
A Real-World Case Study Towards Net Zero: EV Charger and Heat Pump Integration in End-User Residential Distribution Networks


Abstract
1. Introduction
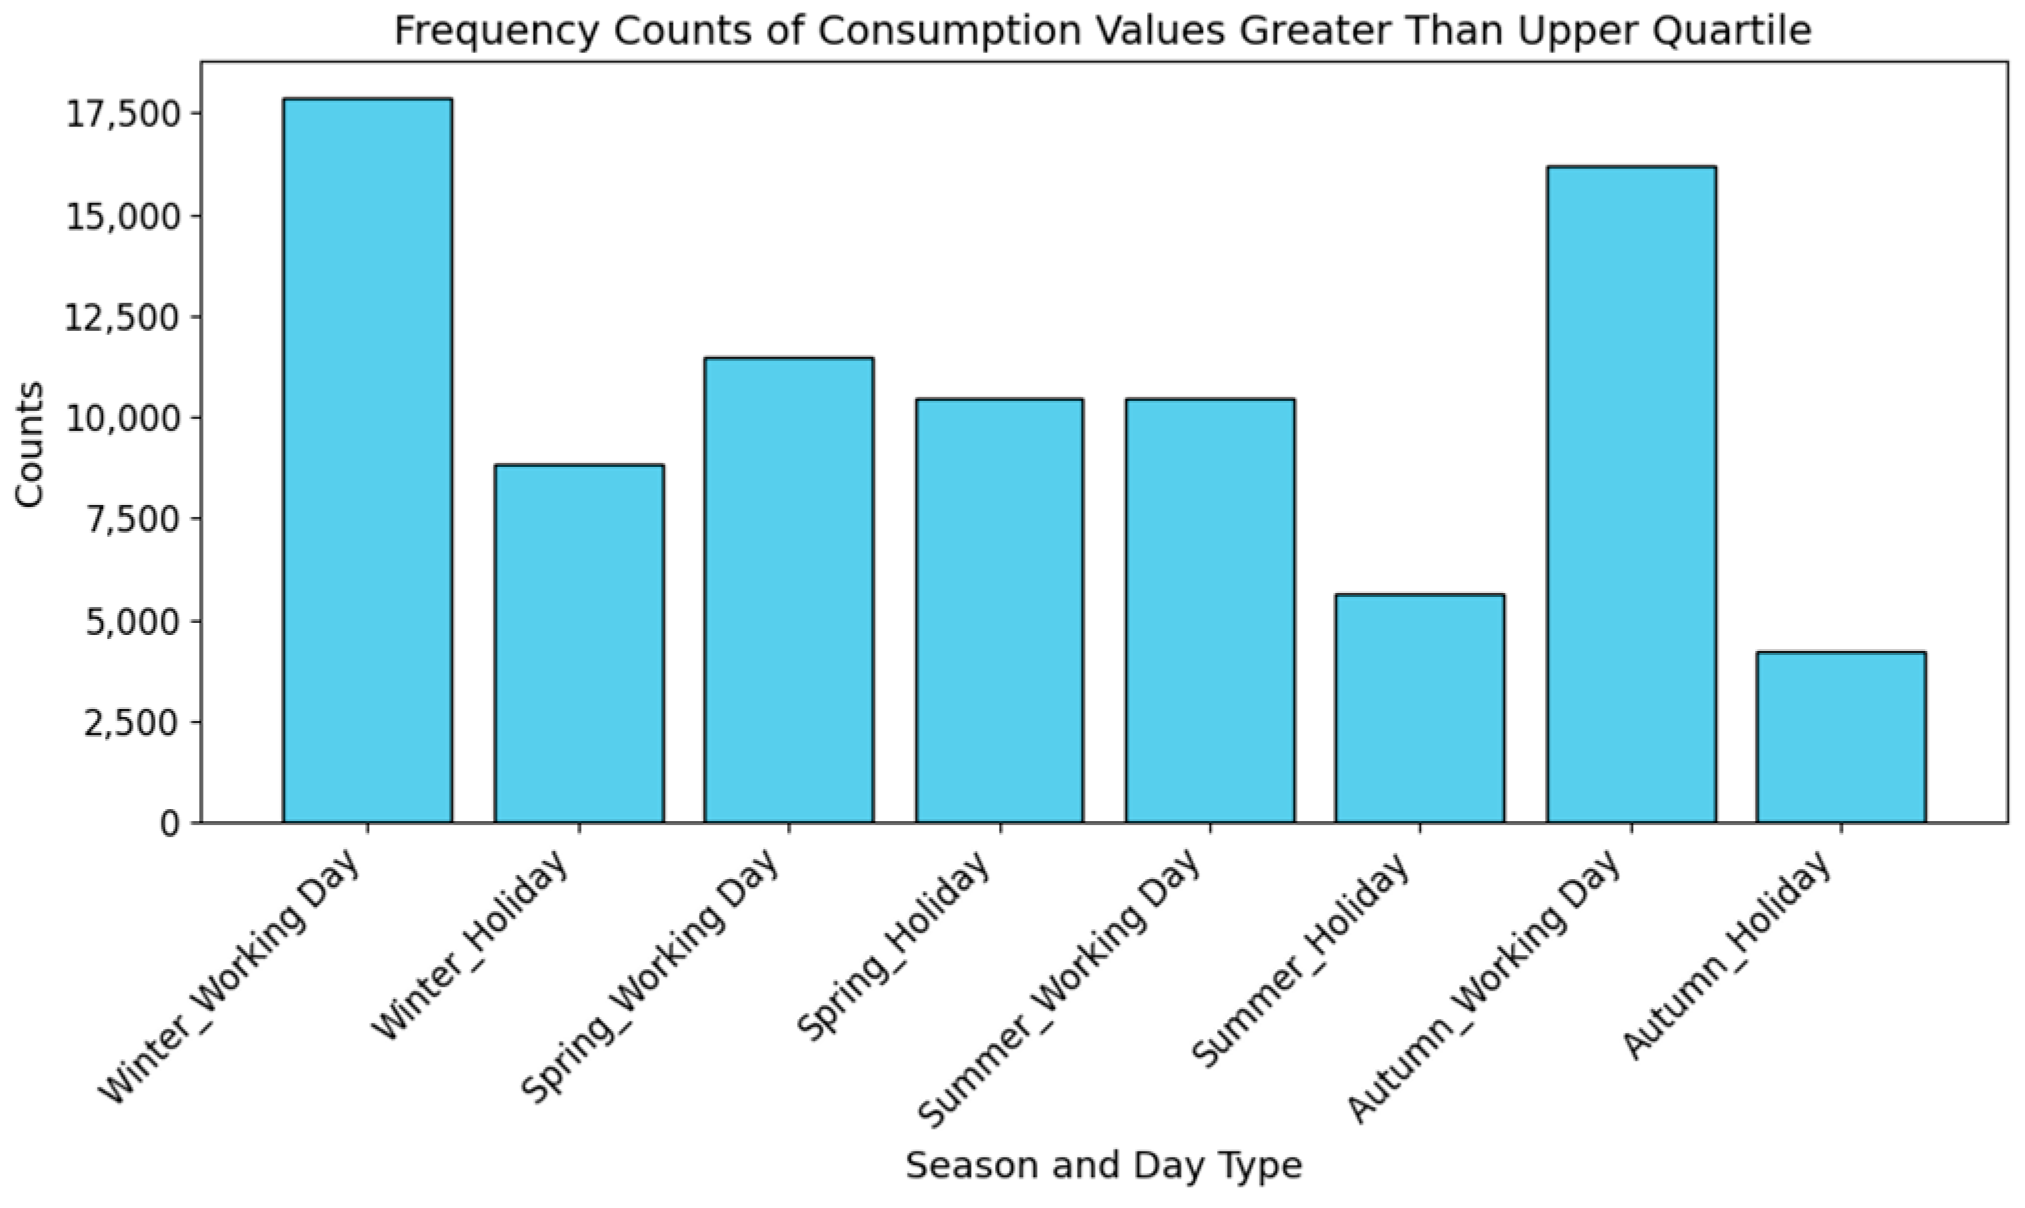
- Quartile-resolved base benchmark: Across all recognised day types (working weekday, Saturday, Sunday/holiday), voltage violations and domestic transformer loadings for the lower quartile, median, upper quartile, and absolute maximum of domestic-only demand are calculated. This gives system designers not only a single “typical” or “extreme” week but also a complete statistical envelope.
- Policy-linked horizon scanning: By providing a statistically rigorous yet visually appealing picture of the whole voltage and domestic transformer loading landscape, the analysis thoroughly analyses the end-user network assets such as electrical buses and transforms the future scenario of 2035 national penetration target for heat pumps and EVs, so translating high-level policy ambitions into concrete LV-grid reinforcement metrics fifteen years ahead of schedule—something neither feeder-scale studies nor national projections have attempted in tandem.
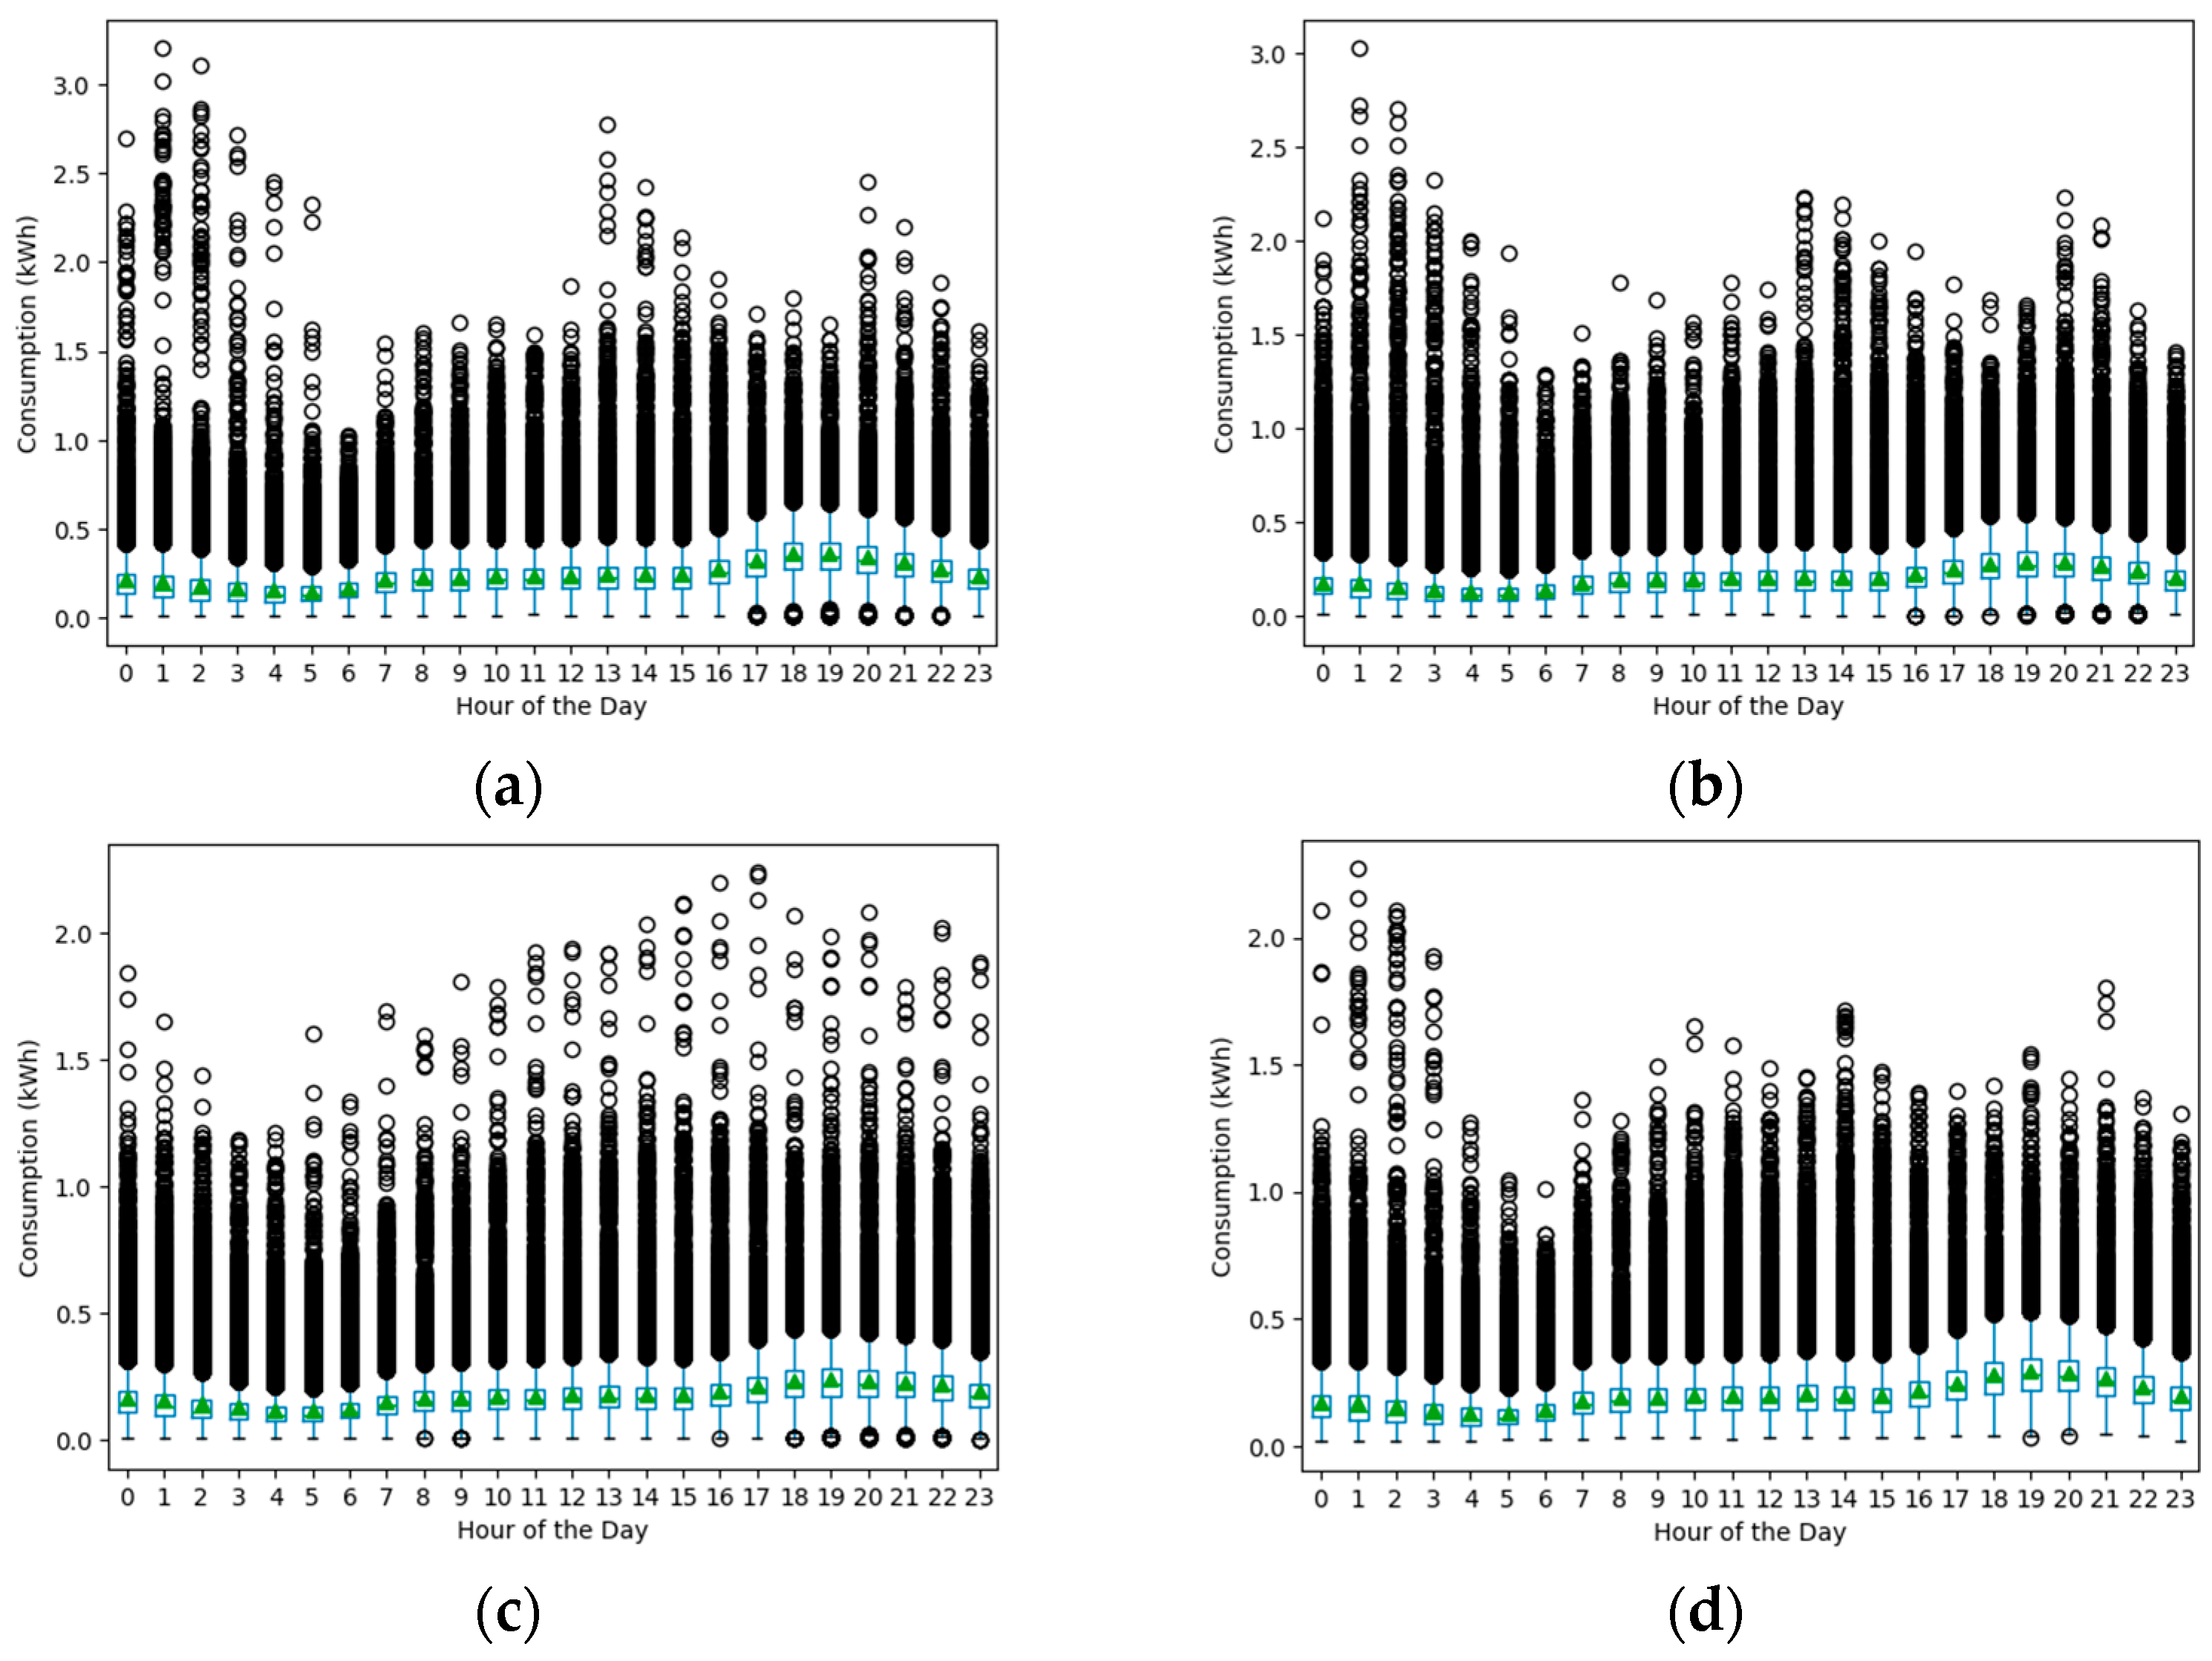
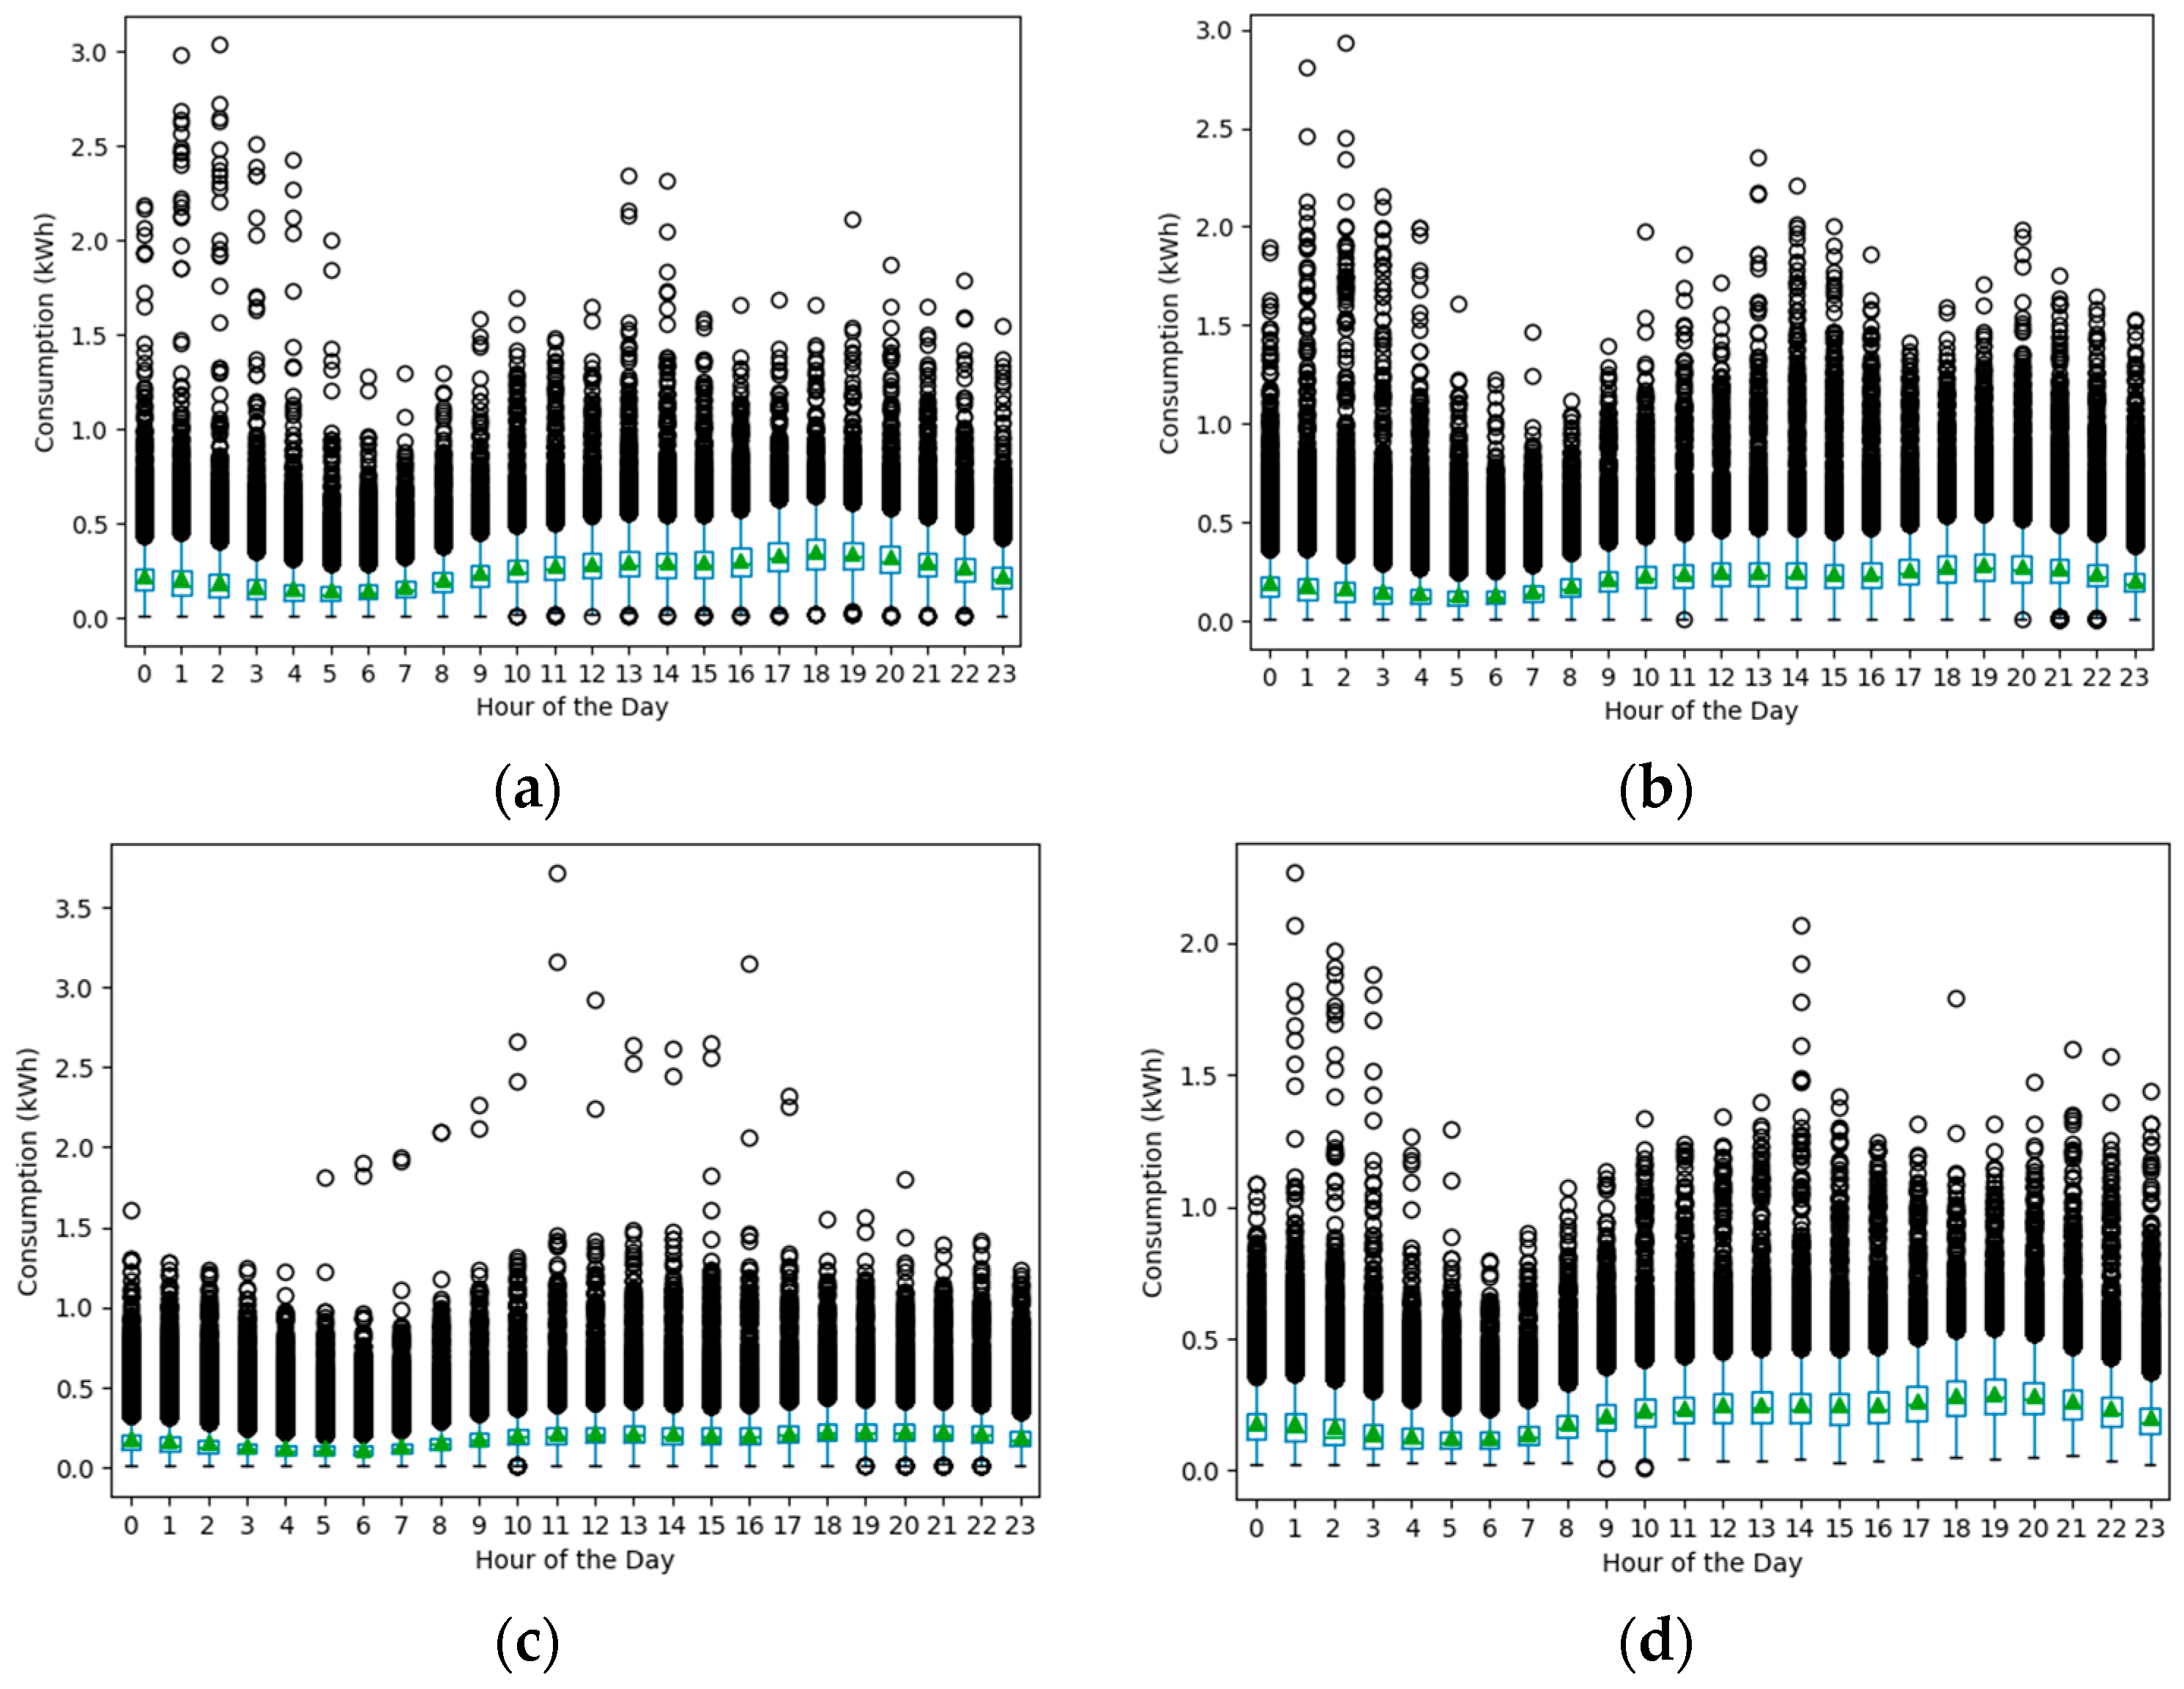
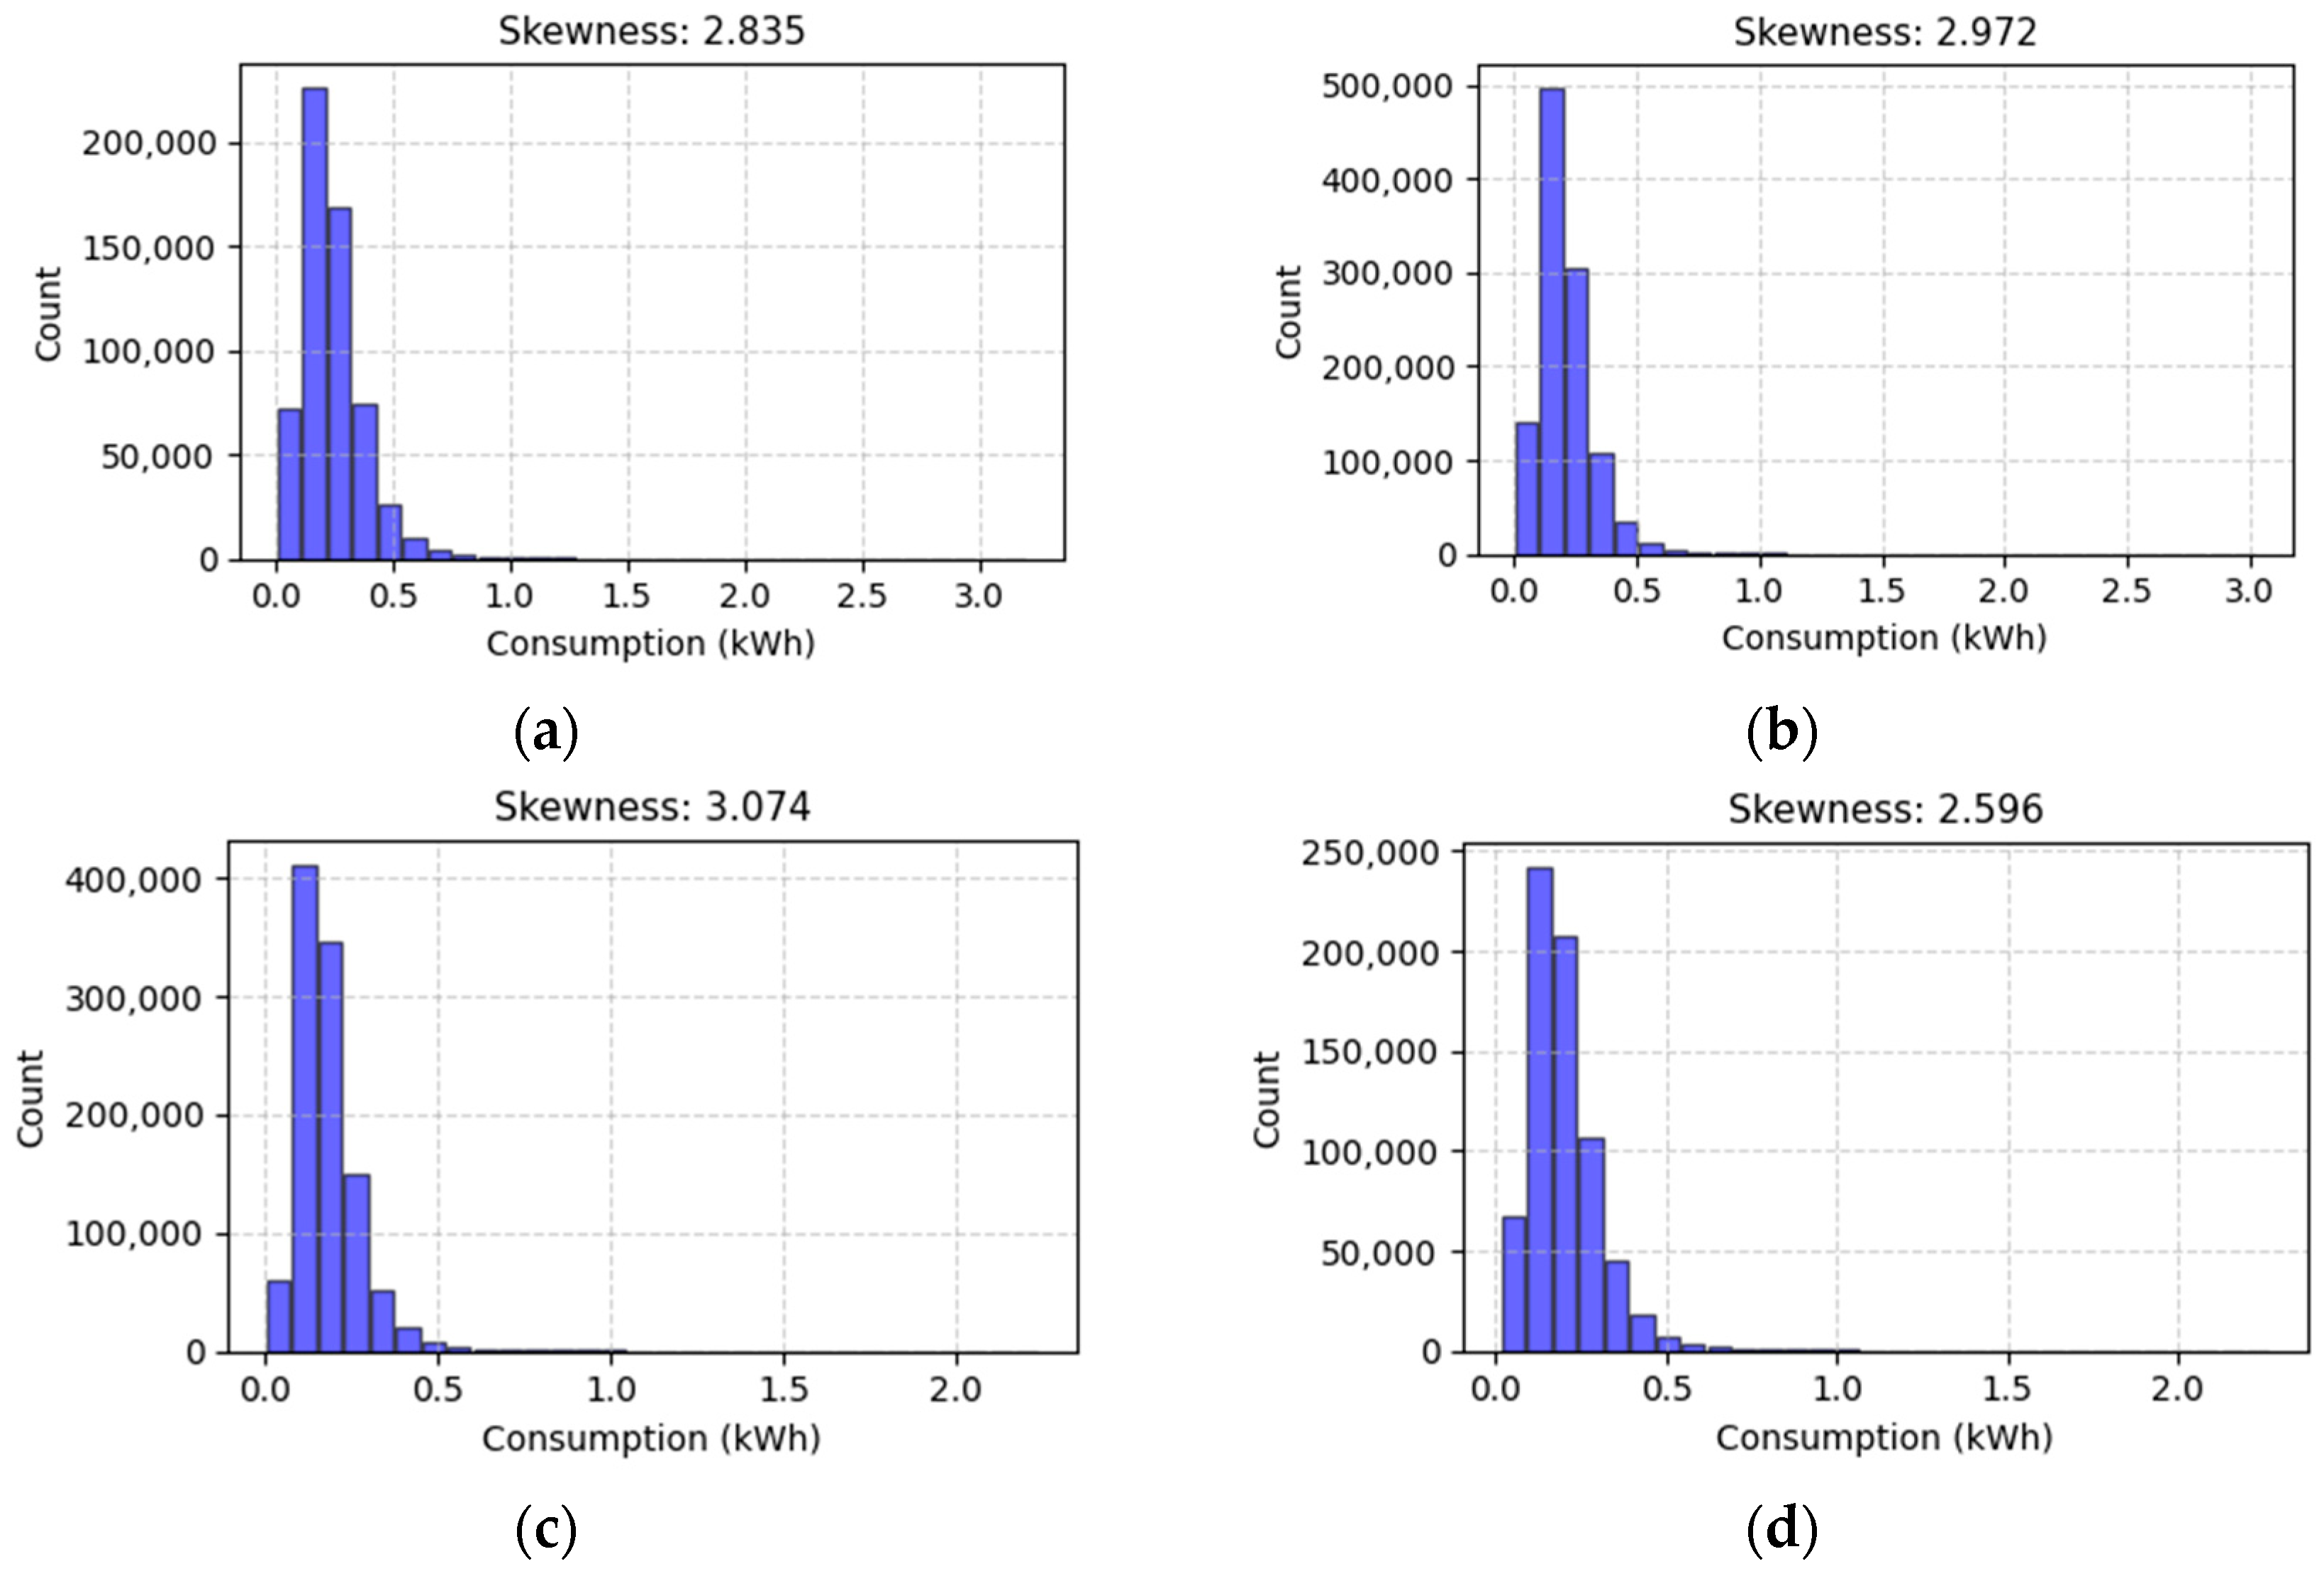
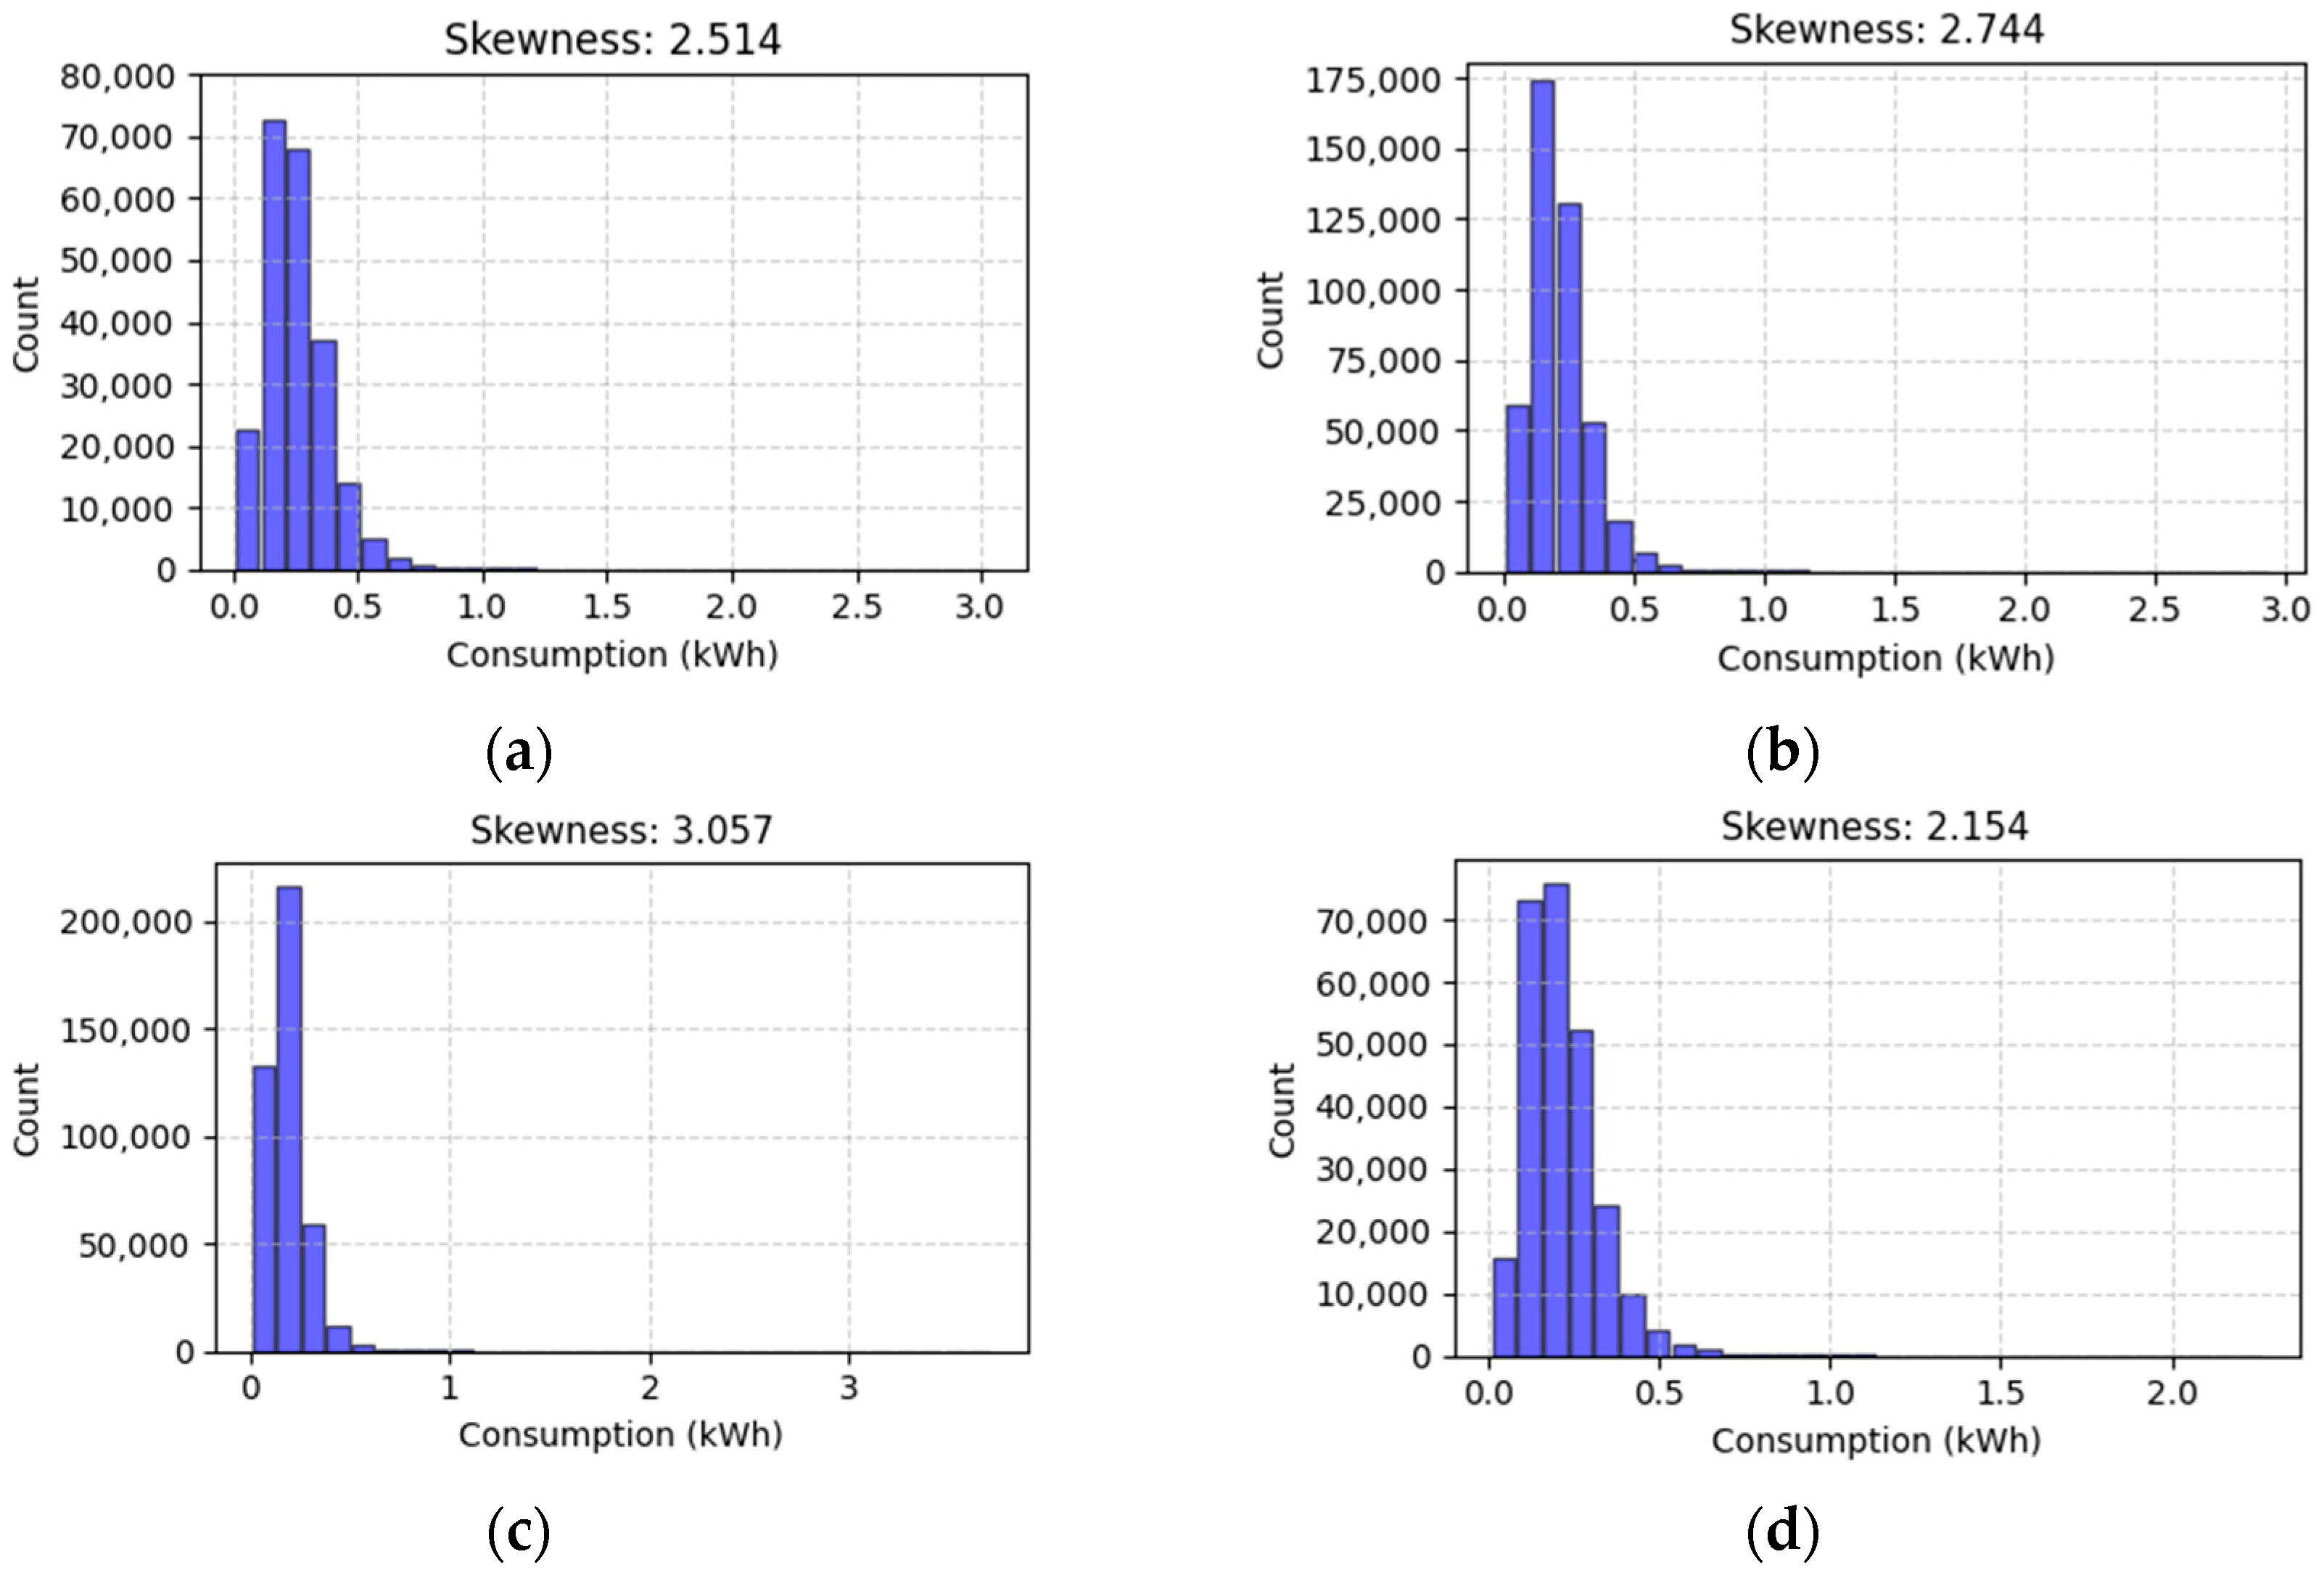
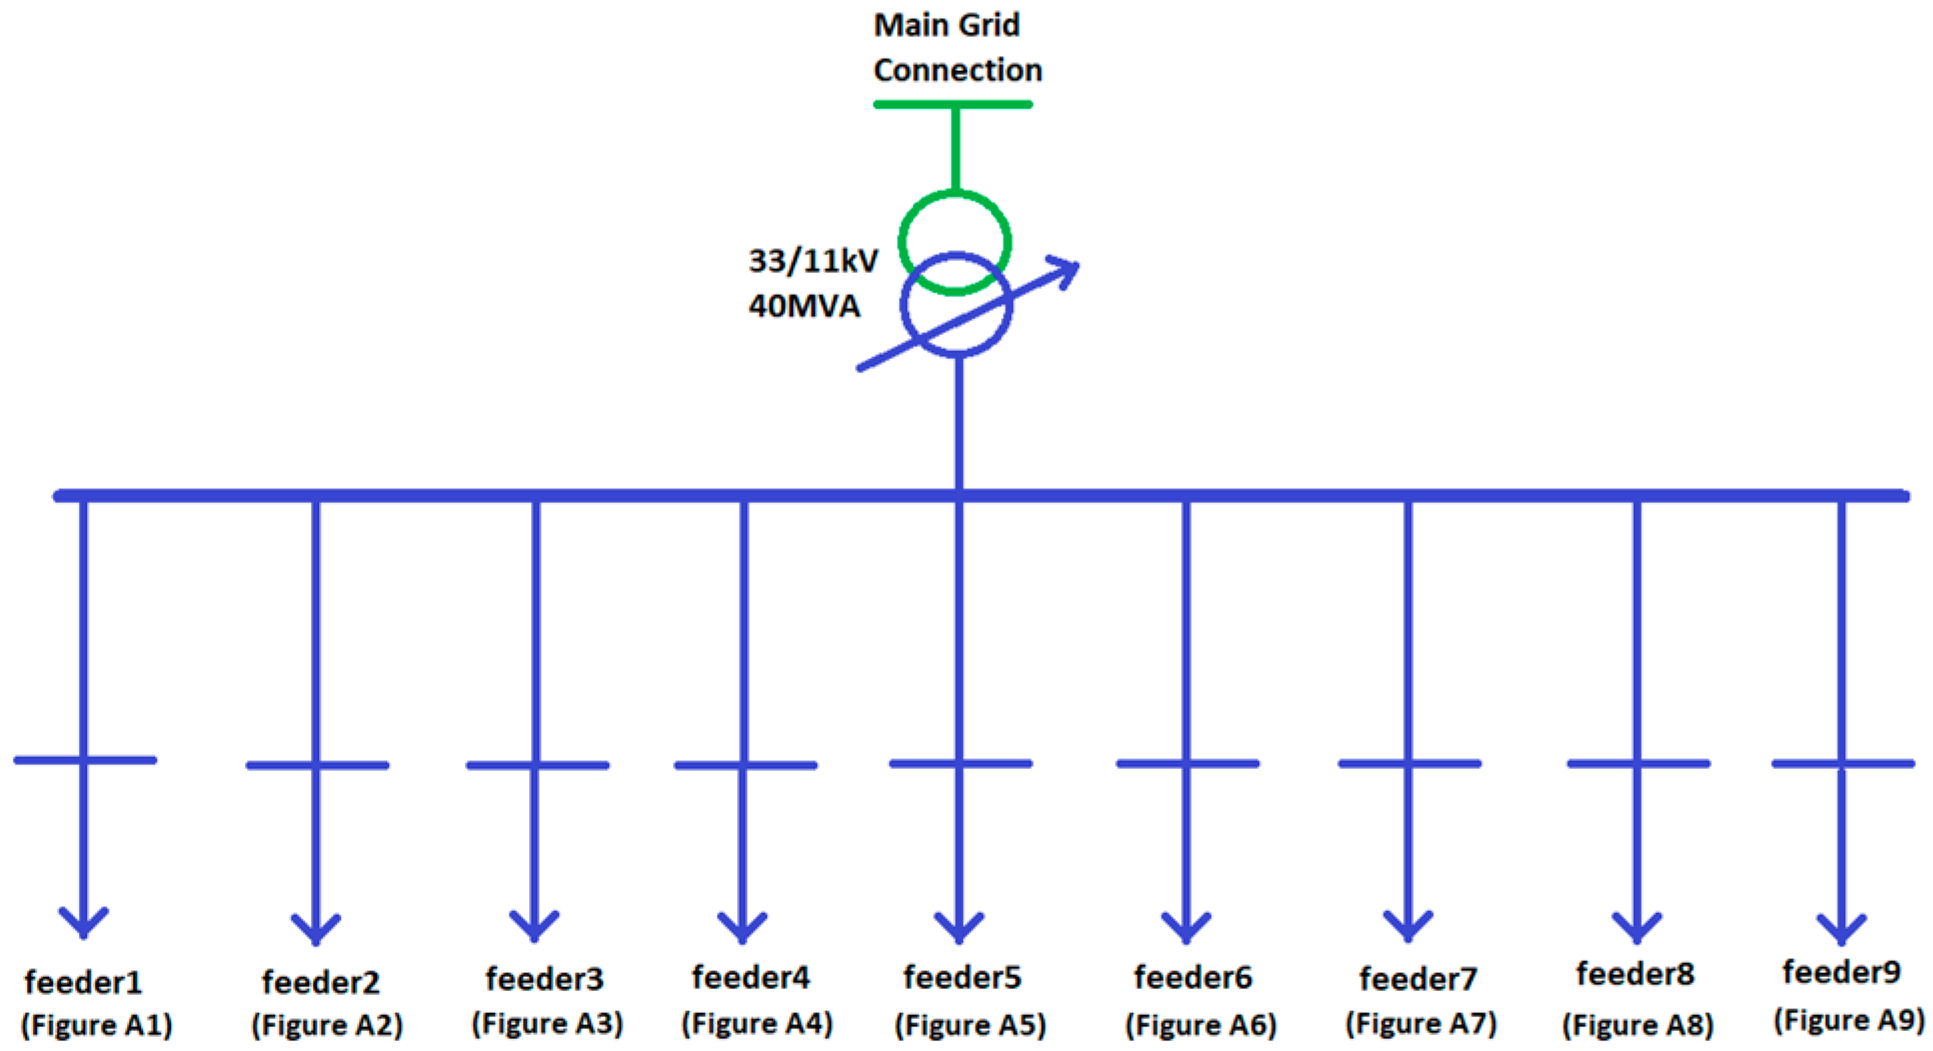
2. Data Preparation
3. Methodology
3.1. Electric Vehicle Consumption Estimation
| Algorithm 1. Procedure of EV profile consumption. | |||
| Procedure Construction_of_Electric_Vehicle_Profile() | |||
| For each hour i from 0 to 23 do | |||
| PD_sum = 0 | |||
| For each EV consumption value c in per-unit do | |||
| -Calculate Probability Density (PD) for EV consumption value at hour i | |||
| -Add PD value to get PD_sum | |||
| End For | |||
| For each EV consumption value c in per-unit do | |||
| -Divide PD value of each EV consumption value c by PD_sum and get PD_c/PD_sum | |||
| -Multiply PD_c/PD_sum by respective consumption value | |||
| End For -Sum all multiplication results and get the nominal EV consumption value at hour i | |||
| End For | |||
| End Procedure | |||
3.2. Heat Pump Consumption Calculation
- = total expected heat loss from building
- = U value of floor of building
- = U value of floor of roof
- = U value of wall of building
- = U value of window
- = typical floor area of building
- = typical roof area of building
- = total wall area of building
- = heat loss due to ventilation
- = air change rate per hour
- = volume of building
- = difference between set and outdoor temperature
- = heat demand per temperature difference
- = coefficient of performance of heat pump
- = coefficient of performance of heat pump
- = thermostat setting temperature in Kelvin (hot side)
- = ambient temperature in Kelvin (cold side)
- = coefficient of performance of heat pump
- = thermostat setting temperature in Kelvin (hot side)
- = ambient temperature in Kelvin (cold side)
- = defrosting efficiency = 0.6 [41]
- = compressor efficiency = 0.7 [43]
- = heat exchanger efficiency = 0.5 [42]
- = electrical power consumption of space heating
- = electricity consumption of domestic water heating
- = electrical power consumption of heat pump
- = set temperature − initial water temperature
- = specific heat capacity of water = 4.18 kJ/kg·K
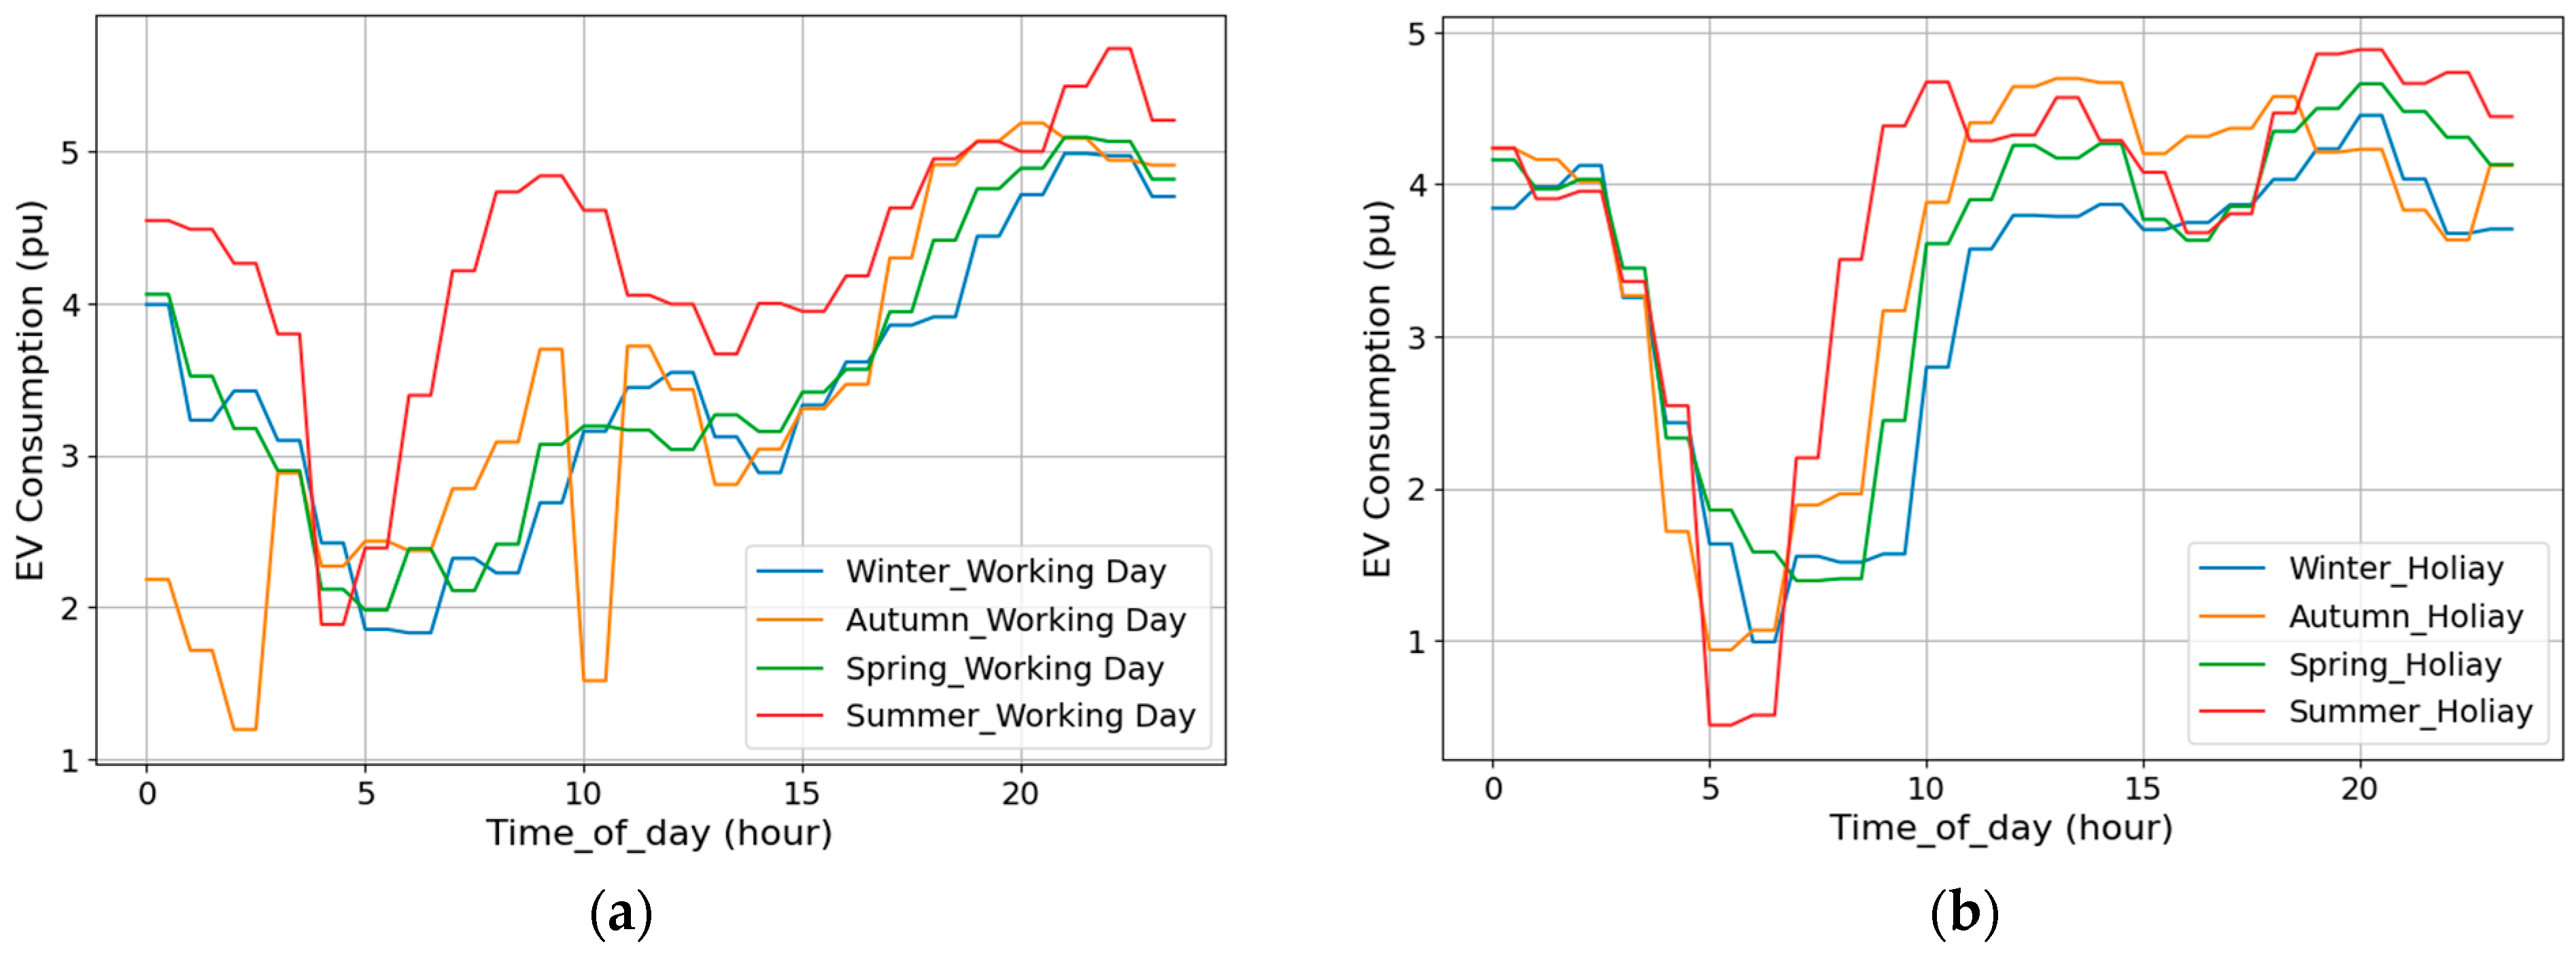
- = electric vehicle consumption = 7 kW × total consumers × EV consumption in pu (Figure 7)
- = total consumers × Heat Pump energy consumption (Equation (7))
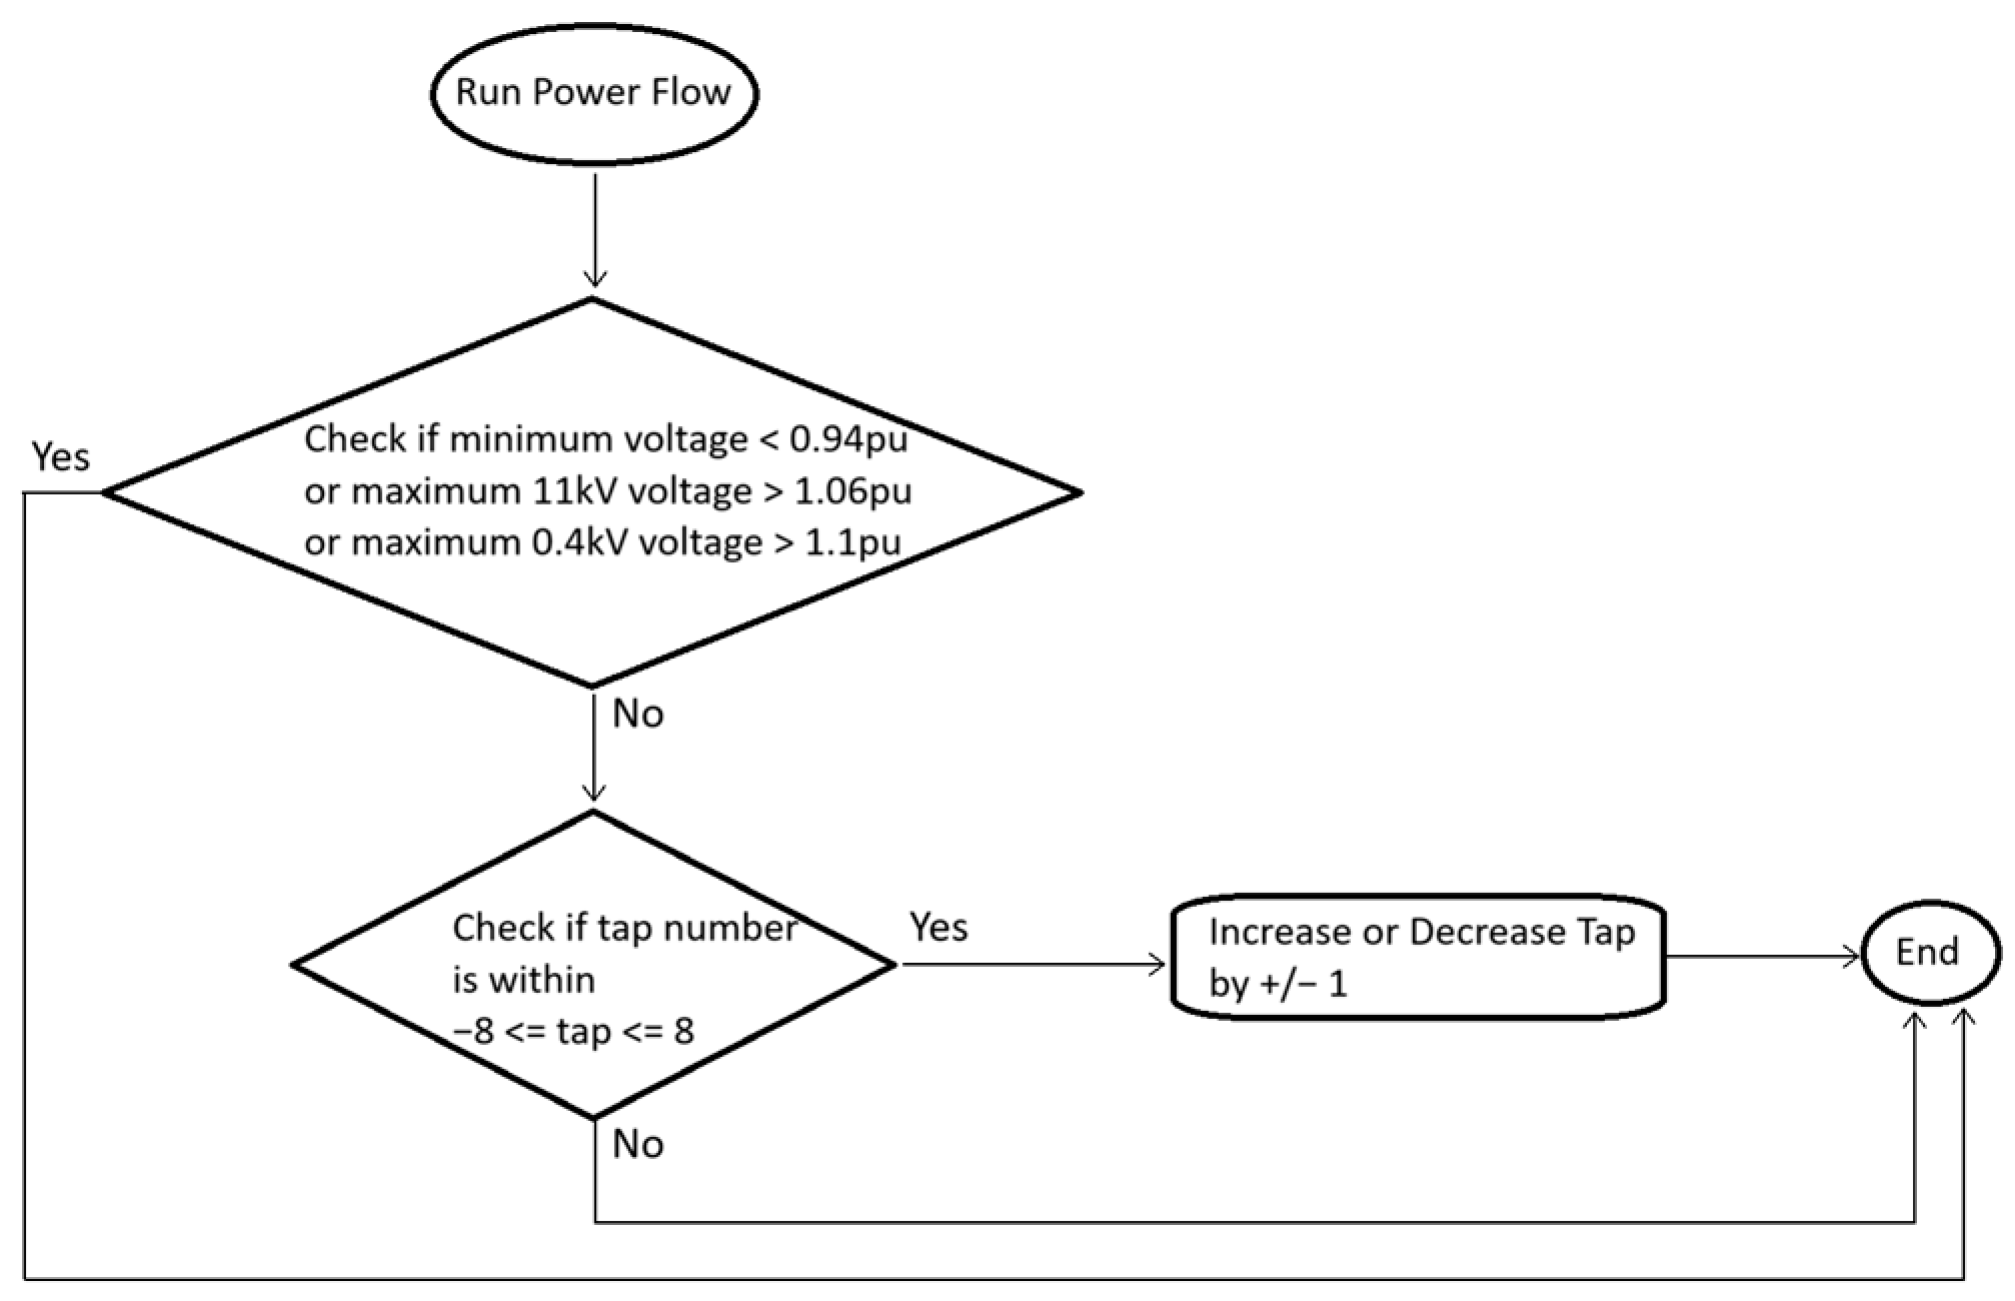
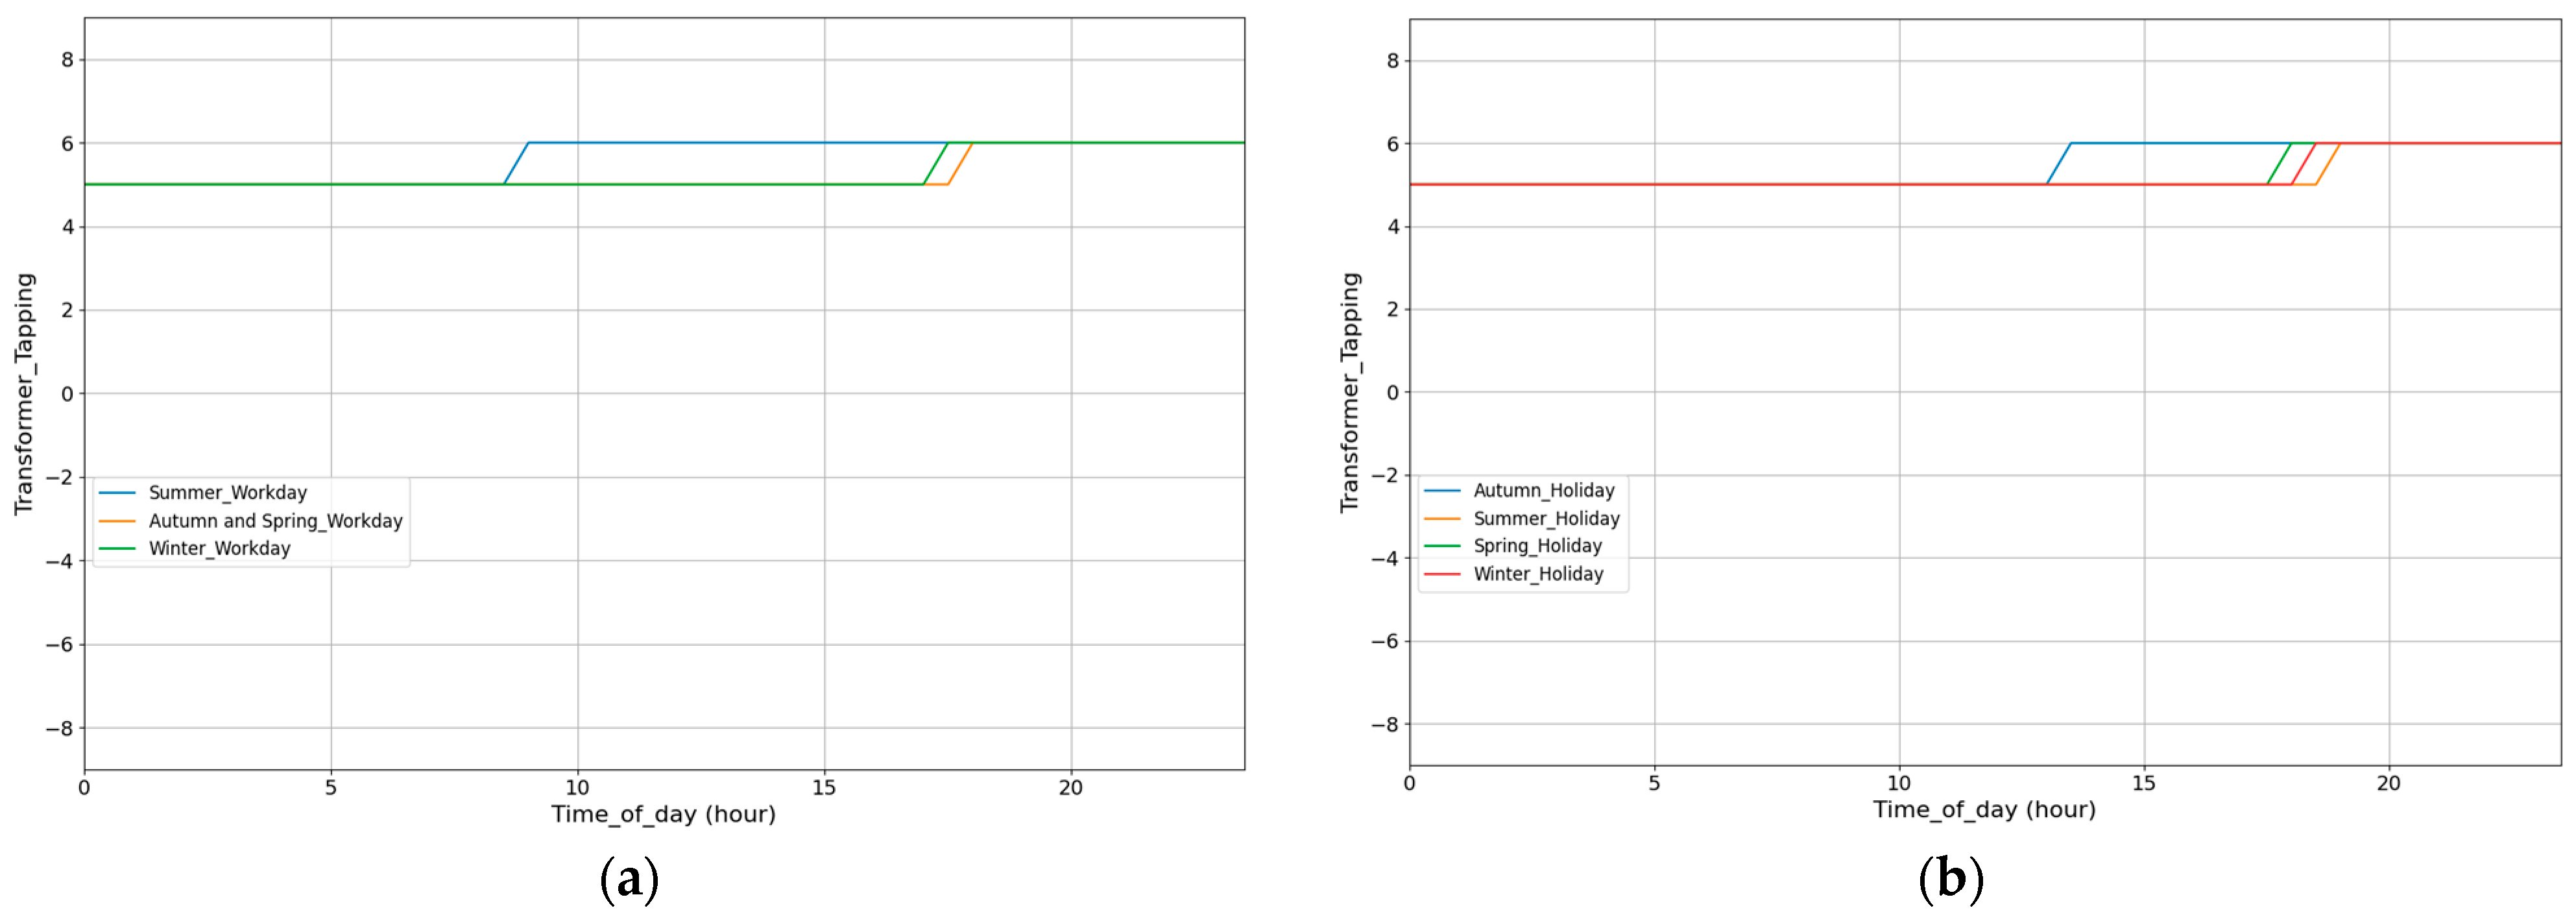
3.3. Power Flow Analysis
4. Results
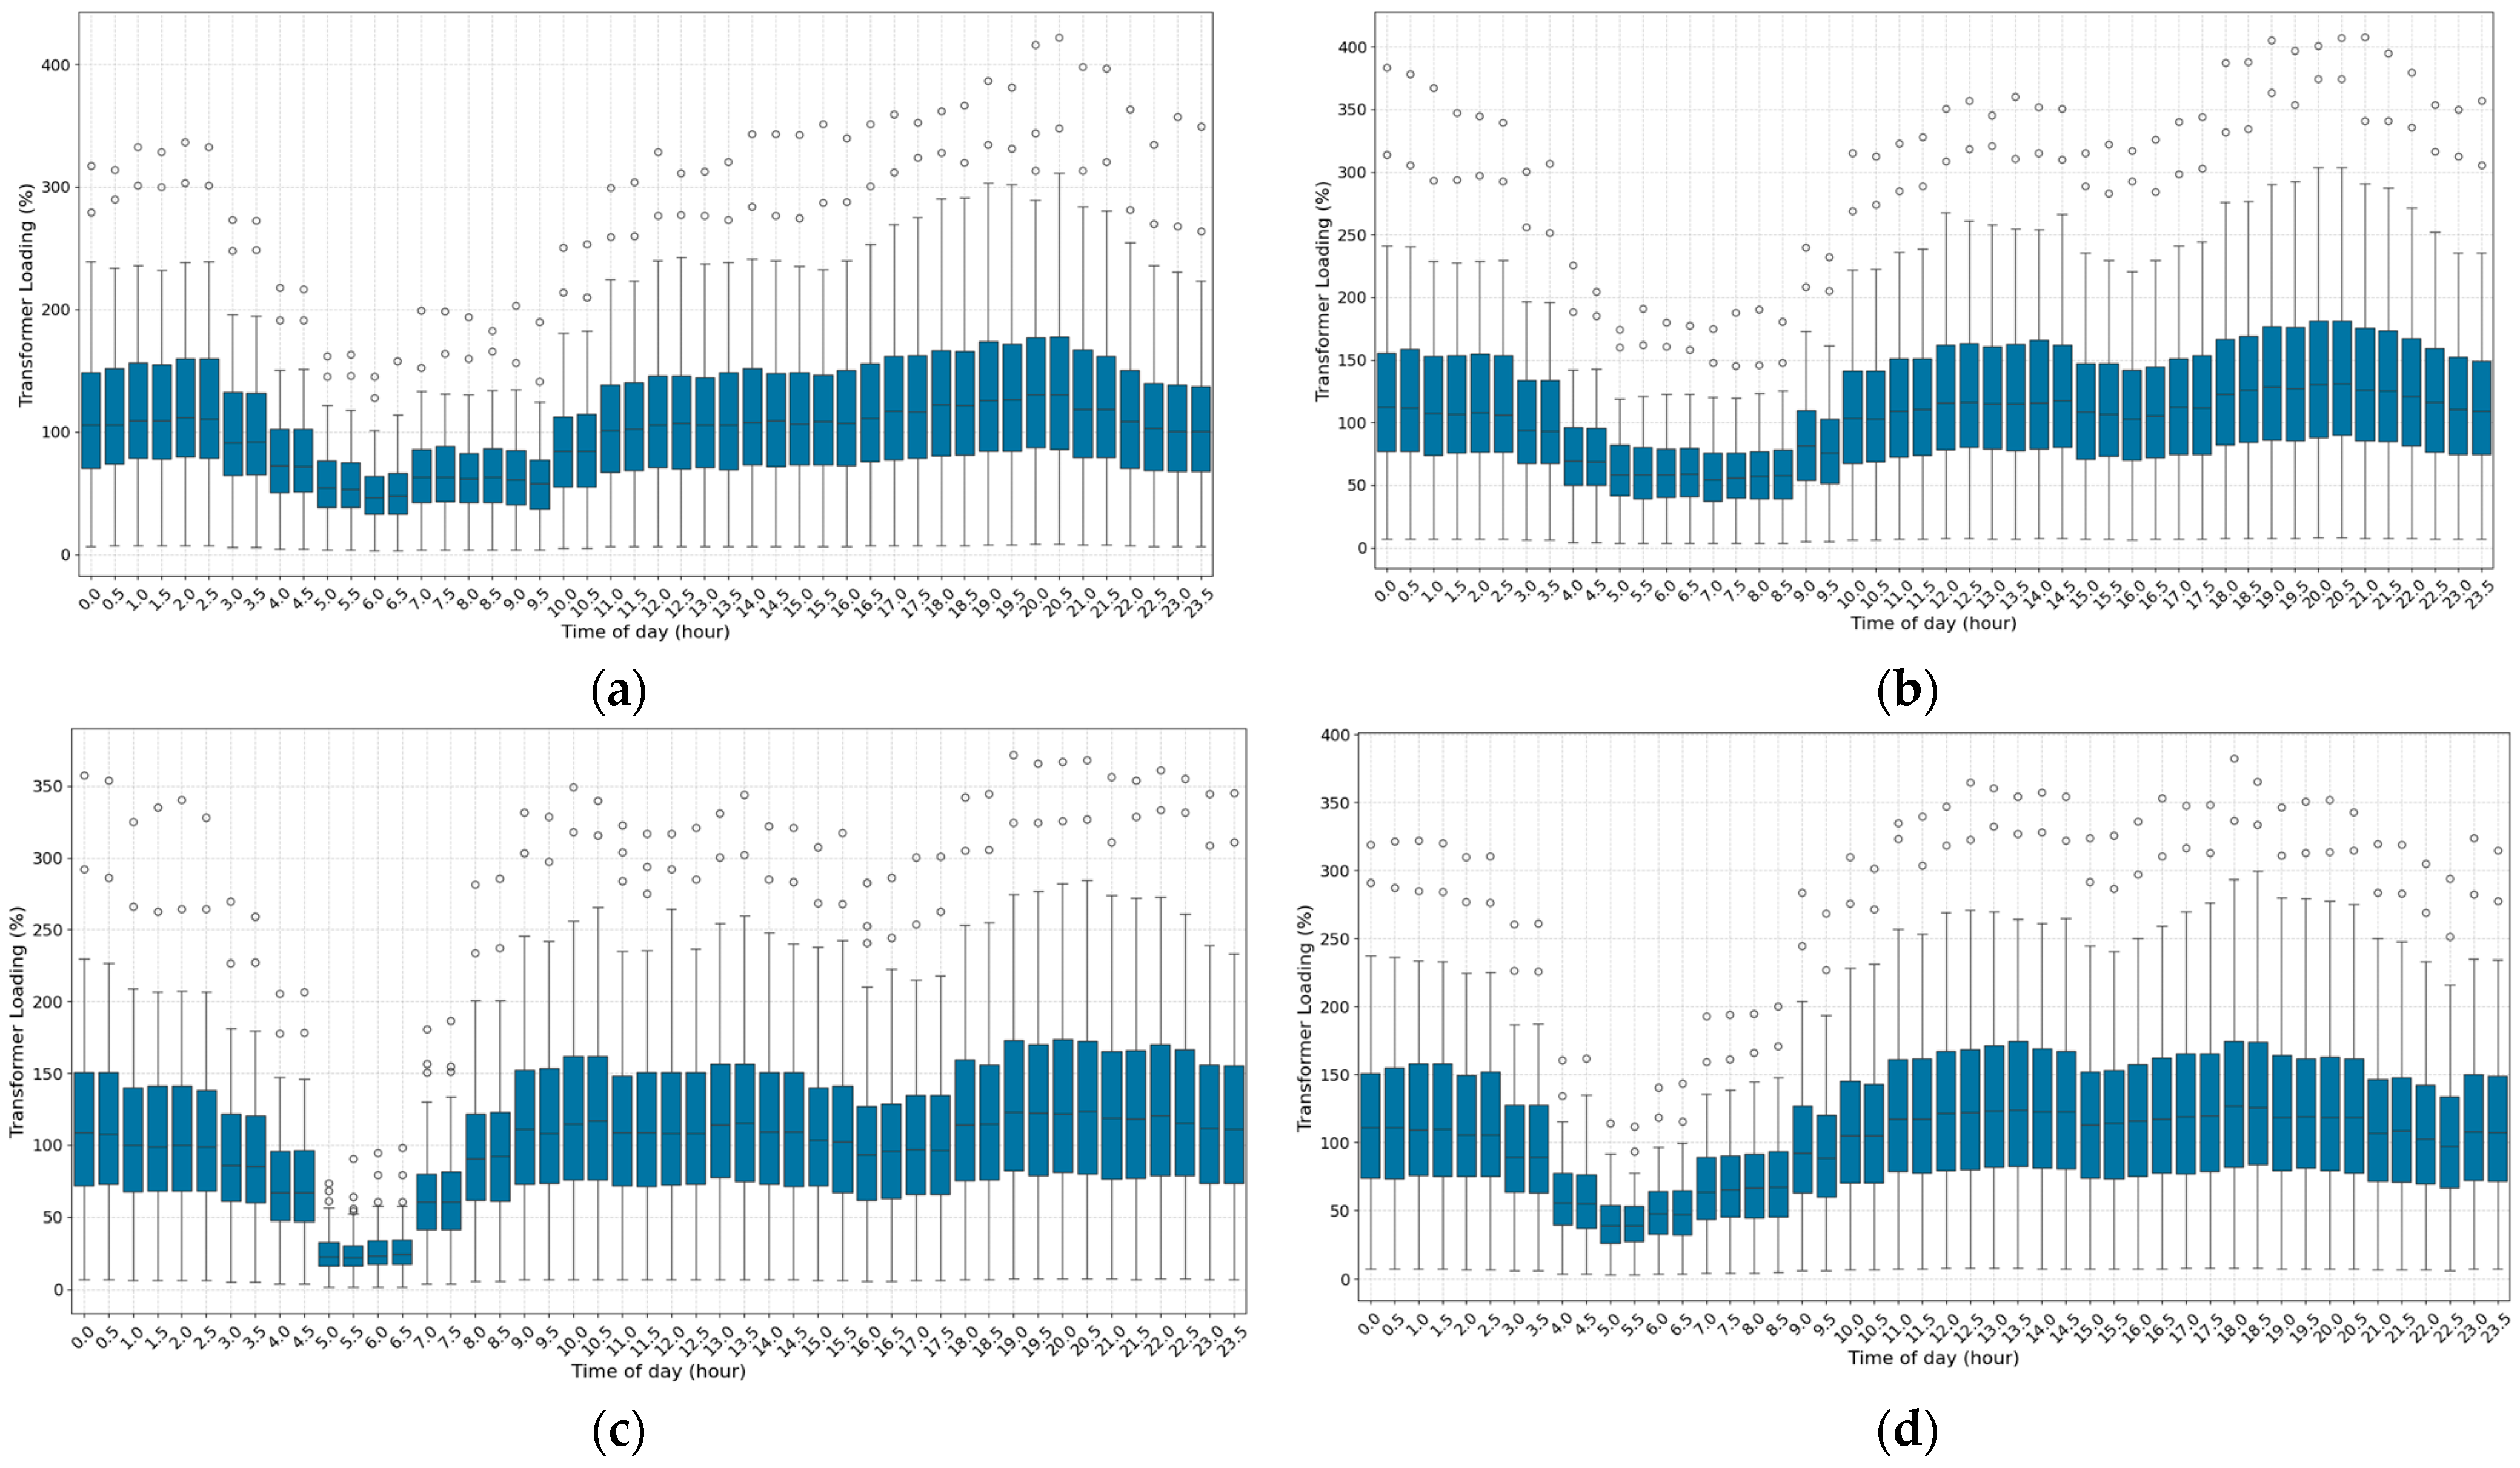
4.1. Base Case Without Heat Pumps and EVs
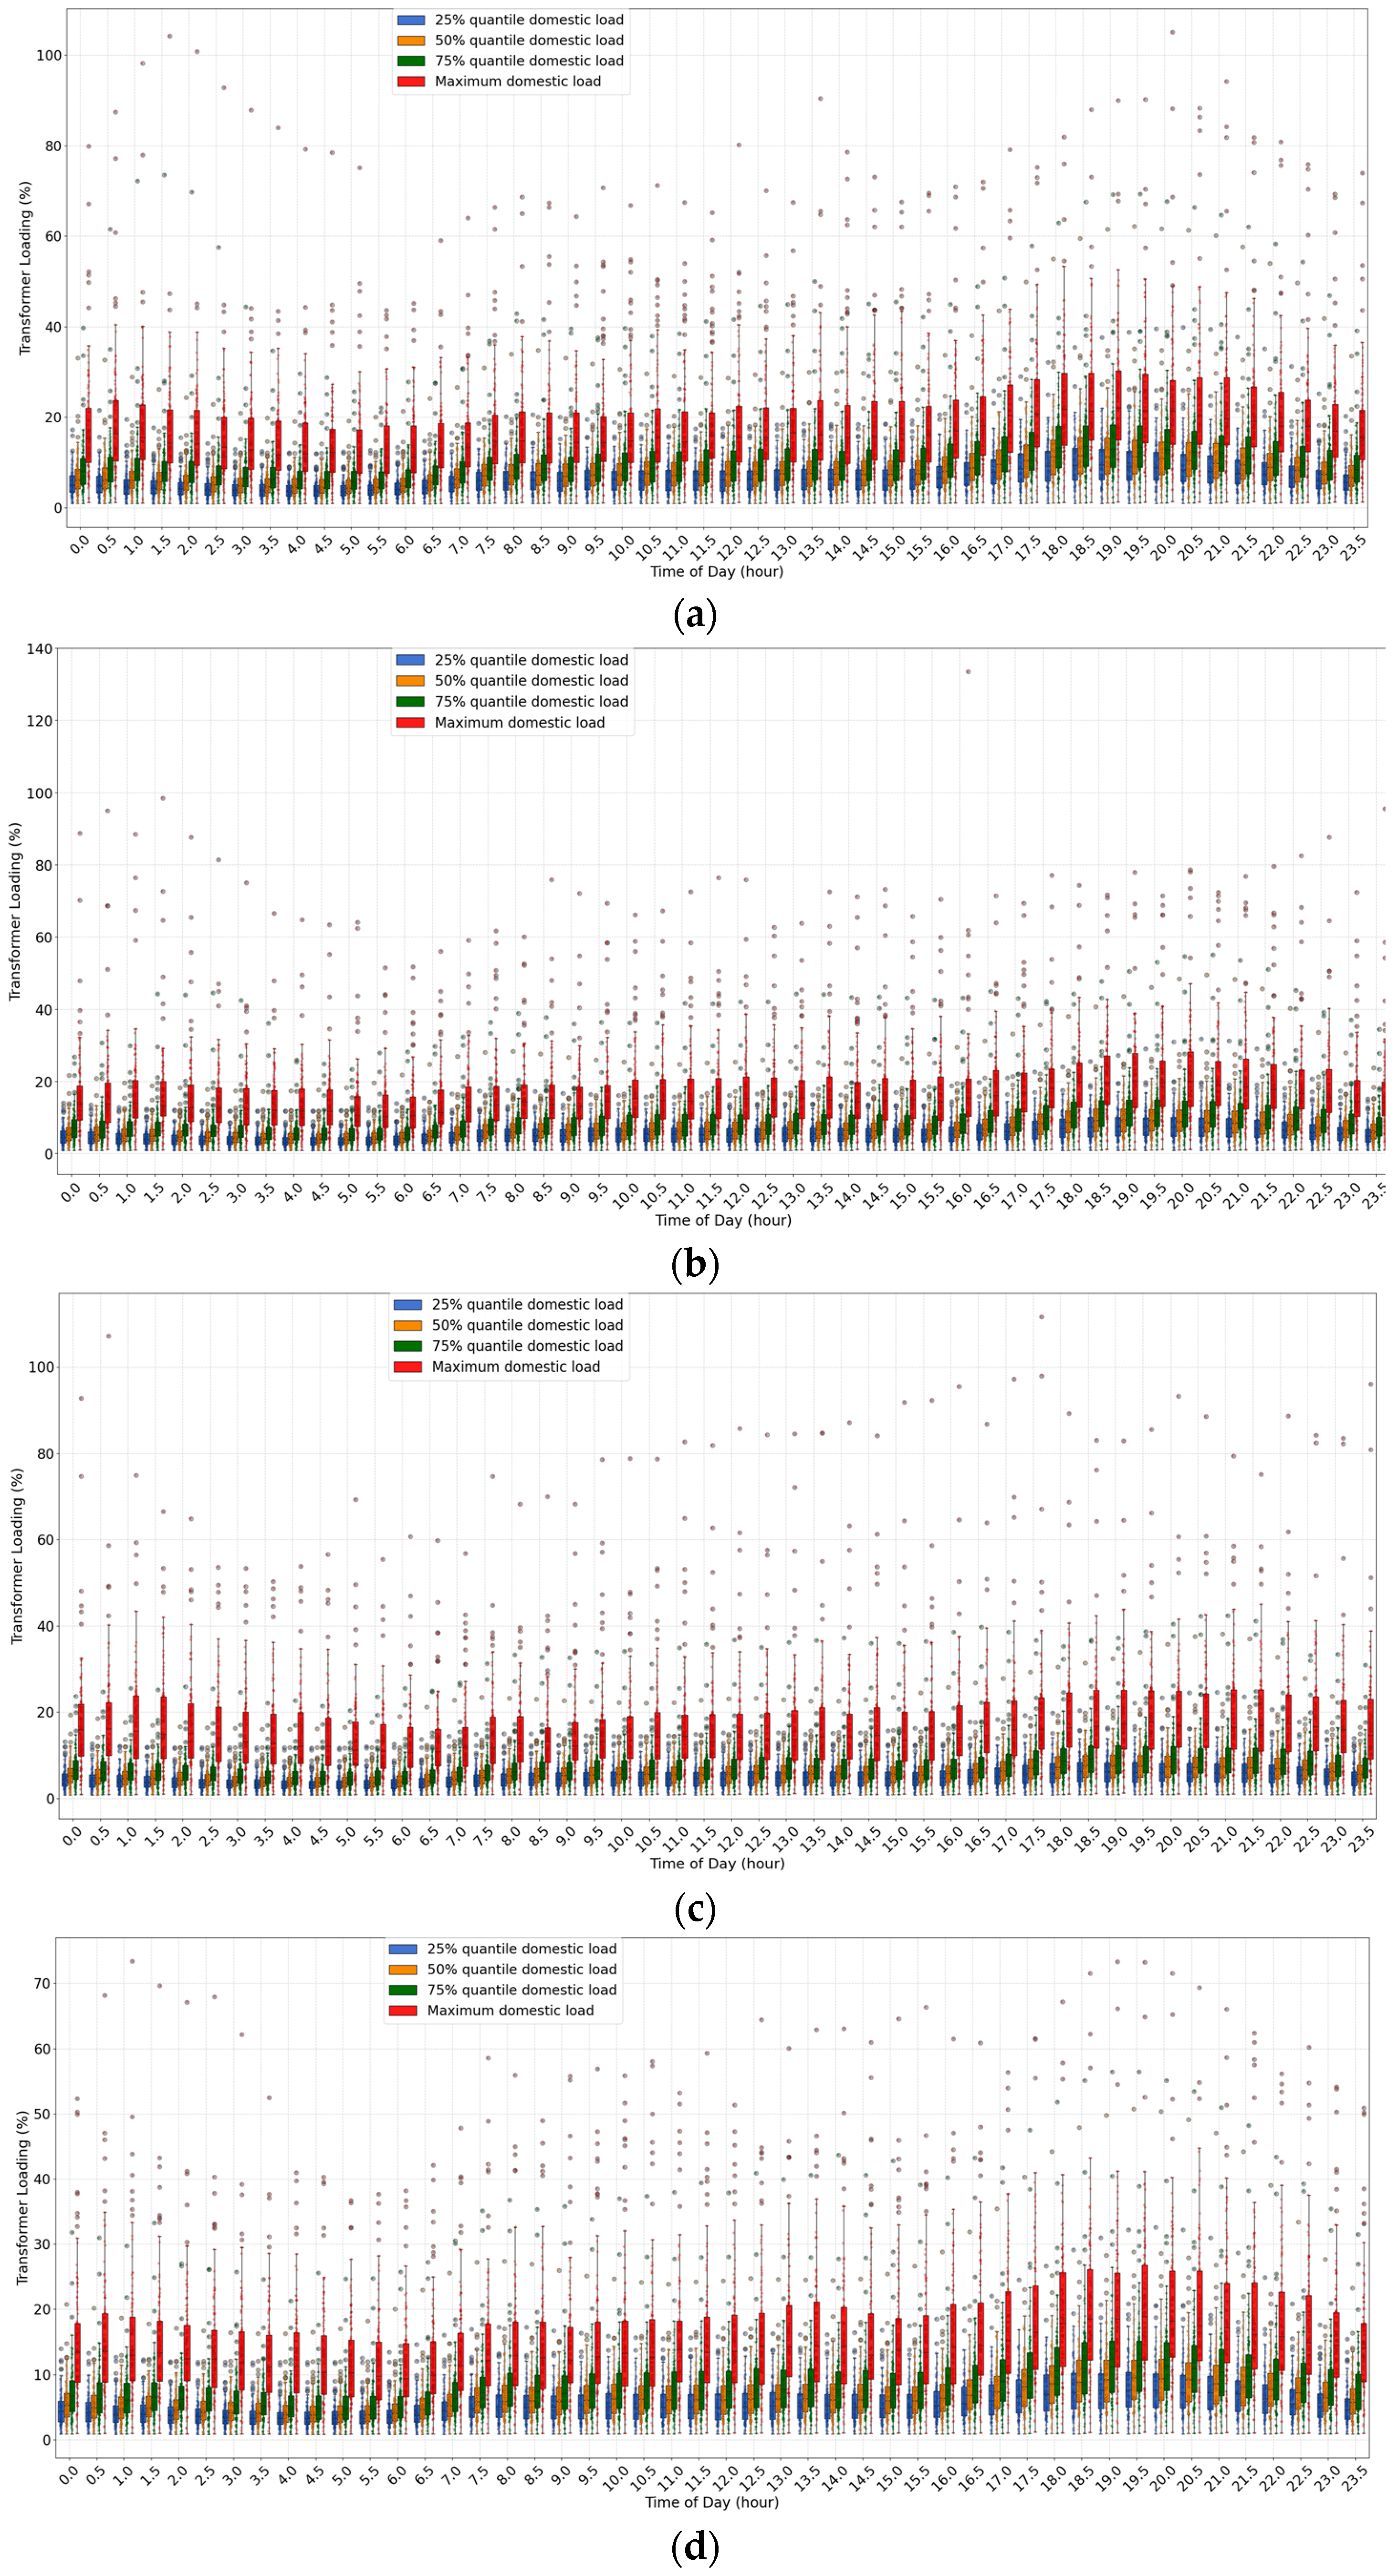
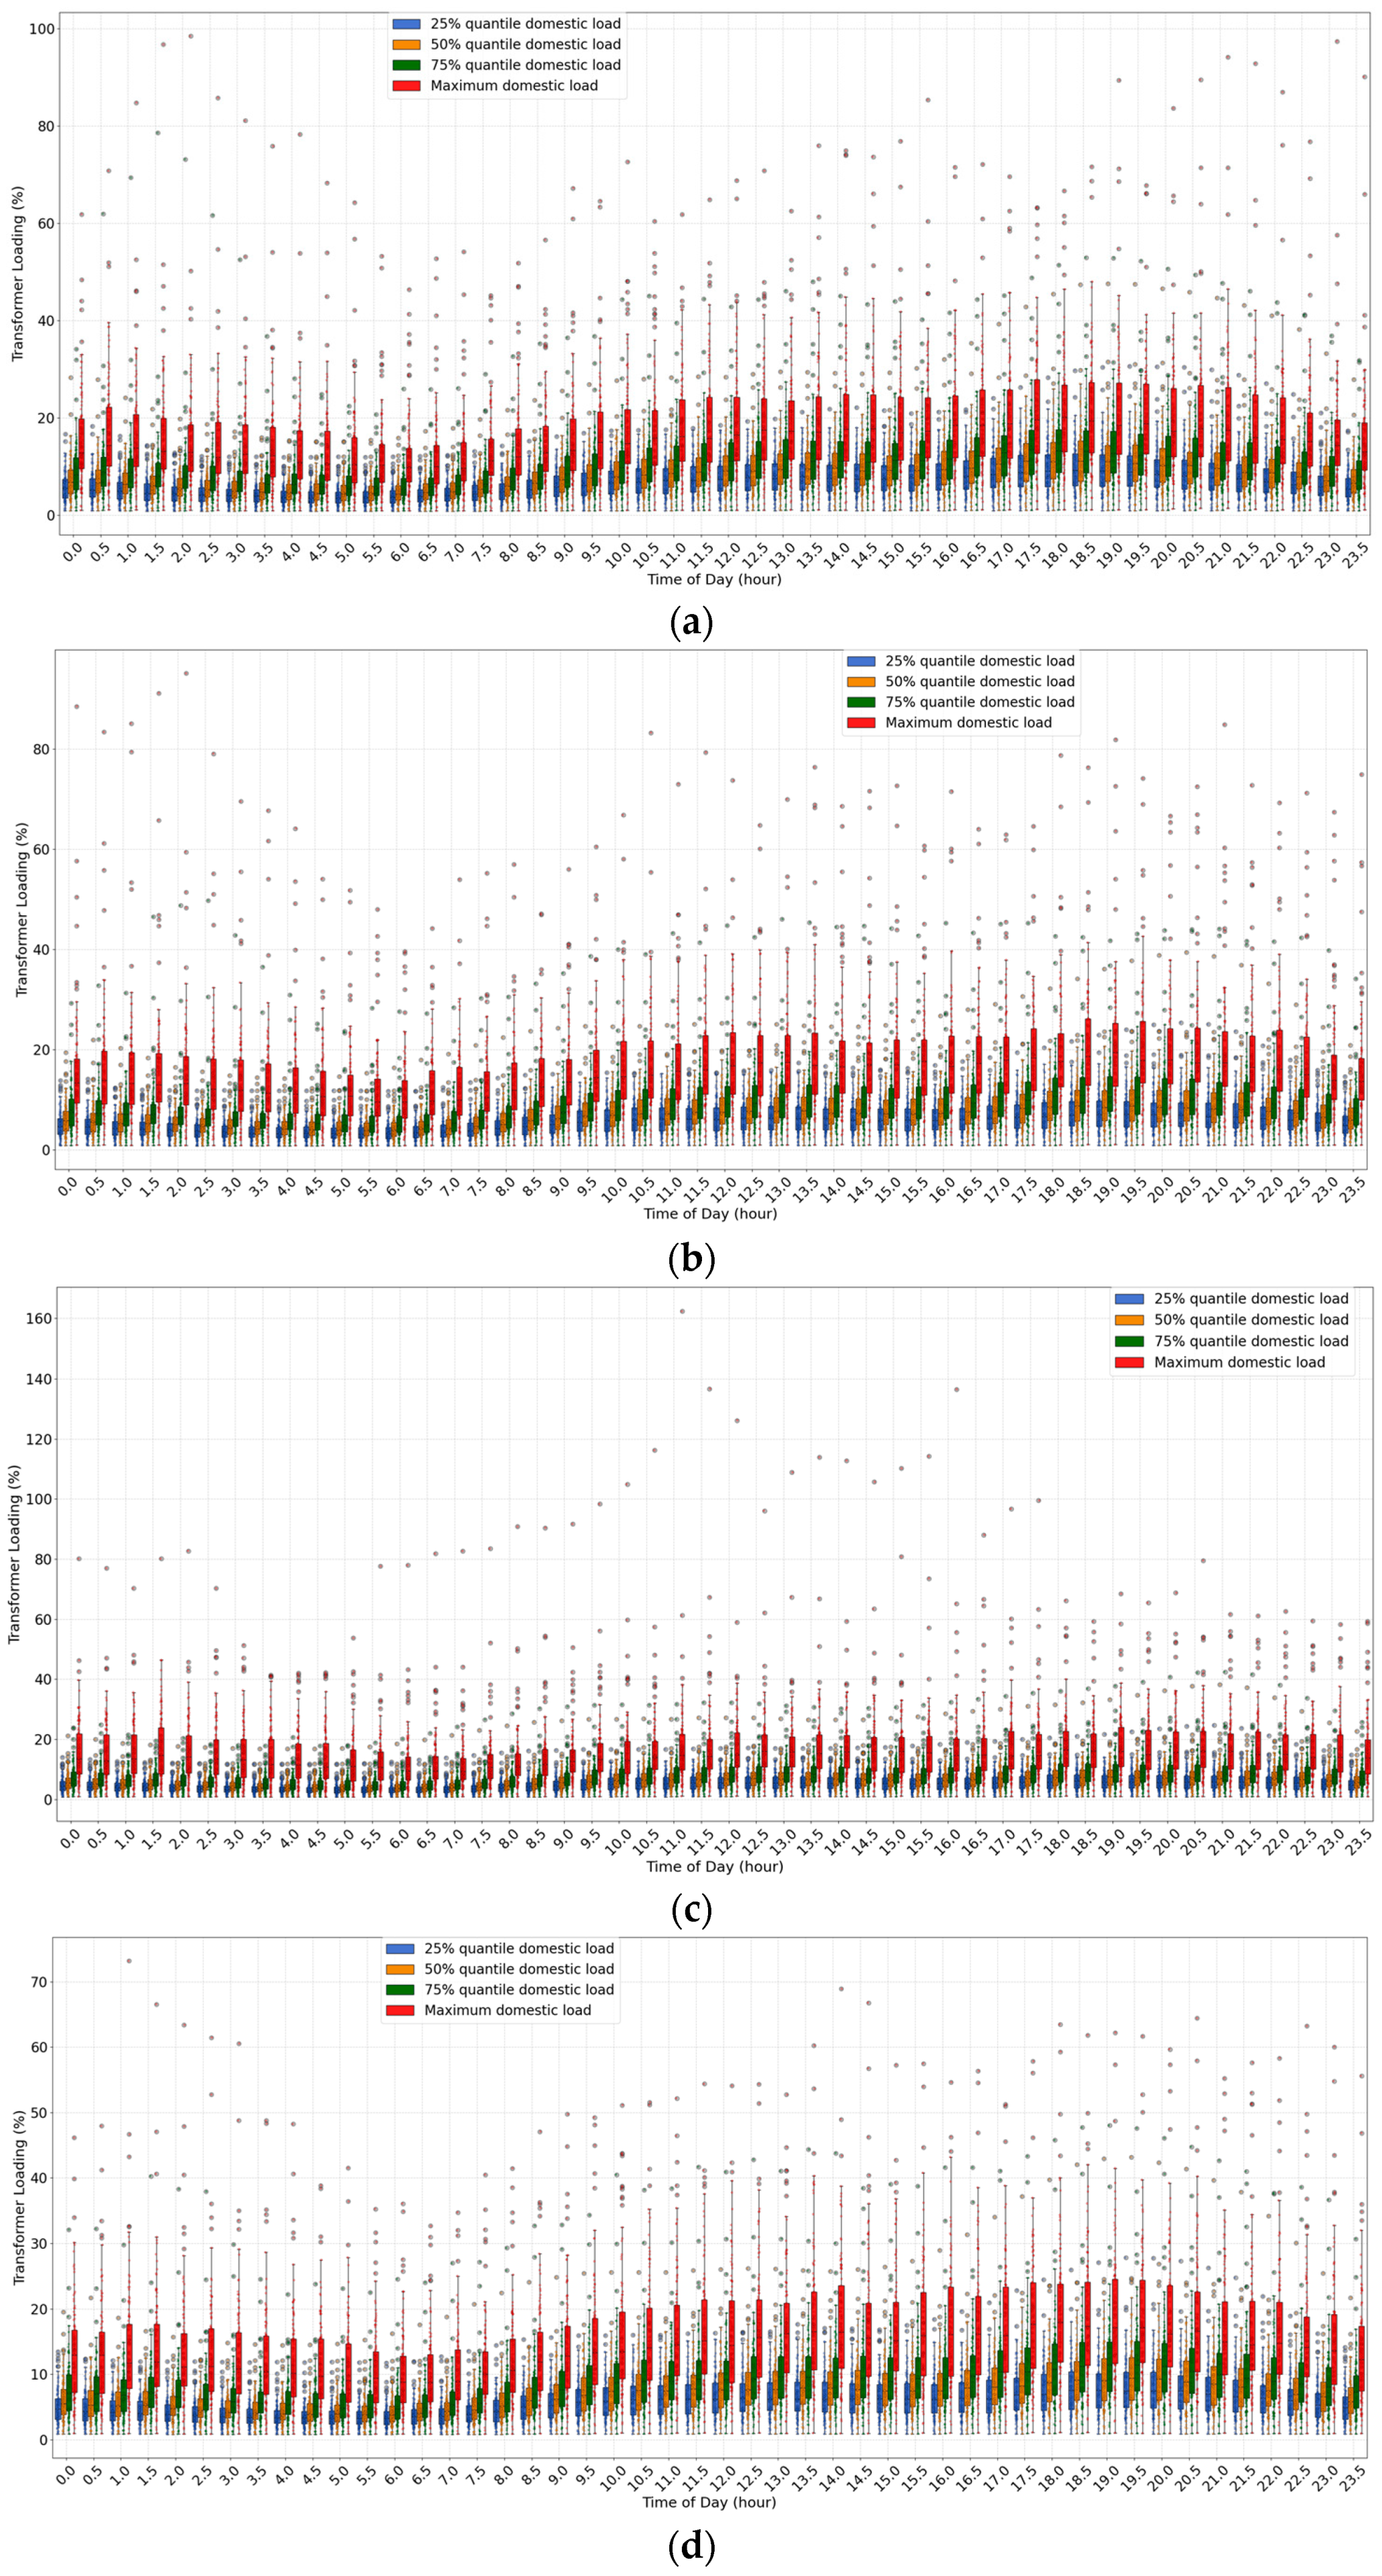
4.2. Analysis of Voltage and Transformer Violation with Existing Integration of Heat Pumps and EVs
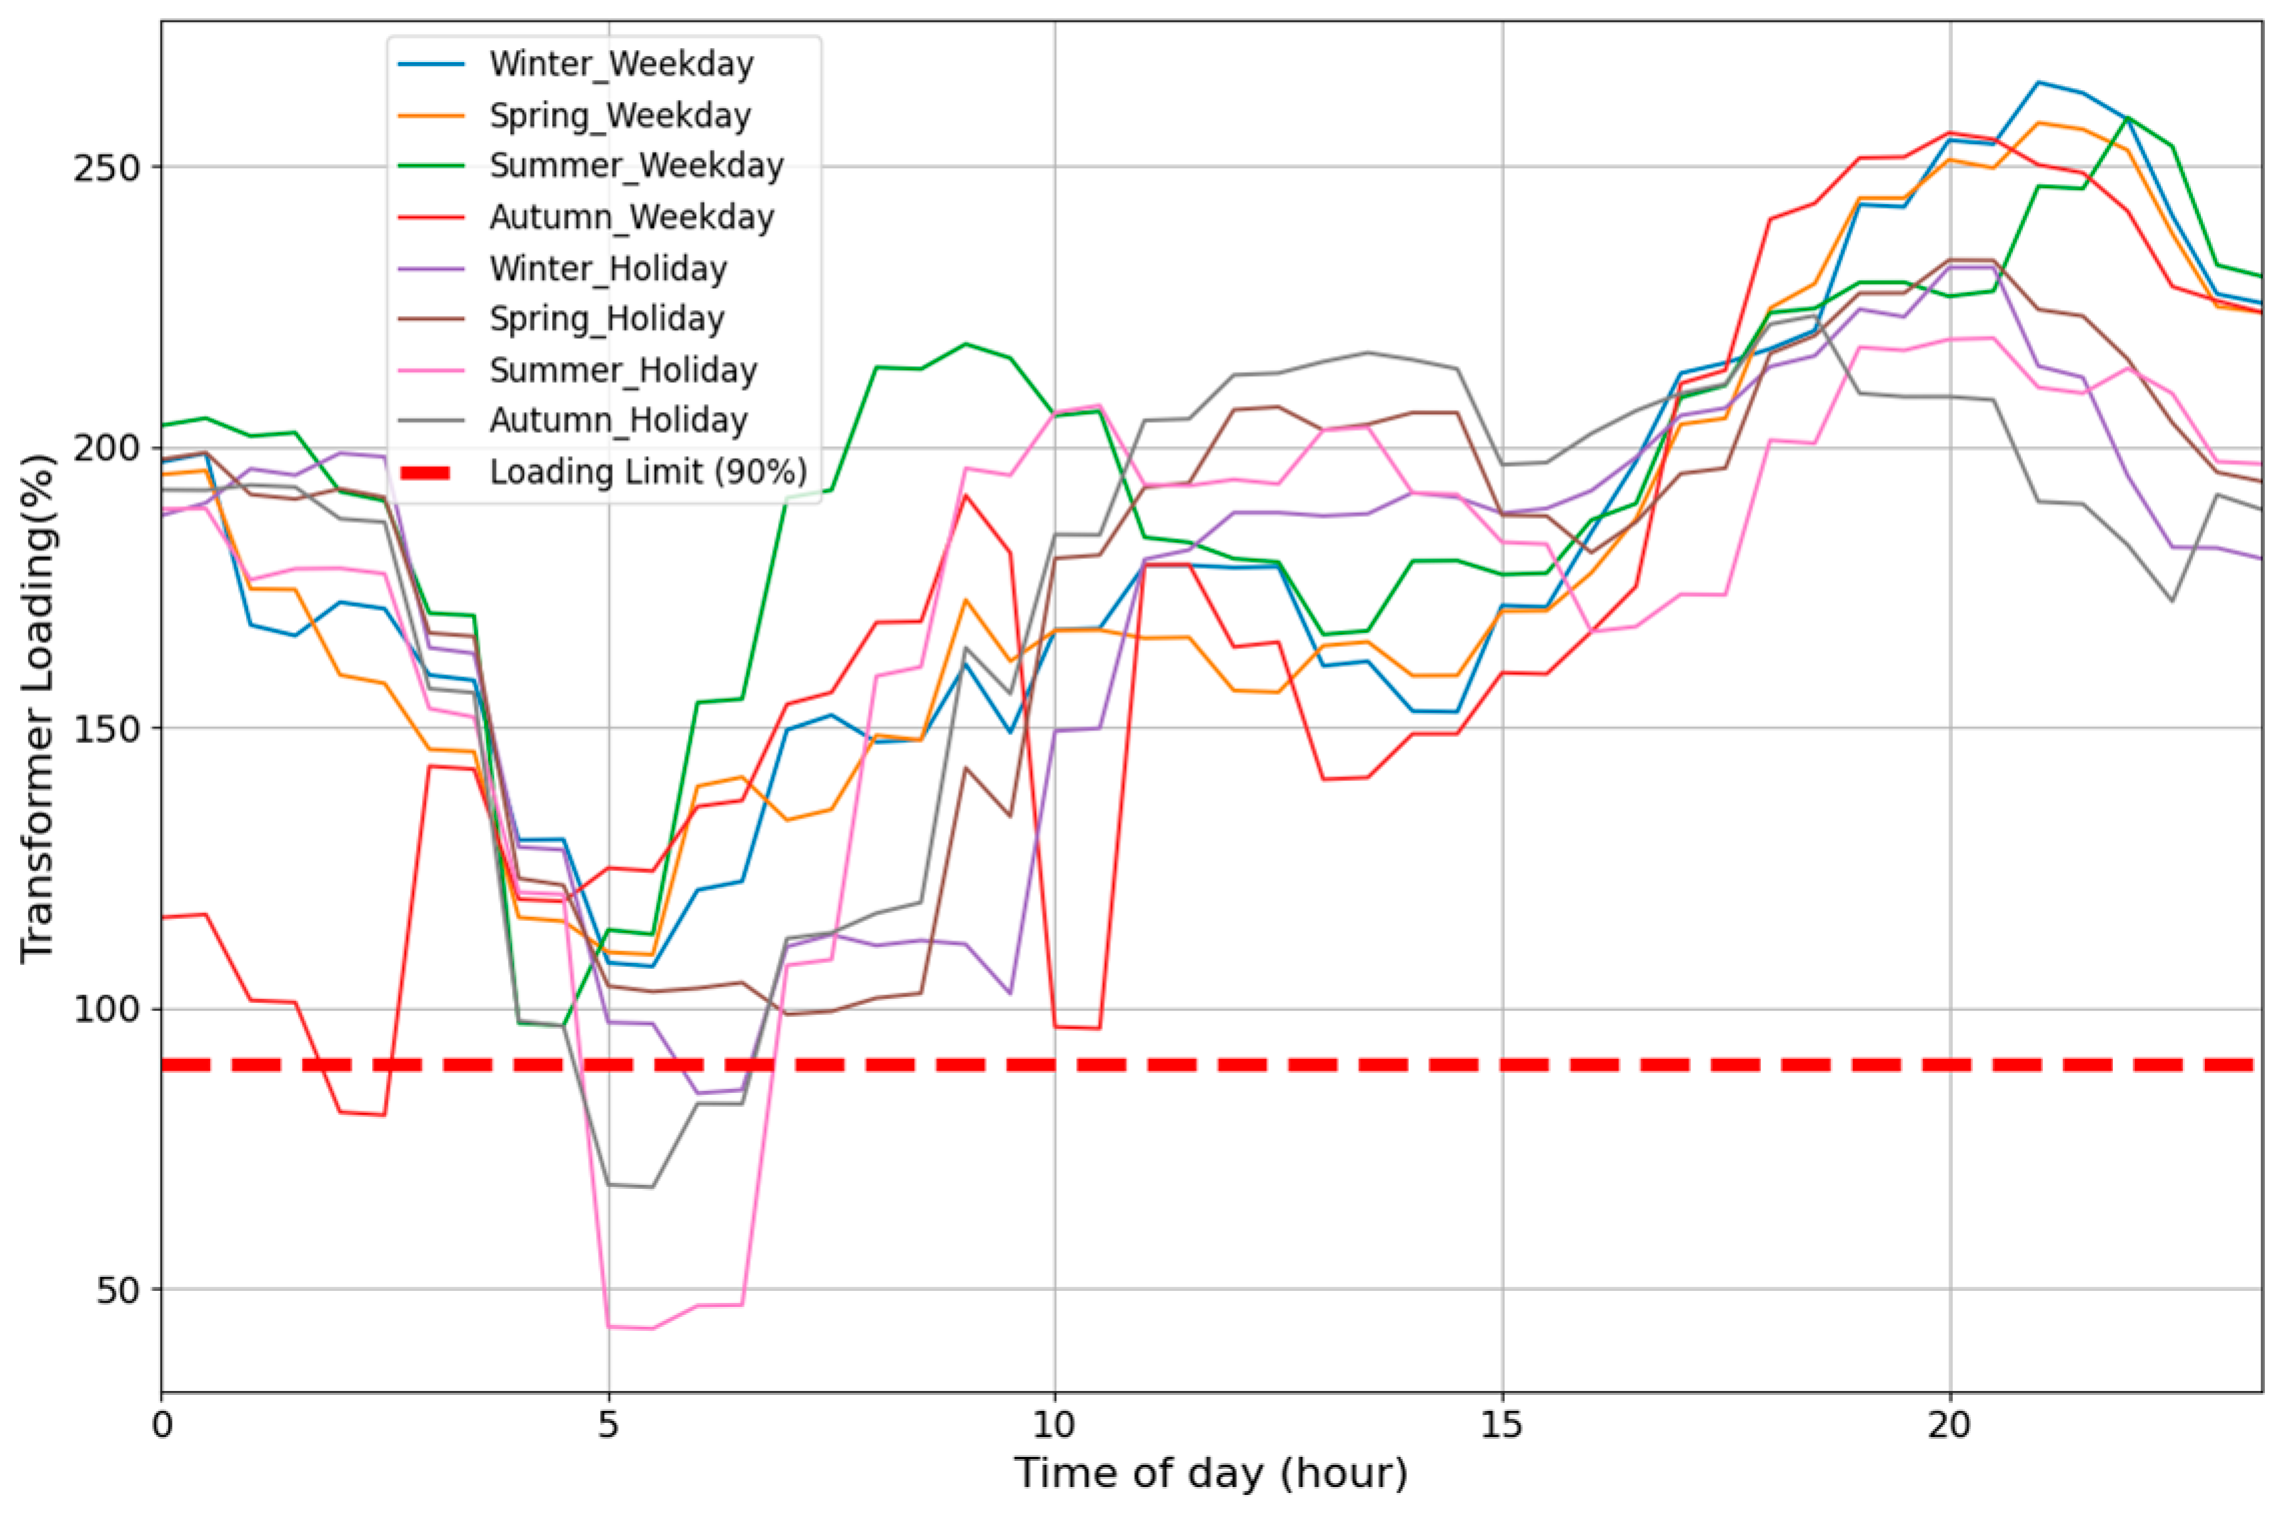
4.3. Analysis of Voltage and Transformer Violation with Future Predicted Integration of Heat Pumps and EVs Due to National Electrification Target
5. Conclusions
- The lower ambient temperature and the existence of a higher number of older buildings can significantly impact on end-user distribution network assets in implementing electrification and greenhouse gas emission policy which can be more prominent in winter days.
- If conditions require attaining a much higher adoption rate of heat pumps substituting more than the desired portion (23%) of conventional gas boilers, it will require significant enhancements to transformer capacity and a decrease in line impedance to accommodate the increased electrical load and ensure system dependability.
- While the present circumstances may preclude substantial enhancements to the distribution network assets, the preliminary execution of the asset upgrade plan should commence to provide resilience against dynamic political, economic, social, and technological trends.
6. Outlook for Readiness to Decarbonisation Progress
- The proactive strategy aimed at critical sectors with an expected swift adoption of electric vehicles and heat pumps will be more economical and less disruptive than addressing capacity deficiencies reactively.
- Incorporating planned retirements and replacements of network assets into comprehensive decarbonisation strategies will optimise costs and labour, and this dual approach—merging asset renewal with capacity improvements—will facilitate continuous, resilient service.
- Distributed energy resources (DERs) can diminish net demand on essential distribution assets. Supportive policy frameworks must be developed to facilitate shared community energy systems where applicable, enhancing resilience and reducing the necessity for additional network expansion.
- The UK government’s net-zero initiative requires explicit milestones and funding strategies for effective assistance. Collaborating with stakeholders to establish phased objectives for electric vehicles and heat pumps will enable Distribution Network Operators and investors to assess the magnitude, timing, and geographic distribution of the required enhancements.
- Permit procedures for network enhancements, asset substitutions, and the implementation of new technologies should be streamlined and expedited. National and local authorities must cooperate to eliminate unnecessary administrative obstacles, facilitating prompt infrastructure implementation.
Author Contributions
Funding
Data Availability Statement
Acknowledgments
Conflicts of Interest
References
- Sevdari, K.; Calearo, L.; Andersen, P.B.; Marinelli, M.; Rønnow, L. Autonomously distributed control of electric vehicle chargers for grid services. In Proceedings of the 2021 IEEE PES Innovative Smart Grid Technologies Europe (ISGT Europe), Espoo, Finland, 18–21 October 2021. [Google Scholar]
- Sevdari, K.; Calearo, L.; Andersen, P.B.; Marinelli, M. Ancillary services and electric vehicles: An overview from charging clusters and chargers technology perspectives. Renew. Sustain. Energy Rev. 2022, 167, 112666. [Google Scholar] [CrossRef]
- Shamoushaki, M.; Koh, S.C.L. Net-zero life cycle supply chain assessment of heat pump technologies. Energy 2024, 309, 133124. [Google Scholar] [CrossRef]
- Zhang, M.; Millar, M.; Yu, Z.; Yu, J. An assessment of the impacts of heat electrification on the electric grid in the UK. Energy Rep. 2022, 8, 14934–14946. [Google Scholar] [CrossRef]
- Xu, Z.; Li, H.; Xu, W.; Shao, S.; Wang, Z.; Gou, X.; Zhao, M.; Li, J. Investigation on the efficiency degradation characterization of low ambient temperature air source heat pump under partial load operation. Int. J. Refrig. 2022, 133, 99–110. [Google Scholar] [CrossRef]
- Milev, G.; Al-Habaibeh, A.; Fanshawe, S.; Siena, F.L. Investigating the effect of the defrost cycles of air-source heat pumps on their electricity demand in residential buildings. Energy Build. 2023, 300, 113656–113674. [Google Scholar] [CrossRef]
- Sharma, D.; Rehu, J.; Känsälä, K.; Ailisto, H. An automatic aggregator of power flexibility in smart buildings using software based orchestration. Sensors 2021, 21, 867. [Google Scholar] [CrossRef]
- Thorve, S.; Baek, Y.Y.; Swarup, S.; Mortveit, H.; Marathe, A.; Vullikanti, A.; Marathe, M. High resolution synthetic residential energy use profiles for the United States. Nature 2023, 10, 76. [Google Scholar] [CrossRef]
- Gupta, R.; Zahiri, S. Field study of energy and environmental performance of ground source heat pumps retrofitted in a cluster of UK social housing dwellings. J. Phys. Conf. Ser. 2023, 2600, 062004. [Google Scholar] [CrossRef]
- Borsboom, W.; Mossallam, B.; Linden, R. Reducing peak load of renewable energy at district level with predictive twins. IOP Conf. Ser. Earth Environ. Sci. 2022, 1085, 012007. [Google Scholar] [CrossRef]
- Sun, J.; Chen, B.; Hu, Y. Network-integrated evolutionary analysis for electric vehicle charging infrastructure deployment in the UK. In Proceedings of the International Conference on Energy, Ecology and Environment 2023 (ICEEE2023), London, UK, 14–18 August 2023. [Google Scholar]
- Pathway for Zero Emission Vehicle Transition by 2035 Becomes Law. Available online: https://www.gov.uk/government/news/pathway-for-zero-emission-vehicle-transition-by-2035-becomes-law#:~:text=80%25%20of%20new%20cars%20and,increasing%20to%20100%25%20by%202035.&text=The%20UK%20now%20has%20the,today%20(3%20January%202024) (accessed on 1 November 2024).
- Castle, J.; Hendry, D. Can the UK achieve net zero greenhouse gas emissions by 2050? Natl. Inst. Econ. Rev. 2023, 266, 11–21. [Google Scholar] [CrossRef]
- Hafezi, S.; Morimoto, R. How the presence of public charging infrastructure can impact the adoption rate of electric vehicles in the UK. In Proceedings of the 6th International Conference on Clean Energy and Technology, Penang, Malaysia, 7–8 June 2023. [Google Scholar]
- Nazari-Heris, M.; Abapour, M.; Mohammadi-Ivatloo, B. An Updated Review and Outlook on Electric Vehicle Aggregators in Electric Energy Networks. Sustainability 2022, 14, 15747. [Google Scholar] [CrossRef]
- Khan, M.O.; Kirmani, S.; Rihan, M. Impact assessment of electric vehicle charging on distribution networks. Renew. Energy Focus 2024, 50, 100599–100607. [Google Scholar] [CrossRef]
- Nutkani, I.; Toole, H.; Fernando, N.; Andrew, L.P.C. Impact of EV charging on electrical distribution network and mitigating solutions—A review. IET Smart Grid 2024, 7, 485–502. [Google Scholar] [CrossRef]
- Thormann, B.; Kienberger, T. Evaluation of Grid Capacities for Integrating Future E-Mobility and Heat Pumps into Low-Voltage Grids. Energies 2020, 13, 5083. [Google Scholar] [CrossRef]
- Barbosa, T.; Andrade, J.; Torquato, R.; Walmir Freitas, W.; Trindade, F.C.L. Use of EV hosting capacity for management of low-voltage distribution systems. IET Gener. Transm. Distrib. 2020, 14, 2620–2629. [Google Scholar] [CrossRef]
- Silva, E.C.D.; Melgar-Dominguez, O.D.; Romero, A.R. Simultaneous Distributed Generation and Electric Vehicles Hosting Capacity Assessment in Electric Distribution Systems. IEEE Access 2021, 9, 110927–110939. [Google Scholar] [CrossRef]
- Fachrizal, R.; Ramadhani, U.H.; Munkhammar, J.; Widén, J. Combined PV–EV hosting capacity assessment for a residential LV distribution grid with smart EV charging and PV curtailment. Sustain. Energy Grids Netw. 2021, 26, 100445–100459. [Google Scholar] [CrossRef]
- Sandström, M.; Huang, P.; Bales, C.; Dotzauer, E. Evaluation of hosting capacity of the power grid for electric vehicles—A case study in a Swedish residential area. Energy 2023, 284, 129293–129305. [Google Scholar] [CrossRef]
- Prasad, D.; Suresh, G.; Gopila, M. Distribution-Driven Optimization for Heat Pump and EV Hosting Capacity in LV Networks. IETE J. Res. 2024, 70, 6882–6892. [Google Scholar] [CrossRef]
- Khalid, M. Smart grids and renewable energy systems: Perspectives and grid integration challenges. Energy Strategy Rev. 2024, 51, 101299–101324. [Google Scholar] [CrossRef]
- Khalid, M.; Thakur, J.; Bhagavathy, S.M.; Topel, M. Impact of public and residential smart EV charging on distribution power grid equipped with storage. Sustain. Cities Soc. 2024, 104, 105272–105285. [Google Scholar] [CrossRef]
- Capper, T.; Kuriakose, J.; Sharmina, M. Facilitating domestic demand response in Britain’s electricity system. Util. Policy 2024, 89, 101768–101777. [Google Scholar] [CrossRef]
- Damianakis, N.; Mouli, G.R.C.; Bauer, P.; Yunhe Yu, M. Assessing the grid impact of Electric Vehicles, Heat Pumps & PV generation in Dutch LV distribution grids. Appl. Energy 2023, 352, 121878–121892. [Google Scholar]
- Becker, T.; Smetc, R.; Macharisc, B.; Vanthournout, K. Effect of electric vehicles, heat pumps, and solar panels on low-voltage feeders: Evidence from smart meter profiles. Sustain. Energy Grids Netw. 2025, 42, 101705–101725. [Google Scholar] [CrossRef]
- Lama, P.; Maharjan, S.; Kimber, A.; Wang, Z. Evaluating the Impact of EVs and Heat Pumps on Primary-Secondary Distribution Systems Using Real-World Data. In Proceedings of the 2024 56th North American Power Symposium (NAPS), El Paso, TX, USA, 13–15 October 2024. [Google Scholar]
- Steffen, T.; Wiegel, B.; Baboli, P.T.; Becker, C. Impacts of Distribution Grid Congestion Management on Charging Efficiency of Private Electric Vehicles. In Proceedings of the NEIS 2024, Conference on Sustainable Energy Supply and Energy Storage Systems, Hamburg, Germany, 16–17 September 2024. [Google Scholar]
- Arboleya, P.; Kippke, M.A.; Kerscher, S. Flexibility management in the low-voltage distribution grid as a tool in the process of decarbonization through electrification. In Proceedings of the 8th International Conference on Energy and Environment Research ICEER 2021, Roma, Italy, 13–17 September 2021. [Google Scholar]
- UK Census Data. Available online: https://www.ons.gov.uk/census/planningforcensus2021/ukcensusdata (accessed on 12 November 2024).
- Healthy Street Score Cards. Available online: https://www.healthystreetsscorecard.london/results/results_outcome_indicators/#ResultsCarOwnership (accessed on 12 November 2024).
- SSEN Distribution Data Portal. Available online: https://data.ssen.co.uk/ (accessed on 31 January 2025).
- Low Carbon London Electric Vehicle Load Profiles. Available online: https://data.london.gov.uk/dataset/low-carbon-london-electric-vehicle-load-profiles (accessed on 16 October 2024).
- Open-Meteo. Available online: https://open-meteo.com/ (accessed on 24 October 2024).
- Standard Assessment Procedure (SAP 2012)—BRE Group. Available online: https://bregroup.com/sap/standard-assessment-procedure-sap-2012/ (accessed on 1 November 2024).
- Energy Performance of Buildings Data England and Wales. Available online: https://epc.opendatacommunities.org/ (accessed on 1 November 2024).
- Public Health England. Minimum Home Temperature Thresholds for Health in Winter—A Systematic Literature Review; Public Health England: London, UK, 2014; pp. 10–26. [Google Scholar]
- British Gas—What Is the Ideal Home Temperature? Available online: https://www.britishgas.co.uk/the-source/no-place-like-home/whats-the-ideal-home-temperature.html (accessed on 11 September 2024).
- Zhang, W.; Hrnjak, P. The Experimental Study of Defrosting Energy of an Air-source Heat Pump System Under Various Conditions. In Proceedings of the 19th International Refrigeration and Air-Conditioning Conference, West Lafayette, IN, USA, 10–14 July 2022. [Google Scholar]
- Fakheri, A. Heat Exchanger Efficiency. J. Heat Mass Transf. 2007, 129, 1268–1276. [Google Scholar] [CrossRef]
- Islam, M.R. Chapter 7: Field Guidelines. In Reservoir Development: Sustainable Oil and Gas Development, 2nd ed.; Hammon, K., Ed.; Elsevier: London, UK, 2007; pp. 737–843. [Google Scholar]
- Aragon, V.; Gauthier, S.; Warren, P.; James, P.A.B.; Ben Anderson, A. Developing English domestic occupancy profiles. Build. Res. Inf. 2017, 47, 375–393. [Google Scholar] [CrossRef]
- Ahmed, K.; Pylsy, P.; Kurnitski, J. Hourly consumption profiles of domestic hot water for different occupant groups in dwellings. Sol. Energy 2016, 137, 516–530. [Google Scholar] [CrossRef]
- Thurner, L.; Scheidler, A.; Schäfer, F.; Menke, J.; Dollichon, J.; Meier, F.; Meinecke, S.; Braun, M. Pandapower—An Open-Source Python Tool for Convenient Modeling, Analysis, and Optimization of Electric Power Systems. IEEE Trans. Power Syst. 2018, 33, 6510–6521. [Google Scholar] [CrossRef]
- Western Power Distribution. Project NETWORK EQUILIBRIUM Voltage Limits Assessment Discussion; National Grid: London, UK, 2016; pp. 6–8. [Google Scholar]
- SP Energy Networks. Available online: https://www.spenergynetworks.co.uk/pages/voltage_changes.aspx#:~:text=In%20the%20UK%2C%20the%20declared,216.2%20volts%20to%20253.0%20volts (accessed on 1 November 2024).
- English Housing Survey 2021 to 2022: Energy. Available online: https://www.gov.uk/government/statistics/english-housing-survey-2021-to-2022-energy/english-housing-survey-2021-to-2022-energy#:~:text=Heat%20pumps%20make%20use%20of,too%20small%20to%20report%20on (accessed on 22 September 2024).
- REVEALED: The UK’s Electric Vehicle Numbers, Ranked Best to Worst by Town. Available online: https://fleetcover.co.uk/greenest-transport-towns/ (accessed on 22 September 2024).
- Electric Vehicles. Available online: https://www.neso.energy/energy-101/net-zero-explained/electric-vehicles (accessed on 22 September 2024).
- Sarsentis, D.; Orso, L. How the UK Compares to the Rest of Europe on Heat Pump Uptake; NESTA: London, UK, 2023; pp. 1–38. [Google Scholar]
- Families and Households in the UK: 2023. Available online: https://www.ons.gov.uk/peoplepopulationandcommunity/birthsdeathsandmarriages/families/bulletins/familiesandhouseholds/2023#:~:text=There%20were%208.4%20million%20people,all%20people%20living%20in%20households (accessed on 12 November 2024).
- Acquah-Andoh, E.; Ifelebuegu, A.; Theophilus, S. Brexit and UK energy security: Perspectives from unconventional gas investment and the effects of shale gas on UK energy prices. Energies 2019, 12, 600. [Google Scholar] [CrossRef]
- Althaqafi, M. The impact of natural gas prices on electricity tariffs in the UK. Int. J. Energy Econ. Policy 2023, 13, 86–91. [Google Scholar] [CrossRef]
- Bennett, G.; Elwell, C.; Oreszczyn, T. Space heating operation of combination boilers in the UK: The case for addressing real-world boiler performance. Build. Serv. Eng. Res. Technol. 2018, 40, 75–92. [Google Scholar] [CrossRef]


| Specification | Values |
|---|---|
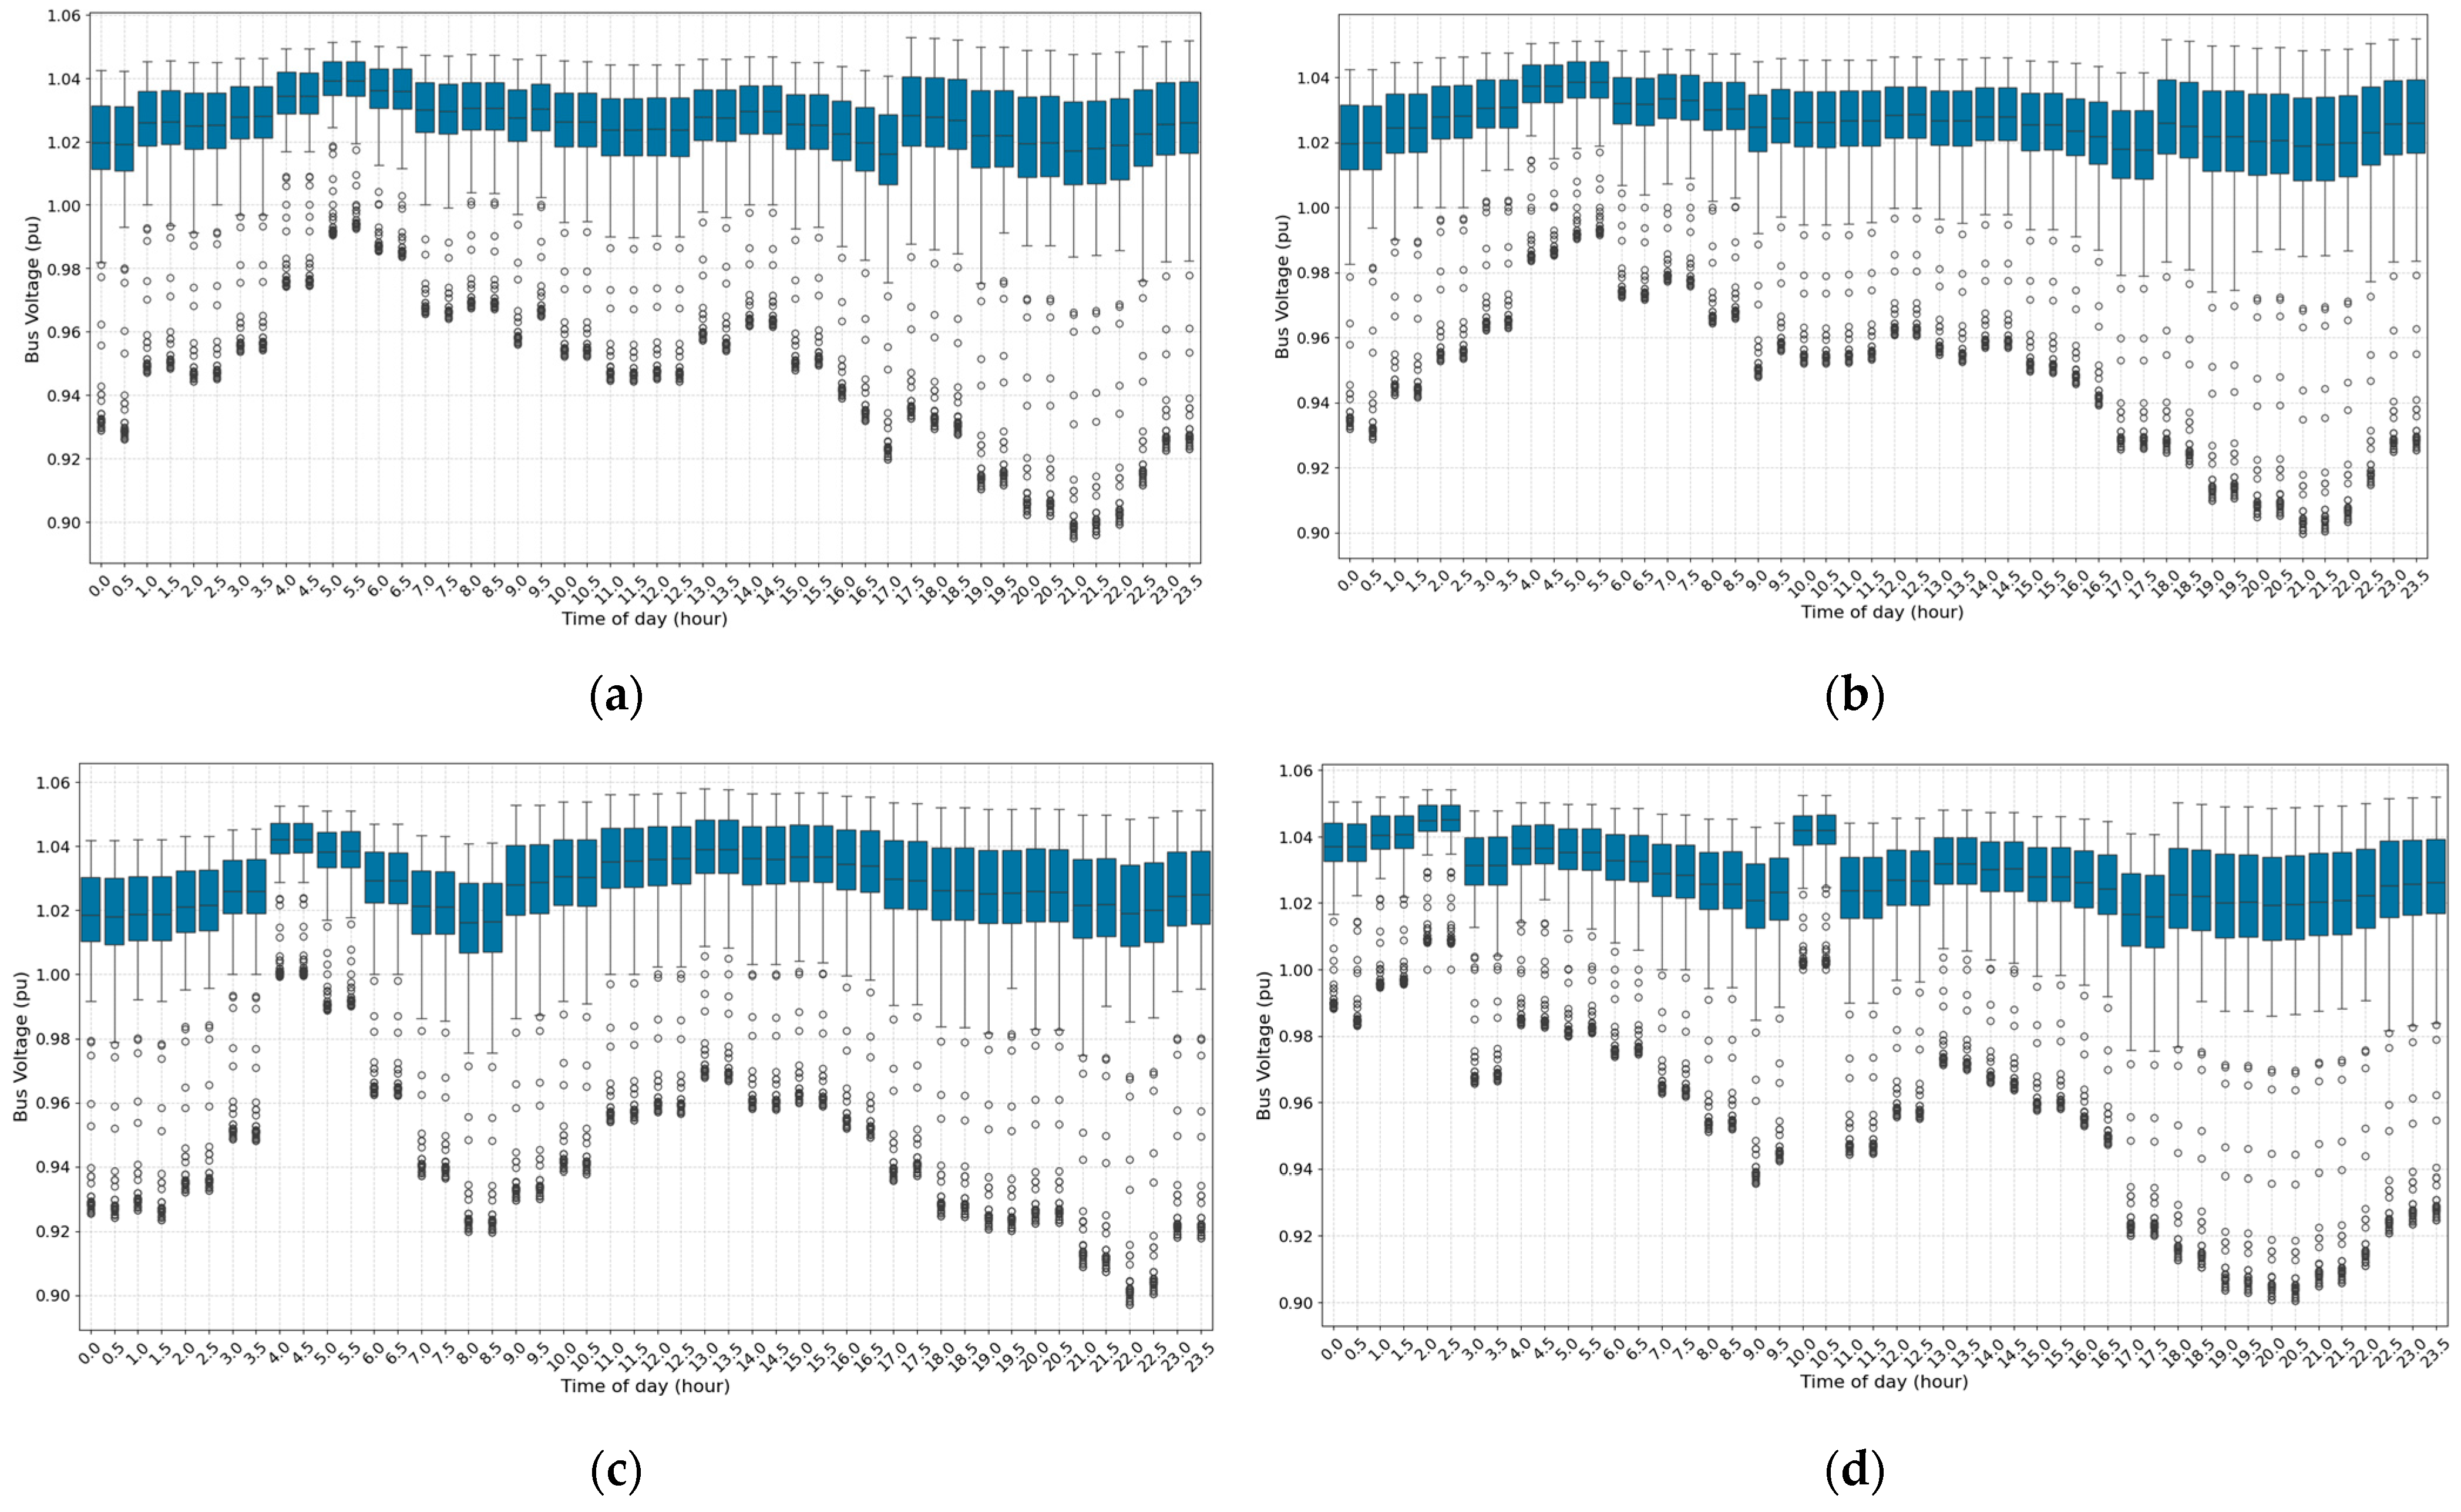
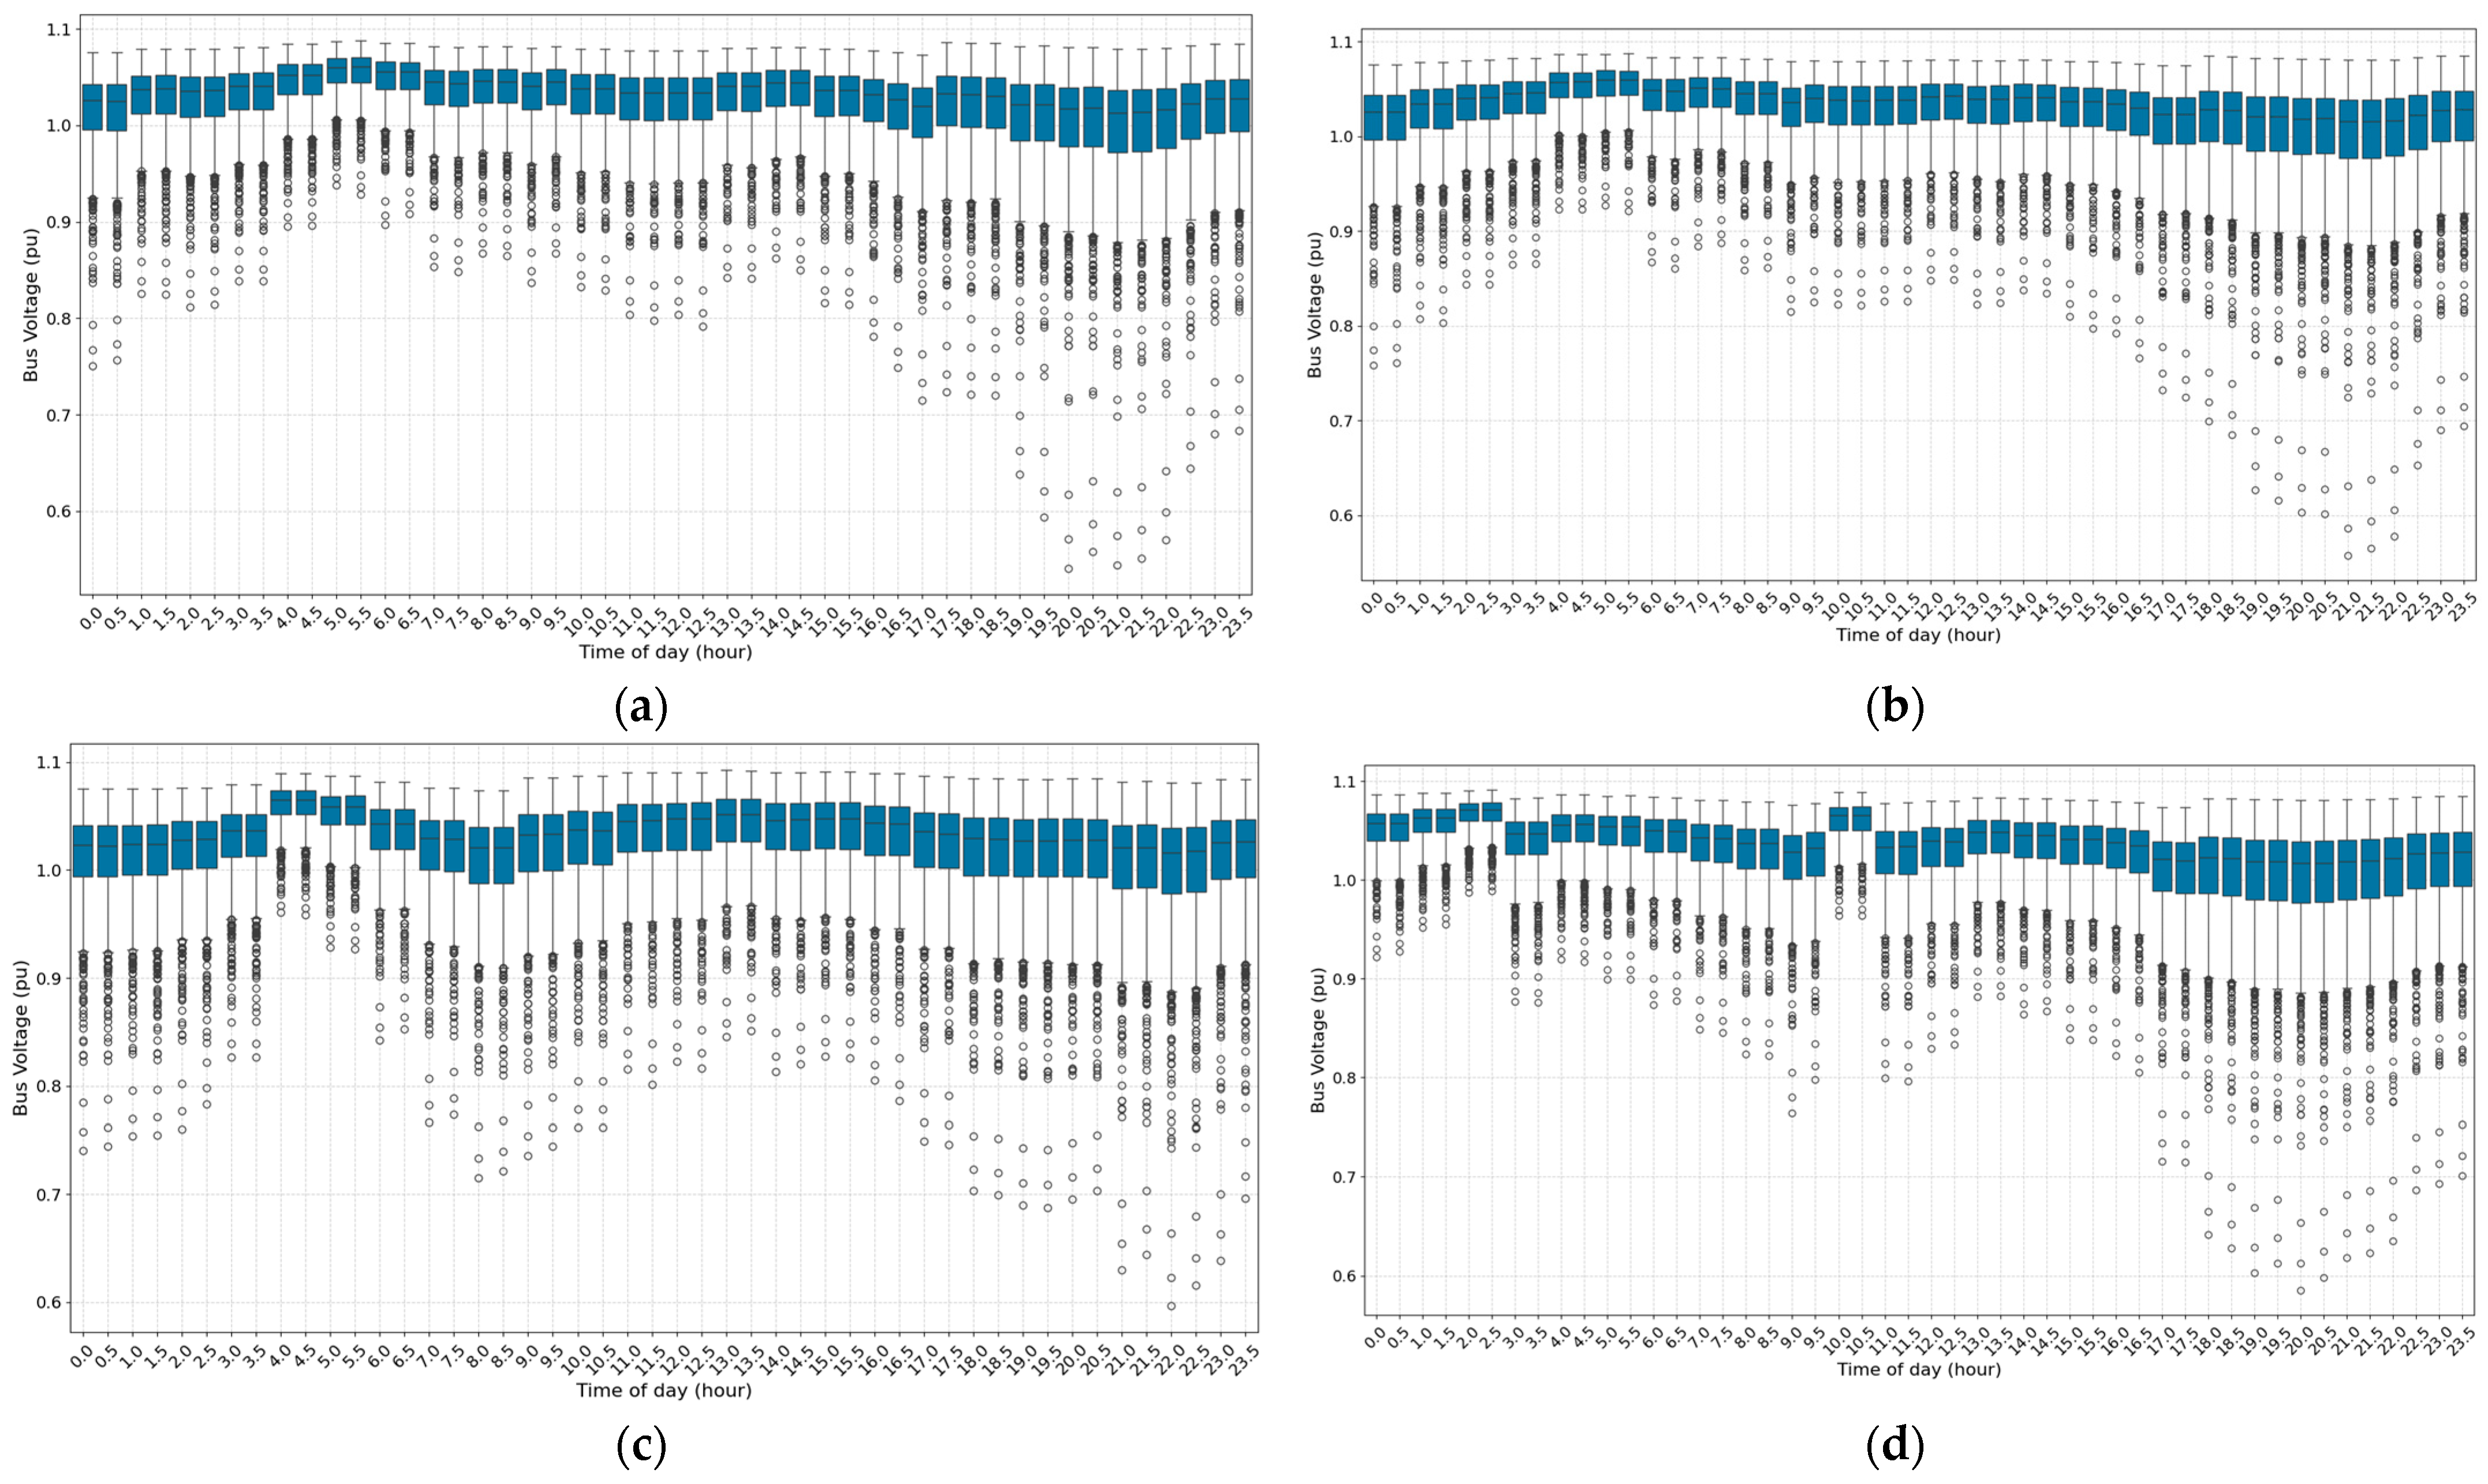
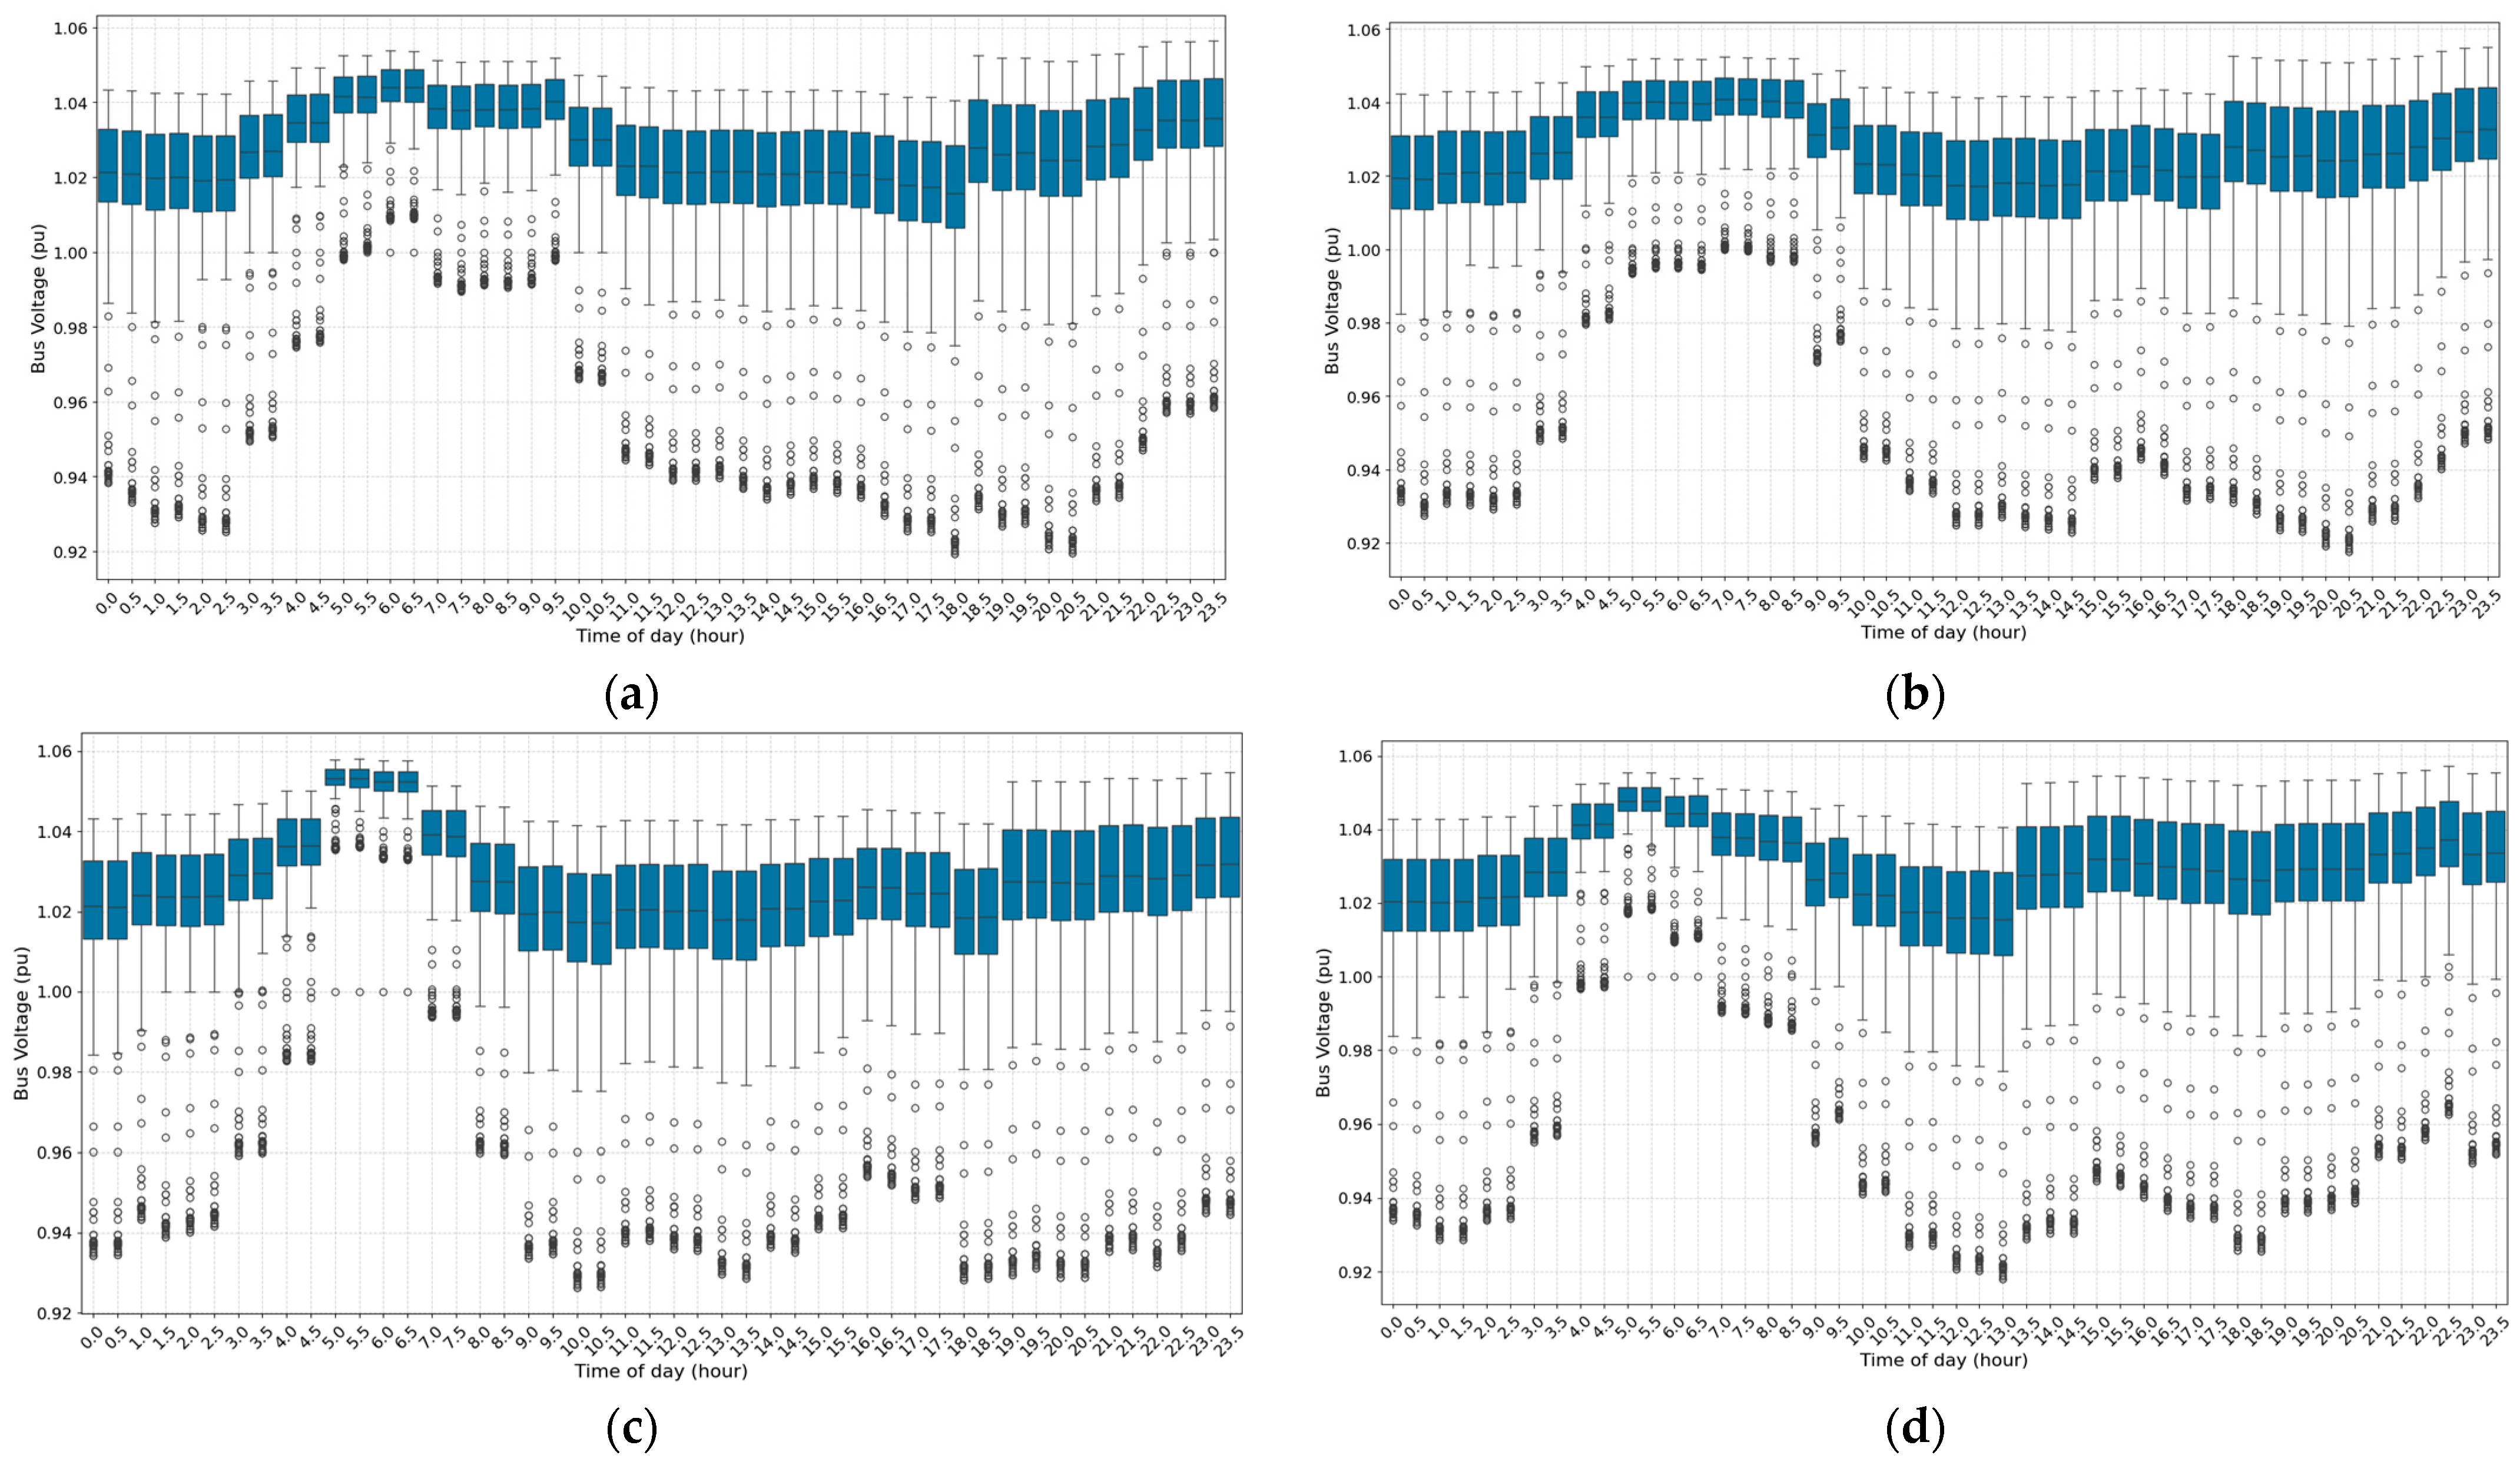
| 11 kV bus acceptable voltage [47] | 0.94–1.06 pu |
| 0.4 kV bus acceptable voltage [48] | 0.94–1.1 pu |
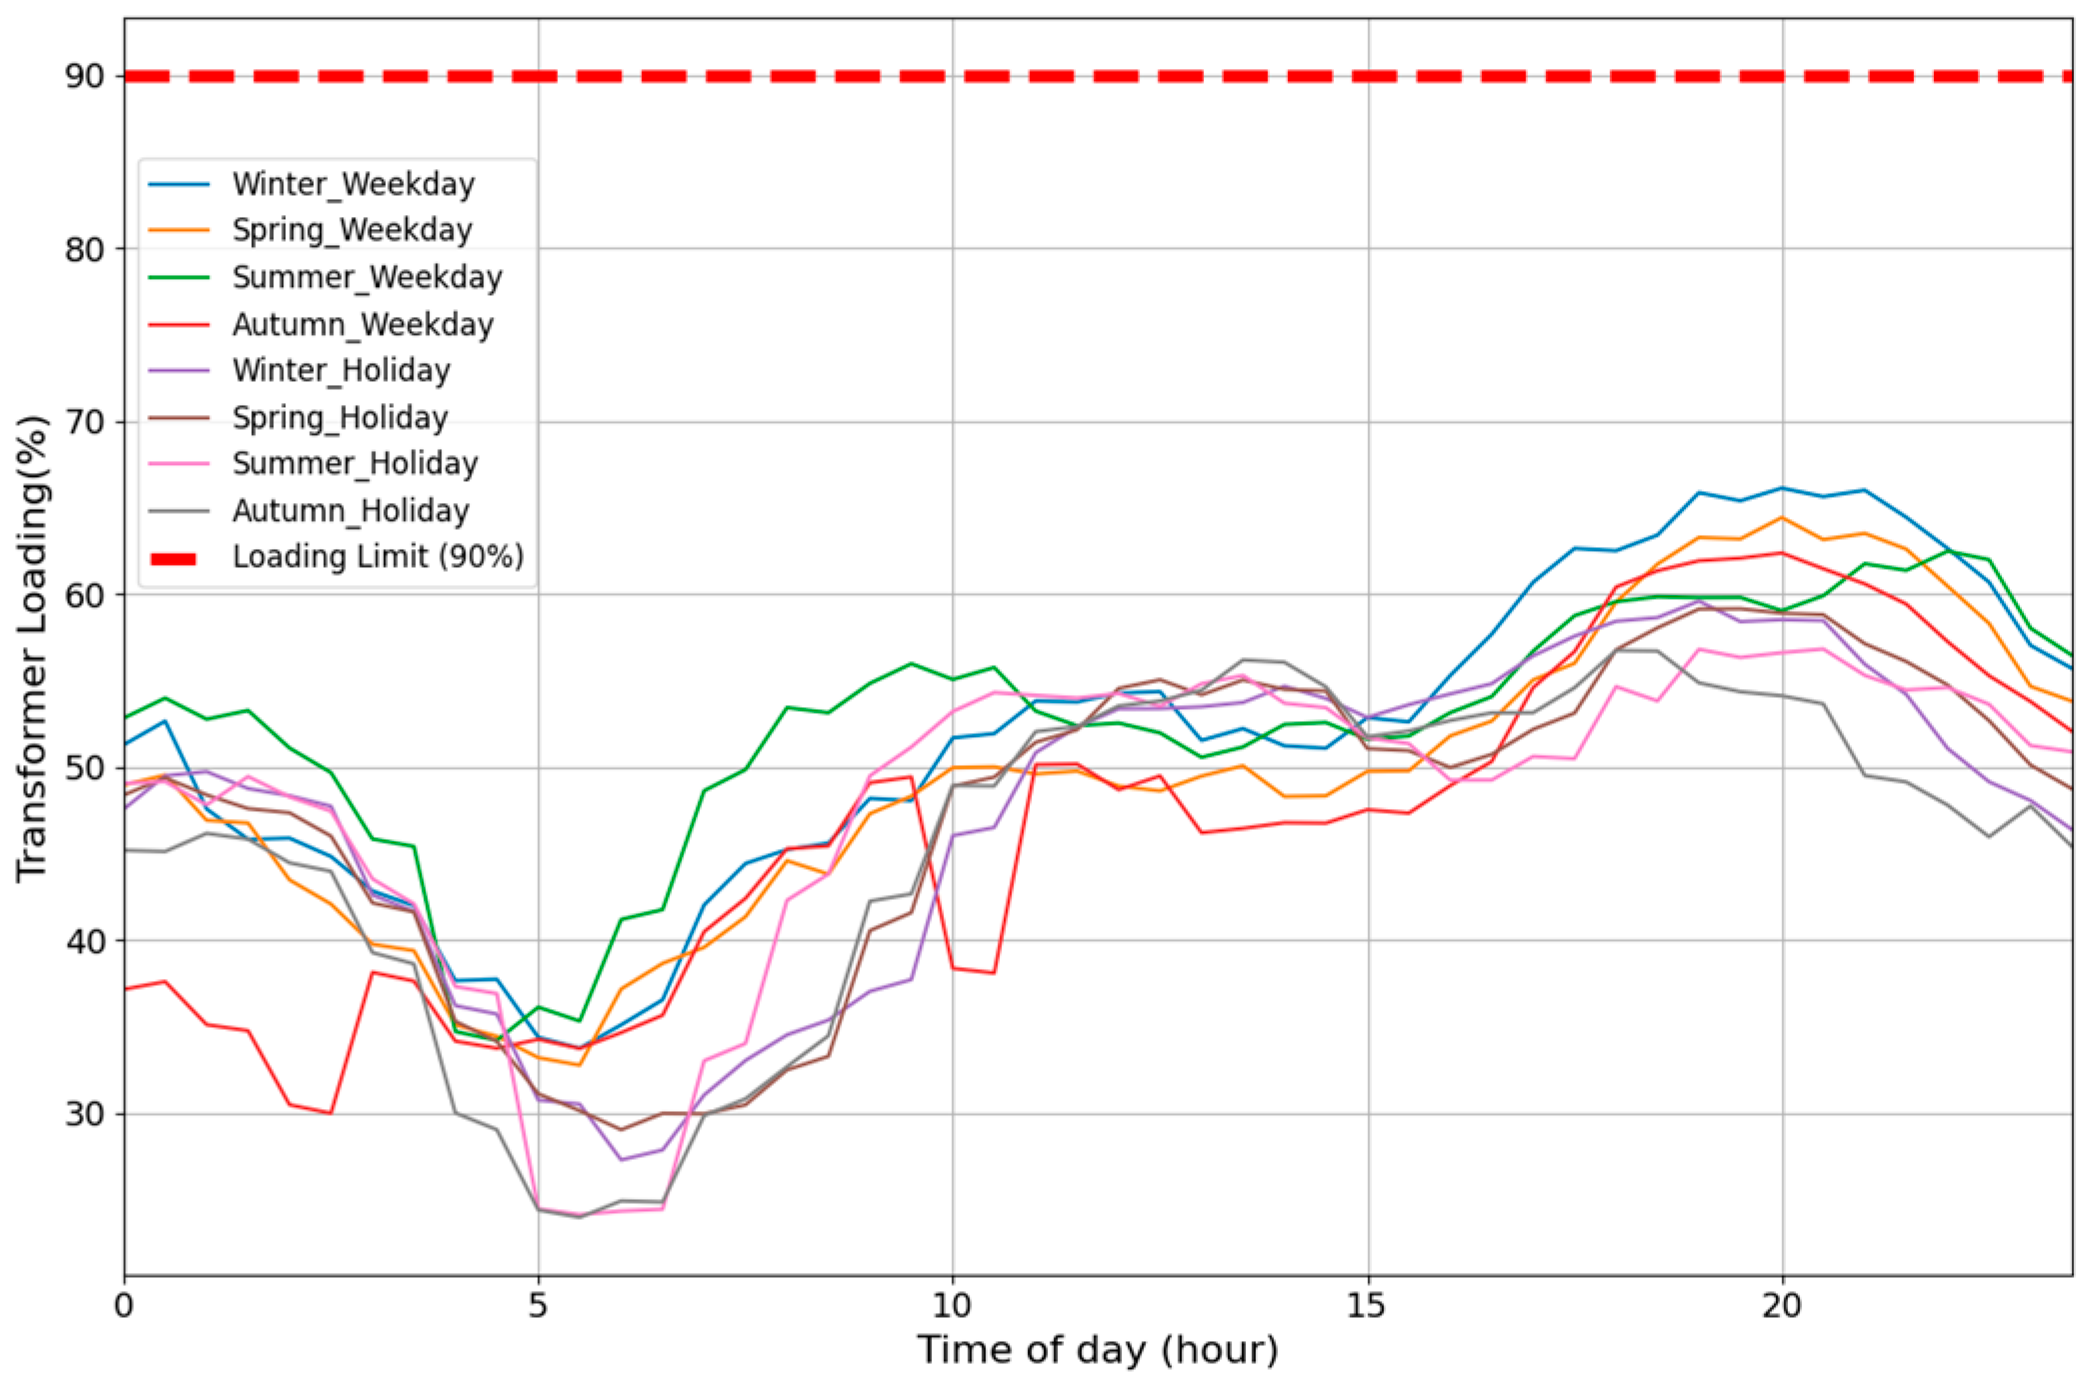
| Transformer rating limit | 90% |
| OLTC (assumed) | +/− 8 taps, +/− 1.25% per tap |
| Power factor | 0.95 |
| No. | Finding | Scenario | Implication |
|---|---|---|---|
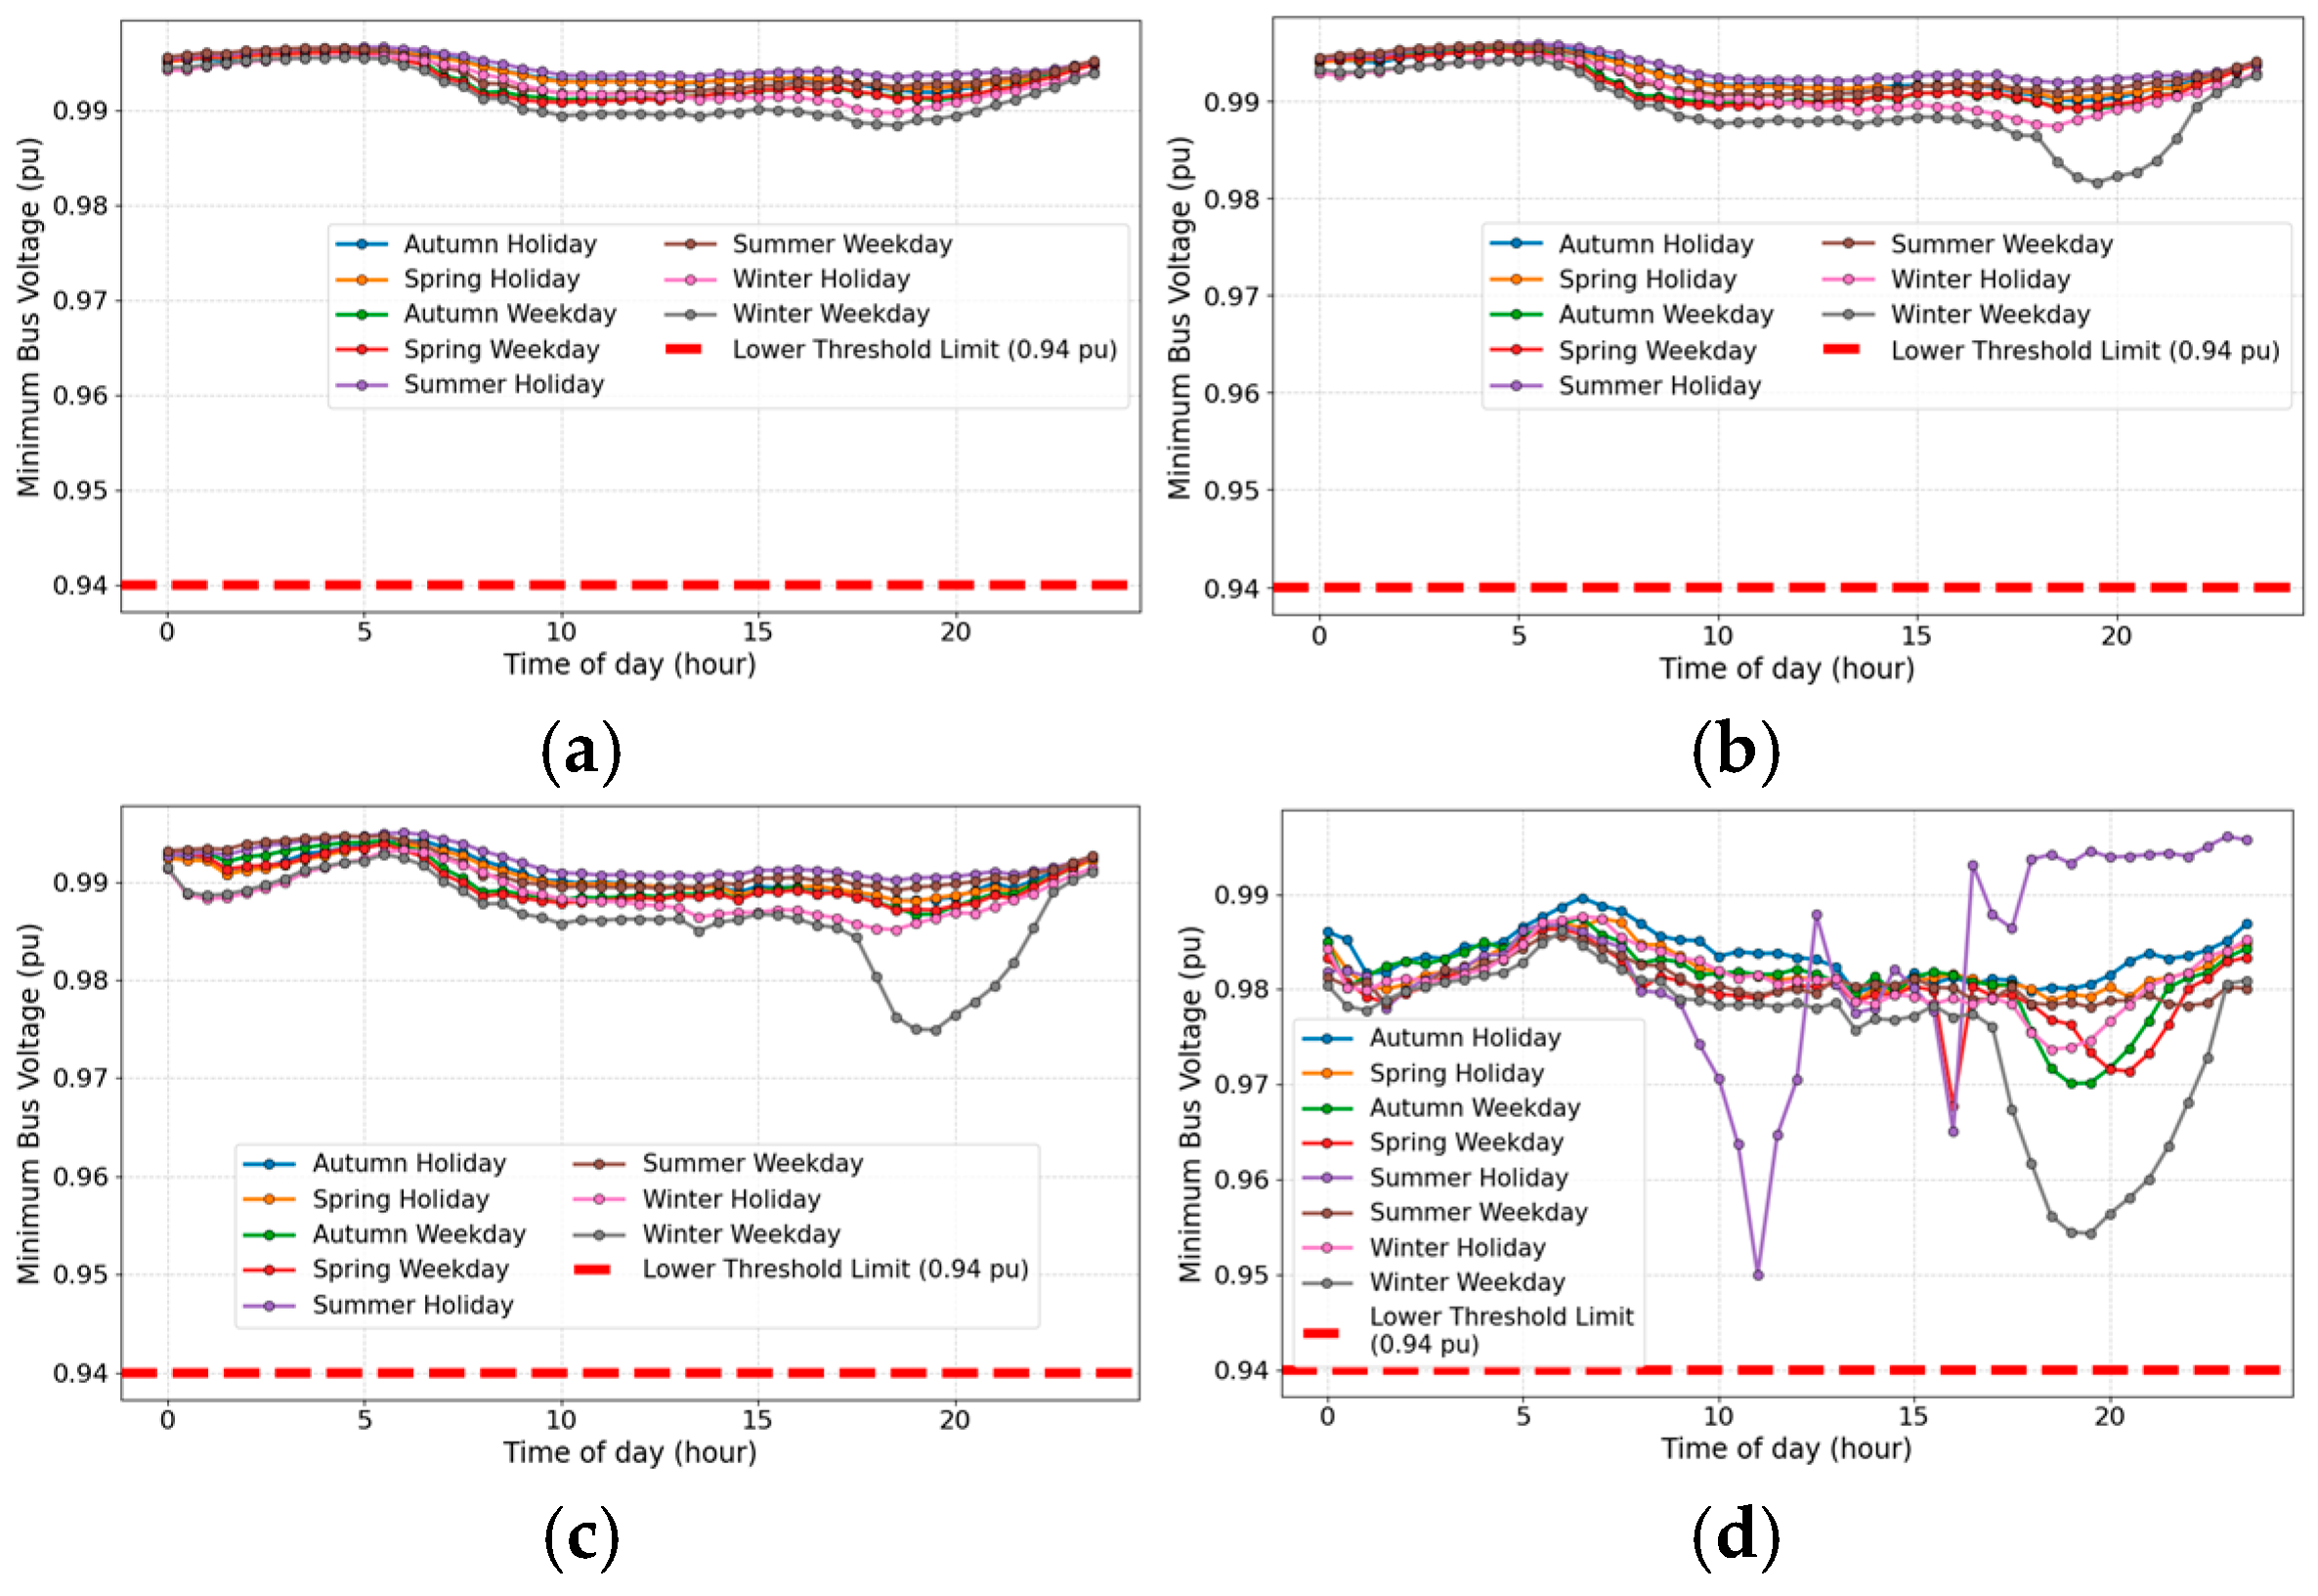
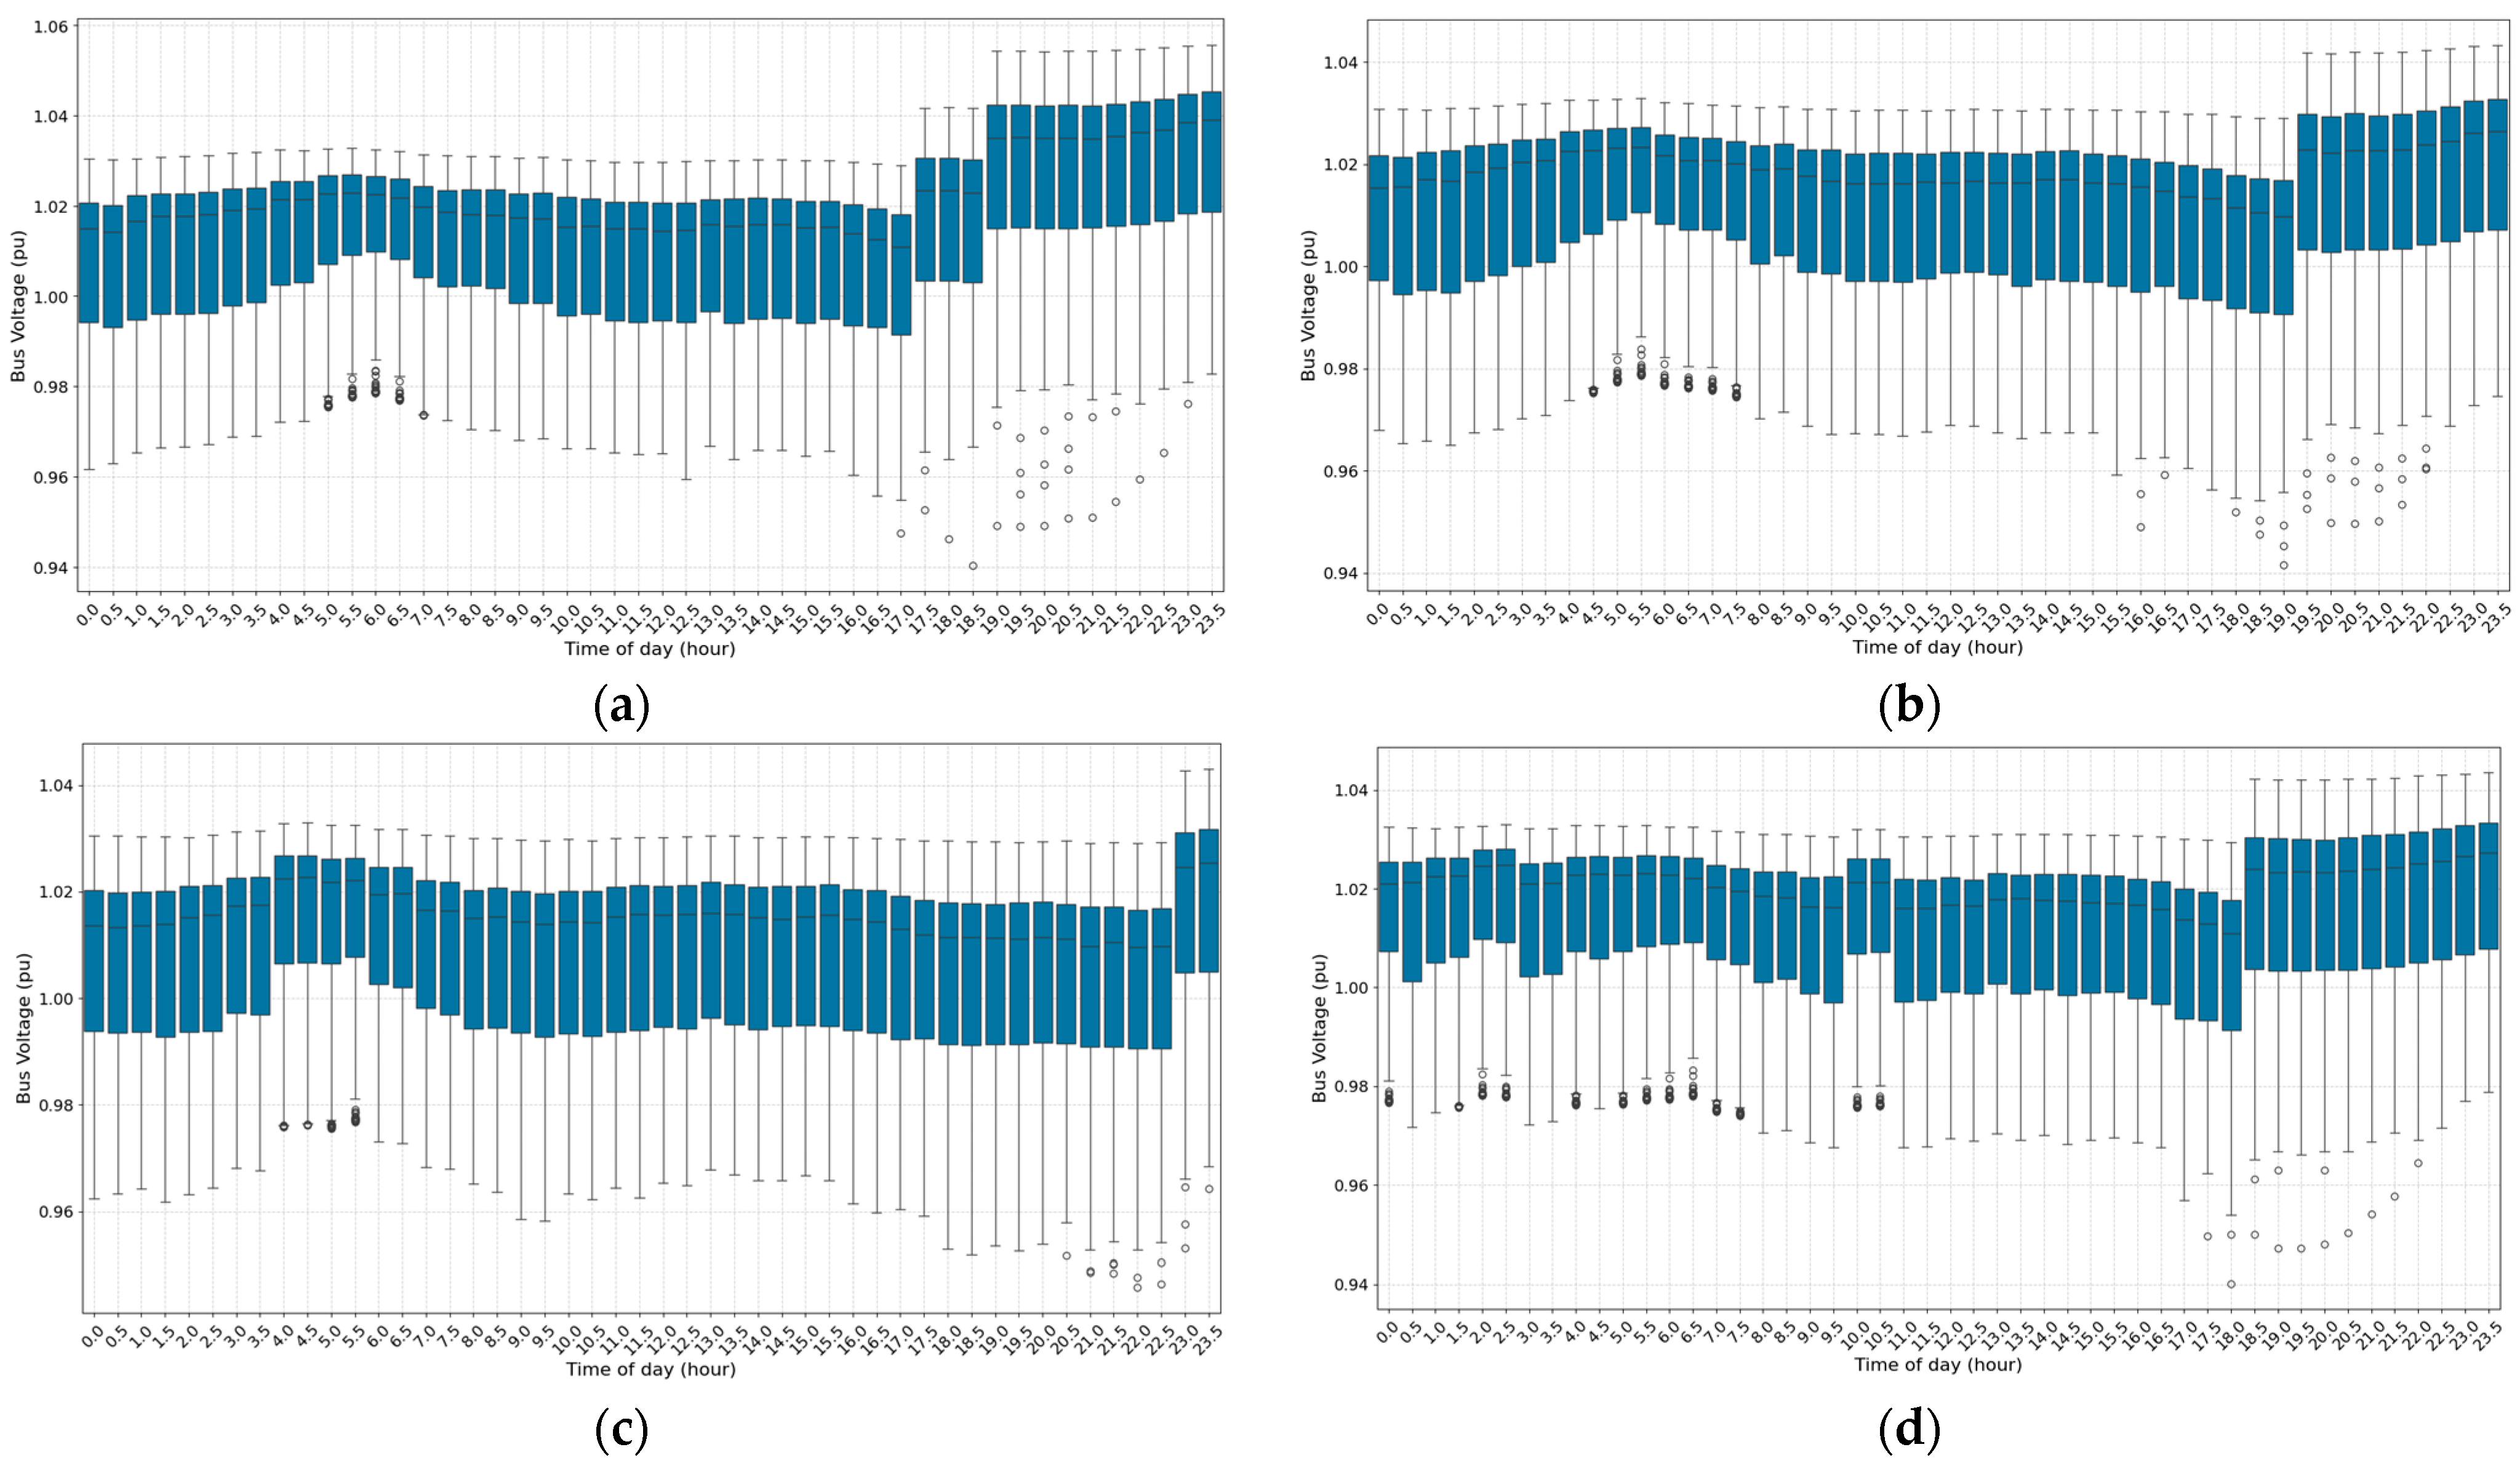
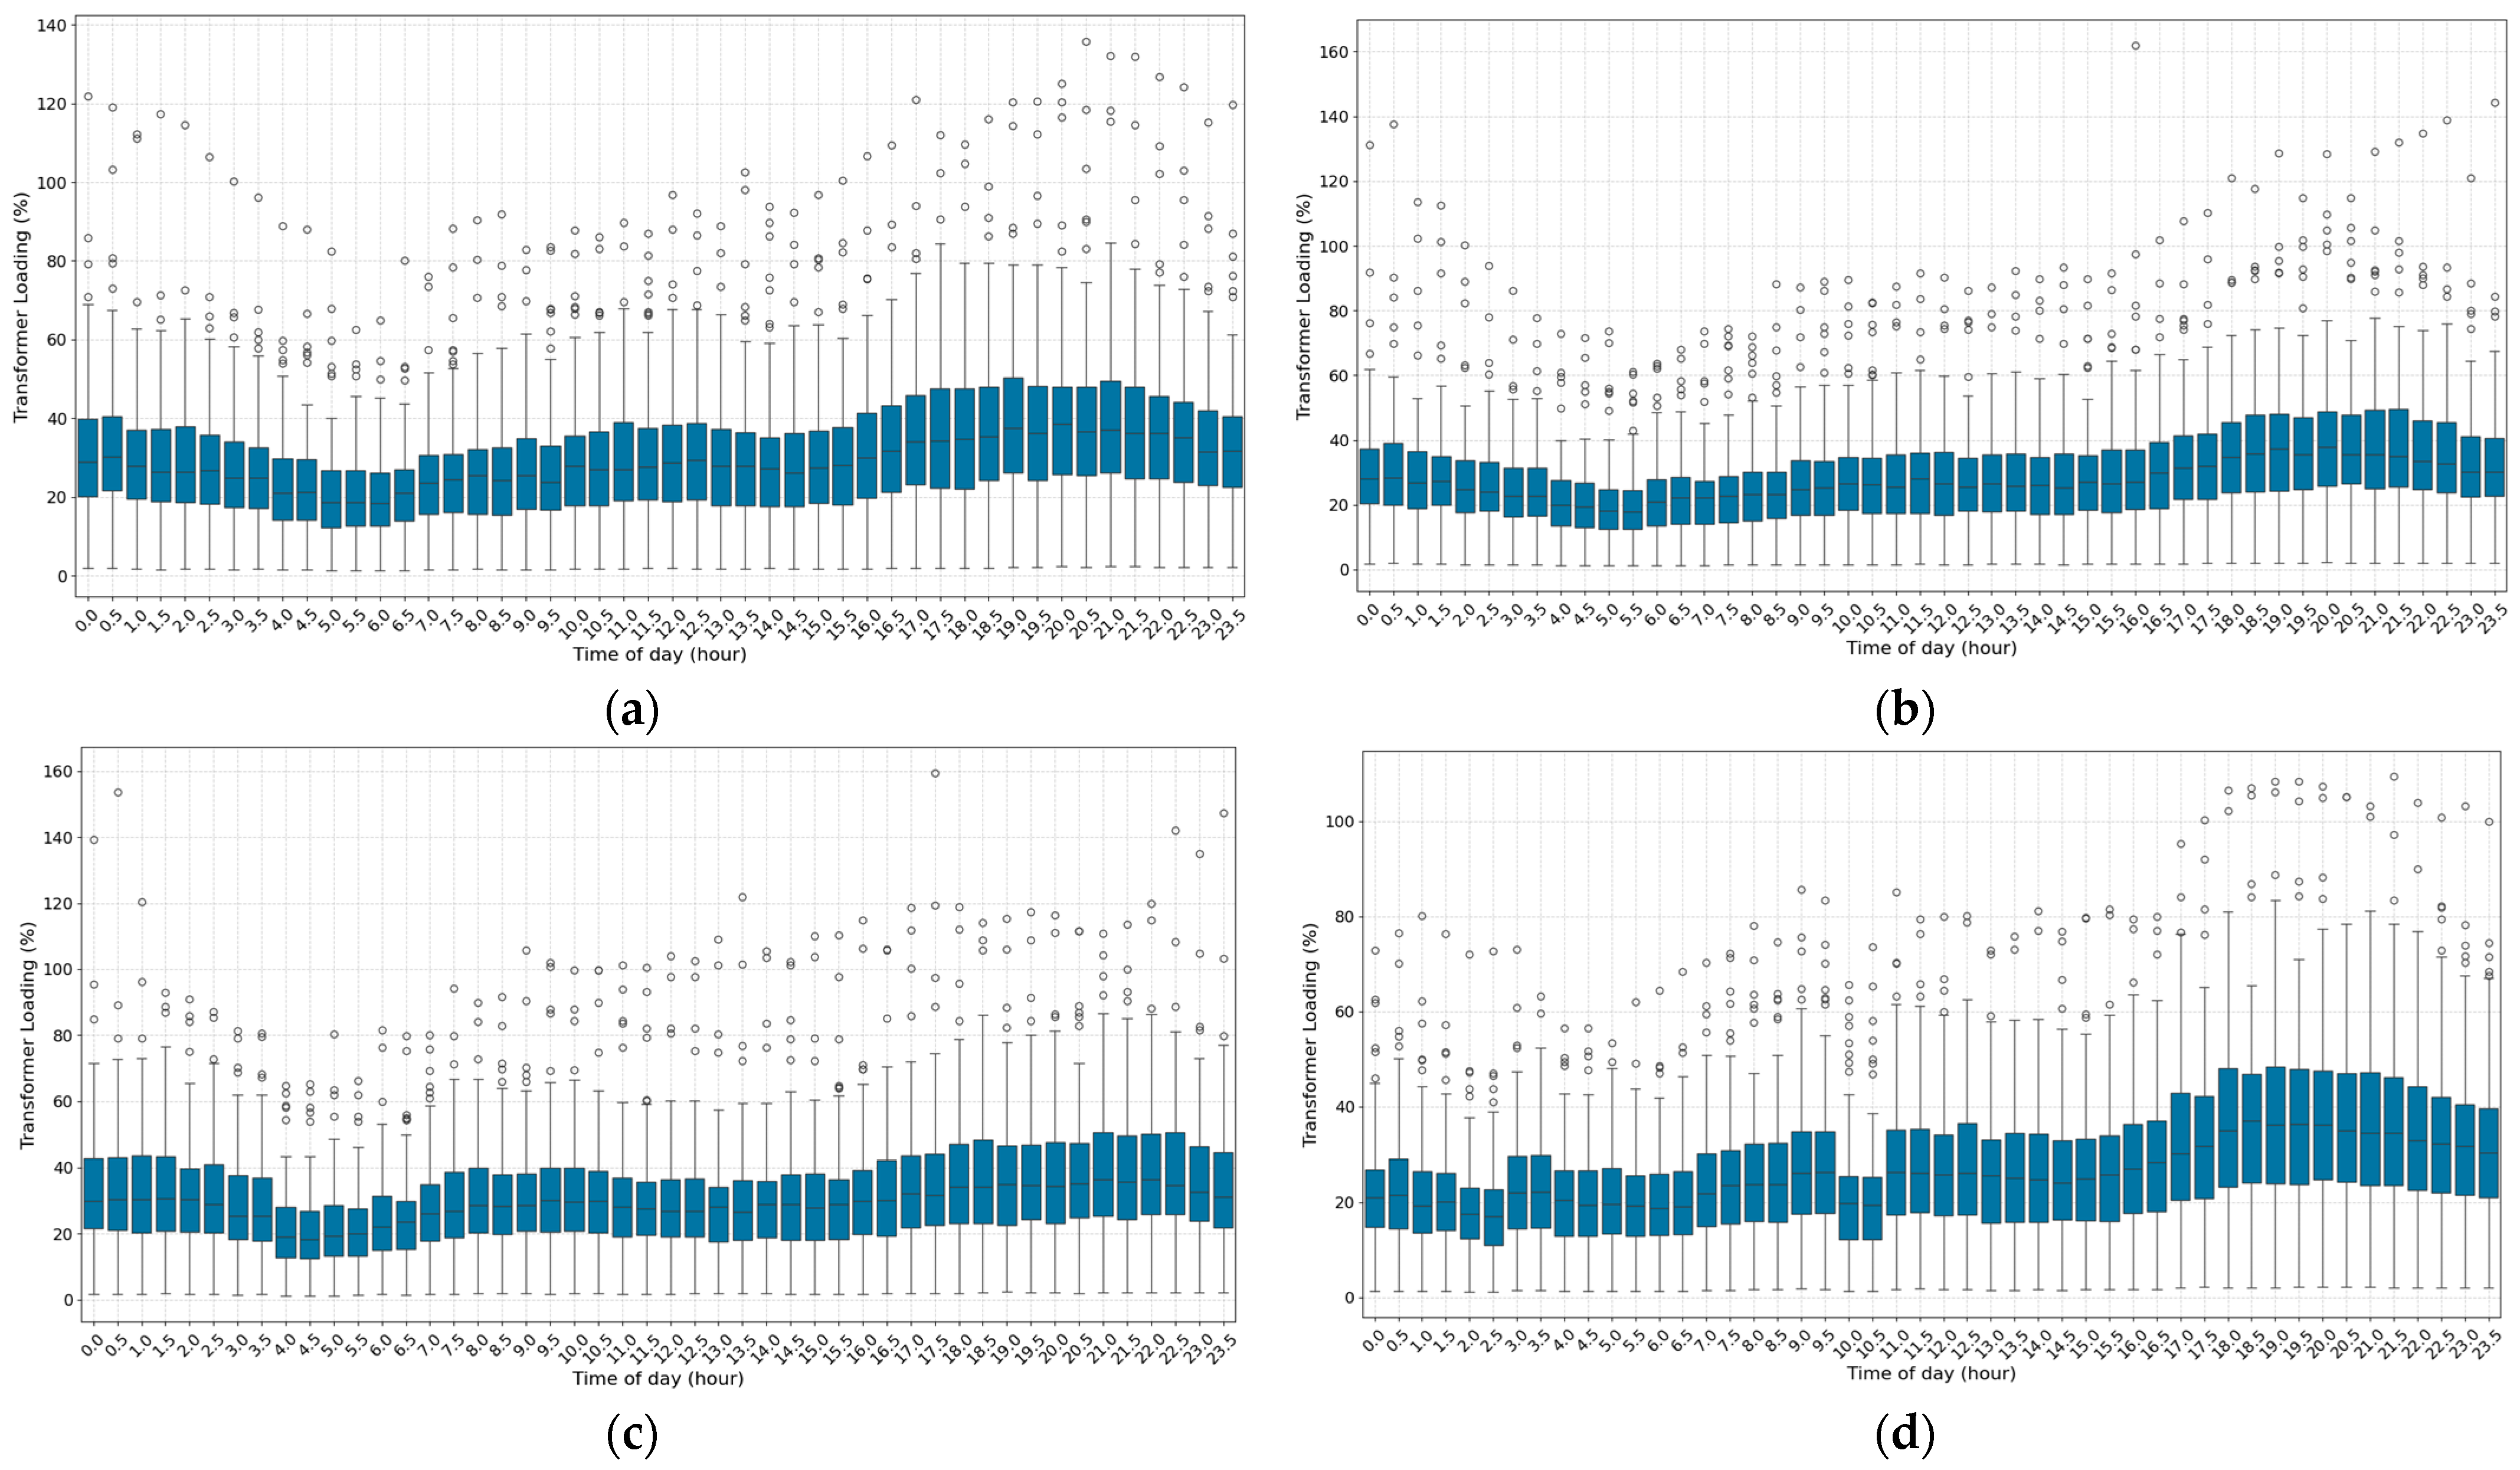
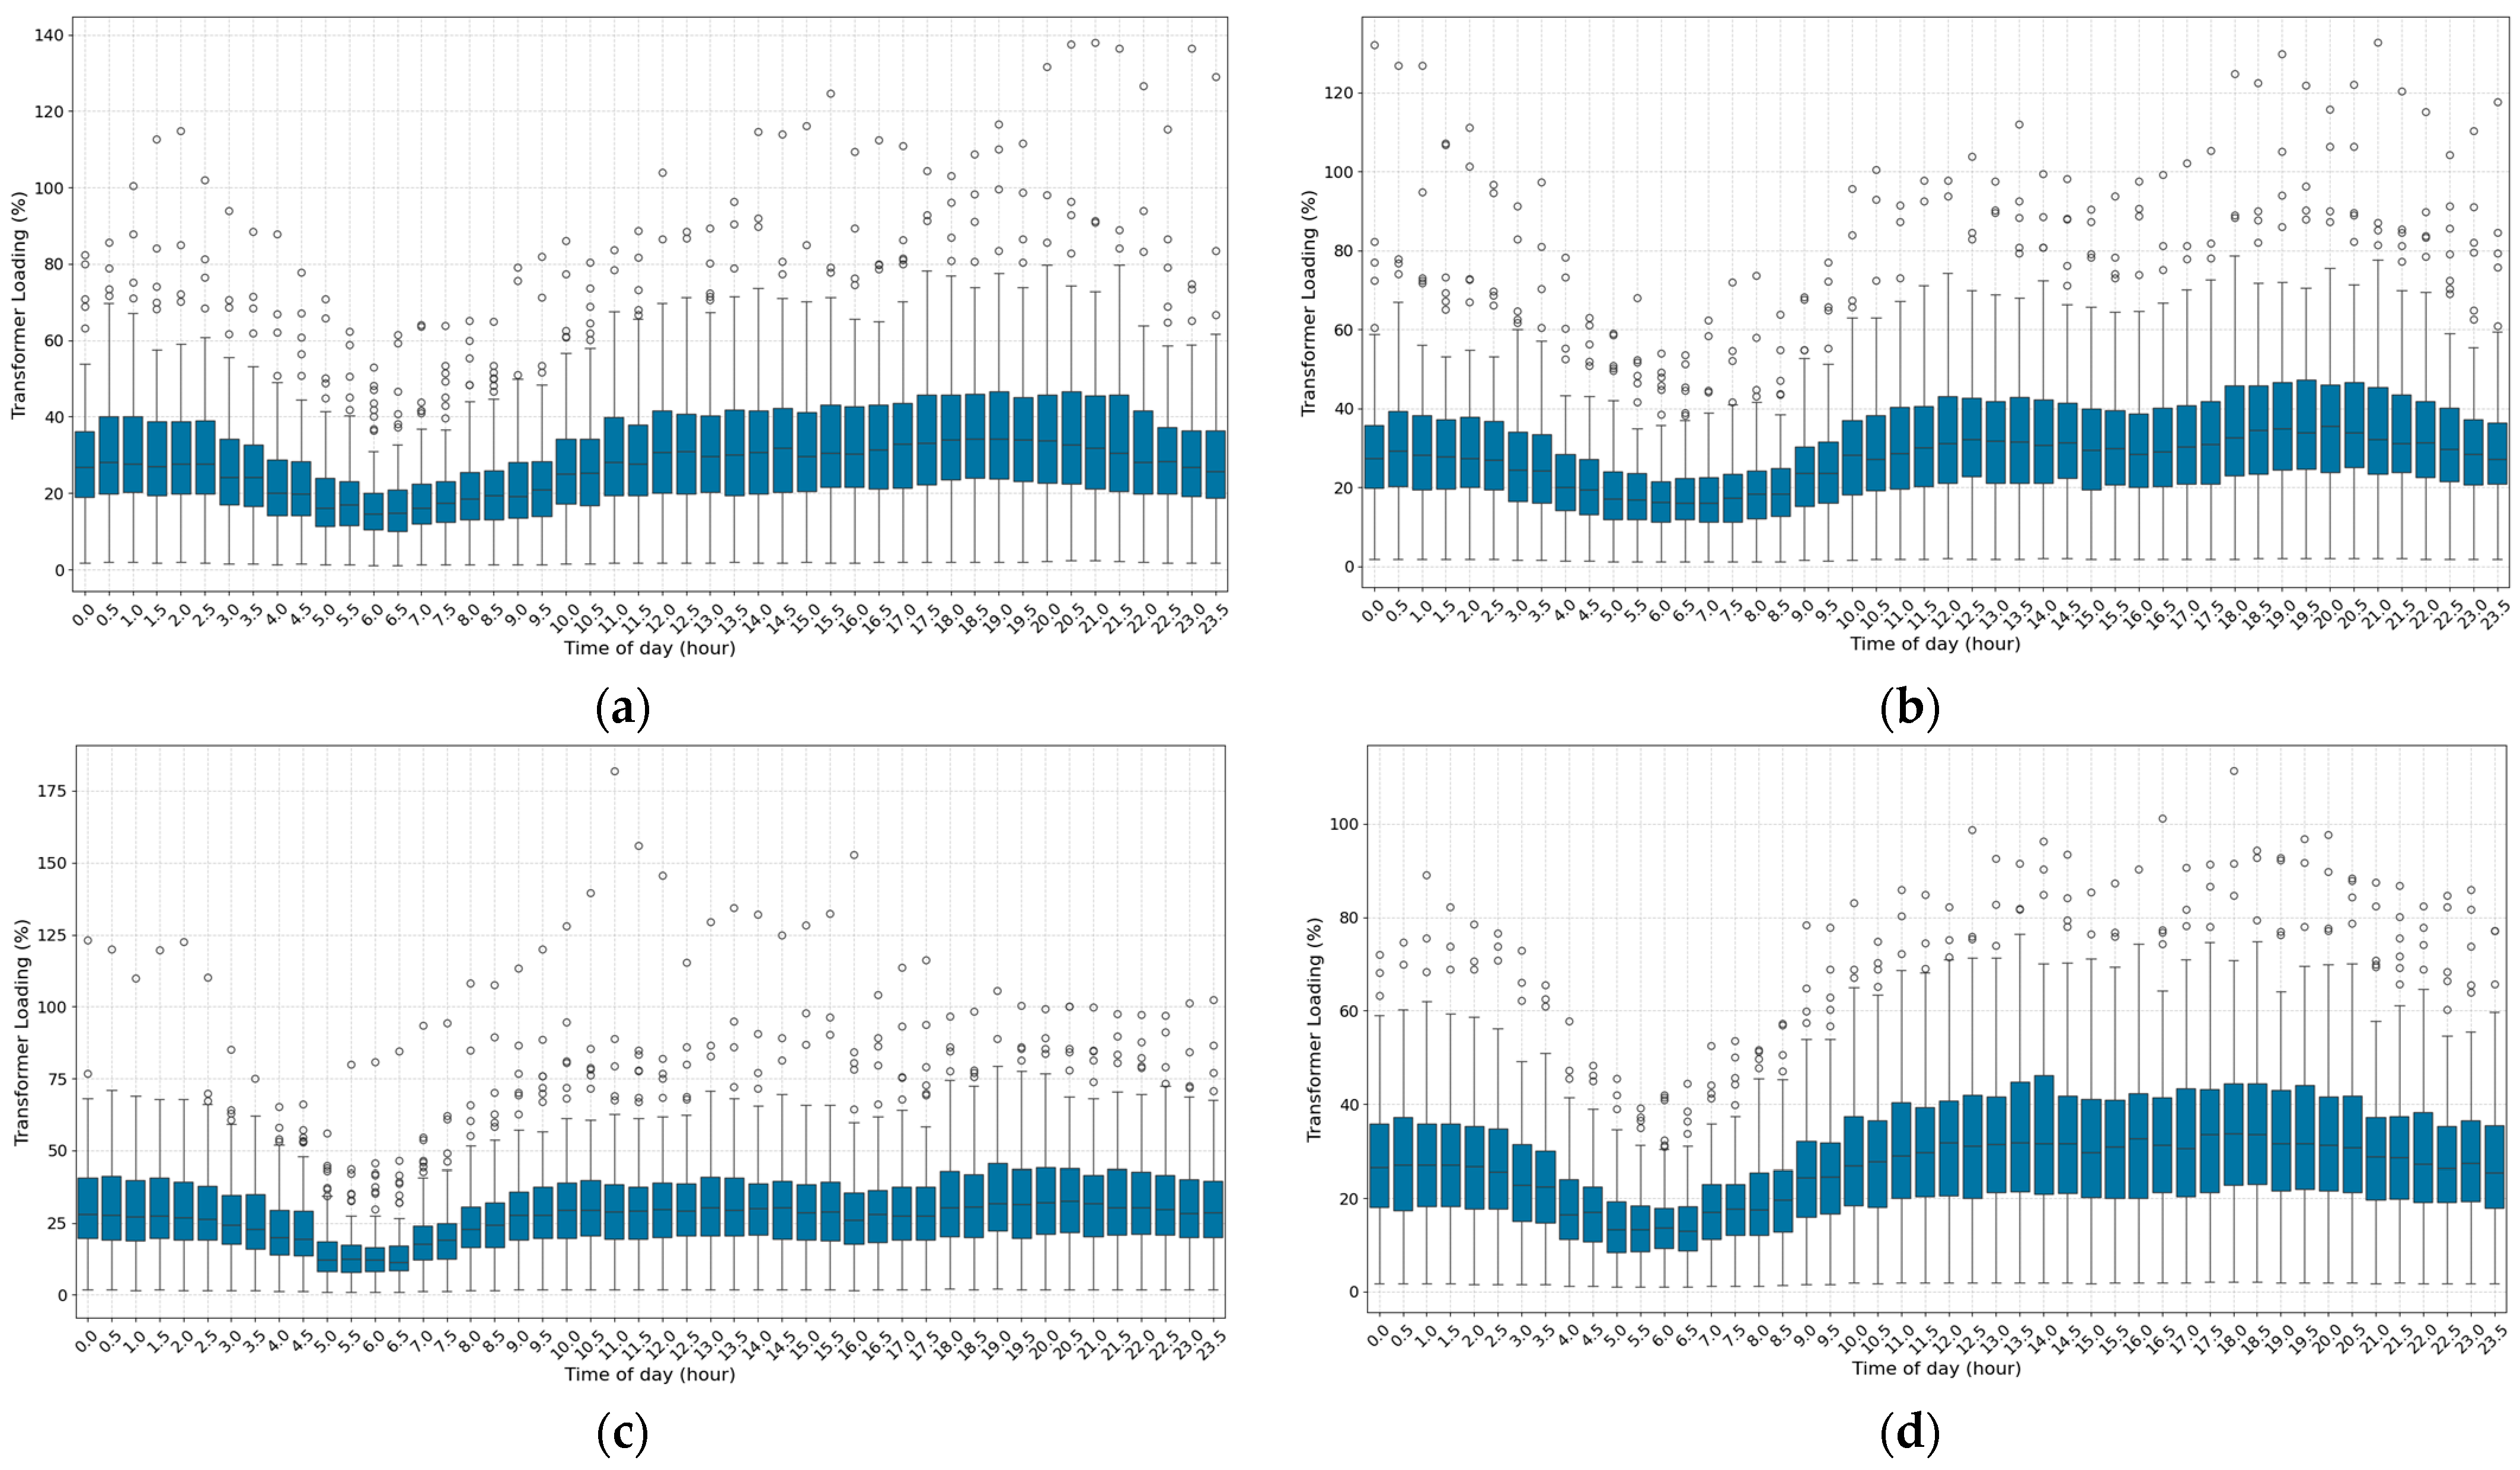
| 1 | Most transformer loadings and bus voltages remain within statutory limits. A few transformers show outliers exceeding 90% loading. | Base case (domestic load only) and current EV (14.05%) + HP (1%) penetration | Reinforcement is not immediately required, but localised upgrades may be necessary. |
| 2 | Voltage violations are rare and limited to a few marginal cases (~0.94 pu), mainly during peak winter and summer hours. | Existing EV and HP penetration | On-load tap changers (OLTCs) maintain voltage stability under current conditions. |
| 3 | Transformer loading increases by 20–40% with current EV and HP integration, especially during evening peaks. | Existing EV and HP penetration | Indicates growing stress on assets; long-term asset management should anticipate these increases. |
| 4 | Holiday load profiles show flatter peaks compared to working days, with reduced peak transformer loadings. | All scenarios | Suggests opportunity for load balancing and flexibility through targeted demand management. |
| 5 | Distribution transformers near their limits even under base case when coincident peak occurs. | Base case (no EV/HP) | Diversity assumptions help, but some transformers may be under-dimensioned for future loads. |
Disclaimer/Publisher’s Note: The statements, opinions and data contained in all publications are solely those of the individual author(s) and contributor(s) and not of MDPI and/or the editor(s). MDPI and/or the editor(s) disclaim responsibility for any injury to people or property resulting from any ideas, methods, instructions or products referred to in the content. |
© 2025 by the authors. Licensee MDPI, Basel, Switzerland. This article is an open access article distributed under the terms and conditions of the Creative Commons Attribution (CC BY) license (https://creativecommons.org/licenses/by/4.0/).
Share and Cite
Tun, T.P.; Ceylan, O.; Pisica, I. A Real-World Case Study Towards Net Zero: EV Charger and Heat Pump Integration in End-User Residential Distribution Networks. Energies 2025, 18, 2510. https://doi.org/10.3390/en18102510
Tun TP, Ceylan O, Pisica I. A Real-World Case Study Towards Net Zero: EV Charger and Heat Pump Integration in End-User Residential Distribution Networks. Energies. 2025; 18(10):2510. https://doi.org/10.3390/en18102510
Chicago/Turabian StyleTun, Thet Paing, Oguzhan Ceylan, and Ioana Pisica. 2025. "A Real-World Case Study Towards Net Zero: EV Charger and Heat Pump Integration in End-User Residential Distribution Networks" Energies 18, no. 10: 2510. https://doi.org/10.3390/en18102510
APA StyleTun, T. P., Ceylan, O., & Pisica, I. (2025). A Real-World Case Study Towards Net Zero: EV Charger and Heat Pump Integration in End-User Residential Distribution Networks. Energies, 18(10), 2510. https://doi.org/10.3390/en18102510