Article

Integrated Assessment of Rooftop Photovoltaic Systems and Carbon Footprint for Organization: A Case Study of an Educational Facility in Thailand

by
Nattapon Leeabai
1,
Natthakarn Sakaraphantip
2,
Neeraphat Kunbuala
3,
Kamonchanok Roongrueng
4 and
Methawee Nukunudompanich
3,5,*
1
Department of Environmental Engineering, Faculty of Engineering, Kasetsart University, Chatuchak, Bangkok 10900, Thailand
2
CES Solar Cells Testing Center (CSSC), Pilot Plant Development and Training Institute (PDTI), King Mongkut’s University of Technology Thonburi (KMUTT), Thung Khru, Bangkok 10140, Thailand
3
Department of Industrial Engineering, School of Engineering, King Mongkut’s Institute of Technology Ladkrabang, Lat Krabang, Bangkok 10520, Thailand
4
Green Technology Research Co., Ltd. (GTR), Dindaeng, Bangkok 10400, Thailand
5
Department of Mechanical Engineering (Energy Engineering Program), School of Engineering, King Mongkut’s Institute of Technology Ladkrabang, Lat Krabang, Bangkok 10520, Thailand
*
Author to whom correspondence should be addressed.
Energies 2025, 18(10), 2485; https://doi.org/10.3390/en18102485
Submission received: 8 April 2025 / Revised: 2 May 2025 / Accepted: 7 May 2025 / Published: 12 May 2025
(This article belongs to the Section B: Energy and Environment)

Abstract

:
This study presents an integrated methodology to assess and reduce greenhouse gas (GHG) emissions in institutional buildings by combining organizational carbon footprint (CFO) analysis with rooftop photovoltaic (PV) system simulation. The HM Building at King Mongkut’s Institute of Technology Ladkrabang (KMITL), Thailand, was selected as a case study to evaluate carbon emissions and the feasibility of solar-based mitigation strategies. The CFO assessment, conducted in accordance with ISO 14064-1:2018 and the Thailand Greenhouse Gas Management Organization (TGO) guidelines, identified total emissions of 1841.04 tCO2e/year, with Scope 2 electricity-related emissions accounting for 442.00 tCO2e/year. Appliance-level audits revealed that classroom activities represent 36.7% of the building’s electricity demand. These findings were validated using utility data totaling 850,000 kWh/year. A rooftop PV system with a capacity of 207 kWp was simulated using PVsyst software (version 7.1), incorporating site-specific solar irradiance and technical loss parameters. Monocrystalline modules produced the highest energy output of 292,000 kWh/year, capable of offsetting 151.84 tCO2e/year, equivalent to 34.4% of Scope 2 emissions. Economic evaluation indicated a 7.4-year payback period, with a net present value (NPV) of THB 12.49 million and an internal rate of return (IRR) of 12.79%. The integration of verified CFO data with empirical load modeling and derated PV performance projections provides a robust, scalable framework for institutional carbon mitigation. This approach supports data-driven Net Zero campus planning aligned with Thailand’s Nationally Determined Contributions (NDCs) and carbon neutrality policies.

1. Introduction

Thailand is currently advancing its national commitment toward carbon neutrality by 2050, as outlined in the updated National Energy Plan [1]. This strategic roadmap includes a substantial expansion of renewable energy sources, particularly solar power, with installed solar capacity targeted to grow from 5149 MW to 7087 MW by 2030. These developments align with national greenhouse gas (GHG) mitigation goals to reduce emissions to 41 million metric tons of CO2 equivalent (CO2e) by 2050 [2]. To meet these ambitious targets, emission reduction must occur across all energy-intensive sectors—particularly in buildings, transportation, and industry.
In Thailand, the transition to renewable energy, particularly solar photovoltaic (PV) systems, is hindered by a combination of infrastructural, economic, and policy-related challenges [3,4]. Despite the country’s abundant solar resources, the adoption of PV technology is impeded by high initial capital costs, limited infrastructure development, and regulatory hurdles [4]. The existing power grid infrastructure, primarily designed for centralized fossil fuel-based generation, lacks the capacity to efficiently integrate decentralized solar energy systems, leading to inefficiencies and potential energy loss. Additionally, while the Thai government has set ambitious renewable energy targets, including a goal of having 30% of energy production come from renewable sources by 2036 [5], the implementation of supportive policies and incentives has been inconsistent, often characterized by bureaucratic delays and fragmented frameworks. These systemic barriers underscore the importance of contextualizing technical solutions within the socio-political landscape to effectively address the climate crisis in Thailand.
Among these, the building sector holds significant potential for GHG mitigation, given its high energy consumption and growing urban footprint. In particular, academic institutions represent a unique opportunity: they house large populations, operate energy-intensive infrastructure, and serve as models for sustainable practice [6]. Many university buildings in Thailand and other developing countries exhibit high electricity usage, with Scope 2 emissions from grid electricity often accounting for over 70% of their total organizational GHG emissions [7,8,9,10,11]. Studies of Thai university campuses confirm that electricity demand dominates institutional carbon profiles, surpassing emissions from direct fuel use, commuting, or procurement [12,13].
To guide such efforts effectively, institutions must first understand where their emissions originate. Conducting the carbon footprint for organization (CFO) assessment provides a standardized and certified methodology to quantify emissions across Scope 1 (direct), Scope 2 (purchased electricity), and Scope 3 (indirect, value chain) sources [6,11]. In Thailand, the CFO approach developed by the Thailand Greenhouse Gas Management Organization (TGO) ensures compliance with international standards such as ISO 14064 and the GHG Protocol [2,11]. By identifying major emission hotspots, CFO assessments enable institutions to prioritize interventions, monitor progress, and prepare for participation in emerging carbon trading or reporting mechanisms. In higher education, where electricity consumption dominates emissions profiles, CFOs play a vital role in linking strategic energy investments with measurable environmental outcomes [12,13].
Among the renewable energy technologies available, rooftop solar photovoltaic (PV) systems offer a particularly suitable solution for academic buildings. Compared to wind, biomass, or geothermal options—which may require large land areas, complex logistics, or site-specific geological conditions—rooftop PV systems are modular, space-efficient, and cost-competitive [3,14,15]. The levelized cost of electricity (LCOE) for commercial rooftop PV has declined to as low as 0.06–0.08 USD/kWh, making it a viable alternative to grid electricity [16]. Furthermore, rooftop solar systems align well with university load profiles, which typically peak during daytime hours. Their compatibility with existing infrastructure and direct impact on Scope 2 emissions make them a strategic choice for carbon reduction in institutional contexts.
This study integrates both a comprehensive CFO assessment and the design of a rooftop PV system for the HM Building at King Mongkut’s Institute of Technology Ladkrabang (KMITL). The first objective is to quantify the building’s total GHG emissions across Scopes 1, 2, and selected Scope 3 categories in accordance with TGO reporting standards. The second objective is to simulate a rooftop solar PV system using PVsyst software and evaluate its carbon offset potential relative to the building’s annual verified footprint. By combining technical performance modeling with organizational emissions accounting, this study provides a data-driven framework for institutional decarbonization.

2. Methodology

This study applies a two-fold methodological approach: (1) assessing the carbon footprint of the HM Building using Thailand’s national CFO framework, and (2) designing and simulating rooftop photovoltaic (PV) systems using PVsyst software to evaluate environmental and financial performance. This integrated method enables a comprehensive understanding of the potential for emission reductions through renewable energy implementation at the institutional level.

2.1. Organizational Carbon Footprint (CFO) Assessment

2.1.1. System Boundary and Scope

The organizational carbon footprint assessment was performed for the HM Building, an academic facility comprising eight floors and a total area of 3817 m2 at King Mongkut’s Institute of Technology Ladkrabang (KMITL). The reporting period spans from January to December 2024. The system boundary follows the operational control approach, as defined by the Thailand Greenhouse Gas Management Organization (TGO) [2], and is consistent with the Greenhouse Gas Protocol [6] and ISO 14064-1:2018 [7]. Emissions were categorized into three scopes as shown in Table 1. Scope 3 assessment (Table S3) included scoring and five remaining categories: purchased goods and services, capital goods, waste (Figure S5), student commuting (Table S4 and Figure S4), and leased assets. Procurement and financial records informed the estimation of purchased and capital goods using spend-based TGO emission factors. Waste emissions were calculated from institutional audit data, applying TGO factors for landfill. Student commuting data were sourced from the university’s annual transportation survey, including travel mode and frequency, with distances estimated from anonymized postal codes. Emission factors for transport were drawn from TGO (2022), with assumptions on trip frequency and vehicle occupancy. Leased asset emissions were based on reported energy consumption.

2.1.2. Data Collection and GHG Calculation

Activity data were collected from building operations records, energy bills, procurement logs, and transport surveys. GHG emissions were calculated using the following equation:
G H G C O 2 e = A c t i v i t y   D a t a × E m i s s i o n   F a c t o r × G l o b a l   W a r m i n g   P o t e n t i a l
Emission factors were sourced from TGO’s national CFO emission database (2023), and GWP values from IPCC AR5. Results were expressed in metric tons of CO2 equivalent (tCO2e) and categorized by emission scope and source [2,17].

2.2. PV System Design in Relation to CFO

Given that Scope 2 emissions from purchased electricity dominate the HM Building’s carbon profile, the design of the rooftop solar PV system specifically targets this source. Three PV module types were selected for simulation:
  • Monocrystalline (Longi LR5-72HIBD-545M G2);
  • Polycrystalline (JA Solar JAP72-S10-345-SC);
  • Thin-film (Solibo CIGS SL2-150 G2.3+).
Each was paired with the same inverter: Huawei SUN2000-100KTL-M1-480Vac (Huawei, Shenzhen, China). The total available roof space of approximately 1000 m2 was used as a constraint in system sizing as seen in Figure 1.

2.3. Simulation Setup Using PVsyst

To accurately simulate the energy generation potential of a rooftop PV system for the HM Building, solar irradiance data specific to the Ladkrabang area were used. This site-specific resource assessment ensures realistic modeling that aligns with the actual geographic and climatic conditions. Table 2 presents the monthly global horizontal irradiance (GlobHor), incident irradiation on tilted surfaces (GlobInc), and average ambient temperatures (T-Amb), which serve as primary inputs for PVsyst simulations.

2.3.1. Load Profile

The HM Building’s electricity demand profile was compiled by surveying its major electrical appliances across typical usage scenarios [18]. Power ratings and operational hours were gathered either from appliance labels or product datasheets. Daily and monthly load profiles were developed to identify peak consumption periods and to inform system sizing in PVsyst.
Energy consumption (in kWh/day) was calculated using the following standard formula:
E n e r g y k W h = W a t t a g e   ( W ) × U s a g e   h o u r s   ( h ) 1000
While granular appliance-level calculations were conducted, the simulation was ultimately calibrated to match the annual verified consumption of 850,000 kWh, ensuring consistency with the organizational carbon footprint report. This makes the system simulation directly relevant to GHG emissions reduction planning.

2.3.2. Project Design by PVsyst

The project begins by selecting the geographical location for the PV system based on the latitude and longitude. This ensures that the system design is tailored to the specific solar irradiance and climatic conditions of the chosen area [19,20]. The input data for the PVsyst program typically include the following key parameters to ensure accurate simulation and analysis.
(1)
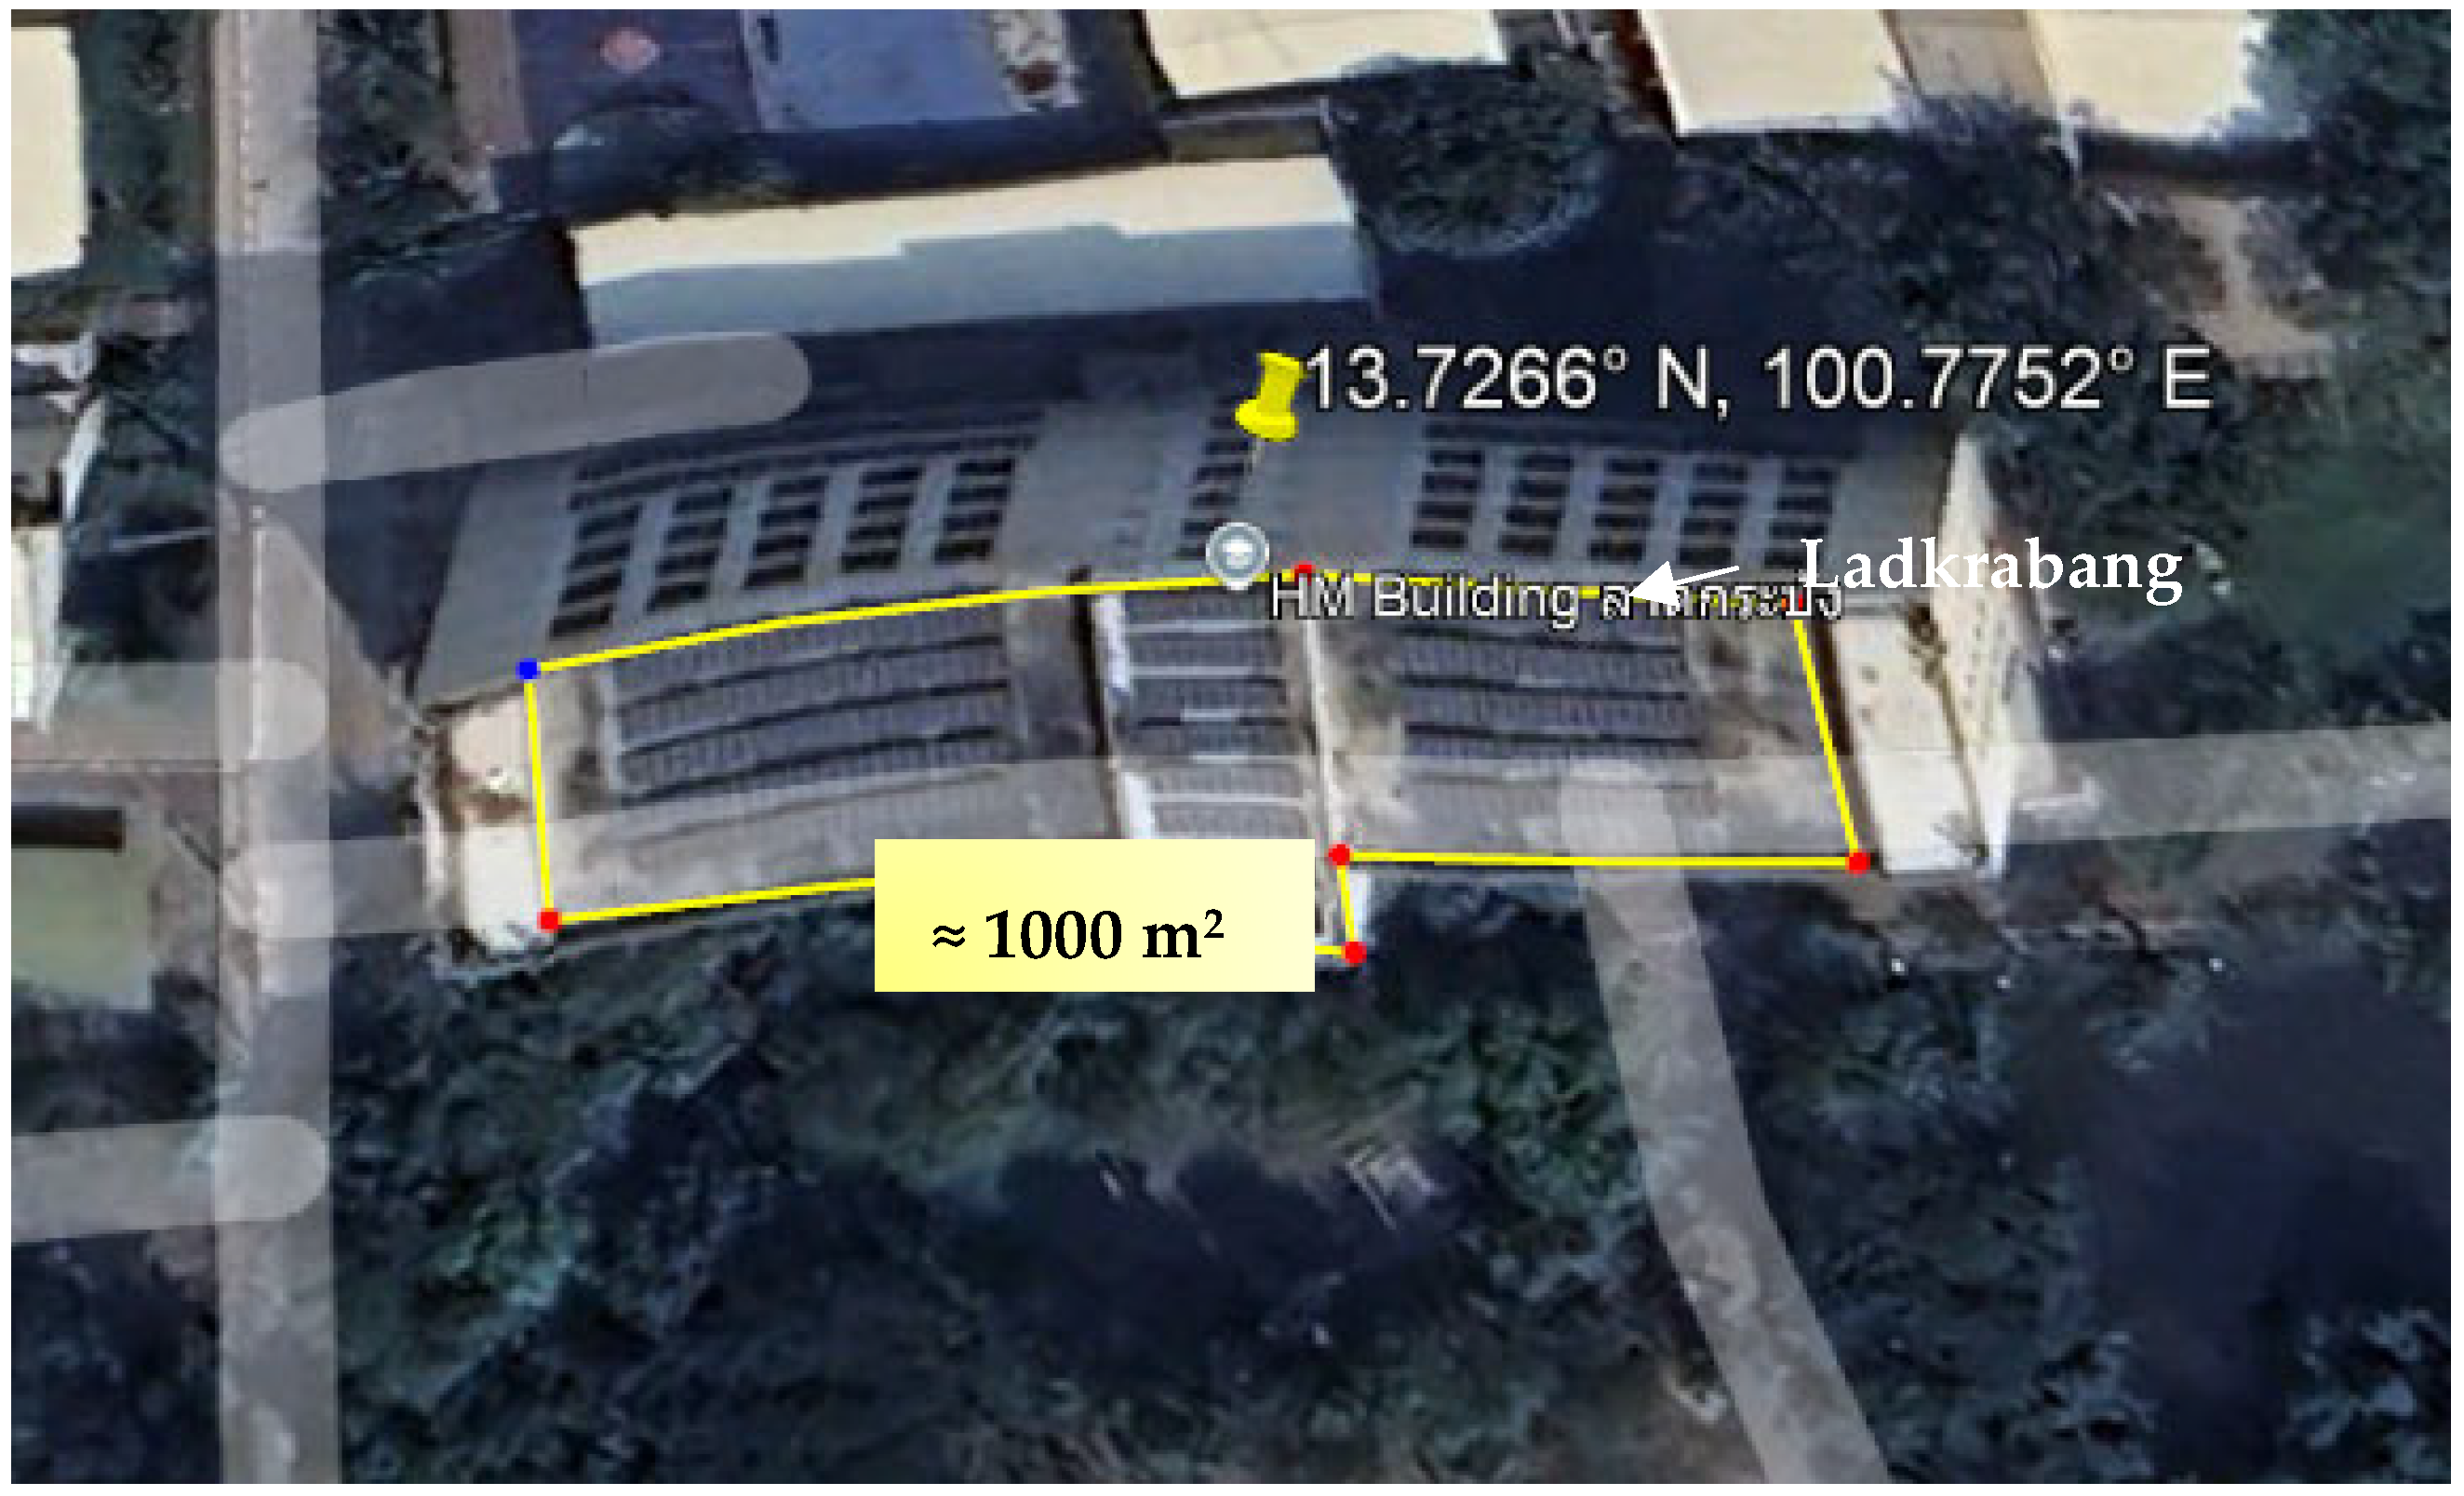
Location data: such as geographic coordinates (13.7266° N, 100.7752° E), local climate data (solar irradiance, temperature, humidity, etc.), time zone and altitude.
(2)
Equipment specifications: such as PV modules and inverter as described in Section 2.2.
(3)
Dimensions and area required for installation: the average roof area of HM is 1000 m2 from Google map.
(4)
System configuration: daily or seasonal load profile of the building (energy consumption in kWh) in Section 2.1, solar rooftop on-grid setup, panel tilt angle of 15 degrees and oriented towards the south to capture the maximum amount of sunlight [21].

2.3.3. System Simulation

The different types of photovoltaic (PV) modules are simulated to determine their performance within the proposed project design. This study considers three different types of PV modules.
-
Case 1: Monocrystalline (high efficiency, higher cost).
-
Case 2: Polycrystalline (moderate efficiency and cost).
-
Case 3: Thin-film (lower efficiency, large area required).
PVsyst simulations included loss factors such as shading, temperature, wiring, mismatch, and inverter conversion. The annual energy output from each system was then used to estimate the corresponding CO2 offset, applying Thailand’s national grid emission factor of 0.52 kg CO2e/kWh. The comparative analysis of the results from three types of panels are shown in Table 3.

2.4. System Analysis and Comparison

The system study examines three key components: photovoltaic performance, which assesses energy output and efficiency; economic viability, evaluating costs, payback duration, and financial returns; and carbon dioxide reduction, quantifying the environmental impact through decreased carbon emissions. Three photovoltaic technologies—monocrystalline (Case 1), polycrystalline (Case 2), and thin-film (Case 3)—were evaluated to ascertain the optimal choice based on efficiency, cost-effectiveness, and environmental advantages. The economic evaluation was conducted based on local market quotations and supported by benchmark reports from the Thailand Energy Regulatory Commission [22] and the International Renewable Energy Agency [23]. An electricity tariff of 4.72 THB/kWh was assumed, along with an operation and maintenance (O&M) cost of 1.5% of the initial investment annually. A system lifetime of 25 years was considered with minimal degradation, and a discount rate of 5% was applied for financial calculations. These assumptions enabled the computation of key financial indicators, including payback period, net present value (NPV), internal rate of return (IRR), and return on investment (ROI). Relevant equations used for these assessments are summarized in Table 4 (provided below). This integrated methodology facilitates the selection of the most appropriate solar PV system for the HM Building project.

3. Result

3.1. Carbon Footprint of the HM Building

The carbon footprint of the HM Building was assessed following TGO’s CFO Guideline (Version 03: 2019), consistent with ISO 14064-1:2018 and the Greenhouse Gas Protocol. The reporting boundary encompassed all operational activities from 1 January to 31 December 2024. Emissions were categorized into Scope 1 (direct), Scope 2 (indirect from electricity), and Scope 3 (indirect from the value chain). This assessment provides a quantitative baseline to evaluate the effectiveness of proposed renewable energy interventions, particularly rooftop photovoltaic (PV) systems.
Scope 1 emissions were attributed primarily to methane (CH4) released from restroom wastewater, amounting to 3477.73 kg CH4 per year. Using the Global Warming Potential (GWP) value of 25 from the IPCC Fifth Assessment Report (AR5), this equates to 86.94 tCO2e. Refrigerant leakage from systems using R-22, R-32, and R-410A was negligible, with no refrigerant replacement occurring during the reporting year. As such, direct emissions accounted for only a small portion of the building’s overall footprint and were classified as low in materiality.
Scope 2 emissions were derived from electricity consumption, which was verified through utility records from the Provincial Electricity Authority (PEA). The building consumed 850,000 kWh over the reporting year. Applying Thailand’s official grid emission factor of 0.52 kg CO2e/kWh (TGO, 2023), this results in 442 tCO2e. Scope 2 emissions accounted for more than 90% of the emissions within the institution’s operational control, and approximately 24% of the building’s total carbon footprint. Given the scale and manageability of these emissions, they are identified as the primary target for carbon mitigation strategies.
Scope 3 emissions were included based on materiality screening using TGO’s thresholds. Student commuting was the dominant contributor at 1182.13 tCO2e/year, reflecting the high number of enrolled students and private vehicle use. Additional contributions included waste disposal (85.43 tCO2e/year), leased asset electricity use (37.5 tCO2e/year), and water consumption (7.04 tCO2e/year). Although Scope 3 emissions collectively accounted for 71.3% of the total carbon footprint (1312.10 tCO2e), they are largely outside the direct control of the building operator and thus fall outside the scope of this study’s technical mitigation strategy. The total emissions from all scopes amounted to 1841.04 tCO2e/year. Table 5 summarizes the breakdown by category. This profile clearly positions Scope 2 emissions—electricity use—as both the most significant and most actionable category for reduction, supporting the subsequent analysis and design of rooftop PV systems.
The magnitude of Scope 2 emissions underscores the importance of deploying on-site renewable energy systems. The proposed monocrystalline PV system, generating 292,000 kWh annually, could reduce emissions by approximately 151.84 tCO2e/year—offsetting 34.4% of Scope 2 emissions and 8.2% of the building’s total organizational emissions. This reinforces the strategic value of targeting electricity-related emissions as a pathway to institutional decarbonization and compliance with Thailand’s long-term climate goals.
The CFO results demonstrate that purchased electricity (Scope 2) constitutes the dominant emission source for the HM Building. In alignment with Thailand’s Net Zero policies and CFO framework, priority is given to reducing Scope 1 and Scope 2 emissions as the first step, while Scope 3 reductions are currently voluntary but expected to become mandatory in the near future. Accordingly, subsequent renewable energy interventions, particularly rooftop PV system deployment, are targeted at mitigating these electricity-related emissions.

3.2. Energy Use in HM Building

Based on the data collected from electrical appliances, the energy consumption in the HM Building was calculated using standard load formulas (Table 6). Room-wise segmentation was used to estimate energy use per day, which was then extrapolated across 40 lecture rooms based on daily operation schedules (Table 7). This approach yielded an estimated total of 1299.2 kWh/day for classroom areas alone, with the highest daily loads observed on Mondays, Tuesdays, and Thursdays, reaching up to 650 kWh/day (Figure 2). These peaks correlate with intensive classroom use for educational activities, while weekends—particularly Sundays—showed the lowest consumption, around 150 kWh/day, due to reduced occupancy. Notably, this pattern aligns with the KMITL academic calendar during the 2024 academic year, which includes semester breaks that affect daily and weekly consumption levels.
Figure 2a presents the estimated daily peak energy demand patterns alongside (b) the verified monthly electricity consumption for the HM Building in 2024. The analysis in Table 6 and Table 7, which focuses on lecture rooms, highlights their critical role in driving weekday peak loads, owing to their predictable operational schedules and standardized electrical equipment. In contrast, laboratories, offices, hallways, and IT systems contribute to a relatively stable baseload throughout the week. Notably, all laboratory spaces primarily utilize standard plug-in electrical equipment, without reliance on heavy industrial machinery, thereby maintaining consistent energy patterns across different functional zones.
Although detailed sub-zoning data are unavailable, the HM Building operates under a dedicated sub-meter, guaranteeing that the PEA billing records (850,000 kWh/year) accurately represent the building’s total consumption. This provides a robust empirical foundation for the energy load estimation and CFO validation. Furthermore, annual usage patterns remain stable across academic years, due to the consistent semester calendar and facility utilization, supporting the comparability of 2023 and 2024 profiles for photovoltaic system design and emissions mitigation planning. Based on the established load profiles and verified consumption data, a rooftop photovoltaic (PV) system was subsequently designed to optimize energy self-generation and reduce Scope 2 emissions for the HM Building.

3.3. PV System Design and Emissions Offset

To address the HM Building’s high Scope 2 emissions, a rooftop photovoltaic (PV) system was designed to operate as an on-grid installation. The system layout was constrained by the available roof area of 1000 m2, and performance simulations were conducted using PVsyst software to evaluate the behavior of three PV technologies under local solar and environmental conditions. The technologies analyzed—monocrystalline, polycrystalline, and thin-film—were selected based on their relevance to the Thai PV market and varying cost–performance characteristics.
Each system was configured with a target installed capacity of 207 kWp, adhering to spatial constraints and optimizing sun exposure with a 15° south-facing tilt. PVsyst simulations incorporated detailed loss mechanisms including irradiance, temperature derating, mismatch, shading, inverter inefficiency, and wiring losses, to ensure realistic performance projections. This methodology aligns with best practices for solar system design in humid tropical zones, where oversimplified models can significantly overstate energy output and economic viability. The simulation results showed that the monocrystalline system achieved the highest annual output at 292,000 kWh, followed by polycrystalline (239,000 kWh) and thin-film (233,000 kWh). Using Thailand’s official grid emission factor of 0.52 kg CO2e/kWh, these systems would offset 151.84, 124.28, and 121.16 tCO2e/year, respectively—substantially reducing Scope 2 emissions as recorded in the building’s carbon footprint report.
As illustrated in Figure 3, there is a measurable reduction between ideal and actual system performance due to cumulative system losses. For example, the monocrystalline system’s nominal output of 320,000 kWh/year decreased to 292,000 kWh/year, revealing a total derating of approximately 8.75%. These findings reinforce the importance of loss-adjusted simulations in tropical design contexts, where high ambient temperatures, cloud intermittency, and non-uniform irradiance significantly influence system behavior [24,25].
From a cost–benefit perspective, polycrystalline modules deliver the highest financial performance among the three technologies. With the lowest total installation cost (THB 3.57 million), this system offers the shortest payback period (5.6 years), the highest internal rate of return (IRR) at 17.57%, and a return on investment (ROI) of 343.4%. Despite producing less energy annually than monocrystalline modules, its affordability makes it a highly attractive option for projects with constrained budgets. In contrast, the monocrystalline system achieves the highest energy yield (292,000 kWh/year) and carbon offset (151.84 tCO2e/year), with a strong ROI of 263.1% and a moderate payback period of 6.8 years. Importantly, monocrystalline panels also offer the highest energy density, making them the most suitable solution for rooftops with limited space—such as the HM Building’s 1000 m2 roof area. Thin-film modules, while performing well under certain conditions, require significantly more surface area and carry the highest installation cost (THB 6.48 million), with the lowest ROI and longest payback period (10.7 years), limiting their feasibility in spatially constrained applications. Therefore, when both financial return and space optimization are considered, monocrystalline systems represent the most balanced and strategic choice.
From an environmental standpoint (Table 8), monocrystalline panels provide the greatest emissions reduction—offsetting over one-third (34.4%) of the building’s total Scope 2 emissions, verified at 442 tCO2/year from CFO reporting. Financially, however, the polycrystalline system demonstrated superior investment metrics with the shortest payback period (5.6 years) and highest ROI (343.4%), making it the most attractive choice under budget-sensitive constraints. ROI is a key measure of the economic viability of solar PV systems, calculated as the financial savings over the system’s lifespan relative to the initial costs. A higher ROI reflects a more attractive investment and is influenced by factors such as electricity rates, solar potential, government incentives, and system performance. Thin-film modules delivered a high-performance ratio (85.5%), yet their larger area requirements and lower output density limit their practicality for space-constrained rooftops like that of the HM Building.
The findings present a robust case for the deployment of rooftop photovoltaic (PV) systems as a targeted strategy for mitigating emissions, specifically tailored to the carbon profile of the HM Building. The integration of real operational data—from PEA billing records, CFO Scope 2 accounting, and appliance-level load profiling—sets this study apart from previous works that rely solely on theoretical system capacity or default irradiance assumptions. By correlating simulated PV generation with verified electricity consumption, particularly during daytime lecture room operation (Section 3.2), the system is optimized not only for energy yield but also for its realistic emissions offset potential. Such an approach ensures that the system’s performance is grounded in actual operational conditions, thus enhancing its relevance within the context of Thailand’s carbon management framework and providing a more accurate basis for evaluating its efficacy in reducing Scope 2 emissions. This solar PV adoption in Thailand is achieved by evaluating the economic feasibility and efficiency of different systems. It aims to provide evidence for policy consistency, better incentives, and solutions for grid integration. Additionally, high public awareness appears to be closely linked to the willingness to pay for solar energy solutions, suggesting that increasing awareness could help promote broader adoption in Thailand [26].

4. Limitations

This study focused on lecture rooms, which account for approximately 36.7% of the HM Building’s total electricity use. While this allowed for clear analysis of peak loads, other functional areas such as offices and laboratories—contributing to the building’s baseload—were not modeled in detail due to limited sub-metering. However, total consumption was verified using dedicated building-level electricity meters and PEA billing data.
PV system simulations were based on standard assumptions for irradiance, panel performance, and cost estimates. These may differ from real operating conditions, which can affect the accuracy of energy yield and financial outcomes. Future work could benefit from zone-specific metering and sensitivity analysis to improve precision and adaptability.

5. Conclusions

This study developed an integrated approach to assess and reduce carbon emissions in academic buildings through the combination of CFO analysis, empirical load profiling, and PV system simulation. Using the HM Building at KMITL as a case, the research quantified building-level GHG emissions and evaluated the potential for on-site solar power to mitigate Scope 2 emissions from electricity use. The CFO results indicated total annual emissions of 1841.04 tCO2e, with Scope 2 electricity-related emissions accounting for 442.00 tCO2e, or approximately 24% of total emissions. Appliance-level audits revealed that lecture rooms contribute approximately 36.7% of the building’s electricity consumption, confirmed by the annual utility data of 850,000 kWh. This bottom-up load analysis enabled temporal mapping of peak demand periods and aligned PV generation with active usage zones. Simulation of a 207 kWp rooftop PV system using PVsyst software demonstrated that a monocrystalline system could generate 292,000 kWh/year, offsetting 151.84 tCO2e/year or 34.4% of Scope 2 emissions. Among the configurations, polycrystalline modules offered the most favorable financial metrics with a payback period of 5.6 years and an ROI of 343.4%. Loss-adjusted modeling emphasized the importance of realistic performance forecasting under tropical climatic conditions. This research contributes a replicable framework that integrates CFO-verified emissions, measured energy usage, and derated PV system outputs. By grounding PV system design in both environmental accounting and empirical demand data, this study improves alignment with institutional decarbonization goals and national climate policy under Thailand’s NDCs. Future work should expand the load analysis to non-instructional areas and investigate the integration of energy storage or demand-side management. The proposed methodology can support broader applications such as green building certification, carbon credit generation, or Renewable Energy Certificate (REC) programs within higher education institutions. In addition, the significant findings also contribute to SDG 7 (Affordable and Clean Energy) and SDG 13 (Climate Action) by providing a framework for integrating photovoltaic systems and emissions analysis.

Supplementary Materials

The following supporting information can be downloaded at: https://www.mdpi.com/article/10.3390/en18102485/s1.

Author Contributions

Methodology, N.S.; Formal analysis, K.R.; Writing—original draft, M.N.; Writing—review & editing, N.L., N.S., N.K. and M.N.; Supervision, M.N.; Funding acquisition, M.N. All authors have read and agreed to the published version of the manuscript.

Funding

The authors gratefully acknowledge the partial financial support for publication provided by the School of Engineering, King Mongkut’s Institute of Technology Ladkrabang (KMITL), Thailand.

Data Availability Statement

The data presented in this study are available on request from the corresponding author due to legal reasons.

Conflicts of Interest

Author Kamonchanok Roongrueng was employed by the company Green Technology Research Co., Ltd. The remaining authors declare that the research was conducted in the absence of any commercial or financial relationships that could be construed as a potential conflict of interest.

References

  1. Department of Energy Policy and Planning Office, Ministry of Energy, 2020. National Energy Plan. Available online: https://www.eppo.go.th/index.php/en/component/k2/item/17093-nep (accessed on 15 May 2024).
  2. Thailand Greenhouse Gas Management Organization (TGO). Guidelines for Calculating the Carbon Footprint of Organization; (Version 8). Available online: https://thaicarbonlabel.tgo.or.th/index.php?lang=EN&mod=YjNKbllXNXBlbUYwYVc5dVgybHo (accessed on 20 June 2024).
  3. Chaianong, A.; Pharino, C. Outlook and challenges for promoting solar photovoltaic rooftops in Thailand. Renew. Sustain. Energy Rev. 2015, 48, 356–372. [Google Scholar] [CrossRef]
  4. Chatthaworn, R.; Angaphiwatchawal, P.; Chaitusaney, S. Solar PV policy, barriers and proposed solution for technical barriers in Thailand. Int. J. Eng. Technol. 2018, 7, 1172–1180. [Google Scholar] [CrossRef]
  5. Govindarajan, L.; Batcha, M.F.B.M.; Abdullah, M.K.B. Solar Energy Policies in Southeast Asia Towards Low Carbon Emission: A Review. Heliyon 2023, 9, e14294. [Google Scholar] [CrossRef] [PubMed]
  6. Intergovernmental Panel on Climate Change (IPCC). Climate Change 2014: Mitigation of Climate Change—Fifth Assessment Report (AR5); Cambridge University Press: Cambridge, UK, 2014. [Google Scholar]
  7. ISO 14064-1:2018; Greenhouse Gases—Part 1: Specification with Guidance at the Organization Level for Quantification and Reporting of GHG Emissions and Removals. International Organization for Standardization (ISO): London, UK, 2018.
  8. PVsyst SA. PVsyst Software for PV System Design and Simulation (Version 7.2). 2021. Available online: https://www.pvsyst.com (accessed on 10 May 2021).
  9. Phuangpornpitak, N.; Tia, S. Opportunities and challenges of integrating renewable energy in universities in Thailand. Renew. Energy 2013, 59, 126–132. [Google Scholar] [CrossRef]
  10. Lertsatitthanakorn, C.; Rordprapat, W.; Rordprapat, P. Energy consumption and greenhouse gas emissions in university buildings in Thailand. Energy Build. 2012, 45, 247–254. [Google Scholar] [CrossRef]
  11. Chomphuphuk, W.; Limmeechokchai, B.; Junrat, S. Assessment of GHG emissions and mitigation strategies in Thai higher education institutions. J. Clean. Prod. 2021, 289, 125674. [Google Scholar] [CrossRef]
  12. Kaparapu, J.; Prasad, M.K.; Reddy, D.R.B.; Jyothi, K. A critical review on carbon footprint of universities. Int. J. Sci. Res. Eng. Dev. 2022, 5, 683–692. [Google Scholar]
  13. United Nations Environment Programme (UNEP). Greening Universities Toolkit v2.0. 2020. Available online: https://www.unep.org/resources/toolkits-manuals-and-guides/greening-universities-toolkit-v20 (accessed on 28 October 2024).
  14. International Energy Agency (IEA). World Energy Outlook 2023. 2023. Available online: https://www.iea.org/reports/world-energy-outlook-2023 (accessed on 20 June 2024).
  15. Sharma, S.; Sharma, V.; Jain, A. Solar PV system design using PVsyst: A case study of an academic institute. In Proceedings of the 2018 IEEE International Conference on Computing, Power and Communication Technologies (GUCON), Greater Noida, India, 28–29 September 2018; IEEE: Piscataway, NJ, USA, 2018; pp. 134–139. [Google Scholar] [CrossRef]
  16. Khalid, A.M.; Bahaidarah, H.M.S.; Rehman, S.; Alam, M.M. Performance ratio—Crucial parameter for grid-connected PV plants. Renew. Sustain. Energy Rev. 2016, 65, 1139–1158. [Google Scholar] [CrossRef]
  17. Arunrat, N.; Pumijumnong, N.; Sereenonchai, S. Scenario-based greenhouse gas and energy management in higher education: A case study of Mahidol University. Sustainability 2021, 13, 164. [Google Scholar] [CrossRef]
  18. Schäfer, P.; te Heesen, H. Load Profile Analysis; Umwelt-Campus Birkenfeld: Birkenfeld, Germany, 2023; Available online: https://www.umwelt-campus.de/en/hteheesen/research/pv-yield-study (accessed on 25 July 2024).
  19. Jiang, H.; Lu, X.; Chen, Y.; Lin, Y. Assessing carbon reduction potential of rooftop PV in China through remote sensing data-driven simulations. Sustainability 2023, 15, 3380. [Google Scholar] [CrossRef]
  20. Bahaidarah, H.M.S.; Rehman, S.; Gandhidasan, P. Performance evaluation of a PV module under climatic conditions of Dhahran, Saudi Arabia. Energy Explor. Exploit. 2015, 33, 909–930. [Google Scholar] [CrossRef]
  21. Peerapong, P.; Limmeechokchai, B. Optimal photovoltaic resources harvesting in grid-connected residential rooftop and in commercial buildings: Cases of Thailand. Energy Procedia 2015, 79, 39–46. [Google Scholar] [CrossRef]
  22. Thailand Energy Regulatory Commission (ERC). Solar Rooftop Installation Cost Benchmark Report 2024. Available online: https://www.erc.or.th/en/annual-report (accessed on 20 October 2024).
  23. International Renewable Energy Agency (IRENA). Renewable Power Generation Costs in 2024; IRENA: Abu Dhabi, United Arab Emirates, 2024. [Google Scholar]
  24. Wang, M.; Wang, Z.; Xu, H. Carbon emission reduction and financial feasibility of rooftop PV in Beijing. J. Clean. Prod. 2018, 203, 1119–1131. [Google Scholar] [CrossRef]
  25. Filho, W.L.; Shiel, C.; Paço, A.; Mifsud, M.; Pace, P. Carbon footprint of a university campus: A case study in Brazil. Energy Build. 2015, 96, 179–188. [Google Scholar] [CrossRef]
  26. Jotaworn, S.; Nitivattananon, V.; Teparakul, O.; Wongboontham, T.; Sugiyama, M.; Numata, M.; Alvarez, D.D.B. Households’ willingness to pay for renewable energy alternatives in Thailand. Soc. Sci. 2023, 12, 634. [Google Scholar] [CrossRef]
Figure 1. The roof area of HM from Google Earth.
Energies 18 02485 g001
Figure 2. (a) Daily peak energy demand profile, showing higher usage on weekdays linked to lecture room operations calculated in accordance to [18]. (b) Verified monthly electricity consumption derived from PEA utility bills, validating the annual total used for Scope 2 CFO calculations.
Energies 18 02485 g002
Figure 3. Comparison of ideal (nominal) and actual (simulated) annual energy output for three PV technologies. Data derived from PVsyst includes loss factors due to temperature, mismatch, shading, and inverter efficiency. Monocrystalline technology retains the highest absolute post-loss yield.
Energies 18 02485 g003
Table 1. Categorization of GHG sources by scope and justification for inclusion in CFO assessment.
ScopeDescriptionSelected Emission SourcesJustification
Scope 1Direct emissions from sources owned or controlled by the organization
-
Refrigerant leakage (R-22, R-32, R-410A);
-
Methane (CH4) from restroom wastewater
Measurable on-site sources under direct control
Scope 2Indirect emissions from the generation of purchased electricity consumed by the organizationElectricity purchased from the national grid (850,000 kWh/year)Primary emission source (over 90% of total GHG emissions); verified by utility records (PEA)
Scope 3Other indirect emissions occurring in the value chain of the organizationPurchased goods (Cat.1), capital goods (Cat.2), waste (Cat.5), student commuting (Cat.7), leased assets (Cat.13)Included based on materiality screening and alignment with TGO CFO reporting protocol [17]
Table 2. The sunshine duration and global radiation values for Ladkrabang province.
GlobHor
kWh/m2
DiffHor
kWh/m2
T-Amb
°C
GlobInc
kWh/m2
GlobEff
kWh/m2
January135.863.4927.14154.2145.7
February134.277.6128.48144.6136.7
March159.285.8929.73164.2155.2
April166.088.4530.36163.4154.3
May156.884.0530.28147.6138.6
June141.079.6729.36130.7122.4
July139.277.2029.35130.1122.0
August135.080.8729.07130.3122.5
September123.766.1528.16124.2116.9
October126.681.1828.58132.0124.3
November125.267.6428.00138.8130.9
December133.467.1027.34151.9143.6
Year1676.0919.3028.821712.01613.1
Table 3. Illustrates a comparative analysis of the results from three types of panels.
Parameters Type of Solar Panel
MonocrystallinePolycrystallineThin-Film
Nominal (STC)207 kWp170 kWp159 kWp
No. of modules380 units494 units1062 units
Module area982 m2991 m2998 m2
Total installation costTHB 5,390,249.30THB 3,573,577.70THB 6,477,573.70
Produced energy292 kWh/year239 kWh/year233 kWh/year
PR82.33%82.08%85.50%
Payback period6.8 years5.6 years10.7 years
NPVTHB 14,179,287.27THB 12,271,781.54THB 8,118,602.74
IRR14.15%17.57%7.78%
ROI263.1%343.4%125.3%
CO2 emission balance3301.2 tCO2e1578.2 tCO2e2373.3 tCO2e
Note: PV field orientation is 15/0°, Number of inverters for all systems are 2 units (SUN2000-100KTL-M1-480Vac, Huawei).
Table 4. Equations used in methodology.
ParameterExpressionDescription for the Values
Energy consumption

Performance ratio

Payback period

Net present value


Levelized cost of energy


Internal rate of return

Return on investment


CO2 reduction
k W h =   W a t t s   t i m e   i n   h o u r s 1000


P R = E G r i d G l o b I n c   ×   P n o m
I n i t i a l   i n v e s t m e n t   o r   o r i g i n a l   c o s t   o f   a s s e t   C a s h   f l o w
N P V =   y = 1 N C a s h   f l o w ( y ) ( 1 + R d 100 ) y c a p i t a l   c o s t
L C O E = c a p i t a l   c o s t + A b a n d o n e m n t   c o s t   ( 1 + R d 100 ) N y = 1 N O & M   c o s t ( y ) ( 1 + R d 100 ) y y = 1 N E ( y ) ( E y 1 + R d 100 )


IRR = value of the discount rate that makes NPV of all cash flows equal to zero

R O I = N e t   b e n e f i t   a t   t h e   e n d   o f   t h e   l i f e t i m e T o t a l   I n v e s t m e n t


C a r b o n   B a l a n c e = ( E G r i d × y × L C E G r i d ) L C E s y s t e m
E_Grid = the energy delivered to the grid in kWh

GlobInc = Irradiation in the plane of array in kWh/m2

Pnom = Array nominal power at STC in kWp

Rd = discount rate

y = PV system lifespan

E = energy production from PV system in kWh


Investment efficiency metric


LCEGrid = the average amount of carbon dioxide emissions per unit of electricity produced, a value disseminated by the International Energy Agency (IEA)

LCEsysten = the total carbon dioxide emissions resulting from the construction and operation of the solar energy system installation
Table 5. Total GHG emissions by scope.
ScopeSourceEmissions (tCO2e/Year)% of Total CFO
Scope 1Methane (restrooms), refrigerants86.944.7%
Scope 2Grid electricity (850,000 kWh)442.0024.0%
Scope 3Transport, waste, water, leased assets1312.1071.3%
Total 1841.04100%
Table 6. Appliance energy consumption per room.
ApplianceQuantity (Unit)Power Rating (W)Usage (Hrs/Day)Daily Energy Use (kWh/Day)
Fluorescent Lights203675.04
Air Conditioners4920725.76
Personal Computers124071.68
Total per Room 32.48
Note: Data were obtained from equipment labels and verified by on-site observation and online specifications. This represents a typical classroom scenario in the HM Building.
Table 7. Data of appliances for all lecture rooms in HM Building.
MetricValue
Daily energy use per room32.48 kWh
Number of rooms40
Total daily energy (all rooms)1299.2 kWh
Weekly energy use (5 days)6496 kWh/week
Monthly energy use (20 days)25,984 kWh/month
Annual estimate (approximate)311,808 kWh/year
Table 8. Performance comparison of PV system technologies.
TechnologyAnnual Output (kWh)CO2 Offset (tCO2e/Year)% Scope 2
Offset
Payback Period (Years)ROI (%)
Monocrystalline292,000151.8434.4%8.5312.0
Polycrystalline239,000124.2828.1%5.6343.4
Thin-film233,000121.1627.4%10.7180.2
Disclaimer/Publisher’s Note: The statements, opinions and data contained in all publications are solely those of the individual author(s) and contributor(s) and not of MDPI and/or the editor(s). MDPI and/or the editor(s) disclaim responsibility for any injury to people or property resulting from any ideas, methods, instructions or products referred to in the content.

