
Socioeconomic Determinants of Biomass Energy Transition in China: A Multiregional Spatial Analysis for Sustainable Development


Abstract
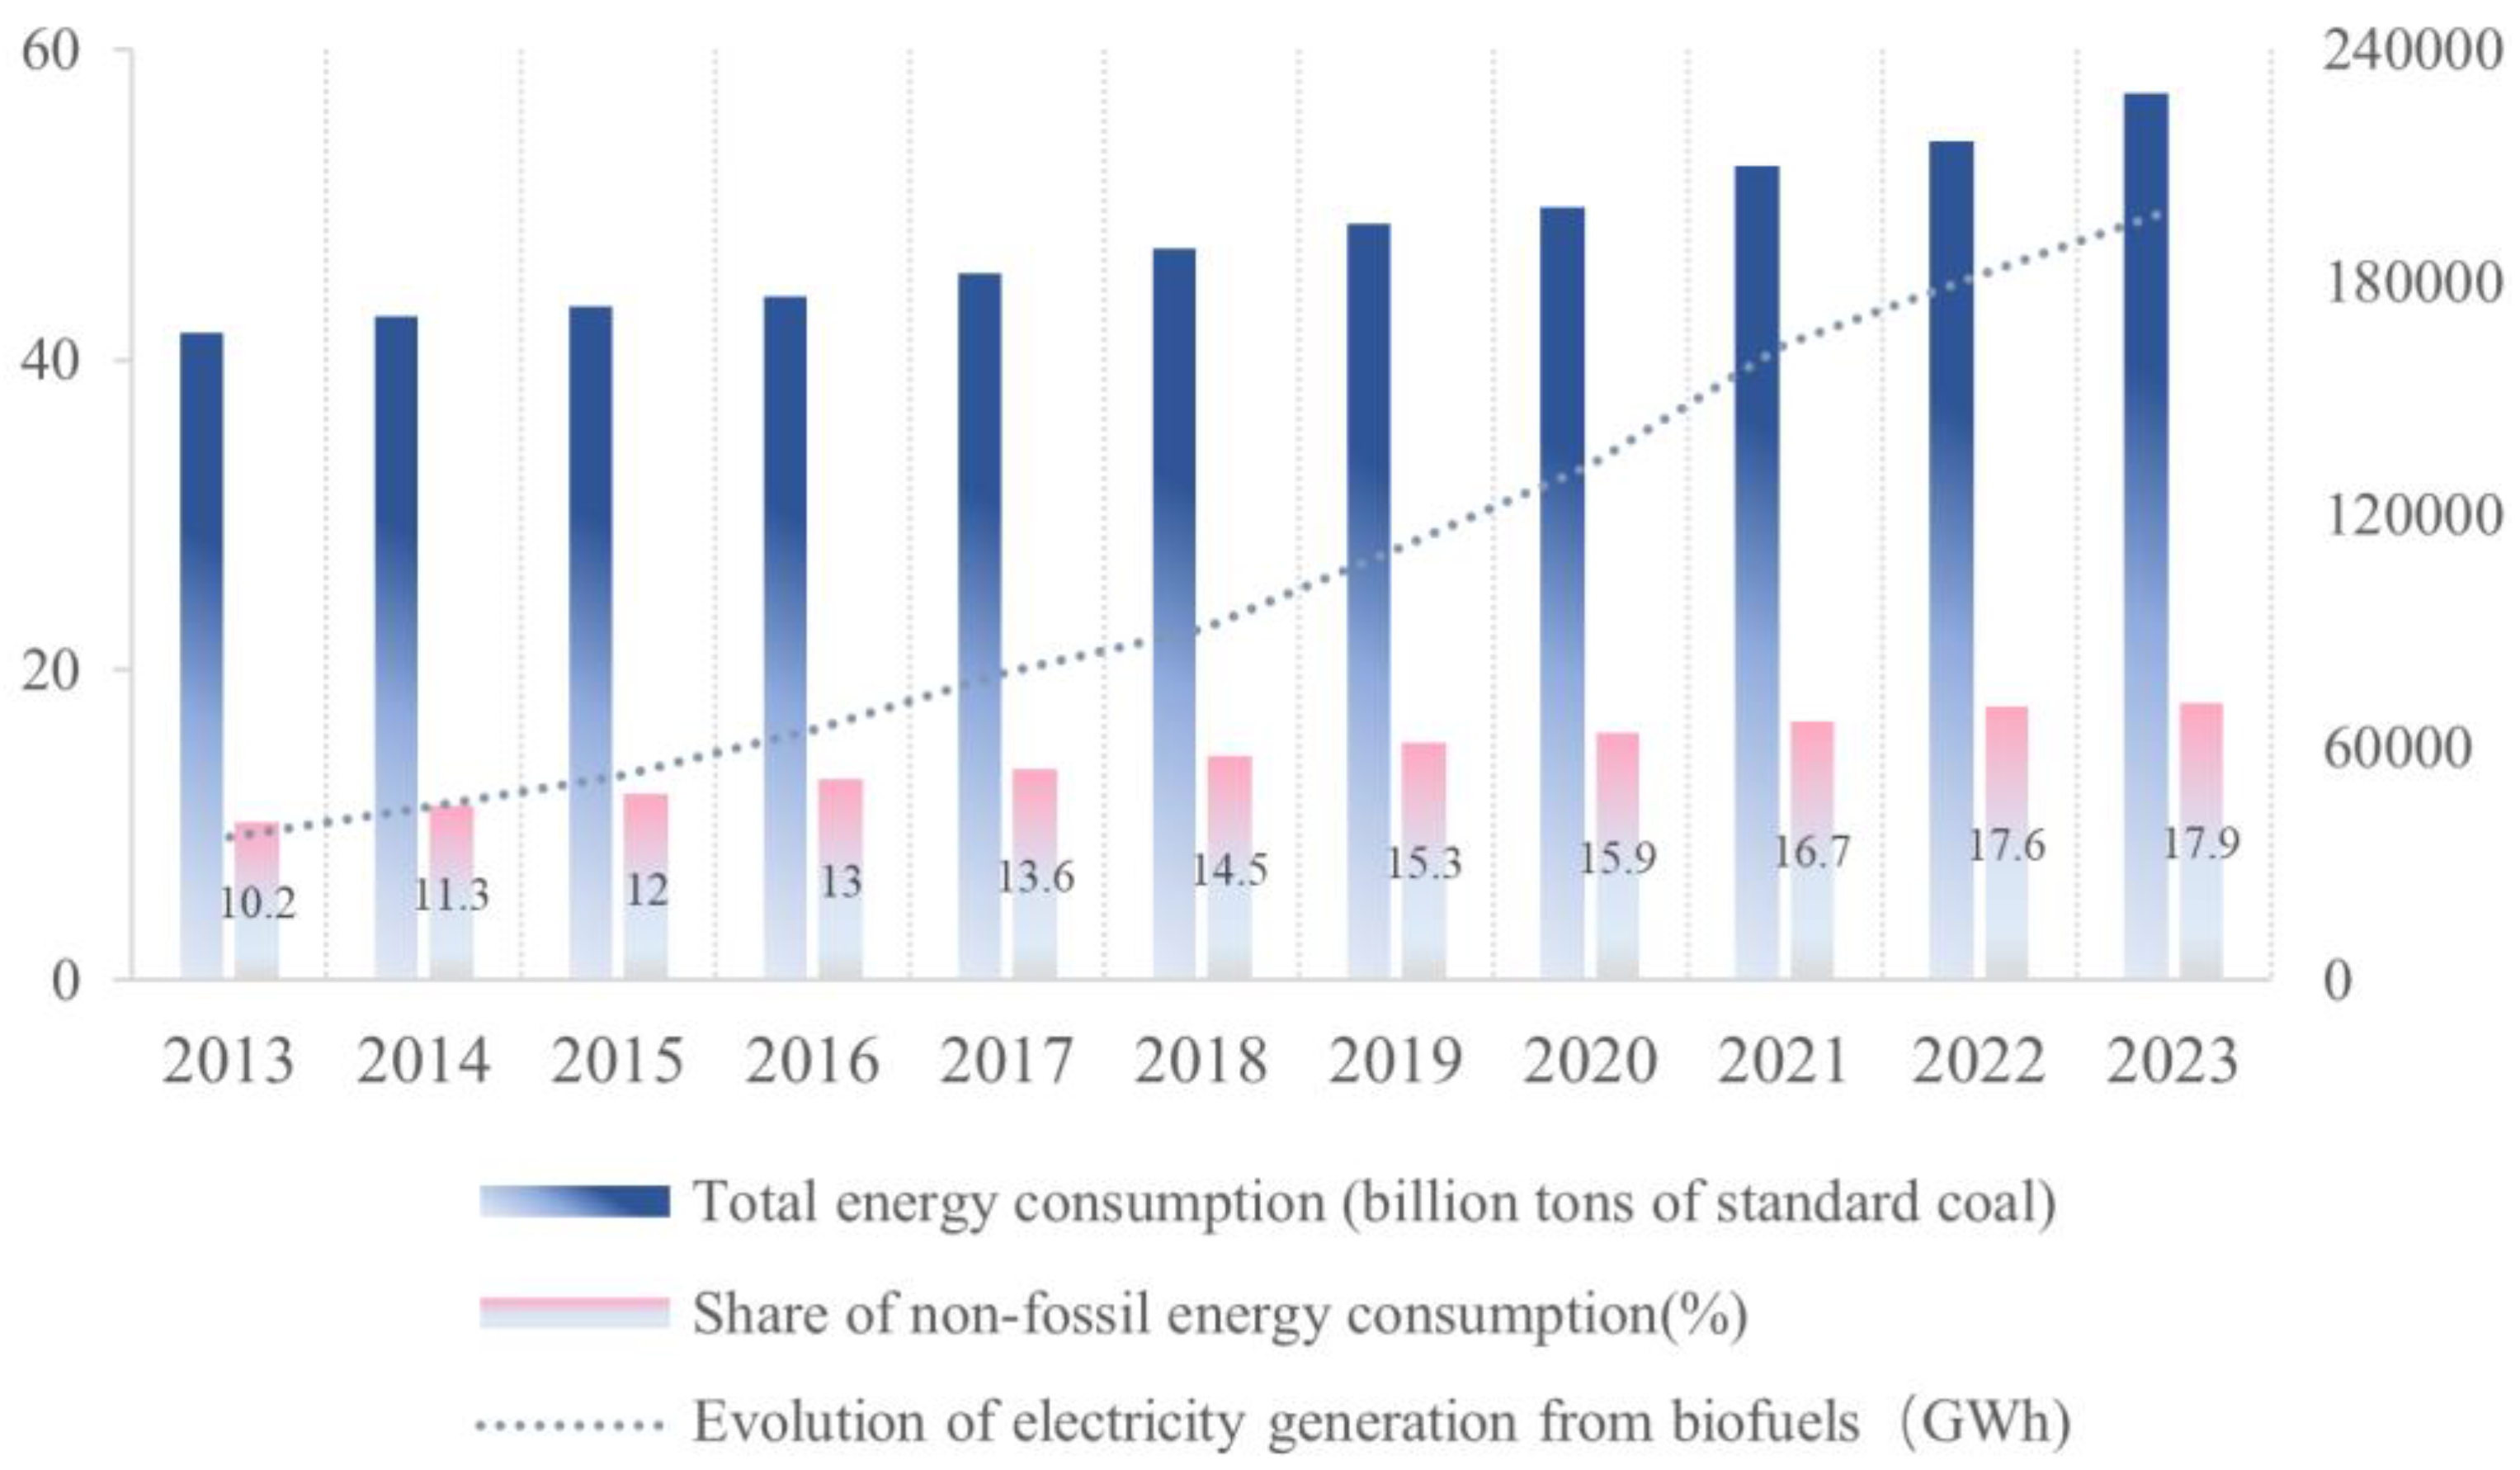
1. Introduction
2. Materials and Methods
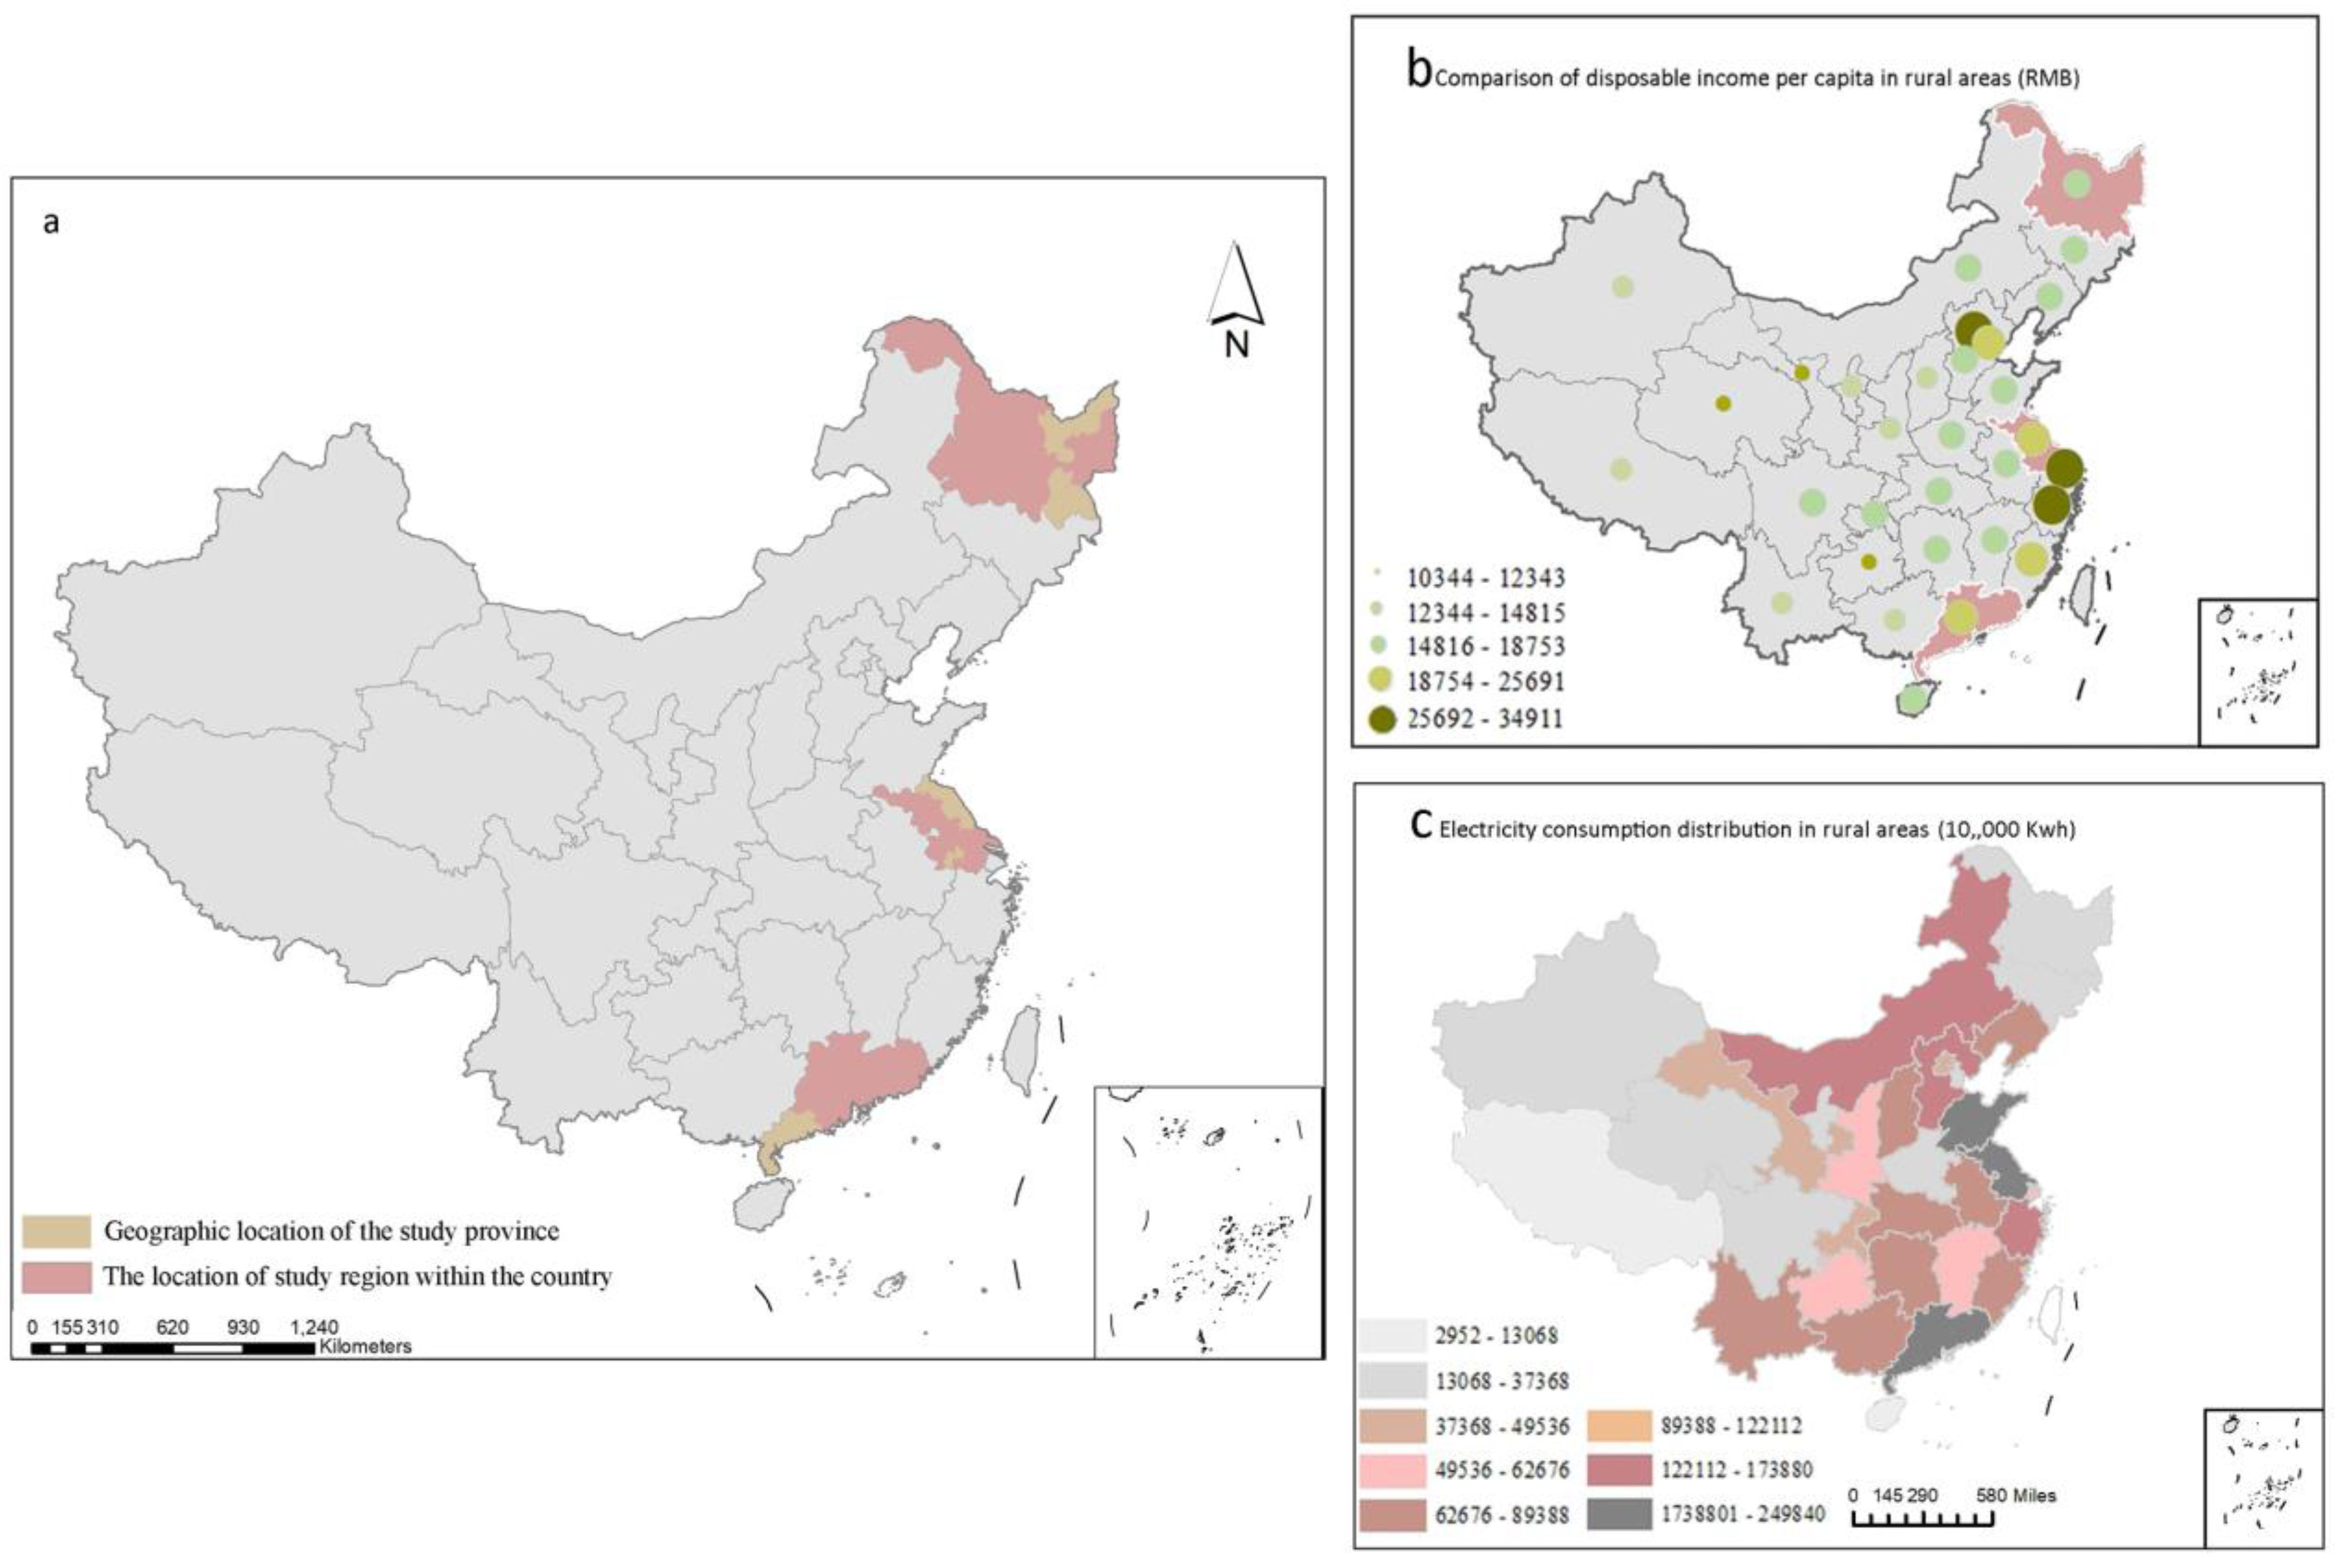
2.1. Research Framework and Data
2.2. Estimation of Energy Consumption by Income
2.3. Calculation of Agricultural Biomass Availability
2.3.1. Calculation of Agricultural Biomass Potential
2.3.2. Estimation of Waste-to-Energy (WTE) Potential from Domestic Solid Waste
2.4. Assessment Model for Biomass Resource Surplus and Deficit
2.5. Nonlinear Modeling of Income-Driven Rural Energy Consumption Patterns
3. Results
3.1. Simulation of the Impact of PCDI on Energy Demand
3.1.1. Relationship Between PCDI and Electricity Consumption
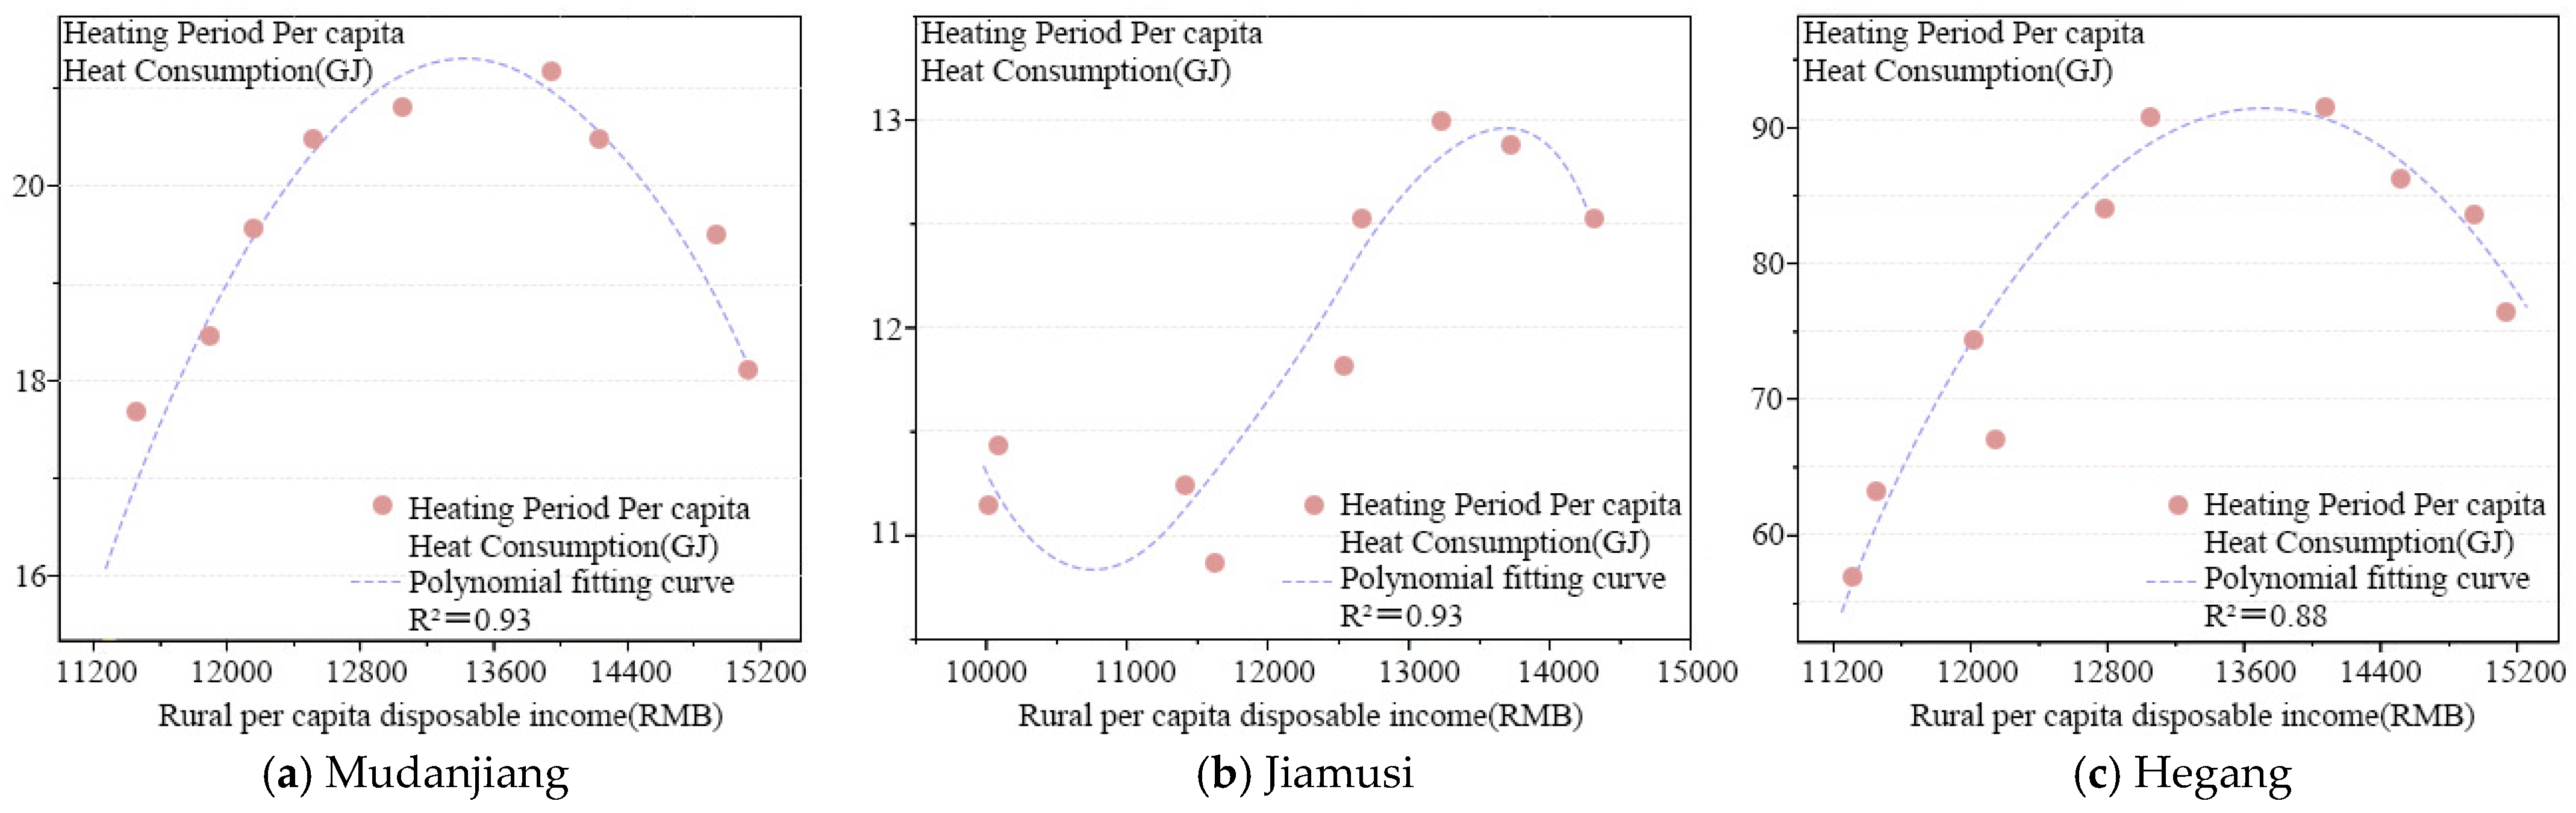
3.1.2. Income-Driven Variability in Winter Thermal Energy Demand
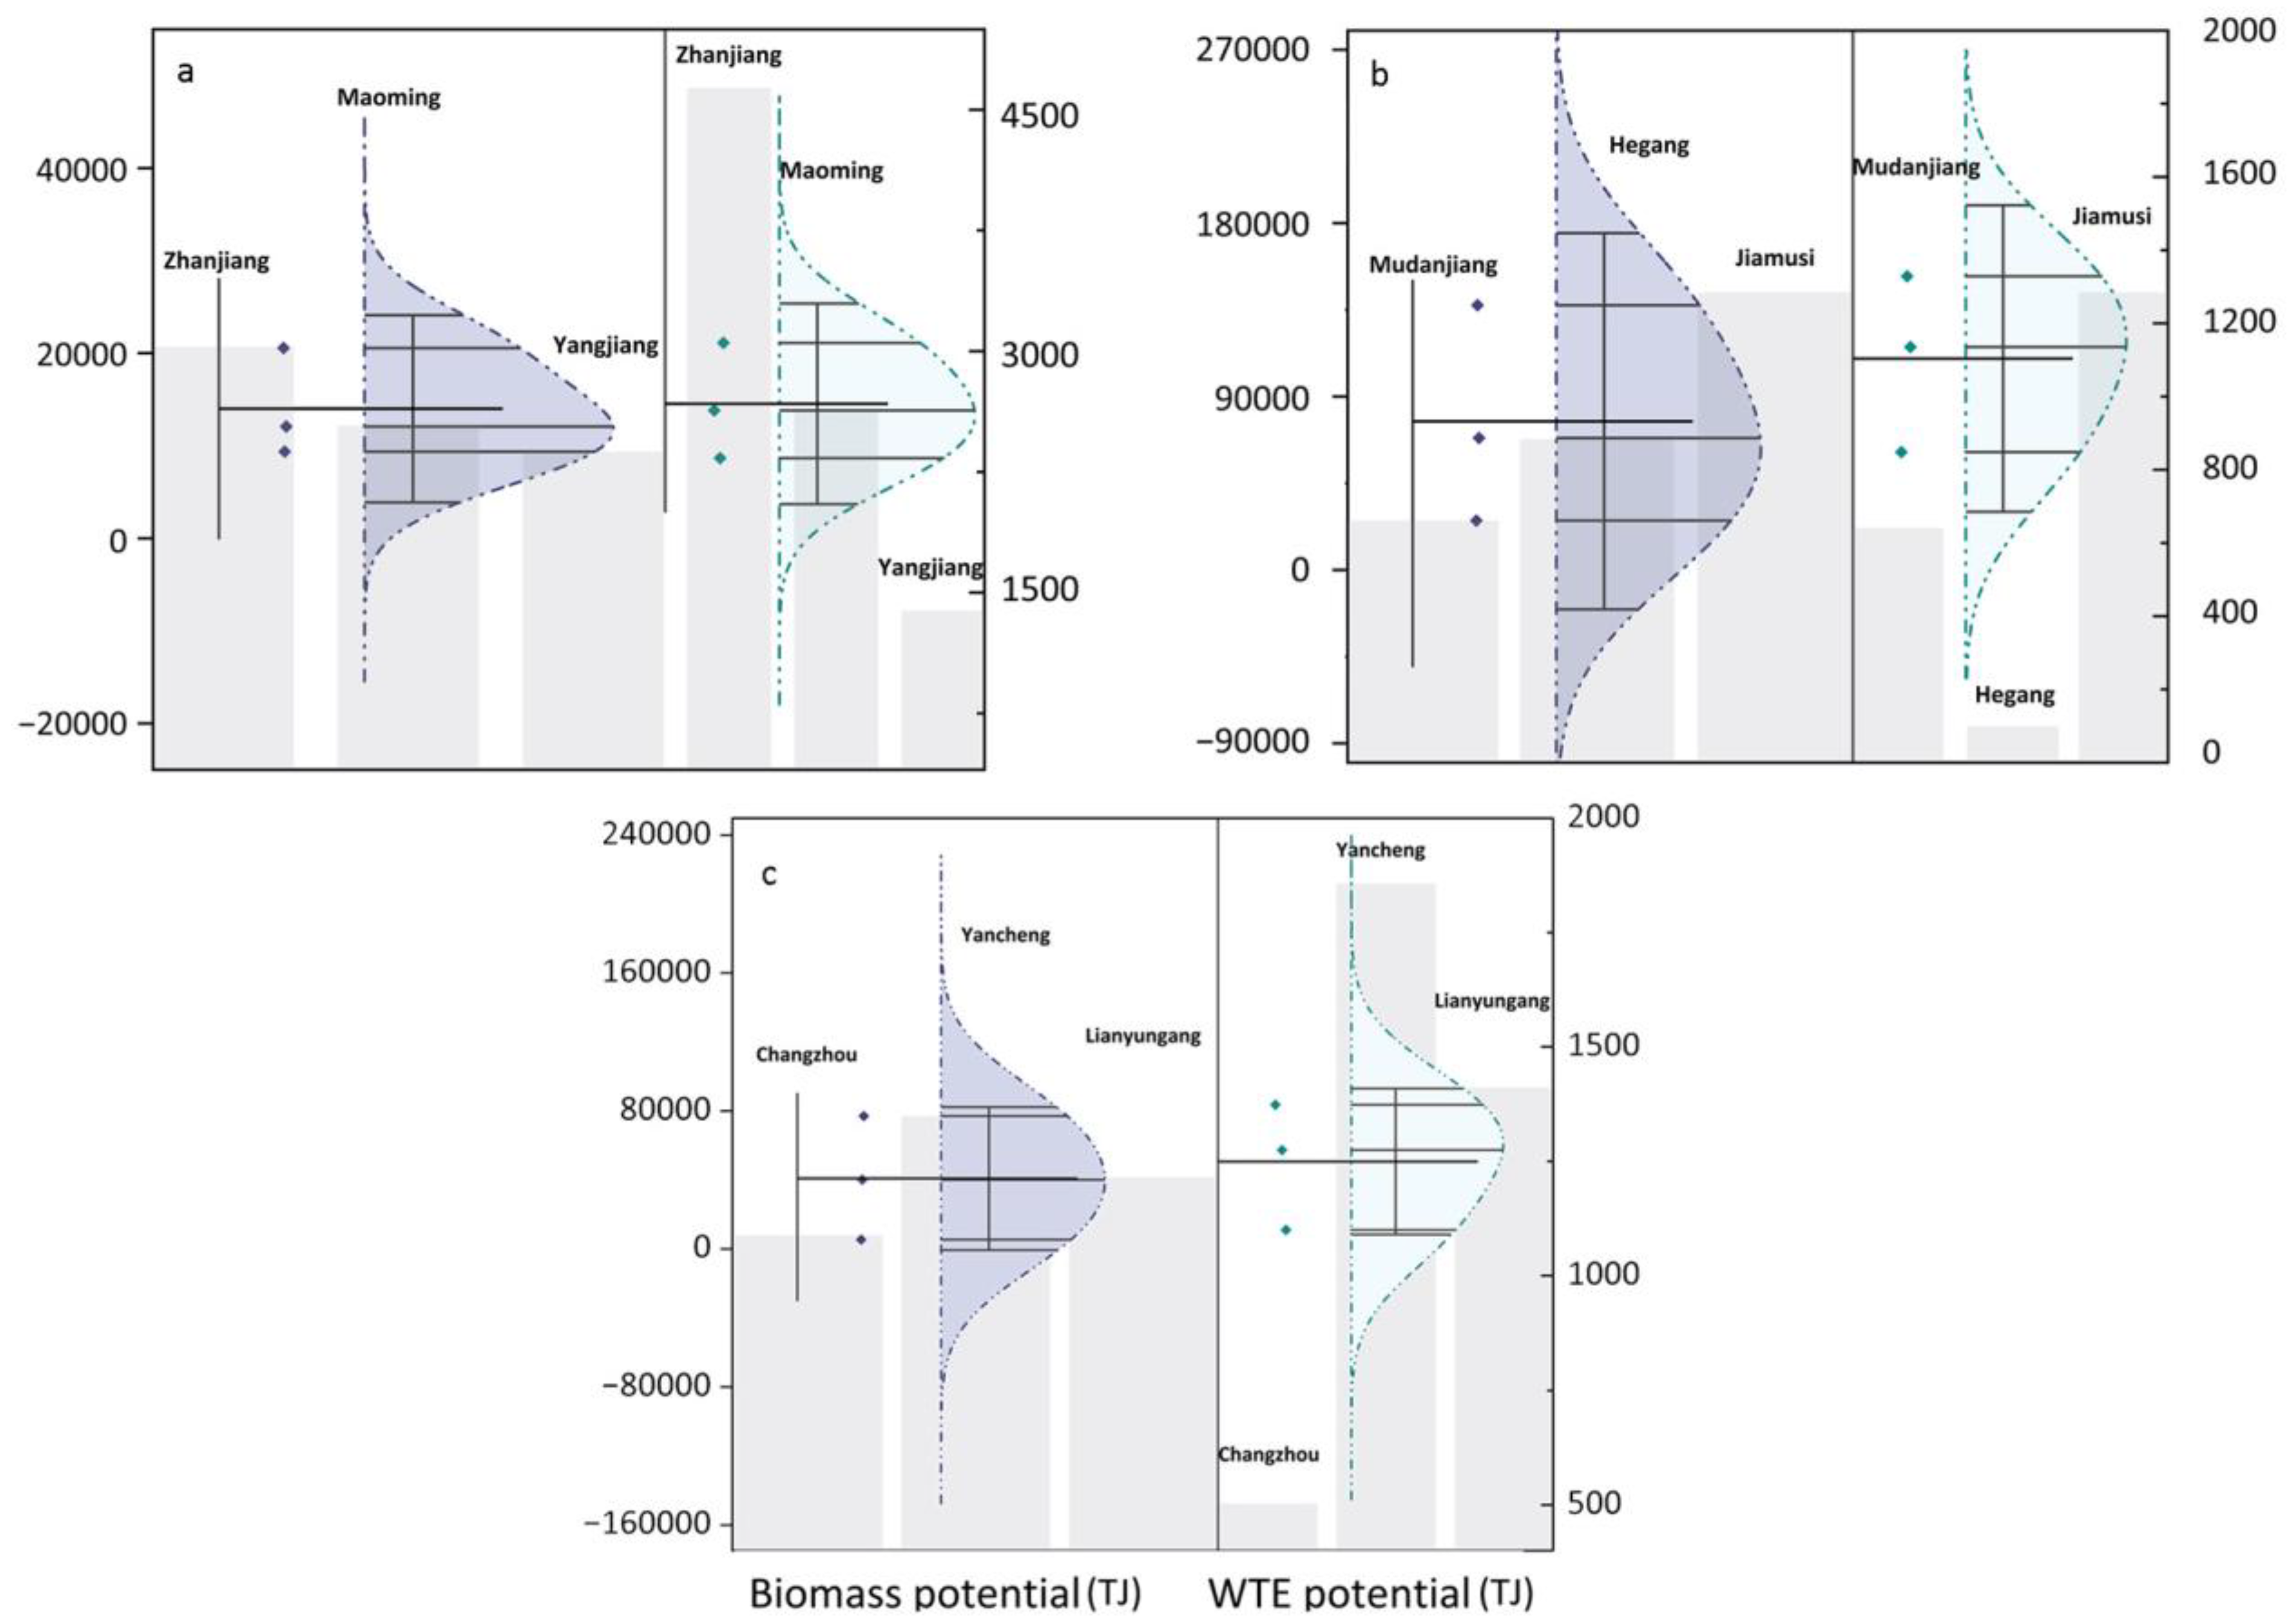
3.2. Distribution of Biomass and WTE Potentials Across Economic Regions
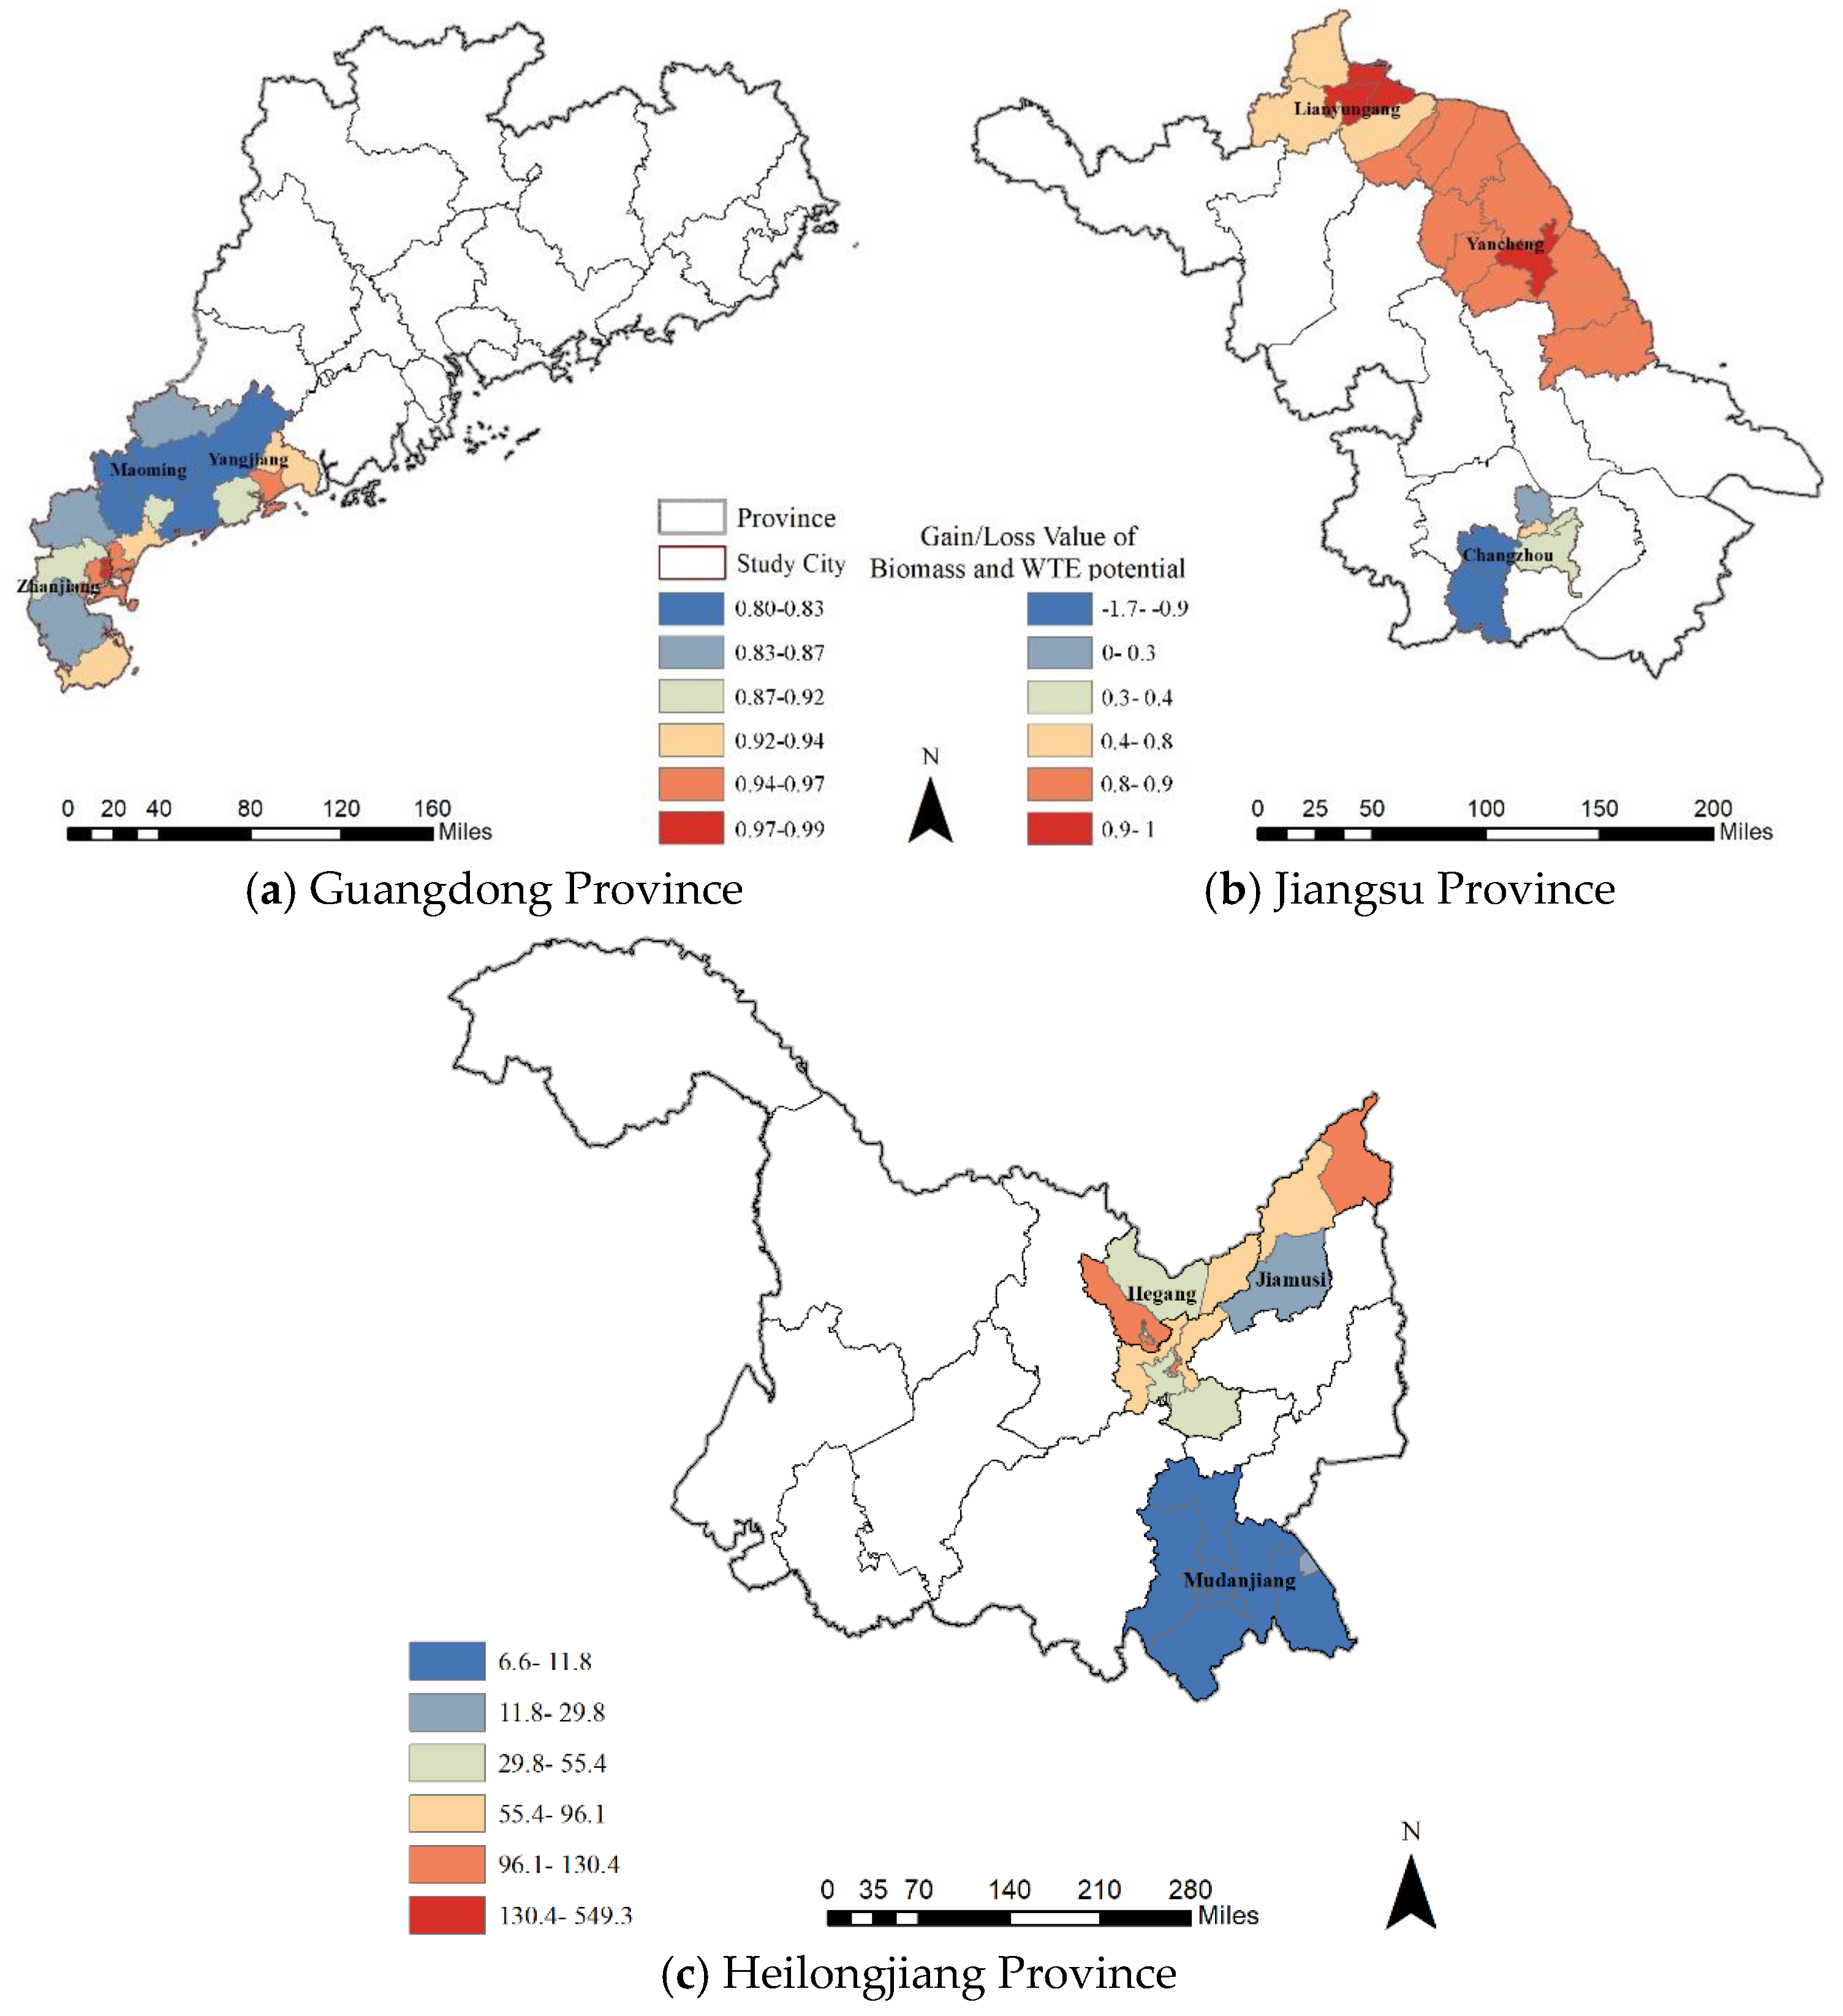
3.3. Assessment of Surplus and Deficit of Biomass Energy
4. Conclusions
- (1)
- Nonlinear regression analysis revealed that rural energy demand exhibits a critical inflection point between RMB 13,000 and 15,000 in low- to middle-income regions. Beyond this threshold, per capita energy consumption tends to stabilize or decline, reflecting shifts in household behavior and infrastructure improvements. This income-sensitive pattern offers a novel empirical reference for energy demand forecasting and targeted policy interventions.
- (2)
- In low-income rural areas, energy consumption rises sharply after reaching a critical threshold (about 13,000 RMB) and then declines slowly. The results of the study suggest that the surplus of biomass energy improves significantly as the PCDI rises and targeted policy interventions (e.g., cropland protection policies and government subsidies to the biomass energy industry) are implemented.
- (3)
- Regions with superior economic development such as rural areas with PCDI levels above RMB 21,000 typically benefit from better financial conditions and more developed infrastructure, especially road transportation networks, which are conducive to the expansion of the bioenergy industry. Per capita energy consumption continues to rise sharply in rural areas with PCDIs between RMB 13,000 and 21,000. Here, transitioning to integrated systems that combine agricultural residues, domestic waste, and other renewables (e.g., photovoltaics) will be essential. Improved conversion efficiency and demand-responsive planning can further boost system performance.
5. Discussion
Author Contributions
Funding
Data Availability Statement
Conflicts of Interest
References
- China’s Energy Transition. Available online: https://www.gov.cn/zhengce/202408/content_6971115.htm (accessed on 24 November 2024).
- IEA—International Energy Agency. Available online: https://www.iea.org (accessed on 27 April 2025).
- Xu, X.; Zhang, W.; Yin, Y.; Dong, Y.; Yang, D.; Lv, J.; Yuan, W. Environmental Implications of Reduced Electricity Consumption in Wuhan during COVID-19 Outbreak: A Brief Study. Environ. Technol. Innov. 2021, 23, 101578. [Google Scholar] [CrossRef] [PubMed]
- Energy Consumers of Tomorrow. Available online: https://www.iea.org/reports/world-energy-outlook-2021/energy-consumers-of-tomorrow (accessed on 24 November 2024).
- Xu, Y.; Smith, P.; Qin, Z. Sustainable Bioenergy Contributes to Cost-Effective Climate Change Mitigation in China. iScience 2024, 27, 110232. [Google Scholar] [CrossRef]
- Ghoddusi, H.; Rodivilov, A.; Roy, M. Income Elasticity of Demand versus Consumption: Implications for Energy Policy Analysis. Energy Econ. 2021, 95, 105009. [Google Scholar] [CrossRef]
- Zhou, Q.; Wei, S. Socio-Economic Transition and Inequality of Energy Consumption among Urban and Rural Residents in China. Energy Build. 2019, 190, 15–24. [Google Scholar] [CrossRef]
- Piao, X.; Managi, S. Household energy-saving behavior, its consumption, and life satisfaction in 37 countries. Sci. Rep. 2023, 13, 1382. [Google Scholar] [CrossRef]
- Chang, H.; Zhang, J. Income Growth versus Labor Loss: The Joint Impacts of Rural-Urban Migration and off-Farm Employment on Household Energy Use in Rural China. Renew. Sustain. Energy Rev. 2024, 203, 114746. [Google Scholar] [CrossRef]
- Li, X.; Mao, H.; Fang, L. The Impact of Rural Human Capital on Household Energy Consumption Structure: Evidence from Shaanxi Province in China. Sustain. Futures 2024, 8, 100301. [Google Scholar] [CrossRef]
- Ma, X.; Wang, M.; Chen, D.; Li, C. Energy Choice in Rural Household Cooking and Heating: Influencing Factors and Transformation Patterns. Environ. Sci. Pollut. Res. 2021, 28, 36727–36741. [Google Scholar] [CrossRef]
- Ma, S.; Xu, X.; Li, C.; Zhang, L.; Sun, M. Energy Consumption Inequality Decrease with Energy Consumption Increase: Evidence from Rural China at Micro Scale. Energy Policy 2021, 159, 112638. [Google Scholar] [CrossRef]
- Wu, S.; Zheng, X.; You, C.; Wei, C. Household Energy Consumption in Rural China: Historical Development, Present Pattern and Policy Implication. J. Clean. Prod. 2019, 211, 981–991. [Google Scholar] [CrossRef]
- Meng, M.; Wu, S.; Zhou, J.; Wang, X. What Is Currently Driving the Growth of China’s Household Electricity Consumption? A Clustering and Decomposition Analysis. Sustainability 2019, 11, 4648. [Google Scholar] [CrossRef]
- Ma, W.; Zhou, X.; Renwick, A. Impact of Off-Farm Income on Household Energy Expenditures in China: Implications for Rural Energy Transition. Energy Policy 2019, 127, 248–258. [Google Scholar] [CrossRef]
- Zhang, Y.; Wang, P. Effect of Population Age Structure on Capacity for Biomass Cogeneration: A Case Study of a Rural Area in China. Build. Environ. 2020, 170, 106601. [Google Scholar] [CrossRef]
- Weiss de Abreu, M.; Ferreira, D.V.; Pereira, A.O.; Cabral, J.; Cohen, C. Household Energy Consumption Behaviors in Developing Countries: A Structural Decomposition Analysis for Brazil. Energy Sustain. Dev. 2021, 62, 1–15. [Google Scholar] [CrossRef]
- Riva, F.; Ahlborg, H.; Hartvigsson, E.; Pachauri, S.; Colombo, E. Electricity Access and Rural Development: Review of Complex Socio-Economic Dynamics and Causal Diagrams for More Appropriate Energy Modelling. Energy Sustain. Dev. 2018, 43, 203–223. [Google Scholar] [CrossRef]
- Ma, C.; Zhang, Y.; Zhao, W. Influence of Latitude on Raw Material Consumption by Biomass Combined Heat and Power Plants: Energy Conservation Study of 50 Cities and Counties in the Cold Region of China. J. Clean. Prod. 2021, 278, 123796. [Google Scholar] [CrossRef]
- Yin, G.; Duan, J.; Feng, J.; He, F.; Zhao, H.; Guo, Y.; Han, T. Code for Design of Urban Heating Network (CJJ34-2002), 1st ed.; Beijing Gas and Heating Engineering Design Institute Co., Ltd., China Architecture & Building Press: Beijing, China, 2004. [Google Scholar]
- Ozcan, H.K.; Guvenc, S.Y.; Guvenc, L.; Demir, G. Municipal Solid Waste Characterization According to Different Income Levels: A Case Study. Sustainability 2016, 8, 1044. [Google Scholar] [CrossRef]
- Technical Specifications of Domestic Pollution Control for Town and Village. Available online: https://english.mee.gov.cn/Resources/standards/others1/Specifications_Engineering/201102/t20110216_200786.shtml (accessed on 4 May 2025).
- Han, H.; Wu, S. Rural Residential Energy Transition and Energy Consumption Intensity in China. Energy Econ. 2018, 74, 523–534. [Google Scholar] [CrossRef]
- Zhou, H.; Meng, A.; Long, Y.; Li, Q.; Zhang, Y. An Overview of Characteristics of Municipal Solid Waste Fuel in China: Physical, Chemical Composition and Heating Value. Renew. Sustain. Energy Rev. 2014, 36, 107–122. [Google Scholar] [CrossRef]
- National Development and Reform Commission. Notice on Issuing the “14th Five-Year Plan” for the Development of Urban Domestic Waste Classification and Treatment Facilities (No. 642). Available online: https://www.ndrc.gov.cn/xxgk/zcfb/tz/202105/t20210513_1279763_ext.html (accessed on 28 April 2025).
- Chakraborty, M.; Sharma, C.; Pandey, J.; Gupta, P.K. Assessment of Energy Generation Potentials of MSW in Delhi under Different Technological Options. Energy Convers. Manag. 2013, 75, 249–255. [Google Scholar] [CrossRef]
- CJ/T 20-1999 English Version, CJ/T 20-1999 Specific Equipments for Municipal Environmental Sanitation—Incineration Gasification Pyrolysis of Refuse (English Version)—Code of China. Available online: https://www.codeofchina.com/standard/CJT20-1999.html (accessed on 29 November 2024).
- Clean Winter Heating Plan for Northern China (2017–2021)|China Energy Portal|. Available online: https://chinaenergyportal.org/clean-winter-heating-plan-for-northern-china-2017-2021/ (accessed on 29 November 2024).
- Wang, Y.; Li, Y.; Huang, Y.; Yi, C.; Ren, J. Housing Wealth Inequality in China: An Urban-Rural Comparison. Cities 2020, 96, 102428. [Google Scholar] [CrossRef]


| Province | City/County | Design’s Heating Days () | Average Outdoor Temperature During the Design’s Heating Period (°C) | Outdoor Temperature During the Design’s Heating Period | Design Heating Load Index (kW) |
|---|---|---|---|---|---|
| Heilongjiang | Mudanjiang | 182 | −7.3 | −24 | 52.93 |
| Hegang | 186 | −7.3 | −24 | 52.93 | |
| Jiamusi | 192 | −7.3 | −24 | 52.93 |
| Province | City/County | Total Production of Major Crops (1000 tons) | Straw Available (1000 tons) | Biomass Potential (TJ) |
|---|---|---|---|---|
| Heilongjiang | Mudanjiang | 1612.2 | 2820.8 | 25,603.6 |
| Hegang | 4507.8 | 7481.3 | 68,574.7 | |
| Jiamusi | 10,865.9 | 16,287.7 | 137,407.1 | |
| Jiangsu | Changzhou | 535.9 | 699.8 | 5246.9 |
| Yancheng | 6965.1 | 9694.6 | 77,091.1 | |
| Lianyungang | 3672.4 | 5066.7 | 40,013.5 | |
| Guangdong | Zhanjiang | 11,607.5 | 2573.5 | 20,550.6 |
| Maoming | 1990.5 | 1629.2 | 12,084.3 | |
| Yangjiang | 765.5 | 1165.8 | 9357.3 |
| Province | City/County | Number of Rural Residents (10,000 Persons) | Per Capita Disposable Income (RMB) | Per Capita Rural Electricity Consumption (GJ) | Thermal Energy Consumption per Heating Area in the Winter Heating Period (GJ/m2) | Thermal Energy Consumption per Capita During the Heating Period (GJ/Person) |
|---|---|---|---|---|---|---|
| Heilongjiang | Mudanjiang | 108.2 | 20,045 | 1.81 | 0.42 | 29.71 |
| Hegang | 15.5 | 16,466 | 1.38 | 0.54 | 30.15 | |
| Jiamusi | 110.1 | 19,196 | 3.74 | 0.43 | 13.62 | |
| Guangdong | Zhanjiang | 376.43 | 20,693 | 2.18 | - | - |
| Maoming | 348.45 | 19,621 | 2.18 | - | - | |
| Yangjiang | 177.6 | 19,841 | 2.53 | - | - | |
| Jiangsu | Changzhou | 119.9 | 35,822 | 54.39 1 | - | - |
| Yancheng | 240.84 | 23,670 | 12.82 | - | - | |
| Lianyungang | 177 | 19,237 | 7.09 | - | - |
| Province | City | Biomass Potential (TJ) | WTE Potential (TJ) | Annual per Capita Energy Demand (GJ) | Straw Resource Density (t/km2) | Estimated Annual Energy Demand (10,000 Mwh) |
|---|---|---|---|---|---|---|
| Jiangsu | Changzhou | 5246.97 | 500.87 | 52.68 | 159.59 | 1843.75 |
| Yancheng | 77,091.08 | 1866.89 | 12.82 | 572.59 | 857.63 | |
| Lianyungang | 40,013.55 | 1372.03 | 7.09 | 665.28 | 348.58 | |
| Guangdong | Zhanjiang | 20,550.69 | 4531.69 | 2.03 | 203.91 | 214.37 |
| Maoming | 12,084.31 | 2701.04 | 2.18 | 84.95 | 211.00 | |
| Yangjiang | 9357.31 | 1419.14 | 1.55 | 146.34 | 51.37 | |
| Heilongjiang | Mudanjiang | 25,603.59 | 838.72 | 30.56 | 72.65 | 918.53 |
| Hegang | 68,574.73 | 120.15 | 33.96 | 510.15 | 146.20 | |
| Jiamusi | 137,407.09 | 1321.23 | 30.84 | 501.78 | 952.18 |
Disclaimer/Publisher’s Note: The statements, opinions and data contained in all publications are solely those of the individual author(s) and contributor(s) and not of MDPI and/or the editor(s). MDPI and/or the editor(s) disclaim responsibility for any injury to people or property resulting from any ideas, methods, instructions or products referred to in the content. |
© 2025 by the authors. Licensee MDPI, Basel, Switzerland. This article is an open access article distributed under the terms and conditions of the Creative Commons Attribution (CC BY) license (https://creativecommons.org/licenses/by/4.0/).
Share and Cite
Li, C.; Zhang, Y.; Ma, C. Socioeconomic Determinants of Biomass Energy Transition in China: A Multiregional Spatial Analysis for Sustainable Development. Energies 2025, 18, 2477. https://doi.org/10.3390/en18102477
Li C, Zhang Y, Ma C. Socioeconomic Determinants of Biomass Energy Transition in China: A Multiregional Spatial Analysis for Sustainable Development. Energies. 2025; 18(10):2477. https://doi.org/10.3390/en18102477
Chicago/Turabian StyleLi, Chanyun, Yifei Zhang, and Chenshuo Ma. 2025. "Socioeconomic Determinants of Biomass Energy Transition in China: A Multiregional Spatial Analysis for Sustainable Development" Energies 18, no. 10: 2477. https://doi.org/10.3390/en18102477
APA StyleLi, C., Zhang, Y., & Ma, C. (2025). Socioeconomic Determinants of Biomass Energy Transition in China: A Multiregional Spatial Analysis for Sustainable Development. Energies, 18(10), 2477. https://doi.org/10.3390/en18102477