
Distribution of Remaining Oil and Enhanced Oil Recovery Strategy for Carboniferous Buried-Hill Reservoirs in Junggar Basin

Abstract
1. Introduction
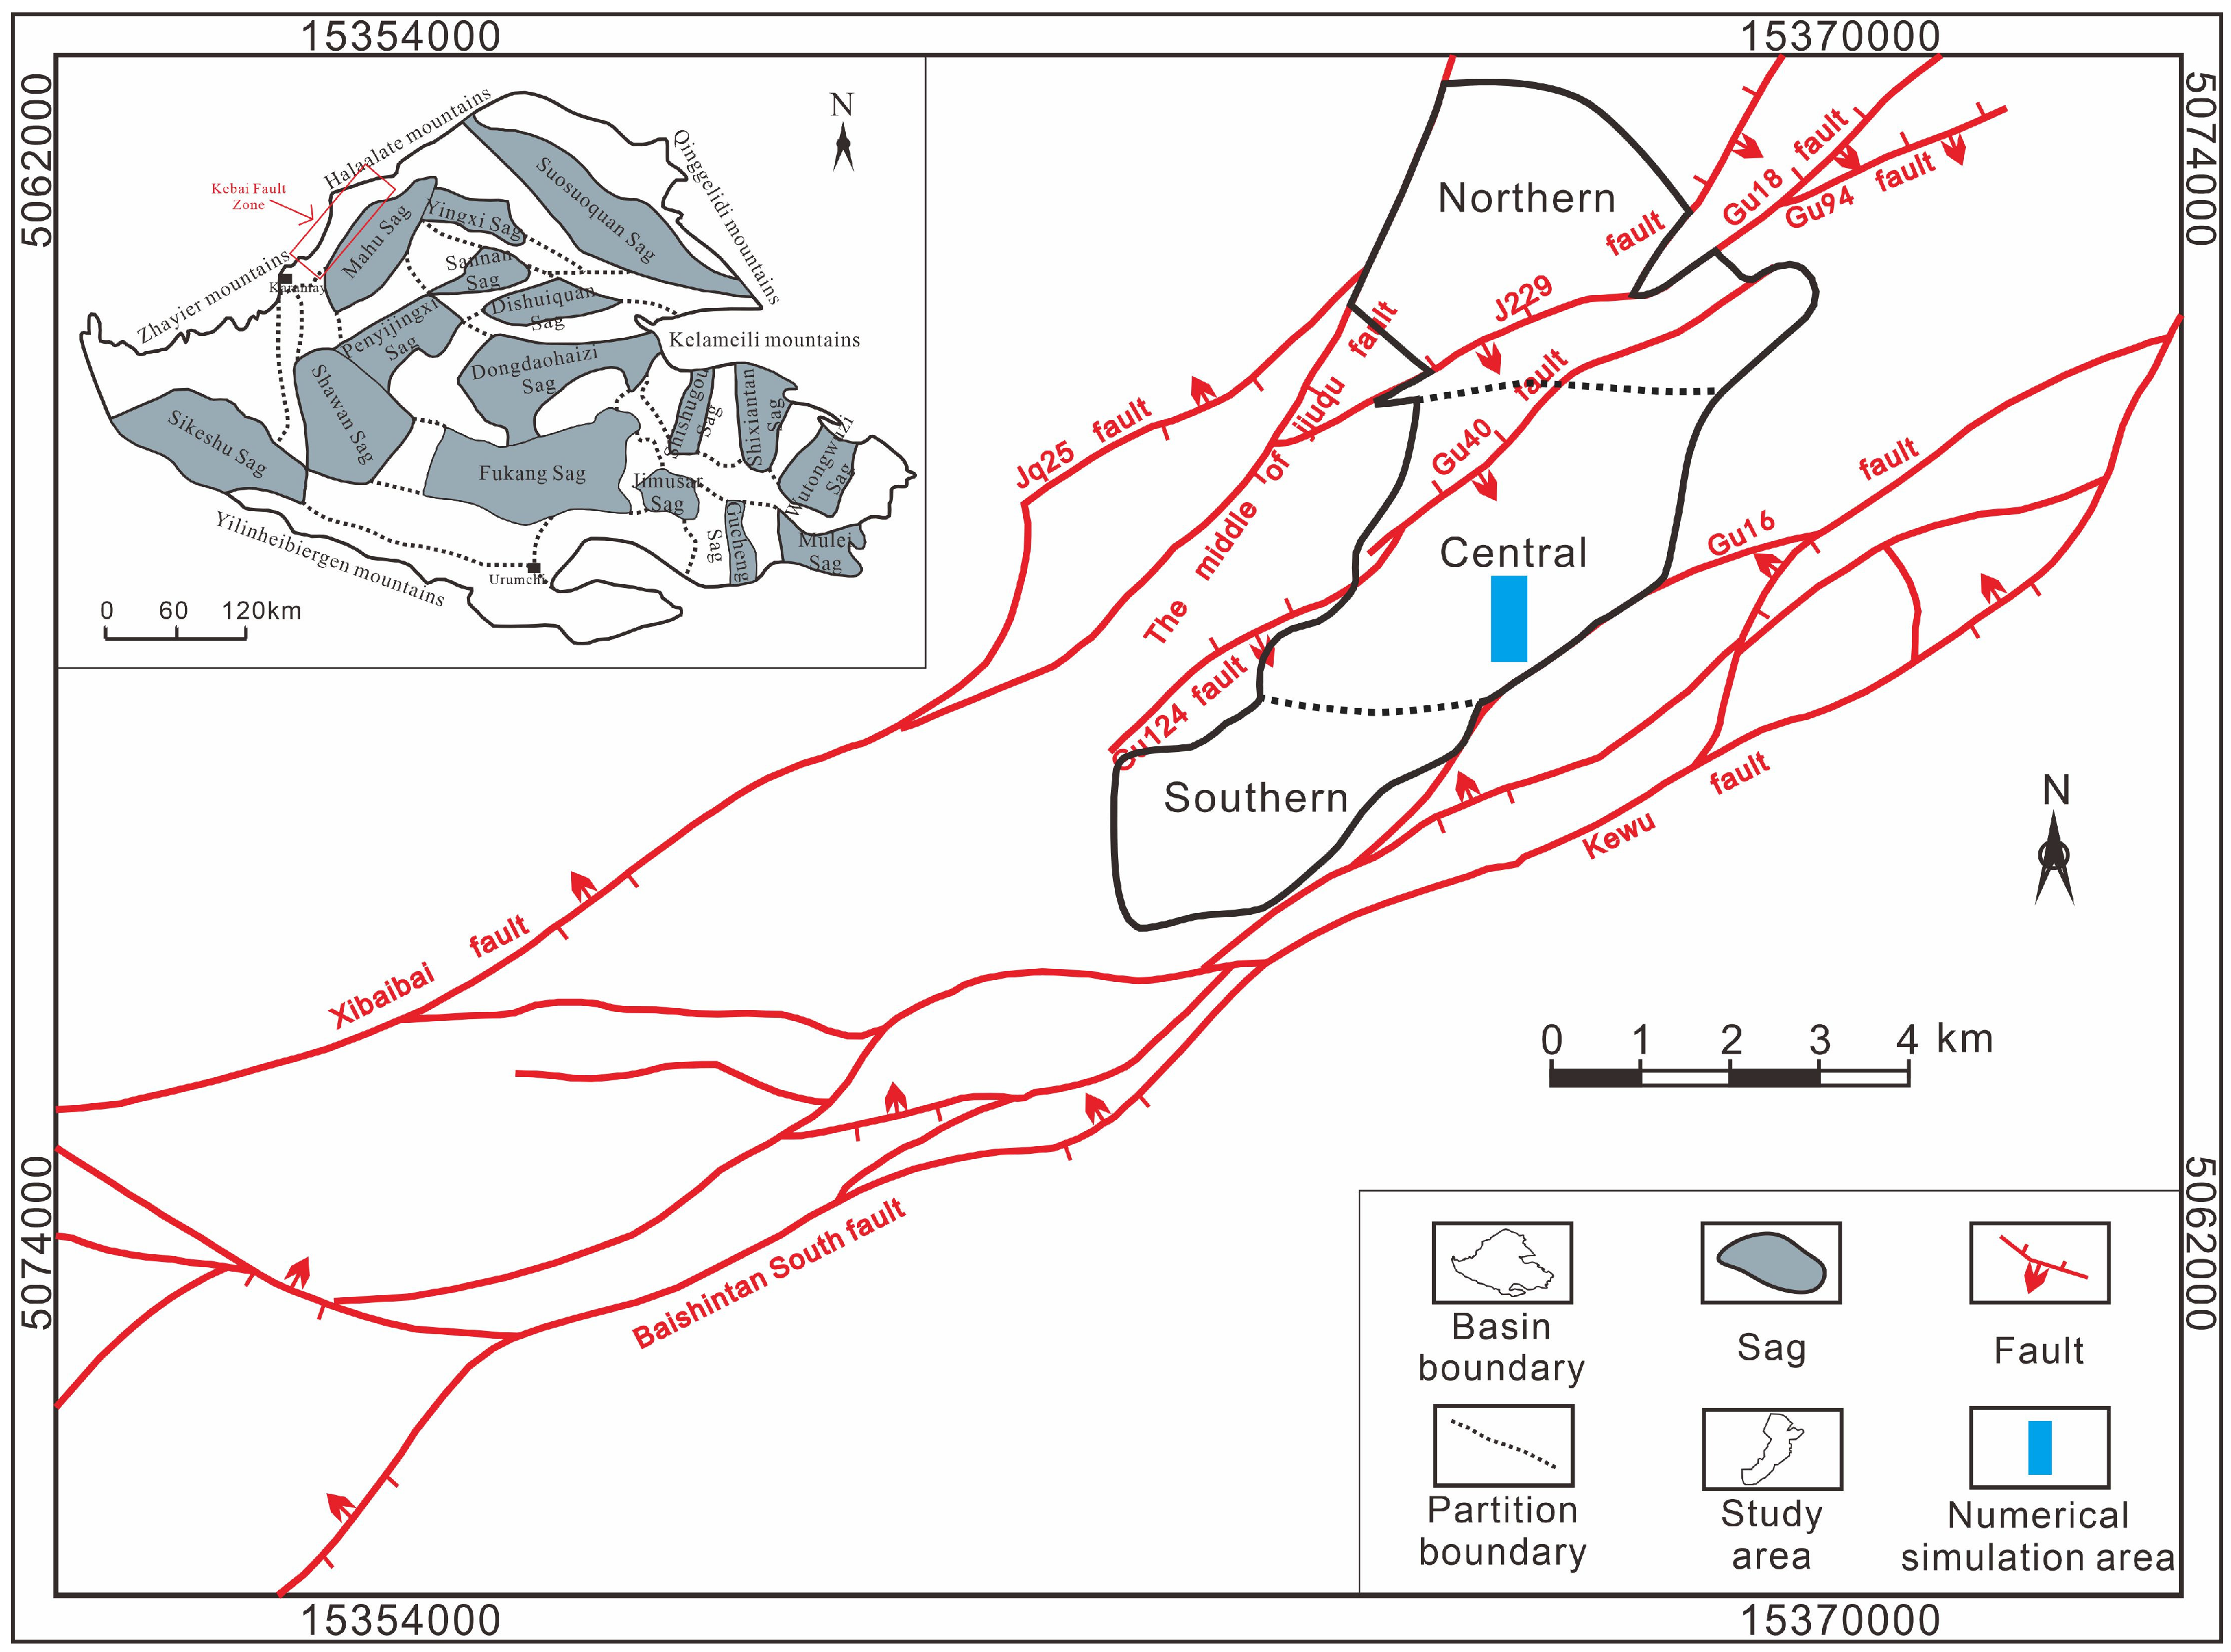
2. Geological Setting
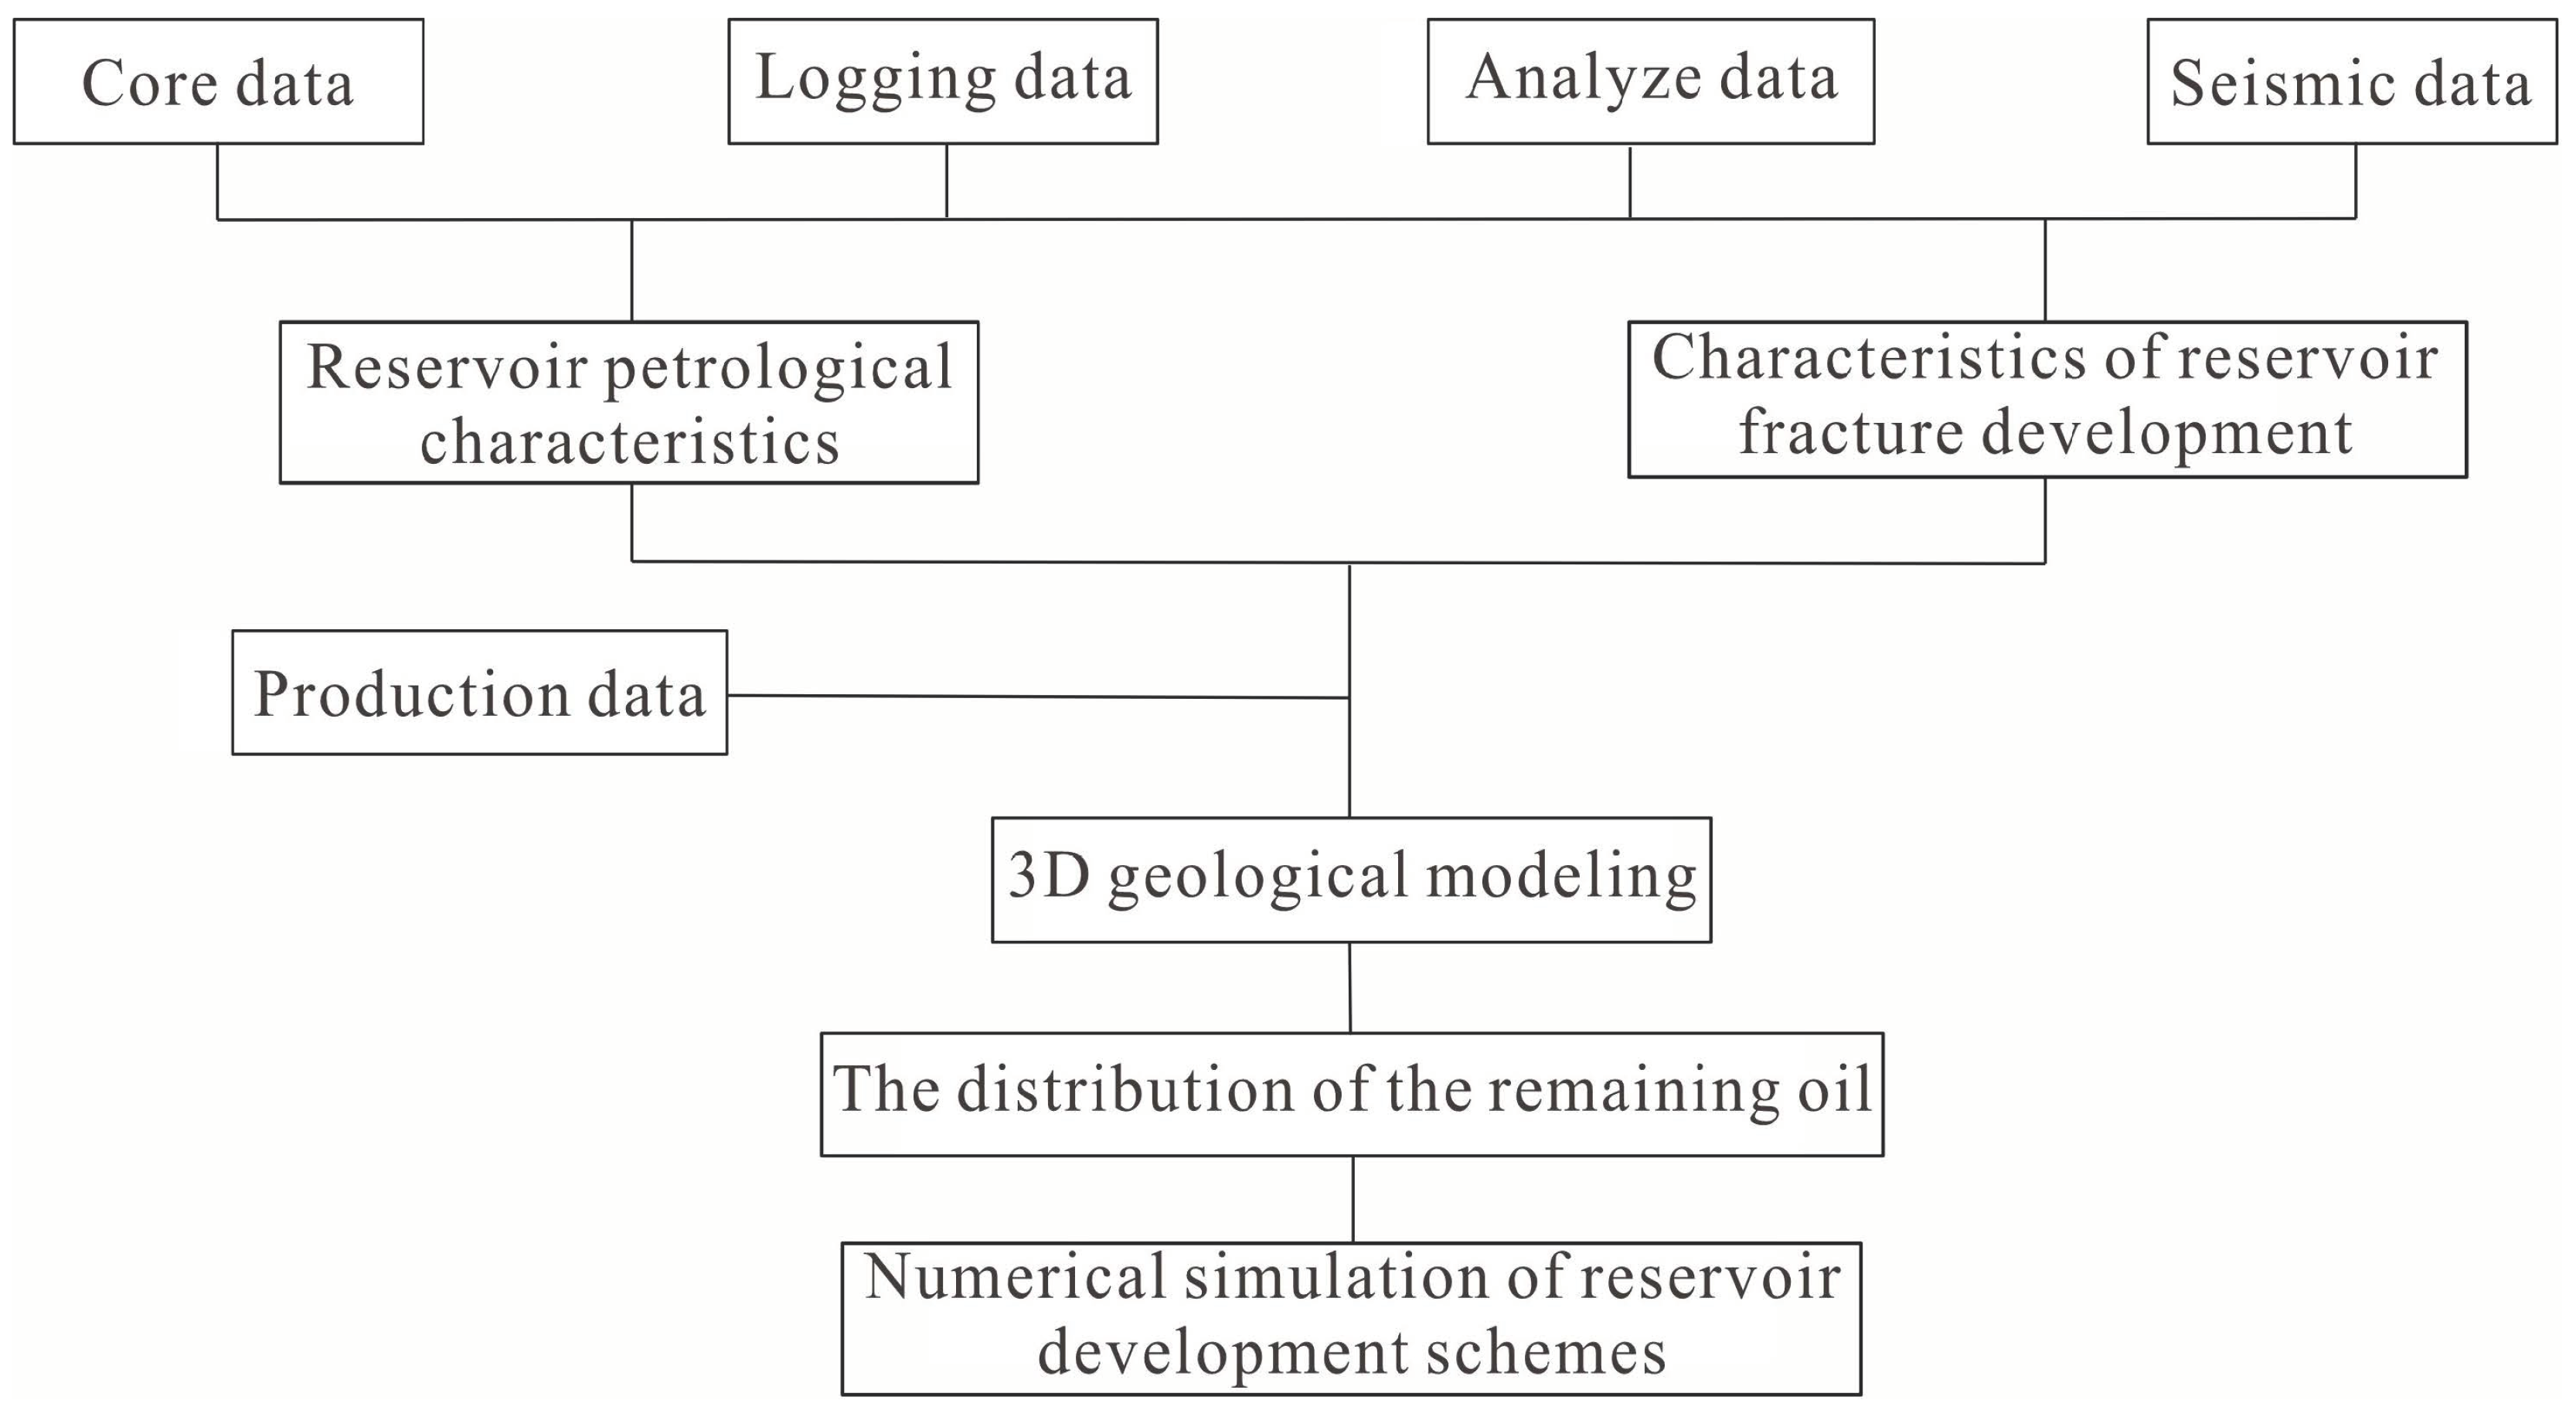
3. Data and Methodology
3.1. Reservoir Rock Characterization Study
3.2. Reservoir Properties and Oil-Bearing Characteristic Study
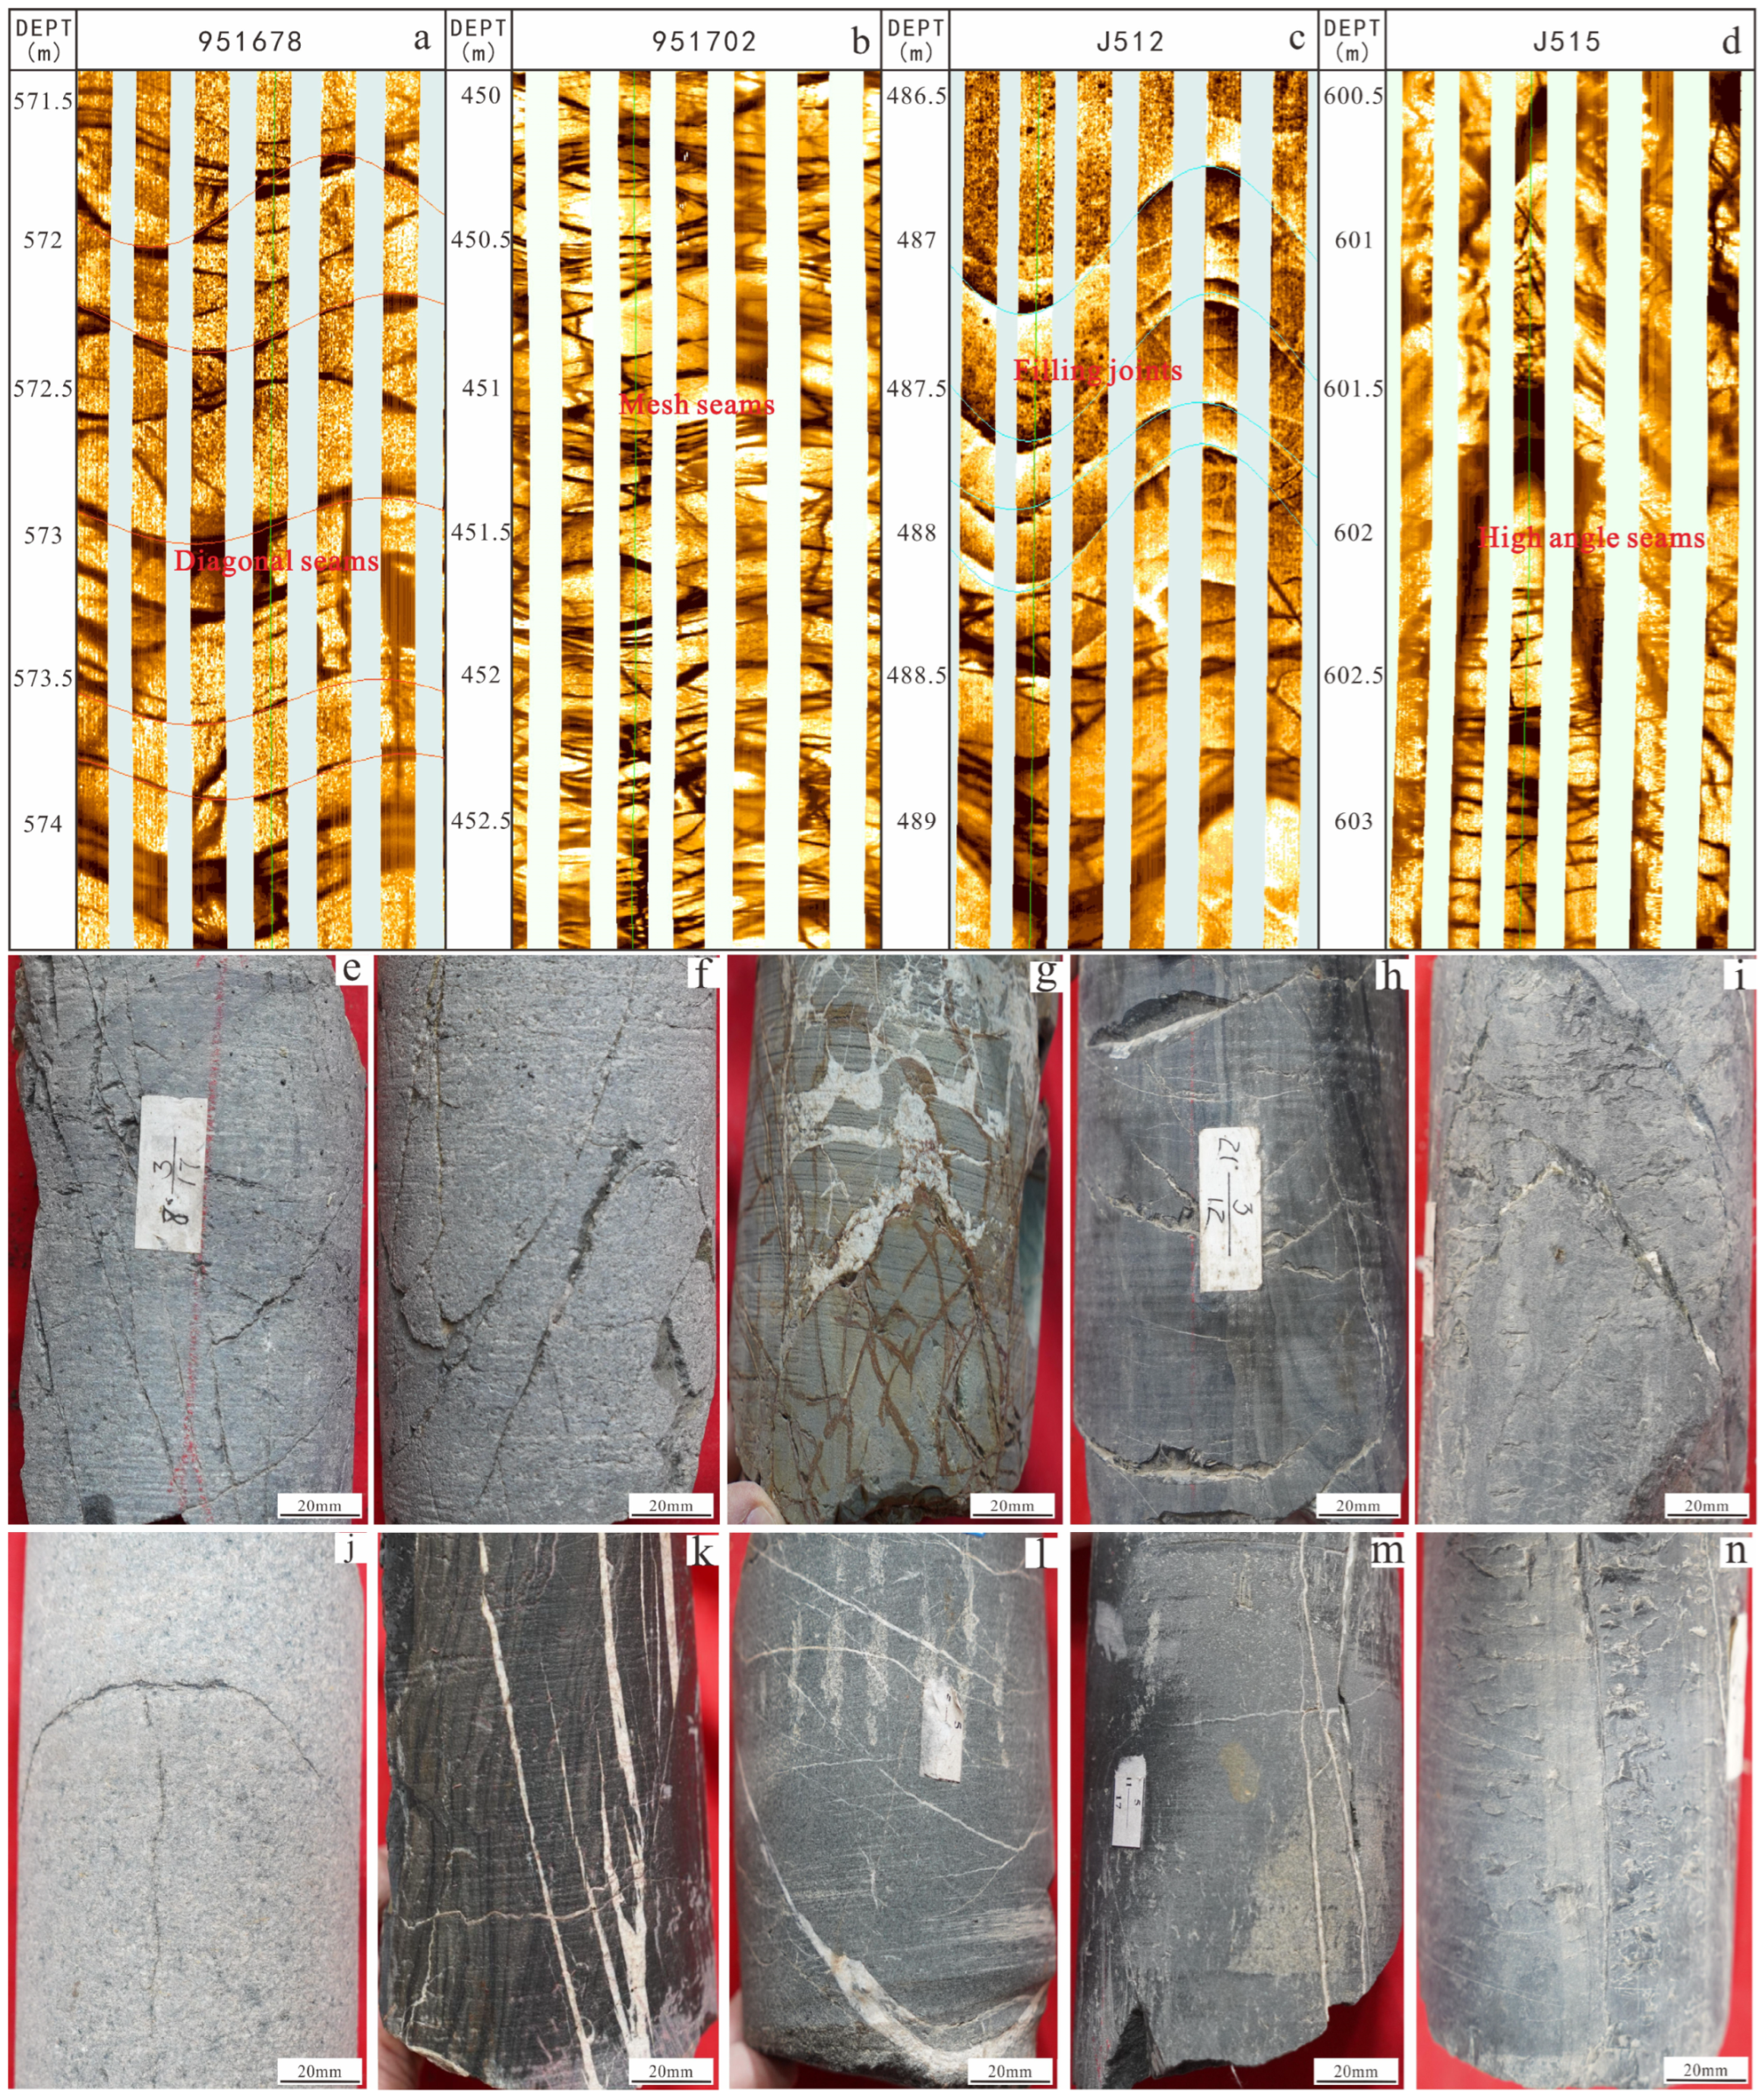
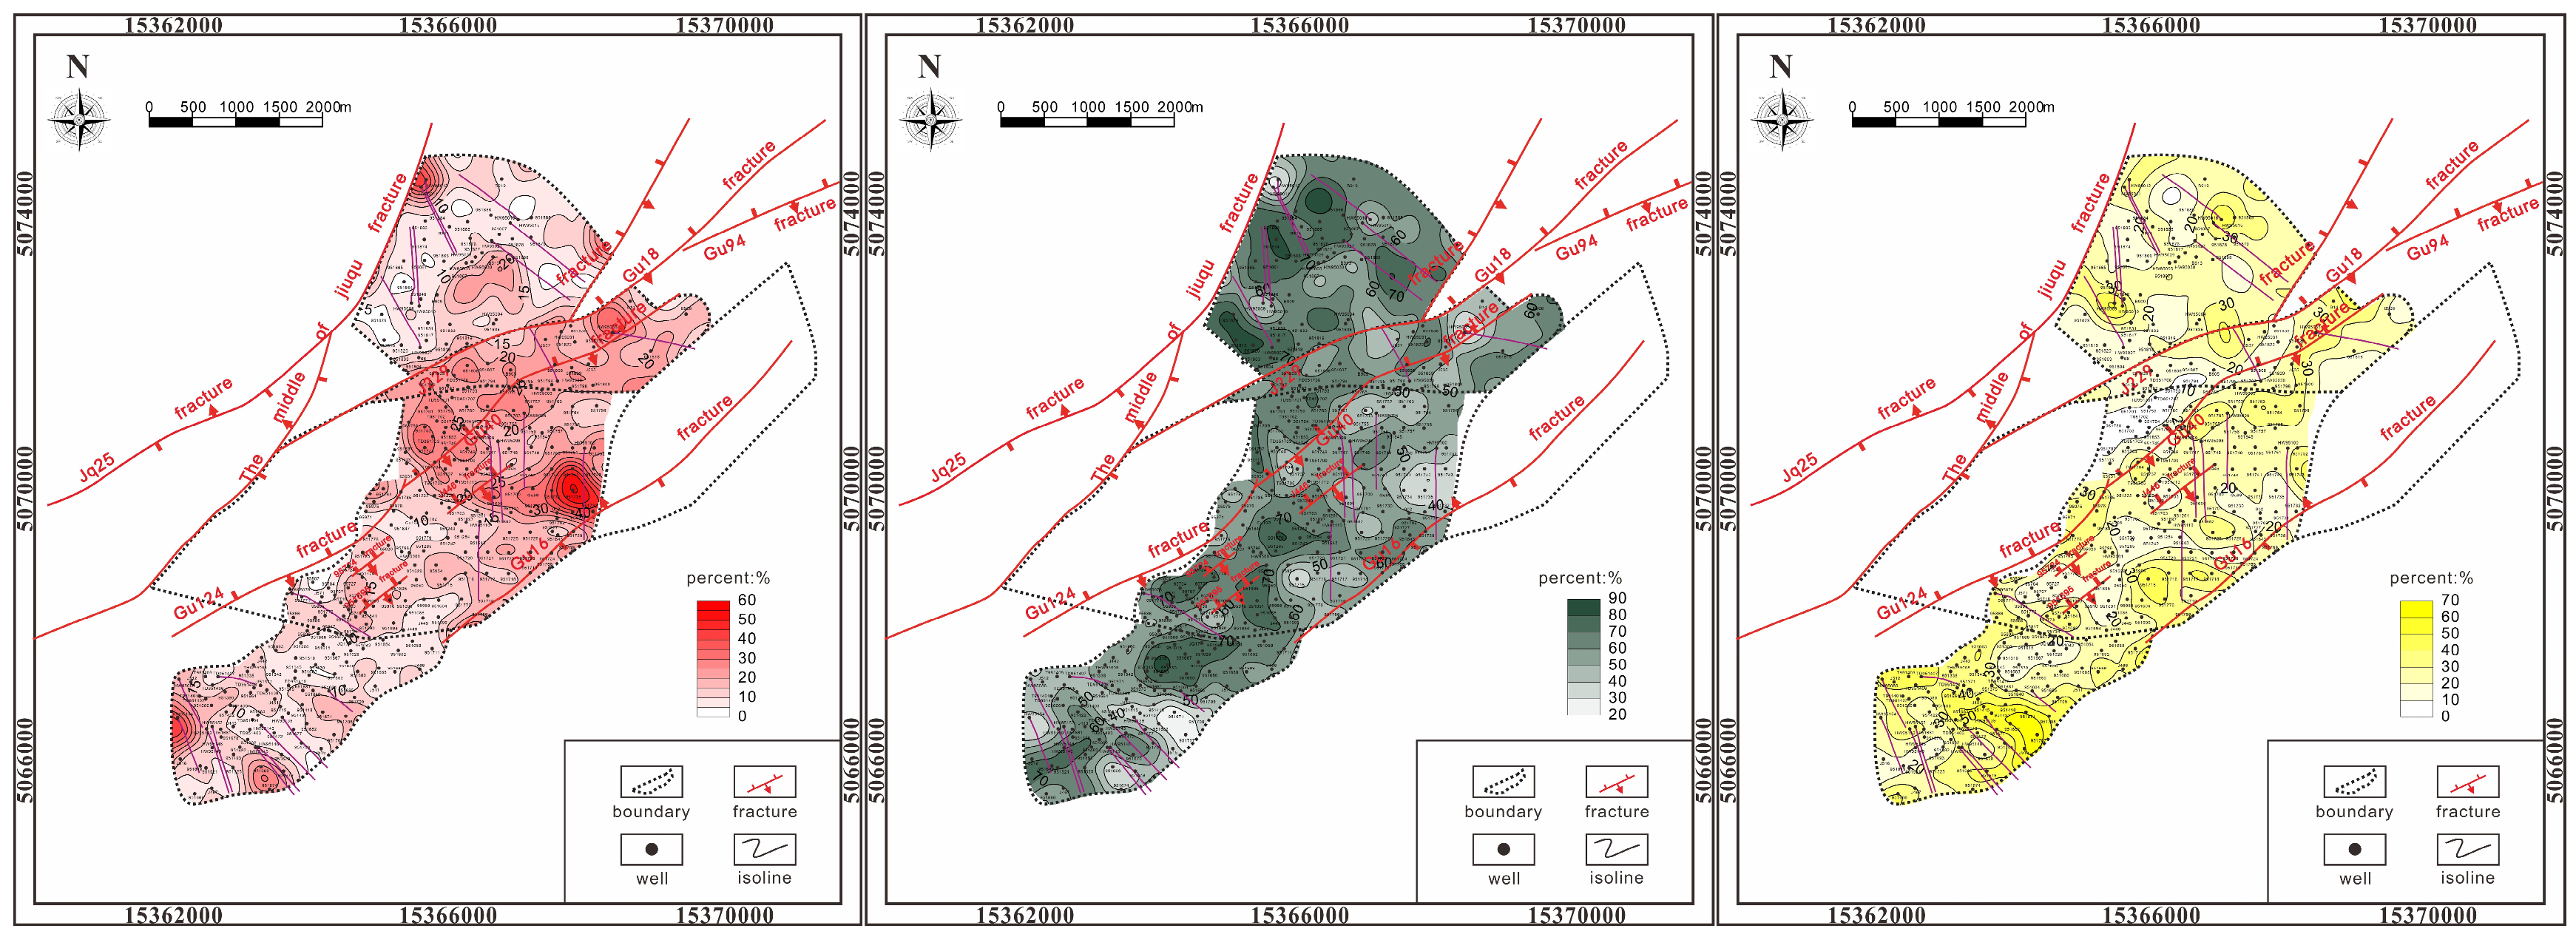
3.3. Fracture Study
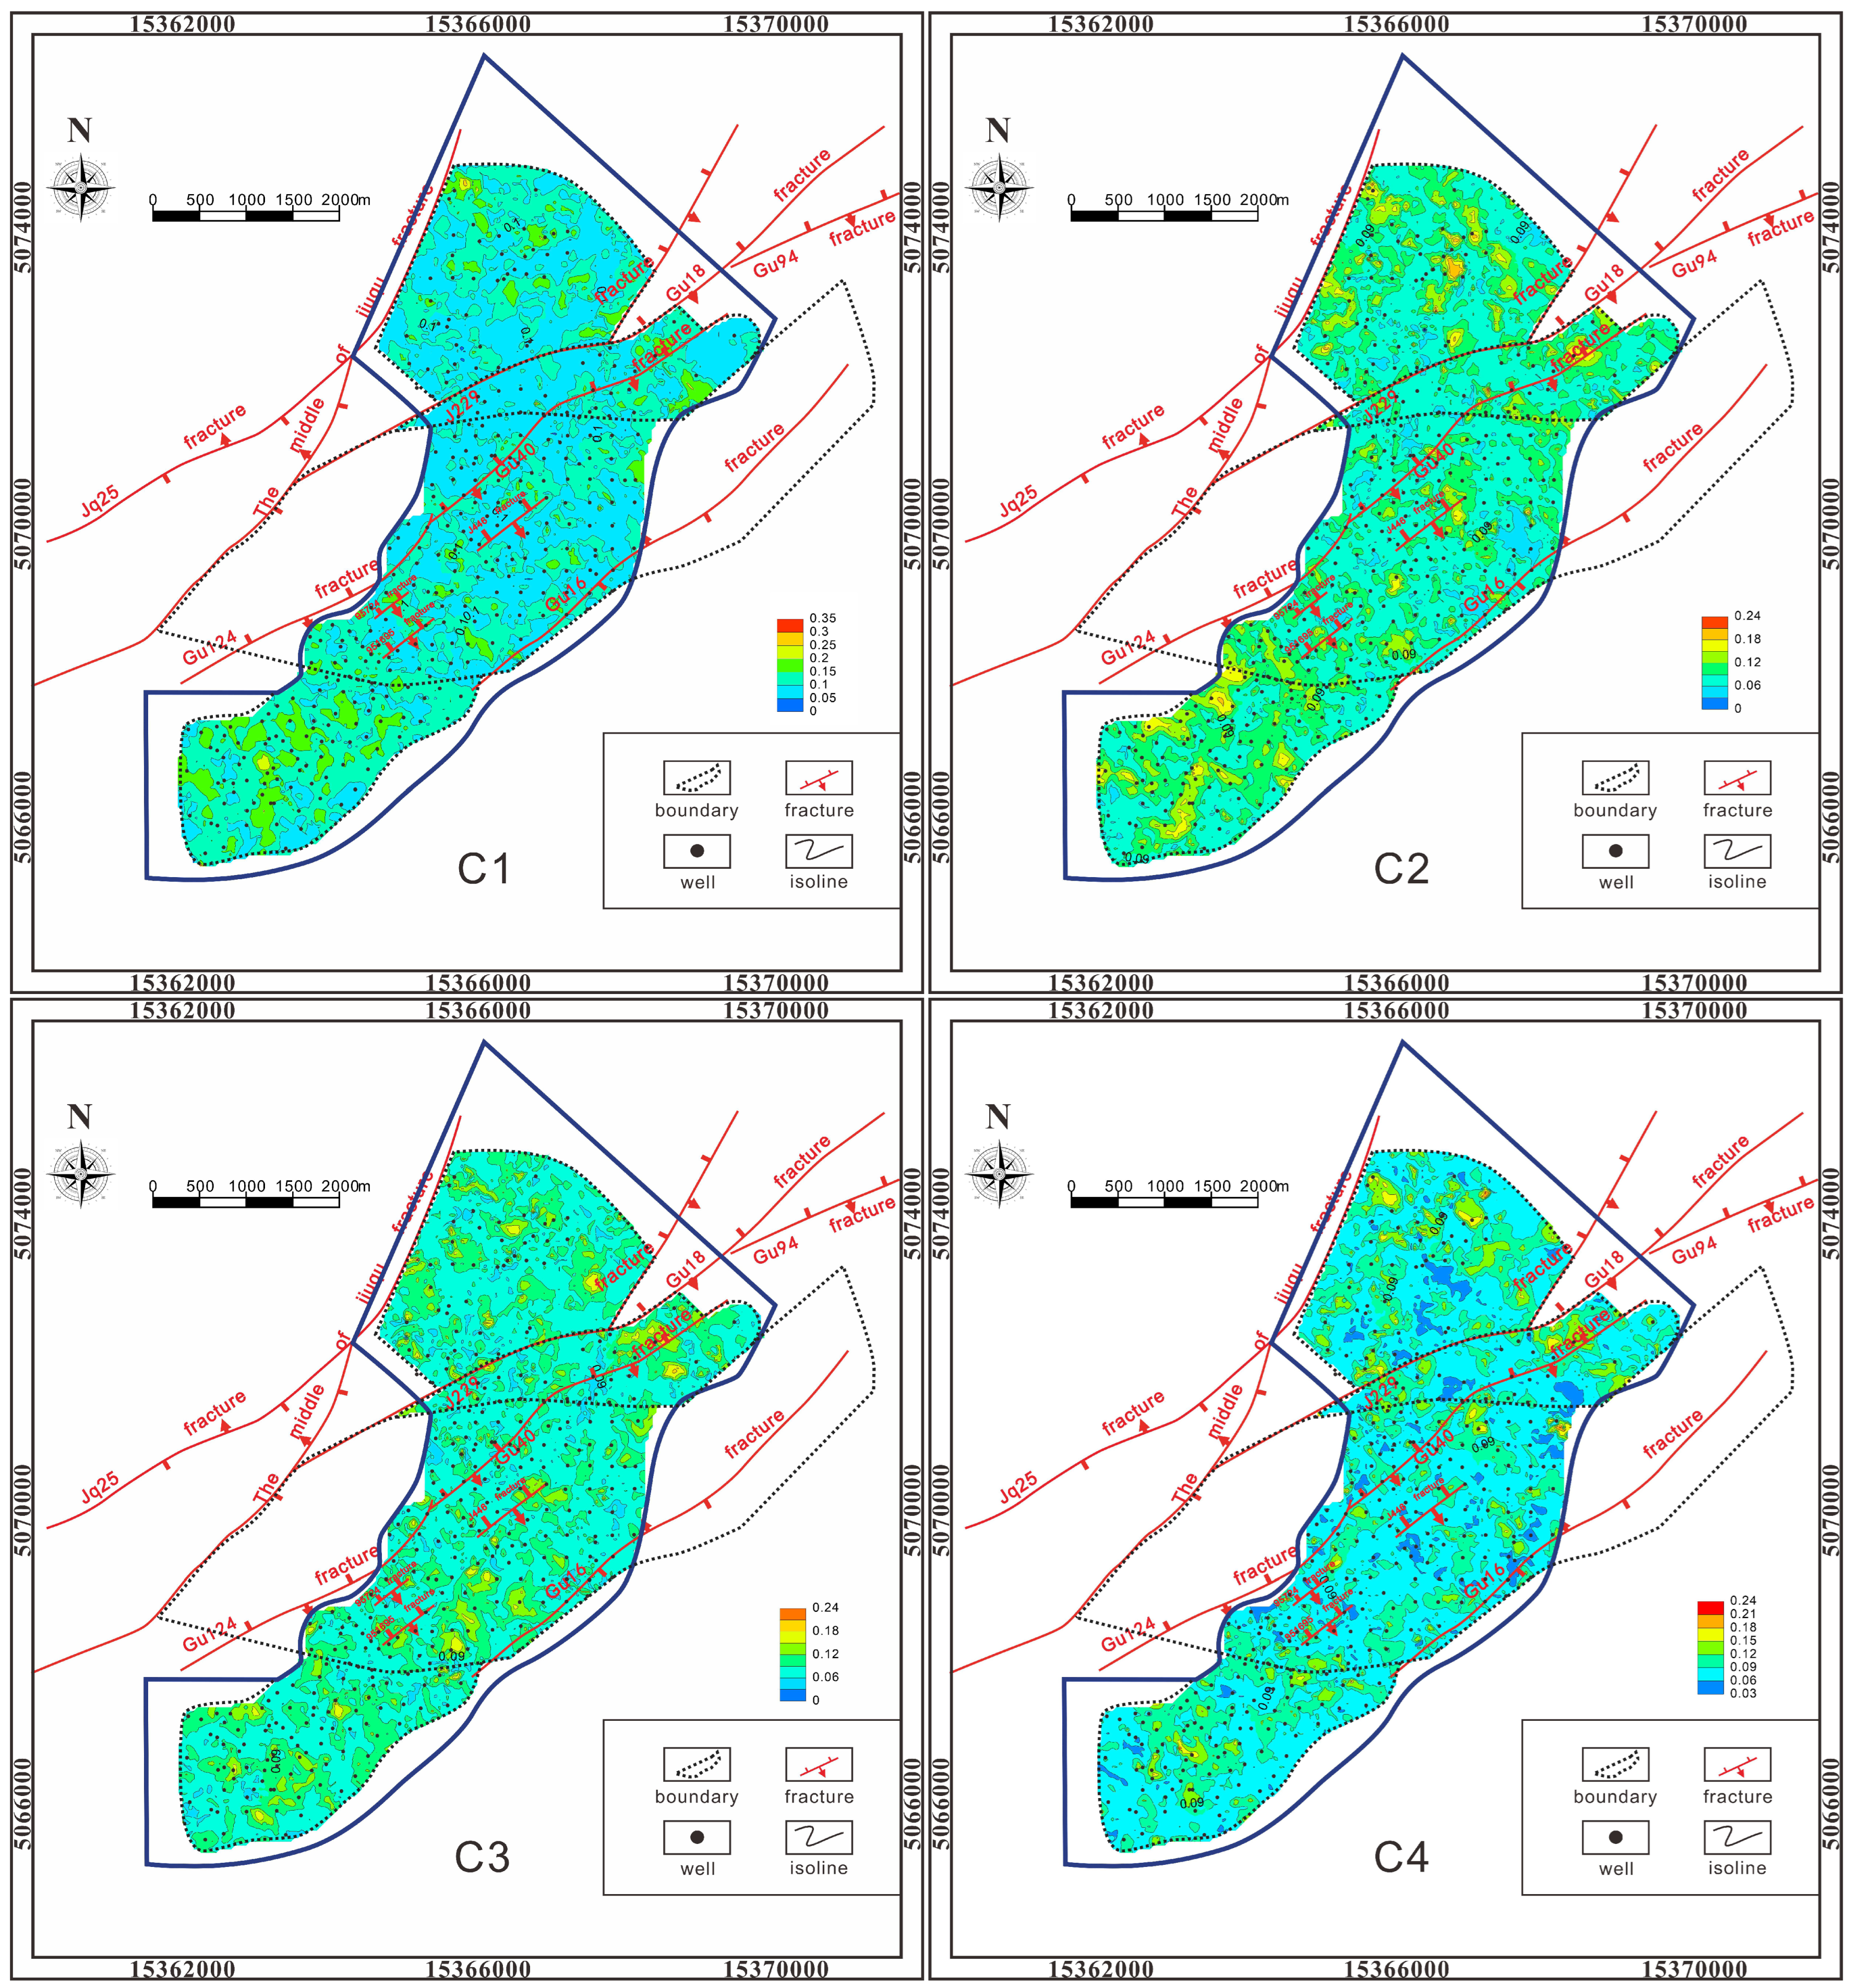
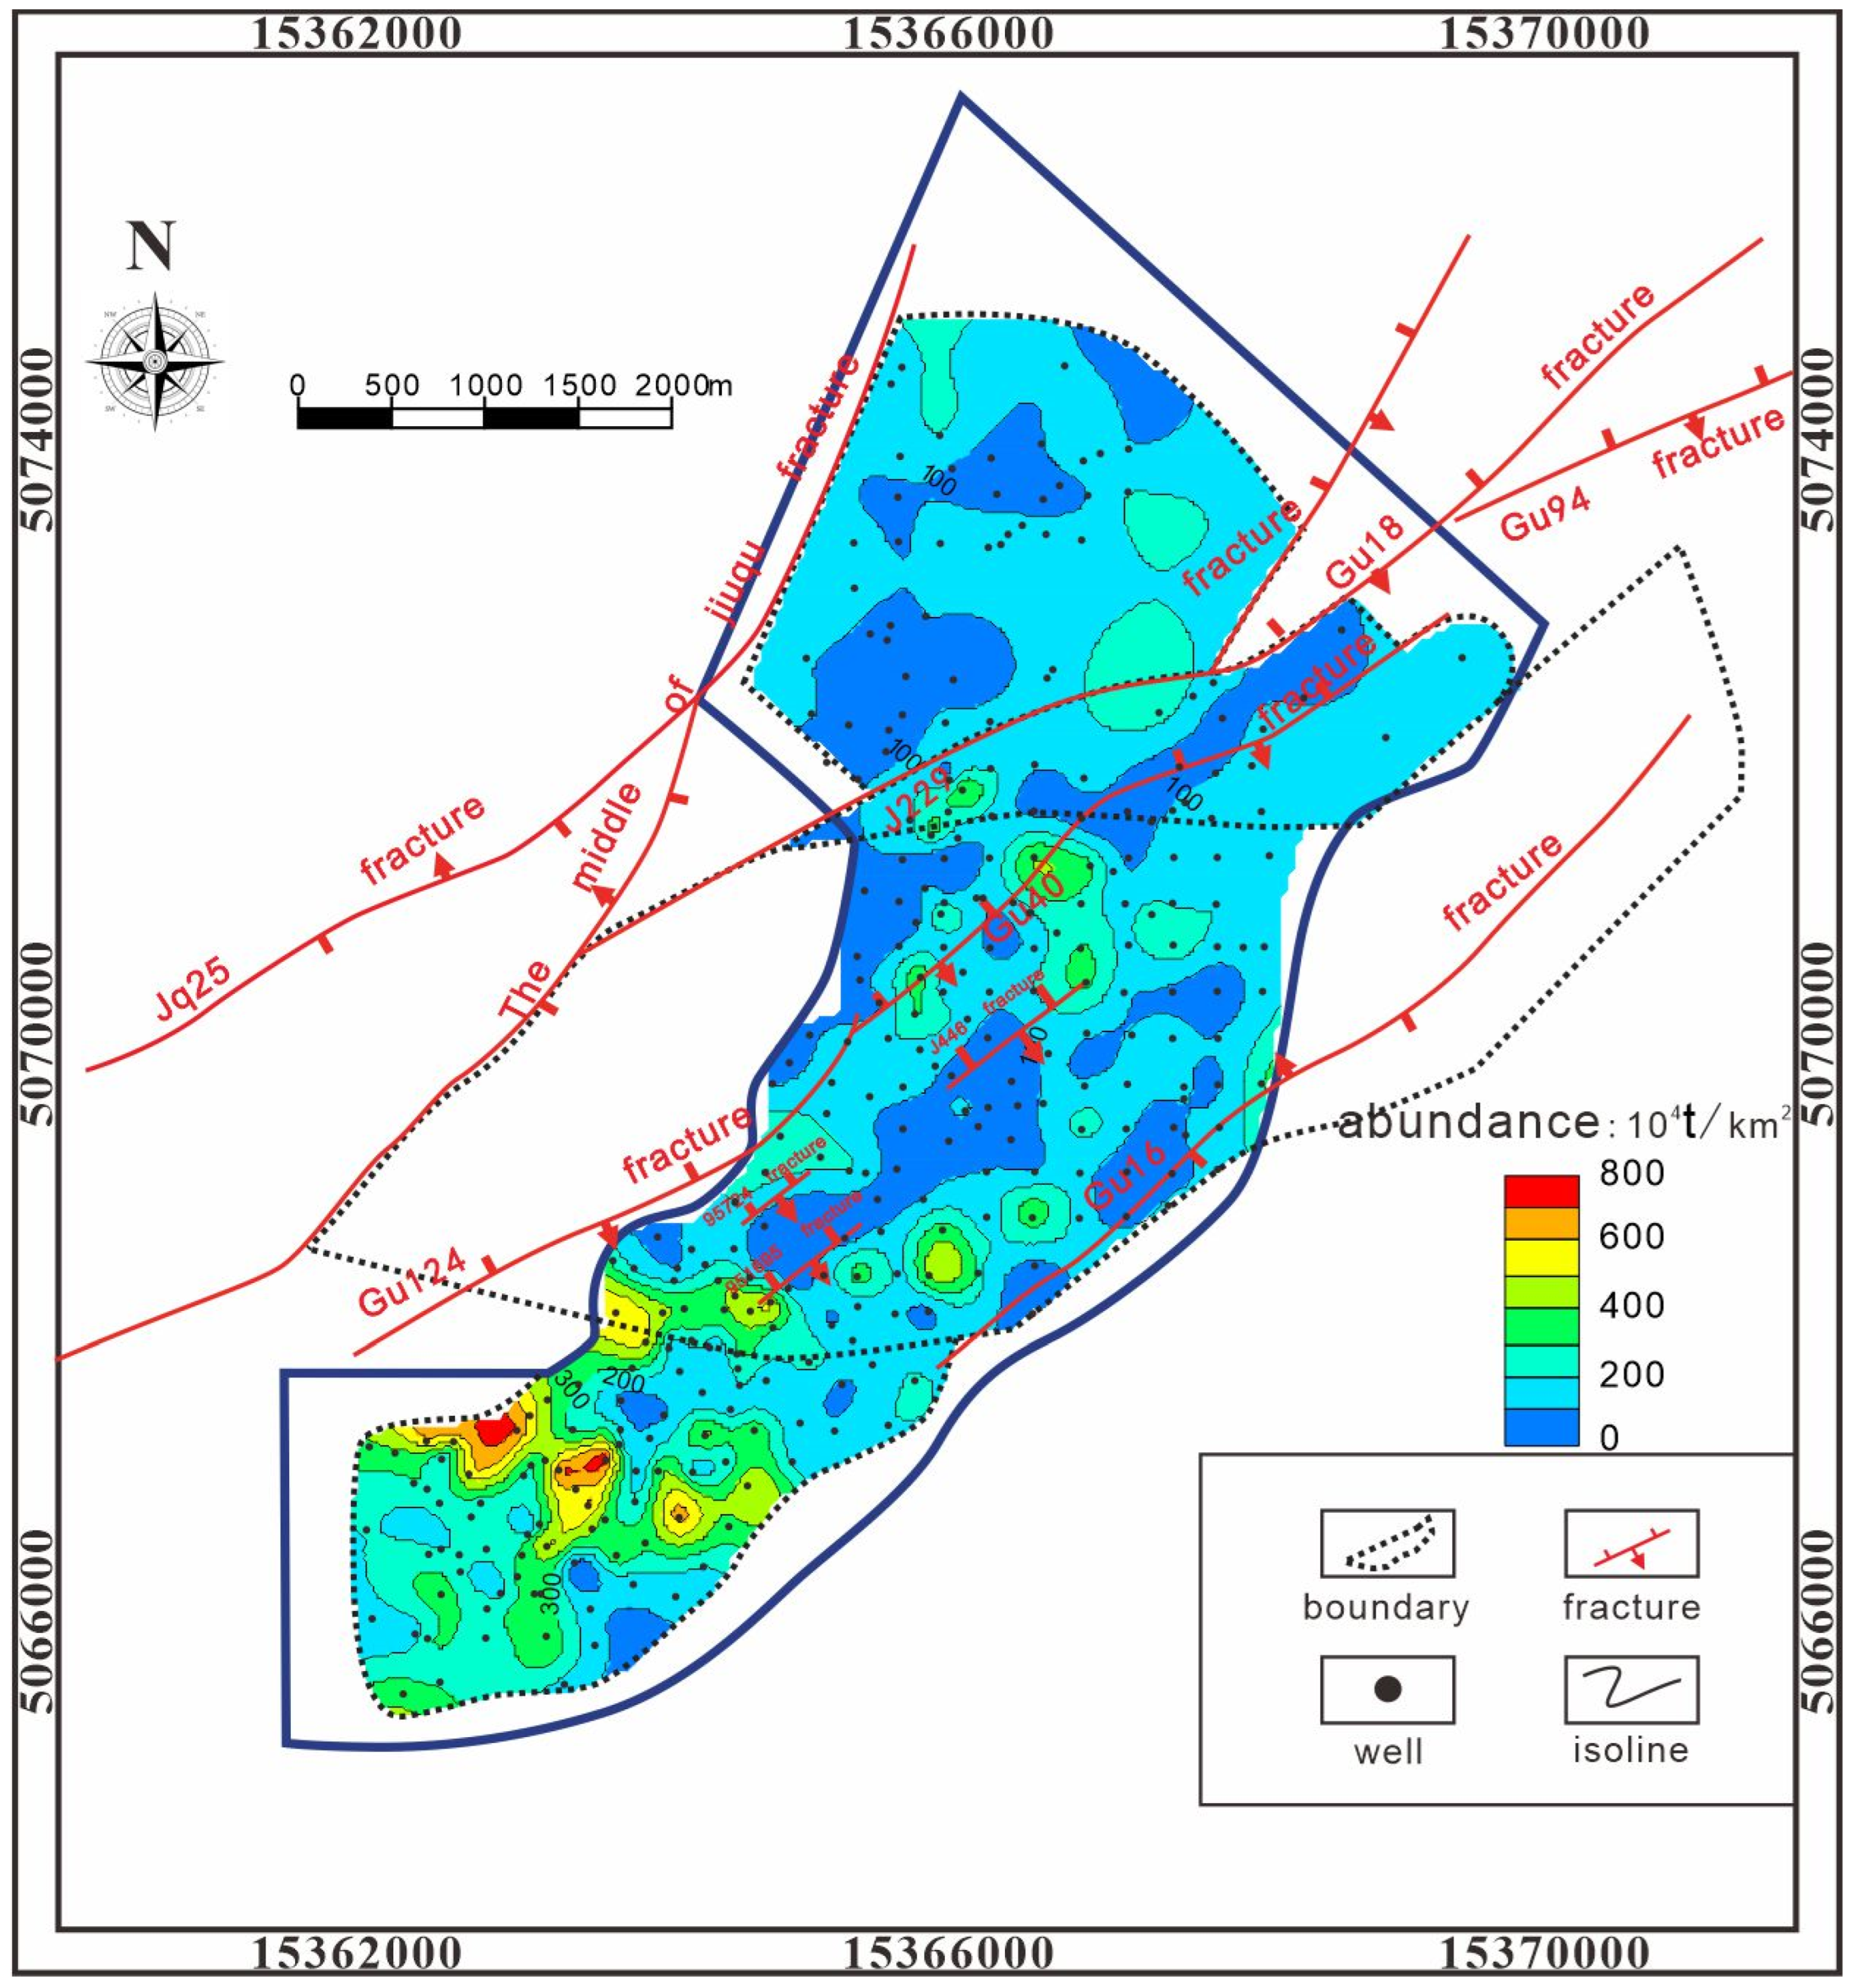
3.4. Distribution of Remaining Oil
3.5. Three-Dimensional Geological Model and Reservoir Numerical Model
4. Results
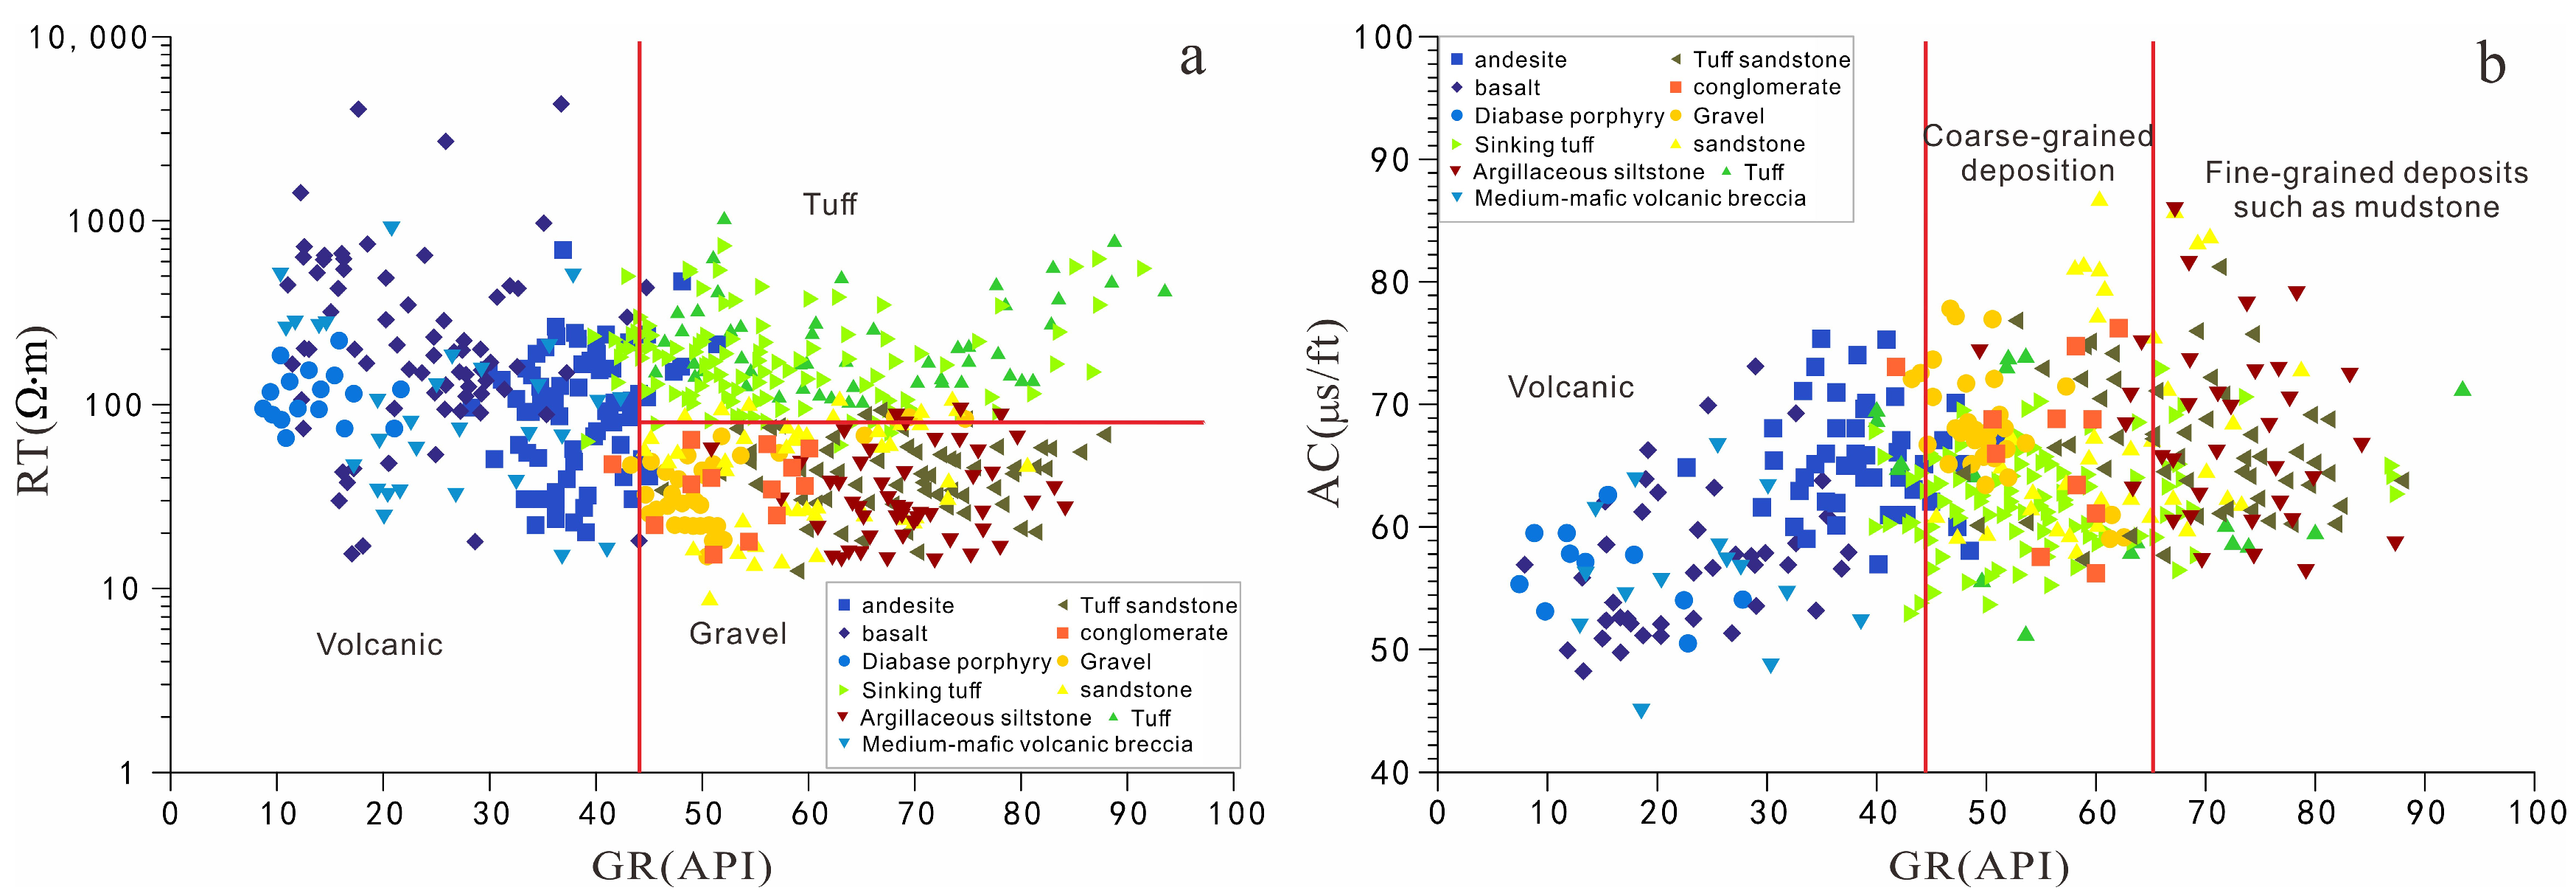
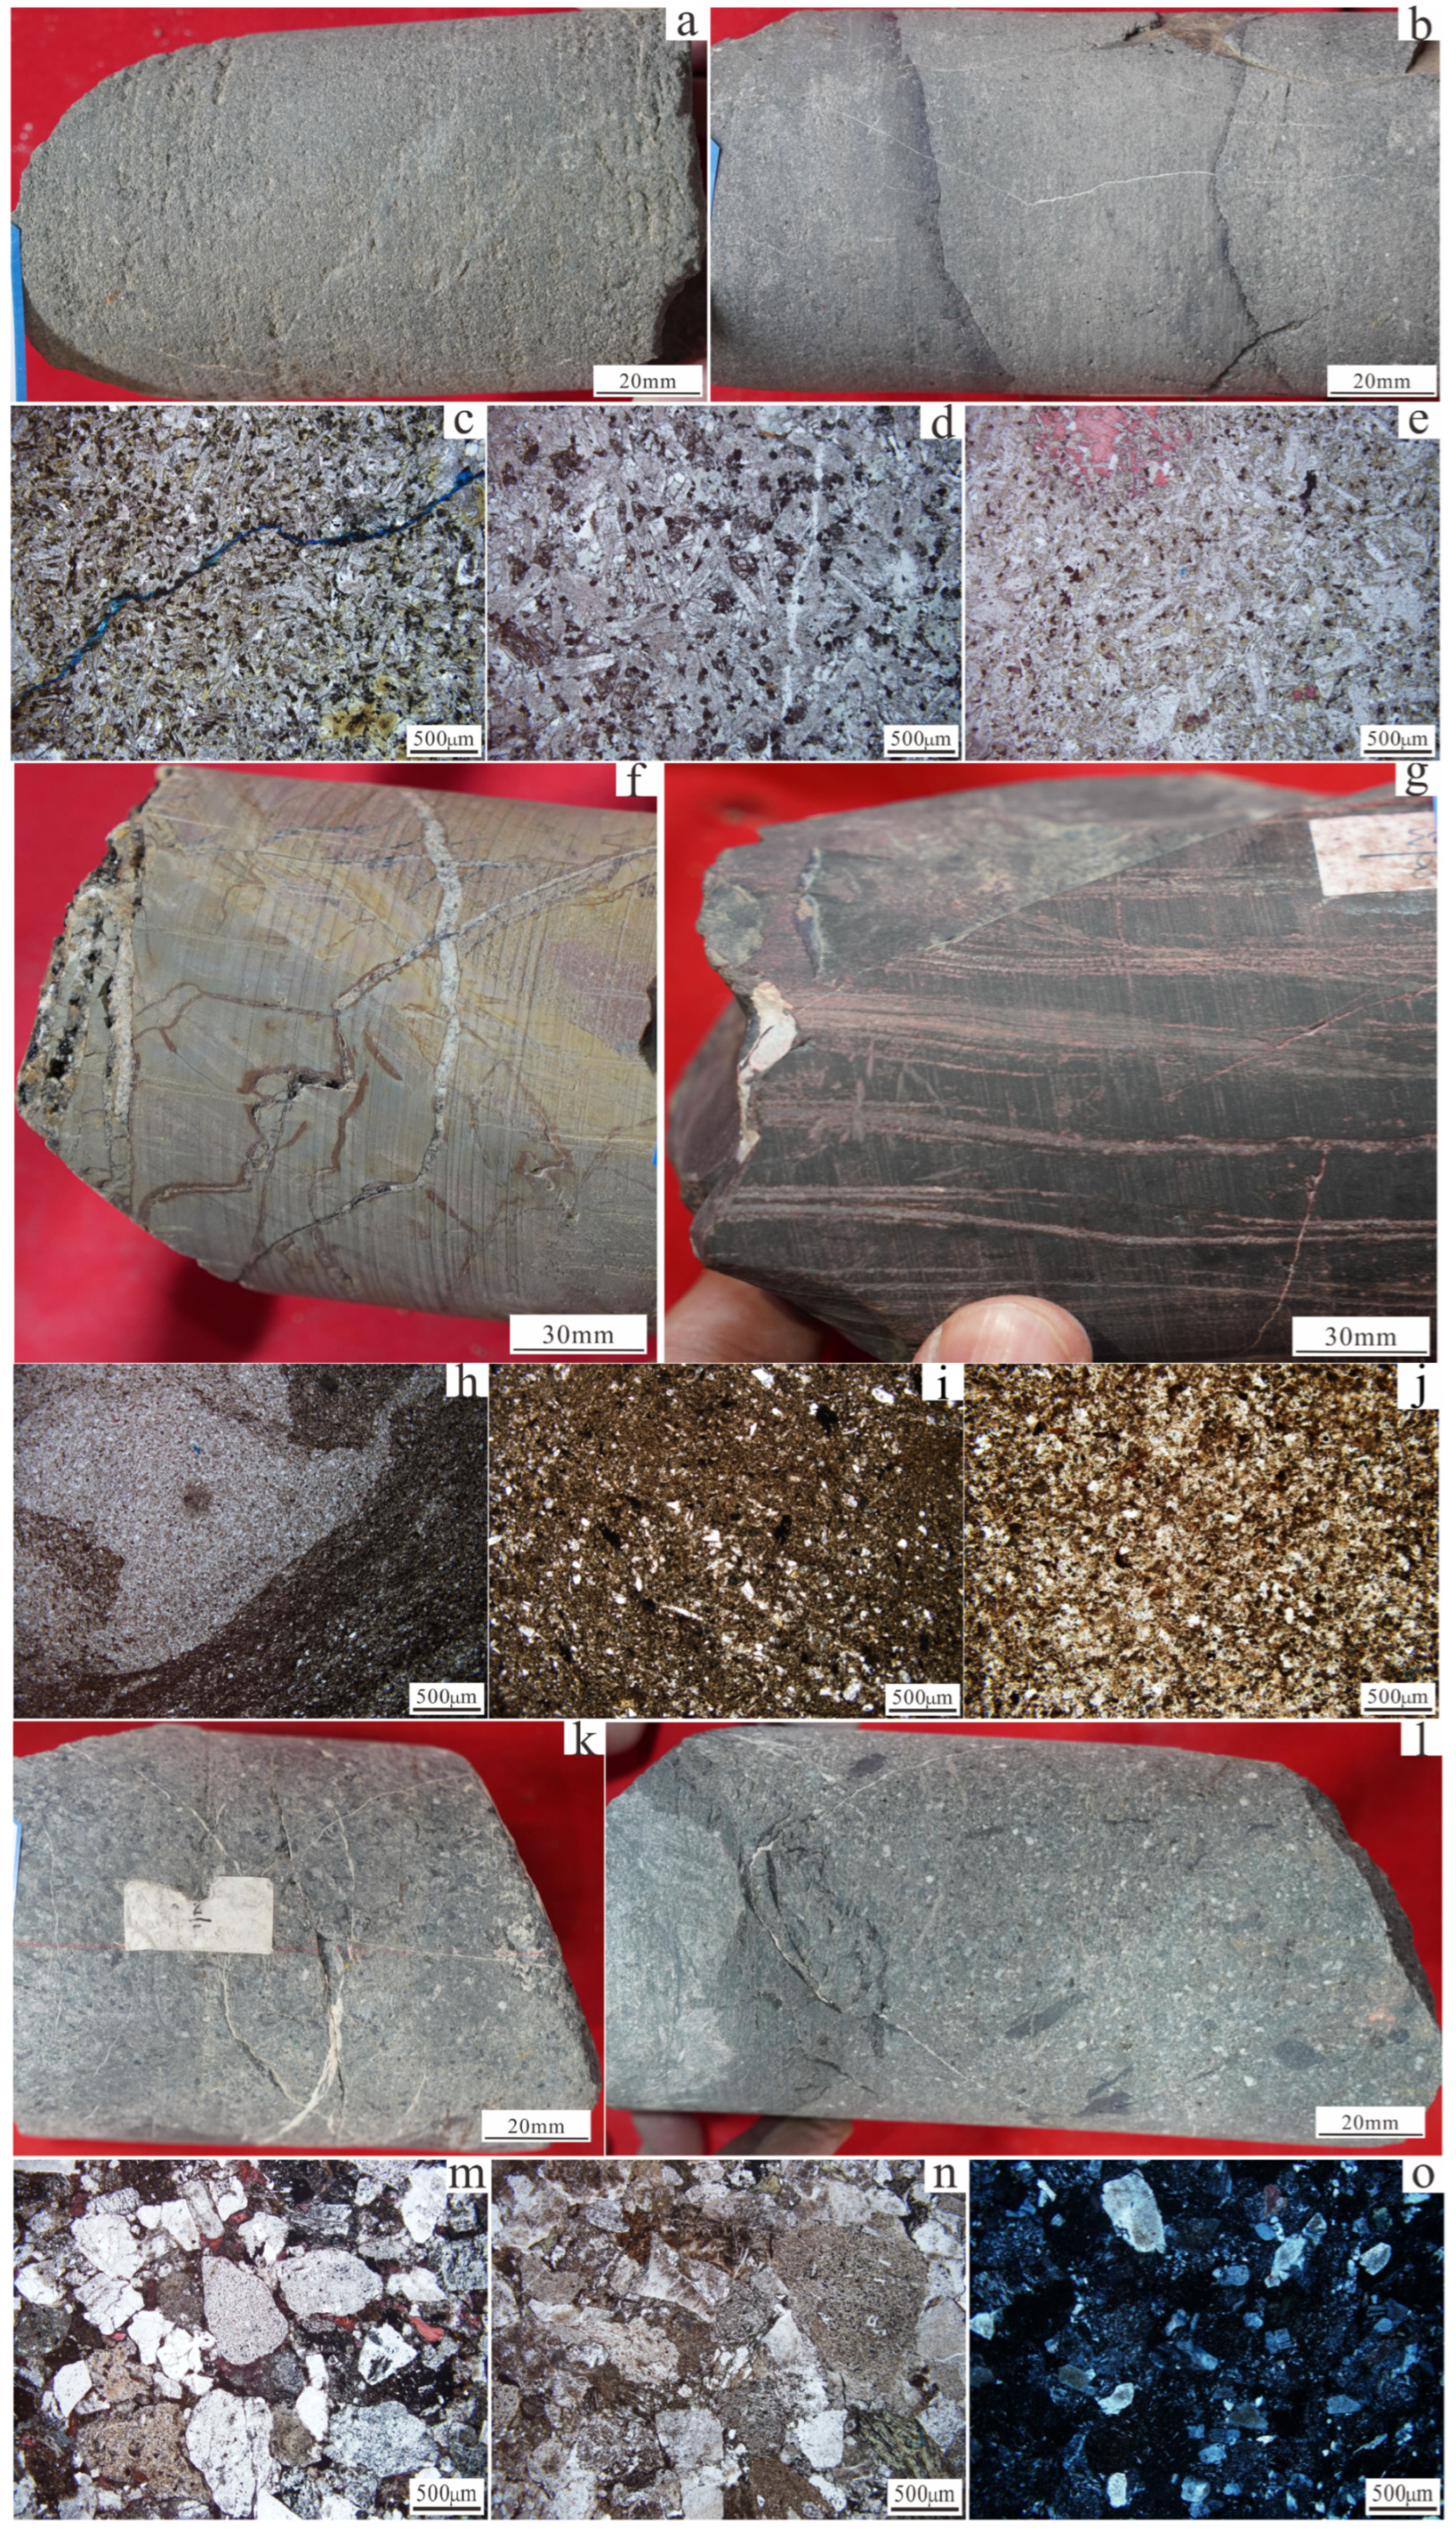
4.1. Lithology
4.2. Reservoir Properties and Oil-Bearing Characteristics
4.3. Fracture Characteristics and Identification
4.4. Three-Dimensional Geological Model and Remaining Oil Distribution
4.4.1. Three-Dimensional Geological Model
4.4.2. Remaining Oil Distribution
5. Discussion
6. Conclusions
Author Contributions
Funding
Data Availability Statement
Conflicts of Interest
References
- Li, Q.; Li, Q.; Cao, H.; Wu, J.; Wang, F.; Wang, Y. The crack propagation behaviour of CO2 fracturing fluid in unconventional low permeability reservoirs: Factor analysis and mechanism revelation. Processes 2025, 13, 159. [Google Scholar] [CrossRef]
- Li, Q.; Li, Q.; Wu, J.; Li, X.; Li, H.; Cheng, Y. Wellhead stability during development process of hydrate reservoir in the northern south China sea: Evolution and mechanism. Processes 2024, 13, 40. [Google Scholar] [CrossRef]
- Zou, C.N.; Zhao, W.Z.; Jia, C.Z.; Zhu, R.K.; Zhang, G.Y.; Zhao, X.; Yuan, X.J. Formation and distribution of volcanic hydrocarbon reservoirs in sedimentary basins of China. Pet. Explor. Dev. 2008, 35, 257–271. [Google Scholar] [CrossRef]
- Feng, Z.Q. Volcanic rocks as prolific gas reservoir: A case study from the Qingshen gas field in the Songliao Basin, NE China. J. Nat. Gas Sci. Eng. 2008, 25, 416–432. [Google Scholar] [CrossRef]
- Tang, H.F.; Tian, Z.W.; Gao, Y.F.; Dai, X.J. Review of volcanic reservoir geology in China. Earth-Sci. Rev. 2022, 232, 104158. [Google Scholar] [CrossRef]
- Tang, Y.J.; Chen, F.K.; Peng, P. Characteristics of volcanic rocks in Chinese basins and their relationship with oil-gas reservoir forming process. Acta Petrol. Sin. 2010, 26, 185–194. [Google Scholar]
- Wang, X.C.; Chen, W.T.; He, Y.; Liu, H.; Wang, W. Control of Paleocene volcanic edifice on favorable reservoirs: A case study of the southwestern Huizhou Sag, Pearl River Mouth Basin. Pet. Geol. Exp. 2022, 44, 466–475. [Google Scholar]
- Liu, X.N.; Jiang, Z.X.; Yuan, X.D.; Chen, C.; Wang, C. Influence of the Cretaceous fine-grained volcanic materials on shale oil/gas, Luanping Basin. Oil Gas Geol. 2022, 43, 390–406. [Google Scholar]
- Li, X.C.; Hou, Y.G.; Chen, Z.H.; He, S.; Liang, Y.; Liu, Y.; Song, Y.; Yu, R. Influence of Permian basaltic volcanic activity on coal-bearing shale reservoirs, Southern Guizhou Depression. Pet. Geol. Exp. 2021, 43, 620–627. [Google Scholar]
- Pan, H.; Li, X.S.; Qian, C.C.; Song, J.Q.; Luo, G.X. Characteristic and accumulation patterns of Carboniferous inside-type volcanic reservoir in Ke-bai Fault Zone of Junggar Basin. J. Northeast Pet. Univ. 2022, 46, 62–75. [Google Scholar]
- Xia, L.; Zhao, Y.W.; Yu, C.L.; Xi, K.L.; Ablimiti, Y.; Liu, H.L.; Chen, L. Key factors controlling deep Carboniferous volcanic reservoirs in the east slope of Mahu Sag, Junggar Basin, NW China. J. Pet. Sci. Eng. 2023, 220, 111223. [Google Scholar] [CrossRef]
- Sun, X.M.; Cao, S.Y.; Pan, X.; Hou, X.Y.; Gao, H.; Li, J.B. Characteristics and prediction of weathered volcanic rock reservoirs: A case study of Carboniferous rocks in Zhongguai paleouplift of Junggar Basin, China. J. AAPG 2018, 6, T431–T447. [Google Scholar] [CrossRef]
- Shi, J.A.; Sun, G.Q.; Zhang, S.C.; Guo, H.; Zhang, S.Y.; Du, S.K. Reservoir characteristics and control factors of Carboniferous volcanic gas reservoirs in the Dixi area of Junggar Basin, China. J. Nat. Gas Geosci. 2017, 2, 43–55. [Google Scholar] [CrossRef]
- Wang, Y.; Yang, R.C.; Song, M.S.; Lenhardt, N.; Wang, X.Z.; Zhang, X.C.; Yang, S.C.; Wang, J.; Cao, H.F. Characteristics, controls and geological models of hydrocarbon accumulation in the Carboniferous volcanic reservoirs of the Chunfeng Oilfield, Junggar Basin, northwestern China. Mar. Pet. Geol. 2018, 94, 65–79. [Google Scholar] [CrossRef]
- Zou, C.N.; Zhao, W.Z.; Jia, C.Z.; Zhu, R.K.; Zhang, Y.G.; Zhao, X.; Yuan, X.J. Geological features and exploration potential of Carboniferous hydrocarbon accumulations in the Junggar Basin, NW China. Pet. Explor. Dev. 2010, 37, 523–530. [Google Scholar]
- Yang, H.B.; Xiang, B.L.; Bao, H.J.; Pang, H. Hydrocarbon Resources Potential in Carboniferous Igneous Inner Reservoirs in Ludong Area of Junggar Basin. Xinjiang Pet. Geol. 2014, 35, 1–4. [Google Scholar]
- Huang, Z.T.; Li, C.T.; Wang, B.; Qiao, X.; Fu, Y.; Yan, B. Enhanced Recovery in Middle and Late Stages of Depletion Development of Condensate Gas Reservoirs with Oil Ring. Xinjiang Pet. Geol. 2024, 45, 470–474. [Google Scholar]
- Alkhasawneh, M.S.; Ngah, U.K.; Tay, L.T.; Isa, N.A.M.; Al-Batah, M.S. Modeling and Testing Landslide Hazard Using Decision Tree. J. Appl. Math. 2014, 2014, 929761–929768. [Google Scholar] [CrossRef]
- Xue, L.; Liu, Y.; Xiong, Y.; Liu, Y.; Cui, X.; Lei, G. A data-driven shale gas production forecasting method based on the multi-objective random forest regression. J. Pet. Sci. Eng. 2021, 196, 107801. [Google Scholar] [CrossRef]
- Shang, Y.Z.; Zhang, Z.H.; Xu, D.N.; Zhao, W.W.; Chen, H.Y.; Han, H.B. Lithologic logging identification of volcanic rocks based on random forest: A case study of the Carboniferous in the Dixi area of the Junggar Basin. Geophys. Geochem. Explor. 2024, 48, 1025–1036. [Google Scholar]
- Liu, M.; Hu, S.; Zhang, J.; Zou, Y. Methods for identifying complex lithologies from log data based on machine learning. Unconv. Resour. 2023, 3, 20–29. [Google Scholar] [CrossRef]
- Ren, Q.; Zhang, H.; Zhang, D.; Zhao, X.; Yan, L.; Rui, J.; Zeng, F.; Zhu, X. A framework of active learning and semi-supervised learning for lithology identification based on improved naive bayes. Expert Syst. Appl. 2022, 202, 117278. [Google Scholar] [CrossRef]
- Li, Z.; Wu, Y.; Kang, Y.; Lv, W.; Feng, D.; Yuan, C. Feature-depth smoothness based semi-supervised weighted extreme learning machine for lithology identification. J. Nat. Gas Sci. Eng. 2021, 96, 104306. [Google Scholar] [CrossRef]
- Saporetti, C.M.; Da Fonseca, L.G.; Pereira, E.; De Oliveira, L.C. Machine learning approaches for petrographic classification of carbonate-siliciclastic rocks using well logs and textural information. J. Appl. Geophys. 2018, 155, 217–225. [Google Scholar] [CrossRef]
- Li, T.; Wang, R.; Wang, Z.; Zhao, M.; Li, L. Prediction of fracture density using genetic algorithm support vector machine based on acoustic logging data. Geophysics 2018, 83, D21–D30. [Google Scholar] [CrossRef]
- Chen, G.H.; Hu, C.; Zeng, Y.L.; Ma, Z.G. Logging and identification method of fracture-cave fills in carbonate reservoir based on BP neural network. Geophys. Prospect. Pet. 2015, 54, 99–104. [Google Scholar]
- Lu, G.Q.; Dong, S.Q.; Huang, L.L.; Zeng, L.B.; Liu, G.P. Fracture Intelligent Identification Using Well Logs of Continental Shale Oil Reservoir of Fengcheng Formation in Mahu Sag, Junggar Basin. Earth Sci. 2023, 48, 2690–2702. [Google Scholar]
- Li, W.; He, S.; Tan, K.J.; Zhang, F.; Zhao, Y.C.; Yin, L. Characteristics of volcanic reservoirs and diagenetic evolution in the northwest margin of Junggar Basin. Nat. Gas Geosci. 2010, 21, 909–916. [Google Scholar]


| Lithology | Core Length (m) | Oil-Bearing Core Length (m) | Rich in Oils | Oil Spots | Oil Stains | Fluorescence | ||||
|---|---|---|---|---|---|---|---|---|---|---|
| Core Length (m) | Percentage (%) | Core Length (m) | Percentage (%) | Core Length (m) | Percentage (%) | Core Length (m) | Percentage (%) | |||
| Volcanic | 15.2 | 10.1 | 0.49 | 4.81 | 4.07 | 40.28 | 1.34 | 13.30 | 4.20 | 41.61 |
| Tuff | 17.8 | 9.7 | 0.20 | 2.02 | 5.77 | 59.46 | 0.70 | 7.22 | 3.04 | 31.30 |
| Gravel | 353.4 | 214.1 | 8.56 | 4.00 | 78.15 | 36.50 | 30.74 | 14.36 | 96.64 | 45.14 |
| total | 386.4 | 233.9 | 9.25 | 3.95 | 87.98 | 37.62 | 32.79 | 14.02 | 103.88 | 44.41 |
| Lithology | Relational | m | n | a | b | N | R |
|---|---|---|---|---|---|---|---|
| Volcanic | F = 1.122φ−1.805 | 1.805 | - | 1.122 | - | 32 | 0.91 |
| I = 1.085SW−1.931 | - | 1.931 | - | 1.085 | 60 | 0.91 | |
| Tuff | F = 1.057φ−1.875 | 1.875 | - | 1.057 | - | 27 | 0.94 |
| I = 1.041SW−1.937 | - | 1.937 | - | 1.041 | 144 | 0.98 | |
| Gravel | F = 0.907φ−1.801 | 1.801 | - | 0.907 | - | 48 | 0.87 |
| I = 1.027SW−1.845 | - | 1.845 | - | 1.027 | 277 | 0.99 |
| Lithology | Φ (%) | So (%) | Rt (Ω.m) |
|---|---|---|---|
| Volcanic | 5.0 | 40 | 47 |
| Tuff | 5.0 | 40 | 80 |
| Gravel | 6.0 | 40 | 27 |
| Dataset | R2 | RMSE | MSE |
|---|---|---|---|
| Training set | 0.82 | 1.18 | 1.39 |
| Test set | 0.79 | 1.23 | 1.52 |
| SW | KrW | Kro |
|---|---|---|
| 0.3 | 0 | 0.9 |
| 0.35 | 0 | 0.68465 |
| 0.38125 | 0.00019531 | 0.56038 |
| 0.4125 | 0.0015625 | 0.4447 |
| 0.44375 | 0.0052734 | 0.33829 |
| 0.475 | 0.0125 | 0.24206 |
| 0.50625 | 0.024414 | 0.15722 |
| 0.5375 | 0.042188 | 0.085582 |
| 0.56875 | 0.066992 | 0.030258 |
| 0.6 | 0.1 | 0 |
| 1 | 1 | 0 |
| Model Initial Reserves (104 × m3) | NTG Constrained Reserves (104 × m3) | Cumulative Production of Well Groups (104 × m3) |
|---|---|---|
| 264.7 | 115 | 10.4 |
| Gas–Water Ratio | Water Injection Volume (m3/d) | Injecting Nitrogen Gas (m3/d) | Expected Oil Production (103 m3) |
|---|---|---|---|
| 3:1 | 12.5 | 3750 | 8.9 |
| 4:1 | 10 | 4000 | 9.42 |
| 5:1 | 8 | 4000 | 8.87 |
| Exhaustive mining | 8.01 | ||
Disclaimer/Publisher’s Note: The statements, opinions and data contained in all publications are solely those of the individual author(s) and contributor(s) and not of MDPI and/or the editor(s). MDPI and/or the editor(s) disclaim responsibility for any injury to people or property resulting from any ideas, methods, instructions or products referred to in the content. |
© 2025 by the authors. Licensee MDPI, Basel, Switzerland. This article is an open access article distributed under the terms and conditions of the Creative Commons Attribution (CC BY) license (https://creativecommons.org/licenses/by/4.0/).
Share and Cite
Lv, Q.; Shi, Z.; Cheng, L.; Zan, C. Distribution of Remaining Oil and Enhanced Oil Recovery Strategy for Carboniferous Buried-Hill Reservoirs in Junggar Basin. Energies 2025, 18, 2474. https://doi.org/10.3390/en18102474
Lv Q, Shi Z, Cheng L, Zan C. Distribution of Remaining Oil and Enhanced Oil Recovery Strategy for Carboniferous Buried-Hill Reservoirs in Junggar Basin. Energies. 2025; 18(10):2474. https://doi.org/10.3390/en18102474
Chicago/Turabian StyleLv, Qijun, Zhaowen Shi, Linsong Cheng, and Chunjing Zan. 2025. "Distribution of Remaining Oil and Enhanced Oil Recovery Strategy for Carboniferous Buried-Hill Reservoirs in Junggar Basin" Energies 18, no. 10: 2474. https://doi.org/10.3390/en18102474
APA StyleLv, Q., Shi, Z., Cheng, L., & Zan, C. (2025). Distribution of Remaining Oil and Enhanced Oil Recovery Strategy for Carboniferous Buried-Hill Reservoirs in Junggar Basin. Energies, 18(10), 2474. https://doi.org/10.3390/en18102474