3.1. Autoregressive Models
Autoregressive models, leveraging the chain rule of probability, decompose the joint distribution of a sequence into a product of conditional distributions. This approach allows for the generation of data points conditioned on preceding values, making them suitable for modeling time series data prevalent in power systems. This section reviews the application of autoregressive models, including specific architectures like Transformers, in addressing key challenges within the power domain.
Following the fundamentals of autoregressive modeling, several studies have investigated their application in generating synthetic power system data and scenarios for a variety of purposes. For instance, in [
7], the authors describe an approach to real-time optimal power flow (OPF) that incorporates linguistic stipulations. This is achieved by integrating a Generative Pretrained Transformer (GPT) agent with deep reinforcement learning (DRL). The GPT agent interprets qualitative objectives and constraints based on linguistic stipulations as rewards, which are then optimized using a DRL process. This method allows traditionally unquantifiable linguistic stipulations expressed in natural language to be directly modeled as objectives and constraints in the OPF problem. The DRL agent can then solve the OPF model in real time, providing dispatch decisions that are interpretable with language outputs.
In addition to generating data, autoregressive models have been studied for prediction and forecasting tasks, which are of high interest for the efficient operation of power systems. Numerous studies have examined their application in this domain. One example is the work in [
8], which proposes a CNN-LSTM model for enhancing the accuracy of steam turbine power prediction in co-generation systems. Short-term power load prediction is crucial for efficient energy management and should be more accurate. This model first uses a one-dimensional CNN to extract high-dimensional features from input data, then uses an LSTM layer to capture temporal correlations, and finally uses an attention mechanism to optimize the weights of the LSTM output. The model’s ability to focus on the most relevant features in the input data makes it robust to noise and missing data, and the results show more accurate and reliable predictions than traditional LSTM. In addition, study [
9] proposes an attention-based CNN-LSTM-BiLSTM model for load forecasting in integrated energy systems (IESs). Load forecasting is becoming more difficult due to the combination of multiple energy sources and the nonlinear characteristics of the time series data. The CNN and attention block are used to extract the effective features of the model, and the LSTM-BiLSTM block is used to forecast the time-related data. The results have shown improved forecasting performance compared to CNN-BiLSTM, CNN-LSTM, BiLSTM, LSTM, BPNN, RFR, and SVR. Moreover, Ref. [
10] presents a dual-stage attention-based Long Short-Term Memory (DA-QLSTM) network for short-term zonal electricity load probabilistic forecasting. The method integrates a feature attention-based encoder to identify the most relevant input features and a temporal attention-based decoder to capture temporal dependencies in load data. Utilizing the pinball loss function for probabilistic forecasting, the DA-QLSTM provides quantile-based predictions that capture uncertainties effectively. Case studies on the GEFCom2014 dataset demonstrate its superior performance in both point and probabilistic forecasting compared to state-of-the-art models. The model also automatically selects critical weather station data, enhancing accuracy while reducing irrelevant variables, making it robust under variable weather conditions and data uncertainties. In the same manner, work [
11] introduces a novel method for short-term multienergy load forecasting in integrated energy systems (IESs). This method consists of a CNN-BiGRU model optimized by an attention mechanism to achieve more accurate load forecasting, one that considers fluctuations, randomness, and the coupling relationships of IESs. The model employs a one-dimensional CNN to extract complex features and a BiGRU to capture time dependencies from historical data. Attention modules are then applied to enhance key information, and a hard weight-sharing mechanism extracts multienergy coupling relationships. Finally, a multitask loss function with weight optimization is applied to balance the learning process across different energy types. The results indicate higher accuracy compared to LSTM models, especially in cooling, heat, and electrical load forecasting. Similarly, paper [
12] introduces an innovative hybrid model, AMC-LSTM, for short-term wind power prediction. This model integrates an attention mechanism to dynamically assign weights to input physical features, Convolutional Neural Networks (CNNs) to extract short-term abstract features, and Long Short-Term Memory (LSTM) networks to identify long-term trends. By addressing redundancies in raw time series data and varying the importance of input features, the AMC-LSTM model achieves superior accuracy and stability compared to other models such as ARIMA, SVM, and CNN-LSTM. Tested on real-world wind turbine data from Inner Mongolia, the AMC-LSTM model demonstrated lower error rates and better alignment with actual wind power outputs, especially over extended forecasting horizons. This approach effectively supports grid management and decision-making in wind farms. On top of that, work [
13] introduces a power forecast approach for centralized PV power plants based on a fusion LSTNet-Attn model. PV power forecasting is essential for the safe and economical operation of power systems, and prediction accuracy is important. This method combines a CNN, LSTM, attention mechanism, and autoregressive model to capture the short-term local dependencies and long-term trends in PV power data and weather factors. The effectiveness of the model is validated using data from a central PV plant, and the results demonstrate higher prediction accuracy and robustness compared to other methods. Correspondingly, work [
14] proposes a new wind power forecasting system based on a dual-stage self-attention mechanism (DSSAM). An accurate and stable forecasting method is important for the optimized integration of large-scale wind power into the grid. This method consists of a feature decomposition module to remove noise, DSSAM to focus on important features, and GRU for forecasting with an ADAM-based optimization module. Results prove the developed feature decomposition module to be effective and the superiority of DSSAM over SSAM, of hybrid structures over single structures, and of deep learning models over linear ones. In a like manner, study [
15] presents a hybrid ensemble deep learning framework for short-term photovoltaic (PV) power forecasting using Long Short-Term Memory (LSTM) networks with an attention mechanism. The method employs two LSTM models to process time series data on temperature and PV power output separately, followed by a fully connected layer to improve accuracy. The attention mechanism adaptively focuses on significant features within the LSTM hidden layers, enhancing forecasting performance. Experiments were conducted and compared with benchmark models like ARIMAX, Multilayer Perceptron (MLP), and traditional LSTM. The proposed method outperformed others across various time horizons, demonstrating superior accuracy and robustness.
From a different perspective, autoregressive models also contribute to estimation tasks, enabling the inference of critical system parameters. For instance, work [
16] proposes a Graph Attention Network (GAT)-based node indispensability estimation (NIE) model to estimate the indispensability of specified nodes, which provides a risk early warning that the
criterion is not satisfied under certain load conditions. Unlike existing methods, this mechanism uses partial state observations and does not require monitoring data from all system components. The model uses a GAT with a multihead attention mechanism and a residual structure, taking preprocessed node feature data as input to predict the indispensability of nodes in a power grid. A comparison between other models such as GCN and MLP is shown, and the model demonstrates superior accuracy and faster convergence. Another study concerning the same idea is [
17], which proposes a new fault location model based on Bi-GRU and an attention mechanism that analyzes current data and extract fault features. Fault location techniques are used to maintain the stable operation of power systems and to quickly respond and restore the grid in case of a fault. Existing methods rely on the manual work of extracting the important features, a task that may not be performed accurately in large systems. The Bi-GRU is used in the method to retain the time characteristics in the signal, while the attention mechanism focuses on the signal changes near the fault, and a fault line location model is included as well to determine the fault position. The results show better accuracy of fault detection compared to traditional manual methods.
Furthermore, researchers have tried to employ autoregressive models for classification and detection tasks to aid in the identification of system events and anomalies. For example, work [
18] introduces a Bi-LSTM attention mechanism model for transient stability assessment (TSA) in power systems, using voltage phasor data. The goal is to offer an improved TSA based on voltage phasor data in terms of accuracy and robustness. The method combines a Bi-LSTM network for feature extraction of time series voltage phasor data with an attention mechanism to weigh the importance of different time steps, improving the accuracy and robustness of the assessment. The results determine that the model outperforms other models (such as LSTM, Bi-LSTM, ANN, MLP, and SVM) in terms of accuracy and robustness. Furthermore, study [
19] presents a novel method for classifying Power Quality Disturbances (PQDs) using a Cross-Attention Fusion of Temporal and Spatial Features (TSF-CAF) model. The method combines an improved SCINet architecture for temporal feature extraction and an adapted VGG16 model for spatial feature extraction, integrating these features with a cross-attention mechanism to enhance classification accuracy. PQD data were simulated and tested using a Python environment and hardware experiments, including synthetic and real-world disturbances. Results show an average classification accuracy of 95.01% under high noise (20 dB) conditions and 99.66% for hardware experiments. Comparative and ablation studies demonstrated the model’s superior performance in classification accuracy, convergence speed, and robustness to noise compared to other deep learning models. In addition, work [
20] proposes a real-time transient stability early warning system for power grids using Graph Attention Networks (GATs) combined with Long Short-Term Memory (LSTM) networks. The system uses phasor measurement unit (PMU) data, including voltage phasors and frequency measurements, as inputs to predict transient instability. The network is trained and tested on synthetic data generated from simulations of the Nordic44 test system, incorporating variations in system topology and load. Results show that the proposed method achieves a missed detection rate of 2.21% and a false alarm rate of 8.20% under noisy conditions, with a maximum average early warning time of 9.61 cycles. The system’s performance is heavily influenced by the grid’s dynamic response to disturbances, demonstrating robustness under realistic conditions while offering significant potential for practical application in smart grids. Similarly, work [
21] proposes an interpretable model based on the dual-attention mechanism and GRU for time-adaptive TSA. Deep learning use in TSA models can enhance their speed and accuracy, but their inexplicability makes them difficult to apply. This method uses a feature attention block to weigh the importance of input features and a time attention block to weigh the importance of different time steps, which are then fed into a GRU network. The model’s difficulty of training is reduced, the assessment speed is higher, and by the visualization of the feature attention block, instability patterns are identified, so the TSA rules learned by the proposed model can be understood. The results showed that the model outperforms other methods like GRU, DT, and SVM, with more than 95% of samples being evaluated at the first cycle after fault clearance. Moreover, work [
22] proposes a data-driven framework for fault and abnormality detection in smart grids. Existing methods usually rely on a model and cannot capture complex temporal series. This method is based on a Bi-LSTM classifier with an attention mechanism to capture time-domain features and a 1D-CNN structure to extract frequency-domain features for prediction. Moreover, a frequency-based clustering algorithm is used to classify, in an unsupervised fashion, the signals into meaningful clusters. The method is also designed to be explainable, making it more suitable for real-world applications.
To conclude, as presented in
Figure 5, there is an increasing interest, as shown by the growing number of research publications from 2019 to 2024, in applications of GPT models within the power systems domain. The number of publications shows a significant upward trend, starting at approximately 150 in 2019 and increasing to over 850 by 2024, indicating a growing interest and research activity in leveraging GPT models for power system challenges. Moreover, as shown in
Figure 6, the left pie chart reveals the distribution of machine learning tasks where autoregressive models are employed in power systems, with prediction tasks being the most prevalent at 53.4%, followed by classification tasks at 33.3% and estimation tasks accounting for 13.3%. The right pie chart displays the distribution of power system applications utilizing autoregressive machine learning models, with DER (Distributed Energy Resources) representing the largest share at 53.3%, followed by PQ (Power Quality) at 40.0% and GSAC (Grid Stability and Control) at 6.7%. Finally, as may be viewed in
Figure 7, the left bar chart shows that Mean Squared Error (MSE) is the most frequently used evaluation metric with a count of six, followed by Root Mean Squared Error (RMSE) with seven and Mean Absolute Error (MAE) with eight.The right bar chart indicates a relatively even distribution among the probability measurement metrics, with Cross Entropy, probability score, Variance, and a collection of other probability measurement metrics representing additional probability measurement metrics that were not covered in this review, each having a count of 10.
3.2. Variational Autoencoders
Variational Autoencoders (VAEs) are probabilistic generative models that learn latent representations of data using an encoder–decoder framework. By learning a compressed, probabilistic representation, VAEs can generate new samples and perform tasks such as dimensionality reduction and anomaly detection. This section explores the applications of VAEs in various power systems applications.
The generation of data, scenarios, and synthetic environments plays an important role in advancing power system research, development, and operation. Naturally, VAE architecture was explored for this category of applications, offering control over the generated samples through manipulation of the latent space. For instance, work [
23] proposes a concentrating solar power (CSP) configuration method to determine the CSP capacity in multienergy power systems. CSP can provide flexibility for power systems, but due to its high construction cost, an evaluation of the configuration scheme is essential. The method employs a two-stage model, comprising a planning stage determining the capacity of CSP components and an operation stage evaluating costs in day-ahead and real-time periods using generated scenarios. To model uncertainty in the power system, the study utilizes an improved VAE (which has a hyperparameter that improves the performance), which learns from historical data and generates scenarios for the configuration model. The overall consideration of flexibility values makes CSP more economical in the configuration problem. Additionally, work [
24] proposes a new VAE-BiLSTM method to reduce dimensionality arising from large volumes of data generation. The problem is derived from the growing use of advanced metering and smart sensing devices, leading to greater computing power and time for energy forecasting. This method generates encoded representations of given time series data to reduce computing resources and results in more accurate forecasting. A comparison between other variants of AEs and VAEs (including RNNs and LSTM) is shown, and in terms of forecasting accuracy, the method outperforms them. Another approach presented in [
25] suggests the notion of a stochastic virtual battery (VB) model and a VAE-based algorithm to identify the probability distribution of the model’s parameters. VB models are used to represent flexible loads, which consist of uncertainties, making deterministic VB models impractical. As shown in the paper, the stochastic character of the method can better represent those flexible loads. Moreover, work [
26] introduces an anomaly detection method that remains relatively insensitive to the moderate presence of anomalous data during training. Existing one-class-classifier-based methods suffer from performance degradation when training data contain anomalous samples, unlike this method. The method combines a VAE and LSTM-based RNN to utilize the data’s temporal relationships for unsupervised anomaly detection. To enhance the reparameterization trick in the VAE, an SVD of the wavelet coefficients found from the input’s high- and medium-frequency representation time series data is employed. Instead of an L2 norm-based cost function, a log cosh-based function is used. The effectiveness of generative models over clustering models in the context of anomaly detection for a sequential dataset is demonstrated, along with the proposed mechanism, whose results show improvement. Furthermore, the research in [
27] addresses the challenge of generating representative multivariate load states for power systems when historical data are scarce. The proposed method utilizes a Conditional Variational Autoencoder (CVAE) to model high-dimensional dependencies and generate synthetic load data. Unlike traditional CVAE implementations, this approach incorporates sample-dependent noise during the generation process and co-optimizes noise parameters during training. Statistical tests and a multiarea adequacy case study on European load data demonstrate that the CVAE outperforms Gaussian copulas and Conditional GANs (cGANs) in reproducing multivariate dependencies and realistic tail distributions. The CVAE’s ability to condition generation on contextual variables, such as time of day, provides additional flexibility for targeted analysis. On top of that, work [
28] introduces a VAE approach to generate electric vehicle (EV) loads. Existing methods rely on predefined probability distributions, and there is great significance in establishing an accurate load profile model of EV charging stations. This model, composed of deep convolution and transposed convolution networks, learns from original load profiles to encode and then decode data, generating new profiles. This method can generate EV loads of different times and spaces without manually specifying the probability distribution and setting many samples that fit this distribution. The method generates diverse profiles, which are classified, and only specific types remain, and from the results, the effective capture of the characteristics of the original data is shown. To continue this line of thinking, work [
29] offers a VAE-based model for energy disaggregation—a tool for estimating the consumption of individual appliances from a single sensor that measures the total consumption of a building. This technique is called NILM (nonintrusive load monitoring), and although existing disaggregation algorithms are very accurate, they lack generalization capability, which is important for multistate appliances and different kinds of buildings. This model uses a probabilistic encoder to map information into a latent space and a decoder to reconstruct the power signal of the target appliance. The model uses an IBN-Net to enhance feature extraction and skip connections between the encoder and decoder to improve signal reconstruction. The proposed model was compared to state-of-the-art NILM approaches on the datasets and showed better results in detecting the target appliance and a more accurate reconstruction capability, especially for multistate appliances.
Another category of tasks in power systems concerns forecasting applications. In this context, VAEs can be utilized for probabilistic forecasting, which may provide not only point predictions but also uncertainty estimates. For instance, work [
30] focuses on improving short-term solar photovoltaic (PV) power forecasting using a Variational Autoencoder (VAE)-based deep learning model, known for its strong performance in time series analysis and nonlinear modeling. The study compares the VAE approach against seven deep learning models, including LSTM, GRU, and RBM, and two traditional machine learning methods, logistic regression and support vector regression. Both single- and multistep-ahead forecasting are examined using data from two grid-connected PV systems in the US and Algeria. Results show that VAE consistently outperformed other methods in accuracy and robustness. This research highlights the potential of deep learning models, particularly VAEs, in enhancing solar power prediction to support efficient grid integration and management strategies. Study [
31] introduces a novel approach for wind power forecasting using Variational Autoencoders (VAEs) combined with hybrid transfer learning for large-scale, multiregional wind farms. The method leverages pretrained features from one wind farm and fine-tunes them using small datasets from other wind farms, optimizing model training and reducing computational costs. The framework integrates MLP autoencoders for dimensionality reduction and feature extraction, followed by transfer learning to adapt models to diverse wind farm conditions. Empirical evaluations using three wind farm datasets demonstrate the method’s superior performance with MAE and RMSE. The model achieves high forecasting accuracy, reduces retraining runtime by 90×, and adapts effectively across varying regional conditions, showing potential for efficient and scalable wind power forecasting. In addition, work [
32] presents a Convolutional Graph Rough Variational Autoencoder (CGRVAE) for forecasting photovoltaic (PV) power generation. PV power prediction is important for optimized management of the grid system, but the used methods suffer from uncertainty and inaccurate spatiotemporal representation. This method captures each PV site’s PDFs of future PV generation in a modeled weighted graph. A network of PV sites is modeled as a weighted graph, where nodes represent PV sites and edges reflect their correlations. The model incorporates rough set theory to handle uncertainties in the PV data and demonstrates superior performance compared to existing forecasting benchmarks. Yet another example is work [
33], which introduces a deep learning framework for forecasting renewable electricity demands, combining Variational Autoencoders (VAEs) for data sampling and Bidirectional Long Short-Term Memory (Bi-LSTM) for prediction. The framework was tailored to South Korea’s energy context, aiming to support the Renewable Energy 3020 Plan by estimating future energy demands. Data preprocessing incorporated conversion factors and regional factors, while postprocessing addressed labeling inconsistencies. The VAE-Bi-LSTM model outperformed other techniques such as LSTM, GRU, ANN, and ARIMA, reducing RMSE, MAE, and MAPE compared to alternatives. The results provide insights into optimizing energy policies and emphasize the importance of data augmentation in enhancing forecasting accuracy for large-scale energy management. Furthermore, paper [
34] introduces a data-driven Optimal Power Flow (OPF) solver leveraging unsupervised generative models to address the challenges of real-time computation, optimality, and feasibility in modern power grids. Unlike traditional solvers requiring labeled optimal datasets or heuristic assumptions, this method uses only feasible datasets to generate near-optimal solutions. The approach incorporates domain knowledge, information theory, and machine learning (ML) constructs to rapidly produce solutions that guarantee system constraint satisfaction without reliance on external tools like AC power flow solvers. Finally, work [
35] proposes the use of a VAE-BiLSTM method for short-term load forecasting. Load forecasting is a significant tool for maximizing the economic efficiency of power producers in deregulated markets. Existing methods lack accuracy in modeling time-dependent patterns and removing noise from real-world data, making their forecasting not accurate enough. In this method, the VAEs preprocess and reconstruct the data (containing also historical, meteorological, and environmental data), creating a normalized, noise-free dataset for training the BiLSTM. To prevent overfitting, the training method is based on batch training, and the method is compared to SVR and LSTM. The forecasting operation was performed separately for all four seasons, and analyzing the results with various evaluation indicators showed the best performance with this method.
From a different perspective, there are many applications in power systems requiring accurate estimation. The latent representations learned by VAEs can be employed for parameter or state estimation in power systems, as may be seen in the following examples. Paper [
36] introduces a novel data-driven method for long-term voltage stability assessment and monitoring in power systems using Variational Autoencoders (VAEs). Leveraging high-frequency PMU (Phasor Measurement Unit) data, the approach extracts low-dimensional latent features representing load and voltage levels, bypassing the need for prior system topology or control strategy knowledge. Unlike traditional methods, the VAE probabilistically regularizes latent features and uses variance reduction for better long-term stability evaluation. The method demonstrated high accuracy and efficiency in simulations across IEEE 14-bus, 57-bus, 118-bus, and European 1354-bus systems under diverse load scenarios, including single and multiple load increments. Results highlight its robustness, computational efficiency, and potential for real-time operation. In the same context, article [
37] presents a novel approach for calibrating power plant model parameters using a Conditional Variational Autoencoder (CVAE) framework, ensuring computational efficiency and robustness in nonlinear dynamic systems. By combining Elementary Effects (EE) analysis for identifying critical parameters and the CVAE model for posterior distribution estimation, the method addresses challenges in traditional and machine learning-based calibration approaches. The framework was tested on a hydrogenerator model with 18 critical parameters under varying prior distributions and event scenarios. Results demonstrate that the proposed method achieves accurate parameter estimation, even when true values deviate from prior distributions. The method’s efficiency and generalizability make it suitable for real-world applications. Furthermore, article [
38] proposes a novel method for fault detection and fault localization in power distribution networks using a Variational Autoencoder (VAE). The solution can handle massive amounts of multidimensional data collected by the power system combined with real-time dynamic distribution network status information to locate and detect anomalies. Simulations’ results demonstrate the correctness and accuracy of the model.
When focusing on classification and detection applications in power systems, VAEs may be applied to anomaly detection and classification tasks, as may be seen in several recent works. For example, work [
39] proposes a data augmentation method for electricity theft detection based on a CVAE. Electricity theft detection is not accurate enough due to a lack of data samples, and this model can generate new data curves which can be used to train various classifiers. The method uses an encoder composed of convolutional layers to map power theft curves into low-dimensional latent variables and a decoder with deconvolutional layers to reconstruct new power theft curves. The proposed mechanism can consider both the shapes and distribution characteristics of samples, and when classifiers (such as CNN, MLP, SVM, and XGBoost) train with the augmented data, their detection performance is better than that achieved when trained with traditional augmentation mechanisms (ROS, SMOTE, CGAN, etc.), or with the original data.
From a slightly different perspective, study [
26] focuses on detecting anomalies in electric vehicle (EV) power battery packs to ensure safety and prevent faults. The authors propose a semi-supervised model combining Gated Recurrent Units (GRUs) with a Variational Autoencoder (VAE), referred to as GRU-VAE. The model processes multivariate time series (MVTS) data, learning robust latent representations and reconstructing inputs to identify anomalies based on reconstruction errors. The Peaks Over Threshold (POT) model is employed to dynamically set anomaly thresholds. Experimental results on real EV datasets demonstrate GRU-VAE’s effectiveness, achieving a 24% improvement in F1-score over GRU-AE and outperforming traditional threshold-based methods. The approach is scalable and suitable for early detection, offering a significant advancement in battery anomaly detection technology. Moreover, work [
40] focuses on anomaly detection for hydropower turbine units using a combination of a Variational Modal Decomposition (VMD) and a Deep Autoencoder (AE) based on a Convolutional Neural Network (CNN). The method first decomposes sensor signals into simpler subsignals using VMD, then employs a deep Autoencoder for unsupervised learning, using reconstruction residuals to detect anomalies. The dataset consists of sensor readings from a hydropower plant, including flow rate, guide vane opening, and oil level in tanks. The evaluation metrics include recall, precision, accuracy, specificity, and F1 score, where the proposed method improves recall by 0.140, precision by 0.205, and F1 score by 0.175 over traditional AE approaches. Wasserstein Distance is used for distributional comparison, highlighting improved convergence. The approach does not use transfer learning but benefits from self-supervised learning through AE training. The method significantly reduces reconstruction error, enhancing the separation of normal and abnormal data, making it a robust tool for anomaly detection in power systems. In addition, paper [
41] addresses the challenge of anomaly detection in electric vehicle (EV) power batteries by introducing the Deep Variational AutoEncoder-Based Support Vector Data Description with Adversarial Learning (DVAA-SVDD) model. The method integrates a Variational Autoencoder (VAE) to regularize the feature space of normal samples, thereby mitigating hypersphere collapse issues common in Deep-SVDD methods. Adversarial learning complements the VAE, acting as a discriminator to enhance feature generation quality and define more robust classification boundaries. The model was validated on real-world datasets containing over 5 million samples, demonstrating superior performance compared to existing techniques in detecting anomalies with high accuracy, robustness, and efficiency. By achieving optimal metrics across diverse datasets, this framework ensures reliable and scalable deployment in real-world EV battery monitoring systems. The study highlights the effectiveness of unsupervised learning in addressing data imbalance and heterogeneity in battery fault detection. Consequently, Ref. [
42] introduces a hybrid approach combining a physical model and an LSTM-based Variational Autoencoder (LSTM VAE) for anomaly detection in district heating substations. The physical model decomposes heat load data into regular components and residuals, while the LSTM VAE is trained on residuals to identify anomalies based on reconstruction errors. The approach was tested on real-world hourly heat energy data from a Swedish substation, partitioned into warm and cold months. Results demonstrate that the LSTM VAE outperforms baseline models (LSTM and LSTM Autoencoder) in terms of AUC and F1 score, particularly with optimized threshold settings. The study highlights the potential for improving energy system diagnostics through advanced machine learning techniques. Lastly, Ref. [
43] proposes a novel method for anomaly detection in household appliances. Based on the analysis of their power signatures, the authors trained a VAE to model the normal operation of each appliance. Then, at test time, they compared the reconstruction error of the VAE to the anomaly threshold previously estimated from the training errors, looking for deviations. Finally, the paper shows that the VAE method outperforms traditional algorithms for anomaly detection.
Yet another core task in the power systems domain is data reconstruction. In this light, VAEs may be used for data imputation and reconstruction, filling in missing data points based on the learned latent representation. For instance, work [
44] proposes an AT-GVAE-based FDIA detection framework based on data reconstruction. Existing FDIA detection methods can only tell if there is an attack without localizing the exact nodes injected, and their performance is not desirable under small attacks. The proposed mechanism consists of two multiple-layer GRU-based VAEs that act as the generator and discriminator. The VAE modules are enhanced with a self-attention mechanism to further characterize the latent feature variables for data reconstruction by decoders. This model outperforms other VAE-based methods, mainly because of two factors: capturing data distribution in both real data and latent vector space, and using the VAE-G to generate samples close to small abnormalities of FDIA attacks.
To conclude, VAEs are probabilistic generative models that learn compressed latent representations of data, enabling them to generate new samples and perform tasks like dimensionality reduction and anomaly detection. This section explored VAE applications in power systems, including tasks such as data generation, forecasting, estimation, classification, detection, and data reconstruction. As presented in
Figure 8, there is a growing research interest, as may be inferred from the increasing number of publications, focusing on VAE models in power system applications from 2019 to 2024. The number of publications remained relatively stable around 160 from 2019 to 2023 before showing a noticeable increase to approximately 180 in 2024, suggesting a recent growth in research interest in VAEs for this domain. Moreover, as shown in
Figure 9, the left pie chart indicates that prediction is the most common machine learning task for VAE models in power systems at 29.7%, followed by generation and estimation, both at 25.9%. The right pie chart shows that DER (Distributed Energy Resources) constitutes the largest application area for VAE models at 48.2%, with GSAC (Grid Stability and Control) following at 37.0%. Finally, as may be viewed in
Figure 9, the left bar chart indicates that Root Mean Squared Error (RMSE) is the most frequent evaluation metric with a count of eight, closely followed by Mean Squared Error (MSE) with seven and F1-score with six. The right bar chart shows that the probability measurement metrics CRPS, Variance, WD, CI, CE, and KL each have a count of 10, while a collection of other metrics that were not covered in this review have a slightly higher count of 18.
Figure 10 shows the distribution of different evaluation metrics for machine learning tasks where Variational Autoencoder (VAE) models are used in power system applications.
Right: The distribution of probability measurement metrics used to quantify uncertainty in power system applications involving VAE machine learning models. The left bar chart indicates that Root Mean Squared Error (RMSE) is the most frequent evaluation metric with a count of 8, closely followed by Mean Squared Error (MSE) with 7 and F1-score with 6. The right bar chart shows that the probability measurement metrics CRPS, Variance, WD, CI, CE, and KL each have a count of 10, while a collection of other metrics that were not covered in this review have a slightly higher count of 18.
3.3. Generative Adversarial Networks
Generative Adversarial Networks (GANs) employ a two-network architecture: a generator that creates synthetic data and a discriminator that distinguishes between real and generated samples. This adversarial training process enables GANs to learn complex data distributions and generate realistic synthetic data, offering potential benefits for power system analysis and simulation. This section examines the diverse applications of GANs in power systems, ranging from load forecasting to power grid security.
The generation of realistic and diverse scenarios is crucial for various power system applications. Several studies have explored the use of GANs for this purpose. For instance, article [
45] explores the short-term optimal operation of a large-scale hydro–wind–solar hybrid system to address the challenges of renewable energy integration into power grids. A stochastic optimization model is proposed, utilizing an improved generative adversarial network (GAN) with variational inference (GAN-VI) to capture the spatial and temporal uncertainties of wind and photovoltaic (PV) power. A two-stage optimization approach is employed, combining a heuristic algorithm for unit commitment and a refined model for cascade hydropower stations. Case studies in Southwest China demonstrate the system’s capability to balance fluctuating renewable energy sources and meet power transmission demands efficiently. The results highlight that high-quality scenarios generated by GAN-VI improve operational strategies, reducing start–stop losses and enhancing renewable energy utilization by 2.5% compared to traditional methods. Furthermore, article [
46] focuses on renewable scenario generation to address the uncertainty and variability in wind and photovoltaic energy. It introduces a data-driven, model-free approach utilizing Controllable Generative Adversarial Networks (ctrl-GANs) with a transparent latent space. The method incorporates orthogonal regularization and spectral normalization for training stabilization and establishes a link between the generated scenario features and the latent vectors. New evaluation metrics, including MMD, FID, and 1-NN scores, are used to assess the quality of generated scenarios. Results demonstrate the method’s effectiveness in generating realistic renewable energy scenarios, reflecting both temporal and spatial correlations while enabling controlled feature adjustments in the scenarios. The GAN-based approach outperforms traditional methods by capturing dynamic patterns and enabling flexible feature control. In addition, work [
47] proposes a new method using an unsupervised labeling model and conditional WGAN-GP to model the uncertainties and variation in wind power. The method employs a cluster analysis to categorize wind forecast errors, a support vector classifier (SVC) to predict labels for these categories, and a conditional scenario generation process using an improved WGAN with a gradient penalty term. The generated scenarios try to capture both the marginal distribution of each category and the spatiotemporal relationships among multiple wind farms. The results show that the proposed model can generate scenarios that accurately reflect real-world wind power output patterns, including mode diversity and statistical reliability, and that the gradient penalty improves scenario quality compared to weight clipping. The paper also proposes a scenario reduction technique using the k-medoids algorithm to balance computational efficiency and reliability. Moreover, work [
48] develops a distribution-free method for wind power scenario generation using SeqGAN. Power generation that can characterize the complex dynamics of wind power (and by that, it should avoid manual labeling) is necessary for the effectiveness of the generated datasets. The mechanism combines the SeqGAN with LSTM and GANs coupled with reinforcement learning. The model treats sequence generation as a stochastic sequential decision-making process, where a generative model acts as an agent guided by rewards from a discriminative model. This method’s performances are compared with Gaussian distributed, vanilla LSTM, and multivariate KDE models and show better results when applied to day-ahead scheduling. Similarly, study [
49] explores a model-free, data-driven approach to renewable energy scenario generation using Generative Adversarial Networks. GANs leverage deep neural networks to generate realistic wind and solar power scenarios, capturing temporal and spatial correlations without explicit statistical modeling. Historical data from NREL datasets validated the method’s effectiveness, demonstrating its ability to produce diverse and statistically accurate renewable generation patterns. The method also supports conditional scenario generation, such as focusing on specific weather events or seasons, offering a scalable and efficient alternative to traditional probabilistic models. Evaluation metrics confirm the generated scenarios closely resemble real data in both statistical properties and diversity. Furthermore, study [
50] addresses the challenge of real-time optimal power flow analysis, critical for efficient and reliable grid operation amidst uncertainties introduced by renewable generation, storage systems, and diverse loads. It proposes a novel data-driven machine learning approach that integrates generative learning, information theory, and domain-specific knowledge. This method only requires feasible data points for training and provides subsecond computation times, making it significantly faster than traditional and existing ML-based methods. The model guarantees both the feasibility and near-optimality of solutions without requiring grid topology or power flow equations post-training. Additionally, paper [
51] introduces Recurrent Generative Adversarial Networks (R-GANs) for generating realistic energy consumption data to address the challenges of data scarcity and privacy in smart grids. By replacing CNNs with RNNs, the model captures temporal dependencies in time series data. The addition of a Wasserstein GAN (WGAN) and Metropolis–Hastings GAN (MH-GAN) improves the training stability and data quality. ARIMA and Fourier transform features further enhance the generated data’s realism and utility. The synthetic data were evaluated for training energy forecasting models, achieving results comparable to models trained on real data. Moreover, paper [
52] explores the use of Generative Adversarial Networks for short-term load forecasting (STLF), addressing a gap in the use of GANs beyond data augmentation in energy systems. The study introduces a Conditional GAN (cGAN) architecture, leveraging minimal exogenous variables (temperature, day, and month) to predict daily load profiles. Various GAN architectures, including DCGAN, LSGAN, WGAN, and WGAN-GP, were tested, with cDCGAN achieving the best results (MAPE: 4.99%). The models were evaluated on one year of unseen data, demonstrating their capability to capture load variations and seasonality effectively. Future directions include enhancing the latent space and integrating multiple condition vectors to refine predictions. In addition, work [
53] introduces a time series GAN controller for long-term smart generation control (LTSGC) in microgrids, aiming to address the uncoordinated problems of conventional control frameworks. The method replaces the typical combined framework of economic dispatch (ED), smart generation control (SGC), and generation commands dispatch (GCD) with a single-time-scale LTSGC. The proposed TSGAN controller utilizes reinforcement learning and deep generative adversarial networks (DGANs) to predict states from historical data. The TSGAN is trained using a min-max game system to generate data similar to real-life data. Results indicate the proposed TSGAN controller achieves higher control performance and smaller economic cost compared to conventional algorithms. Similarly, study [
54] introduces a GAN-based robust optimization (GAN-RO) framework to improve the integration of photovoltaic systems into power grids by addressing variability and uncertainty in renewable energy. The proposed method combines GANs for generating realistic solar energy scenarios with a robust optimization model, allowing dynamic adjustments to operational strategies. The model was trained on historical energy and weather data and tested using IEEE 33-bus system simulations to optimize energy consumption and reduce operational costs. The results demonstrate a reduction in energy costs, a decrease in carbon emissions, and an increase in system efficiency. The study highlights the potential of AI-driven optimization techniques in enhancing grid stability, economic efficiency, and sustainability. In the same manner, work [
55] proposes a strategy for electric vehicles (EVs) and thermostatically controlled loads (TCLs) in a distribution system, using a modified GAN. Intelligent energy strategy is important for not overloading the grid system with these flexible loads. This method models EVs as battery energy storage systems (BESSs) and TCLs as virtual energy storage systems (VESSs), and it integrates machine learning into a bilevel optimization problem to determine power dispatch and VESS control. A modified GAN is used to estimate power, voltage, and VESS energy storage states and to address missing data issues. Results demonstrate that the method outperforms conventional approaches in accuracy and voltage stability while also being less affected by incomplete datasets. The data-driven approach reduces computation time and enables a faster response to changes in the distribution system. Furthermore, study [
56] addresses the challenge of transient stability assessment (TSA) in power systems, where data imbalance and limited unstable samples hinder the performance of data-driven classifiers. To overcome this, the authors propose a GAN-based case generation model that integrates a CNN-based regression model to guide the generation of realistic instability samples by shifting the data distribution towards prolonged instability moments. The model is trained and evaluated, where it successfully enhances dataset diversity. The performance is assessed using Fréchet Inception Distance (FID), Mean Absolute Percentage Error (MAPE), and classification accuracy across different TSA models (CNN, SVM, DBN, GCN). Results show that the proposed method outperforms conventional GAN-based approaches by improving the realism of generated cases and boosting classifier robustness in recognizing rare instability events. The study demonstrates the effectiveness of data augmentation in improving TSA performance, particularly in data-scarce scenarios. Another work concerning this idea is [
57], which proposes a home energy management (HEM) system for minimizing bill cost. Unlike existing methods that assume probabilistic distribution, this method is model-free. It utilizes a WGAN to generate solar power scenarios and then applies mixed-integer linear programming (MILP) to schedule appliances and energy storage. The WGAN-generated solar power profiles closely match real solar data, and the results are compared to a Monte Carlo method for scenario generation, with the WGAN approach showing better performance in terms of accuracy and reduced computational time. Furthermore, the proposed system, when considering both PV and ESS, demonstrates a significant reduction in electricity costs. Additionally, paper [
58] proposes a novel approach to generating synthetic time series data for smart grids using Conditional Generative Adversarial Networks (GANs). This method addresses the challenges of data availability, scale, and privacy in distribution-level datasets. The approach models time series data as a combination of “Level” (high-level statistics) and “Pattern” (behavioral trends), which are normalized and learned via GANs. The generated datasets preserve statistical properties and are evaluated using Maximum Mean Discrepancy (MMD), clustering, and load forecasting tasks. Experimental results using the Pecan Street Dataset demonstrate the synthetic data’s indistinguishability from real data, enabling privacy-preserving research and applications in smart grid scenarios. Moreover, article [
59] introduces a weakly supervised Generative Adversarial Network (GAN) framework to enhance the detection and generation estimation of distributed solar photovoltaics (PVs) in power grids with limited labeled data. The method leverages GAN-based image augmentation to generate diverse labeled satellite images, embed PV-specific characteristics, and integrate PV detection and classification into a feedback loop for mutual improvement. The approach combines geographic data, weather conditions, and historical generation patterns for robust output estimation, validated through tests in Arizona and California. This solution addresses data scarcity and achieves high accuracy in PV localization and generation forecasting. From a slightly different perspective, work [
60] suggests a method for synthesizing three-phase unbalanced active distribution networks, addressing the challenge of limited real-world data availability. The method employs an unbalanced graph Generative Adversarial Network (UG-GAN) to learn the distribution of random walks over a single real-world network and across phases, generating synthetic network connectivity. The framework also uses kernel density estimation (KDE) to generate time series load data and an optimization-based approach to place standard grid components, considering the interaction between topology, loads, and electrical components. Case studies demonstrate that the generated synthetic networks mimic the characteristics of real-world networks while maintaining data privacy and autonomy. The proposed method provides a comprehensive approach to generating realistic distribution system test cases using minimal real-world data. In a similar context, work [
61] proposes a GAN-based reconstruction of low-frequency electrical measurement data in smart grids. This is important for realizing two-way communication of energy and data flow between various agents. This method begins by transforming electrical measurement data into electrical images, where different measurement types are stored in different color channels. Then, a GAN-based super-resolution reconstruction method is used to enhance the images’ resolution, effectively increasing the sampling frequency of the data. Results demonstrate that the model can restore high-frequency details with less error and can be generalized to different datasets with satisfactory accuracy.
Beyond scenario generation, GANs have also found significant application in prediction and forecasting tasks within power systems. Several studies have explored their potential in this domain. For example, work [
62] presents a novel cross-modal method for generating scenarios of renewable energy, specifically addressing the issue of data quality and multimodality via cGAN. The method fuses spatial information from GPS data and temporal information from power output data using a spatiotemporal Transformer within the cGAN framework, which formulates scenario generation as a probability approximation problem. The results show that with a spatial Transformer, the model performed better than with a temporal Transformer and that it provides more training stability. This model’s generated data closely match real-world data and achieve state-of-the-art (SOTA) scenario generation performance. Furthermore, work [
63] introduces TraceGAN, a novel method for generating synthetic appliance power signatures using a conditional, progressively growing, one-dimensional Wasserstein GAN. For accurate NILM, a significant amount of labeled data are needed, but collecting such data is challenging. This method involves training a generator and a discriminator in an alternating fashion, where the generator produces realistic power signals from a random input, while the discriminator tries to distinguish between the generated and real signals. TraceGAN can synthesize truly random and realistic appliance power data signatures. In addition, work [
64] designs an attention-based cycle consistent (ABC)-GAN model for generating IoT data in intelligent systems. The goal is to better capture the important temporal features and the distribution of the data, as more quality generated data are essential for the operation of those systems. This method employs an encoder–decoder architecture with an improved attention-based LSTM variant to capture temporal features and a CycleGAN to learn distributions between different data patterns. It consists of two generators and two discriminators, which help it learn the cross-mapping between different domains, trying to overcome domain gaps. The training is performed with two adversarial loss functions and a cycle consistency loss function, which helps ensure that the generated data are close to the real time series. Results exhibit high consistency with the original data, although there is a potential limit to the pattern diversity of the augmented data, probably due to their dependency on the distribution of the training samples. Moreover, work [
65] proposes a novel time series forecasting based on CGANs (TSF-CGANs) designed for PV power prediction. PV power forecasting is a solution for efficient management of the system, but existing deep learning methods have reached a development limit in extracting the inherent features of the input data. The method employs a CGAN framework combined with a CNN and Bi-LSTM. The generator within TSF-CGANs functions as a regression prediction mode and then employs Bi-LSTM to produce the predicted value. The discriminator concurrently assesses the authenticity of the generated datasets, with the generator’s parameters iteratively optimized through adversarial training. Model performances are compared with LSTM, RNN, BP, SVM, and the Persistence model and indicate better accuracy. Similarly, work [
66] proposes an electric vehicle (EV) demand modeling called EV-GANs, which uses 3D CGANs to capture the nature of EV charging. Existing methods are based on Monte Carlo simulation and are unable to grasp the correlation between EV demand characteristics. This method maps EV demand characteristics into a 3D space and by that extracts the correlation between these dimensions. Results illustrate the effectiveness of the model, outperforming MC and Copula methods. In the same manner, study [
67] explores the use of Generative Adversarial Networks (GANs) to improve cyber-attack detection in smart grids by addressing the challenge of limited attack sample availability. Traditional deep learning-based detection models struggle due to data scarcity, leading to overfitting and reduced robustness. The proposed approach utilizes a GAN to generate synthetic attack messages, which are then integrated into the training dataset to enhance model performance. The evaluation, conducted on a simulated smart grid environment, demonstrates a 4% improvement in attack detection accuracy when using GAN-augmented datasets. The results indicate that increasing the volume of attack samples enhances generalization, particularly for rare attack types such as R2L and U2R. Overall, the research provides a novel AI-driven approach to improving cybersecurity in smart grids, making detection models more resilient against emerging threats. Additionally, paper [
68] presents a data-driven approach for detecting outages in partially observable distribution systems using smart meter (SM) data and Generative Adversarial Networks (GANs). The proposed method first decomposes the network into multiple zones using a breadth-first search (BFS)-based mechanism to enhance outage location accuracy. A GAN is then trained in each zone to learn the temporal–spatial distribution of normal operation data, and an anomaly scoring technique is applied to detect deviations indicating outages. The study validates the method using real AMI (Advanced Metering Infrastructure) data and evaluates performance using recall, precision, and F1 score. Results demonstrate that the proposed method effectively detects outages with high accuracy, even in cases of limited smart meter deployment, and achieves better detection performance than traditional support vector machine-based approaches. Likewise, study [
69] addresses short-term wind power forecasting using a Conditional Generative Adversarial Network (CGAN) combined with Convolutional Neural Networks (CNNs) to improve day-ahead prediction accuracy. The method incorporates historical wind farm data, which are clustered using K-means based on weather factors such as wind speed and direction. Gray Relational Analysis (GRA) is employed to identify similar past conditions, providing labeled guidance for CGAN training. The results demonstrate that CGAN enhances prediction performance by generating realistic synthetic wind power samples, reducing the forecasting error compared to traditional methods like the ANN, SVM, and ELM. Further, study [
70] introduces Informer-TimeGAN, a model for day-ahead wind power scenario generation, addressing the stochasticity and uncertainty of wind power forecasting. By integrating probSparse self-attention from Informer with time series generative adversarial networks (TimeGANs), the model effectively captures temporal correlations, seasonal patterns, and prediction error characteristics. An error stratification block categorizes errors based on ramping characteristics and power levels, allowing more targeted scenario generation. Evaluated on two real-world wind farm datasets in China, the model outperforms SeqGAN, RNN-GAN, and TimeGAN in maintaining autocorrelation, capturing volatility, and improving scenario accuracy, as shown by higher Coverage Rate (CR), lower Power Interval Width (PIW), and improved RMSE. The results demonstrate that Informer-TimeGANs enhance uncertainty modeling, making them a valuable tool for economic dispatch and power system planning. On top of that, paper [
71] proposes a hybrid forecasting model leveraging a semi-supervised Generative Adversarial Network (GAN) for short-term wind power and ramp event forecasting. The method employs Variational Mode Decomposition (VMD) to preprocess wind power time series data into intrinsic mode functions (IMFs) and uses GANs to generate virtual samples for training, enhancing prediction accuracy. The discriminative model integrates a semi-supervised regression layer for point forecasting, while a self-tuning strategy with multilabel classification improves ramp event prediction. Testing on datasets from wind farms in Belgium and China demonstrated superior forecasting performance compared to traditional statistical and machine learning methods. The GAN-based approach reduced errors significantly, achieving high accuracy and adaptability across various conditions. Correspondingly, article [
72] addresses the challenge of integrating renewable energy sources, particularly wind and solar, into power systems due to their inherent unpredictability and variability. The authors propose an improved Generative Adversarial Network (GAN)-based model for scenario forecasting, leveraging convolutional neural networks (CNNs) for robust feature extraction. This model captures the spatial–temporal correlations and stochastic dynamics of renewable power generation, allowing the generation of realistic time series trajectories. Experimental results demonstrate that the model effectively represents uncertainties, preserves statistical and spatial correlations, and achieves faster convergence compared to traditional methods. The approach is validated using 7 years of high-resolution wind and solar data from multiple sites in Washington State, showing its potential for application in renewable energy planning and operation.
GANs are also proving useful in classification tasks within power systems, particularly when dealing with imbalanced datasets or complex feature spaces. Several studies have explored their application in this area. For instance, work [
73] introduces a novel method for detecting high impedance faults (HIFs) in distribution networks using a cGAN and a CNN classifier. HIFs can be mistaken for other transient events, which presents a challenge in the protection of distribution systems. Existing methods’ efficiency relies on the size of the training data, and acquiring a large amount of datasets is time-consuming. This method begins by extracting the third harmonic angle (THA) of the current using an adaptive linear neuron (ADALINE). The cGAN then generates a large amount of pseudo-data from a small set of real data. Finally, a CNN classifier separates HIF data from other transient events. The method achieves high accuracy despite a low quantity of data input. In addition, study [
74] introduces a self-attention generative adversarial network (SA-GAN)-enhanced deep reinforcement learning (DRL) method to improve the resilience of networked microgrids (MGs) during sequential extreme events (SEEs). By generating credible data with sequential features, the SA-GAN addresses data scarcity and integrates into a double deep Q-network (DDQN) framework for adaptive MG reconfiguration. Tests on 7-bus and IEEE 123-bus systems show that this method enhances learning, adaptability, and resilience, ensuring continuous critical load survival. The approach outperforms conventional DRL methods, offering a robust, data-driven solution for power grid operations under extreme weather. Furthermore, work [
75] proposes a new generative adversarial framework for learning from skewed class distributions called ACIL (adversarial class imbalance learner). The model tries to learn the minority class distributions along with the majority class distribution to find cyber-attacks and physical faults. The ACIL has been tested and compared to various class imbalance learning models, showing superior performance.
Finally, GANs are being investigated for estimation tasks in power systems, offering potential improvements in accuracy and robustness, particularly when dealing with incomplete or noisy data. For example, Ref. [
76] introduces a fully data-driven approach for prefault dynamic security assessment (DSA) using phasor measurement unit (PMU) data with incomplete measurements. The method employs generative adversarial networks (GANs), an unsupervised deep learning technique, to address missing data, eliminating reliance on PMU observability and network topologies. Unlike traditional methods, which are constrained by PMU placement and require complete data inputs, the proposed approach is generalized and extensible, capable of handling various missing data scenarios. Simulation results demonstrate that this method maintains high DSA accuracy under all PMU missing conditions, with significantly reduced computational complexity. This innovation enhances the robustness of DSA for power systems facing uncertainties from renewable energy integration and data imperfections. The findings provide a practical and efficient solution for real-time dynamic security assessments in modern power grids. By the same token, study [
77] addresses the challenges of high-resolution state estimation (SE) in power distribution networks caused by increasing renewable generation and incomplete or inaccurate measurements. To tackle these issues, a spatiotemporal estimation generative adversarial network (ST-EGAN) is proposed, which generates high-resolution pseudo-measurements by extracting temporal patterns and leveraging residual structures to bridge spatial and temporal data gaps. The method eliminates the need for additional equipment and improves the robustness of SE in noisy and uncertain conditions. Validation on the IEEE 33-bus test network demonstrates that ST-EGAN outperforms existing interpolation and deep learning methods, reducing the mean RMSE by 4.78% compared to interpolation techniques and achieving superior accuracy and robustness under various noise levels. This approach effectively supports high-resolution SE, enhancing reliability and operational efficiency without increasing computational demands. In addition, the article [
78] proposes the CVAE method for modeling the probabilistic wind power curve. To achieve better modeling performance, they introduced the latent random variable. They use it to characterize underlying unobservable weather conditions and inconsistent wind turbine conditions. Their experimental results showed that CVAE gained better results over previous methods in terms of lower CRPS and PI reliability and sharpness.
To conclude this section, we have shown the diverse applications of Generative Adversarial Networks in power systems, spanning tasks such as data generation, prediction, classification, and estimation. An interesting trend is the popularity of GAN models for synthetic data and scenario generation. This opens avenues for addressing data scarcity issues and improving the training of other machine learning models in power system applications. Future research directions may include exploring novel GAN architectures specifically tailored for power system challenges, investigating methods for improving the stability and interpretability of GANs, and developing standardized evaluation metrics for assessing the performance of GAN-based power system solutions. As presented in
Figure 11, there is an increasing interest, as shown by the growing number of research publications, focusing on GAN models in power system applications from 2019 to 2024. The number of publications shows a steady increase over the years, starting at approximately 140 in 2019 and reaching over 180 by 2024, indicating a growing research interest in utilizing GANs in this domain. Moreover, as shown in
Figure 12, the left pie chart reveals that generation is the most common machine learning task for GAN models in power systems at 52.5%, followed by prediction at 27.1%. The right pie chart indicates that DER (Distributed Energy Resources) represents the dominant application area for GAN models at 76.2%, with PQ (Power Quality) accounting for 15.3%. Finally, as may be viewed in
Figure 12, the left bar chart shows that a collection of other evaluation metrics that were not covered in this review have the highest count at 42, followed by Mean Absolute Percentage Error (MAPE) at 8 and Root Mean Squared Error (RMSE) at 7. The right bar chart indicates that a collection of other probability measurement metrics that were not covered in this review are most frequent with a count of 48, while CRPS, Entropy, SGS, PI, CE, STD, WD, and Variance each have a count of 10.
Figure 13 shows the distribution of different evaluation metrics for machine learning tasks where Generative Adversarial Network (GAN) models are used in power system applications.
Right: The distribution of probability measurement metrics used to quantify uncertainty in power system applications involving GAN models. The left bar chart shows a collection of other evaluation metrics that were not covered in this review have the highest count at 42, followed by Mean Absolute Percentage Error (MAPE) at 8 and Root Mean Squared Error (RMSE) at 7. The right bar chart indicates that a collection of other probability measurement metrics that were not covered in this review are most frequent with a count of 48, while CRPS, Entropy, SGS, PI, CE, STD, WD, and Variance each have a count of 10.
3.4. Diffusion Models
Diffusion models progressively add noise to data until they become pure noise and then learn to reverse this process to generate new data samples. This approach has recently achieved impressive results in various generative tasks and is gaining traction in the power systems domain. This section reviews the emerging applications of Diffusion models in power systems, focusing on their potential for data generation and probabilistic modeling.
One area of focus for Diffusion models is addressing data scarcity and generating synthetic data for various power system applications. This may be seen in several works, such as [
79], which addresses the problem of limited training data offered to train a load forecasting model and proposes a two-step generative model-assisted approach for forecasting under small sample scenarios. First, the dataset is augmented, and then a regressor is trained on the augmented data. Two augmentation models are compared, TimeGAN and TS-Diffusion, and four regressor models, XGBoost, CatBoost, RandomForest, and ExtraTree. The results show that augmenting the dataset is effective for better forecasting when using a Diffusion model and that the best regressor for the model is ExtraTree. Furthermore, work [
80] addresses the dynamics of electricity prices in power markets by analyzing irregular time series data and defining stochastic models to describe their behavior. The proposed methodology includes filling data gaps, detecting Gaussian components, and estimating a Diffusion model of power prices across two different time periods. The jump amplitude used in the Diffusion model is described by a normal random variable and a truncated Lévy distribution, enabling the reproduction of the first four moments of the log-returns distribution. The analysis is applied to markets such as SP15 and Palo Verde, demonstrating alignment between the model and empirical data. Results distinguish between normal market periods and price spikes, offering a comprehensive analytical tool for studying power price dynamics. In addition, study [
81] offers a new method to mitigate parameter degeneracy in system dynamics. They undertake it by using a JCDI model and a Transformer encoder-based denoise neural network. In order to choose the sensitive parameters for identification, they use the Sobol method. This method can reveal the sensitivity discrepancies under different fault events, produce for specific disturbances multiple parameter sets, and enhance parameter estimation accuracy in degenerate cases. Moreover, paper [
82] introduces a Conditional Latent Diffusion Model (CLDM) for short-term wind power scenario generation, addressing uncertainty in renewable energy forecasting. The model combines deterministic forecasting with forecast error scenario generation, utilizing an embedding network to extract relevant features from Numerical Weather Prediction (NWP) data. By performing the diffusion process in a latent space, the model reduces denoising complexity and generates high-quality scenarios with fewer diffusion steps. Compared to state-of-the-art methods like GANs and VAEs, CLDM demonstrates superior performance in accuracy and efficiency, validated through rigorous numerical studies. The proposed method provides a practical tool for power system operators to improve forecasting accuracy, aiding in unit commitment, market trading, and economic dispatch of renewable energy systems. Similarly, work [
83] offers a universal data generation framework for energy time series data called EnergyDiff. The generated data the model creates are supposed to resolve the lack of high-resolution data. This framework is based on DDPM with a Marginal Calibration technique (which calibrates the inaccurate DDPM marginal distribution) that increases the accuracy and yields precise marginal distributions in various domains. Another related study is [
84], which constructs a hybrid model based on DDPM and GAN for the load sample generation tasks in a DHS (District Heating System) and establishes the relationship between load samples and indoor temperature. It provides a complete data chain from “production to users” for DHS operation optimization and fault diagnosis. The study compares a GAN and DDPM and shows that the GAN is more accurate, while DDPM is more generic, robust, and easier to train, and the hybrid model suggested tries to use the advantages of both methods. To evaluate the effectiveness of the generated samples, an indoor temperature response model, is built. The entire model guides a more efficient and convenient operation of a DHS. Furthermore, work [
85] proposes an FDIA (False Data Injection Attacks) data recovery framework comprising two key models: the FDIA localization model and the data recovery model. The increasing integration of renewable energy sources and power electronic devices introduces significant randomness in both power generation and loads, leading to significant power fluctuations that challenge the accuracy of existing FDIA detection and recovery methods. The first stage of the mechanism consists of an LMPNN and a hidden space that produce an input for the second stage. This one consists of a DDGM model that uses the input, DDIM, and physical constraints, allowing it to recover valid data. This method shows robustness compared to alternative techniques, as well as high FDIA localization and data recovery performance even under uncertain high-level power fluctuations. Finally, work [
86] develops an SSSD-based transient trajectory generation framework to tackle the data insufficiency problem for power system applications. That is because real system simulations are mostly unavailable, and even if available, they are very time-consuming. The algorithm is designed based on a conditional time series Diffusion model that adds random noise and denoises it to create new data samples. Those samples are taken to reproduce multivariable trajectories so that their generation is guided to a desired dynamic behavior. The proposed framework can be used on a detailed system model to simplify the generation of dynamic response data. Furthermore, article [
87] proposes a data-driven method for scenario generation of renewable energy production. They introduce a controllable GAN model with a latent controllable vector in manifold space, enabling deliberate modification of generated scenarios. This solution can also generate new scenarios which can be statistically characterized and explored. In addition, work [
88] proposes the usage of a Conditional GAN to craft false data that can be injected as measurements to attack and circumvent the smart grid’s BDDs (bad data detectors). The CGAN and algorithm introduced only need access to the grid’s measurement data and to know what data types to inject to produce the threat model. Simulation results showed that the CGAN-based FDIA can bypass the BDD with a very high probability (0.99). Next, article [
89] proposes a deep learning framework for predicting power consumption (PC) and RES power generation (PG) in residential and commercial buildings. Since PC and PG data are usually insufficient, they also introduce a method to use a GAN-based methodology to enlarge AI datasets for their work and future studies. Moreover, Ref. [
90] proposes a novel PV system planning framework for distribution grids built as a two-stage stochastic optimization model. To address uncertainties in PV production and load demand, it introduces a GAN-based data-driven approach for scenario generation, which leads to comprehensive PV planning decisions. Additionally, the framework incorporates volt-var control using smart PV inverters to improve voltage regulation and reduce power losses. Next, Ref. [
91] proposes a novel federated deep learning method for renewable scenario generation called Fed-LSGAN. This method enables learning on a central server, which receives parameters from different sites rather than collecting all their data. Each site captures spatiotemporal characteristics and sends them to the server. By that, the model preserves the sites’ privacy while learning and generating scenarios using shared inputs from all sites. Simulations show that the model outperforms other state-of-the-art centralized methods.
Beyond data generation, Diffusion models are also being explored for prediction and forecasting tasks, as may be seen in the following reviewed studies. For instance, work [
92] analyzes wind power technology using the Generalized Bass Model (GBM) framework, incorporating both endogenous and exogenous dynamics, such as local incentive schemes. By comparing GBM with traditional Diffusion models, the study demonstrates GBM’s superior performance in model selection and forecasting accuracy across various metrics. A cross-country analysis highlights differences in wind power adoption, with specific focus on the US and Europe due to their comparable geographic areas. The findings emphasize the importance of integrating localized incentives into Diffusion models to enhance predictive reliability. Short-term forecasts generated through GBM offer practical insights for policymakers and industry stakeholders aiming to optimize wind power deployment strategies. This work bridges existing gaps in wind power diffusion studies and provides a robust methodological advancement for energy forecasting. In addition, paper [
93] explores the application of denoising diffusion probabilistic models for energy forecasting, focusing on load, photovoltaic, and wind power time series. Using data from the Global Energy Forecasting Competition 2014, the authors evaluate DDPMs against state-of-the-art deep learning generative models, including generative adversarial networks (GANs), Variational Autoencoders (VAEs), and normalizing flows (NFs). The methodology employs a Markov chain framework trained via variational inference to model time series, offering scalable and robust performance. Results demonstrate that DDPMs outperform competing models in terms of quality and value, marking the first successful implementation of this approach in energy forecasting. The work bridges a critical gap in probabilistic scenario generation for renewable energy. The findings suggest that DDPMs hold significant potential for advancing power system applications and addressing renewable energy challenges. In a similar manner, paper [
94] investigates the use of normalizing flows, a deep learning technique, to address the uncertainty in renewable energy generation and improve probabilistic forecasting for power systems. Unlike conventional statistical methods, normalizing flows directly learn the multivariate stochastic distribution of processes by maximizing likelihood, providing accurate scenario-based forecasts. The study evaluates this method using data from the Global Energy Forecasting Competition 2014 and compares its performance with state-of-the-art generative models such as GANs and VAEs. Results show that normalizing flows are competitive and effective in generating scenarios for wind, solar, and load forecasting, offering robust tools for energy applications like electricity market bidding and energy management. This methodology is also reproducible, encouraging further adoption by forecasting practitioners.
In the context of classification tasks, Diffusion models are being investigated for event classification uses, particularly in the presence of adversarial attacks. For example, work [
95] tackles the issue of adversarial attacks on machine learning-based power system event classifiers by introducing a Diffusion model-based purification method. The approach adds noise to compromised PMU data and uses a pretrained neural network to remove both noise and adversarial perturbations. By employing Denoising Diffusion Implicit Models (DDIMs), the method achieves real-time efficiency while reducing discrepancies between original and compromised data. Tests on a large PMU dataset show the method improves classification accuracy and supports reliable, real-time power system monitoring.
To summarize, there is a growing interest in Diffusion models for power system applications. These models learn to reverse a process of progressively adding noise to data, and may be used for a variety of purposes. This section reviews their applications in data generation, including addressing data scarcity and creating synthetic data for various purposes, as well as their use in probabilistic modeling for prediction, forecasting, and classification tasks. As presented in
Figure 14, there is an increasing interest, as shown by the growing number of research publications, focusing on Diffusion models in power system applications from 2019 to 2024. The number of publications shows a significant increase over the period, starting at a low of around 30 in 2019 and sharply rising to approximately 200 by 2024, indicating a substantial and growing interest in Diffusion models for this field. Moreover, as shown in
Figure 15, the left pie chart indicates that generation is the most prevalent machine learning task for Diffusion models in power systems at 58.4%, followed by prediction at 25.0%. The right pie chart shows that DER (Distributed Energy Resources) represents the largest application area for Diffusion models at 66.7%, with PQ (Power Quality) and EM (Energy Markets) accounting for 25.0% and 8.3%, respectively. Finally, as may be viewed in
Figure 15, the left bar chart reveals that Root Mean Squared Error (RMSE) is the most frequent evaluation metric with a count of four, followed by Mean Absolute Error (MAE) also at four, while a collection of other metrics that were not covered in this review account for a count of three. The right bar chart shows a relatively even distribution among the listed probability measurement metrics, with CRPS, ELBO, PS, SCS, STD, Variance, and a collection of other metrics that were not covered in this review each having a count of 10.
Figure 16 presents the distribution of different evaluation metrics of machine learning tasks for which Diffusion models are used in different power systems applications. It also shows the distribution of probability measurement metrics that were used to quantify uncertainty in different power systems applications involving Diffusion-based machine learning models. The left bar chart reveals that Root Mean Squared Error (RMSE) is the most frequent evaluation metric with a count of 4, followed by Mean Absolute Error (MAE) also at 4, while a collection of other metrics that were not covered in this review account for a count of 3. The right bar chart shows a relatively even distribution among the listed probability measurement metrics, with CRPS, ELBO, PS, SCS, STD, Variance, and a collection of other metrics that were not covered in this review each having a count of 10.


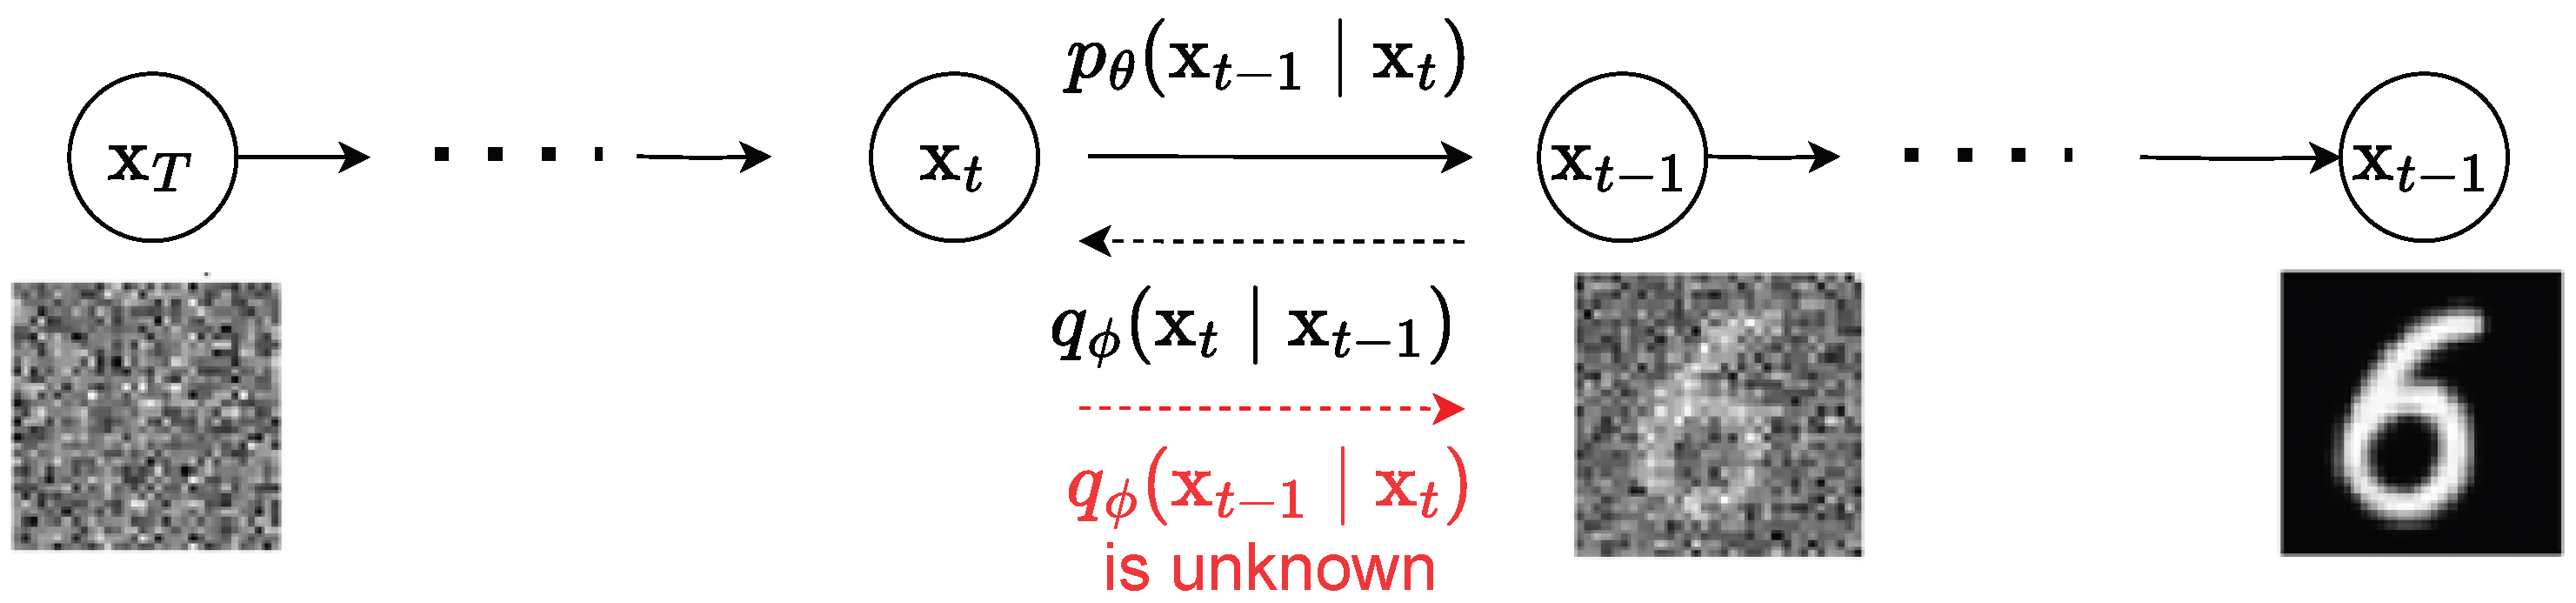
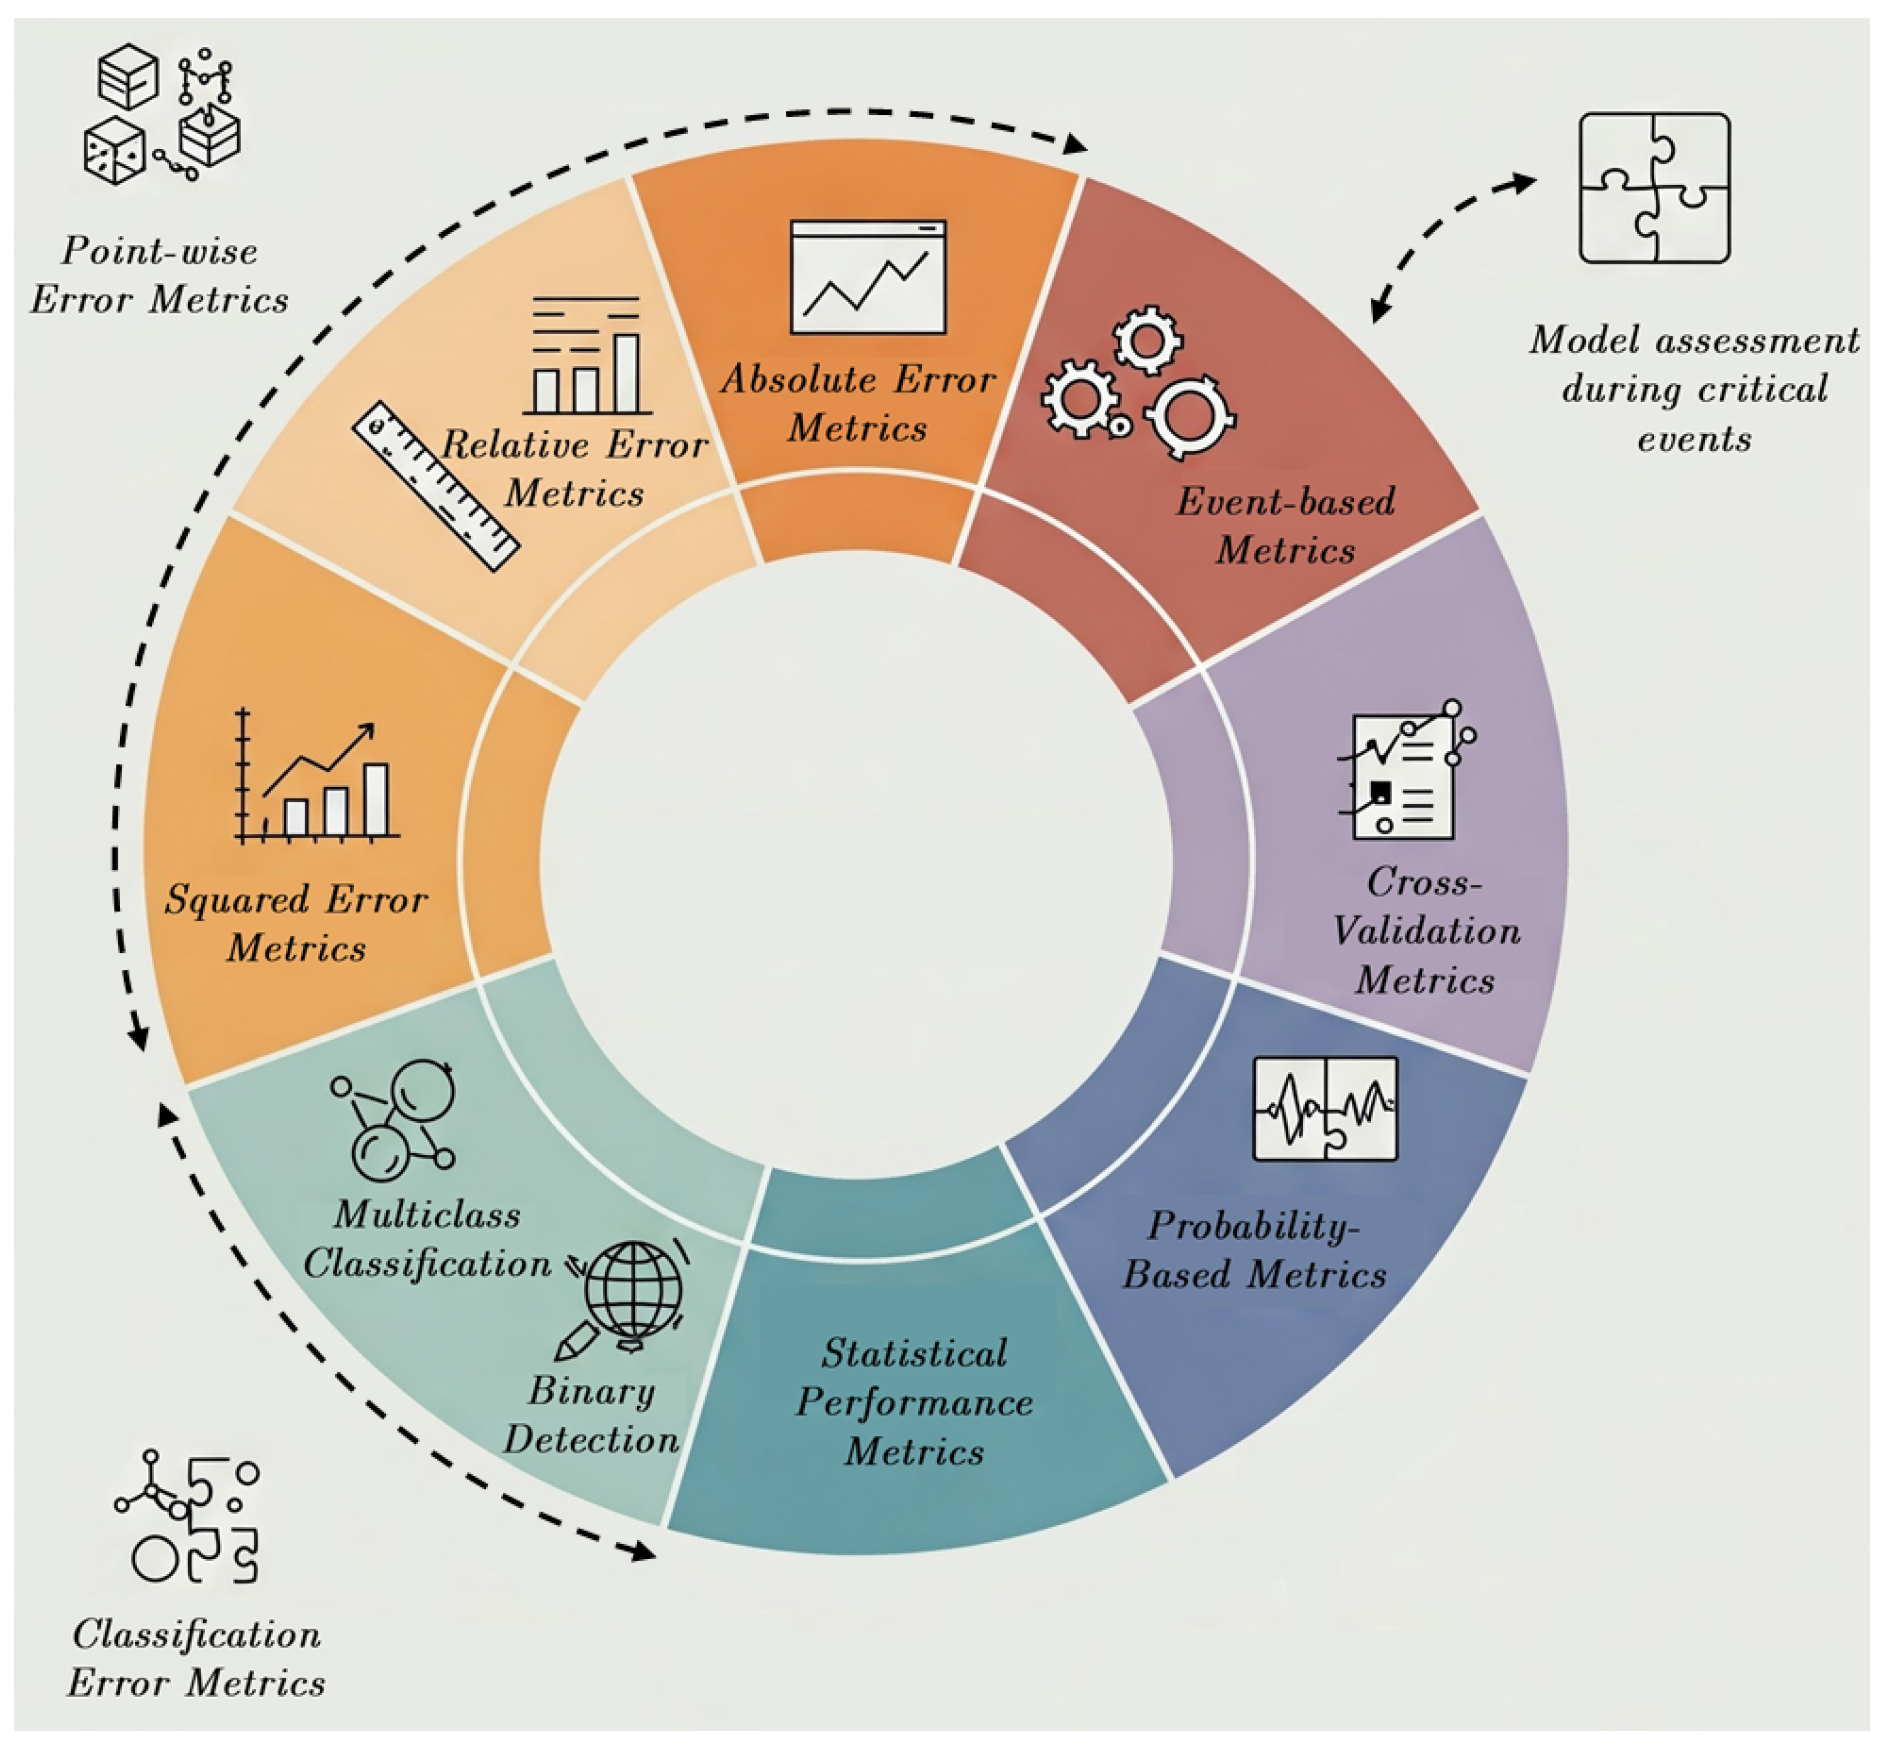
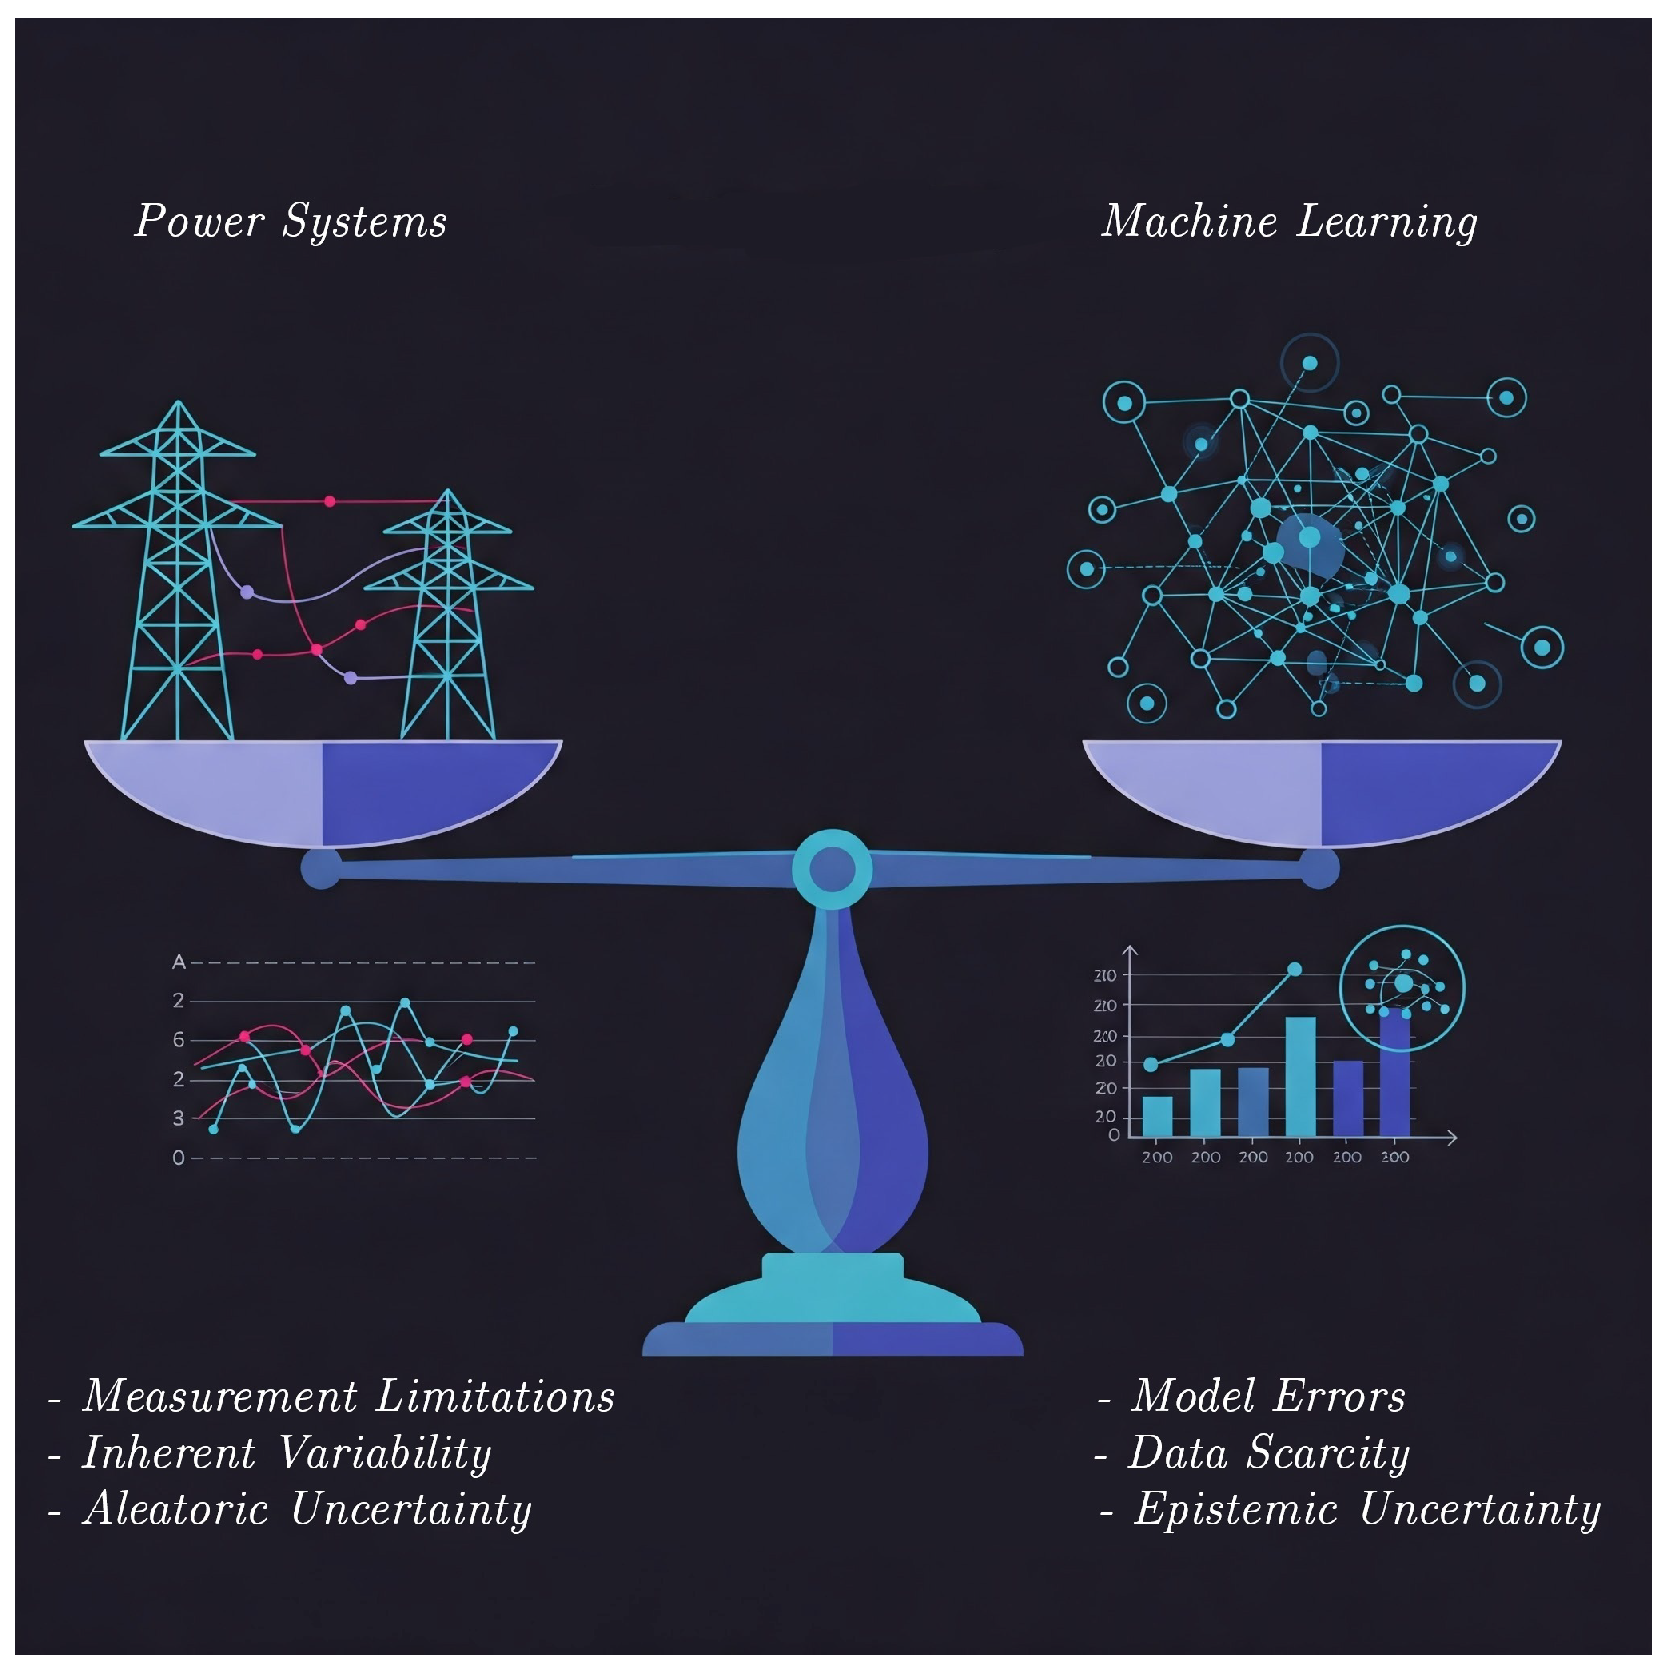
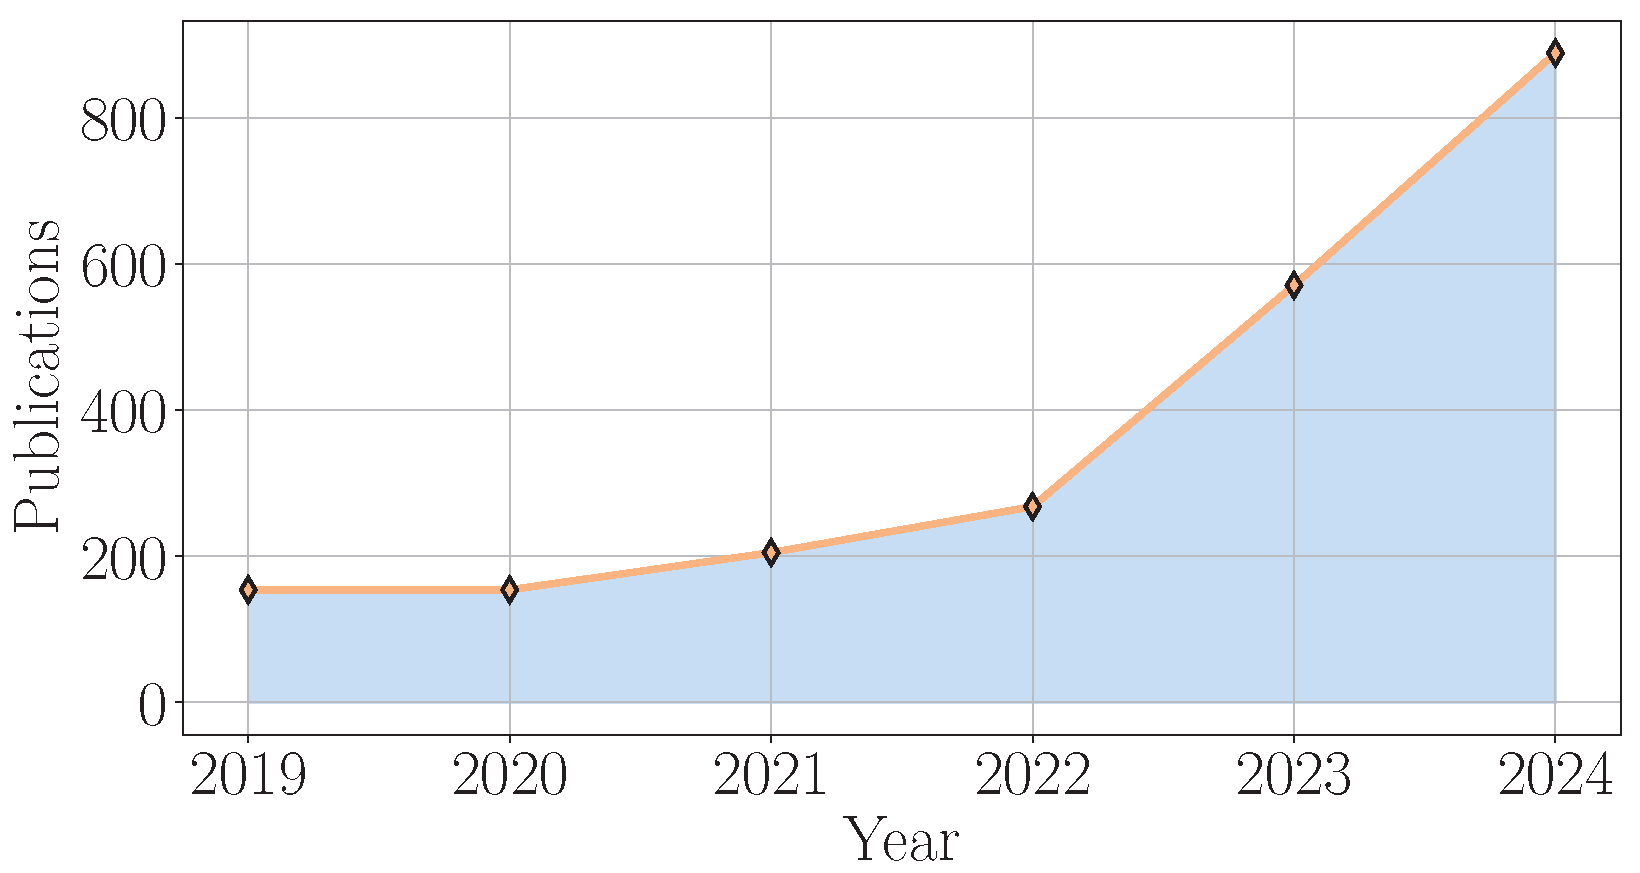
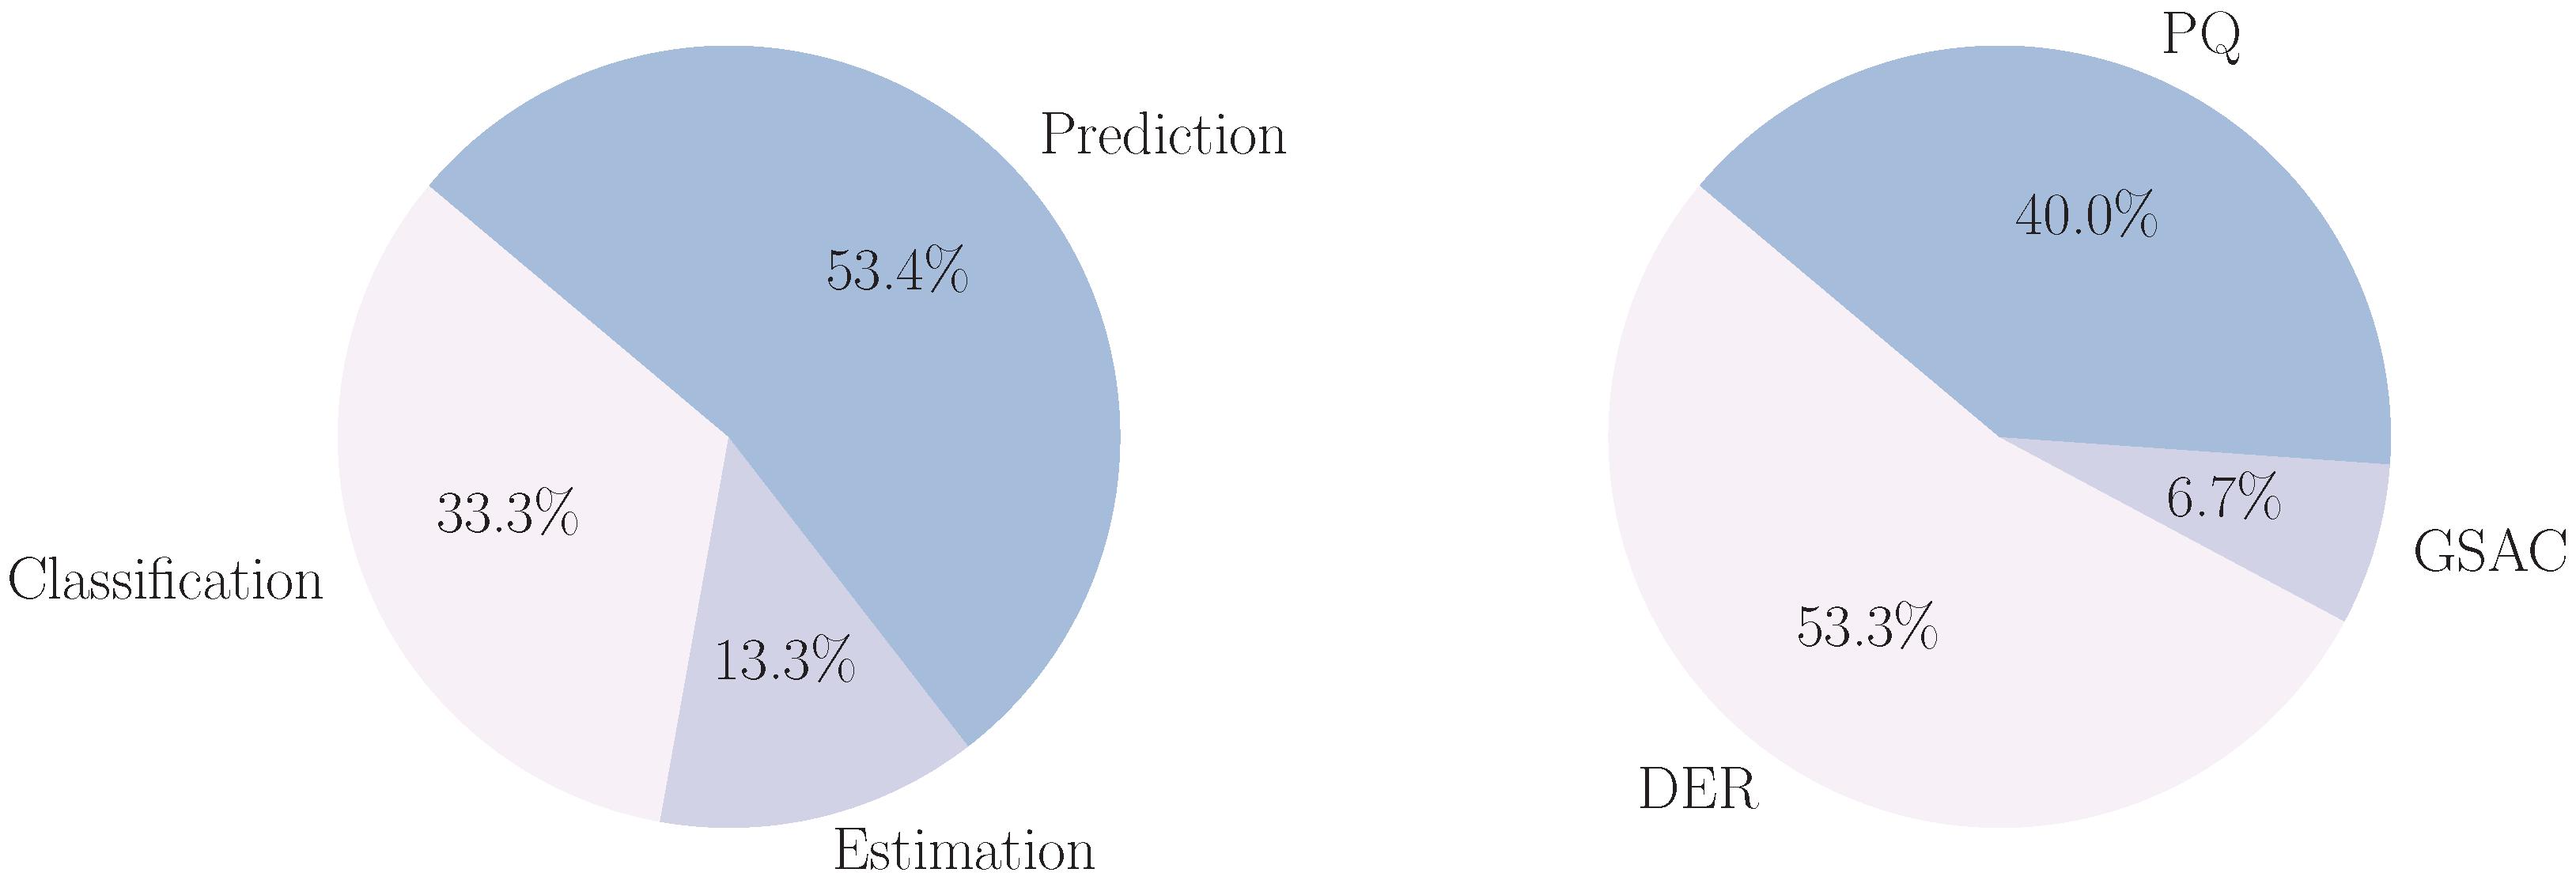
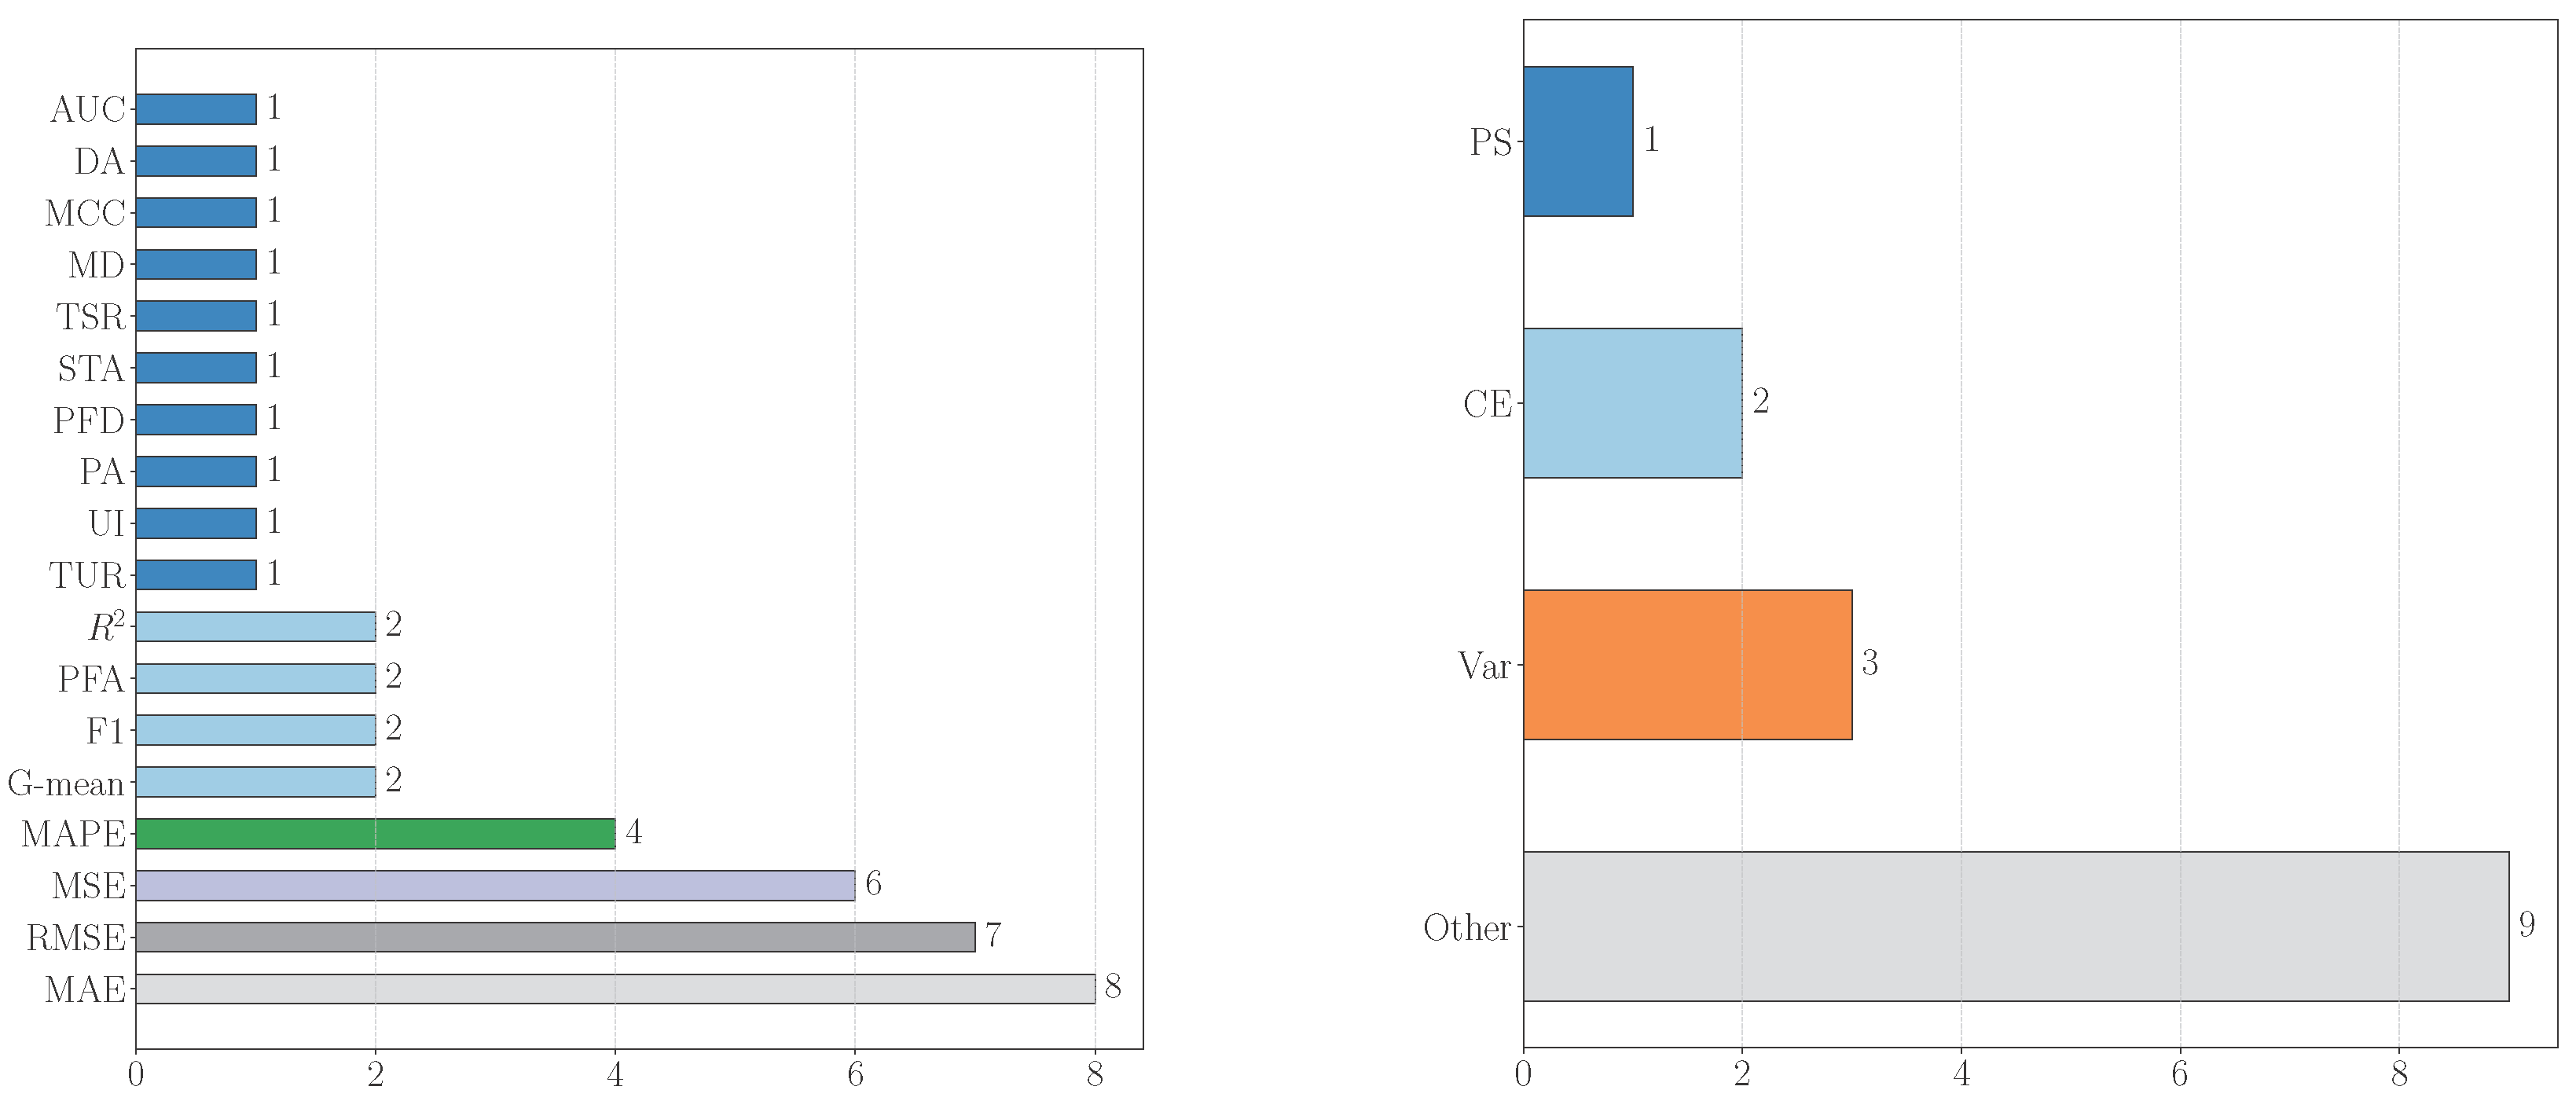
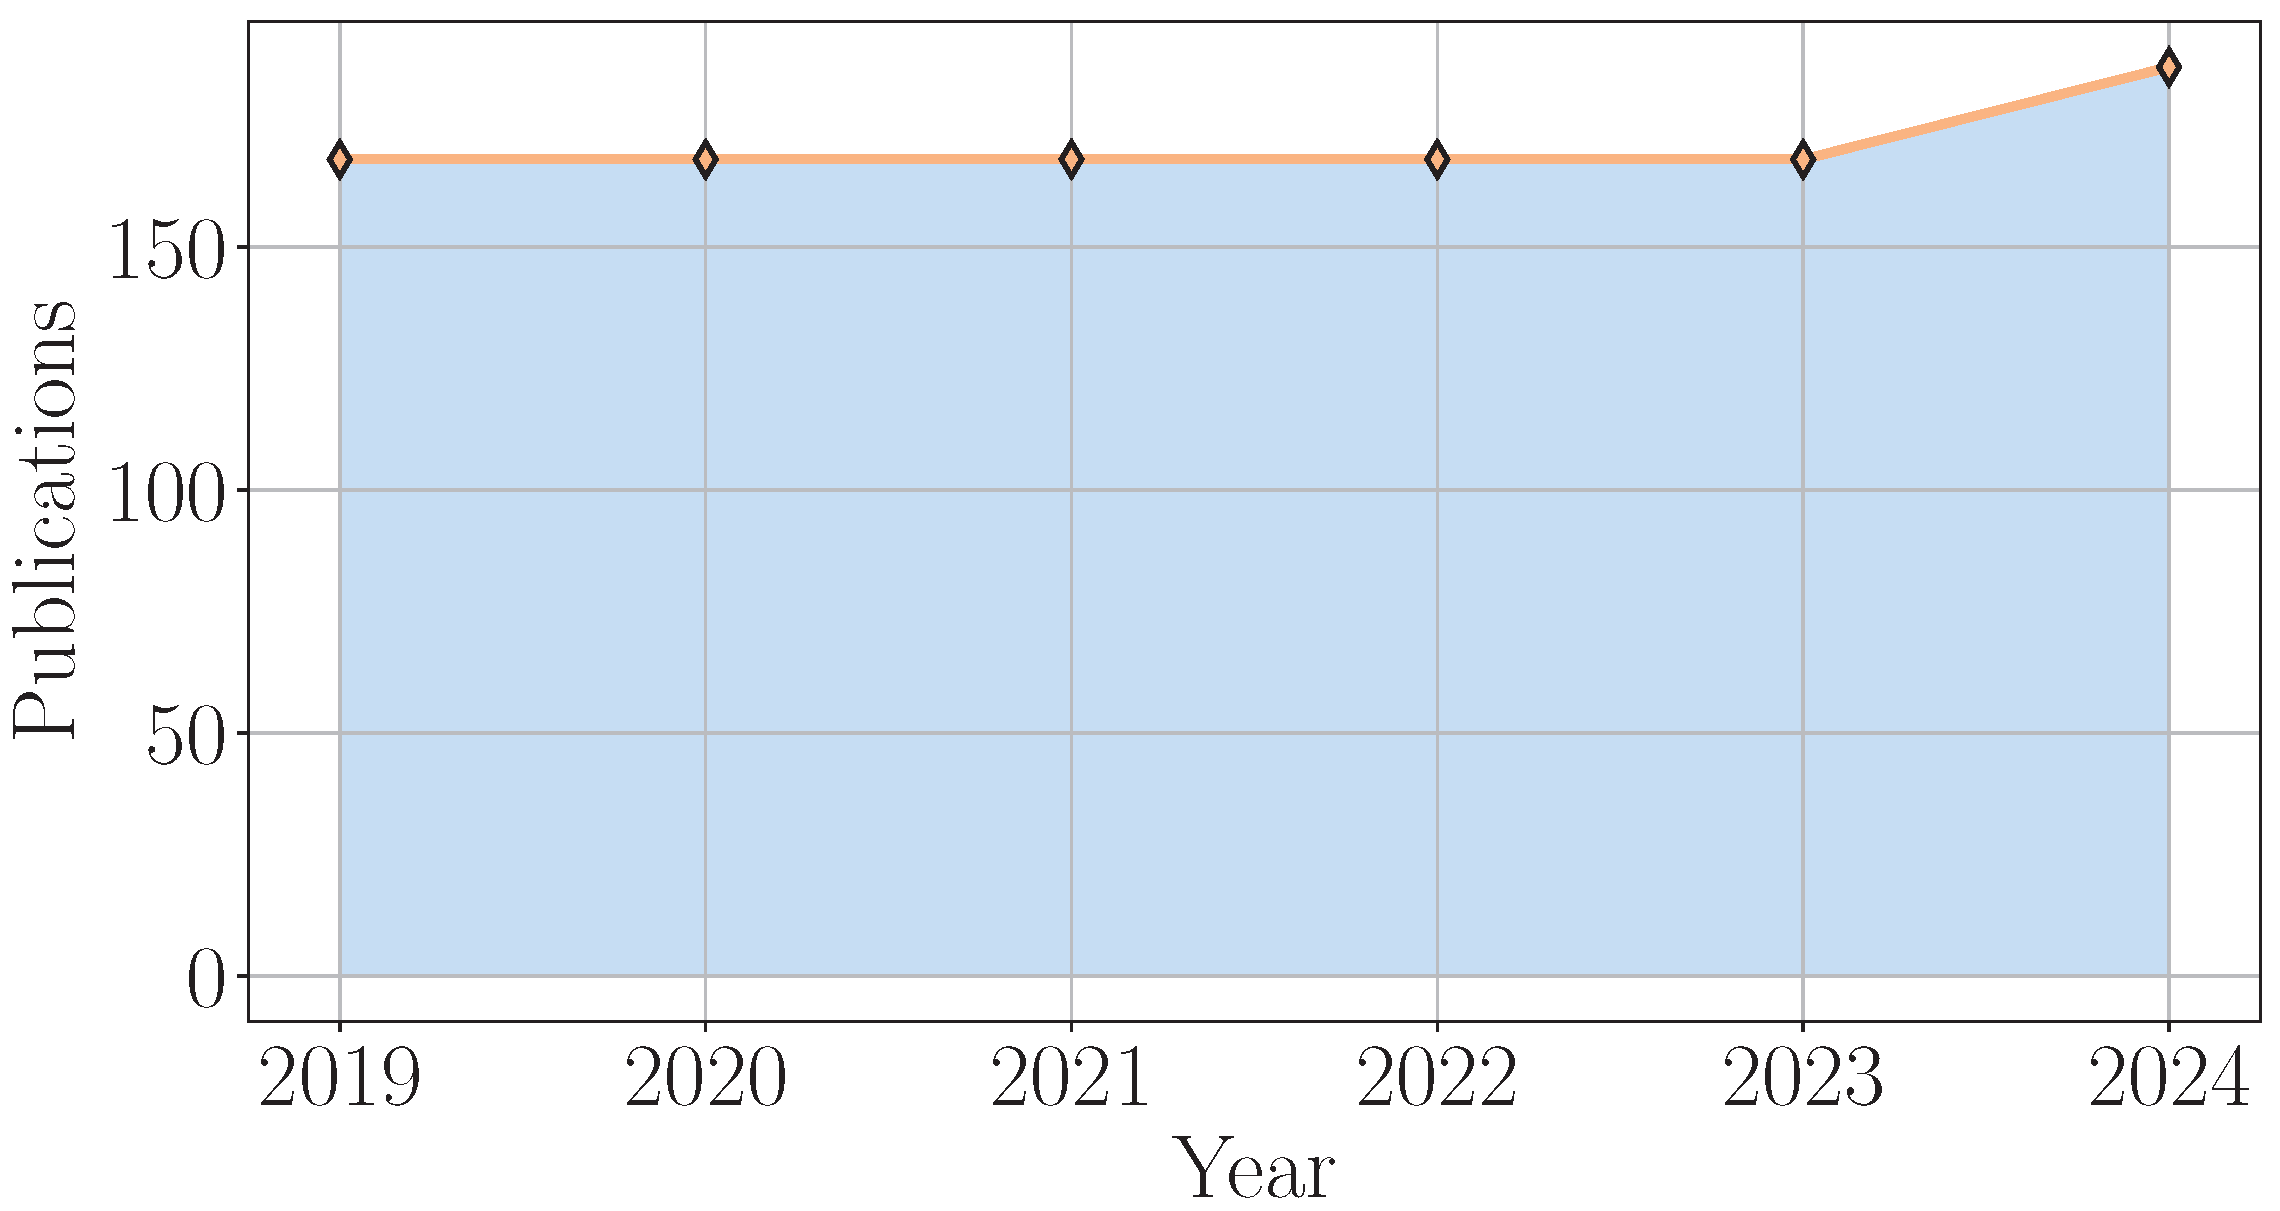
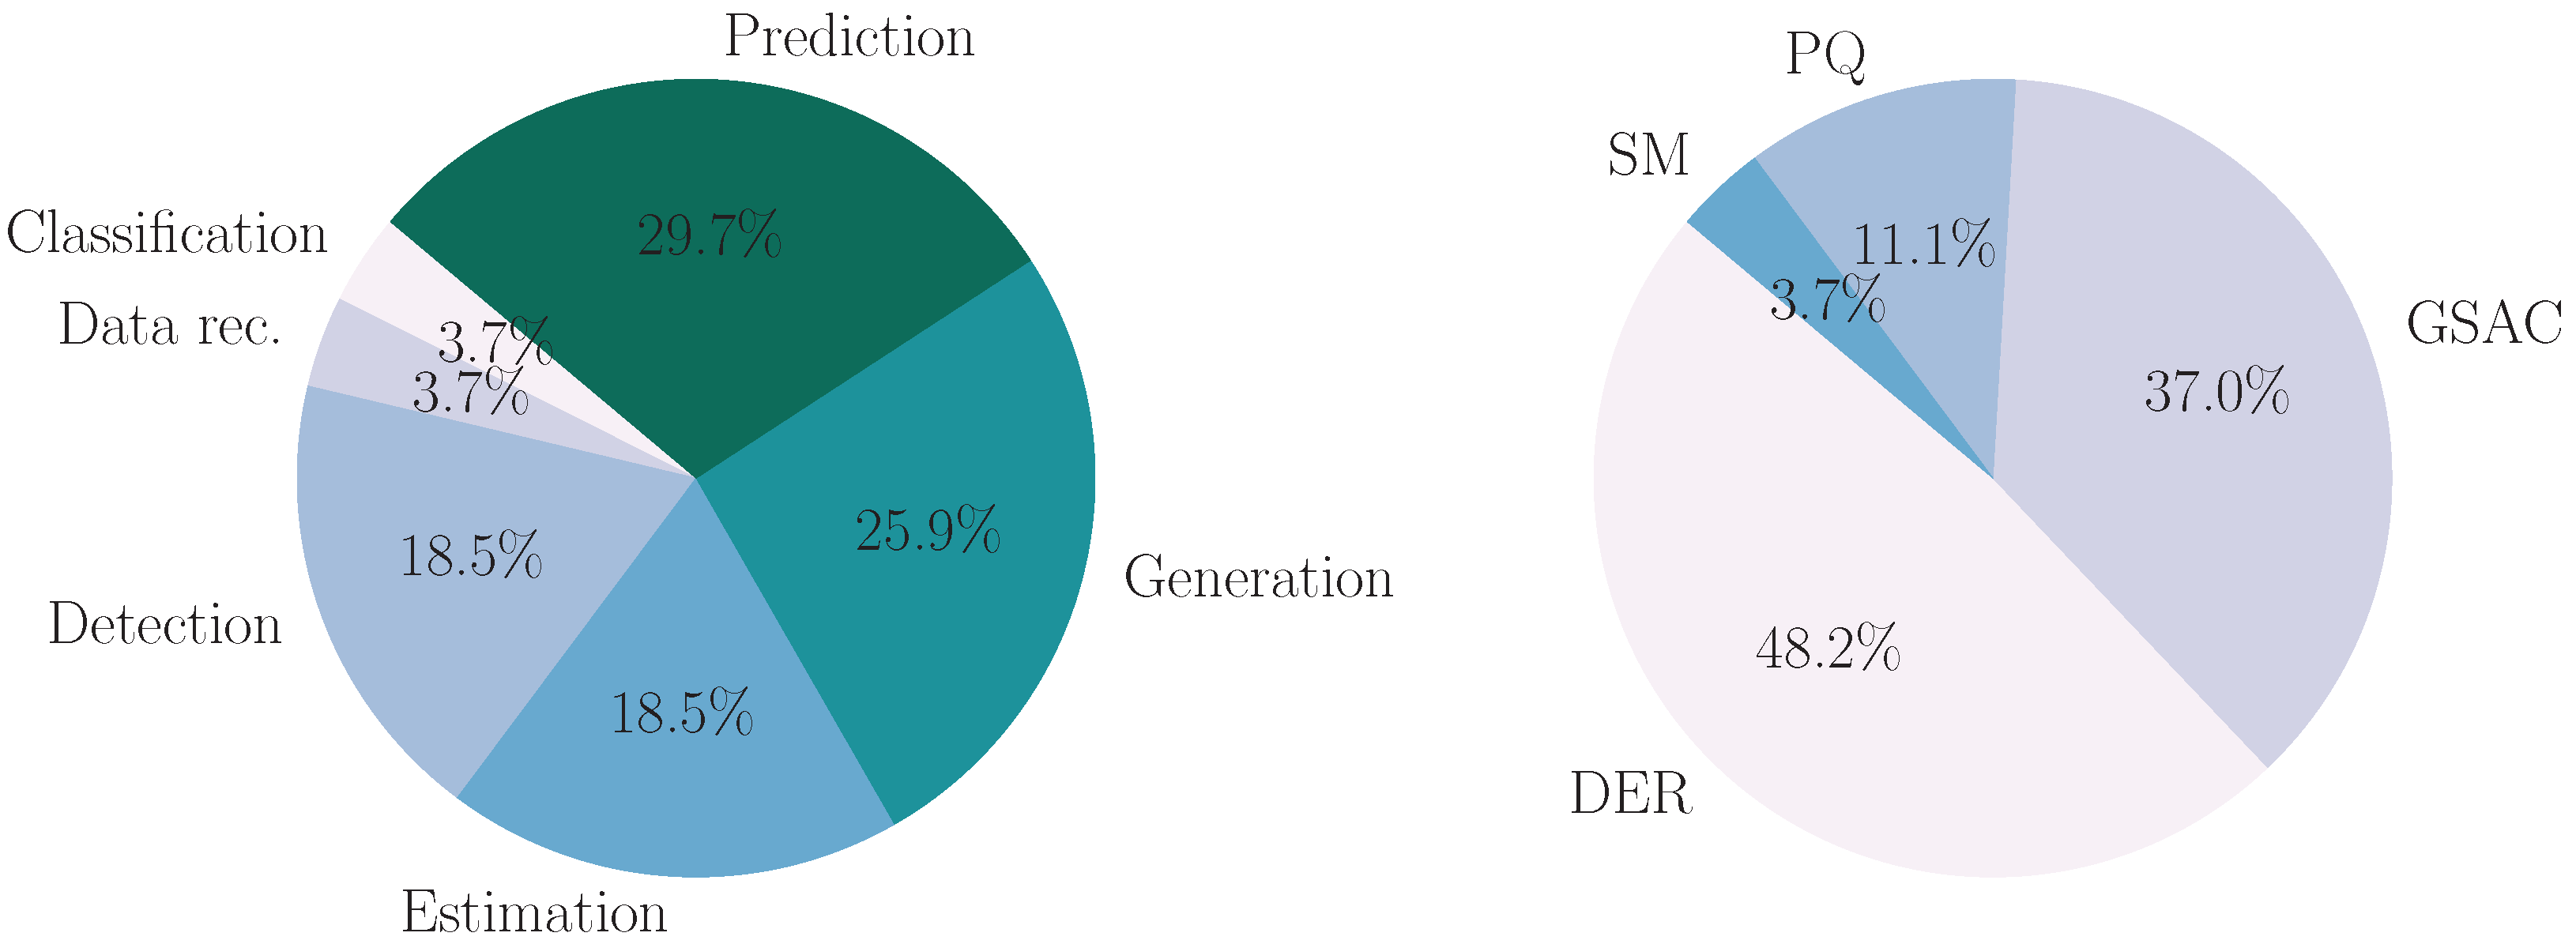
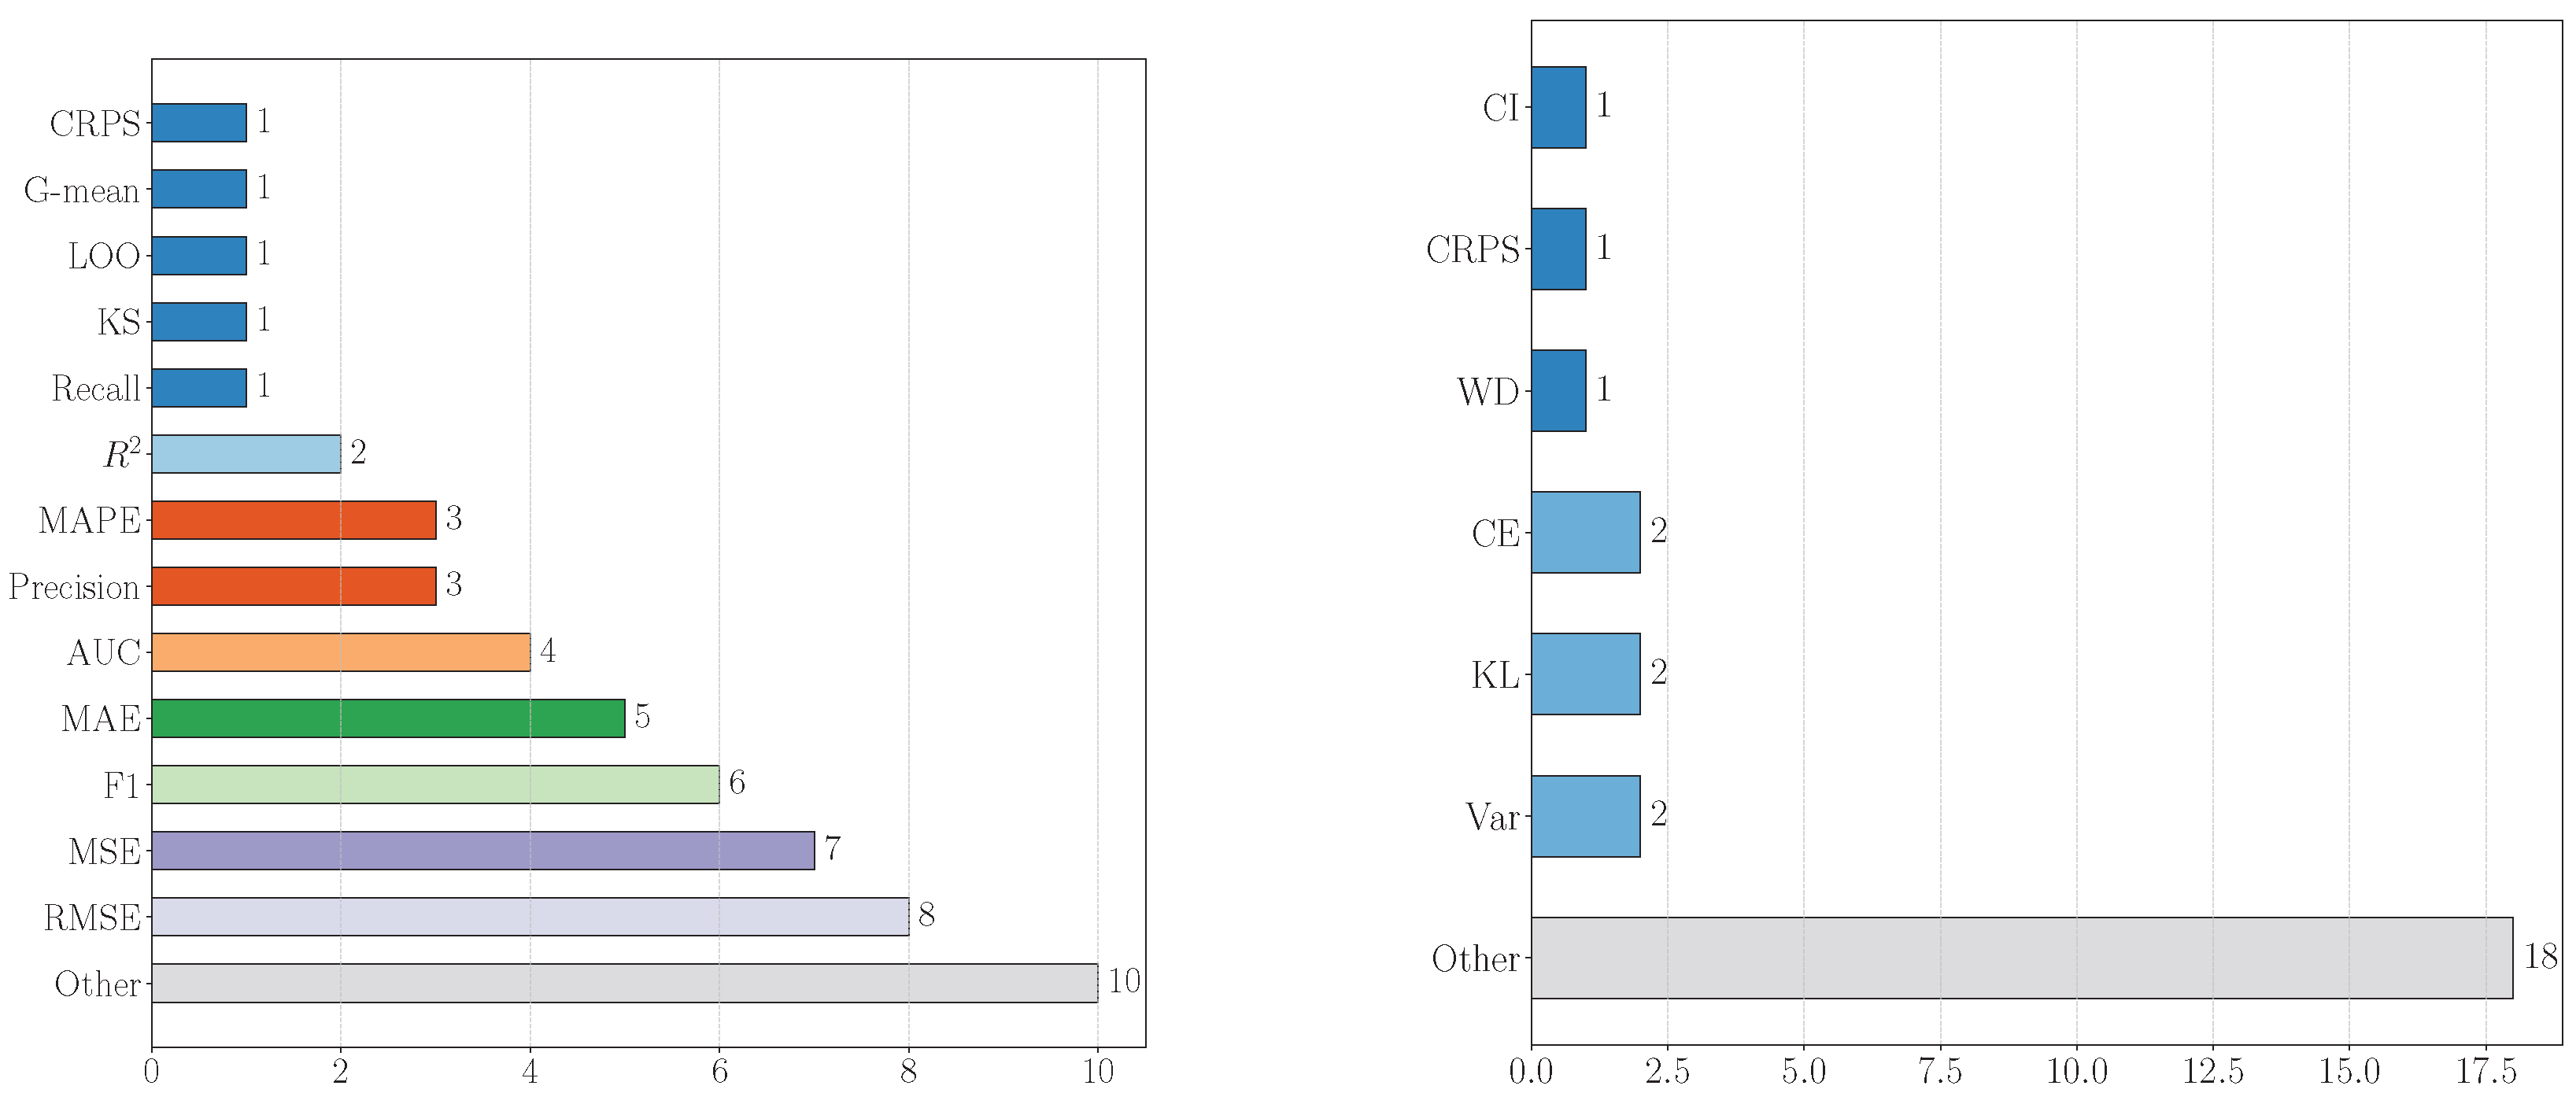
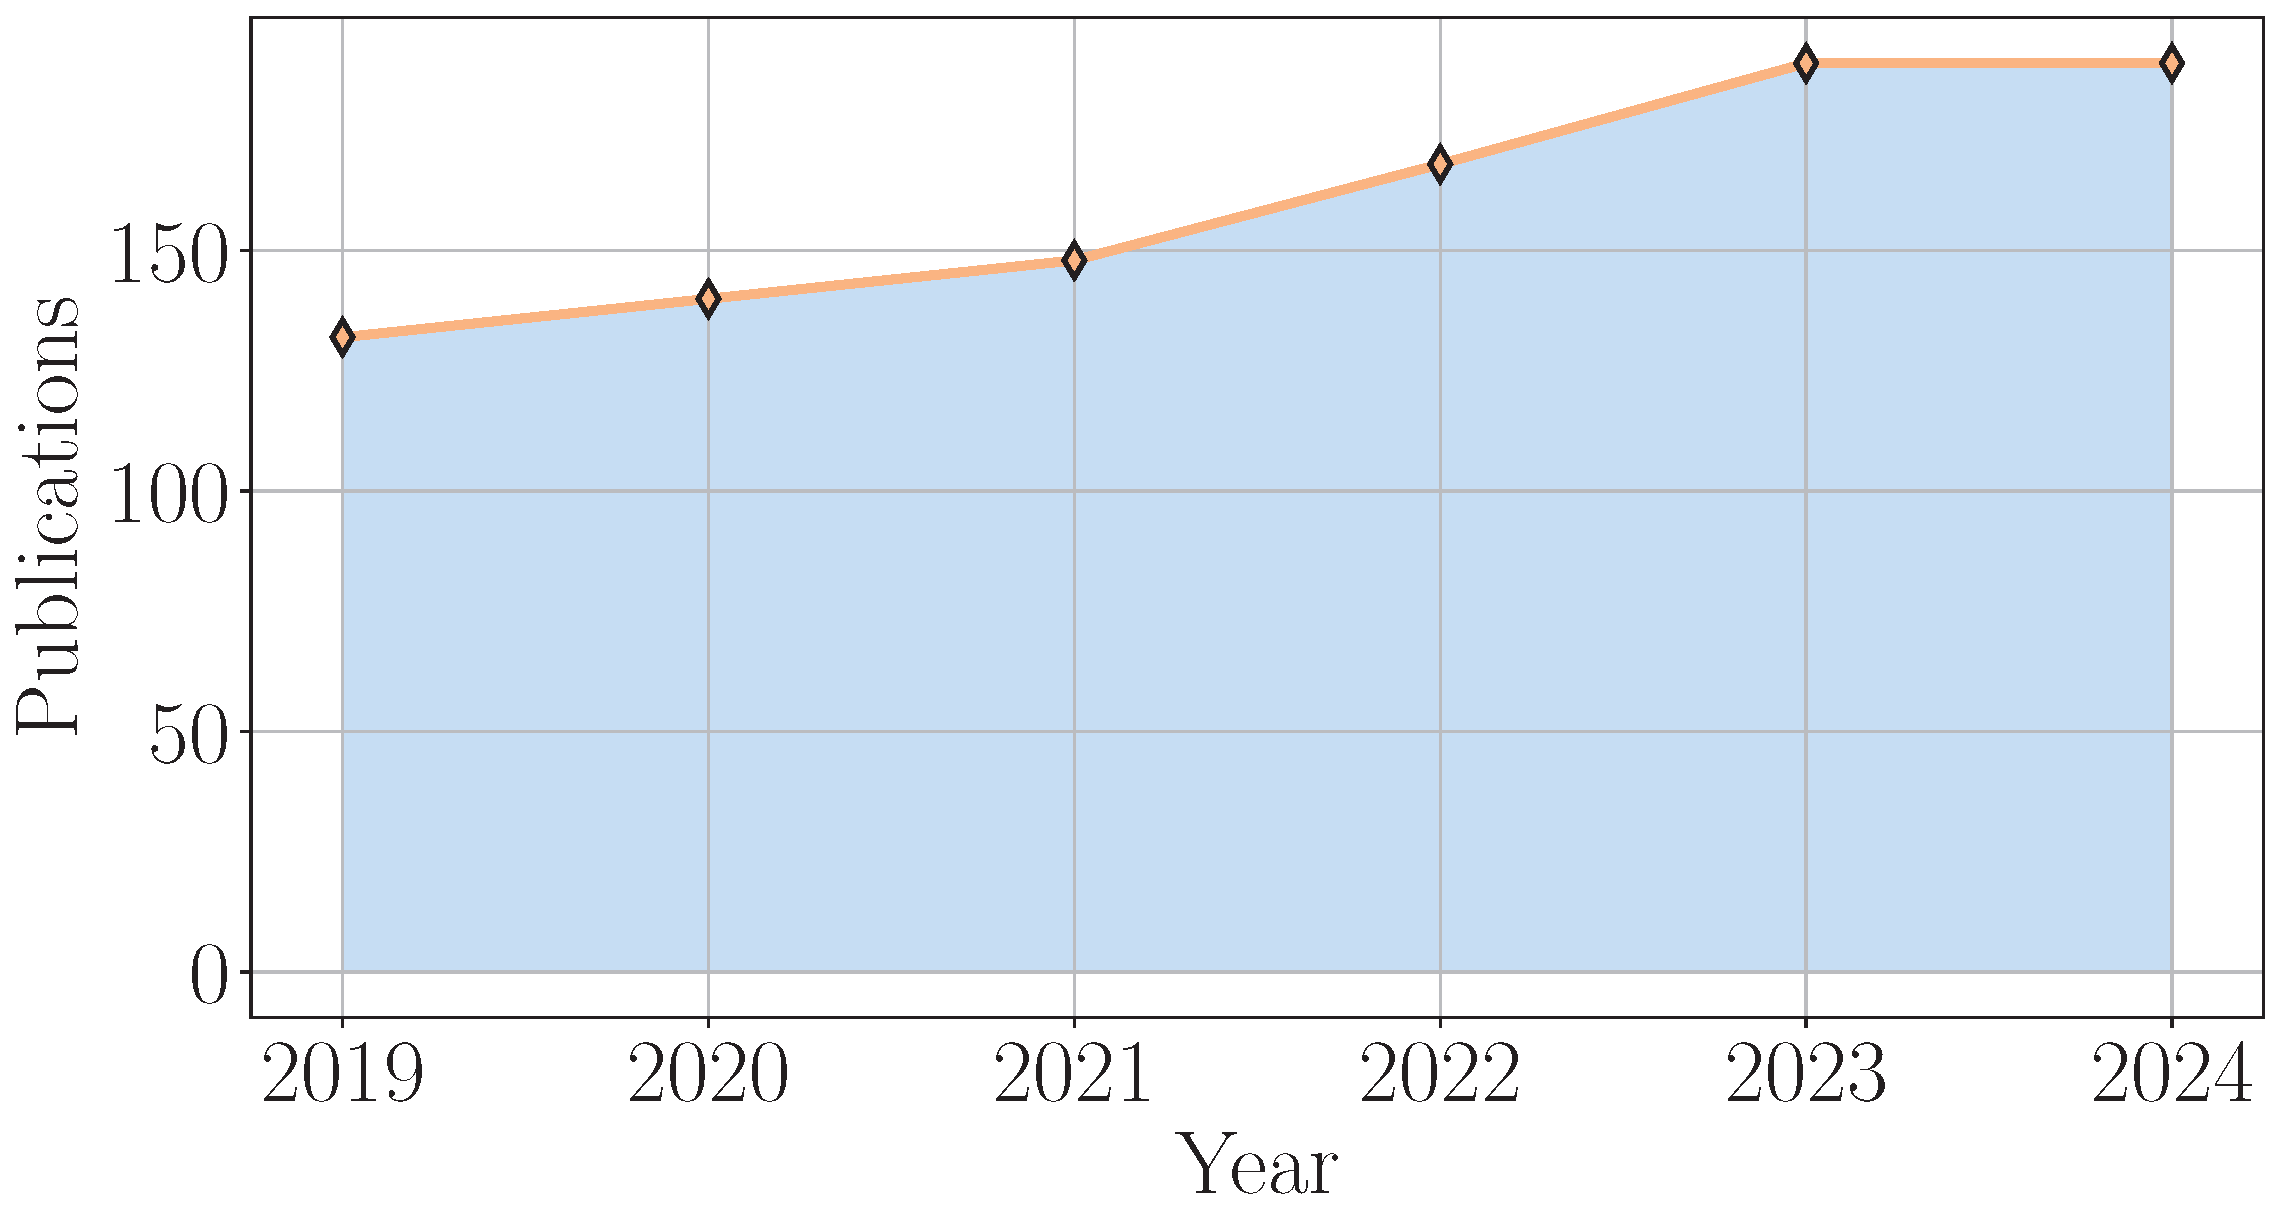
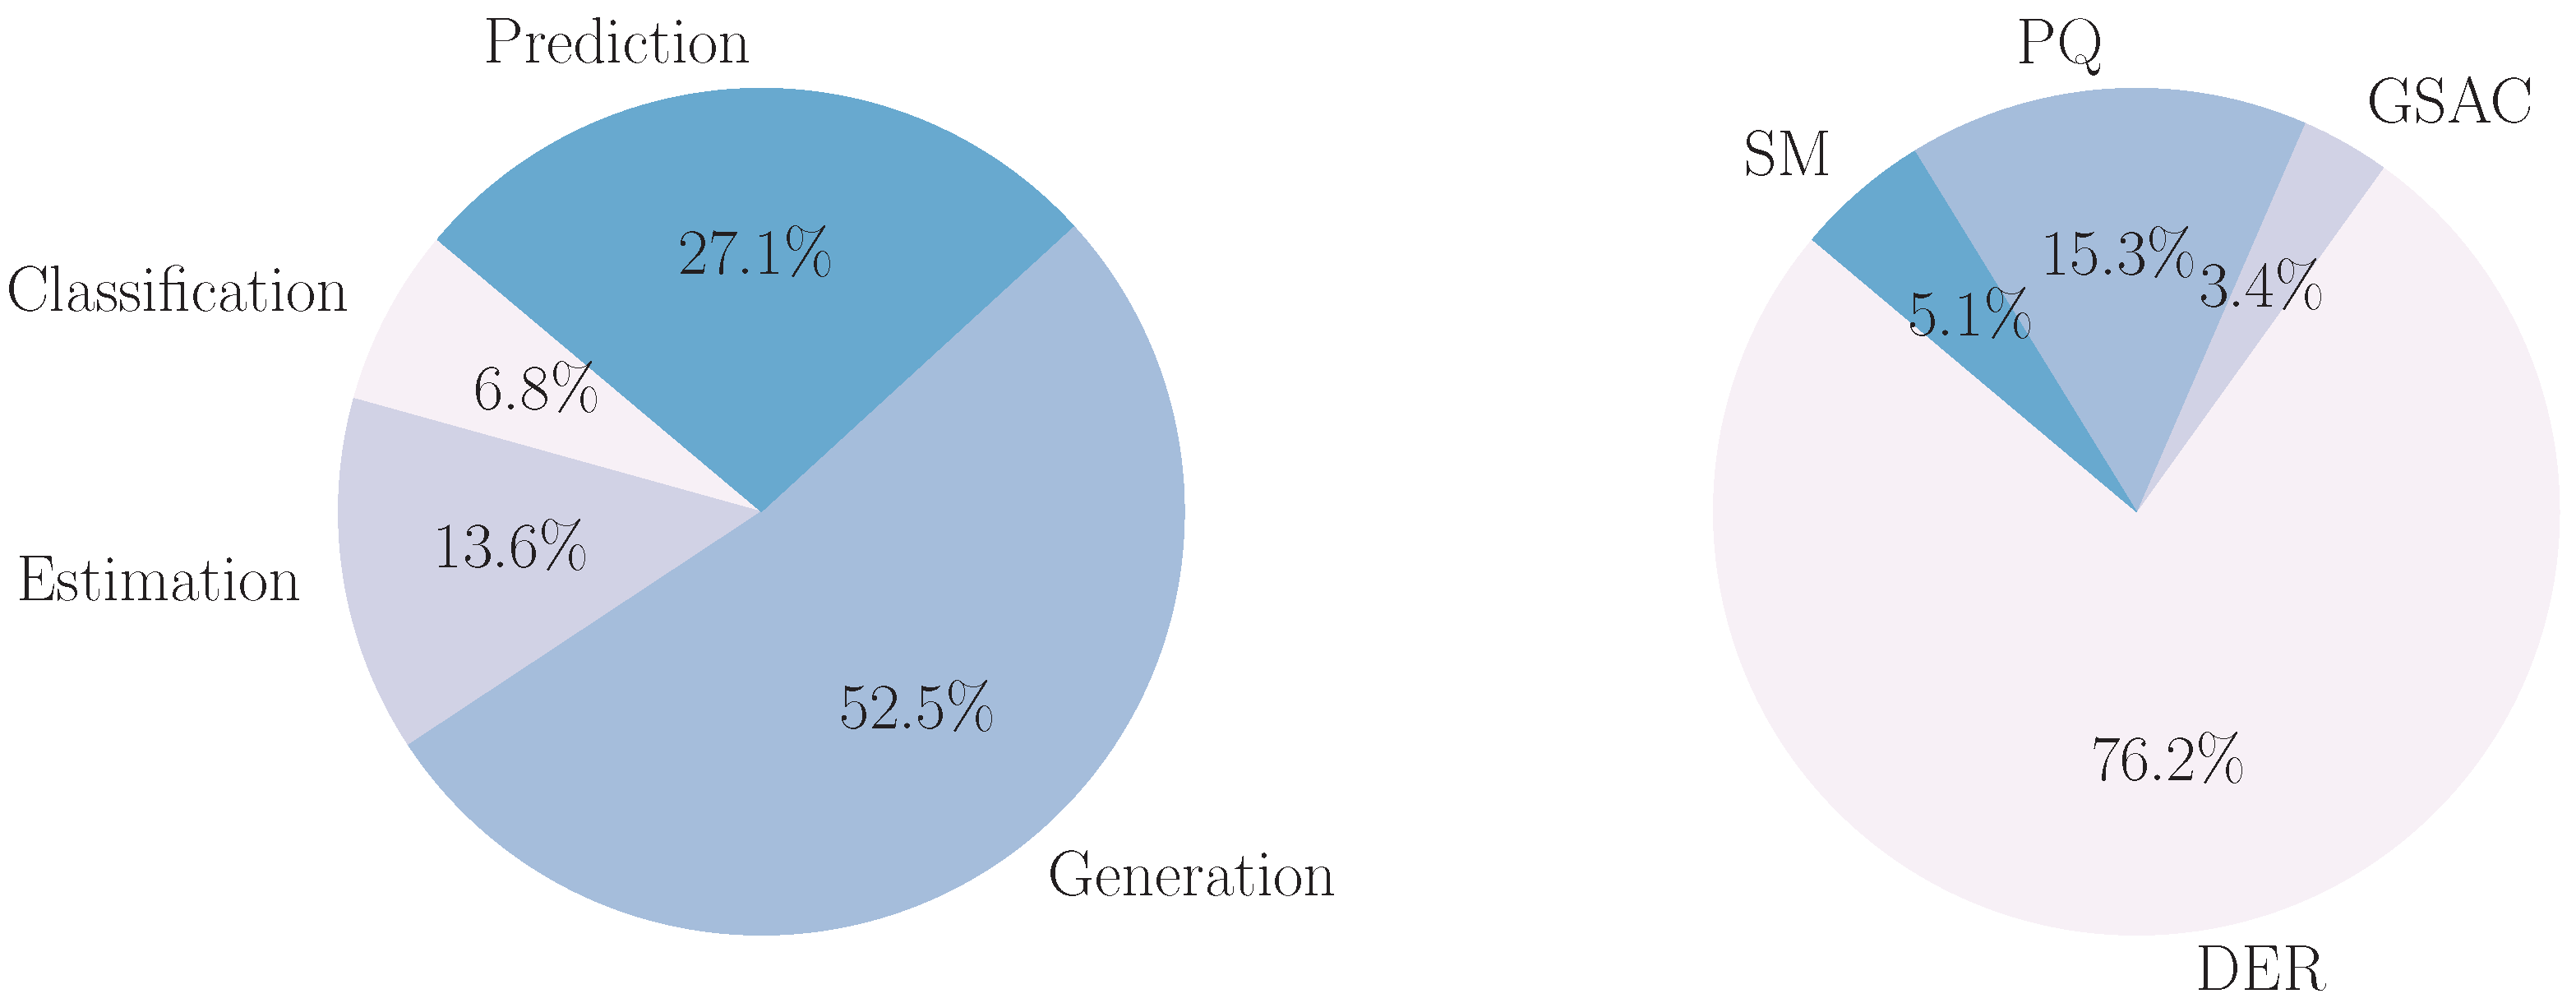
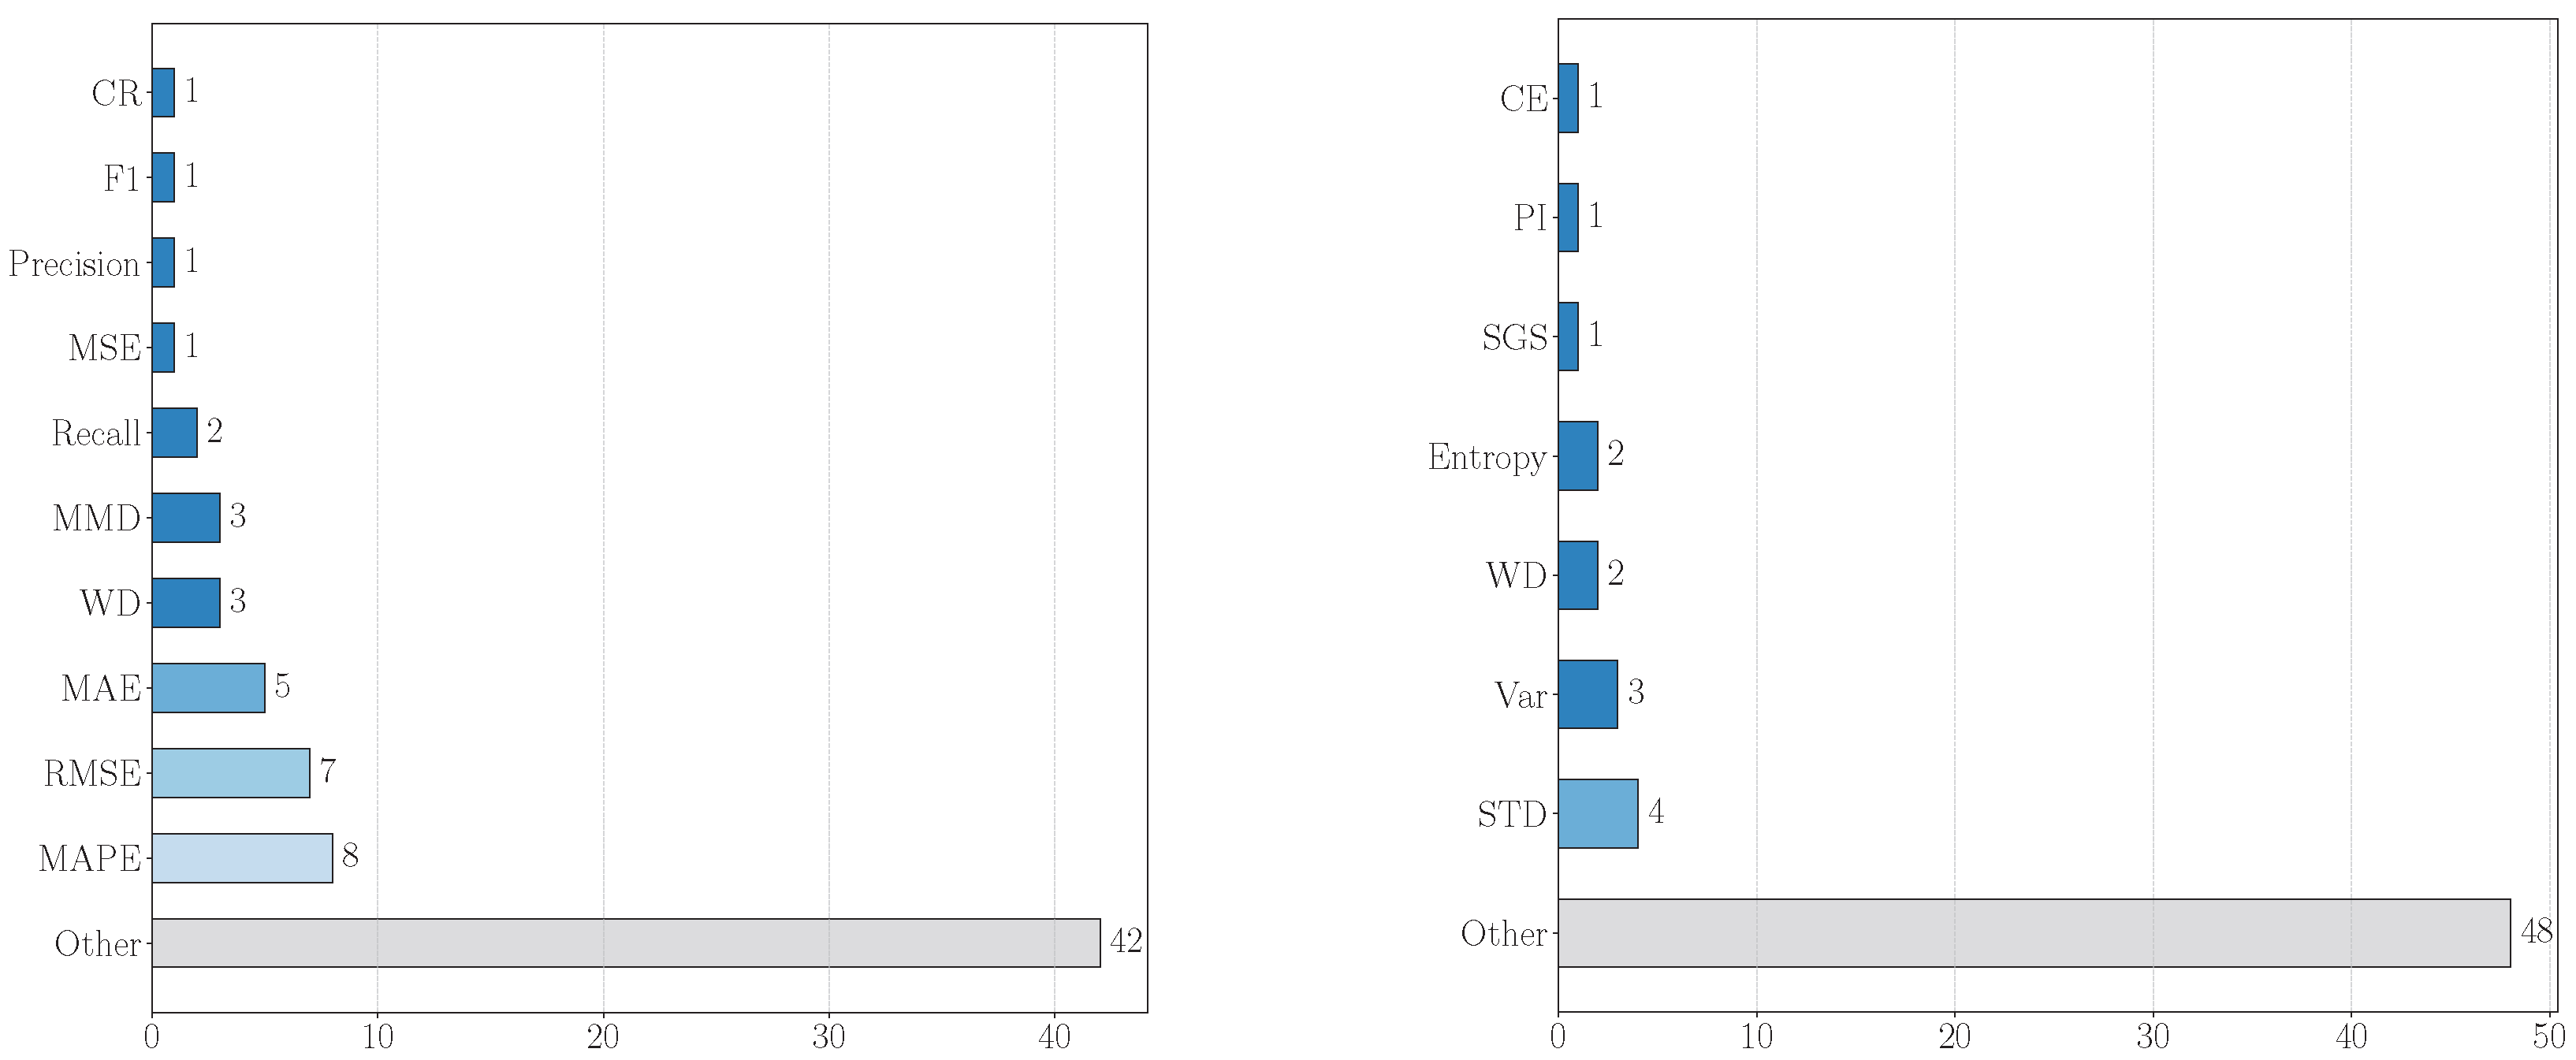
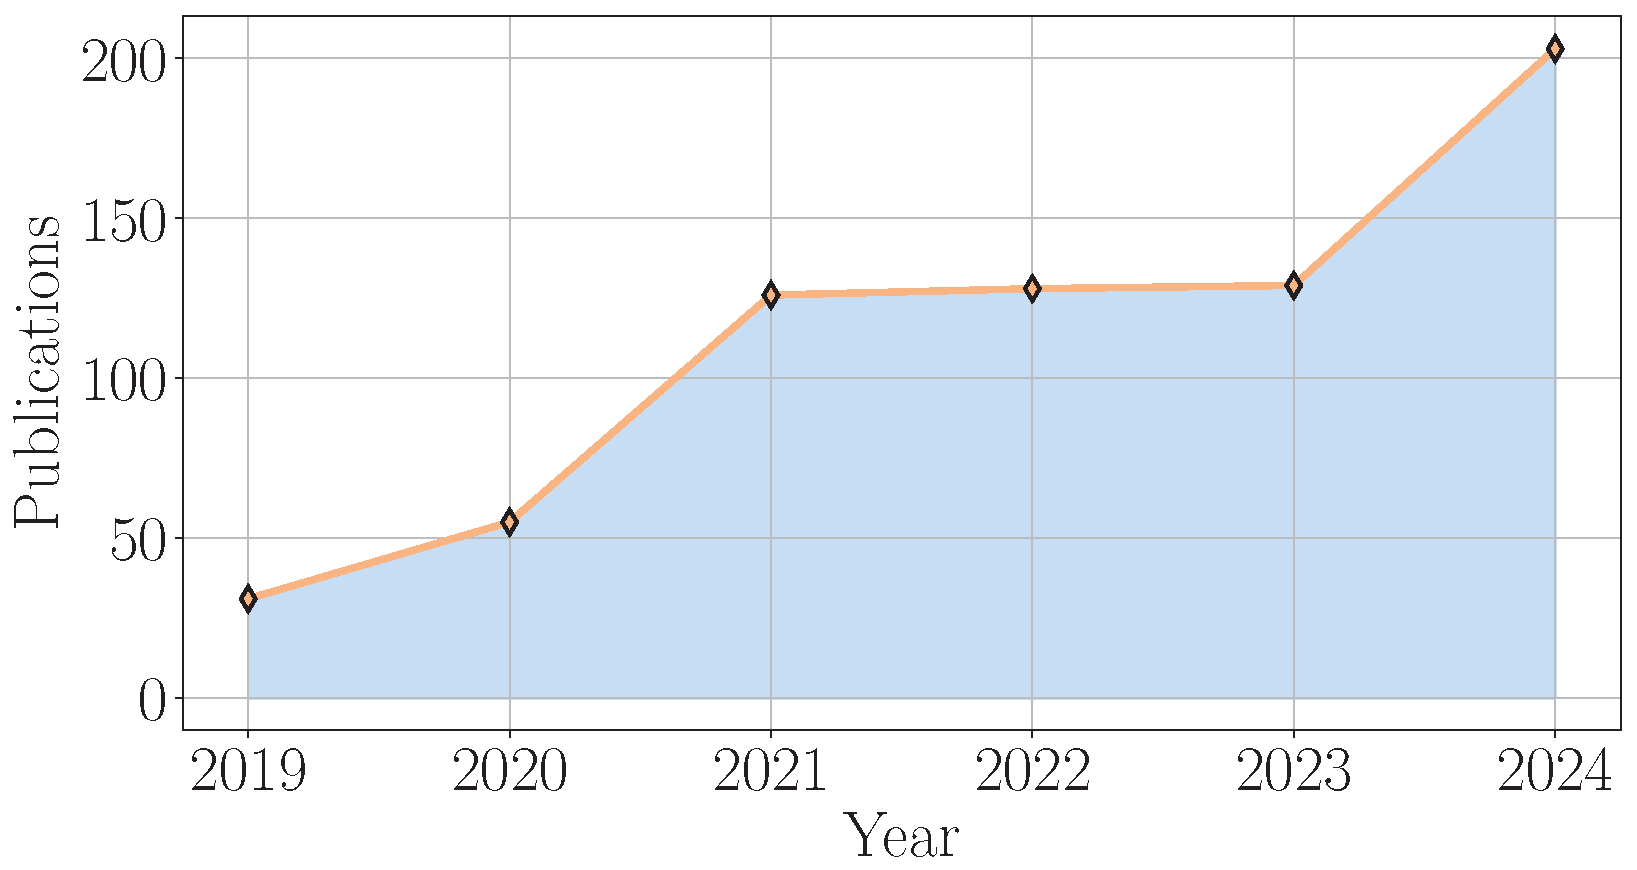
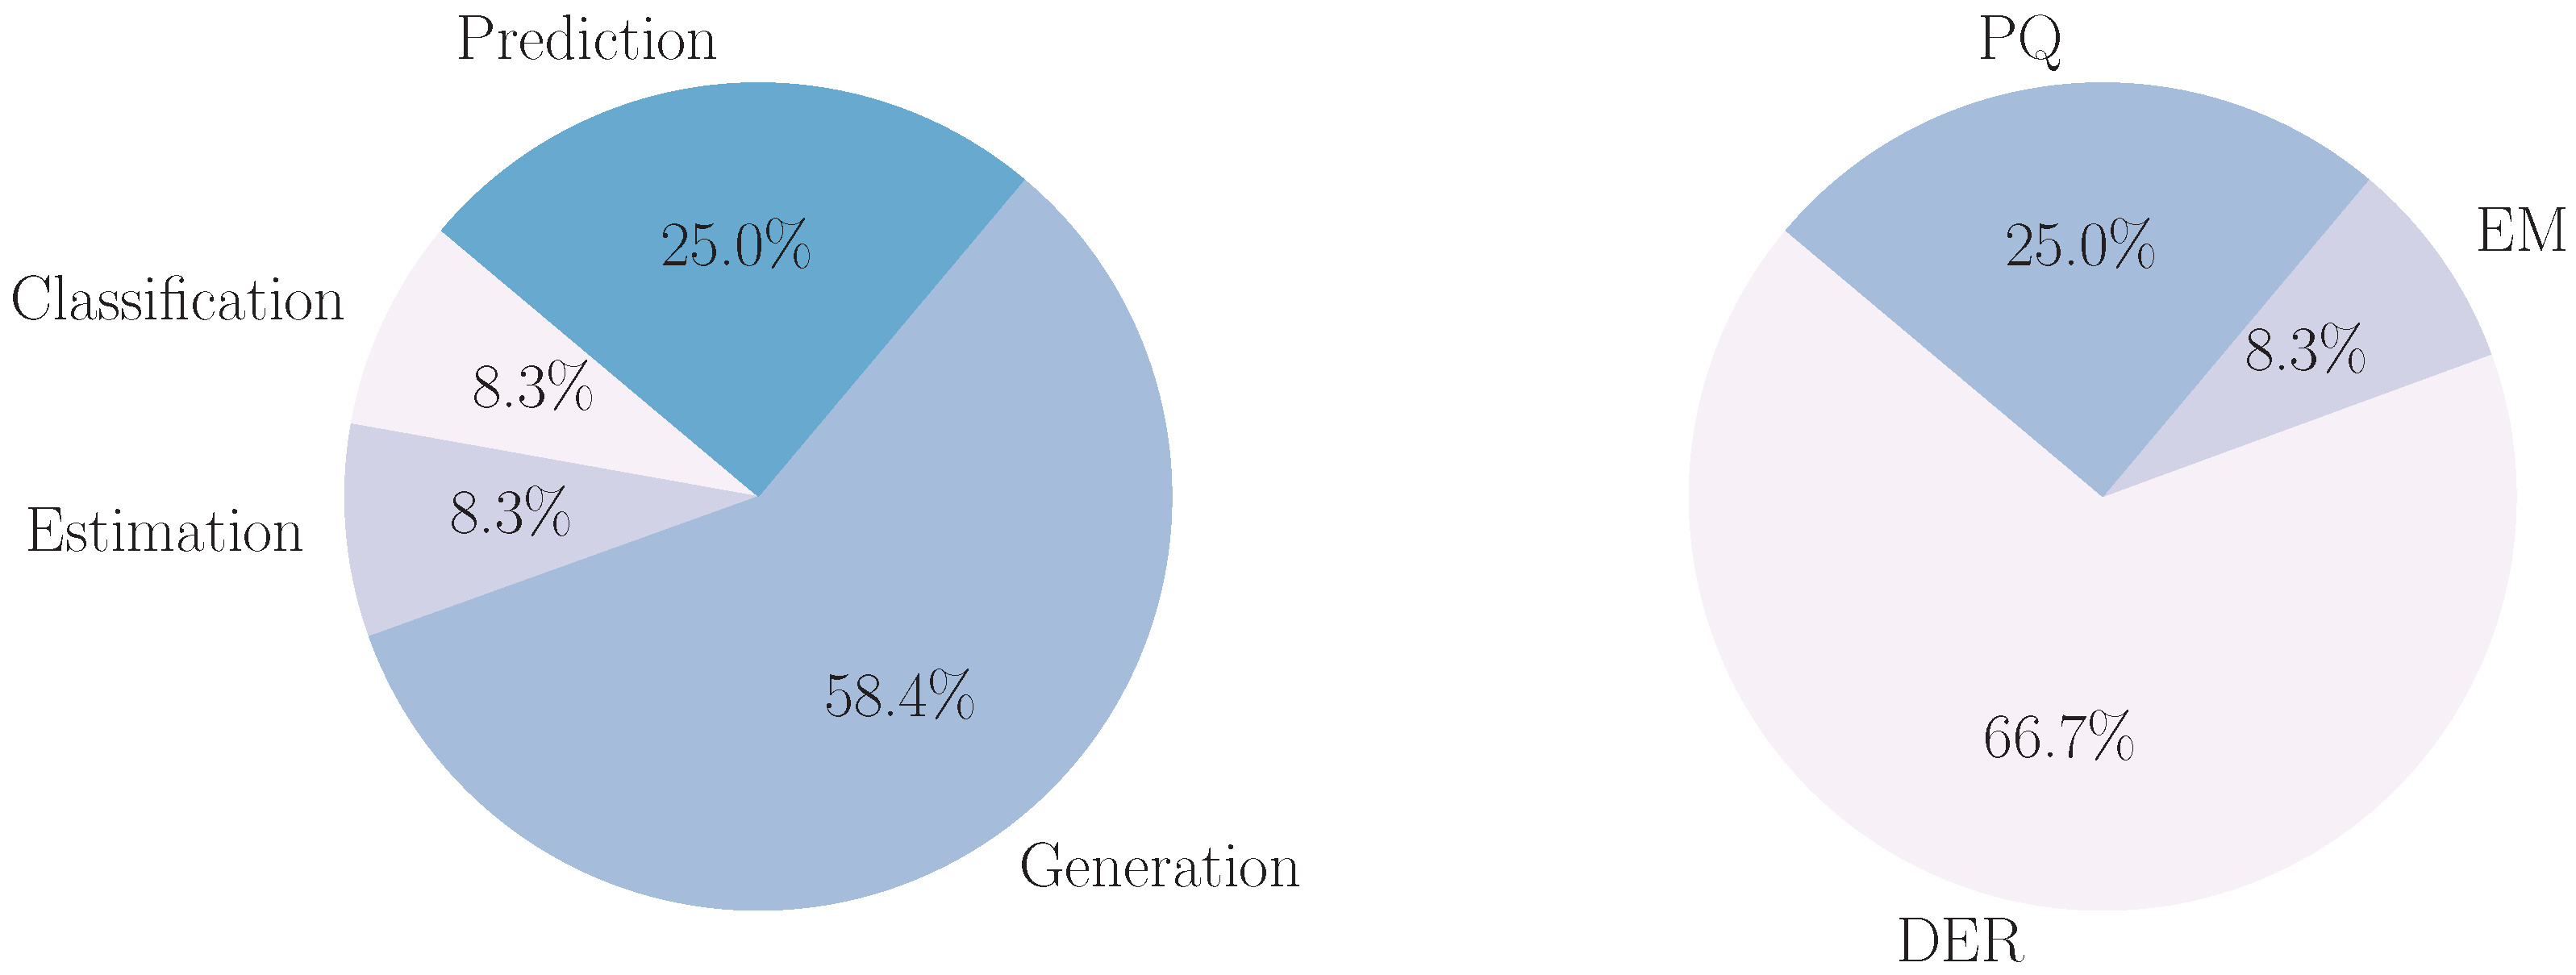
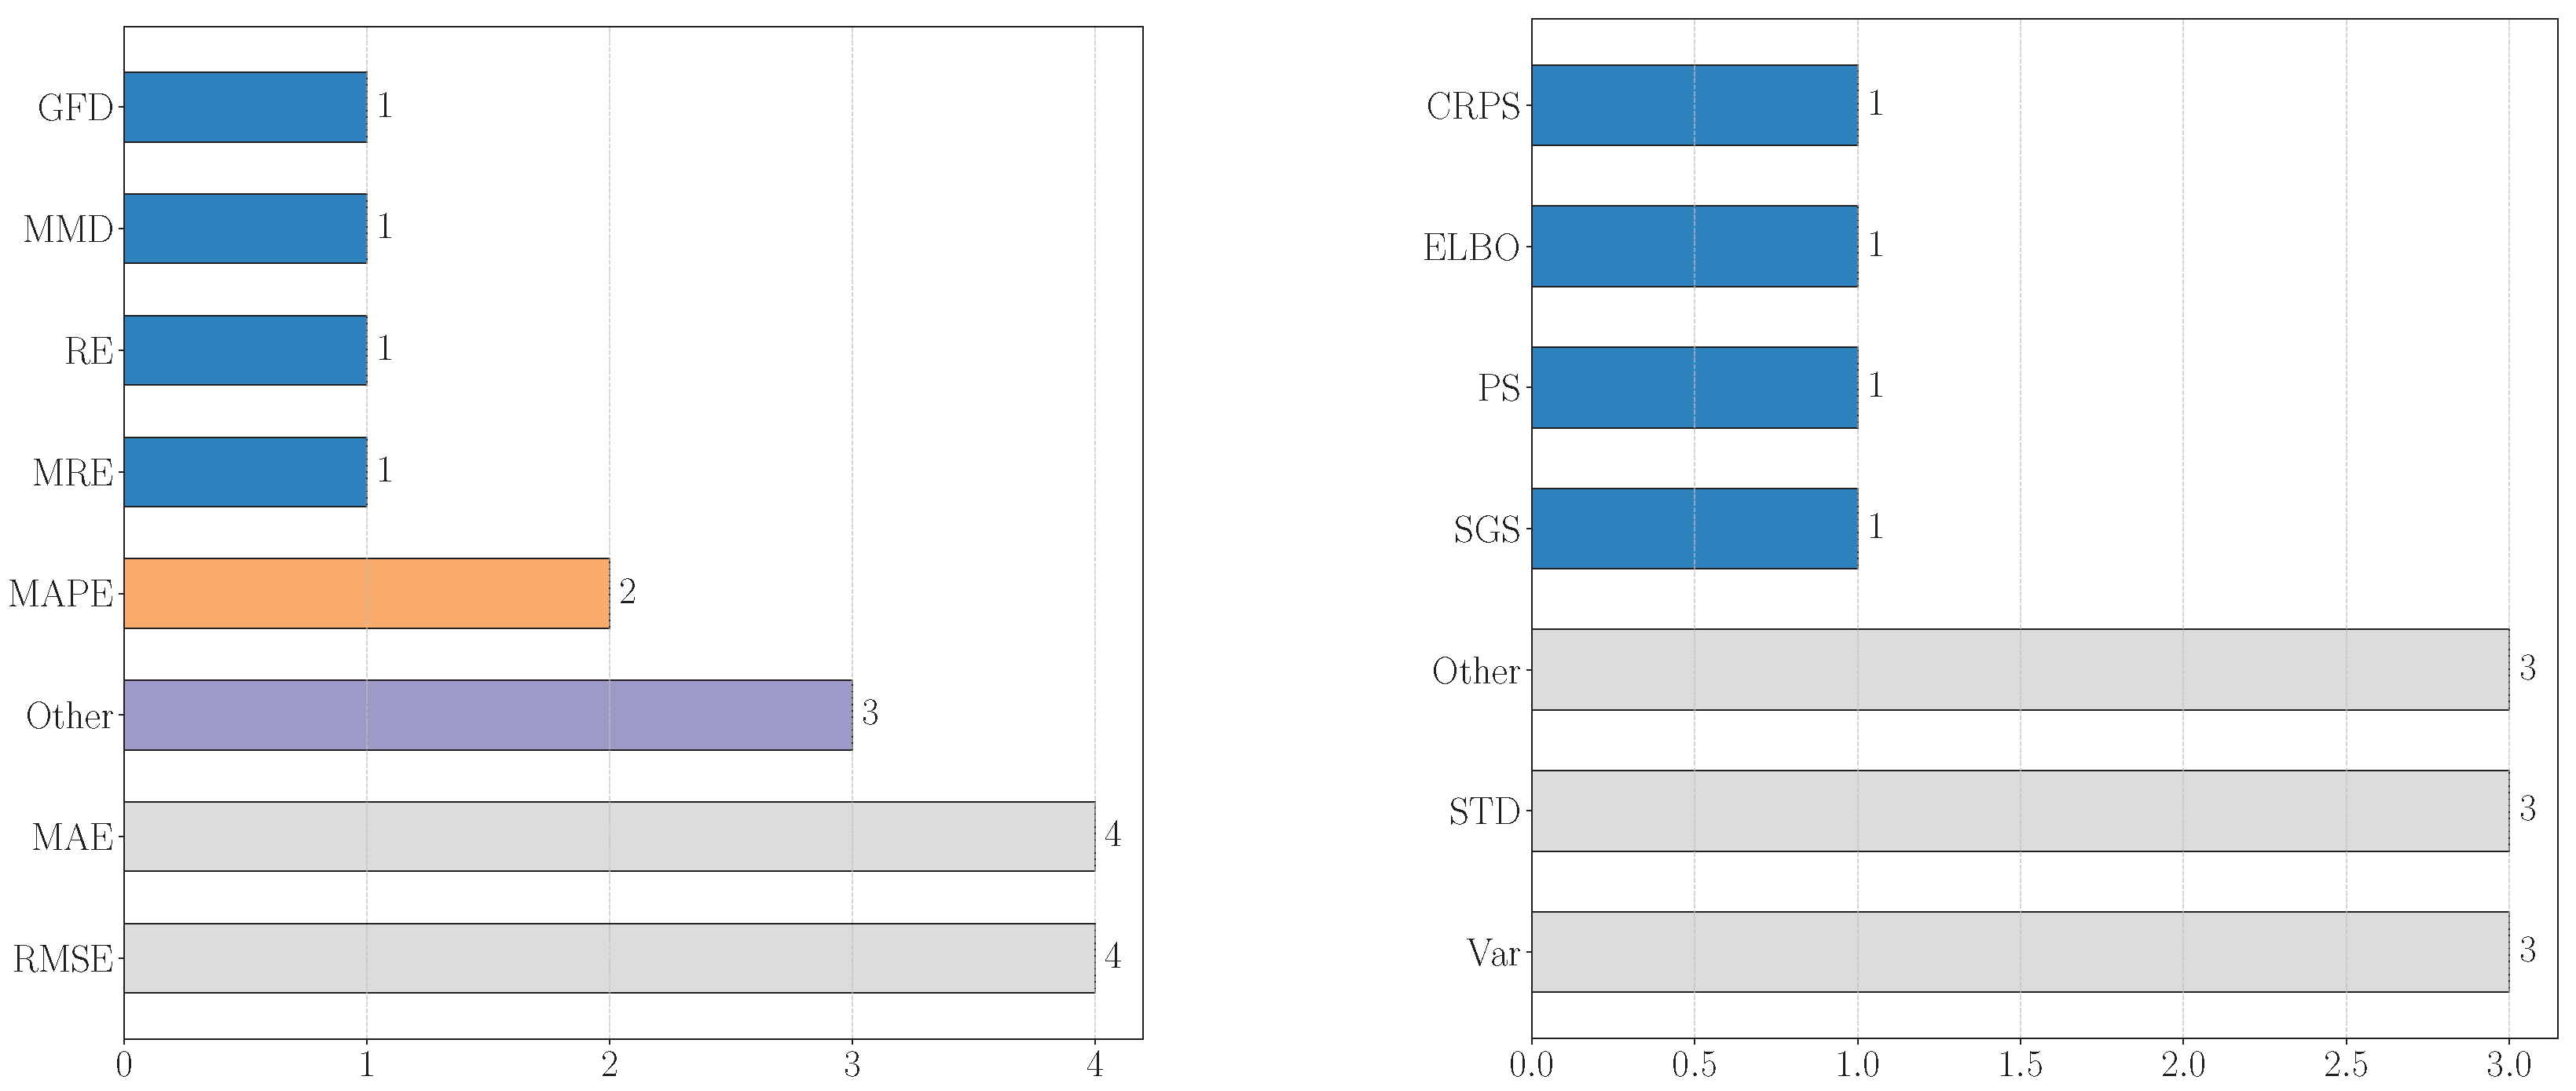
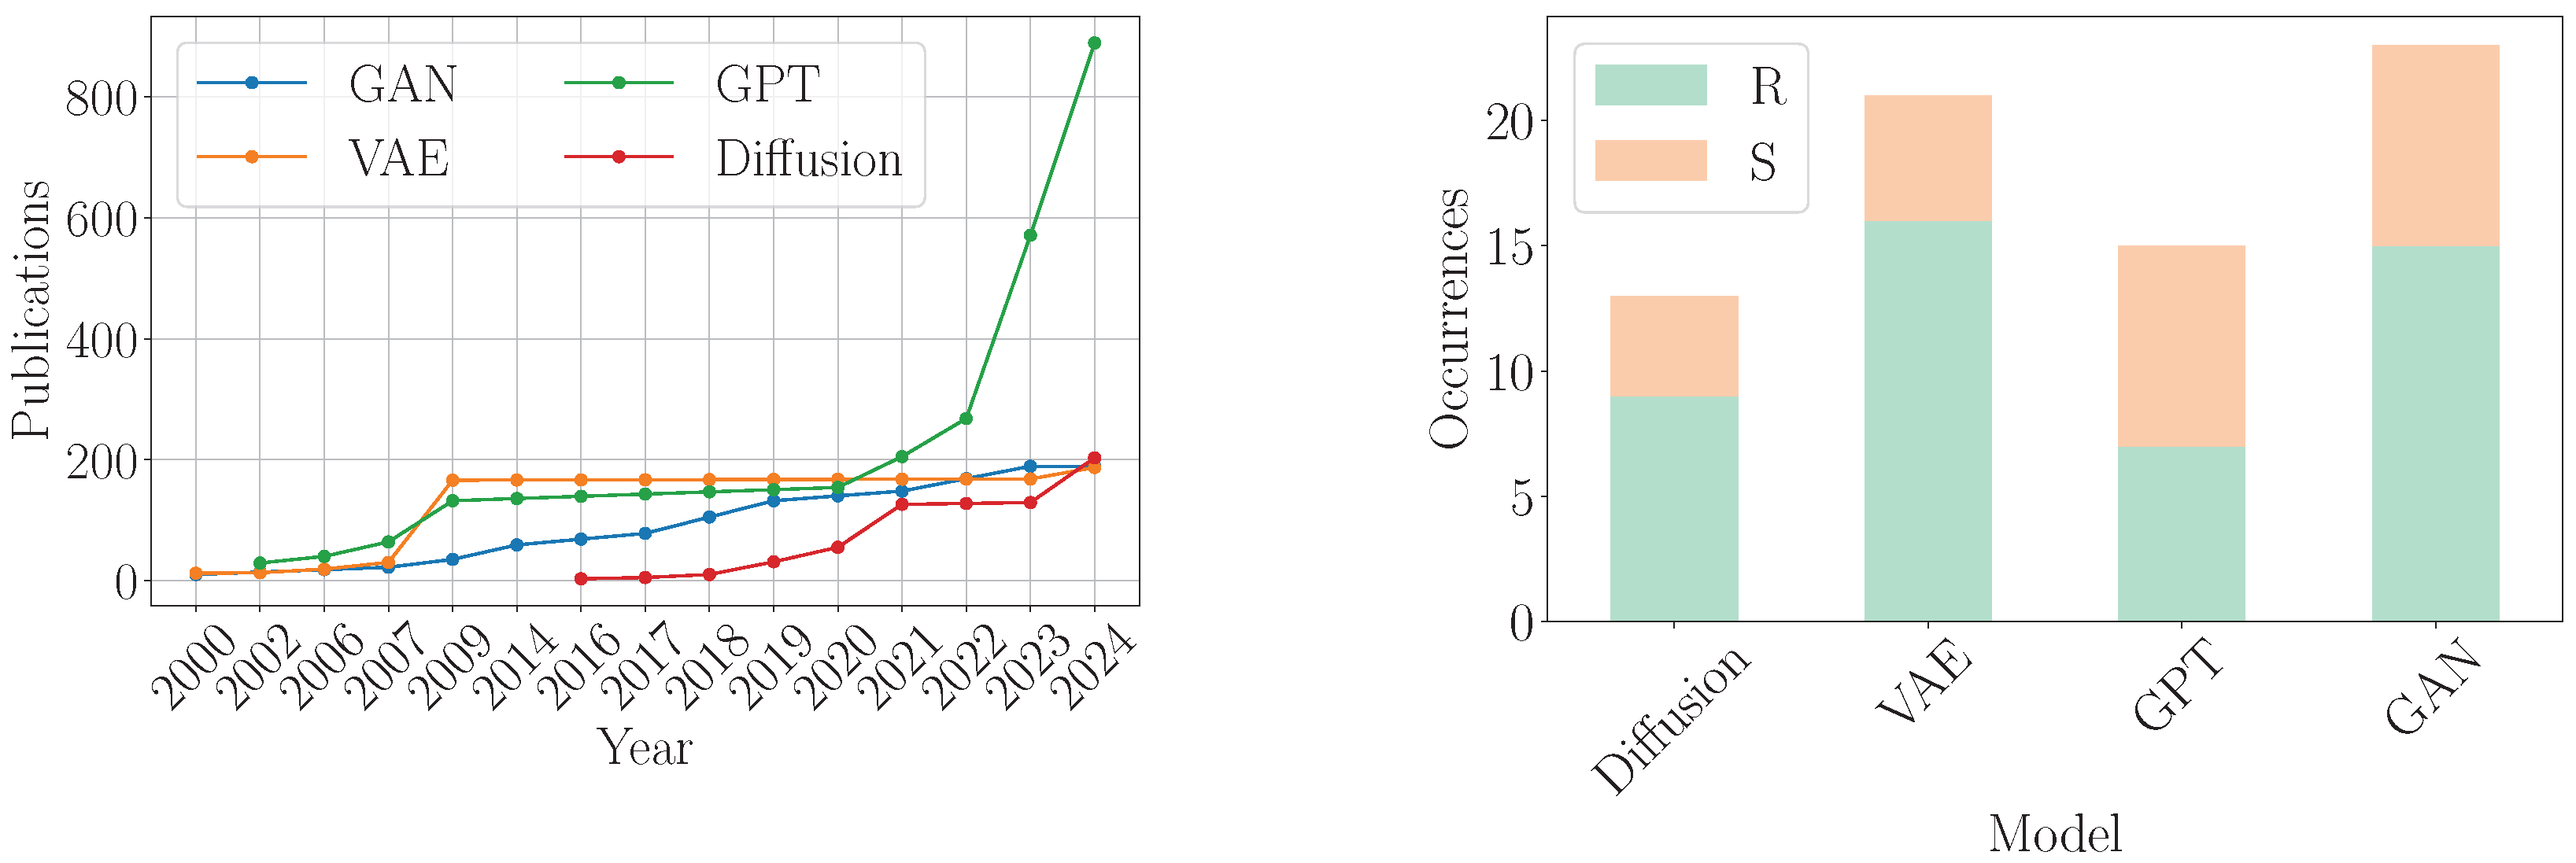
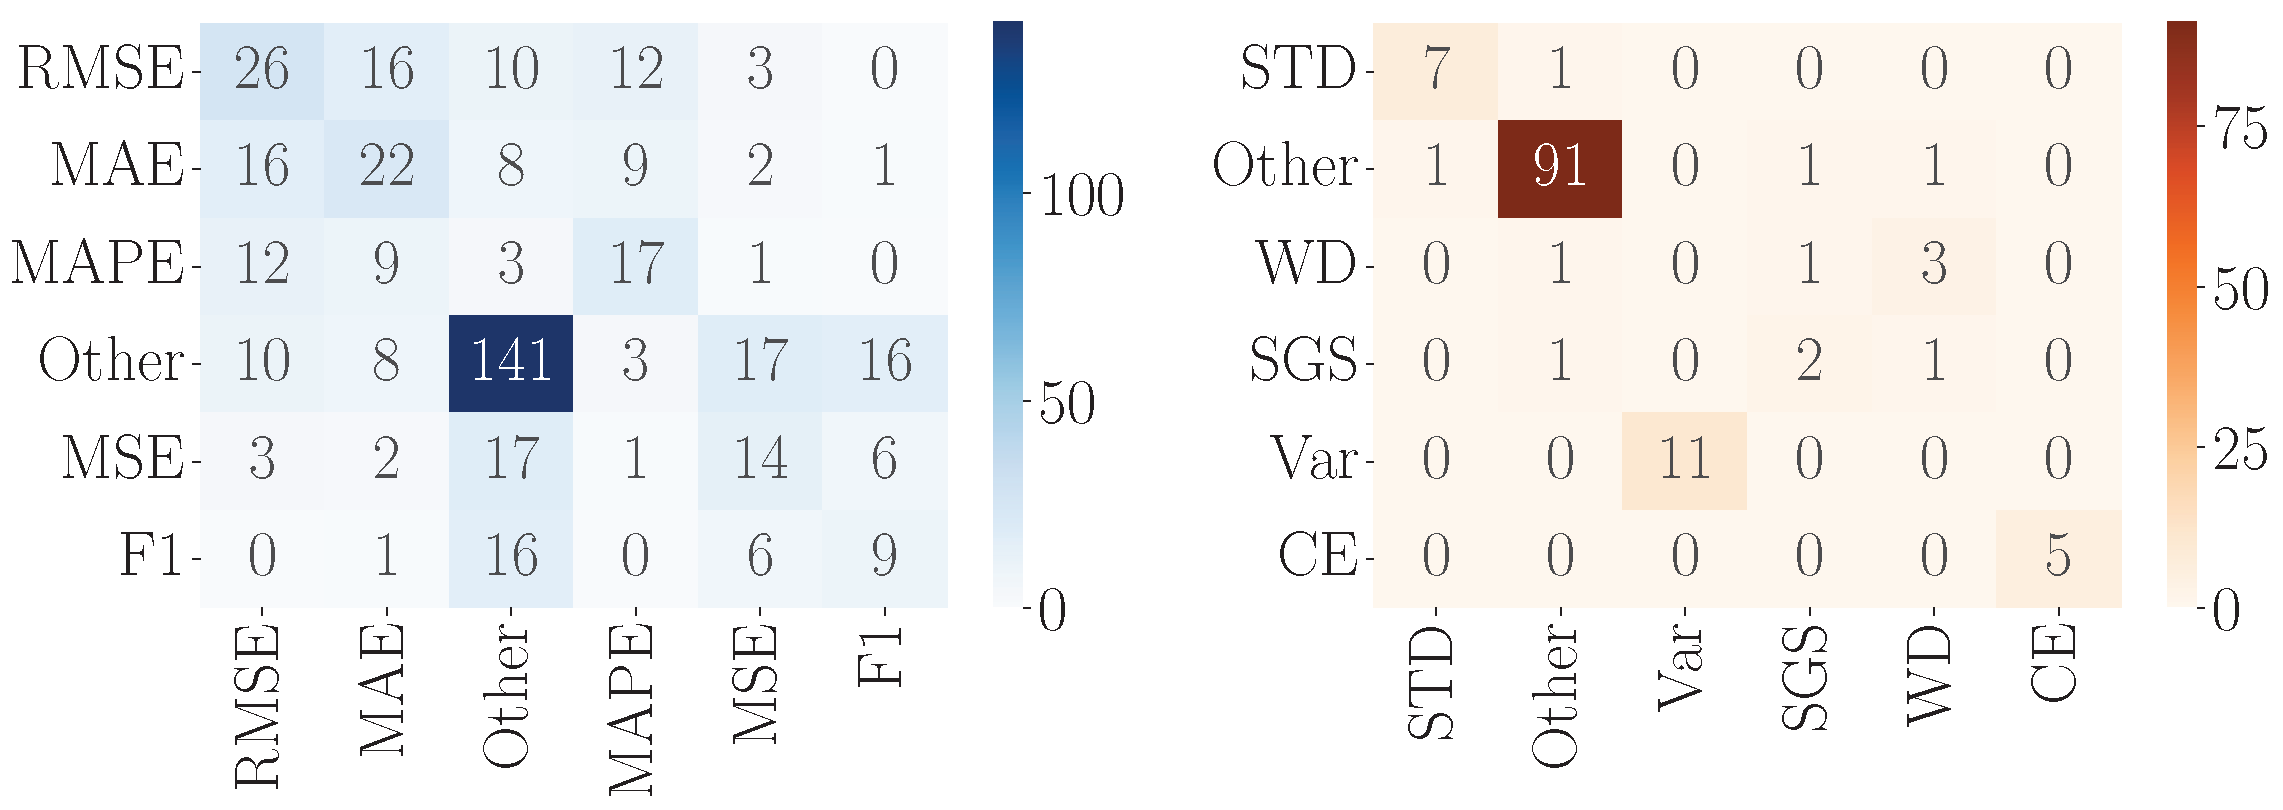
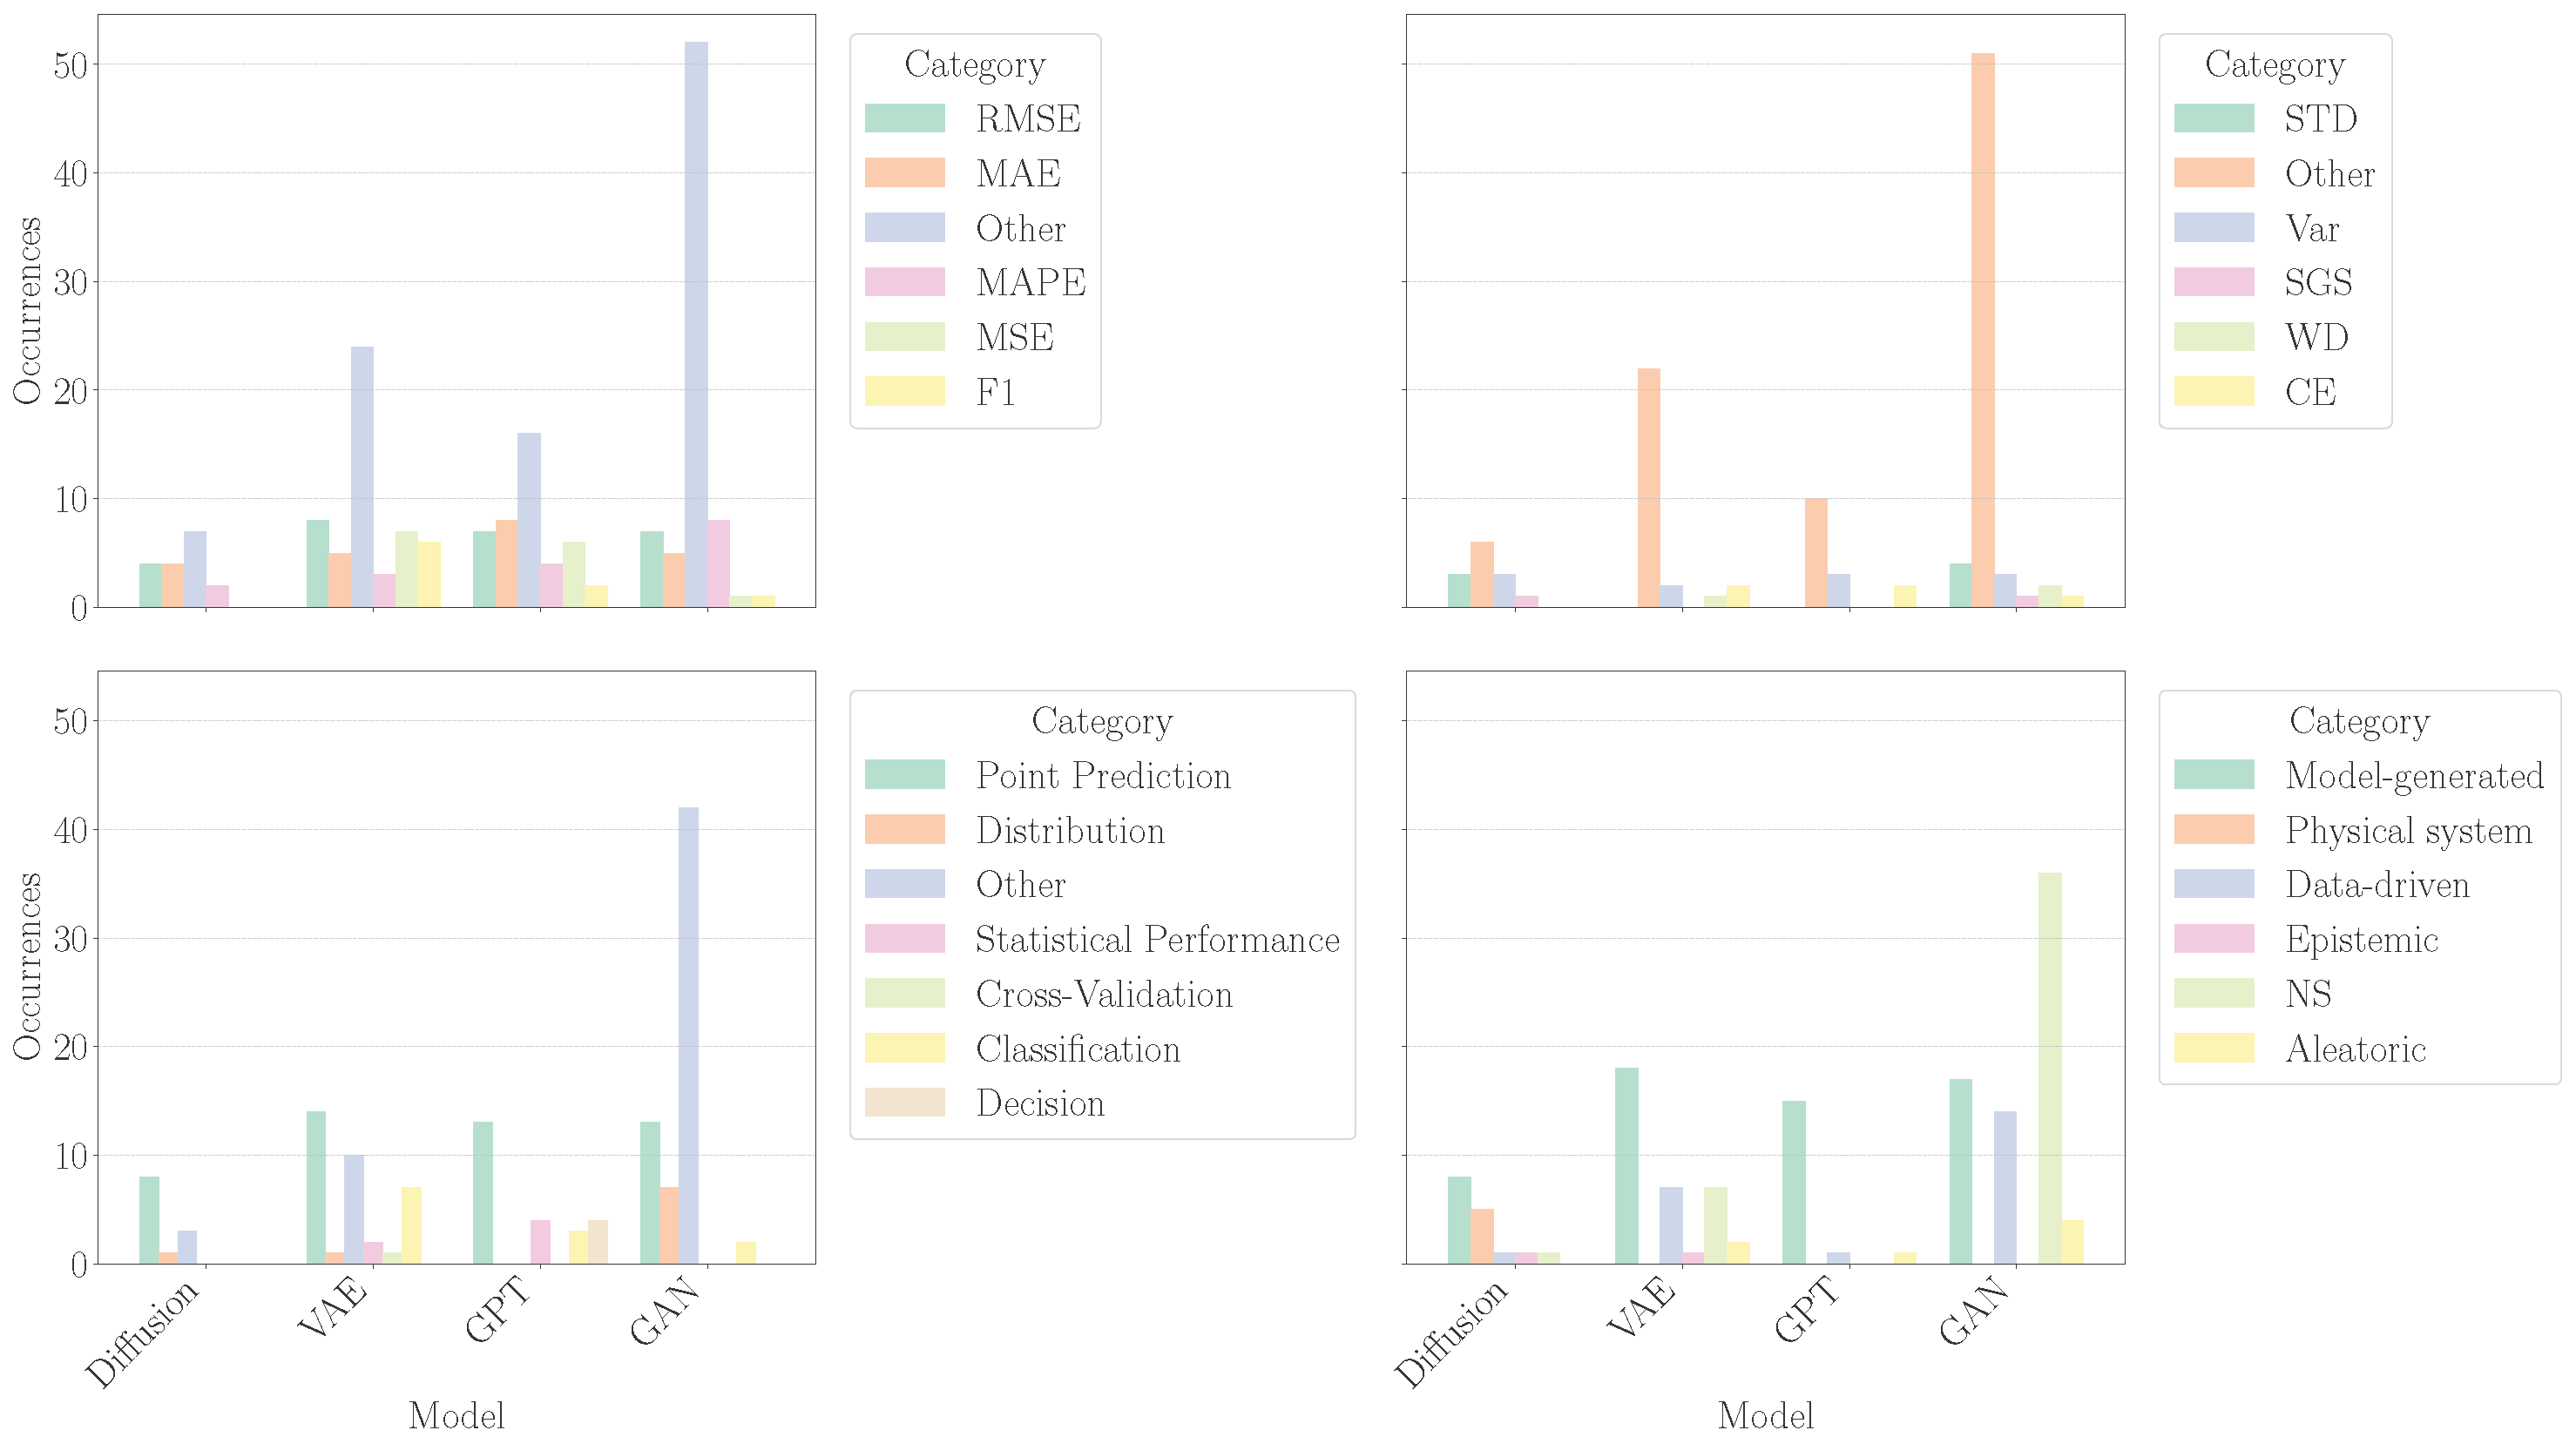
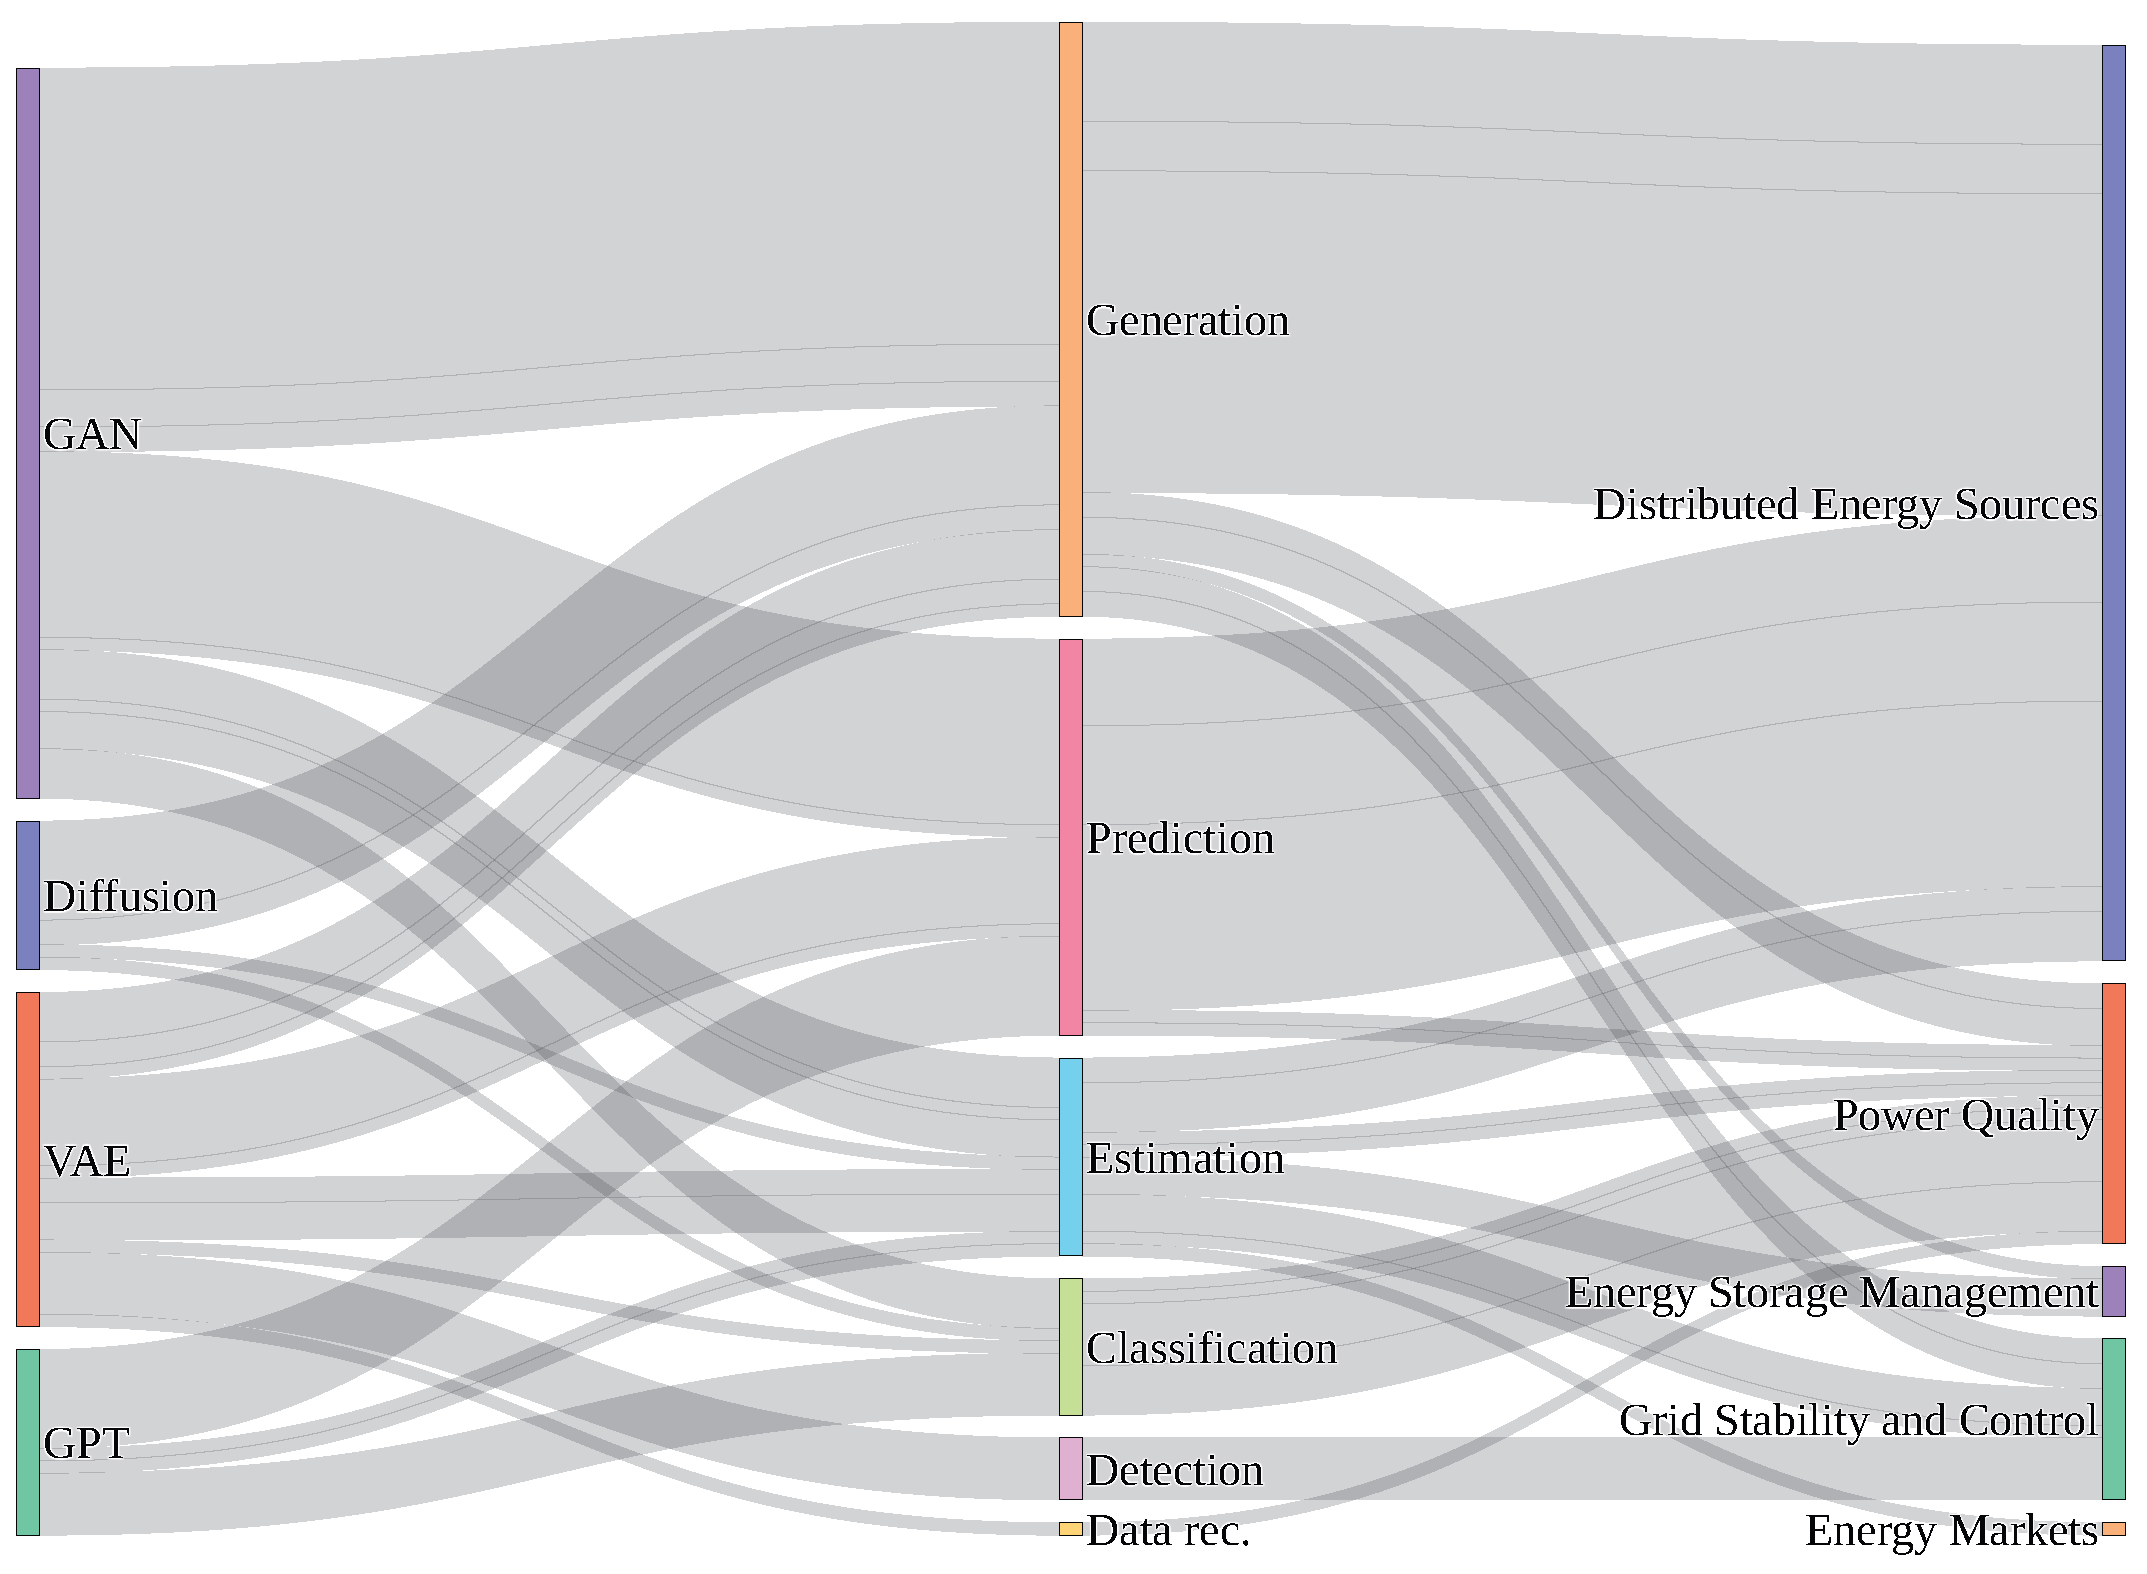

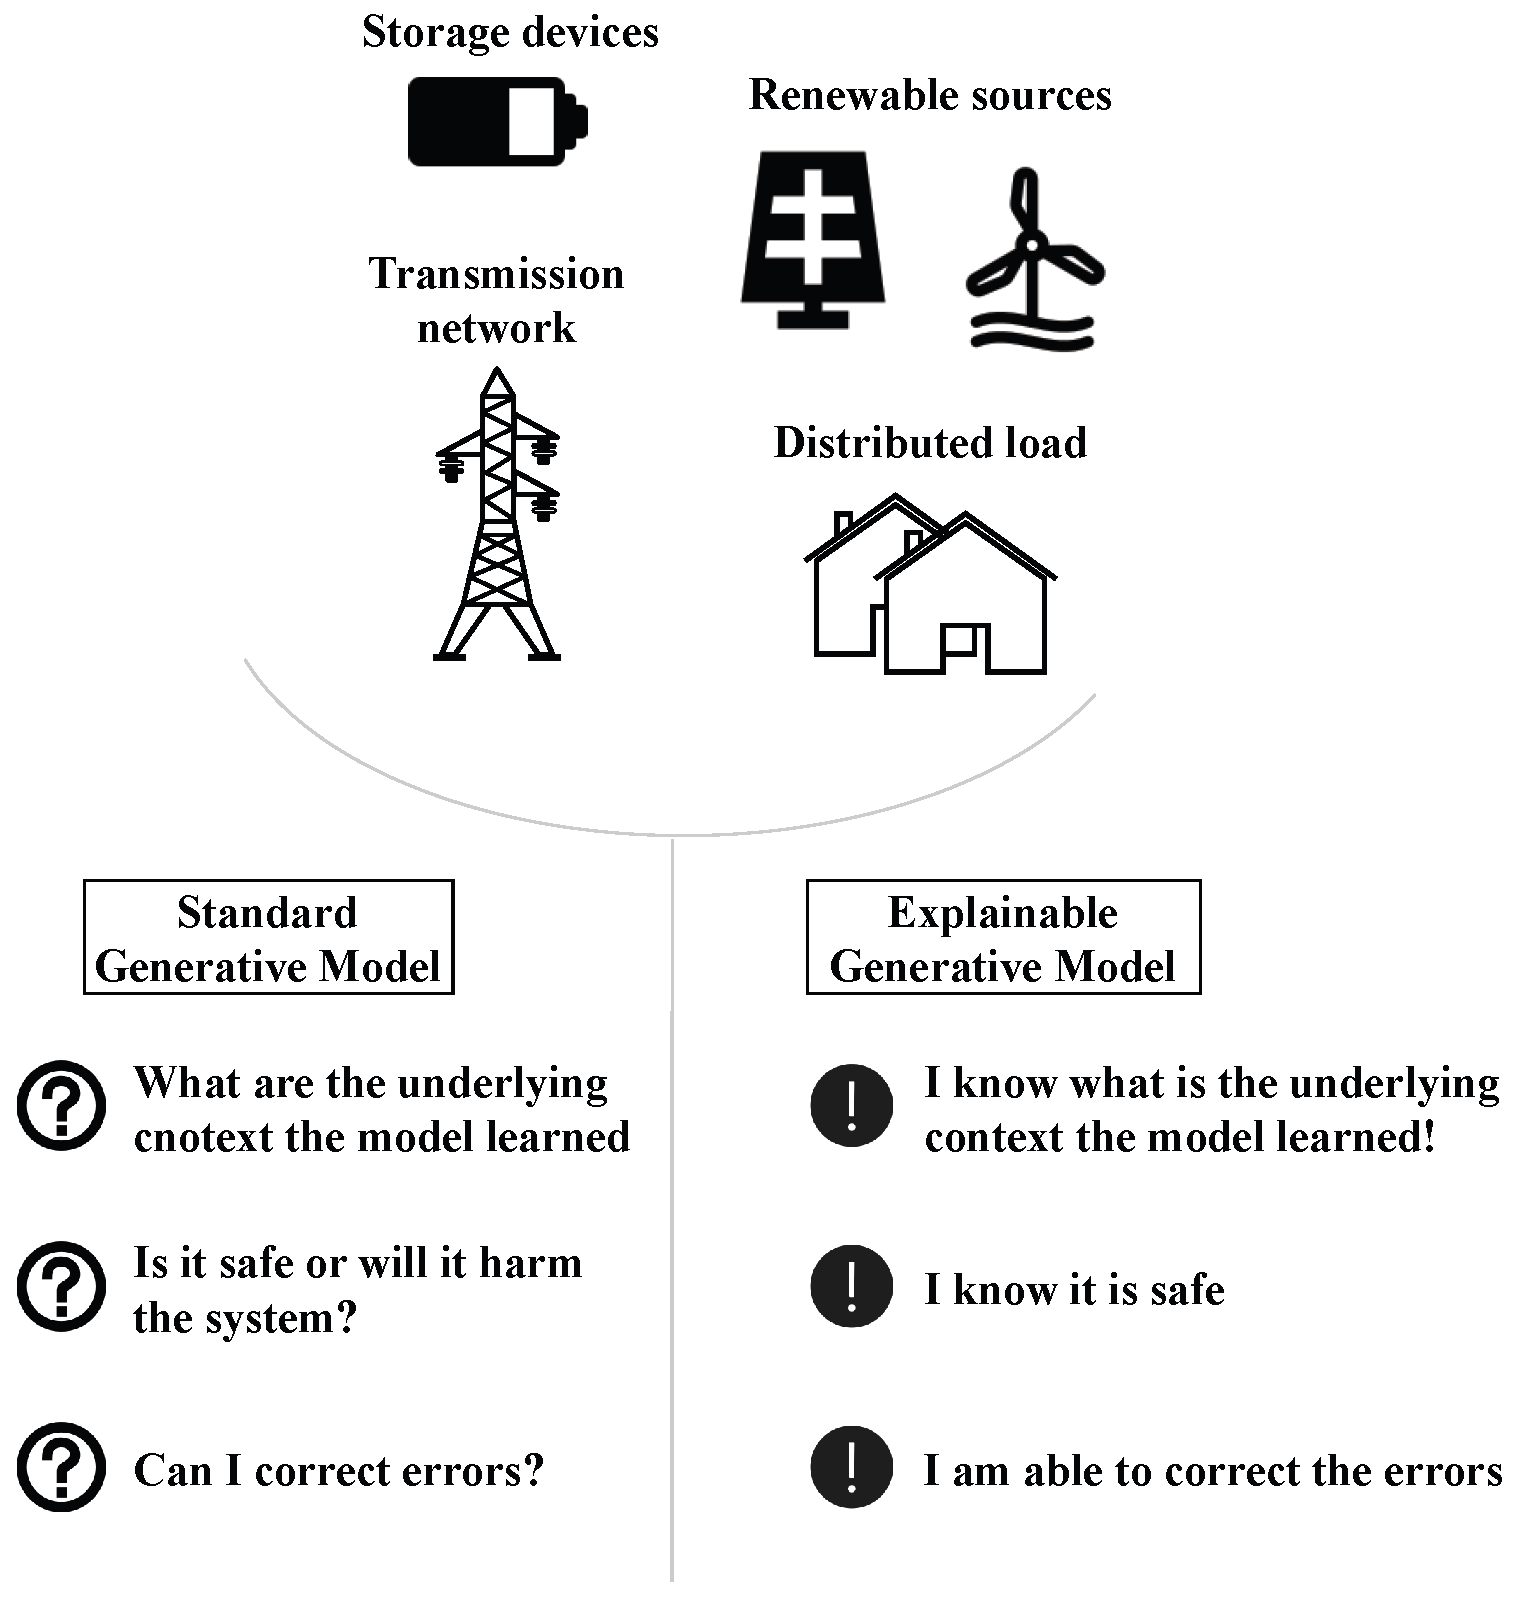
