Article

A Multi-Objective Temperature Control Method for a Multi-Stack Fuel Cell System with Different Stacks Based on Model Predictive Control

1
School of Intelligent Manufacturing, Shanghai Zhongqiao Vocational and Technical University, Shanghai 201514, China
2
College of Automotive Studies, Tongji University, Shanghai 201804, China
3
Shanghai Tongtao Technology Co., Ltd., Shanghai 201805, China
4
Research Institute of Highway Ministry of Transport, Beijing 100088, China
5
Shanghai Motor Vehicle Inspection Certification & Tech Innovation Center Co., Ltd., Shanghai 201805, China
*
Authors to whom correspondence should be addressed.
Energies 2025, 18(10), 2443; https://doi.org/10.3390/en18102443
Submission received: 9 April 2025 / Revised: 28 April 2025 / Accepted: 6 May 2025 / Published: 9 May 2025
(This article belongs to the Special Issue Trends and Prospects in Fuel Cell Towards Industrialization)

Abstract

:
The multi-stack fuel cell system (MFCS) has advantages such as a wide range, long life, and high efficiency; however, its multiple heat sources impose higher requirements on the thermal management system, especially for different stacks. In order to control each stack temperature in an MFCS, the model predictive control (MPC) algorithm based on the backpropagation (BP) neural network is proposed. Firstly, dynamic characteristics have been obtained experimentally for selected PEMFC stacks of different powers. Based on experimental data, a parallel multi-stack fuel cell thermal management subsystem with different stack powers model is established and a system prediction model of the BP neural network is trained by applying the MFCS thermal management subsystem model simulation data. Then, the step response matrix of the system prediction model is obtained at typical operating conditions, and a dynamic matrix controller (DMC) is designed. Finally, a test operating condition is designed for simulation analysis. The results show that the DMC based on BP neural network can quickly and accurately control each stack temperature of the MFCS, while having the characteristics of small overshoot and short regulation time.

1. Introduction

Energy storage and conversion in the energy economy have become a hotspot in the energy field, which has been gradually moving toward low-carbon, environmentally friendly, cleaner, and renewable energy sources [1,2]. Of the many renewable and sustainable energy sources, hydrogen has attracted attention for its high efficiency, cleanliness, and non-polluting properties [3]. There are some differences between hydrogen energy and traditional renewable energy (wind energy, solar energy, etc.). This is because wind energy and solar energy are widely present in nature, while hydrogen fuel is not. Most renewable energy sources are intermittent and geographically constrained, resulting in temporal and spatial gaps between the energy availability and the consumption of the end-users. To tackle these problems, it is necessary to deploy appropriate energy conversion devices for power grids. Hydrogen energy holds significant potential in the clean energy transition and is an effective pathway for achieving large-scale deep decarbonization. Electrolysis of water for green hydrogen production is not only one of the ways to obtain hydrogen energy but also contributes to addressing the variability of renewable energy sources. As a result, fuel cell technology, which uses hydrogen energy as the main power source, has also received attention [4]. Among the development of many fuel cell types, proton exchange membrane fuel cells (PEMFCs) have been used in a variety of power systems in the transport field for their low operating temperature, high specific energy, fast start-up, and low noise [5].
In the transport field, power sources are required to meet various operating conditions and a wide range of power application scenarios [6,7,8]. However, a conventional single-stack fuel cell system (SFCS) has low fault tolerance due to its structural limitations, and the failure of any of the single cells can lead to system failure. Moreover, the maximum power of SFCS is not enough to support high-power application scenarios alone [9]. The multi-stack fuel cell system (MFCS) has been proposed to improve system reliability, fault tolerance, and efficiency to overcome the points of the SFCS [10]. This is due to the parallel operation of multiple stacks in the MFCS, which contributes to the overall system efficiency by reasonably allocating power to each stack according to the system-demanded power.
The MFCS has both distributed and integrated structural types and because of the combined power output of multiple stacks, there is a case for thermal management methods of multiple heat sources in either structural type. With the proper thermal management strategy and control method, PEMFC is able to ensure the proper electrochemical reaction temperature under various dynamic change conditions [11].
For both the SFCS and distributed MFCS, the thermal management structure and control objectives are similar, only ensuring that the operating temperature of a single PEMFC stack is stable under operating conditions. Excessively high and low temperatures could degrade fuel cell performance [12,13]. Concerning the dynamic performance and durability of PEMFCs, temperature is often regarded as one of the most important factors, so controlling and regulating the operating temperature is one of the important challenges for the successful commercialization of PEMFCs. The operating temperature affects not only the internal gas transport, water balance, and electrochemical reaction activity but also the mechanical properties of the material. The higher temperature can easily lead to dehydration of the PEM, hinder the conduction of protons, and reduce the water content of the cathode catalyst layer; on the contrary, when the PEMFC operates at a lower temperature, the electrochemical reaction of the cell is slow and less efficient, which tends to deteriorate the performance and shorten the lifetime of the PEMFC. For low-power PEMFC systems, O’Keefe et al. [14] designed a time-varying PI controller using water cooling to ensure the temperature balancing of the stack by controlling the coolant flow rate. The results show that for low-power SFCS, the method has a good control effect. Pei et al. [15] considered the nonlinear characteristics of the thermal management system and designed a temperature control method based on nonlinear transformation, which was verified by a 5 kW fuel cell to improve the dynamic characteristics, and the temperature control was performed excellently. Xu et al. [16] proposed a temperature control strategy based on the sparrow search algorithm–PID, which was found to be fast-converging, dynamic, and robust when compared with traditional PID and GA-PID algorithms.
For the integrated MFCS, the thermal management approach is greatly different due to the difference in their stack allocation strategy and energy management strategy [10]. Moreover, the present studies on the MFCS mainly focus on the energy management strategy, and little attention is paid to the temperature control of the thermal management subsystem [17,18]. When multiple fuel cell stacks are thermally managed using a set of thermal management systems and circulation pipes, there is an obvious coupling problem where a change in load on one stack affects the temperature of the others [19]. This situation can be described as a multivariate control problem with system constraints for which MPC is well applicable. In current research, MPC algorithms are commonly used to describe the thermal management subsystem model with a linearized model, which has the disadvantage of insufficient system model adaptation, thus leading to poor control [20]. Temperature control of a single-stack system is a unidimensional problem, whereas that of a multi-stack system is not only a problem of solving multiple objectives individually but also involves the interactions between the individual stacks. This is not investigated in the current methodology. However, for integrated multi-stack fuel cell systems, which is a common problem, it is necessary to investigate this problem. For non-distribution stacks, this is more universal. The BP neural network has strong nonlinear mapping abilities and highly self-learning and self-adaptive abilities, which can offset the above deficiencies. Its combination with MPC as a prediction model to control the MFCS temperature will have a good control effect.
In this paper, a parallel thermal management system for the MFCS is designed based on experimentally obtained PEMFC dynamic characterization and is modeled and simulated based on a high-power multi-stack fuel cell system obtained from a previous study involving an optimal stack division method. Based on the thermodynamic balance dynamic analysis, the MPC algorithm is used to control the temperature process of each stack with a large time lag in real time because the applicability of multi-objective control problems, in which multiple objectives are coupled, is poor when considering PID and fuzzy control. A BP neural network is used to develop a prediction model for the thermal management subsystem of the MFCS, a dynamic matrix controller is designed, and the controller’s effect on controlling the temperature of each stack in the MFCS is analyzed.

2. PEMFC Dynamic Characterization Experiment

In the previous study [21], the optimal allocation of stacks was carried out for a 210 kW fuel cell system with efficiency and remaining useful life as the optimization objectives. The optimal calculations resulted in 20 kW, 70 kW, and 120 kW. This section tests the performance of stacks with different power levels for modeling and analysis.

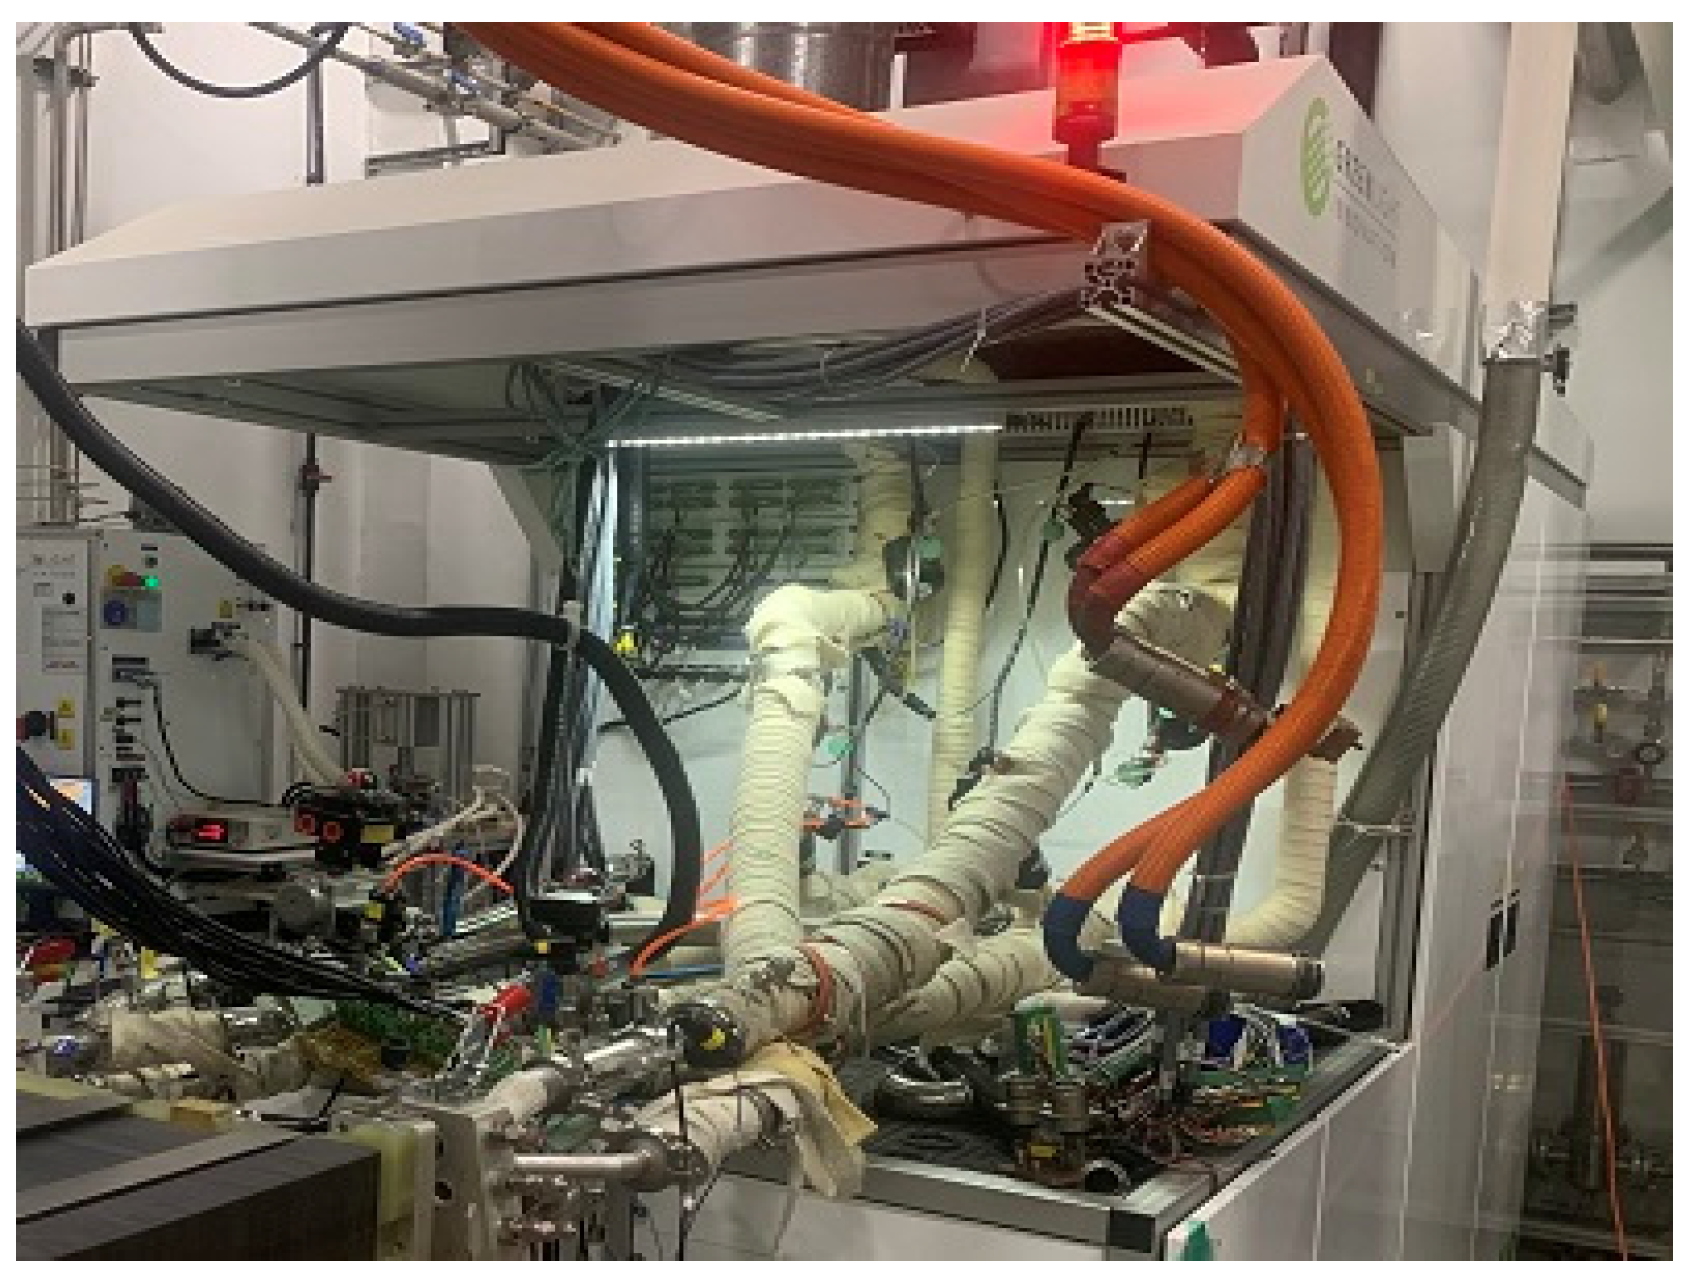
2.1. PEMFC and Test Platform

In order to obtain the performance of the same series of fuel cell stacks with an effective area of 350 cm2, it is necessary to specifically test the starting characteristics, rated power, dynamic response characteristics, steady-state characteristics, and dynamic average efficiency of the three fuel cell stacks depicted in Figure 1. Based on these characteristics, fuel cell models will be established.
In this paper, a fuel cell test system platform (Shanghai REFIRE Technology Co., Ltd., Shanghai, China), as shown in Figure 2, is used to test the performance of fuel cell stacks. The test system contains a test stand, hydrogen supply module, air supply module, coolant supply module, controller, host computer, sensors, and auxiliary components, which provide test conditions for the fuel cell and are operated by the host computer.

2.2. PEMFC Test Preparation

Before the performance test of the selected fuel cells with different power levels, in addition to calibrating the operating conditions according to the relationship between the output current and the desired operating parameters, the activation operation and single-cell consistency test are also necessary to ensure the performance requirements of fuel cells. Various engaging methods can be classified into two main categories: (1) offline activation (water boiling treatment, acid treatment, ultrasonic treatment, etc.) and (2) online activation (current or voltage control activation, short-circuit activation, and air interruption activation, etc.) [22].
After activation, the single-cell consistency of the three stacks is shown in Figure 3, and the difference between the average and minimum voltages of the 20 kW, 70 kW, and 120 kW fuel cell are 0.073 V (as shown in Figure 3a), 0.036 V (as shown in Figure 3b), and 0.175 V (as shown in Figure 3c), respectively. The maximum difference in consistency for each stack occurs during the starting stage, while the difference is very small in the steady state. Furthermore, the difference gradually decreases as the operating voltage increases.

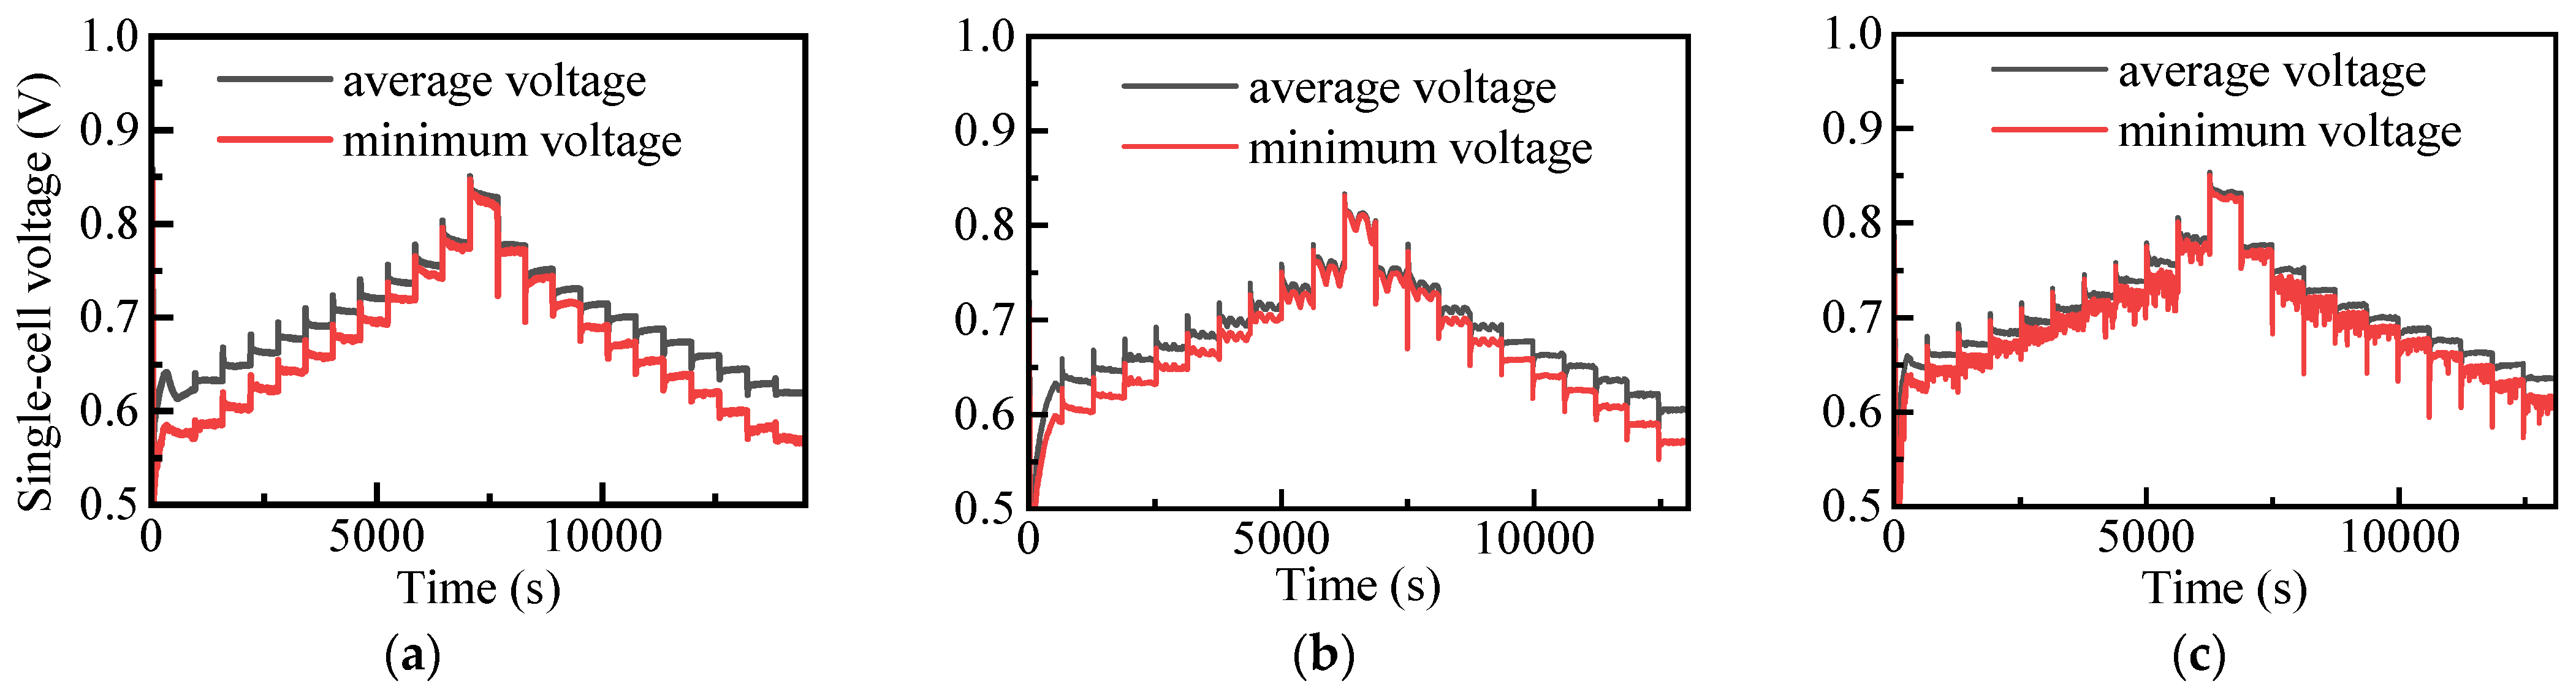
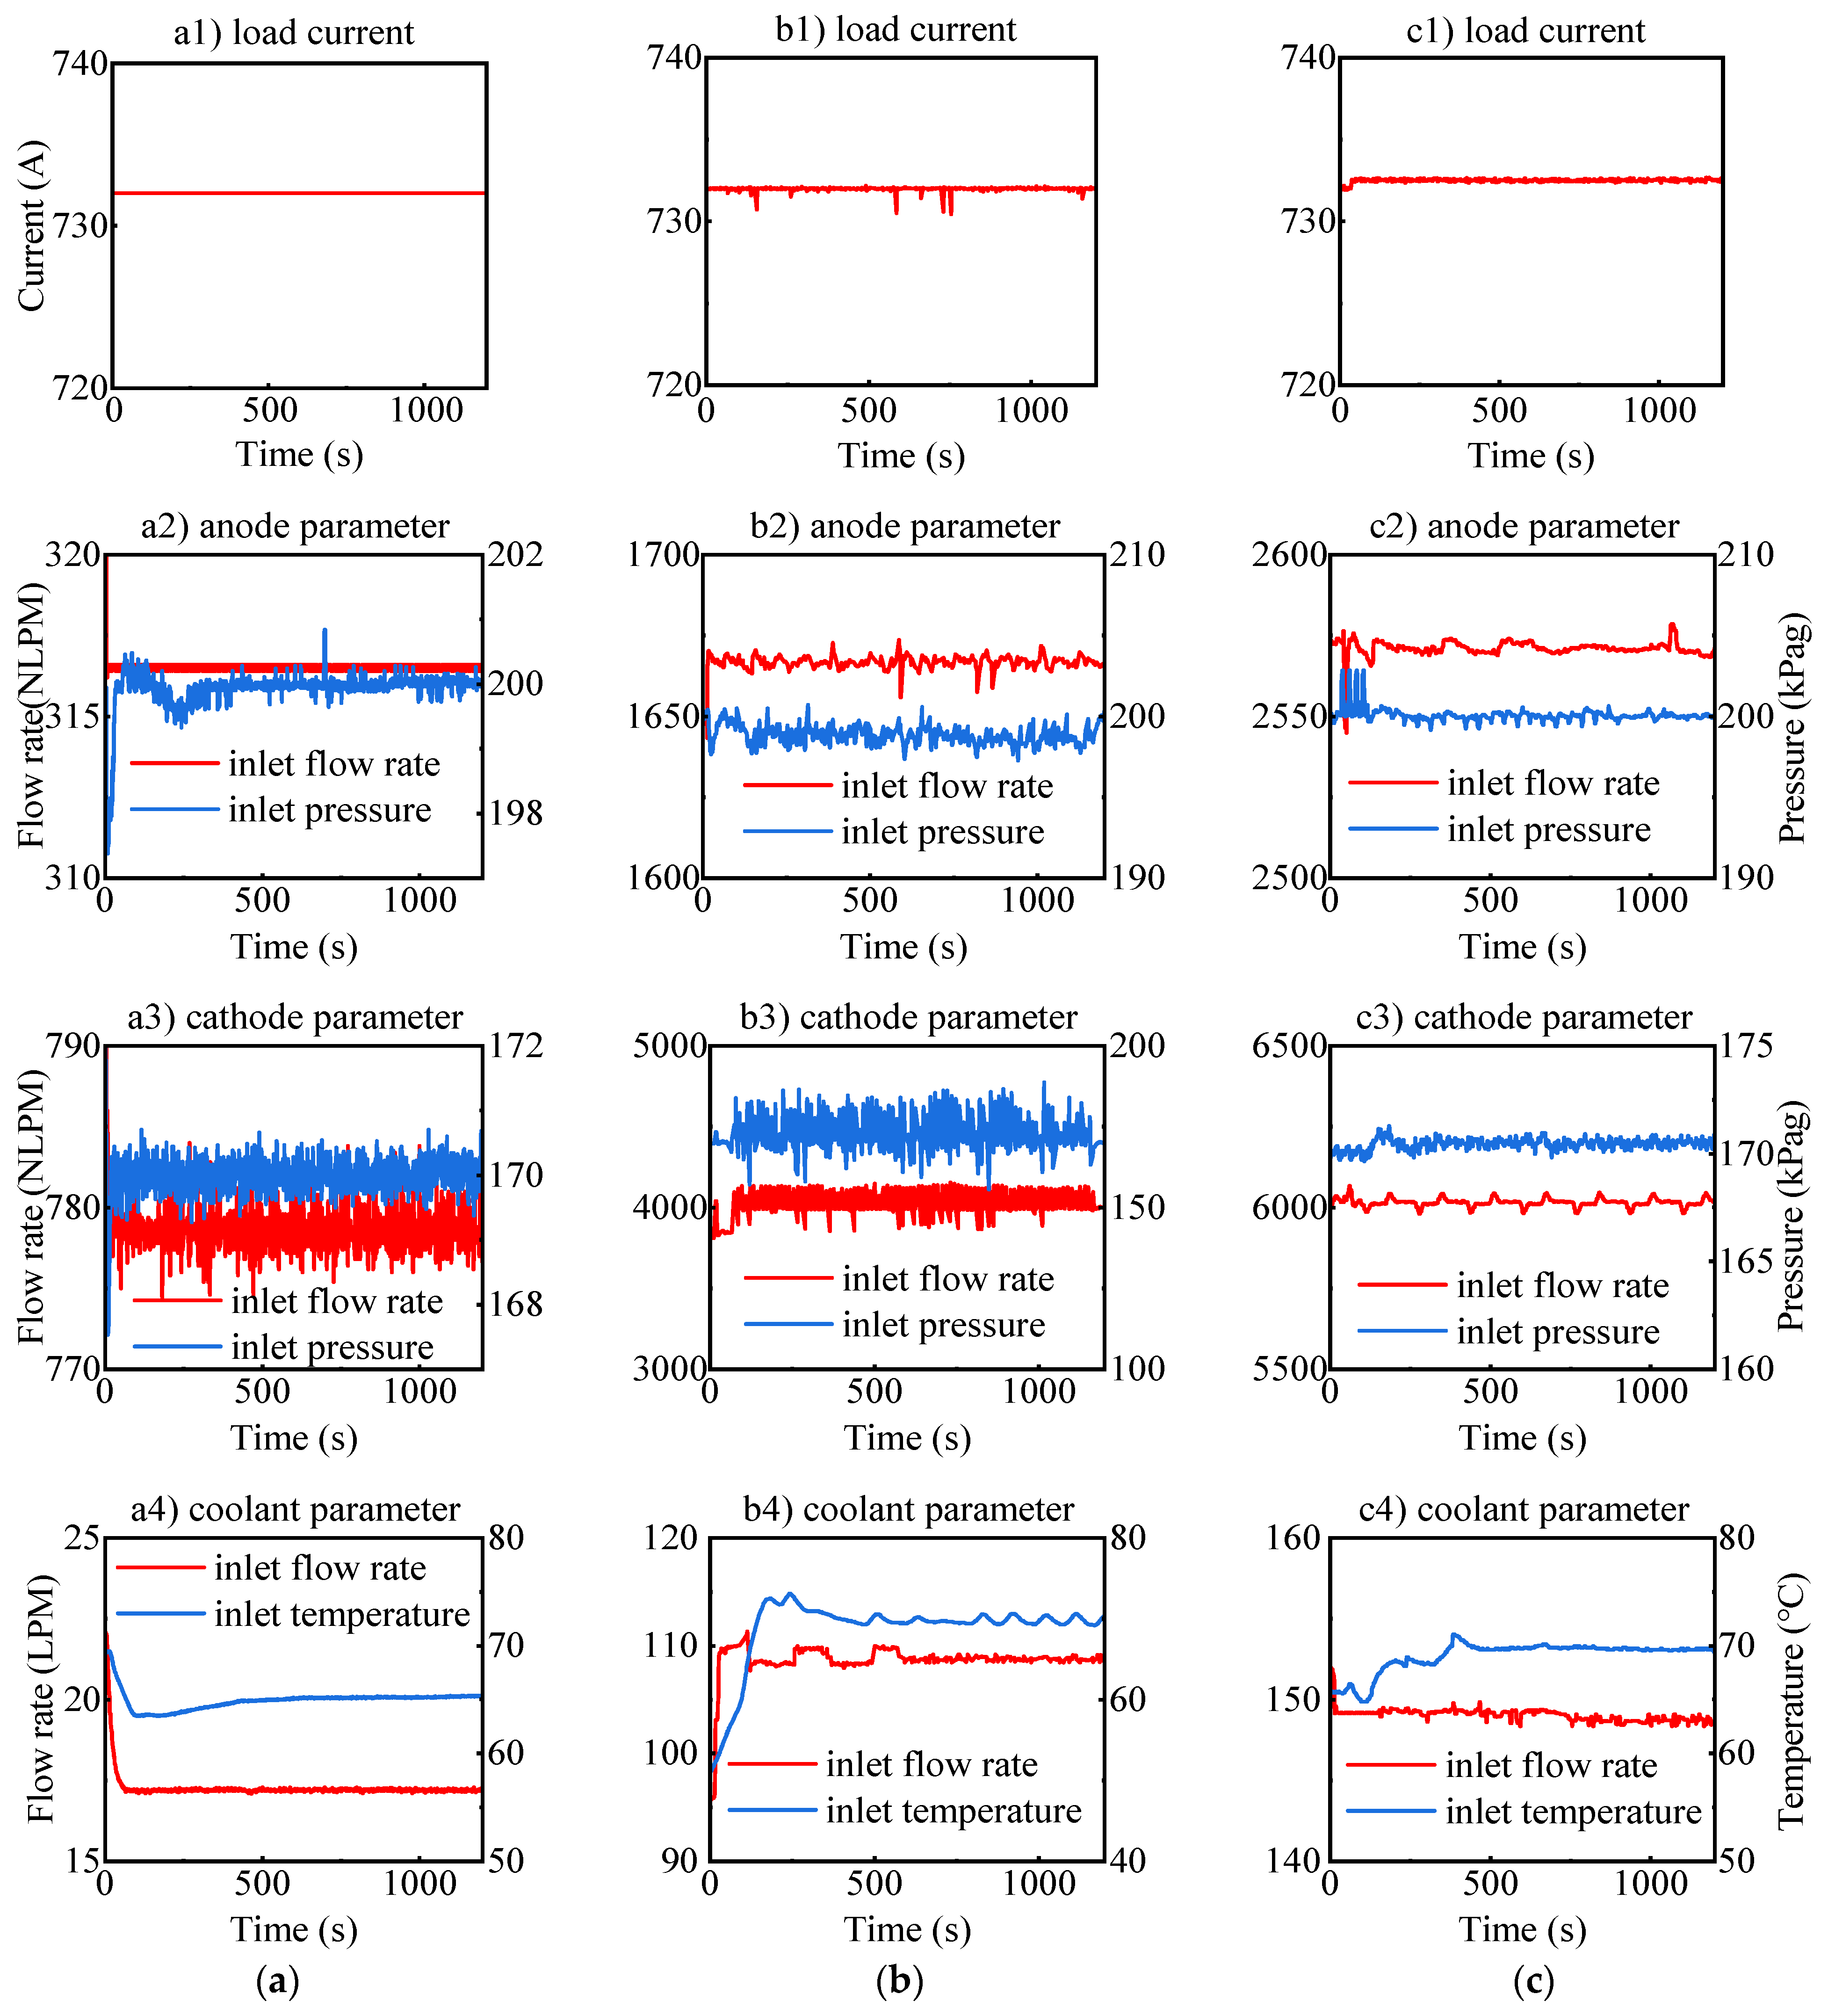
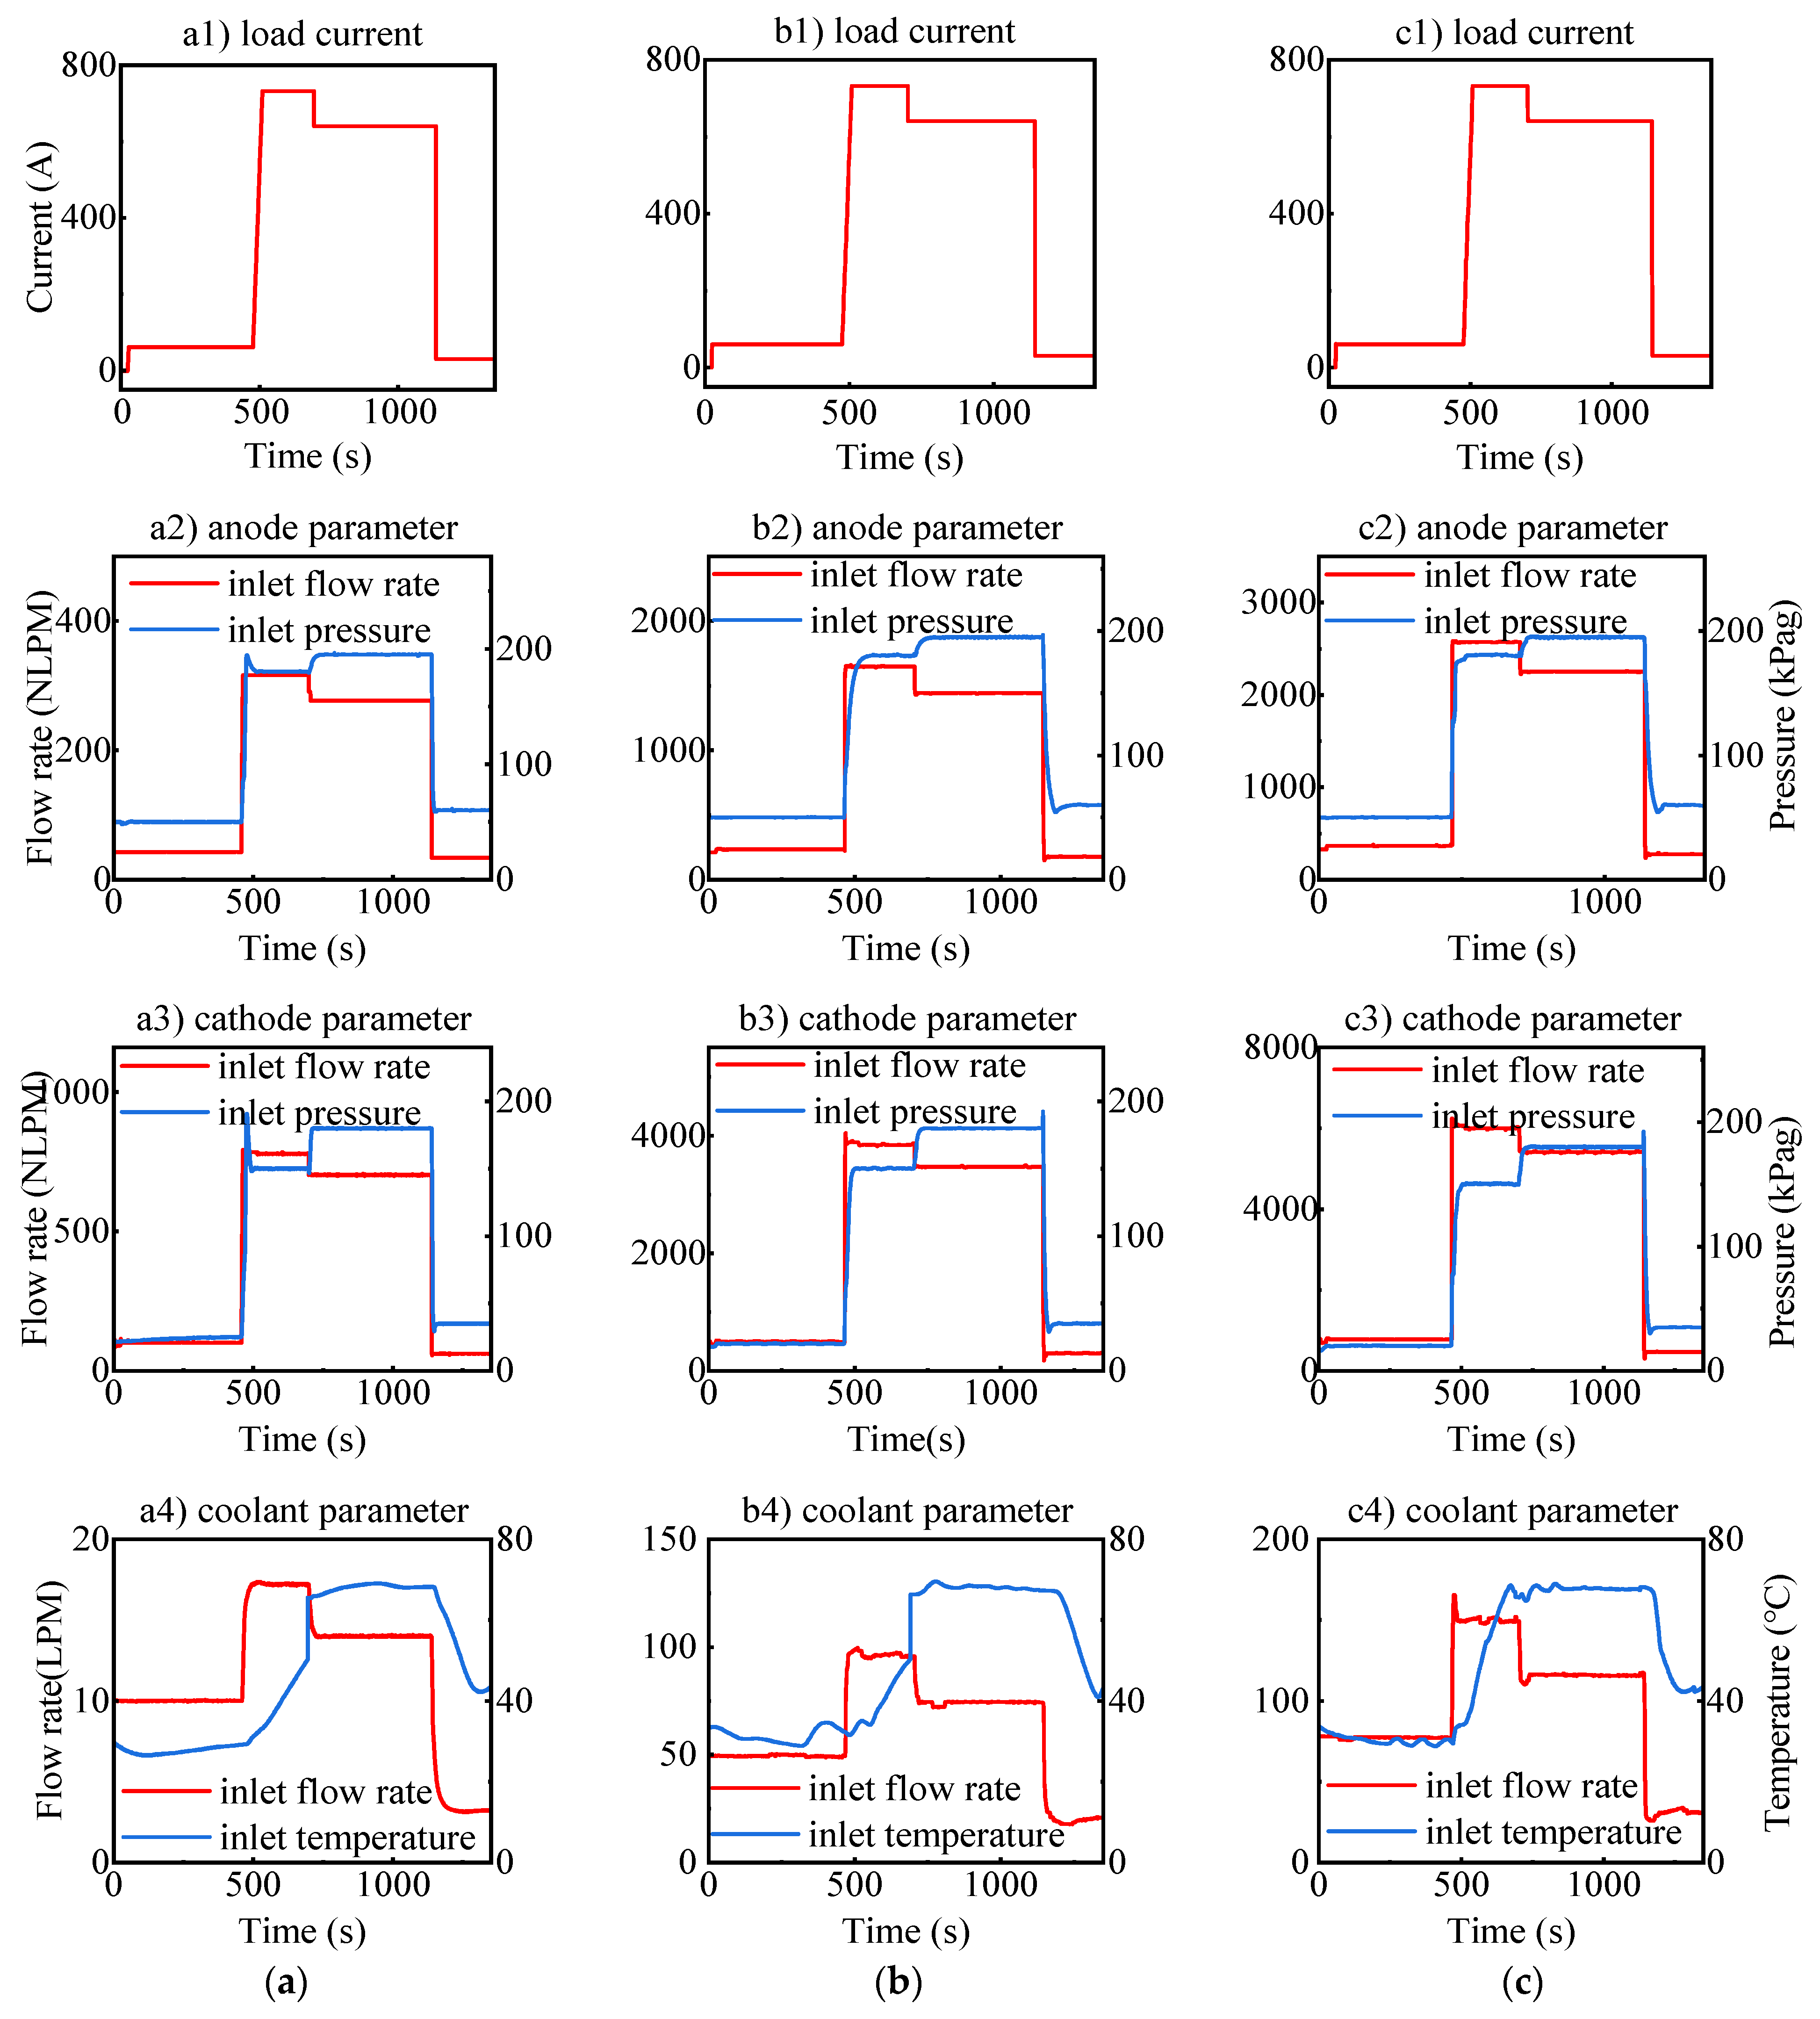
2.3. PEMFC Characterizations

For the steady-state characteristics, this study selects a large load output operating point and sets a constant output current so that the system operates at a constant operating point, and the steady-state characteristics of fuel cell stacks are shown in Figure 4. The results show that each PEMFC stack maintains stable system responsiveness and good output capability when operating at a large load steady-state operating point.
For the dynamic characteristics, in order to describe the characteristics of each fuel cell under large and high dynamics, this paper sets up the large variable load uploading (the uploading current is set to 20 A/s) and downloading operation conditions. The dynamic performance of each fuel cell stack is shown in Figure 5. The results show that the load current and inlet gas parameters perform well under the large variable load condition; however, the inlet coolant temperature adjustment time is long.

3. MFCS Thermal Management System Model

Based on the results of experimental testing and the selection of the sub-stack power levels, the MFCS thermal management system is to be developed.

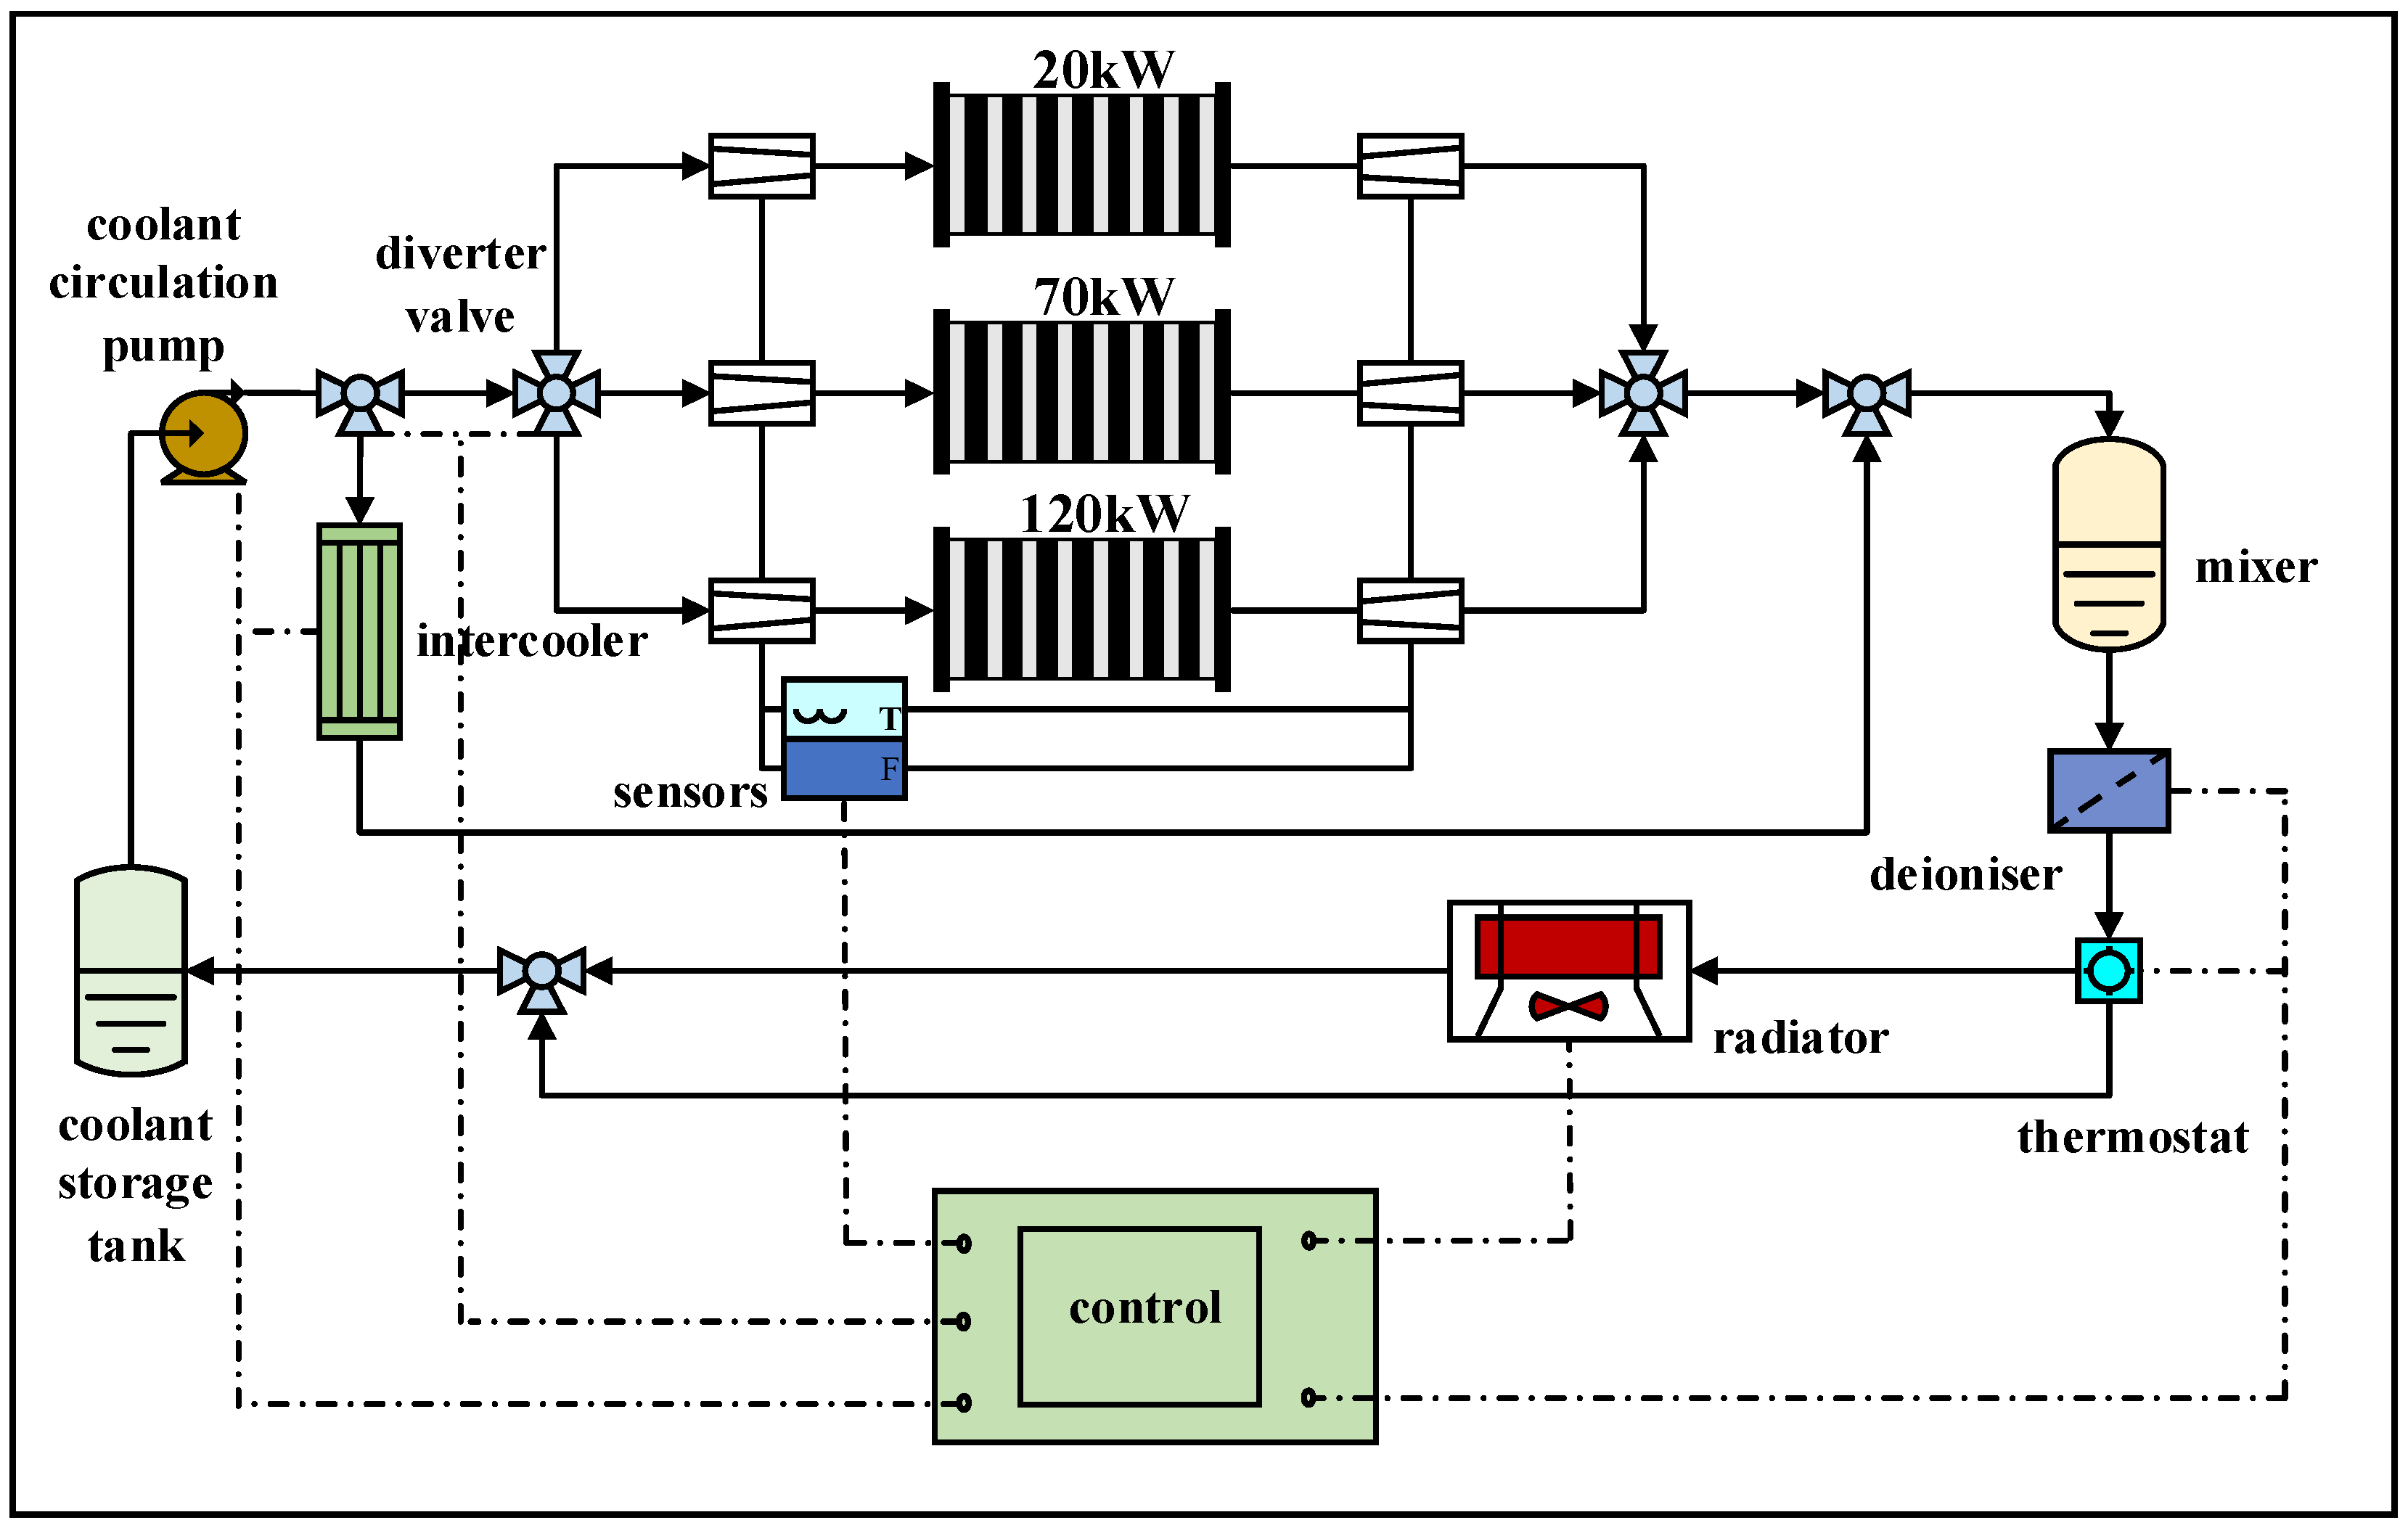
3.1. Thermal Management System Structure

The structure of the MFCS thermal management system is shown in Figure 6. It is water-cooled, and the circulation structure is improved on the basis of the single-stack fuel cell thermal management system, using a set of circulation pipes to dissipate heat from the three stacks connected in parallel [Comparison of Different Topologies of Thermal Management Subsystems in Multi-Stack Fuel Cell Systems]. The main functional components included in the thermal management system are: coolant circulation pump, diverter valves, mixer, three-way valve, thermostat, radiator, coolant storage tank, and deioniser.

3.2. Modeling of PEMFC Stack

The single-cell voltage of the PEMFC can be expressed as:
V cell = E cell V act V ohm V conc
where E cell denotes the reversible potential; V act denotes the activation overvoltage; V ohm denotes the ohmic overvoltage; V conc denotes the concentration overvoltage.
The reversible potential is expressed as:
E cell = 1.229 8.5 × 10 4 ( T st 298 ) + 4.308 × 10 5 T st ( ln p H 2 1.013 + 1 2 ln p O 2 1.013 )
where p H 2 denotes the partial pressure of hydrogen; p O 2 denotes the partial pressure of oxygen; Tst denotes the stack temperature.
The activation overvoltage is expressed by the empirical equation:
V act = V 0 + V a ( 1 e C 1 · i )
where V 0 denotes the voltage loss at a current density of 0; V 0 and V a are both functions of temperature and oxygen partial pressure; i denotes the current density; and C1 denotes an empirical constant of activation polarization.
The ohmic overvoltage is expressed by Ohm’s law as:
V ohm = i A mem R ohm
where A mem and R ohm denote the PEMFC effective membrane area and equivalent resistance, respectively.
The concentration overvoltage is expressed by the empirical equation:
V conc = m T exp C 2 i
where m T is a negatively correlated function of temperature; and C2 denotes an empirical constant of concentration polarization.
Then, the output voltage of each PEMFC stack can be expressed as:
V st = N cell V cell = N cell ( E cell V act V ohm V conc )
where N cell denotes the number of single cells in each PEMFC stack.

3.3. Modeling of Thermal Balance

The assumptions for modeling the thermal management system are as follows:
(1)
The gases involved in the electrochemical reaction are ideal gases;
(2)
Temperatures within each single cell are the same and in good consistency;
(3)
Each stack outlet coolant temperature is assumed to be the stack temperature;
(4)
Neglecting heat exchange between the circulating pipes and the environment.
The temperature variation in each stack depends on the heat variation and can be represented by a heat balance equation:
Q ˙ st , i = Q ˙ react + Q ˙ an , in + Q ˙ ca , in + Q ˙ cool , in Q ˙ an , out Q ˙ ca , out Q ˙ cool , out Q ˙ rad Q ˙ conv
where Q ˙ st , i denotes the change in heat of the stack, kW; Q ˙ react denotes the heat generated by the electrochemical reaction; Q ˙ an , in and Q ˙ an , out denote the heat of the inlet and outlet gases at the anode, respectively; Q ˙ ca , in and Q ˙ ca , out denote the heat of the inlet and outlet gases at the cathode, respectively; Q ˙ cool , in and Q ˙ cool , out denote the heat of the inlet and outlet coolant of the stack, respectively; Q ˙ rad denotes the heat of thermal radiation; Q ˙ conv denotes thermal convective heat.
The heat generated by the electrochemical reaction inside the stack can be expressed as:
Q ˙ react = N cell I st ( E t V st )
where I st denotes the output current of the stack, A; E t denotes the theoretical electric potential, V.
The heat of the gas and coolant at the inlet and outlet of the stack can be expressed as:
Q ˙ an , in = Q ˙ an , in H 2 + Q ˙ an , in vap Q ˙ ca , in = Q ˙ ca , in O 2 + Q ˙ ca , in N 2 + Q ˙ ca , in vap Q ˙ an , out = Q ˙ an , out H 2 + Q ˙ an , out vap + Q ˙ an , out liq Q ˙ ca , out = Q ˙ ca , out O 2 + Q ˙ ca , out N 2 + Q ˙ ca , out vap + Q ˙ ca , out liq Q ˙ cool , in = C p cool m ˙ cool , in ( T cool , in T 0 ) Q ˙ cool , out = C p cool m ˙ cool , out ( T cool , out T 0 )
where superscripts H 2 , O 2 , N 2 , vap and liq denote hydrogen, oxygen, nitrogen, vapor and liquid water, respectively; C p denotes the specific heat capacity of the coolant, J / ( kg · K ) ; T cool , in and T cool , out denote the inlet and outlet coolant temperatures, respectively, and T 0 denotes the ambient temperature, K.
The heat calculation for heat radiation and convection can be expressed as:
Q ˙ rad = ε σ A rad ( T st 4 T 0 4 ) Q ˙ conv = h A conv ( T st T 0 )
where ε denotes the blackness of the stack; σ denotes the Stepan–Boltzmann constant, 5.67 × 10 8   W / ( m 2 · K 4 ) ; A rad denotes the area of heat radiation; h denotes the convective heat transfer coefficient between the surface of the stack and the ambient environment; and A conv denotes the convective heat transfer area.

4. Model Predictive Control of MFCS Stack Temperatures

The MPC algorithm is highly suitable for managing the multivariable and delayed-response temperature control challenges in MFCS [23]. This section presents an MPC strategy, leveraging a BP neural network-based prediction model to achieve precise and efficient temperature regulation for the MFCS.

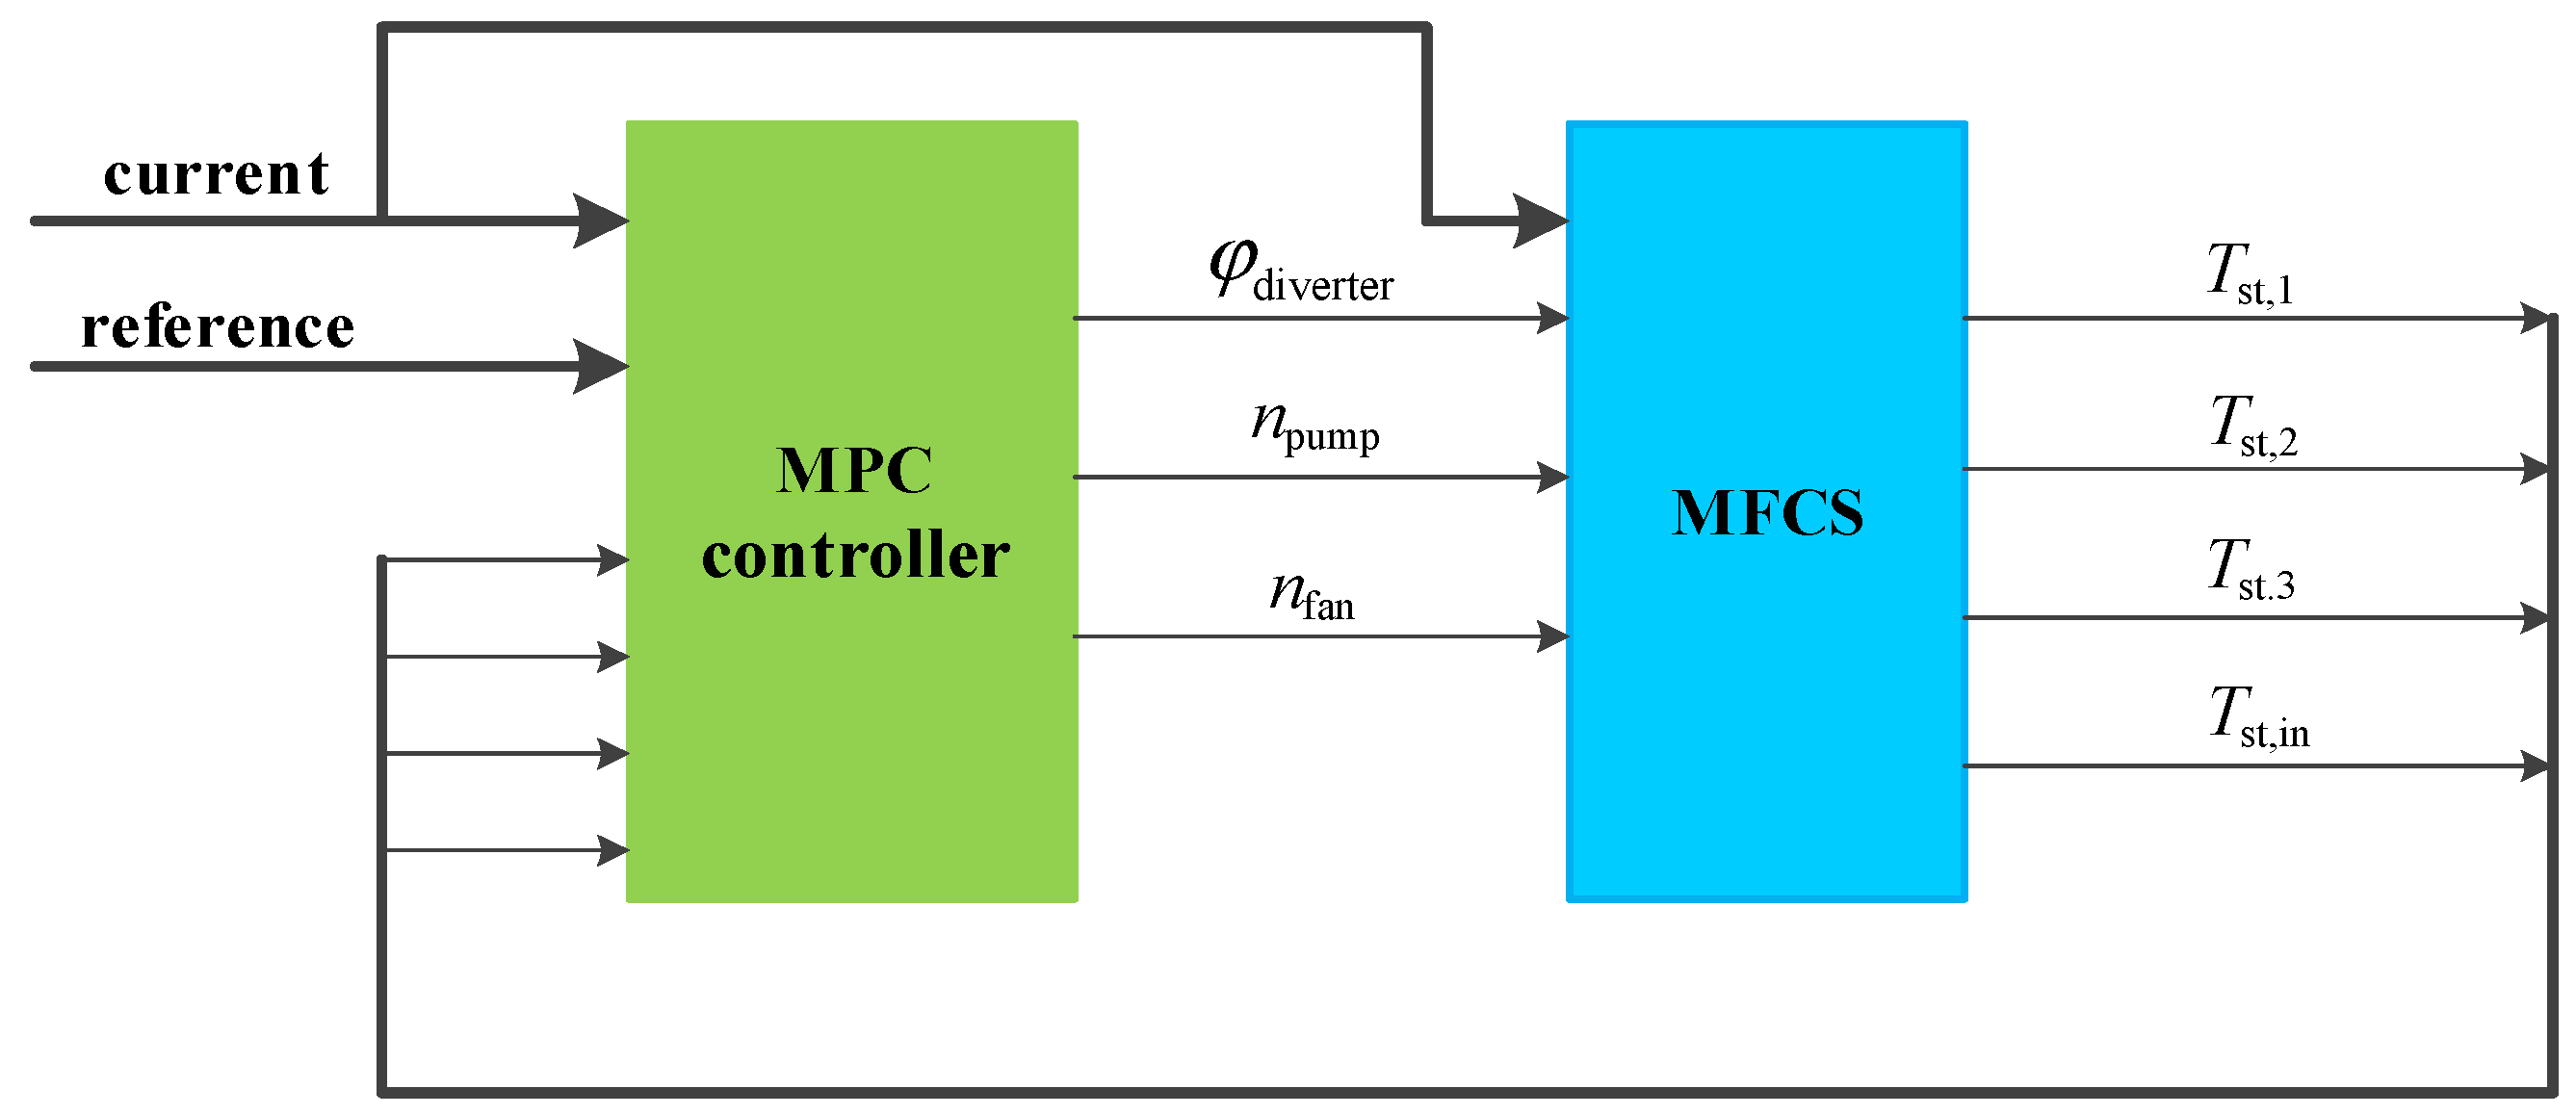
4.1. MFCS Thermal Management System Control Structure

The proposed MPC system incorporates key control elements such as radiator fan speed, coolant pump speed, and diverter valve openings for individual stacks. Additionally, stack output currents are treated as disturbance variables. Figure 7 illustrates the MPC controller structure, where reference temperatures for 20 kW, 70 kW, and 120 kW stacks are set to 348 K, and the inlet coolant temperature is maintained at 338 K. The control mapping relationships are described by Equation (11).
n pump n fan φ 2 φ 3 T st , 1 T st , 2 T st , 3 T st , in
where n pump denotes the coolant circulation pump speed, rpm; n fan denotes the radiator fan speed, rpm; φ 2 denotes the opening of diverter valve 2 (stack 2); φ 3 denotes the opening of diverter valve 3 (stack 3); T st , 1 , T st , 2 , and T st . 3 denote the temperatures of the 20 kW, 70 kW, and 120 kW stacks, respectively, K; and T st , in denotes the coolant temperature, K.

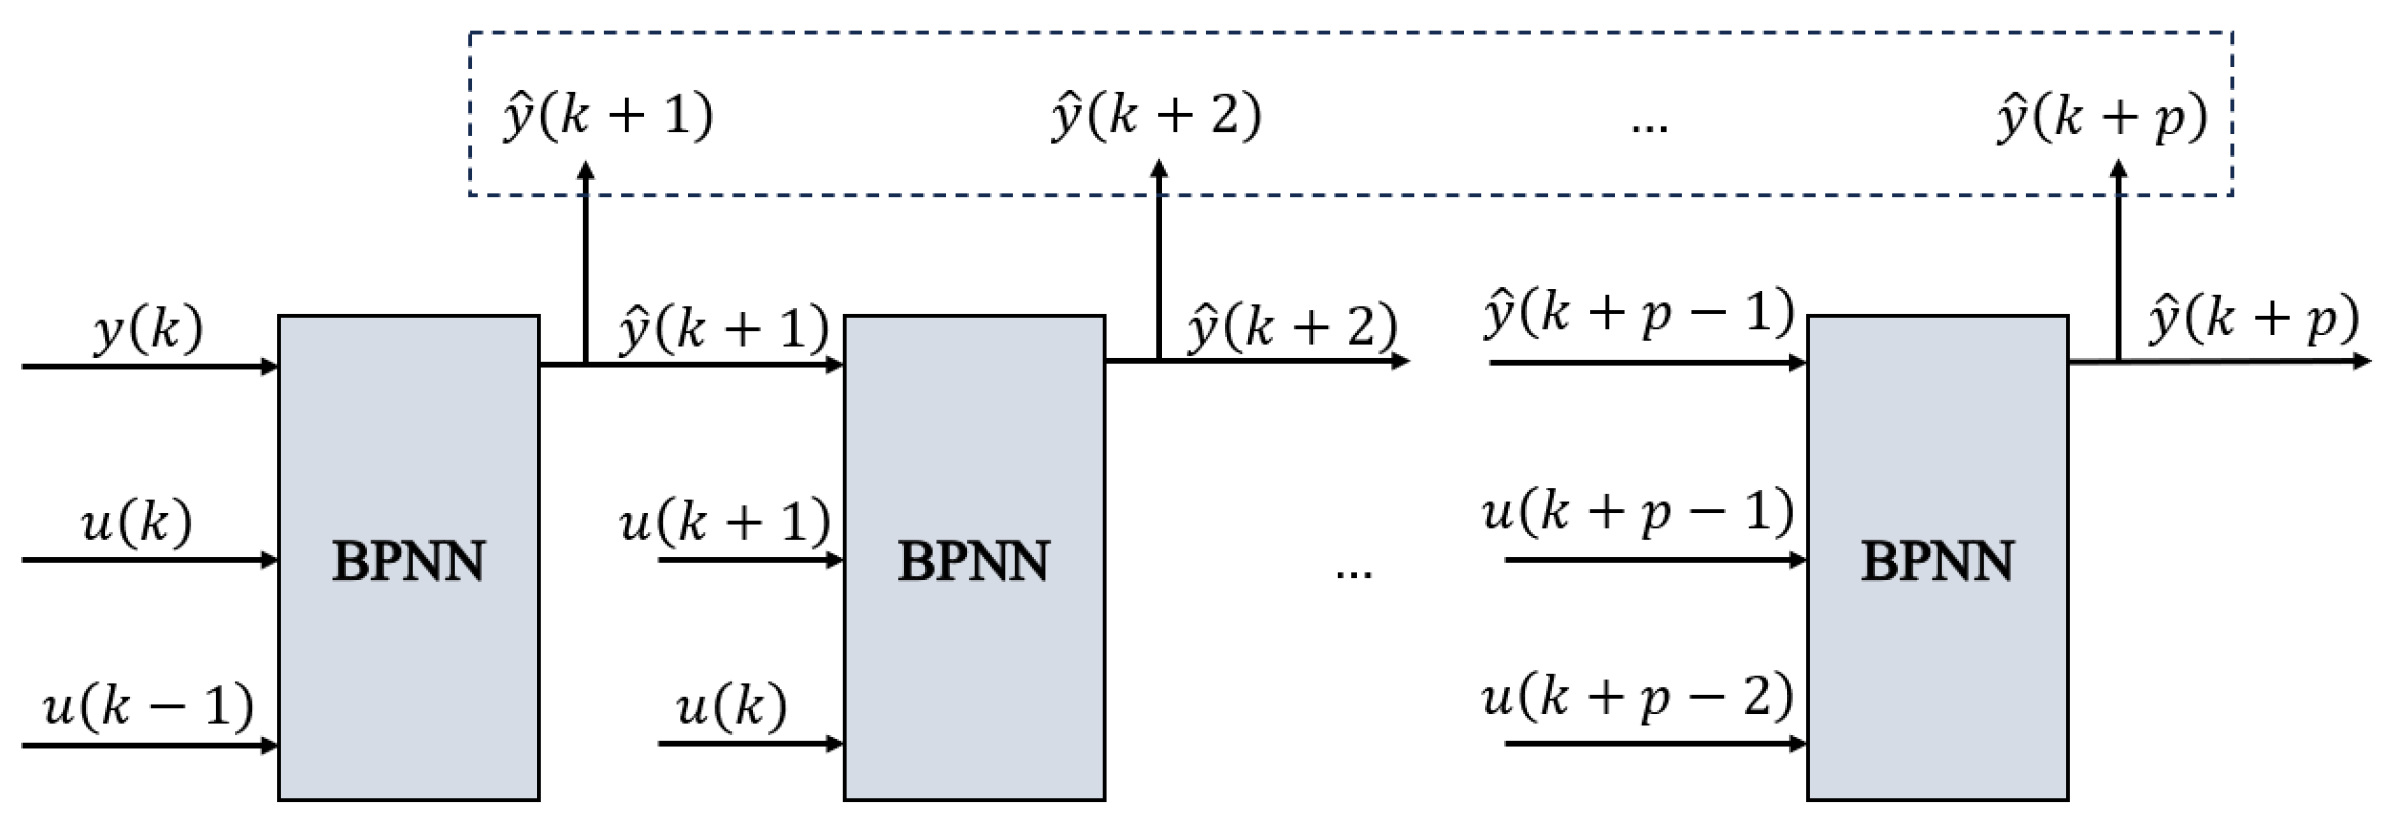
4.2. System Prediction Modeling of BP Neural Network

The BP neural network exhibits strong capabilities in approximating nonlinear functions, making it a suitable choice for developing a prediction model for the thermal management system of an MFCS. By training the network with relevant operational data, it effectively captures the dynamic temperature variation characteristics of the system across diverse operating conditions. The prediction model is mathematically represented as:
y ( k + 1 ) = f ( u ( k m ) , , u ( k 1 ) , u ( k ) , y ( k n ) , , y ( k 1 ) , y ( k ) )
where u ( k ) and y ( k ) denote the input and output of the system at moment k, respectively; m and n denote the output and output order of the system, respectively.
In the thermal management system, the BP neural network is trained by selecting the input values from the (k − 1)th time step, along with the input and output values from the kth time step, as the network inputs. The corresponding output value at the (k + 1)th time step is used as the target output. The system’s inputs and outputs are formally defined as follows:
u = n pump n fan φ 2 φ 3 I st , 1 I st , 2 I st , 3 ,   y = T st , 1 T st , 2 T st , 3 T st , in
where I st , 1 , I st , 2 , and, I st , 3 denote the output currents of 20 kW, 70 kW, and 120 kW stacks in MFCS, respectively. A random signal is applied to the system based on the relationship between input and output, and the output of the system under the input of the random signal is obtained. The input and output data of the system are matched according to the time sequence to form the original training data, and the BP neural network is trained, and the structure of the established neural network and the training parameters are shown in Table 1. For the trained BP neural network model, the system prediction model is verified by setting random working conditions, and the BP neural network prediction model can describe the dynamic characteristics of the system well, and the maximum error with the actual system is within 0.2 K.
When the MPC controller is used, to obtain the response of the system in the prediction time domain, the p-step prediction of the system through Equation (7) can be expressed as:
y ( k + p ) = f ( u ( k + p m ) , , u ( k + p 1 ) , y ( k + p n ) , , y ( k + p 1 ) )
A recursive multi-step prediction model is constructed to predict future system states iteratively. The model adjusts dynamically based on current outputs and disturbances, as depicted in Figure 8.

4.3. Design of the DMC

DMC, a variant of MPC, optimizes system response by solving a quadratic programming problem [24]. Unlike conventional segmented linear MPC models, the DMC leverages the nonlinear BP neural network prediction model to improve accuracy and reduce development complexity. The combination of DMC and BP neural network offers several theoretical advantages: enhanced predictive accuracy, faster convergence and optimization, increased robustness and adaptability, simplified model development, and enhanced control performance. For a system with multiple inputs and multiple outputs, the unit step response model can be expressed as:
Y ( k ) = M s s Y ( k 1 ) + S u Δ u ( k 1 ) + S d Δ d ( k 1 )
where M s s denotes the state transfer matrix; S u and S d denote the input matrix and measurable perturbation matrix of the unit step response state space model, respectively. When the control time domain is m, the prediction time domain is p, and p-step prediction is performed based on Equation (15), the output sequence of the system in the prediction time domain can be expressed as:
Y p ( k + 1 | k ) = M Y ( k ) + S ^ u Δ U ( k ) + S ^ d Δ d ( k )
where Y p ( k + 1 | k ) denotes the output sequence in the prediction time domain; Δ U ( k ) denotes the control sequence in the control time domain; M , S ^ u and S ^ d denote the state transfer matrix, input matrix, and measurable perturbation matrix in the prediction time domain, respectively.
Considering the constraints of the input and output conditions of the system, the performance index of the quadratic form of the optimal control rate can be expressed as:
J = Γ y ( Y p ( k + 1 | k ) R ( k + 1 ) ) 2 + Γ u Δ U ( k ) 2
where Γ y denotes the error weighting matrix; Γ u denotes the control weighting matrix; and R ( k + 1 | k ) denotes the sequence of reference in the prediction time domain.
For Equation (17), the quadratic programming algorithm is used to solve the optimization function, and Equation (17) can be transformed into a quadratic programming standard type, as shown in Equation (12):
J ˜ = Δ U ( k ) T H Δ U ( k ) G ( k + 1 | k ) T Δ U ( k ) s . t . H = S ^ u T Γ y T Γ y S ^ u + Γ u T Γ u G ( k + 1 | k ) = 2 S ^ u T Γ y T Γ y E p ( k + 1 | k ) E p ( k + 1 | k ) = R ( k + 1 ) M s s Y ( k ) S d Δ d ( k )
where E p ( k + 1 | k ) denotes the difference between the desired output and the predicted output of the system. According to the quadratic programming algorithm, the control variables at the current moment are calculated. Then, the control variables at the next moment are calculated according to the MPC theory.

5. MPC Controller Simulation and Verification

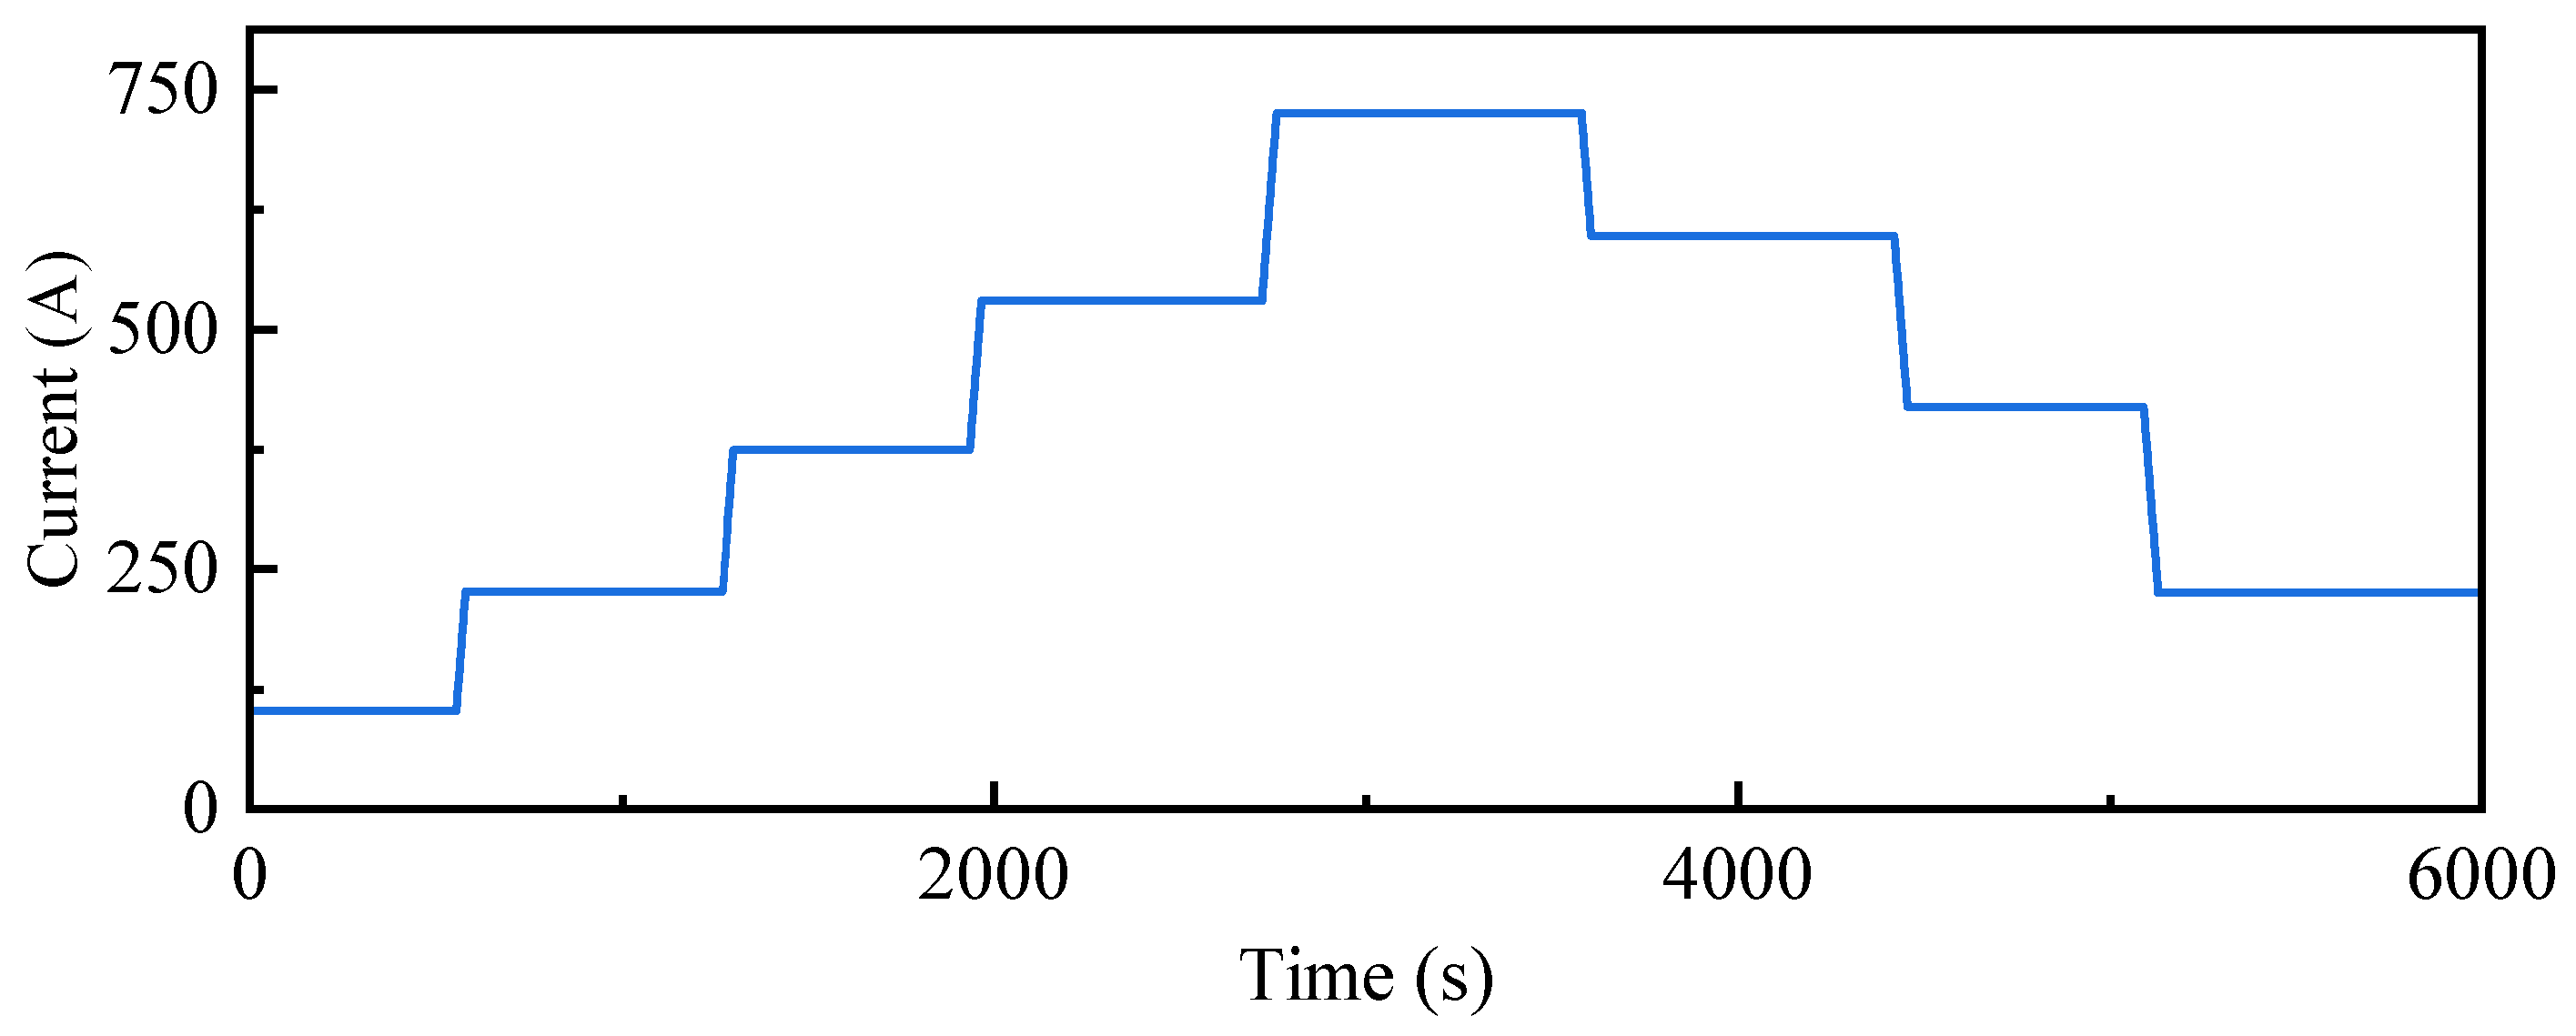
5.1. Design for Test Conditions

The design of test conditions should take into account system limitations such as actuator output range and system response. In the MFCS, the controller’s constraints on actuator outputs and system outputs are shown in Table 2.
Different from the traditional step condition, this paper adopts the step-like condition in verifying the effect of DMC control, this is because the actual system needs a certain response time, which cannot be idealized considering the robustness. As shown in Figure 9, the designed test condition pulling current speed is 5 A/s and the current range is 0–750 A.

5.2. Analysis of Simulation Results Under Test Conditions

The design of MPC controllers based on linearization theory is a conventional approach, particularly for temperature control in the MFCS thermal management subsystem. This approach necessitates the deployment of multiple MPC controllers, each corresponding to a specific steady-state operating point, to ensure effective control across the entire operating range. However, a limited number of steady-state points can lead to suboptimal control performance, while an increased number of points significantly raises the development complexity and cost.
To address these limitations, this study proposes a dynamic matrix controller (DMC) strategy, leveraging a BP neural network to construct a nonlinear system prediction model. This approach enables the generation of the system’s step response matrix for optimal control. The control performance of the DMC, based on the BP neural network, is compared to that of an MPC controller employing segmental linearization through simulation analyses.
The comparative results under the test conditions illustrated in Figure 10 demonstrate that the DMC offers superior performance. As shown in Figure 10 and Figure 11, the regulation of coolant pump speed and fan speed under the DMC is significantly more stable, with minimal fluctuations at operating condition transition points, compared to the MPC controller with segmental linearization. This highlights the enhanced robustness and adaptability of the proposed DMC approach.
The simulation results for the stack temperatures, as illustrated in Figure 12, highlight the comparative performance of the two controllers. The MPC controller, utilizing a segmented linearized prediction model, exhibits an overshoot of stack and coolant temperatures exceeding 3 K, with an adjustment time of approximately 280 s following a variable load. In contrast, the DMC, based on the BP neural network prediction model, demonstrates superior performance by maintaining the temperature deviation of the stacks and coolant inlet within 1.5 K of the desired value. Additionally, the DMC achieves a significantly shorter adjustment time of approximately 180 s, with reduced overshoot during the transition process. The control effects at various operating switching points, summarized in Table 3, further validate the effectiveness of the DMC proposed in this study, underscoring its capability to provide precise and efficient temperature regulation.

5.3. Verification of Dynamic Conditions

The DMC proposed in this study demonstrates robust performance under the designed test conditions. To further evaluate its effectiveness, the controller’s performance is validated under the China Weighted Transient Vehicle Cycle (CWTVC) working conditions, as depicted in Figure 13.
The temperature variations in the system under CWTVC operating conditions, as controlled by the DMC, are presented in Figure 14. Throughout system operation, the temperatures of individual stacks and the coolant inlet exhibit minimal fluctuations, remaining within the prescribed range. These results demonstrate that the DMC, leveraging the BP neural network prediction model, achieves effective temperature regulation under practical working conditions. This indicates its suitability for meeting the operational requirements of the MFCS thermal management subsystem in real-world applications.

6. Conclusions

In this paper, a parallel thermal management subsystem model of the MFCS is constructed and a DMC based on a BP neural network prediction model for the thermal management subsystem is designed for system thermal management.
The BP neural network prediction model is used instead of the linearized model, which can better deal with the problem of predictive model mismatch existing in MPC and greatly improve the accuracy of the system model and the control effect of the controller.
In order to validate the effectiveness of the DMC for the application, in addition to the comparison with the segmented linearization MPC controller in the step-like condition, the validation is also performed in the CWTVC condition. The results show that the application of the DMC in the thermal management subsystem can keep the temperature fluctuation range of each stack within 1.5 K and the temperature adjustment time within 180 s, and it is suitable for the temperature control of the MFCS, which has certain application value.

Author Contributions

Conceptualization, J.G. and S.Z.; methodology, H.S.; software, L.F. and W.S.; validation, H.S. and J.G.; formal analysis, J.G.; investigation, J.G. and L.F.; resources, H.S. and G.Z.; data curation, W.S. and L.F.; writing—original draft preparation, H.S. and J.G.; writing—review and editing, W.S., G.Z. and L.F.; visualization, J.G. and H.S.; supervision, S.Z. and W.S.; project administration, S.Z.; funding acquisition, W.S. and H.S. All authors have read and agreed to the published version of the manuscript.

Funding

Natural Science Foundation of Shanghai Zhongqiao Vocational and Technical University (No. ZQZR202422).

Data Availability Statement

The data presented in this study are available upon request from the corresponding author.

Acknowledgments

This work was supported by Natural Science Foundation of Shanghai Zhongqiao Vocational and Technical University, Shanghai TXJS Engineering Technology Co., Ltd., Shanghai REFIRE Technology Co., Ltd. and AVL-List Gmbh.

Conflicts of Interest

Hongtao Su was employed by the Shanghai Tongtao Technology Co., Ltd., Gang Zhang was employed by the Shanghai Motor Vehicle Inspection Certification & Tech Innovation Center Co., Ltd. The remaining authors declare that the research was conducted in the absence of any commercial or financial relationships that could be construed as a potential conflict of interest. There is no copyright issue associated with any of the figures.

References

  1. Yu, X.; Wang, B.; Wang, W.; Guo, X.; Han, J.; Chen, X. Analysis of Renewable Resources in Central China under the “Double Carbon” Strategy. Energy Rep. 2022, 8, 361–373. [Google Scholar] [CrossRef]
  2. He, X.; Xiang, Q.; Jia, J.; Zhang, Z.; Yan, J.; Xu, Y.; Chen, D. Effect of Methyl Butyrate Blending on Soot Formation in Jet A Laminar Diffusion Flame. Fuel 2024, 376, 132598. [Google Scholar] [CrossRef]
  3. Aminudin, M.A.; Kamarudin, S.K.; Lim, B.H.; Majilan, E.H.; Masdar, M.S.; Shaari, N. An Overview: Current Progress on Hydrogen Fuel Cell Vehicles. Int. J. Hydrogen Energy 2023, 48, 4371–4388. [Google Scholar] [CrossRef]
  4. Roy, A.; Pramanik, S. A Review of the Hydrogen Fuel Path to Emission Reduction in the Surface Transport Industry. Int. J. Hydrogen Energy 2024, 49, 792–821. [Google Scholar] [CrossRef]
  5. Du, Y.; Li, Y.; Ren, P.; Zhang, L.; Wang, D.; Xu, X. Oxygen Transfer at Mesoscale Catalyst Layer in Proton Exchange Membrane Fuel Cell: Mechanism, Model and Resistance Characterization. Chem. Eng. J. 2024, 494, 153021. [Google Scholar] [CrossRef]
  6. Yang, X.-G.; Ye, Q.; Cheng, P. In-Plane Transport Effects on Hydrogen Depletion and Carbon Corrosion Induced by Anode Flooding in Proton Exchange Membrane Fuel Cells. Int. J. Heat Mass Transf. 2012, 55, 4754–4765. [Google Scholar] [CrossRef]
  7. de-Troya, J.J.; Álvarez, C.; Fernández-Garrido, C.; Carral, L. Analysing the Possibilities of Using Fuel Cells in Ships. Int. J. Hydrogen Energy 2016, 41, 2853–2866. [Google Scholar] [CrossRef]
  8. Jiao, K.; Xuan, J.; Du, Q.; Bao, Z.; Xie, B.; Wang, B.; Zhao, Y.; Fan, L.; Wang, H.; Hou, Z.; et al. Designing the next Generation of Proton-Exchange Membrane Fuel Cells. Nature 2021, 595, 361–369. [Google Scholar] [CrossRef]
  9. Shao, Y.; Xu, L.; Xu, L.; Zhang, X.; Wang, Z.; Zhao, G.; Hu, Z.; Li, J.; Ouyang, M. Water Management Issues during Load Cycling under High Temperature and Low Humidity Conditions Relevant for Heavy-Duty Applications of PEMFC. eTransportation 2023, 18, 100285. [Google Scholar] [CrossRef]
  10. Zhou, S.; Fan, L.; Zhang, G.; Gao, J.; Lu, Y.; Zhao, P.; Wen, C.; Shi, L.; Hu, Z. A Review on Proton Exchange Membrane Multi-Stack Fuel Cell Systems: Architecture, Performance, and Power Management. Appl. Energy 2022, 310, 118555. [Google Scholar] [CrossRef]
  11. Li, Y.; Yang, F.; Chen, D.; Hu, S.; Xu, X. Thermal-Physical Modeling and Parameter Identification Method for Dynamic Model with Unmeasurable State in 10-kW Scale Proton Exchange Membrane Fuel Cell System. Energy Convers. Manag. 2023, 276, 116580. [Google Scholar] [CrossRef]
  12. Liu, Y.; Gao, J.; Pei, P.; Yao, S.; Wang, F.; Qin, H. Effects of Dynamic Changes in Inlet Temperature on Proton Exchange Membrane Fuel Cell. J. Renew. Sustain. Energy 2019, 11, 044302. [Google Scholar] [CrossRef]
  13. Yang, L.; Nik-Ghazali, N.-N.; Ali, M.A.H.; Chong, W.T.; Yang, Z.; Liu, H. A Review on Thermal Management in Proton Exchange Membrane Fuel Cells: Temperature Distribution and Control. Renew. Sustain. Energy Rev. 2023, 187, 113737. [Google Scholar] [CrossRef]
  14. O’Keefe, D.; El-Sharkh, M.Y.; Telotte, J.C.; Palanki, S. Temperature Dynamics and Control of a Water-Cooled Fuel Cell Stack. J. Power Sources 2014, 256, 470–478. [Google Scholar] [CrossRef]
  15. Pei, Y.; Chen, F.; Jiao, J.; Ye, H.; Zhang, C.; Jiang, X. Fuel Cell Temperature Control Based on Nonlinear Transformation Mitigating System Nonlinearity. Renew. Energy 2024, 230, 120814. [Google Scholar] [CrossRef]
  16. Xu, J.-H.; Yan, H.-Z.; Ding, Q.; Zhu, K.-Q.; Yang, Y.-R.; Wang, Y.-L.; Huang, T.-M.; Chen, X.; Wan, Z.-M.; Wang, X.-D. Sparrow Search Algorithm Applied to Temperature Control in PEM Fuel Cell Systems. Int. J. Hydrogen Energy 2022, 47, 39973–39986. [Google Scholar] [CrossRef]
  17. Zhang, G.; Li, Q.; Chen, W.; Meng, X.; Deng, H. A Coupled Power-Voltage Equilibrium Strategy Based on Droop Control for Fuel Cell/Battery/Supercapacitor Hybrid Tramway. Int. J. Hydrogen Energy 2019, 44, 19370–19383. [Google Scholar] [CrossRef]
  18. Li, Q.; Yang, H.; Han, Y.; Li, M.; Chen, W. A State Machine Strategy Based on Droop Control for an Energy Management System of PEMFC-Battery-Supercapacitor Hybrid Tramway. Int. J. Hydrogen Energy 2016, 41, 16148–16159. [Google Scholar] [CrossRef]
  19. Zhou, S.; Gao, J.; Pan, Z.; Zhang, G.; Zhai, S.; Shen, W. Fault Diagnosis and Fault-Tolerant Control Method for a Multistack Fuel Cell Thermal Management Subsystem. Energy Technol. 2023, 11, 2300132. [Google Scholar] [CrossRef]
  20. Yuan, X.-H.; Wu, G.; Zhou, J.-G.; Xiong, X.; Wang, Y.-P. MPC-Based Thermal Management for Water-Cooled Proton Exchange Membrane Fuel Cells. Energy Rep. 2022, 8, 338–348. [Google Scholar] [CrossRef]
  21. Gao, J.; Zhou, S.; Lu, Y.; Shen, W. Simulation of a Novel Integrated Multi-Stack Fuel Cell System Based on a Double-Layer Multi-Objective Optimal Allocation Approach. Appl. Sci. 2024, 14, 2961. [Google Scholar] [CrossRef]
  22. Ma, M.; Shen, L.; Zhao, Z.; Guo, P.; Liu, J.; Xu, B.; Zhang, Z.; Zhang, Y.; Zhao, L.; Wang, Z. Activation methods and underlying performance boosting mechanisms within fuel cell catalyst layer. Escience/Dianhuaxue 2024, 4, 100254. [Google Scholar] [CrossRef]
  23. Rojas, J.D.; Ocampo-Martinez, C.; Kunusch, C. Thermal Modelling Approach and Model Predictive Control of a Water-Cooled PEM Fuel Cell System. In Proceedings of the IECON 2013—39th Annual Conference of the IEEE Industrial Electronics Society, Vienna, Austria, 10–13 November 2013. [Google Scholar] [CrossRef]
  24. Chen, M.; Xu, Z.; Zhao, J.; Shao, Z. Dynamic Matrix Control with Feed-Forward for Target Tracking. In Proceedings of the 2019 12th Asian Control Conference (ASCC), Kitakyushu, Japan, 9–12 June 2019. [Google Scholar]
Figure 1. (a) 20 kW, (b) 70 kW, and (c) 120 kW PEMFC stack.
Energies 18 02443 g001
Figure 2. PEMFC test system platform.
Energies 18 02443 g002
Figure 3. PEMFC single-cell consistency: (a) 20 kW fuel cell; (b) 70 kW fuel cell; (c) 120 kW fuel cell.
Energies 18 02443 g003
Figure 4. (a) 20 kW, (b) 70 kW, and (c) 120 kW PEMFC stack steady-state characteristics.
Energies 18 02443 g004
Figure 5. (a) 20 kW, (b) 70 kW, and (c) 120 kW PEMFC stack dynamic characteristics.
Energies 18 02443 g005
Figure 6. The structure of the MFCS thermal management system.
Energies 18 02443 g006
Figure 7. The structure of the MPC controller for the MFCS thermal management system.
Energies 18 02443 g007
Figure 8. Recursive multi-step prediction neural network model.
Energies 18 02443 g008
Figure 9. Test condition.
Energies 18 02443 g009
Figure 10. Coolant circulation pump speed under test conditions. (a) MPC with segmental linearization. (b) DMC control with BP neural network.
Energies 18 02443 g010
Figure 11. Radiator fan speed under test conditions. (a) MPC with segmental linearization. (b) DMC control with BP neural network.
Energies 18 02443 g011
Figure 12. Temperature control effects under test conditions. (a) MPC with segmental linearization. (b) DMC control with BP neural network.
Energies 18 02443 g012
Figure 13. CWTVC working conditions.
Energies 18 02443 g013
Figure 14. Temperature control effect of DMC under CWTVC operating conditions.
Energies 18 02443 g014
Table 1. BP neural network parameters.
ParameterNetwork structureActivation functionNumber of trainings
Value18 × 13 × 4Sigmoid302
Table 2. Controller’s constraints on actuator outputs.
ParameterMinimumMaximumType of Constraint
Coolant circulation pump speed (rpm)504500hard
Radiator fan speed (rpm)505000hard
Diverter valve opening0.10.95hard
Stack temperature (K)323363soft
Inlet coolant temperature (K)343353soft
Table 3. The control effects under test conditions.
Time/sPrediction Model20 kW Stack70 kW Stack120 kW StackInlet Coolant
Overshoot/KStable Time/sOvershoot/KStable Time/sOvershoot/KStable Time/sOvershoot/KStable Time/s
1935BPNN0.3181200.4831200.4461200.284120
Linearization0.8702600.9372601.0952602.160260
2720BPNN0.7281651.4731651.1461650.799165
Linearization1.1252351.9982353.1082351.129235
3580BPNN0.6651251.3211251.0051250.568125
Linearization0.9522601.9082602.6902601.365260
4420BPNN0.3921150.6111150.5411150.320115
Linearization0.7882801.3972801.7992801.788280
Disclaimer/Publisher’s Note: The statements, opinions and data contained in all publications are solely those of the individual author(s) and contributor(s) and not of MDPI and/or the editor(s). MDPI and/or the editor(s) disclaim responsibility for any injury to people or property resulting from any ideas, methods, instructions or products referred to in the content.

