Article

Numerical Simulation Study on Different Exhaust Air Transfer Conditions and Safety of Pulverized Coal System

1
School of Energy and Environment, Southeast University, Nanjing 211189, China
2
Guoneng Shenwan Ma’anshan Power Generation Co., Ltd., Ma’anshan 243051, China
*
Author to whom correspondence should be addressed.
Energies 2025, 18(10), 2408; https://doi.org/10.3390/en18102408
Submission received: 2 April 2025 / Revised: 28 April 2025 / Accepted: 6 May 2025 / Published: 8 May 2025

Abstract

:
Enhancing the safety of pulverizing systems is crucial for ensuring safe operation in the power industry. In this study, the exhaust air transfer system of a 330 MW power unit was investigated through numerical simulations. The internal flow field, the temperature distribution, and the CO concentration in the primary airbox under five exhaust air transfer conditions were analyzed. Furthermore, the effects of varying hot air velocity and temperature on the low-velocity region and combustible gas accumulation were examined to determine optimal safety conditions. The results indicate that, among the five conditions, the 100% B exhaust air transfer leads to the largest low-velocity region, the highest average CO mass fraction, and the greatest deflagration risk, whereas the 75% A exhaust air transfer condition ensures higher safety. Increasing the hot air velocity from 1 m/s to 10 m/s improves flow characteristics and reduces volatile matter accumulation, with lower velocities associated with higher CO concentrations. In contrast, raising the hot air temperature from 560 K to 610 K has a smaller effect on the flow characteristics, although higher temperatures correspond to slightly increased CO levels. In practical operation, maintaining an A/B exhaust air ratio of 75%A/25%B or keeping the hot air velocity above 5 m/s and the hot air temperature below 580 K is most beneficial for the safe operation of the pulverizing system.

1. Introduction

Against the background of deep peak shaving, coal-fired power units exhibit greater flexibility in load regulation, leading to more frequent coal blending and fuel switching during operation. Load adjustments alter the operating modes and the parameters of the pulverizing system, while variations in coal quality affect its safety. For instance, changes in coal-powder-conveying airflow velocity and temperature occur during load regulation, and the variations in coal volatile content can lower the explosion limit of pulverized coal [1,2]. If operational parameters and related equipment are not adjusted accordingly after a fuel switch, an explosion could pose significant threats to personnel and equipment safety. As a critical component of coal-fired power units, the pulverizing system presents a potential safety hazard under certain conditions, including adequate concentrations of combustible materials, oxygen [3,4], the availability of ignition energy [5], sufficient gas–solid interaction surface area [6,7], and spatial confinement. Therefore, under conditions of load regulation and fuel variation, studying different operating conditions of the pulverizing system and their safety implications is of great significance.
Many researchers have studied the safety issues of pulverizing systems. Wang [8] analyzed a deflagration accident in an intermediate storage-type pulverizing system and found that coal dust accumulation areas were the main ignition sources, leading to modifications of the coal mill and coarse separator. Xu et al. [9] investigated the explosion characteristics of pulverized coal and found that coal with a dry, ash-free volatile content exceeding 25% is classified as explosive and poses a significant deflagration risk. Zhang et al. [10] attributed deflagration in a power plant to low flow velocity at the fine separator inlet and improved safety by increasing velocity and powder uniformity. Shang et al. [11] enhanced safety by analyzing the flow field in the fine separator and reducing pulverized coal content in exhaust air. Other studies have addressed particle motion [12], blockage [13,14], wear [15], and deflagration risks [16], leading to structural optimizations that improved system safety and stability.
However, with the development of deep load modulation, pulverizing systems face increasing demands for adaptability and flexibility. In response, Zhou et al. [17] proposed a pulverizing system with an exhaust–hot air hybrid powder transportation method, while retaining the original system structure. The system is equipped with an exhaust air transfer device that redirects exhaust air from the outlet of the exhauster fan into the primary airbox, which already contains hot air. This enables flexible adjustment of air–powder transport parameters based on the characteristics of the coal powder. Studies [18,19] evaluated the performance of this system with multiple coal types using coal quality analysis, thermogravimetric experiments, and field modification tests. The results indicate that this technology improves fuel adaptability and supports stable combustion and emissions control. However, it also increases structural and control complexity and has been associated with potential safety hazards such as deflagration risk in the primary airbox [20]. Therefore, the internal flow field distribution of the exhaust air diversion device, along with changes in operating conditions and potential deflagration risks during exhaust transfer, require further investigation.
Moreover, several studies have explored the factors influencing coal dust deflagration. Cao et al. [21] investigated the relationship between gas flow velocity and flame propagation speed using both numerical simulations and experiments, demonstrating strong consistency between the two approaches. Xu et al. [22] simulated coal flow in horizontal pipes, showing that higher airflow reduced bottom particle deposition. The simulation results were validated by comparison with experimental data obtained from electrical capacitance tomography (ECT) under the same conditions. Liu et al. [23] experimentally studied coal ignition in high-temperature oxygen environments as a substitute for oil burners and found that higher primary air temperature and lower velocity facilitate ignition. Li et al. [24] studied oxygen consumption at different temperatures by combining closed-vessel oxygen consumption tests with simulations and obtained the temporal variation of CO concentration under varying thermal conditions. Pan et al. [25] used microcalorimetry to examine the oxidation behavior of pulverized coal at different heating rates and found that higher heating rates enhanced its tendency to self-ignite. However, there is still a lack of research on the effects of pyrolysis and deflagration in the exhaust air diversion device, and the safe operating range of this system requires further study.
Therefore, this study focuses on the intermediate storage-type pulverizing system of a 330 MW coal-fired power unit. Between 2017 and 2022, following the modification to implement a composite exhaust air–hot air pulverized coal conveying system, six deflagration incidents have occurred, four of which were concentrated in the exhaust air transfer device, represented by the primary airbox. In this study, numerical simulations are employed to investigate the exhaust air transfer system, analyzing the flow characteristics within the primary airbox and its connecting pipelines under different exhaust air transfer conditions. Additionally, the study explores the optimal ranges of hot air velocity and temperature to maintain system safety. The findings provide guidance for reducing safety risks in pulverizing systems and serve as a reference for the internal flow field studies of similar systems.

2. Research Object and Methodology

2.1. Research Object and Fuel Analysis

This study focuses on the exhaust air transfer device in the intermediate storage-type pulverizing system of a 330 MW coal-fired unit at a certain power plant. The three-dimensional geometric model of the device is shown in Figure 1. It can be seen that the primary air box introduces exhaust air through two pathways, A and B. Taking the 100% B exhaust air intake condition as an example (Figure 1a), during operation, part of the A exhaust air is recirculated into the coal mill via the recirculation air valve, while the remaining portion is directed into the tertiary air duct for combustion. Meanwhile, part of the B exhaust air is recirculated into the coal mill, while the rest is transferred into the primary air box, where it mixes with hot air before exiting through eight outlet pipes to transport pulverized coal. In addition to this operational condition, several other exhaust air transfer configurations exist: 100% A exhaust air transfer (Figure 1b), where part of the A exhaust air serves as recirculation air, while the remainder is transferred into the primary air box to mix with hot air for coal transportation. Mixed exhaust air transfer configurations, including 25%A/75%B (Figure 1c), 50%A/50%B (Figure 1d), and 75%A/25%B (Figure 1e), include varying proportions of exhaust air that are transferred into the primary air box and mixed with hot air for pulverized coal transport.
Different exhaust air transfer modes influence the internal flow field, temperature field, and component concentration field of the primary air box. Notably, coal powder deposition is prone to occur at the bottom of the air box (highlighted in the red-framed region), which is the key focus of this study.
Based on on-site investigations, pulverized coal samples collected after milling and separation (post-fine powder separator) were subjected to testing and thermogravimetric analysis (TGA). The key parameters are listed in Table 1, while the TGA results are presented in Figure 2. As shown in Table 1, the received volatile content of the coal used in the unit is 23.81%, and when converted to the dry ash-free basis, it becomes 37.51%, indicating a high deflagration risk [9]. Additionally, the ultrafine pulverized coal present in the exhaust air poses potential safety hazards. Figure 2 illustrates that the combustion process of the pulverized coal can be divided into four stages:
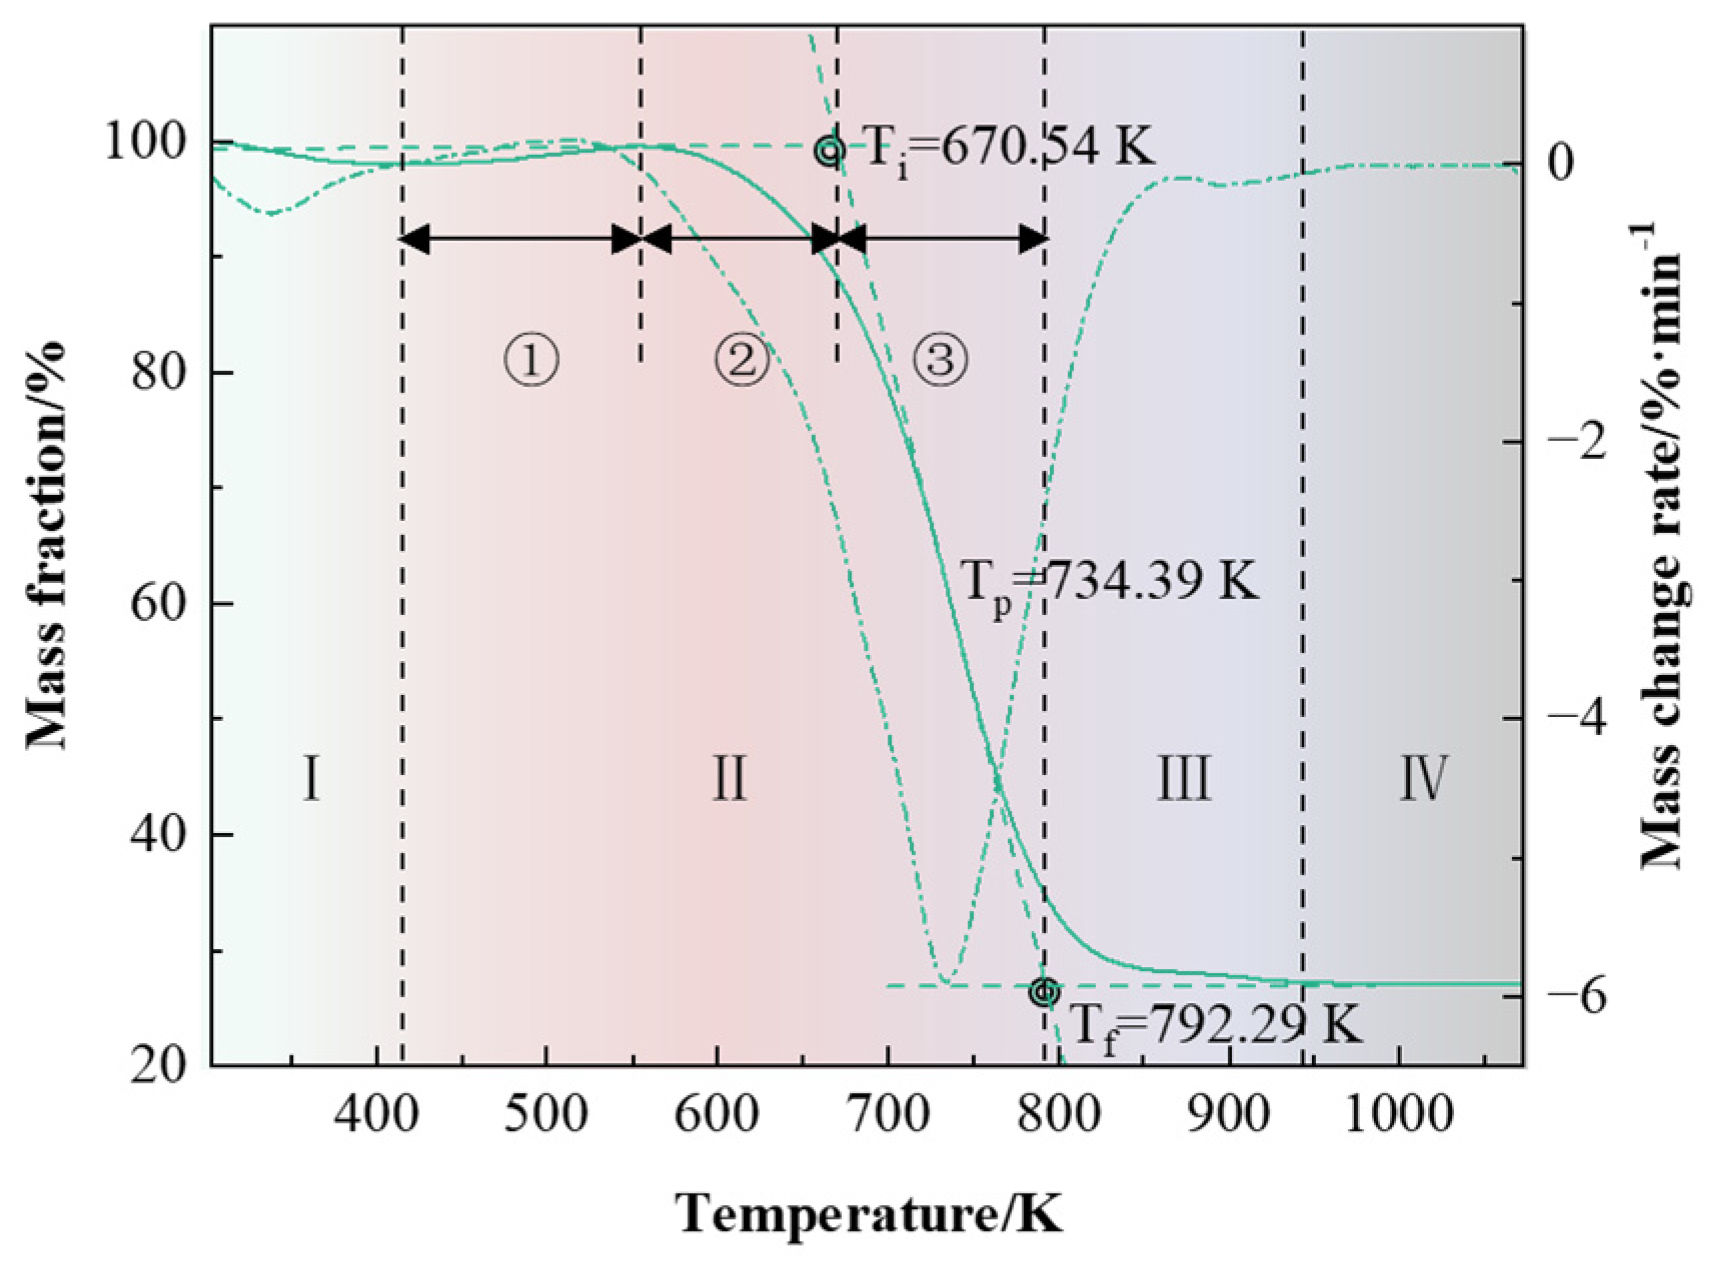
  • Dehydration stage (303 K to 415 K), where moisture is removed from the coal.
  • Primary combustion stage (415 K to 792 K), which is the main phase of coal combustion.
  • Silicate mineral decomposition stage (792 K to 943 K), during which mineral components undergo thermal decomposition.
  • Burnout stage (>943 K), where the remaining carbon content is nearly completely consumed, and further temperature increases result in minimal mass change.
The primary combustion stage can be further subdivided based on the ignition temperature (Ti) and burnout temperature (Tf). Specifically, between 415 K and 555 K, the coal absorbs oxygen and gains mass. From 555 K to Ti (670 K), deoxygenation and thermal decomposition occur, and from Ti (670 K) to Tf (792 K), active combustion takes place. The DTG curve in Figure 2 represents the rate of change in the mass fraction of the coal sample. When the combustion rate reaches its peak at 5.89%/min, the corresponding temperature, known as the maximum combustion rate temperature (Tp), is 734.39 K. Further processing of the TGA data reveals that the activation energies of pulverized coal during thermal decomposition and combustion are 79.54 kJ/mol and 116.31 kJ/mol, respectively. The corresponding pre-exponential factors are 155 s−1 and 1.16 × 10⁵ s−1. These parameters are subsequently utilized in numerical simulation calculations.

2.2. Mathematical Models and Parameters

In this study, computational fluid dynamics (CFD) methods were employed to simulate the internal flow characteristics of the exhaust air transfer device in the pulverizing system. The conservation equations of mass, momentum, energy, and chemical species were solved in the steady state using ANSYS Fluent 2024R2, which includes built-in models for chemical reactions, turbulence, and heat transfer.
To enhance the computational efficiency of the simulations, the following assumptions and simplifications were made:
  • The interactions and agglomeration between coal particles were neglected.
  • Coal particles were assumed to enter the computational domain uniformly from the exhaust air inlet.
  • The complex pyrolysis reactions of coal are simplified by considering only the main reactions, as listed in Table 2.
  • It was assumed that the exhaust air transfer device walls are sufficiently airtight, with no leakage.
The realizable k-ε turbulence model was adopted for turbulence modeling. This model features an improved turbulence viscosity formulation and incorporates correction terms that enhance its ability to handle curvature effects and rotational flows. As a result, it provides more accurate predictions for curved flows, shear flows, flow separation, confluent flows, and multi-outlet flow conditions [26,27]. The exhaust air transfer device consists of various geometric configurations, including curved pipes, square–round joints, and the mixing of hot and cold fluids, which contribute to the observed flow phenomena. For instance, when exhaust air enters the primary airbox, it mixes with hot air, resulting in a confluent flow. Hence, the realizable k-ε turbulence model is deemed most appropriate for this study. In this study, the discrete phase model (DPM) was employed to simulate the gas–solid two-phase flow. This model is based on the Euler–Lagrange approach, where the gas phase is treated as a continuous phase and solved using the Eulerian method, while the pulverized coal is treated as a discrete phase and solved using the Lagrangian method [28]. The exhaust air inlet was set as the injection surface for coal particles, and a discrete random walk model based on the Lagrangian approach was applied to describe the motion of pulverized coal [29,30]. For radiation heat transfer, the discrete ordinates (DO) radiation model was adopted. By solving the radiative transfer equation (RTE), this model accounts for radiation intensity at different locations and the influence of airflow velocity fields, providing a more accurate solution for radiative heat transfer [31].
Coal combustion consists of a series of interacting stages, and different mathematical models need to be applied in numerical simulations depending on the stage. For different coal types, when the temperature reaches 120 °C to 450 °C, the volatile matter begins to be released. According to the TGA results, the temperature at which volatile matter is released from the coal powder is around 300 °C. In this study, the two competing rates model is used to simulate the release of volatile matter. The rate of volatile matter release is given by the following formula [29,32]:
d m p d t = k m p 1 f v , 0 m p , 0
k = A e E / R T
where mp is the particle mass, in kg. mp,0 is the initial particle mass, in kg. t represents time, in s. fv,0 is the initial mass fraction of volatile matter in the particle. k is the kinetic rate, in s−1. A is the pre-exponential factor, with units of s−1. E is the activation energy, with units of J/mol. R is the universal gas constant, 8.314 J/(mol·K). T is the temperature, with units of K.
At different environmental temperatures, the release of volatile matter can be controlled by different competing rates. The competing rate at low temperatures is defined as 1 , and the competing rate at high temperatures is defined as 2 . Their respective definitions are given by Equations (3) and (4).
1 = A 1 e E 1 R T p
2 = A 2 e E 2 R T p
By weighting these two kinetic rates, the expression for the release of volatile matter can be obtained as follows:
m v t 1 f w , 0 m p , 0 m a = 0 t α 1 1 + α 2 2 exp 0 t 1 + 2 d t d t
where mv(t) represents the volatile matter mass at a given moment., in kg. fw,0 represents the mass fraction of evaporating/boiling material (if wet combustion is modeled). α1 is the yield factor for the first (slow) reaction, with a value of 0.3, and α2 is the yield factor for the second (fast) reaction, with a value of 1 [33,34]. ma represents the ash content in the particle, in kg.
The finite-rate models solve the transport equation for component mass fractions and are widely used in combustion simulations. Among them, the finite-rate/eddy-dissipation model (FR/ED) is a modification of the eddy-dissipation model and can be applied to account for multi-step reaction mechanisms. In this study, since the amount of pulverized coal is relatively small and the temperature is lower compared to combustion within the furnace, the coal reacts with hot air in a non-premixed manner. The oxidation of the coal is relatively slow, making it suitable for the application of the FR/ED model [35,36]. The principle of the FR/ED model is to describe component transport using the Arrhenius equation or the eddy-dissipation equation, incorporating the reaction rate as a source term in the equation during the calculation process. The equation for the finite-rate model is as follows:
k F R = Γ v i , r v i , r k f , r j = 1 N C j , r η j , r k b , r j = 1 N C j , r η j , r
where Γ represents the third-body influence coefficient, v i , r represents the stoichiometric coefficient of reactant i in reaction r, v i , r represents the stoichiometric coefficient of product i in reaction r, kf,r represents the forward reaction rate constant for reaction r, N represents the number of components in the system, Cj,r represents the molar concentration of component j in reaction r, kb,r represents the reverse reaction rate constant for reaction r, η j , r represents the rate exponent of reactant j in reaction r, η j , r represents the rate exponent of product j in reaction r.
The eddy-dissipation model assumes that the chemical reaction time is shorter than the eddy breakup time. Once reactants come into contact, the chemical reaction occurs immediately. Therefore, the reaction rate is determined by the turbulence mixing process of the components. The production rate of species i in reaction r is represented by the smaller of the following two expressions:
k i , r = v i , r M w , i K exp 1 ρ ε k min R f R v R , r M w , R
k i , r = v i , r M w , i K exp 1 K exp 2 ρ ε k P f P j N v j , r M w , j
where Mw,i represents the molecular weight of component i. Mw,j represents the molecular weight of component j. Mw,R represents the molecular weight of reactant. Kexp1 and Kexp2 are empirical constants, where Kexp1 ≈ 4 and Kexp2 0.5. fR represents the mass fraction of the reactant. fP represents the mass fraction of the product. ρ represents density, in kg/m3. ε represents turbulent dissipation rate, in m2/s3. v R , r represents the stoichiometric coefficient of reactant in reaction r. v j , r represents the stoichiometric coefficient of product j in reaction r.
The expression for the net reaction rate in the FR/ED model is as follows:
k F R / E D = min k F R , min k i , r
In fact, the Arrhenius reaction rate serves as a kinetic switch to control the overall reaction progress and prevent the reaction from occurring. Once the flame is ignited, the eddy-dissipation reaction rate is typically lower than the Arrhenius reaction rate, and the entire reaction process is constrained by the mixing process. The chemical reactions in the primary air box are relatively complex. Based on actual conditions, the primary chemical reactions were considered, and the kinetic parameters for these reactions, as derived from various literature studies [35,37,38], are shown in Table 2.
The reaction on the coke surface is modeled using the multi-surface reaction model. In this model, Smith [39] expresses the coke reaction rate using Equation (10):
k C = D 0 C g C s = k c C s n
where D0 represents the volume diffusion coefficient, Cg represents the average concentration of the gas component, Cs represents the average concentration of the gas component on the particle surface, kc represents the chemical reaction rate constant, n represents the apparent reaction order. Since Cs is an unknown variable, the expression is rewritten as Equation (11) and then solved iteratively.
k = k c C g k D 0 n
The operating conditions corresponding to different exhaust air transfer conditions are listed in Table 3. As shown in the table, the exhaust air velocities differ between the five operating conditions (A and B). For the 100%A and 100%B cases, the geometric model includes complete recirculation air pipes and tertiary air pipes. Therefore, when either A or B exhaust air is set to the transfer position, the velocity of the other exhaust air stream is not zero but rather participates in operation as recirculation air and tertiary air. For the 25%A/75%B, 50%A/50%B, and 75%A/25%B transfer conditions, a simplified model is used, where the recirculation air pipes and tertiary air pipes are omitted. The total exhaust air volume in these cases is derived from the actual exhaust air volume entering the primary air box under the 100%B condition. The exhaust air velocities for these cases are calculated proportionally based on their respective distribution ratios. The DCS data for different loads are summarized in Table 4. Based on the ranges of hot air velocity and temperature listed in the table, the hot air velocity in the simulations was set between 1 and 10 m/s, increasing by 1 m/s for each condition; the hot air temperature was set between 560 and 620 K, increasing by 10 K for each condition.

2.3. Grid Division and Reliability Verification

Based on the actual structure and dimensions, a 1:1 three-dimensional geometric model of the exhaust air transfer system was established. Taking the 100%B exhaust air transfer condition as an example, the mesh generation is shown in Figure 3. As observed in the figure, a structured mesh was applied to most regions, including the exhaust air pipes and primary air box, while unstructured mesh was used in a few areas, such as round-to-square transitions at pipe connections. Additionally, considering that multiple fluid streams converge at the primary air box inlet, the mesh in this region was locally refined to enhance accuracy.
The number of mesh elements has a significant impact on both computational speed and accuracy. In this study, four mesh schemes were designed with mesh counts of 330,000 (33w), 430,000 (43w), 530,000 (53w), and 630,000 (63w). The primary differences among these schemes lie in the mesh density of the primary air box and the round-to-square transition regions. To evaluate the impact of mesh resolution, a straight line with 100 sample points was selected at a specific location inside the primary air box, and the velocity values at these points were extracted. The results are shown in Figure 4a. As observed in the figure, the internal flow field calculations differ among different mesh resolutions. The 53w and 63w mesh schemes produce consistent results, while the 43w and 33w mesh schemes show noticeable discrepancies. To balance computational accuracy and efficiency, the 53w mesh scheme was selected for subsequent simulations. To further assess mesh independence, the relative errors of the 33w, 43w, and 63w meshes with respect to the 53w mesh were calculated. The absolute values of these errors are presented in Figure 4b, where the red bold line represents zero relative error. As shown, the 63w mesh exhibits the smallest deviation from the 53w mesh, with an average relative error of 3.3%. In contrast, the 33w and 43w meshes display larger errors of 10.5% and 12.7%, respectively. Consequently, the 53w mesh was chosen for the subsequent simulations, as it provides an optimal balance between accuracy and computational cost.
The DCS data of the unit were collected to obtain the average velocity and temperature at the primary air box outlet, as well as the temperature near the upper wall inside the primary air box under the 100% BMCR condition. These data were then compared with the numerical simulation results for the same condition with 100%B exhaust air transfer, and the data are presented in Table 5. As shown in the table, the errors between the simulated and DCS-measured values for the average velocity and temperature at the primary air box outlet, as well as the temperature near the upper wall, were 7%, 7%, and 4%, respectively. This indicates that the numerical model and computational methods exhibit a certain degree of reliability. In the simulation, the wall boundary condition was set based on a perfectly insulated wall under steady-state operation. In practice, however, the insulation layer cannot achieve complete insulation, and a small amount of heat dissipation occurs, resulting in the measured temperatures being lower than those predicted by the simulation.

3. Result and Discussion

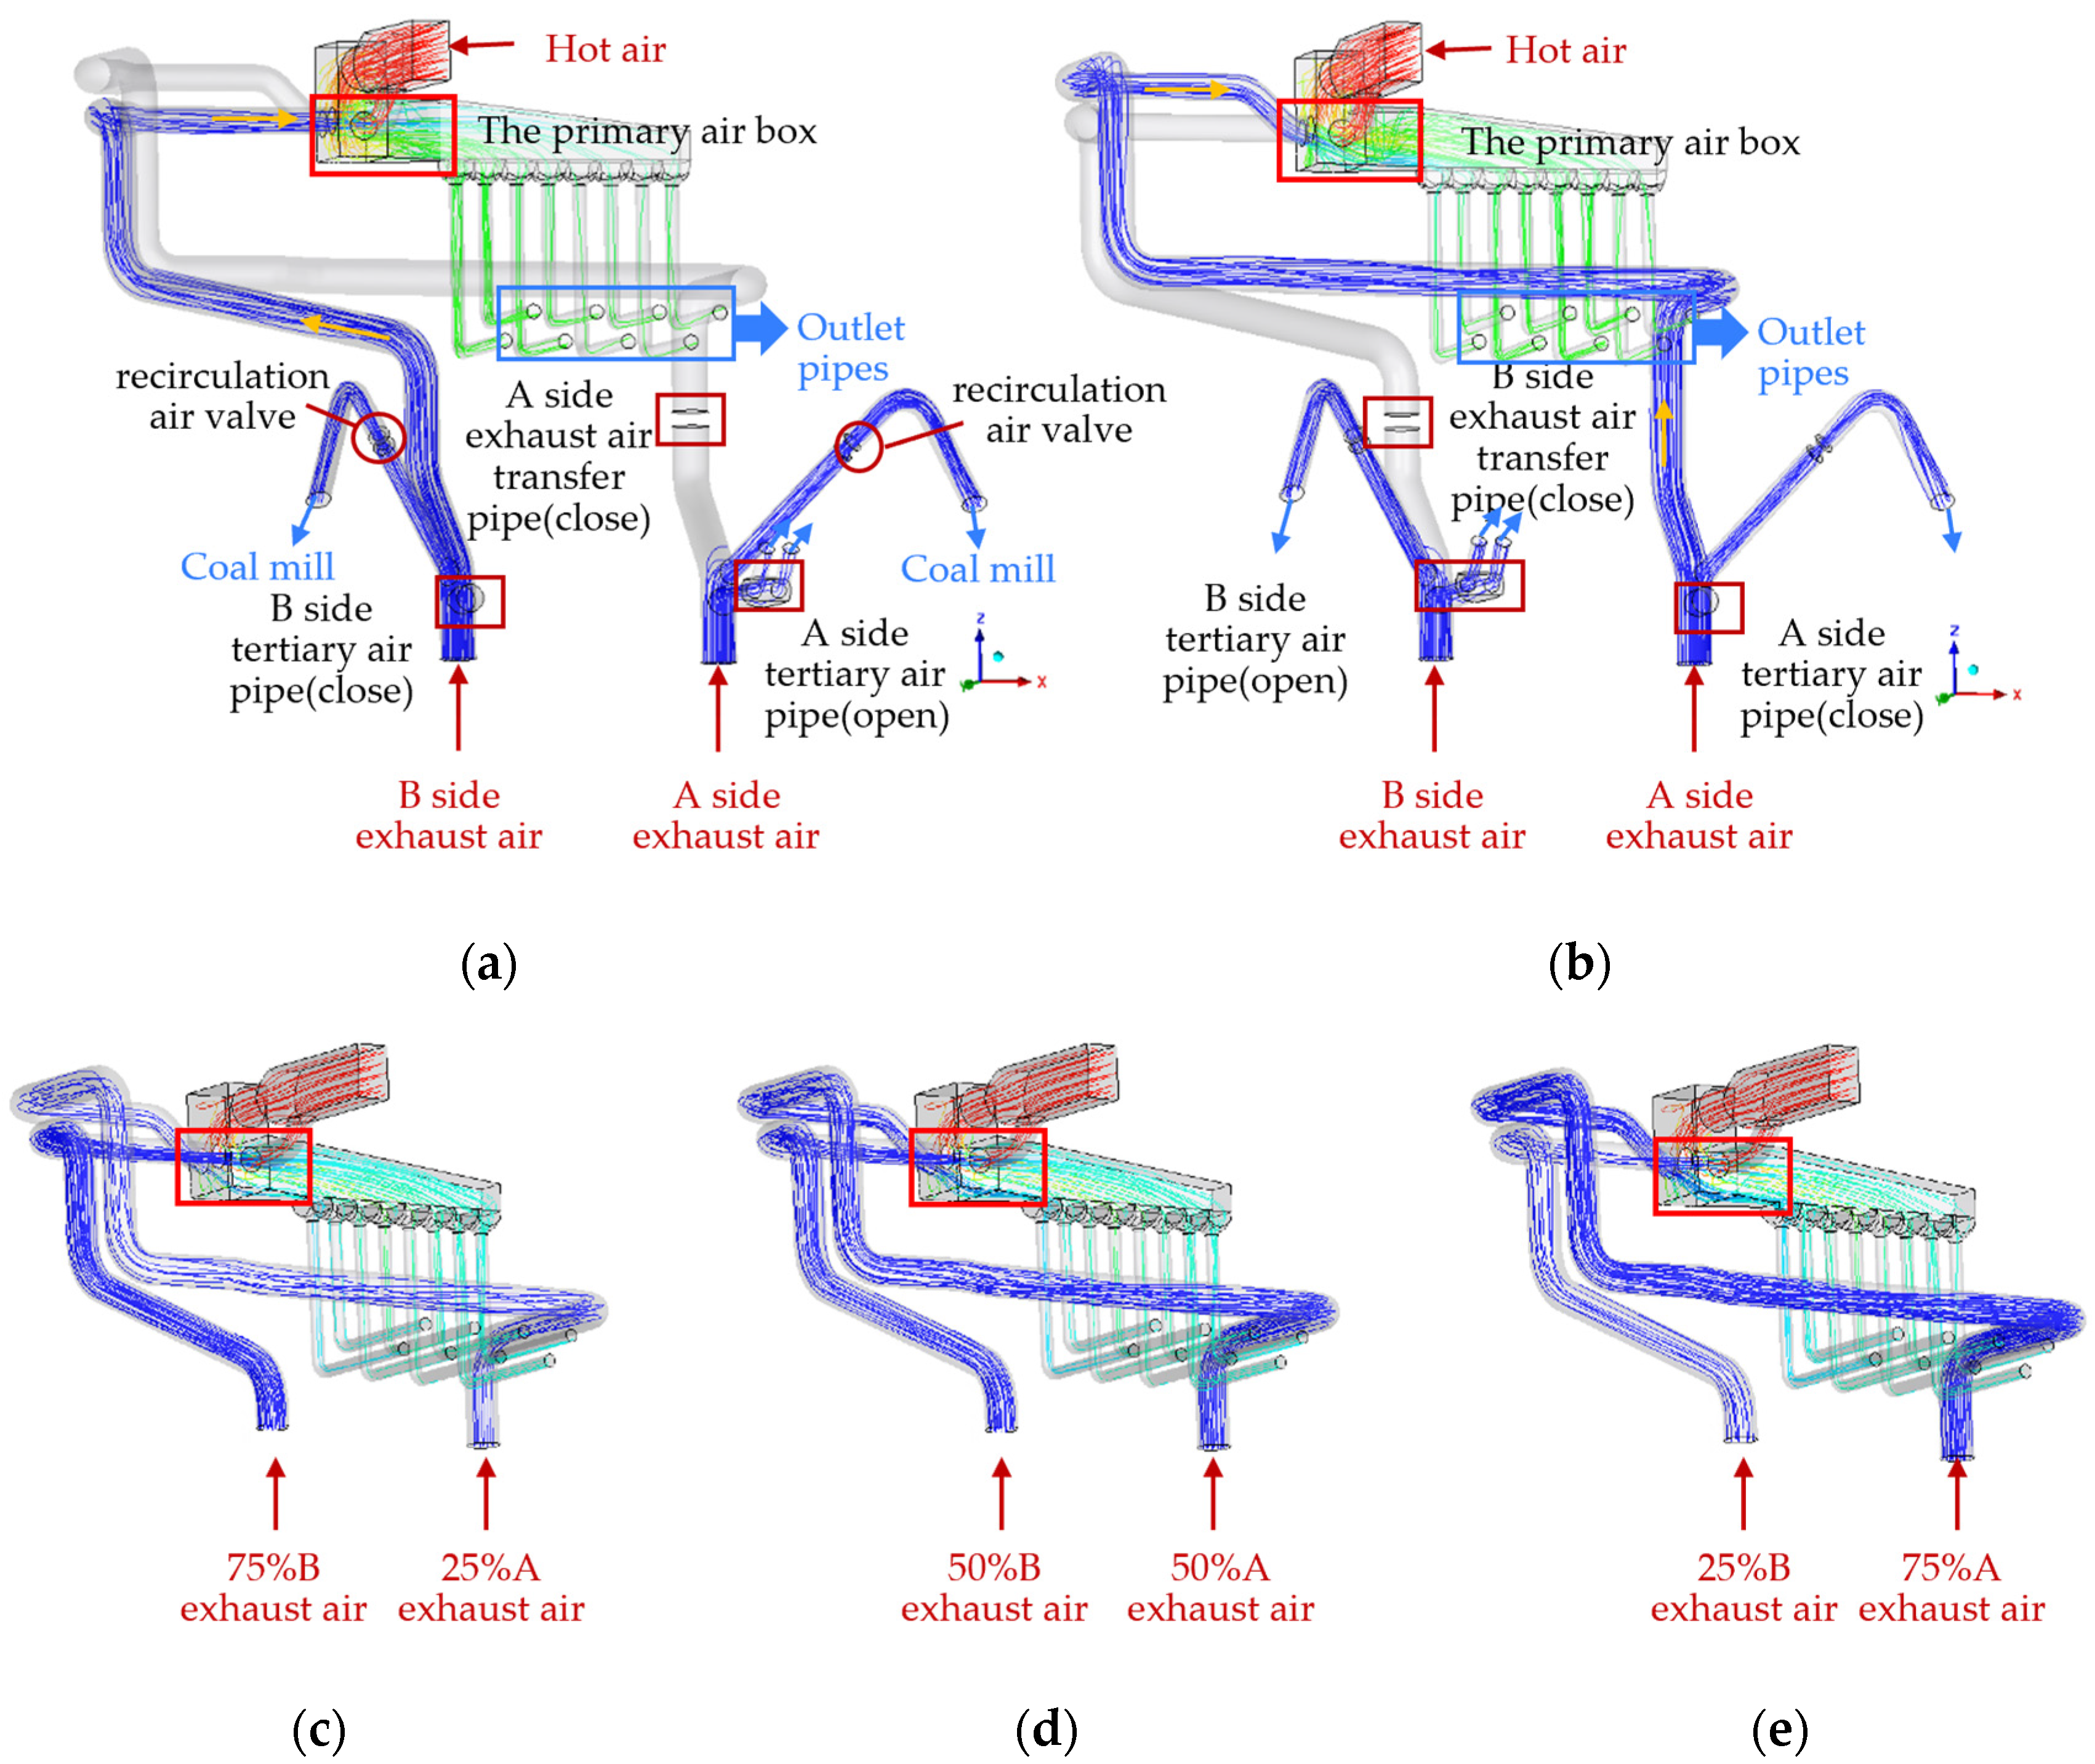
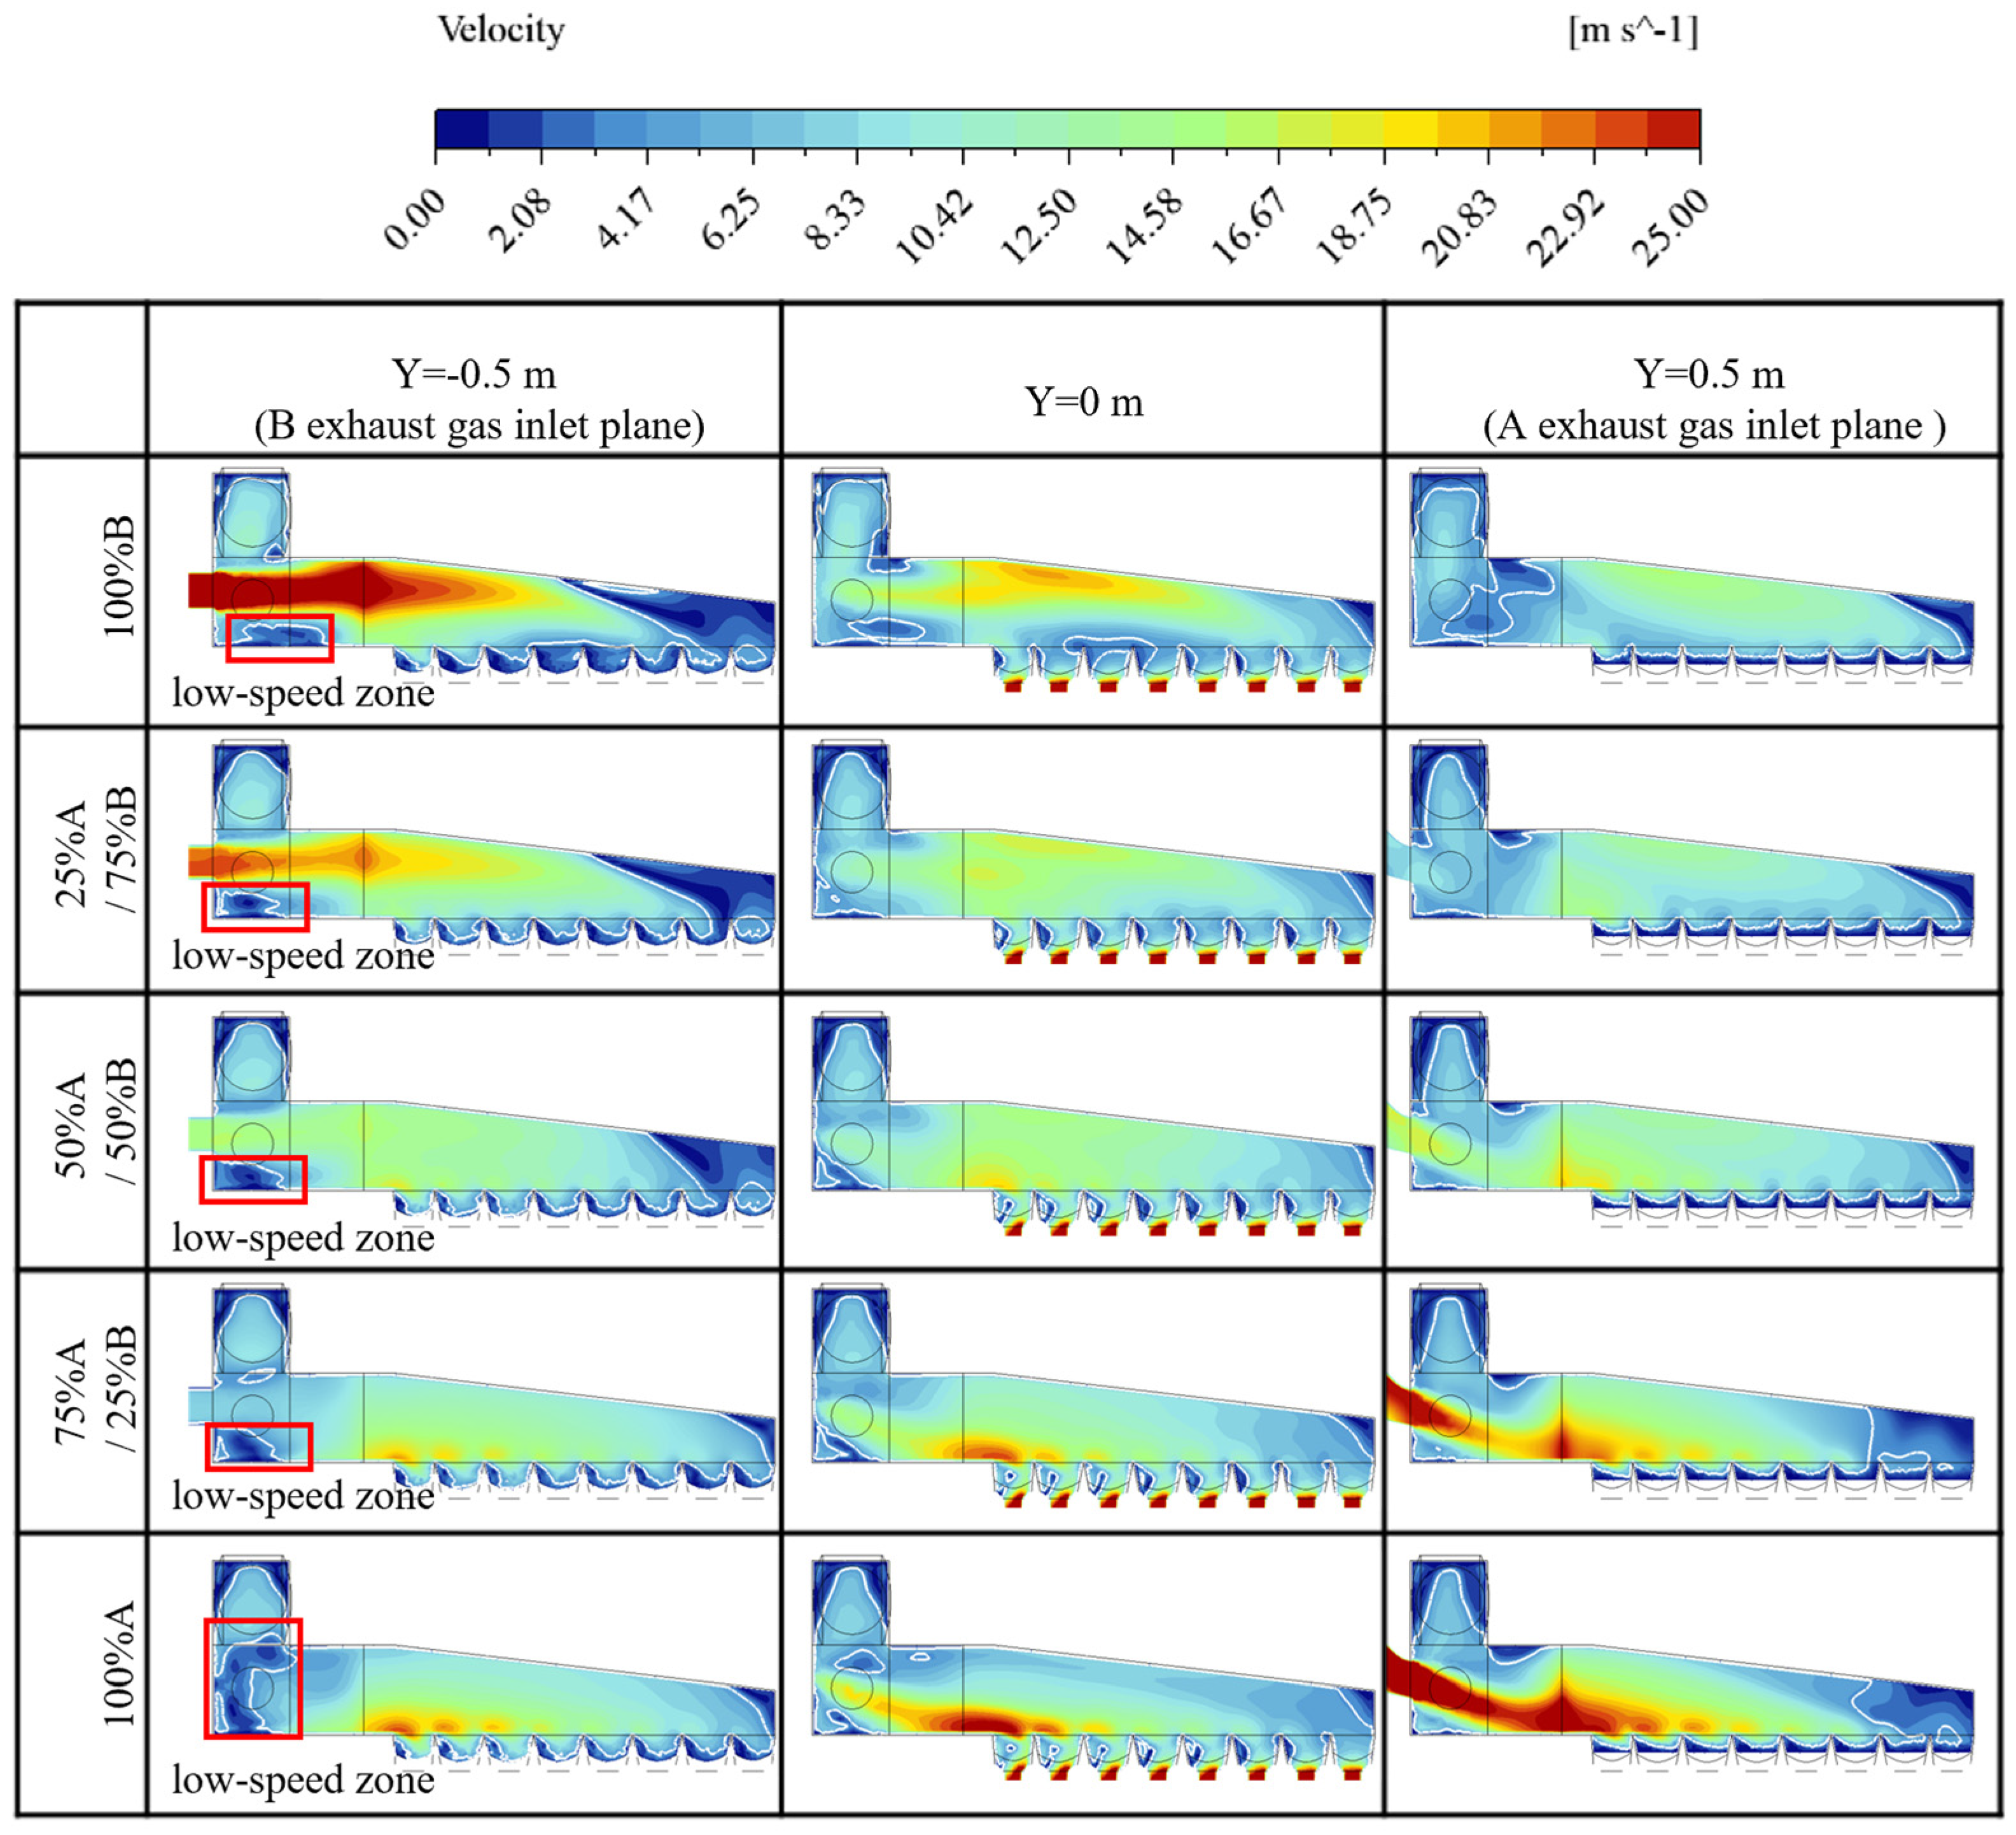
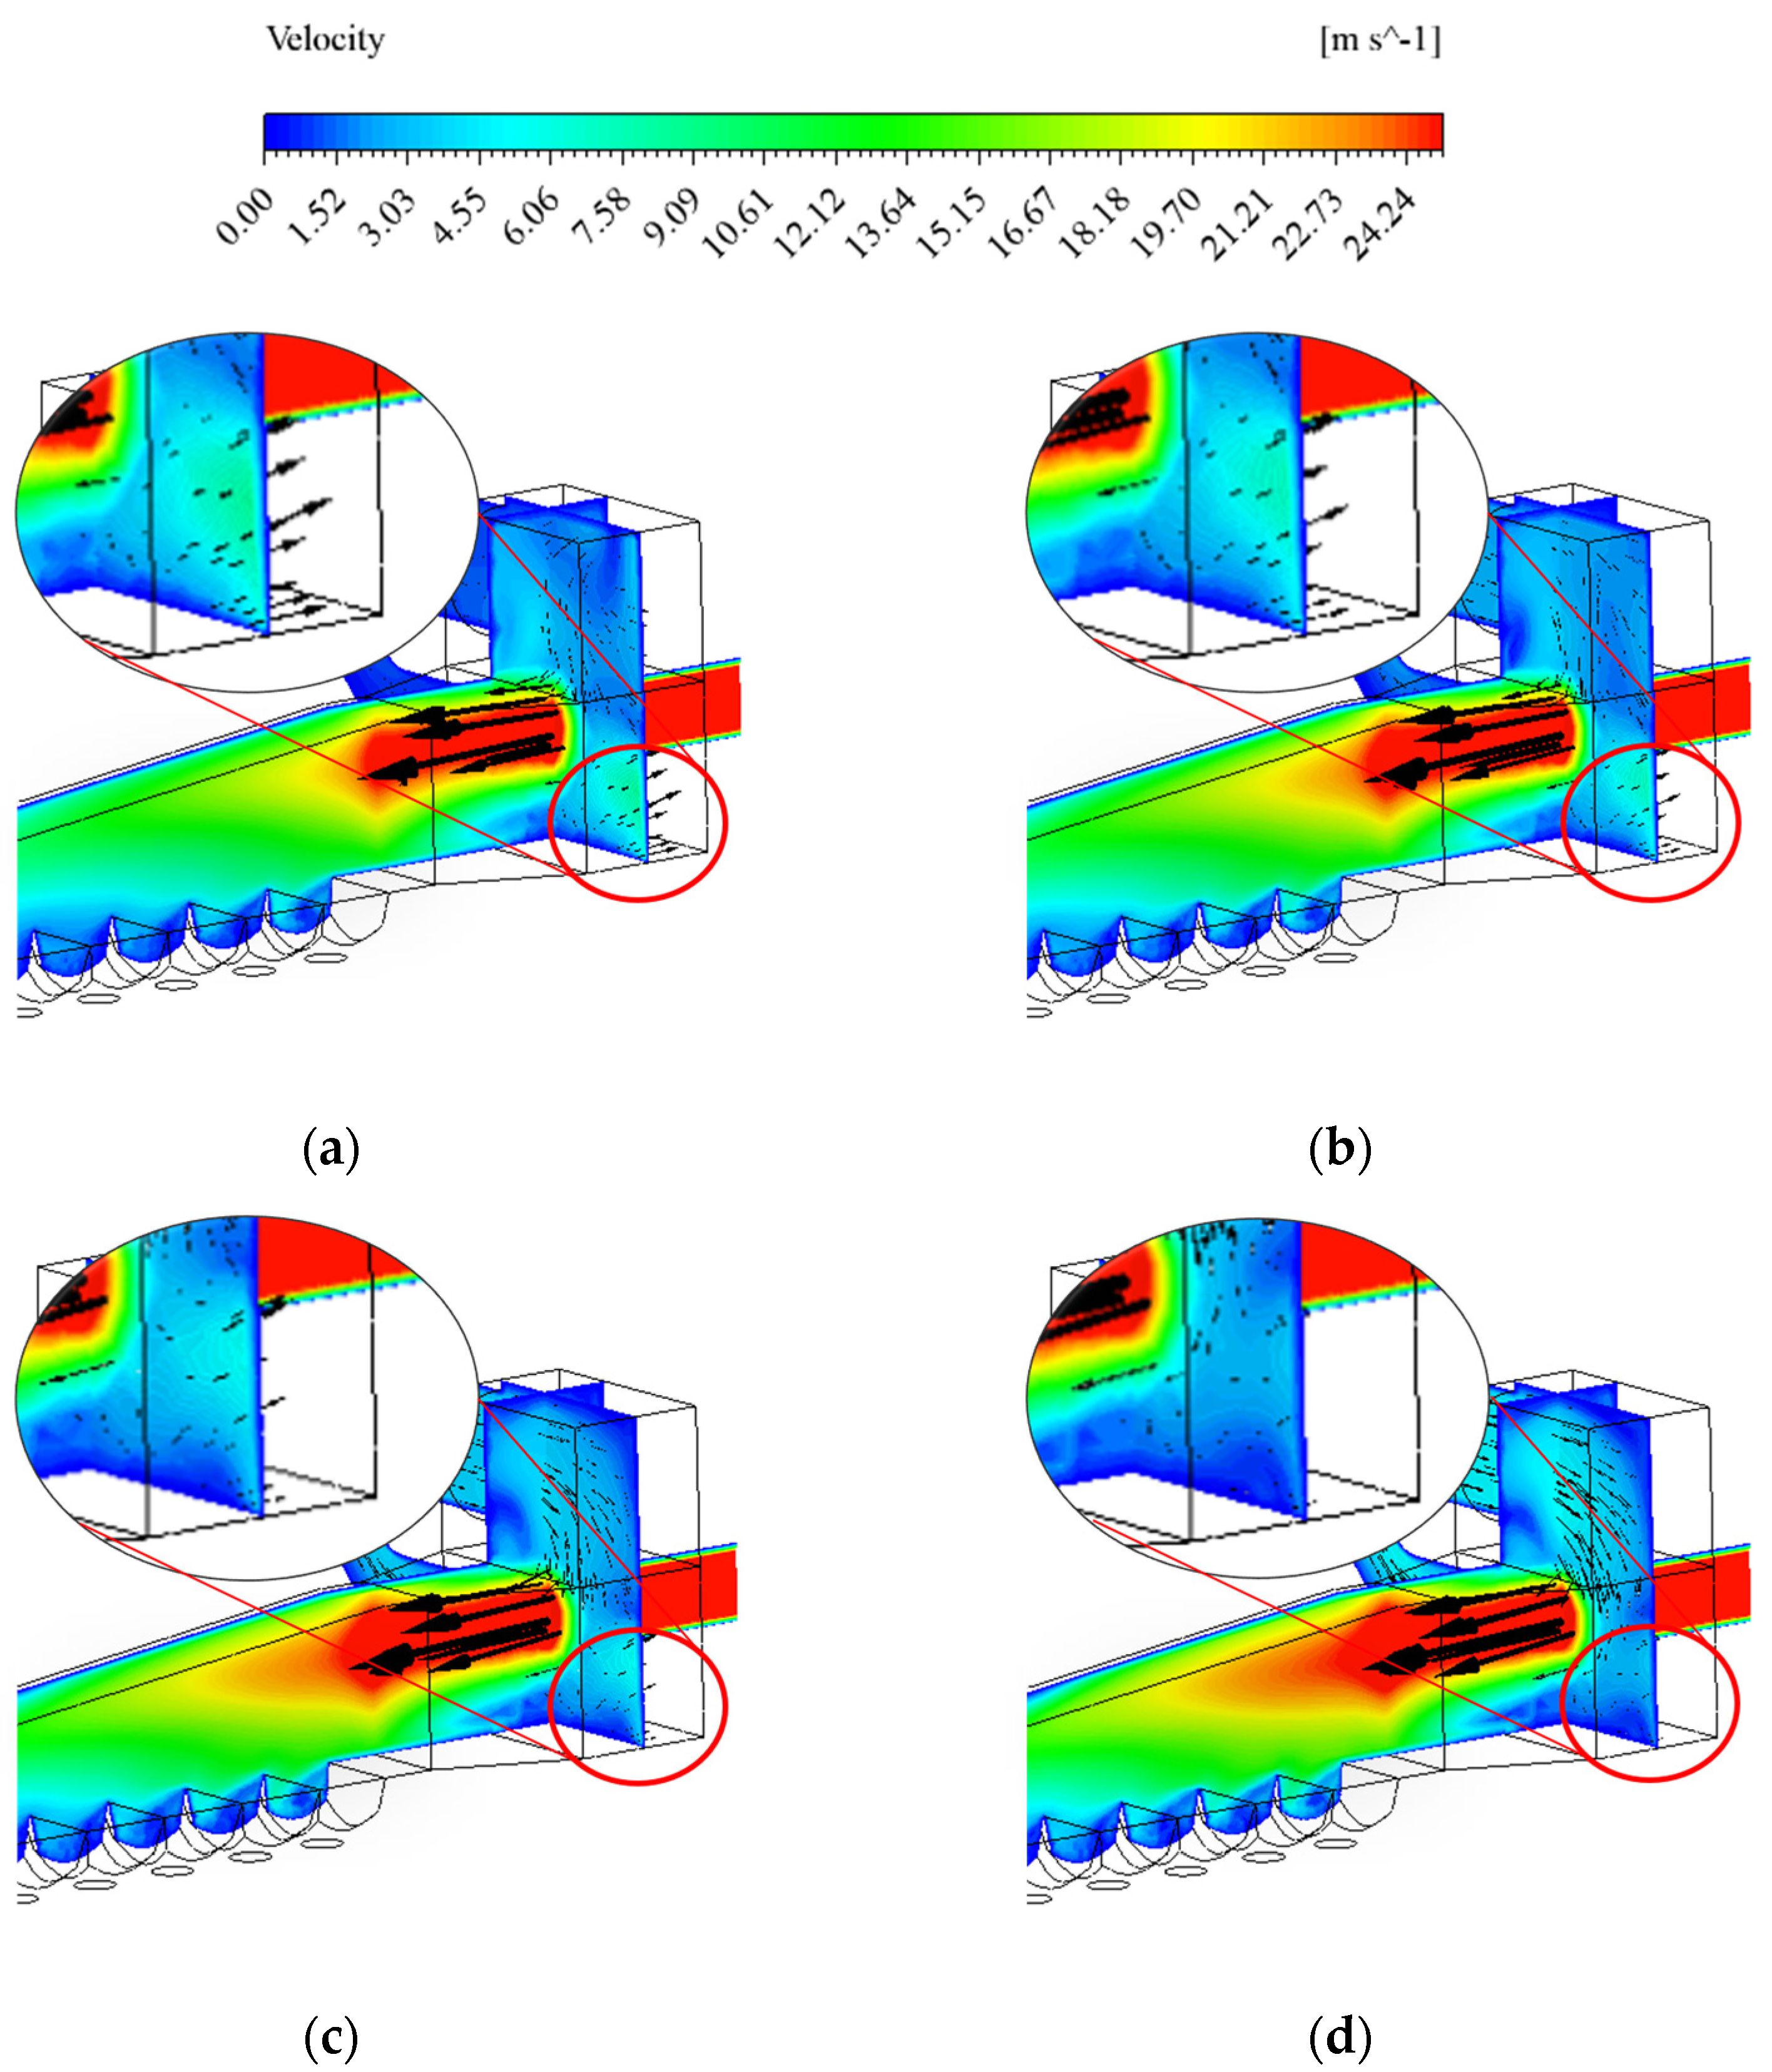
3.1. Flow Field in the Primary Air Box

The internal flow field of the primary airbox under different exhaust air transfer modes in the 100% BMCR condition was analyzed, and the results are shown in Figure 5. In this case, the hot air velocity is 7 m/s, and the hot air temperature is 610 K. As observed in the figure, different exhaust air transfer methods result in variations in the distribution of high-speed regions, but a low-speed zone is present at the bottom of the air box in all cases. As noted in the literature [40,41], regions where the local flow velocity is 10% to 20% of the mainstream velocity can be classified as low-speed zones. Considering that the mainstream velocity of the exhaust air in the airbox is approximately 30 m/s, regions with a velocity below 4 m/s are defined as low-velocity regions. When 100%B exhaust air is introduced, the high-speed area is primarily located at the B exhaust air inlet, then shifts toward the air box’s central axis (Y = 0 m), creating a localized high-speed region on the upper wall of the air box. When 25%A/75%B exhaust air is used, the high-speed area is still located at the B exhaust air inlet, but the overall flow field becomes more uniform compared to the 100%B exhaust air transfer condition, with the low-speed zone at the bottom shrinking. In the case of the 50%A/50%B exhaust air transfer condition, the flow field is the most evenly distributed within the air box. For the 75%A/25%B exhaust air transfer condition, the high-speed region mainly concentrates near the A exhaust air inlet. When 100%A exhaust air is used, the high-speed area is primarily located at the A exhaust air inlet, and due to the oblique downward direction of the A exhaust air, the high-speed airflow shifts toward the air box’s central axis and rapidly strikes the lower wall of the air box, resulting in a higher velocity in that region.
The volume of the low-velocity zone at the bottom of the airbox and its average temperature were statistically analyzed, with the results shown in Figure 6a. As illustrated in the figure, during the transition from 100%B to 100%A, the low-velocity zone volume first decreases and then increases. The largest volume occurs under the 100%B exhaust air transfer condition, measuring 2.01 m3, followed by 100%A with a volume of 1.85 m3. The smallest volume, 1.16 m3, is observed under the 75%A/25%B condition. This phenomenon can be attributed to the fact that the B-side exhaust air enters the airbox horizontally, with a higher velocity and stronger flow rigidity, resulting in minimal disturbance to the bottom region. As a result, low-velocity regions tend to form both in the A-side exhaust air intake zone and near the bottom of the airbox. When A-side exhaust air is gradually introduced, the simultaneous intake of both A and B exhaust streams results in a more uniform flow field. The angled entry of A-side exhaust air directs the flow toward the bottom of the airbox, causing the low-velocity regions to shift toward the bottom corners and reducing their extent. When 100% A-side exhaust air is used, a void region forms near the original B-side intake zone. However, due to the presence of the hot air bypass, the volume of the slower flow areas is smaller than that observed under 100% B-side exhaust air conditions.
By analyzing the average temperature in the low-velocity region based on Figure 6b–f, it is observed that the average temperature in this region is relatively high under the conditions of 100%B exhaust air intake and 100%A exhaust air intake, reaching 583.01 K and 513.84 K, respectively. In contrast, under the other three conditions, the average temperature in the low-velocity region is lower, measured at 489.92 K, 495.65 K, and 469.62 K, respectively. This phenomenon can be attributed to the following reasons: When 100% B exhaust air is introduced (Figure 6b), there is no cold airflow directly mixing with the hot air in the A exhaust air intake region, allowing the hot air to descend along the wall surface unimpeded until reaching the bottom of the airbox, which leads to an increase in temperature in the low-velocity region. Similarly, under the condition of 100% A exhaust air intake (Figure 6f), the absence of cold airflow in the B exhaust air intake region results in direct heat transfer to the low-velocity airflow in this region, thereby increasing the average temperature. In contrast, under the other conditions (Figure 6c–e), the exhaust air mixes more thoroughly with the hot air, and the interference of the two airflows effectively prevents direct heat transfer to this region to some extent.
By analyzing the position and extent of the low-velocity region at the bottom of the airbox based on Figure 6b–f, it can be observed that, as the proportion of A exhaust air intake increases, the low-velocity area near Y = 2.6 m gradually shrinks, while the one near Y = 0 expands, and the entire low-velocity zone shifts in the positive Z-axis direction. This phenomenon occurs because, after A exhaust air enters the primary airbox, it interacts with the descending and recirculating hot air along the wall, which forces this region to shift closer to the B exhaust air intake region.

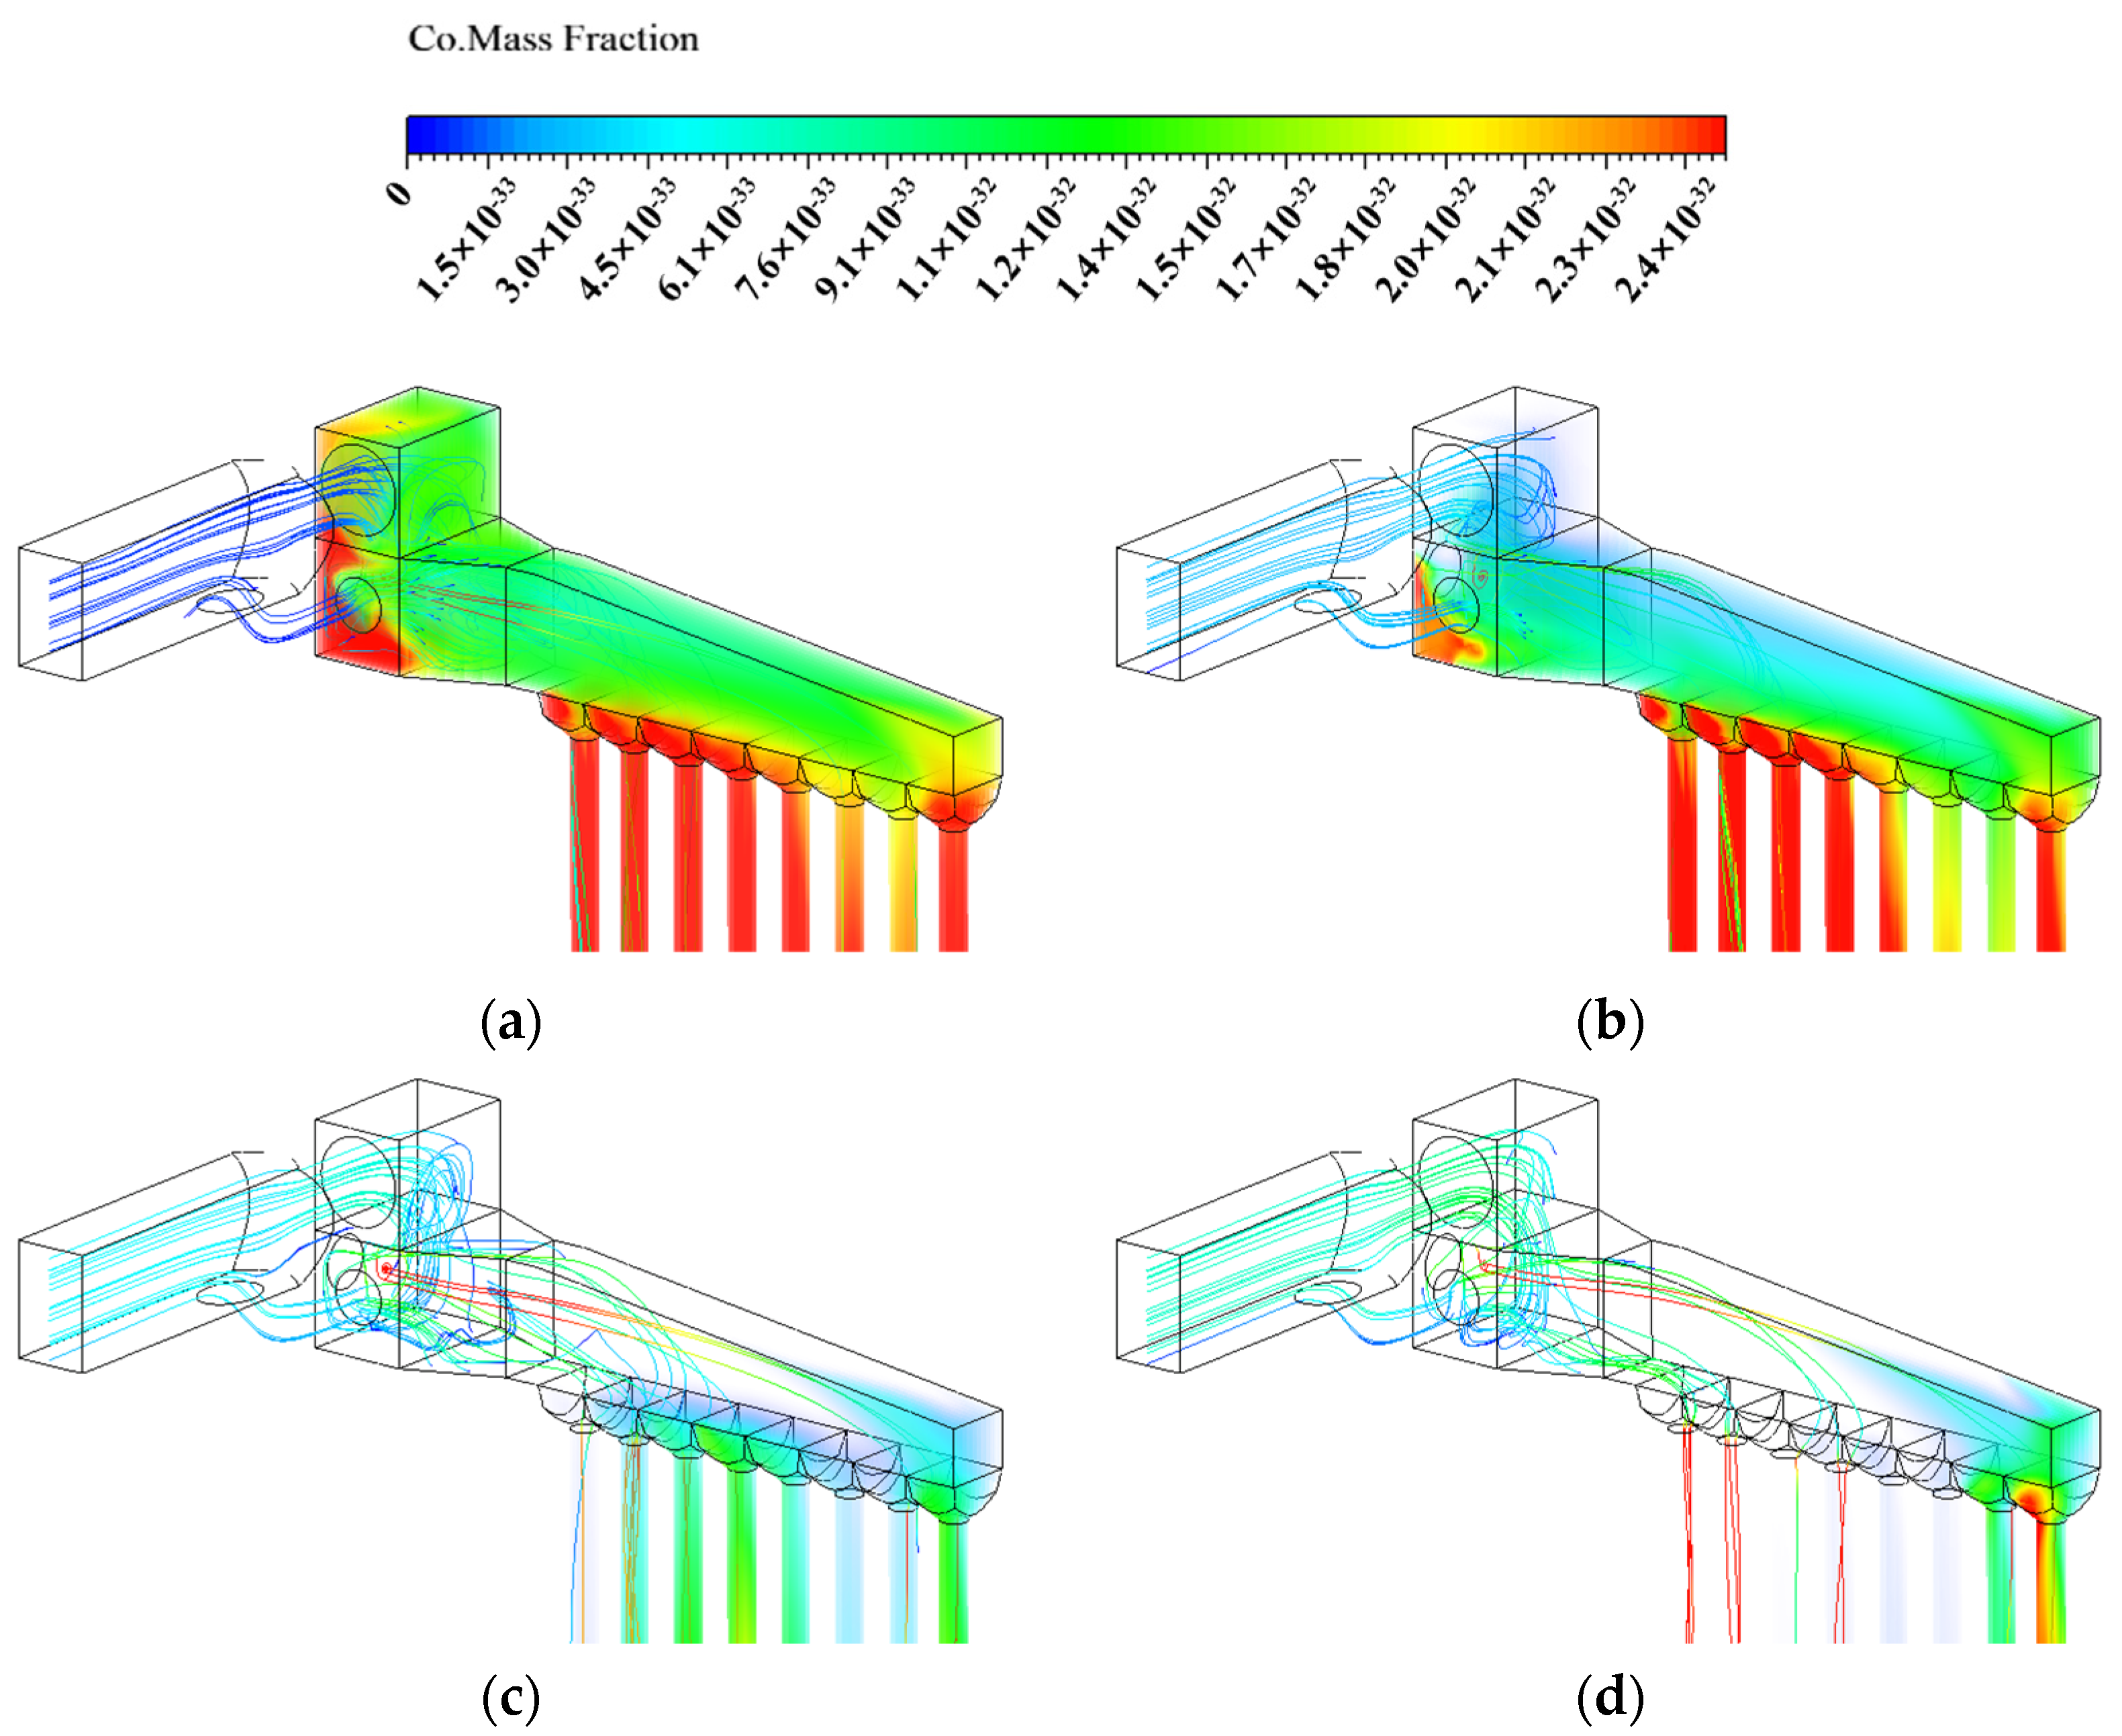
3.2. CO Distribution Inside the Primary Airbox

The distribution and average mass fraction variation of CO in the primary airbox under different exhaust air transfer methods in 100% BMCR operating conditions are shown in Figure 7. In the figure, the CO distribution is represented as a contour plot and highlighted with a red box, while the streamlines indicate the O2 mass fraction along the flow path, with colors transitioning from blue to red as the O2 mass fraction increases. As observed, with an increasing proportion of exhaust air intake through path A, the CO distribution in the airbox gradually shifts from the outlet at the end of the airbox to the outlets in the middle section. Additionally, the average mass fraction of CO continuously decreases, and the distributions of O2 and CO do not overlap. When 100% B exhaust air is introduced, the average CO mass fraction inside the airbox is 5.3 × 10⁻³⁴. Under the condition of 25%A/75%B exhaust air intake, the average CO mass fraction decreases to 2.95 × 10⁻³⁴, representing a 44% reduction compared to the 100% B exhaust air transfer condition. As the proportion of A exhaust air intake increases from 50% to 100%, the average CO mass fraction inside the primary airbox rapidly decreases until it approaches zero.
The changes in CO distribution are primarily caused by the differences in the flow directions and flow field influence of A and B exhaust air. When B exhaust air is used, the high-speed airflow is directed straight toward the airbox outlet, carrying volatiles and combustible gases to the rear of the airbox where they accumulate. In contrast, when A exhaust air is introduced, it enters at an angle toward the bottom wall of the airbox, allowing the CO it carries to be more easily discharged from the middle outlets. Therefore, as the proportion of A exhaust air increases, the region where CO accumulates gradually shifts toward the middle of the airbox.
The variation in CO mass fraction within the airbox is primarily influenced by changes in both the volume and temperature of low-velocity zones. Under the 100%B exhaust air condition, these zones are more extensive and exhibit higher average temperatures, promoting CO generation. When the proportion of A exhaust air is between 25% and 75%, both the extent and temperature of these regions decrease compared to the 100%B case, leading to lower CO production. Particularly under the 50%A/50%B scenario, the flow field becomes more uniform, and the oxygen distribution is broader (as indicated by orange or red streamlines), enabling partial oxidation of CO to CO2. This results in a lower CO mass fraction relative to the 25%A and 75%A cases. In the 100%A condition, as shown in Figure 6f, the low-velocity zone is concentrated near the center of the airbox, reducing the likelihood of pulverized coal settling at the bottom and further contributing to a decline in CO levels.
During 100% BMCR operation, among the five different exhaust air transfer modes, the 100% B exhaust air intake condition results in the largest low-velocity region at the bottom of the airbox, the highest average temperature in the low-velocity region, and the highest average CO mass fraction inside the airbox. Considering all relevant factors, the exhaust air transfer device exhibits higher safety when the A exhaust air intake proportion is 75% under 100% BMCR conditions. However, in actual operation, the switching of exhaust air transfer conditions, variations in hot air velocity, and changes in hot air temperature are all related to load variations and combustion adjustments. Therefore, further research is needed to analyze the internal flow characteristics and CO distribution inside the primary airbox under different hot air velocities and temperatures, with particular attention to the 100% B exhaust air intake condition.

3.3. Adjustment of Hot Air Parameters Under the 100% B Exhaust Air Transfer Condition

3.3.1. Adjustment of Hot Air Velocity

The effects of different hot air velocities on the internal flow characteristics and volatile matter (CO) accumulation in the primary airbox region are shown in Figure 8. As observed in Figure 8, with an increase in hot air velocity, the volume of the low-velocity region initially increases and then decreases, while the average temperature of the low-velocity region gradually rises. When the hot air velocity increases from 1 m/s to 5 m/s, the average CO mass fraction decreases significantly from 1.08 × 10⁻³² to 4.48 × 10⁻³⁴. However, when the velocity continues to increase beyond 5 m/s, the variation in CO mass fraction within the airbox region is relatively small, ranging from 4.48 × 10⁻³⁴ to 2.29 × 10−37.
The variation in the volume of the low-velocity region is attributed to the formation of a low-pressure zone around the high-speed B exhaust air jet. When the hot air velocity is relatively low, the downward airflow along the wall is more susceptible to the influence of B exhaust air, leading to recirculation, as illustrated in Figure 9. As shown in the figure, when the hot air velocity increases from 1 m/s to 3 m/s, the recirculation weakens, and the relative movement of airflow at the bottom of the airbox also decreases, resulting in an expansion of the low-velocity region. However, when the hot air velocity reaches 4 m/s, the influence of inertia on the downward airflow along the wall exceeds the entrainment effect of the low-pressure zone, causing the recirculation region to disappear. Beyond this point, further increases in hot air velocity lead to a reduction in the volume of the low-velocity region at the bottom of the airbox.
The variation in the average temperature of the low-velocity region is due to the fact that hot air serves as the primary heat source within the primary airbox. As the hot air flow rate increases, the amount of heat it carries also rises, leading to an increase in the average temperature of the low-velocity region.
The variation in the average CO mass fraction results from the combined effects of the flow field and temperature field inside the primary airbox. Hot air serves as the primary source of heat and oxygen within the airbox, influencing the temperature and velocity distribution. Temperature and velocity, in turn, play a crucial role in the generation and accumulation of volatiles: higher temperatures promote increased volatile release, while higher velocities facilitate the removal of volatiles from the airbox, preventing their accumulation. When the hot air velocity increases from 1 m/s to 4 m/s, although the volume of the low-velocity region expands, the weakening of the recirculation zone prevents coal powder from remaining inside the airbox for an extended period. When the hot air velocity exceeds 4 m/s, the released volatiles are rapidly carried out of the airbox, maintaining the average CO mass fraction at a relatively low level.
Based on the CO distribution characteristics, hot air velocities of 1 m/s, 3 m/s, 5 m/s, and 7 m/s were selected as representative conditions for analysis. The CO distribution under these conditions is shown in Figure 10. As observed in the figure, CO mass fractions are relatively high when the hot air velocity is 1 m/s and 3 m/s, whereas they decrease significantly at 5 m/s and 7 m/s. Specifically, at a velocity of 1 m/s, CO spreads to the hot air inlet at the beginning of the primary airbox flow path. At 3 m/s, a certain amount of CO is present at all outlets and at the bottom of the primary airbox. At 5 m/s, CO is primarily concentrated around the eight outlet pipes, while at 7 m/s, it is mainly distributed at the two outlets located at the end of the primary airbox flow path. The primary reason for this distribution pattern is that, at lower hot air velocities, the ability of airflow to transport CO is weaker, leading to a broader distribution range of CO. As the hot air velocity increases, the airflow more effectively carries the released CO. By the time the airflow reaches the final section, most of it has exited through other outlets, resulting in a higher CO mass fraction at the remaining outlets.

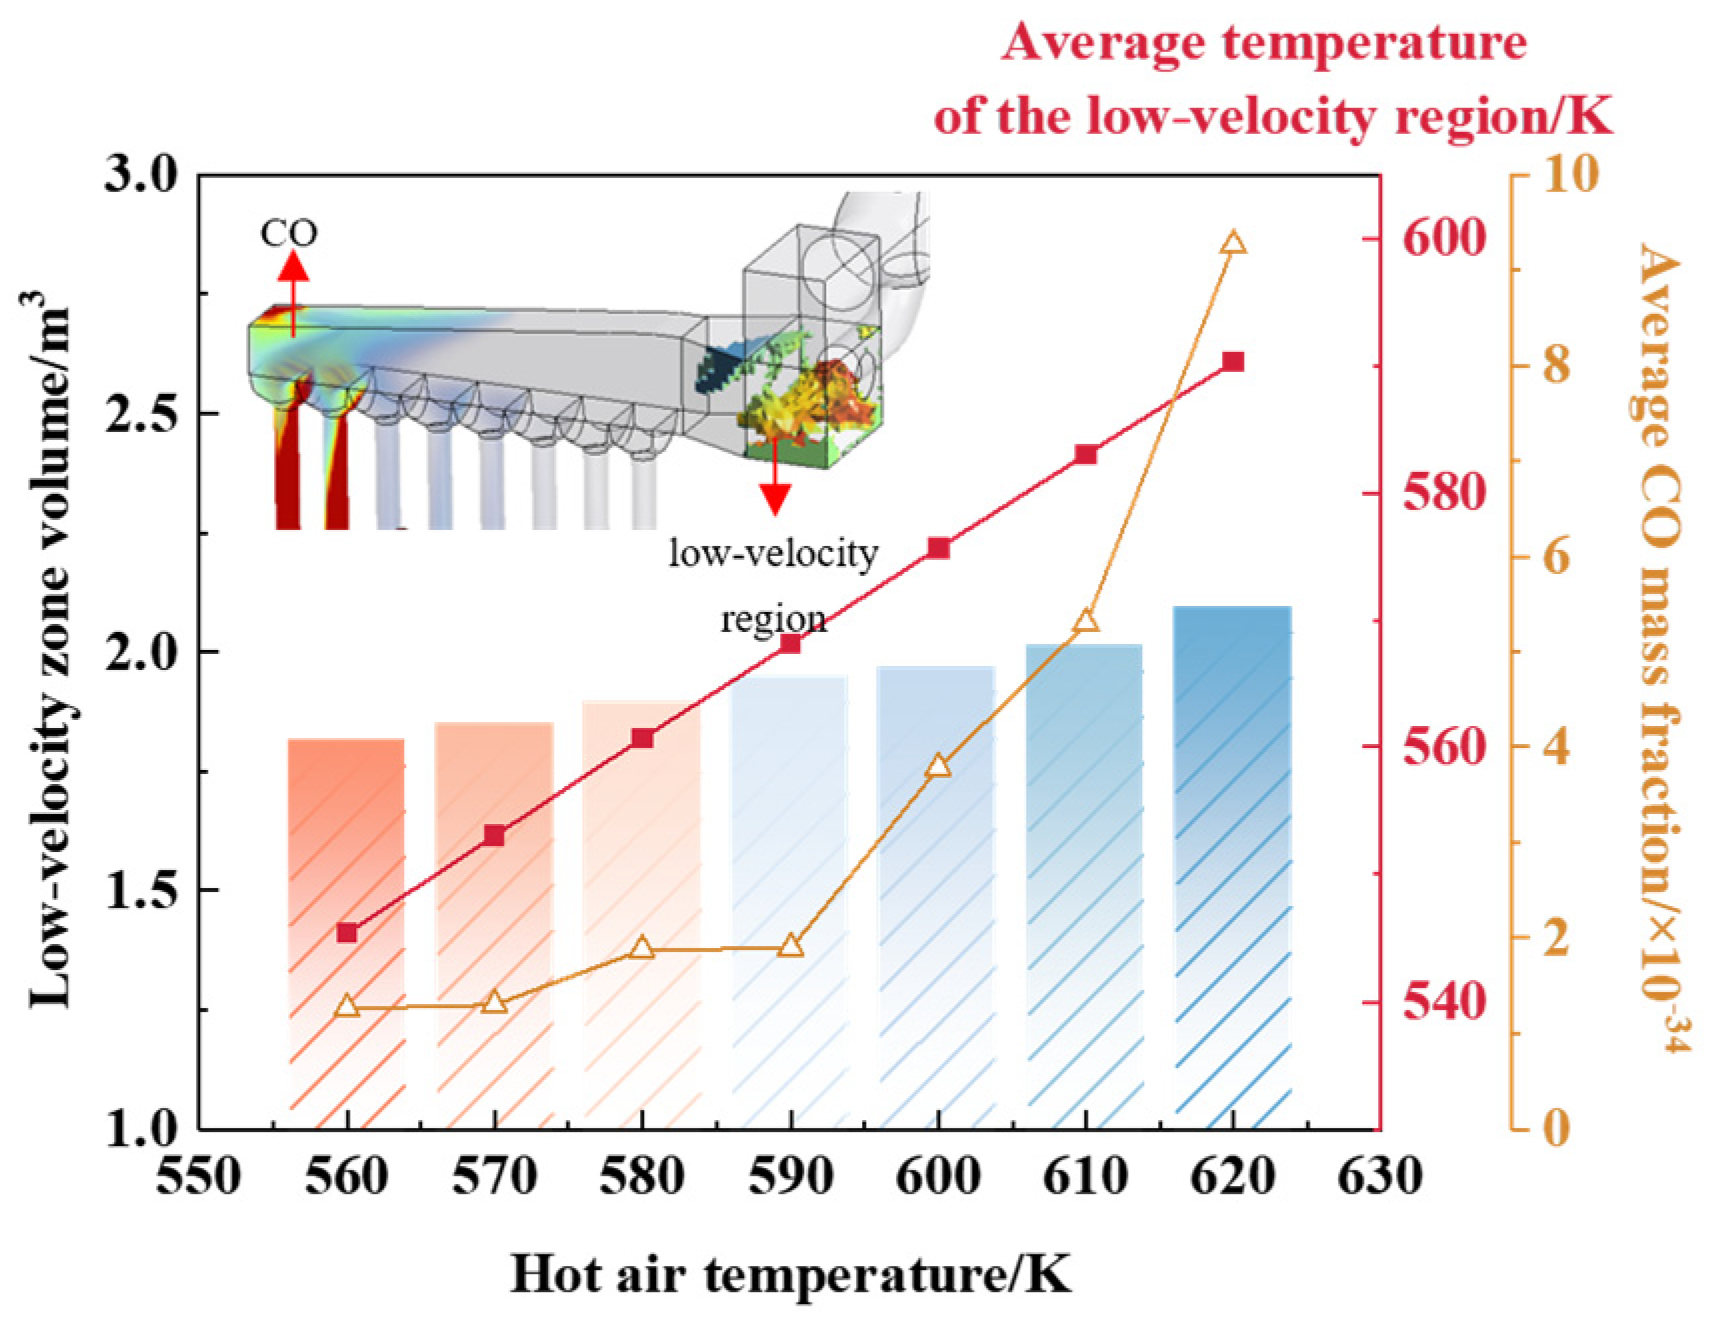
3.3.2. Adjustment of Hot Air Temperature

The effects of different hot air temperatures on the internal flow characteristics and volatile matter (CO) accumulation in the primary airbox region are shown in Figure 11. A comparison between Figure 8 and Figure 11 indicates that the influence of hot air temperature on the volume of the low-velocity region, the average temperature of the low-velocity region, and the average CO mass fraction inside the airbox are relatively smaller than those of hot air velocity. The volume of the low-velocity region, its average temperature, and the average CO mass fraction all increase with rising hot air temperature. Specifically, when the hot air temperature increases from 560 K to 590 K, the average CO mass fraction varies within a relatively small range of 1.26 × 10⁻³⁴ to 1.90 × 10⁻³⁴. However, when the temperature continues to rise beyond 590 K, the average CO mass fraction increases significantly from 1.90 × 10⁻³⁴ to 9.26 × 10⁻³², showing a much larger growth compared to the lower temperature range. This is because, at the same hot air velocity, the increase in temperature causes thermal expansion of the gas, leading to slight differences in the low-velocity region volume. Additionally, higher temperatures enhance the release of volatiles from coal particles, resulting in an increase in the average CO mass fraction.
Figure 10. CO distribution inside the primary air box under different hot air velocities. (a) 1 m/s; (b) 3 m/s; (c) 5 m/s; (d) 7 m/s.
Energies 18 02408 g010
The above results indicate that, for the 100% B exhaust air transfer condition, maintaining a hot air velocity above 4 m/s and a hot air temperature below 590 K plays a crucial role in mitigating volatile matter accumulation and reducing the risk of deflagration inside the airbox. Among these factors, adjusting the hot air velocity has a more significant impact on the operation of the primary airbox. To comprehensively investigate the safe operating parameters of the exhaust air transfer device, further studies on the remaining four exhaust gas transfer conditions are necessary to identify common characteristics and provide guidance for practical safe operation.

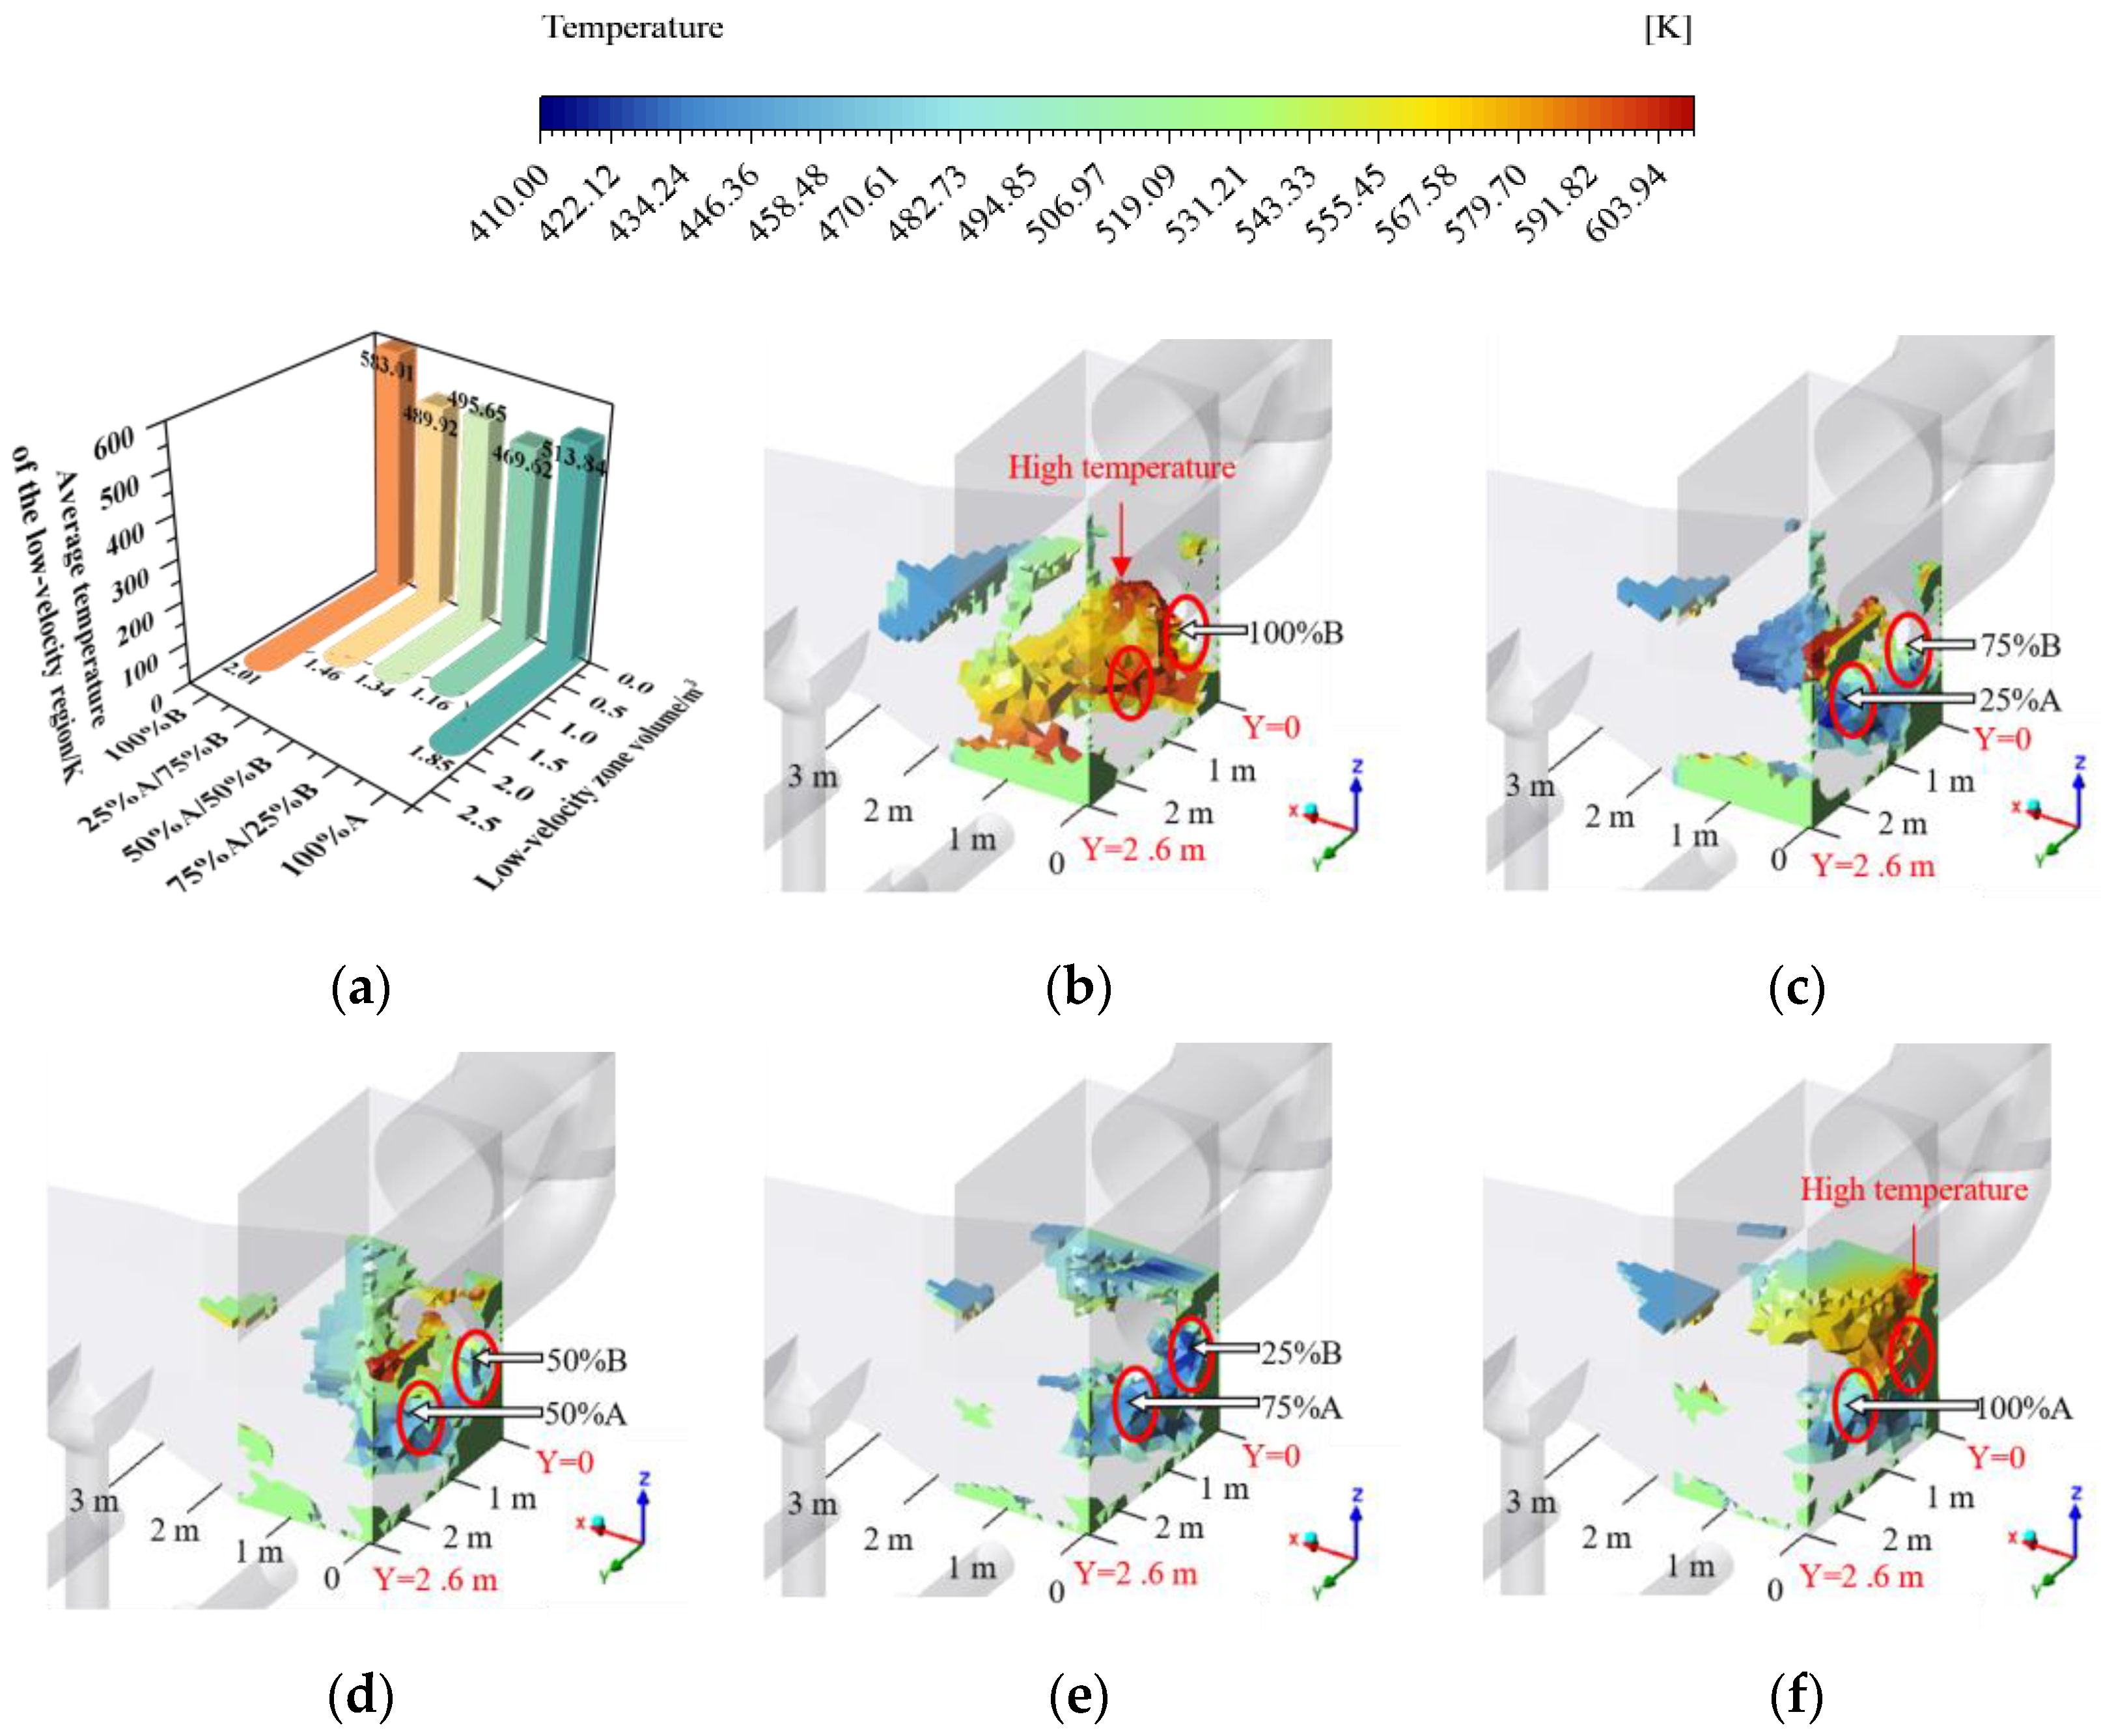
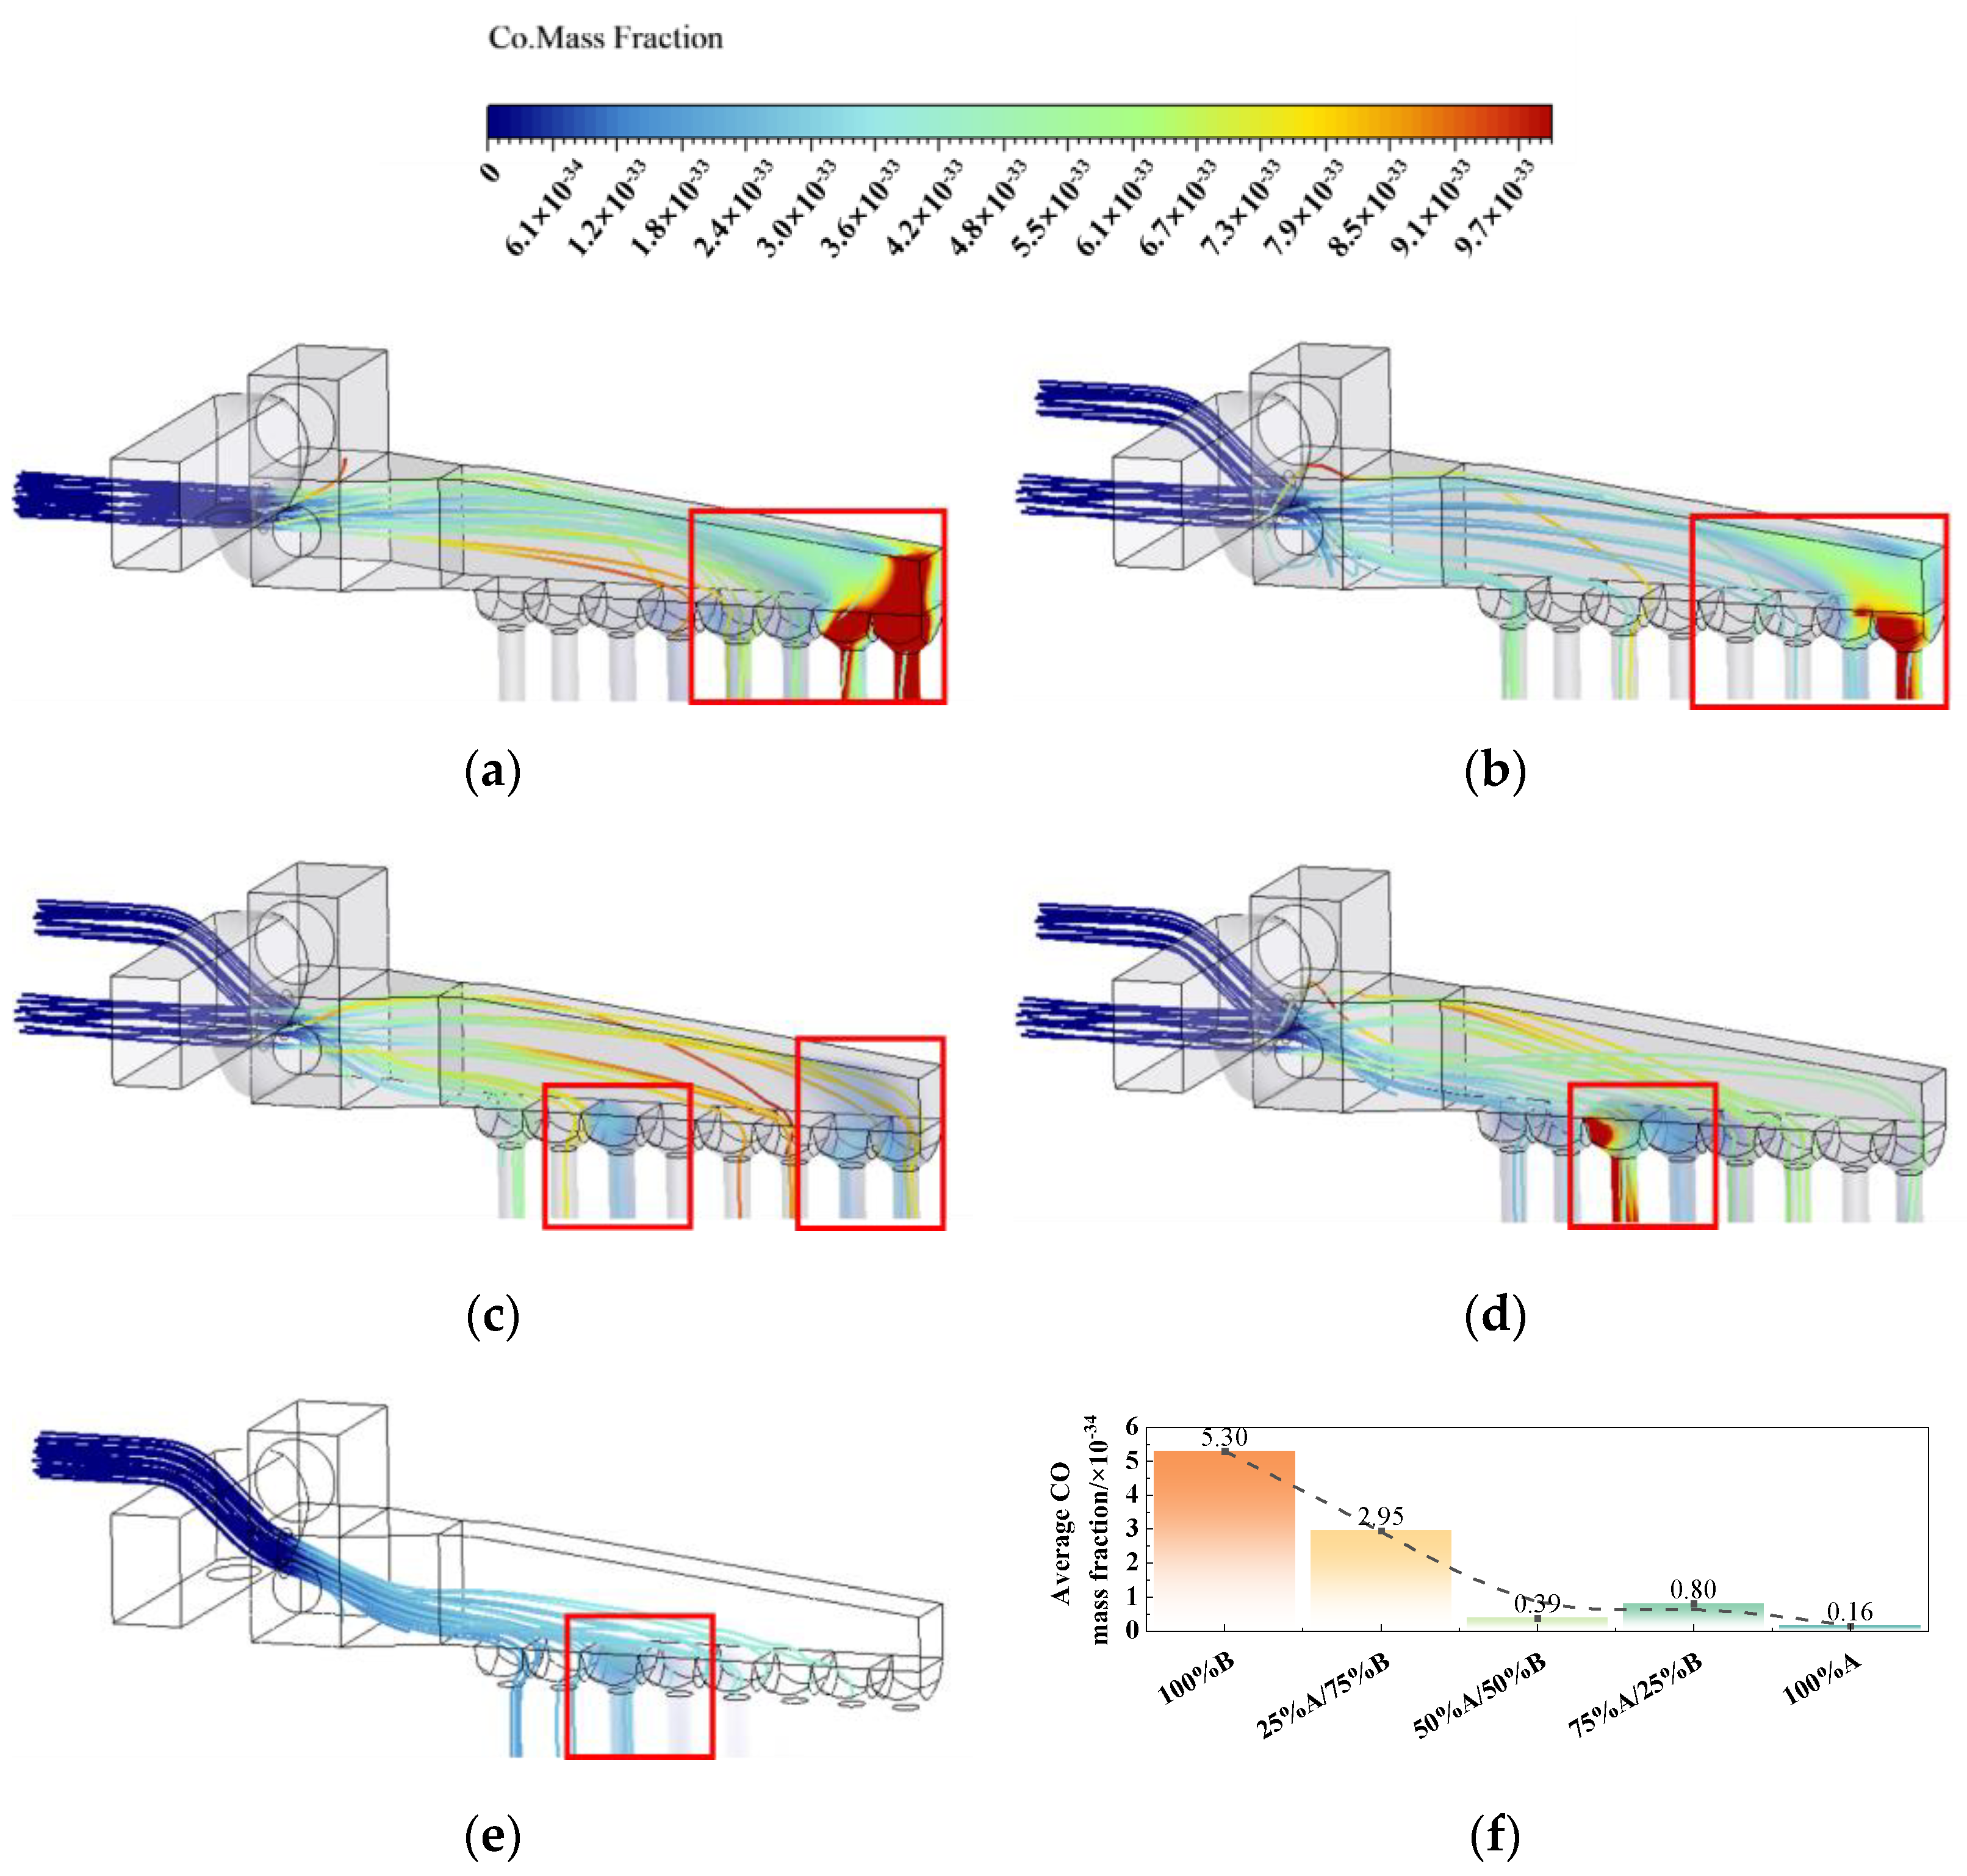
3.4. Adjustment of Hot Air Parameters in Other Exhaust Air Transfer Conditions

A comprehensive analysis was conducted on the flow characteristics and CO concentration under different exhaust air transfer conditions as the hot air velocity varied. The curve depicting the variation of low-velocity zone volume with hot air velocity under different exhaust air transfer conditions is shown in Figure 12a. As observed, in the 100% B and 100% A exhaust air intake conditions, the low-velocity zone volume initially increases and then decreases. In contrast, under the other three conditions, the low-velocity zone volume decreases as the hot air velocity increases. This phenomenon occurs because, in the 100% B and 100% A exhaust air transfer conditions, an empty zone exists on the opposite side, where high-velocity exhaust air influx creates a negative pressure recirculation zone. This results in relative gas movement, causing swirling inside the air chamber, making it difficult for the gas to exit. In the 100% A condition, the presence of a hot air bypass in the B exhaust air intake region weakens the recirculation effect, leading to less pronounced fluctuations compared to the 100% B exhaust air intake. Under the other three conditions, exhaust air enters from both the A and B sides, making it difficult for a recirculation zone to form inside the air chamber, and the low-velocity zone volume follows the same trend as the hot air velocity.
The variation curve of CO mass fraction with hot air velocity under different exhaust air transfer conditions is shown in Figure 12b. As observed, for all five exhaust air transfer conditions, the CO mass fraction remains relatively high when the hot air velocity ranges from 1 to 5 m/s and decreases significantly with increasing velocity. Therefore, this range is defined as the velocity-sensitive zone. When the hot air velocity is between 5 and 10 m/s, the five conditions exhibit similar average CO mass fractions with minimal variation, defining this range as the velocity-insensitive zone, where all conditions can operate safely.
Among the velocity-sensitive conditions, the 100% A exhaust air transfer condition exhibits the largest variation. When the hot air velocity increases from 1 m/s to 5 m/s, the CO mass fraction decreases by 98.7%. The reductions for the other conditions are 95.9% (100%B), 78.7% (25%A/75%B), 79.8% (50%A/50%B), and 77.1% (75%A/25%B). The average CO mass fractions in the 1~5 m/s range, indicated by the bold dashed line in Figure 12b, are 6.08 × 10⁻³³ (100%A), 5.58 × 10⁻³³ (100%B), 4.77 × 10⁻³³ (50%A/50%B), 2.13 × 10⁻³³ (25%A/75%B), and 1.07 × 10⁻³³ (75%A/25%B), in descending order. Thus, within the 1~5 m/s range, the 75%A/25%B exhaust air transfer condition exhibits the most stable response to hot air velocity, with the lowest average CO mass fraction, ensuring the highest level of safety. This stability is attributed to the effective mixing of a larger proportion of A exhaust air with hot air, while the 25% B exhaust air ensures sufficient airflow in the B exhaust air intake region, allowing uniform mixing with the limited amount of hot air from the bypass.
The variation curve of low-velocity zone volume with hot air temperature under different exhaust air transfer conditions is shown in Figure 13a. As observed, the volume of the low-velocity zone inside the air chamber increases with rising hot air temperature for all conditions. Among them, the 100% B exhaust air transfer condition exhibits the largest increase, with a variation of 0.278 m3, followed by 50%A/50%B (0.118 m3), 25%A/75%B (0.09 m3), 100%A (0.087 m3), and 75%A/25%B (0.076 m3). The significant increase in the 100% B exhaust air intake condition is primarily due to the absence of cold airflow from the A exhaust air intake region to mix with the hot air. As a result, the hot air directly enters the bottom of the air chamber, causing a more pronounced temperature rise in the low-velocity zone. This leads to greater thermal expansion of the gas, thereby increasing the volume of the region with lower flow velocity.
The variation curve of CO mass fraction with hot air temperature under different exhaust air transfer conditions is shown in Figure 13b. As observed, for all five exhaust air transfer conditions, the CO mass fraction remains relatively high within the 580~620 K range and increases significantly with rising temperature. Therefore, this range is defined as the temperature-sensitive zone. When the hot air temperature is 560~580 K, the average CO mass fraction exhibits minimal variation across all conditions, defining this range as the temperature-insensitive zone.
In the temperature-sensitive zone, the 100% B exhaust air transfer condition shows the largest variation. When the hot air temperature increases from 580 K to 620 K, the CO mass fraction rises by 7.38 × 10⁻³⁴. In contrast, the CO mass fraction decreases under other conditions: 2.52 × 10⁻³⁴ (25%A/75%B), 1.02 × 10⁻³⁴ (50%A/50%B), 1.18 × 10⁻³⁴ (75%A/25%B), and 1.07 × 10⁻³⁴ (100%A). The average CO mass fractions in the 580~620 K range, indicated by the bold dashed line in Figure 13b, are 4.43 × 10⁻³⁴ (100%B), 2.45 × 10⁻³⁴ (25%A/75%B), 6.54 × 10⁻³⁵ (75%A/25%B), 4.22 × 10⁻³⁵ (50%A/50%B), and 2.96 × 10⁻³⁵ (100%A), in descending order. Thus, within the 580~620 K range, the 50%A/50%B, 75%A/25%B, and 100% A exhaust air transfer conditions exhibit lower average CO mass fractions and smaller fluctuations with temperature changes, ensuring higher operational safety. This stability is attributed to the higher proportion of A exhaust air entering the primary air chamber, facilitating better mixing with hot air and mitigating the impact of temperature increases.
Based on the analysis of the low-velocity region volume and CO mass fraction under five exhaust air transfer conditions at different hot air velocities and temperatures, maintaining the hot air velocity above 5 m/s and the hot air temperature below 580 K is beneficial for system safety. If these conditions cannot be met due to load adjustments, priority should be given to maintaining the exhaust air ratio at approximately 75%A/25%B.

4. Conclusions

This study employs numerical simulations to investigate the exhaust air transfer device of the 330 MW pulverizing system, analyzing the flow characteristics and CO mass fraction inside the primary airbox under five different exhaust air transfer conditions.
The analysis of the internal flow distribution revealed the presence of a low-velocity region near the bottom of the airbox. Among the various conditions, the 75%A/25%B exhaust air ratio exhibited the highest safety margin, while the 100%B condition posed a greater risk of deflagration. Therefore, operation under the 75%A/25%B condition is recommended.
Based on the 100%B condition, it was further observed that increasing the hot air velocity reduced the average CO mass fraction inside the airbox, whereas the hot air temperature had a relatively minor effect.
It is suggested that maintaining the hot air velocity above 5 m/s and the hot air temperature below 580 K can effectively stabilize the CO mass fraction at a low level, thus enhancing the safe operation of the pulverizing system.
Simulations were performed using the coal type currently used by the power unit, with relevant sampling and analysis. However, as coal types may vary, future research should include a wider range of coal types and mixing ratios to enhance the unit’s adaptability and ensure safe operation under multi-coal conditions. In addition, experimental studies are crucial for investigating coal dust deflagration mechanisms and determining critical deflagration conditions. For accurate safety limits, further research and validation with experimental data will be needed.

Author Contributions

Conceptualization, Y.Z. and L.Z.; methodology, Y.Z.; software (ANSYS Fluent 2024R2), Y.Z.; validation, Y.Z., G.S. and W.G.; formal analysis, G.S. and W.G.; investigation, G.S. and W.G.; resources, G.S. and L.Z.; data curation, L.Z.; writing—original draft preparation, Y.Z.; writing—review and editing, Y.Z.; visualization, Y.Z.; supervision, L.Z.; project administration, L.Z.; funding acquisition, L.Z. All authors have read and agreed to the published version of the manuscript.

Funding

This research was funded by Research and Development of Intelligence Platform with “Run-Monitor-Management-Governance” Function on Pulverizing System with Intermediate Bunker in Ma’anshan Power Plant of Anhui Company, grant number SWMAS-FW4-[2024]14.

Data Availability Statement

The data that support the findings of this study are available from the corresponding author upon reasonable request.

Acknowledgments

The authors would like to acknowledge Guoneng Shenwan Ma’anshan Power Generation Co., Ltd. for providing the experimental unit and operating data. The authors also thank the Big Data Computing Center of Southeast University for providing the facility support for the numerical calculation in this paper.

Conflicts of Interest

Authors Guowei Sun, Weiwei Guo are employed by the company Guoneng Shenwan Ma’anshan Power Generation Co., Ltd. The remaining authors declare that the research was conducted in the absence of any commercial or financial relationships that could be construed as a potential conflict of interest. The authors declare that this study received funding from Guoneng Shenwan Ma’anshan Power Generation Co., Ltd. The funder had the following involvement with the study: provision of data and textual materials, formal analysis, investigation, and validation.

Nomenclature

NomenclatureSubscript
Apre-exponential factoraash content in the particle
Cthe molar concentrationbreverse reaction rate constant
Dvolume diffusion coefficientCcoke
Eactivation energycchemical reaction
fmass fractionfforward reaction rate constant
Kempirical constantggas
kreaction ratei,jcomponent
Mmolecular weightPproduct
mmasspparticle
Nthe number of componentsRreactant
napparent reaction orderrreaction
Runiversal gas constantsparticle surface
Ttemperaturevvolatile matter
ttimewevaporating/boiling material
vstoichiometric coefficientFRfinite rate
SymbolEDeddy dissipation
αyield factorexp1the first empirical constant
εturbulent dissipation rateexp2the second empirical constant
ηrate exponent0initial state
ρdensity1low temperature, slow reaction
Γ third-body influence coefficient2high temperature, fast reaction
competing rate

References

  1. Ma, L.; Wei, Z.; Zou, L.; Yi, X.; He, C. Influence factors and prediction of critical parameters of spontaneous combustion of pulverized coal. Coal Sci. Technol. 2021, 49, 206–212. [Google Scholar]
  2. Ajrash, M.J.; Zanganeh, J.; Moghtaderi, B. The flame deflagration of hybrid methane coal dusts in a large-scale detonation tube (LSDT). Fuel 2017, 194, 491–502. [Google Scholar] [CrossRef]
  3. Wu, D.; Norman, F.; Schmidt, M.; Vanierschot, M.; Verplaetsen, F.; Berghmans, J.; Bulck, E.V.D. Numerical investigation on the self-ignition behaviour of coal dust accumulations: The roles of oxygen, diluent gas, and dust volume. Fuel 2017, 188, 500–510. [Google Scholar] [CrossRef]
  4. Wu, D.; Norman, F.; Vanierschot, M.; Verplaetsen, F.; Berghmans, J. Self-heating characteristics of coal dust deposits by a hot gas flow in oxy-fuel atmospheres. Appl. Therm. Eng. 2018, 131, 947–957. [Google Scholar] [CrossRef]
  5. Glushkov, D.O.; Kuznetso, G.V.; Strizhak, P.A. Experimental and numerical study of coal dust ignition by a hot particle. Appl. Therm. Eng. 2018, 13, 774–784. [Google Scholar] [CrossRef]
  6. Li, X.; Wang, J.; Liu, Q. Experimental study on coal dust explosions in a large-scale tube. China Saf. Sci. J. 2011, 21, 72–77. [Google Scholar]
  7. Li, H.; Chen, X.; Deng, J.; Hu, X.; Wang, Q.; Zhai, X. Numerical simulation on formation mechanism of pulverized coal cloud and flame dynamic behaviors during the explosion process in an open vessel. J. China Coal Soc. 2021, 46, 2600–2613. [Google Scholar]
  8. Wang, B. Analysis and summary of explosion accident of steel ball mill powder. Mod. Manuf. Technol. Equip. 2019, 10, 75–77. [Google Scholar] [CrossRef]
  9. Xu, C.; Li, J.; Yin, L. Study on coal dust explosion characteristics of coal-pulverizing system. Electr. Power Sci. Eng. 2010, 26, 53–56. [Google Scholar]
  10. Zhang, L.; Chen, S.; Wei, H. Cause analysis for explosion in coal pulverizing system of a power plant based on numerical simulation and retrofit. Therm. Power Gener. 2007, 6, 58–60+79. [Google Scholar]
  11. Shang, M.; Yao, Y.; Zhang, M.; Huang, Z.; Yang, H. Gas-solid two-phase numerical simulation in the gas-solid distributor of a pulverizing system. Coal Convers. 2022, 45, 17–24. [Google Scholar] [CrossRef]
  12. Jiang, S.; Ye, Y.; Tan, Y.; Liu, J.; Zhang, H.; Yang, D. Discrete element simulation of particle motion in ball mills based on similarity. Powder Technol. 2018, 335, 91–102. [Google Scholar] [CrossRef]
  13. Li, M.; Ma, G.; Li, H. Analysis of the blockage of coal powder pipeline in a power plant and the transformation scheme. Electr. Power Surv. Des. 2023, 11, 56–60. [Google Scholar] [CrossRef]
  14. Cheng, Z.; Li, D.; Li, J.; Feng, Y. Retrofitted technology and engineering practice for the coal blockage prevention in a coal fired furnace. J. Eng. Therm. Power 2017, 32, 109–112+135. [Google Scholar]
  15. Zhang, G.; Zhang, H.; Lei, L.; Zhang, F. Optimization and application of flow field of ZGM medium speed coal mill. Eng. Therm. Energy Power 2025, 40, 187–194. [Google Scholar]
  16. Ren, Y.; Zhang, Z. Study on explosion characteristics in coal pulverizing process for pulverizer. Jilin Electr. Power 2018, 46, 44–47. [Google Scholar] [CrossRef]
  17. Zhou, H.; Min, H.; Liang, F.; Yan, X. A Universal Pulverizing System for Bituminous and Lean Coal Using Low Temperature Furnace Smoke Drying and Using Exhaust Hot Air Compound to Send Powder. CN201010013734.5. 30 June 2010. Available online: https://kns.cnki.net/kcms2/article/abstract?v=0iq8nzQYh5SWmTGkU0_9s9e44ekNdJLe_NivTfVl2hUTsgXdpi0t1J6rfZoAVf0Gyc08W3Jm1HYjXobjkUDJfAClL9RxGs9nDSTg0_ZBgmH5iE0UhMlTBWt4KPkSuLvvkDF-kISGljzuEyY_vJ-SqELgEKLEf5bw4-eRDayCWt2Jk5HAQRv1161LC_s_hW8R&uniplatform=NZKPT&language=CHS (accessed on 10 December 2024).
  18. Ou, M.; Gao, Z.; Peng, J.; Luo, Z.; Liang, H. Application of burning high volatile coal in a 1 069 t/h lean coal boiler. Energy Res. Manag. 2024, 16, 112–116. [Google Scholar] [CrossRef]
  19. Cao, J.; Ou, M.; Gao, Z.; Sun, L. Research and engineering application of burning bituminous coals with high volatile content in a 360 MW lean coal-fired boiler. J. Eng. Therm. Energy Power 2024, 39, 95–103. [Google Scholar]
  20. Lei, P. Optimization and application of 300 MW boiler lean to smoke transformation technology. Autom. Appl. 2024, 65, 51–53+63. [Google Scholar]
  21. Cao, W.; Gao, W.; Peng, Y.; Liang, J.; Pan, F.; Xu, S. Experimental and numerical study on flame propagation behaviors in coal dust explosions. Powder Technol. 2014, 266, 456–462. [Google Scholar] [CrossRef]
  22. Xu, Y.; Xiong, Y.; Zhou, H.; He, C.; Chen, X.; Shen, X. Numerical simulation on pneumatic conveying of dense phase pulverized coal in horizontal pipe at high pressure. J. Xi’an Jiaotong Univ. 2012, 46, 38–43. [Google Scholar]
  23. Liu, G.; Liu, Y.; Dong, P. Experimental study on ignition characteristics of pulverized coal under high-temperature oxygen condition. IOP Conf. Ser. Earth Environ. Sci. 2016, 40, 012002. [Google Scholar] [CrossRef]
  24. Li, Z.; Liu, Y.; Zhang, M.; Wu, B. Study on oxygen consumption characteristics of coal under different temperatures in latent period of spontaneous combustion. J. Saf. Sci. Technol. 2017, 13, 125–130. [Google Scholar]
  25. Pan, R.; Qiu, T.; Chao, J.; Ma, H.; Wang, J.; Li, C. Thermal evolution of the oxidation characteristics of pulverized coal with different particle sizes and heating rates. Thermochim. Acta 2020, 685, 178516. [Google Scholar] [CrossRef]
  26. Shaheed, R.; Mohammadian, A.; Gildeh, H.K. A comparison of standard k–ε and realizable k–ε turbulence models in curved and confluent channels. Environ. Fluid Mech. 2019, 19, 543–568. [Google Scholar] [CrossRef]
  27. Das, A.K.; Singh, R.K.; Gupta, N.; Kumar, A.; Dwivedi, Y.D.; Rana, S.C.; Roy, M.; Singh, P.; Ansu, A.K.; Goya, A.; et al. Comparative study using renormalized group k-ɛ, realizable k-ɛ, and standard k-ɛ models for flow through S-shaped diffuser. Int. J. Interact. Des. Manuf. 2024, 18, 3397–3411. [Google Scholar] [CrossRef]
  28. Chang, P.; Xu, G.; Zhou, F.; Mullins, B.; Abishek, S. Comparison of underground mine DPM simulation using discrete phase and continuous phase models. Process Saf. Environ. Prot. 2019, 127, 45–55. [Google Scholar] [CrossRef]
  29. Zhu, B.; Shang, B.; Guo, X.; Wu, C.; Chen, X.; Zhao, L. Study on Combustion Characteristics and NOx Formation in 600 MW Coal-Fired Boiler Based on Numerical Simulation. Energies 2023, 16, 262. [Google Scholar] [CrossRef]
  30. Yin, H.; Jin, Y.; Li, L.; Lv, W. Numerical investigation on the impact of exergy analysis and structural improvement in power plant boiler through co-simulation. Energies 2022, 15, 8133. [Google Scholar] [CrossRef]
  31. Adams, B.R.; Smith, P.J. Three-dimensional discrete ordinates modelling of radiative transfer in a geometrically complex furnace. Combust. Sci. Technol. 1993, 88, 293–308. [Google Scholar] [CrossRef]
  32. Duan, Y.; Zhang, L.; Mao, Z.; Hu, Y.; Zheng, C. Numerical simulation of MILD combustion on coal-water slurry. Clean Coal Technol. 2017, 23, 36–41. [Google Scholar]
  33. Ansys Inc. Ansys Fluent Theory Guide, Release 2024 R1; Ansys Inc.: Canonsburg, PA, USA, 2024; pp. 475–476. [Google Scholar]
  34. Kobayashi, H.; Howard, J.B.; Sarofim, A.F. Coal Devolatilization at High Temperatures. In Proceedings of the 16th Symposium (International) on Combustion, The Combustion Institute, Pittsburgh, PA, USA, 15–20 August 1976. [Google Scholar]
  35. Cheng, X. Study on the adaptability of EDM, PDF and FR/ED models to pulverized coal combustion process simulation. Clean Coal Technol. 2020, 26, 43–49. [Google Scholar]
  36. Zhao, Y.; Chen, B.; Wang, P.; Li, X.; Sun, R.; Sun, S. Numerical study of the emission from co-combustion of large-proportion semi-coke and pulverized coal. Huadian Technol. 2020, 42, 64–72. [Google Scholar]
  37. Wen, F. Study on reaction kinetics of steam-coal chars gasification with TGA. J. Coal Sci. Technol. 2004, 29, 350–353. [Google Scholar] [CrossRef]
  38. Wen, F. Study on the gasification reaction dynamic of coal coke and CO2. J. Coal Sci. Technol. 2003, 9, 36–39. [Google Scholar] [CrossRef]
  39. Smith, I.W. The combustion rates of coal chars: A review. Symp. Int. Combust. 1982, 19, 1045–1065. [Google Scholar] [CrossRef]
  40. Yan, K.; Wang, Y.; Liu, P.; Zhao, S.; Wei, G.; Zhuo, J.; Yao, Q.; Li, S. Combustion characteristics of non-premixed hydrogen/natural gas flue gas based on flue gas internal recirculation. J. Combust. Sci. Technol. 2025, 31, 212–220. [Google Scholar]
  41. Wang, S.; Yang, C.; Zhou, H.; Niu, B.; Li, J.; Luo, T. Numerical simulation study on flow characteristics of hydrogen blending in T-shaped natural gas pipeline. J. Yan’an Univ. Nat. Sci. Ed. 2023, 42, 1–8. [Google Scholar] [CrossRef]
Figure 1. Geometric model of the exhaust air transfer device. The red box in the figure indicates the area of primary focus. (a) 100%B; (b) 100%A; (c) 25%A/75%B; (d) 50%A/50%B; (e) 75%A/25%B.
Energies 18 02408 g001
Figure 2. TG-DTG curves of pulverized coal. Region I represents the dehydration stage (green background); Region II represents the main combustion stage (red background); Region III represents the mineral decomposition stage (blue background); Region IV represents the burnout stage (gray background). Points ① to ③ further indicate the oxygen absorption, deoxygenation, and rapid combustion phases within the combustion stage. The green curve represents mass fraction, and the green dashed line represents mass change rate.
Energies 18 02408 g002
Figure 3. Grid division of exhaust air transfer system.
Energies 18 02408 g003
Figure 4. Grid independence verification. (a) Velocity values along a selected line inside the airbox for different mesh schemes; (b) Relative errors of the 33w, 43w, and 63w mesh results compared with the 53w mesh, the red bold line represents zero relative error.
Energies 18 02408 g004
Figure 5. Flow field distribution at three horizontal planes (Y = −0.5 m, Y = 0, and Y = 0.5 m) inside the airbox under five exhaust air transfer conditions, arranged in rows: 100%B, 25%A/75%B, 50%A/50%B, 75%A/25%B, and 100%A. Each column compares the same plane under different transfer cases.
Energies 18 02408 g005
Figure 6. Characterization of the low-velocity region at the bottom of the airbox under different exhaust air transfer conditions. (a) Volume and average temperature of the low-velocity region; (bf) simulation results showing the spatial extent and internal temperature distribution of the low-velocity region for various exhaust air ratios: (b) 100%B, (c) 25%A/75%B, (d) 50%A/50%B, (e) 75%A/25%B, and (f) 100%A.
Energies 18 02408 g006
Figure 7. Component distribution and average CO mass fraction in the primary airbox under different exhaust air conditions. The contour plot shows CO distribution, with streamlines representing exhaust air flow and oxygen concentration, and the red box highlights the main CO distribution location. (ae) Component distribution for different conditions: (a) 100%B, (b) 25%A/75%B, (c) 50%A/50%B, (d) 75%A/25%B, (e) 100%A. (f) Variation of average CO mass fraction.
Energies 18 02408 g007
Figure 8. Volume and average temperature of the low-velocity zone in the primary air box, and the average CO mass fraction in the airbox under different hot air velocities.
Energies 18 02408 g008
Figure 9. Changes in the recirculation zone at the bottom of the airbox with increasing hot air velocity. (a) 1 m/s; (b) 2 m/s; (c) 3 m/s; (d) 4 m/s.
Energies 18 02408 g009
Figure 11. Volume and average temperature of the low-velocity zone in the primary air box, and the average CO mass fraction in the airbox under different hot air temperatures.
Energies 18 02408 g011
Figure 12. Curve of the volume in the low-speed zone and the average CO mass fraction as a function of the hot air velocity under different waste gas transfer conditions. (a) The volume in the low-speed zone, (b) the average CO mass fraction. The colored dashed lines indicate the average CO mass fraction at the corresponding hot air velocity for each condition.
Energies 18 02408 g012
Figure 13. Curve of the volume in the low-speed zone and the average CO mass fraction as a function of hot air temperature under different waste gas transfer conditions. (a) The volume in the low-speed zone, (b) the average CO mass fraction. The colored dashed lines indicate the average CO mass fraction at the corresponding hot air temperature for each condition.
Energies 18 02408 g013
Table 1. Main parameters of pulverized coal.
MaterialProximate Analysis
(As Received, wt%)
Ultimate Analysis
(Dry Ash Free, wt%)
Qnet,d/
MJ·kg−1
MoistureAshVolatileFixed CarbonCHON
Pulverized coal14.522.0223.8139.6778.324.9314.541.4322.16
Table 2. Chemical reaction kinetic parameters.
ReactionA/s−1E/kJ·mol−1
mv_vol + 1.706 O2 → CO2 + 1.543 H2O2.1 × 10112.01 × 108
C(s) + O2 → CO23.0 × 1021.30 × 108
C(s) + CO2 → 2 CO2.2 × 1032.20 × 108
C(s) + H2O → CO + H21.1 × 1031.82 × 108
CO + 1/2 O2 → CO23.2 × 10121.67 × 108
H2 + 1/2 O2 → H2O2.5 × 10161.67 × 108
Table 3. Relevant parameters under different exhaust air transfer conditions.
CaseA Exhaust Air
Velocity/m·s−1
B Exhaust Air
Velocity/m·s−1
Hot Air Velocity/m·s−1Hot Air
Temperature/K
100%B
(case 1~16)
25251~10560~620
25%A/75%B
(case 17~32)
4.2612.791~10560~620
50%A/50%B
(case 33~48)
8.538.531~10560~620
75%A/25%B
(case 49~64)
12.794.261~10560~620
100%A
(case 65~80)
25251~10560~620
Table 4. Hot air velocity and temperature under different load conditions.
LoadHot Air Velocity/m·s−1Hot Air Temperature/K
100% BMCR7.0610
80% BMCR9.8580
50% BMCR2.3565
Table 5. Comparison of simulation results and field operating data for 100%B exhaust air transfer condition.
ItemsSimulation ValueMeasured ValueRelative Error (%)
average velocity at the primary air box outlet/m·s−129.1931.457
average temperature at the primary air box outlet/K447.25418.367
temperature near the upper wall inside the primary air box/K424.65408.894
Disclaimer/Publisher’s Note: The statements, opinions and data contained in all publications are solely those of the individual author(s) and contributor(s) and not of MDPI and/or the editor(s). MDPI and/or the editor(s) disclaim responsibility for any injury to people or property resulting from any ideas, methods, instructions or products referred to in the content.

