
Development of a Visualization Platform for Power Generation Analysis in Urban Building-Integrated Photovoltaic Systems


Abstract
1. Introduction
User Demand Survey
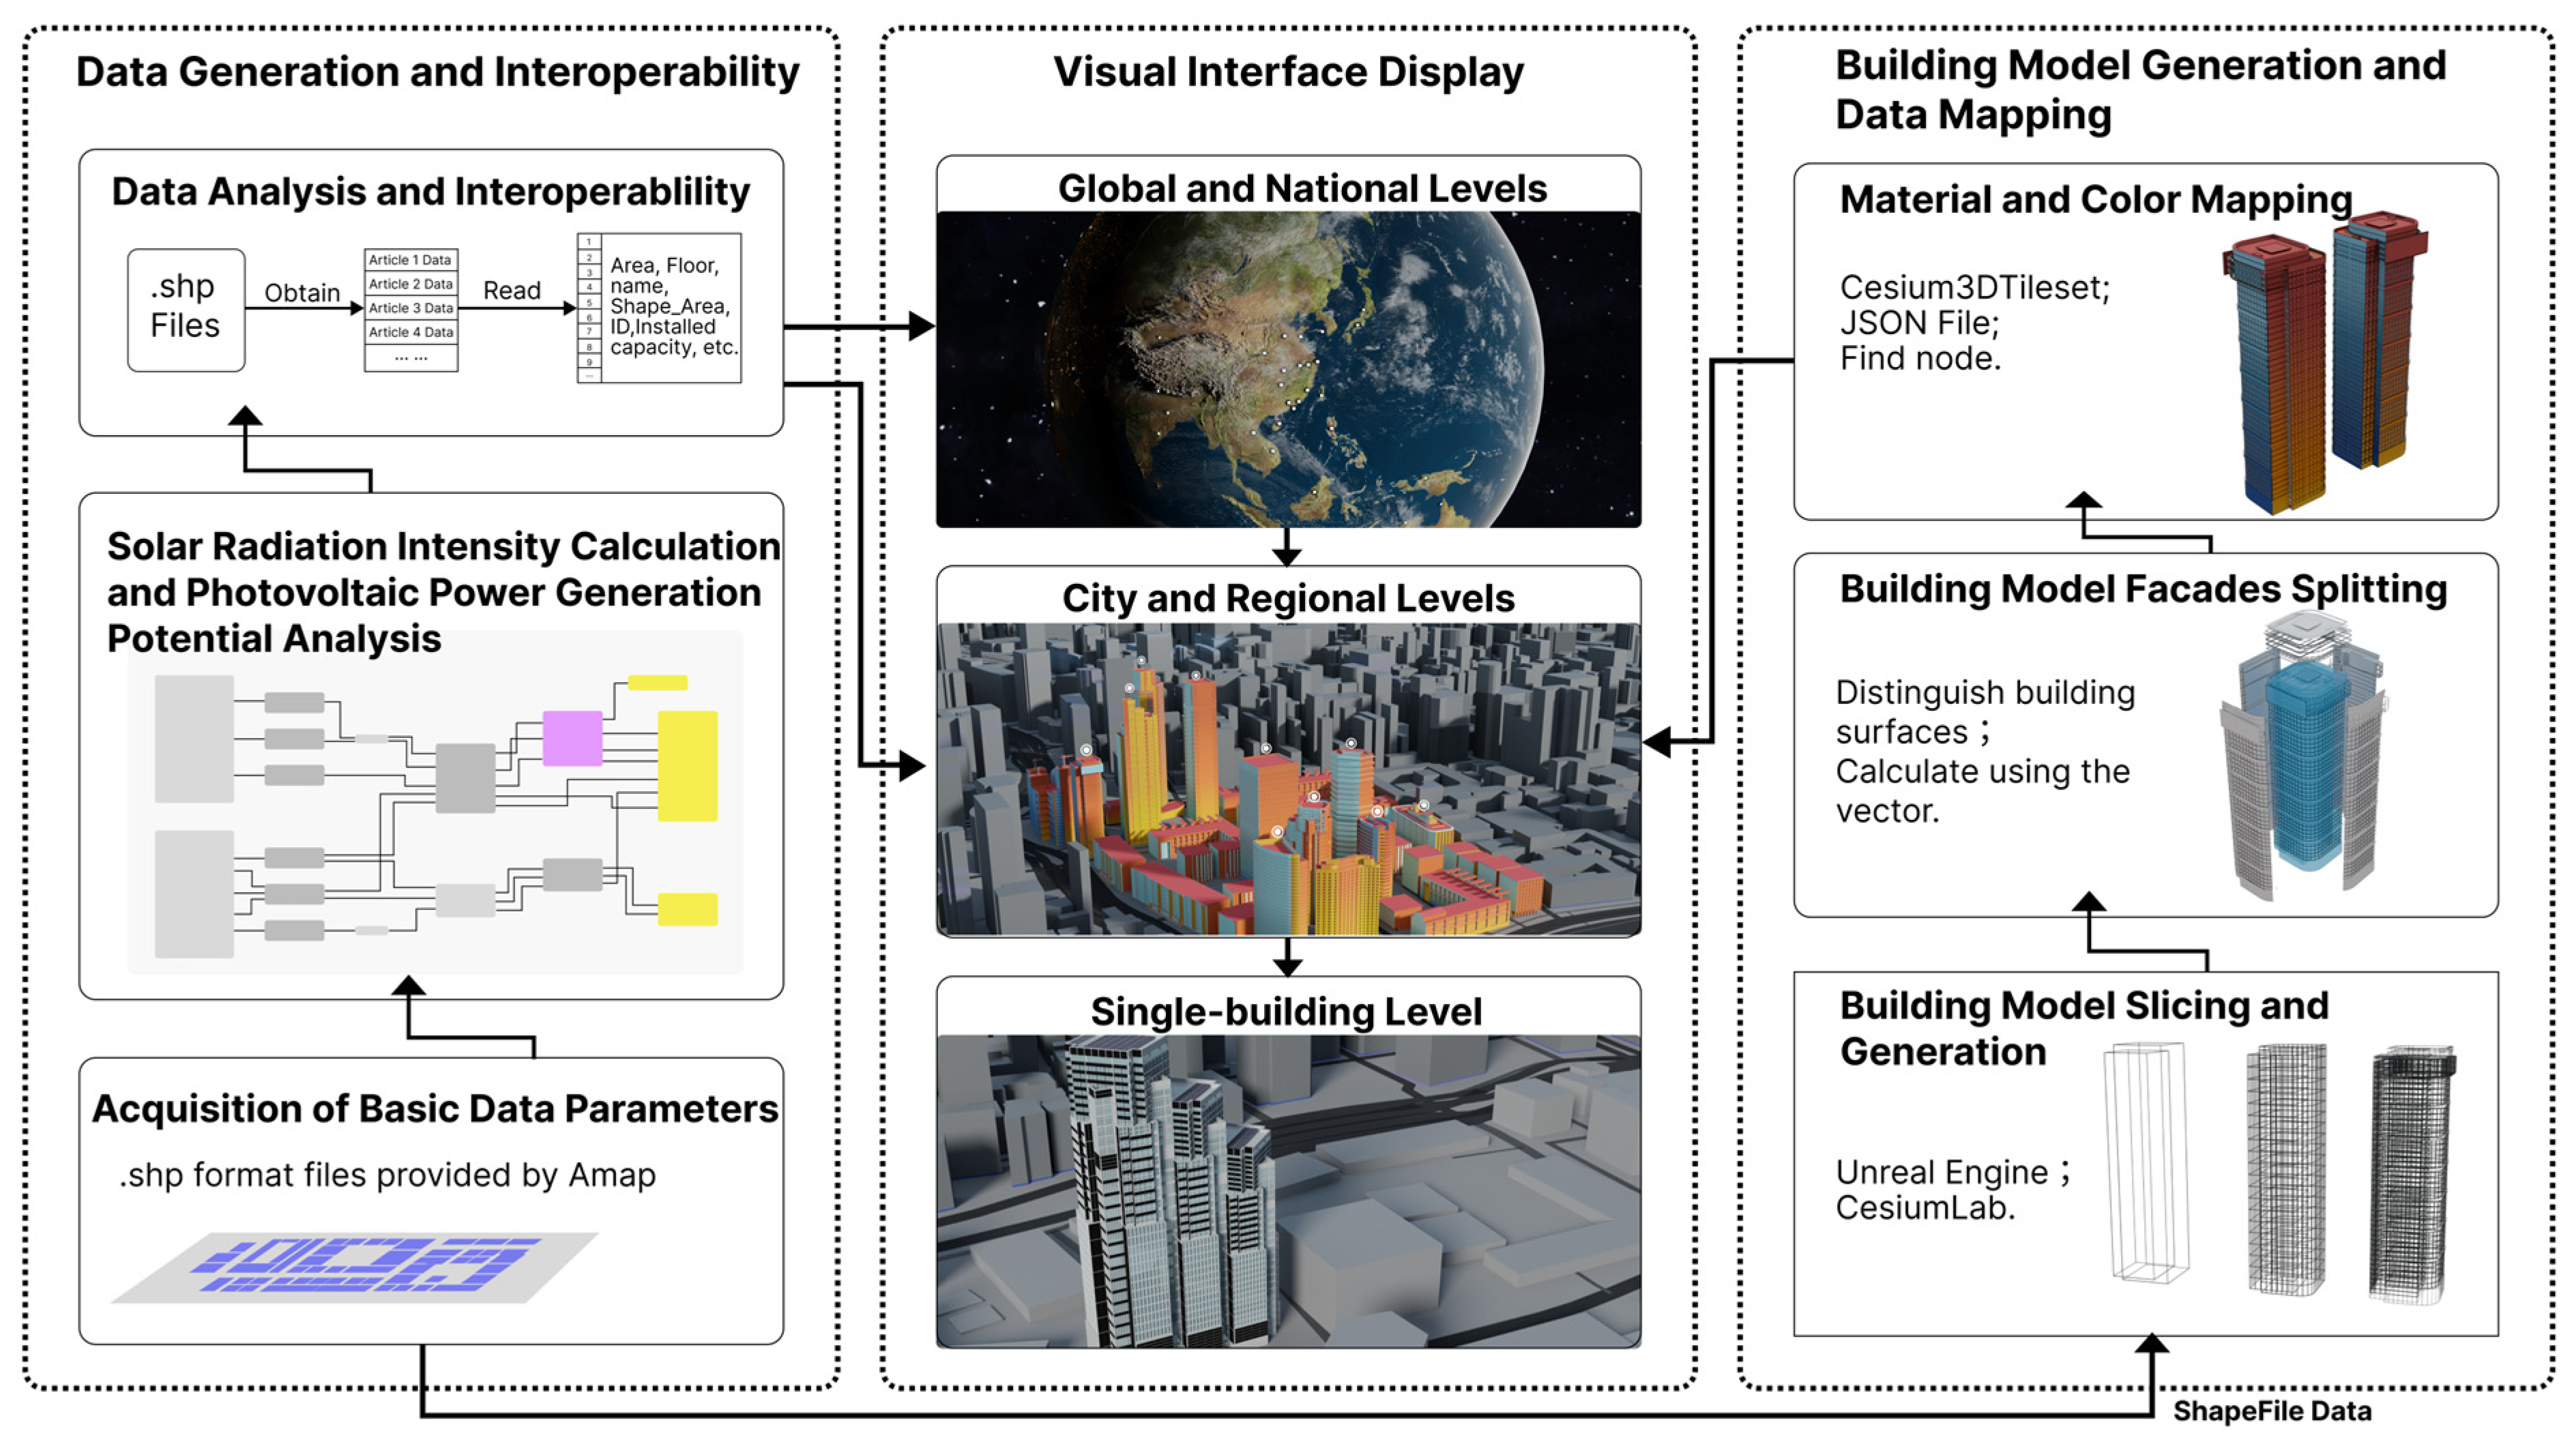
2. Platform Architecture
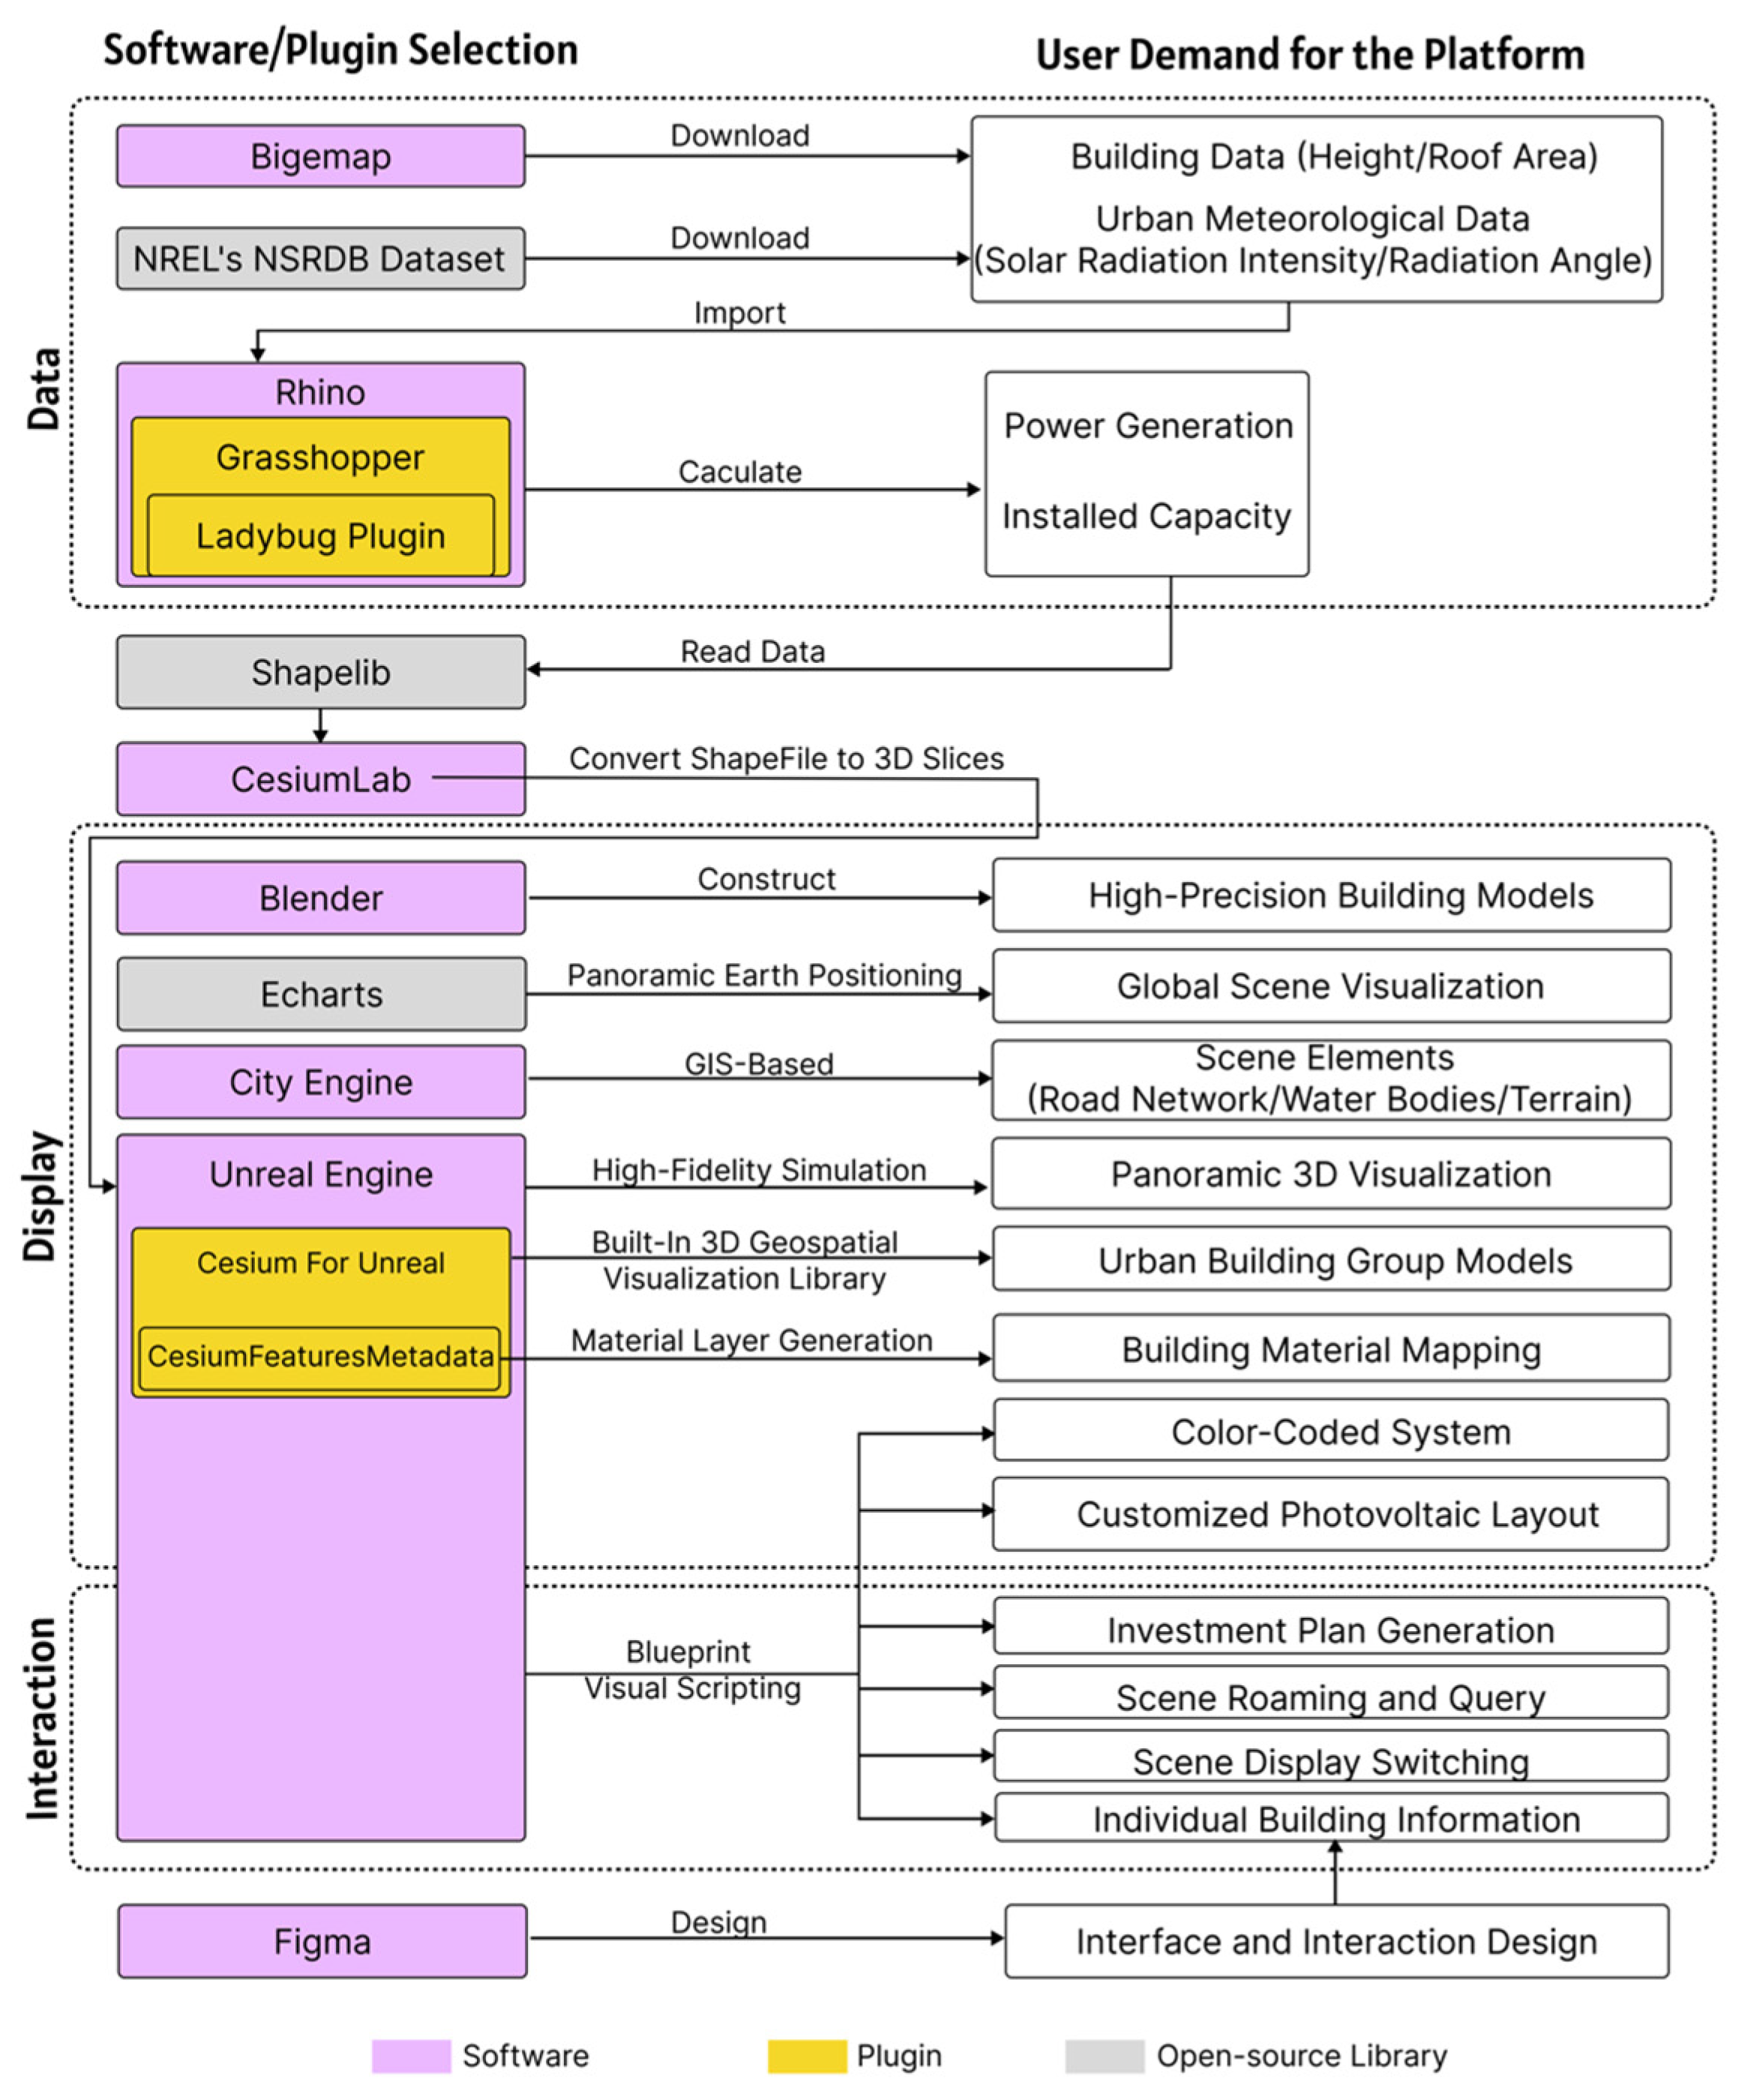
2.1. Data Sources
2.2. Software and Plugin Selection
2.3. Interface Interaction
3. Methods
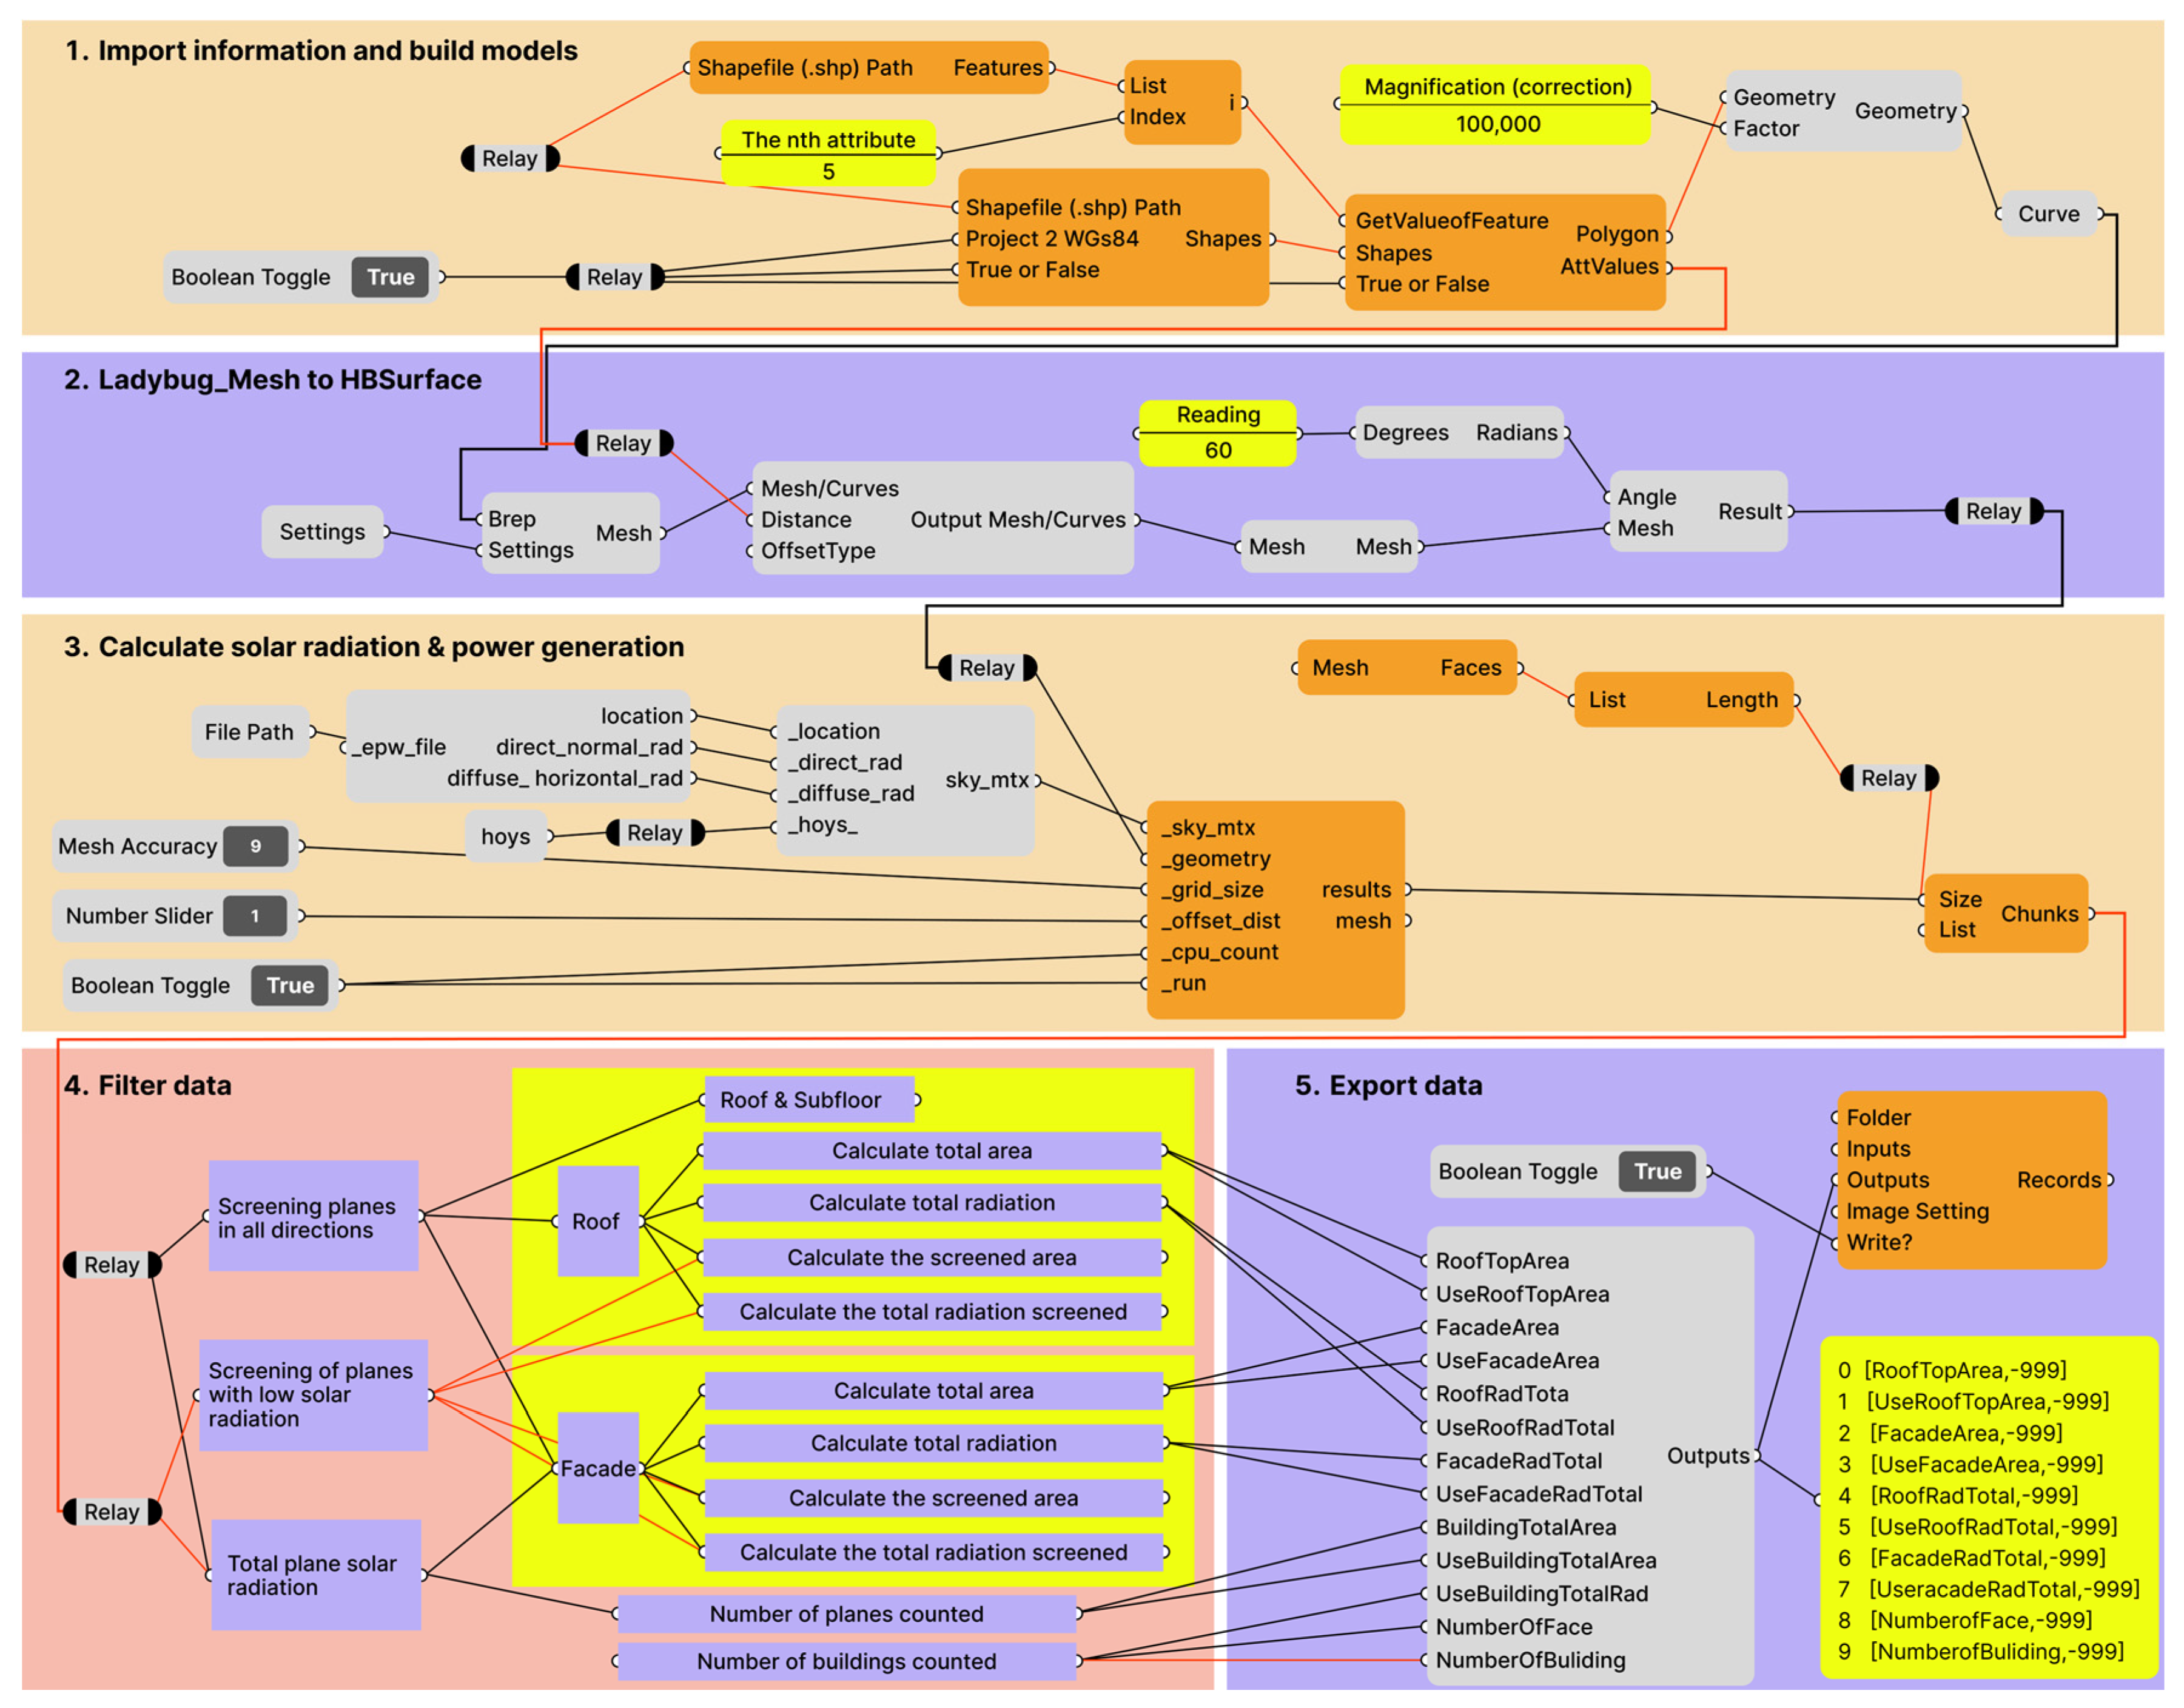
3.1. Solar Radiation Intensity Calculation and Photovoltaic Power Generation Potential Analysis
3.1.1. Construction of City-Scale 3D Building Models
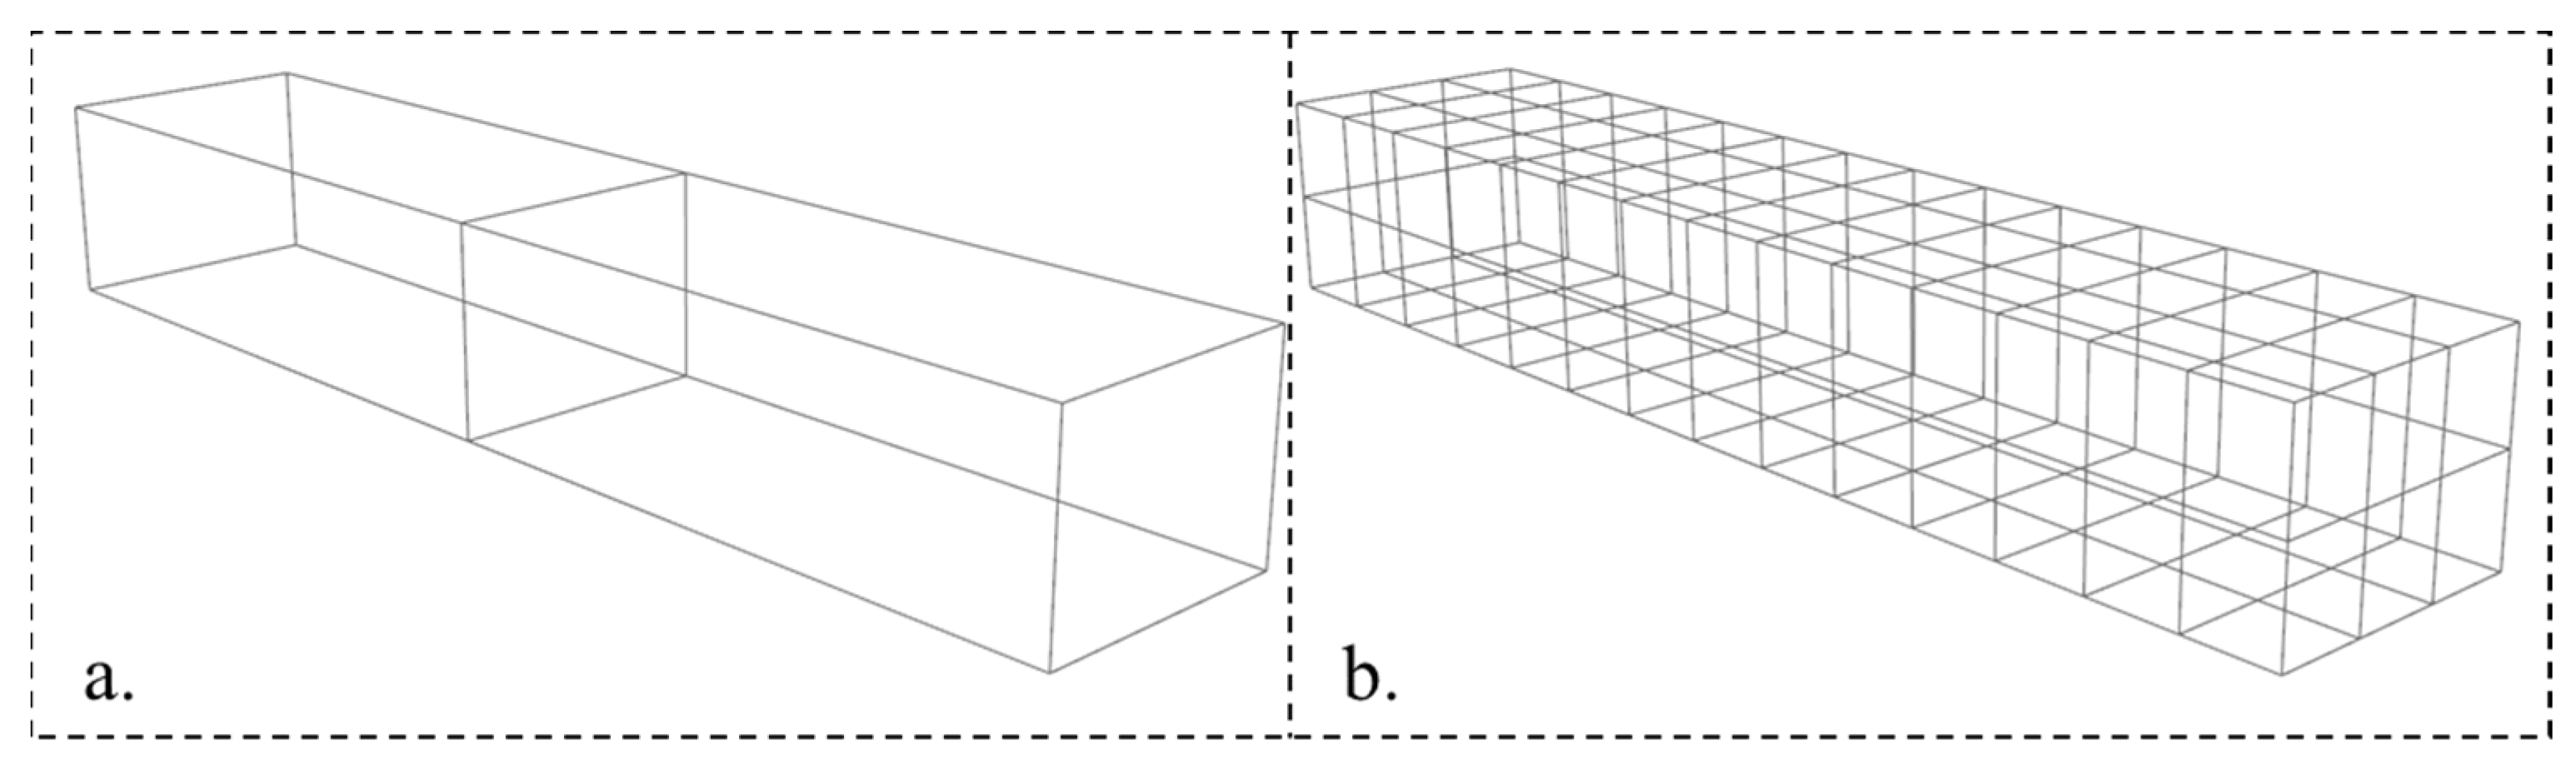
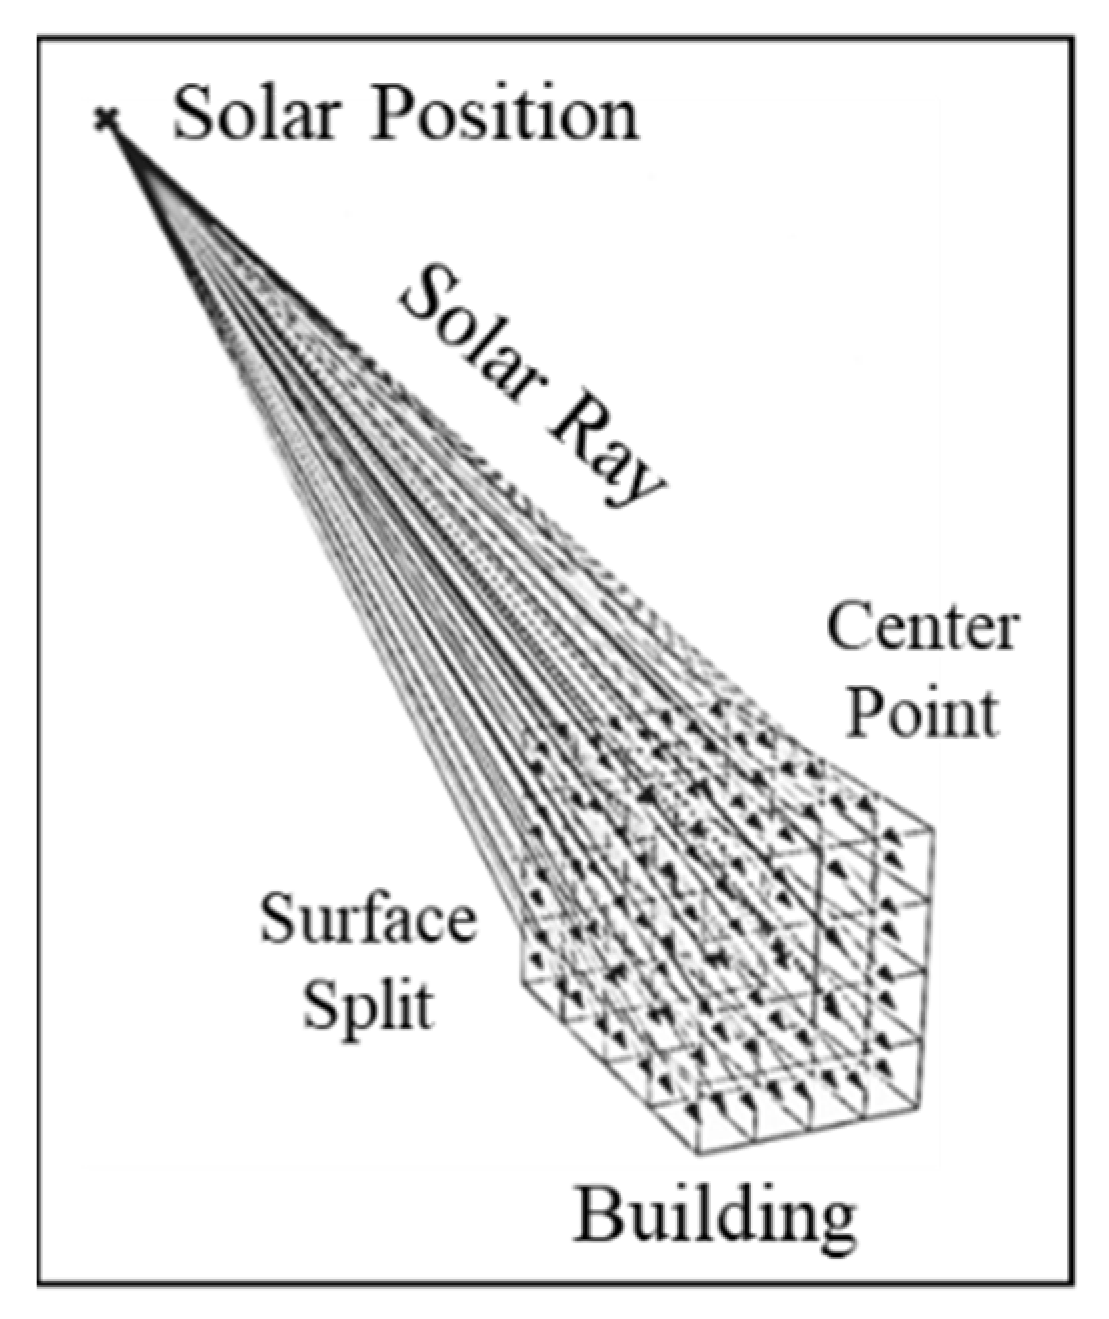
3.1.2. Solar Radiation Model with Shading Consideration
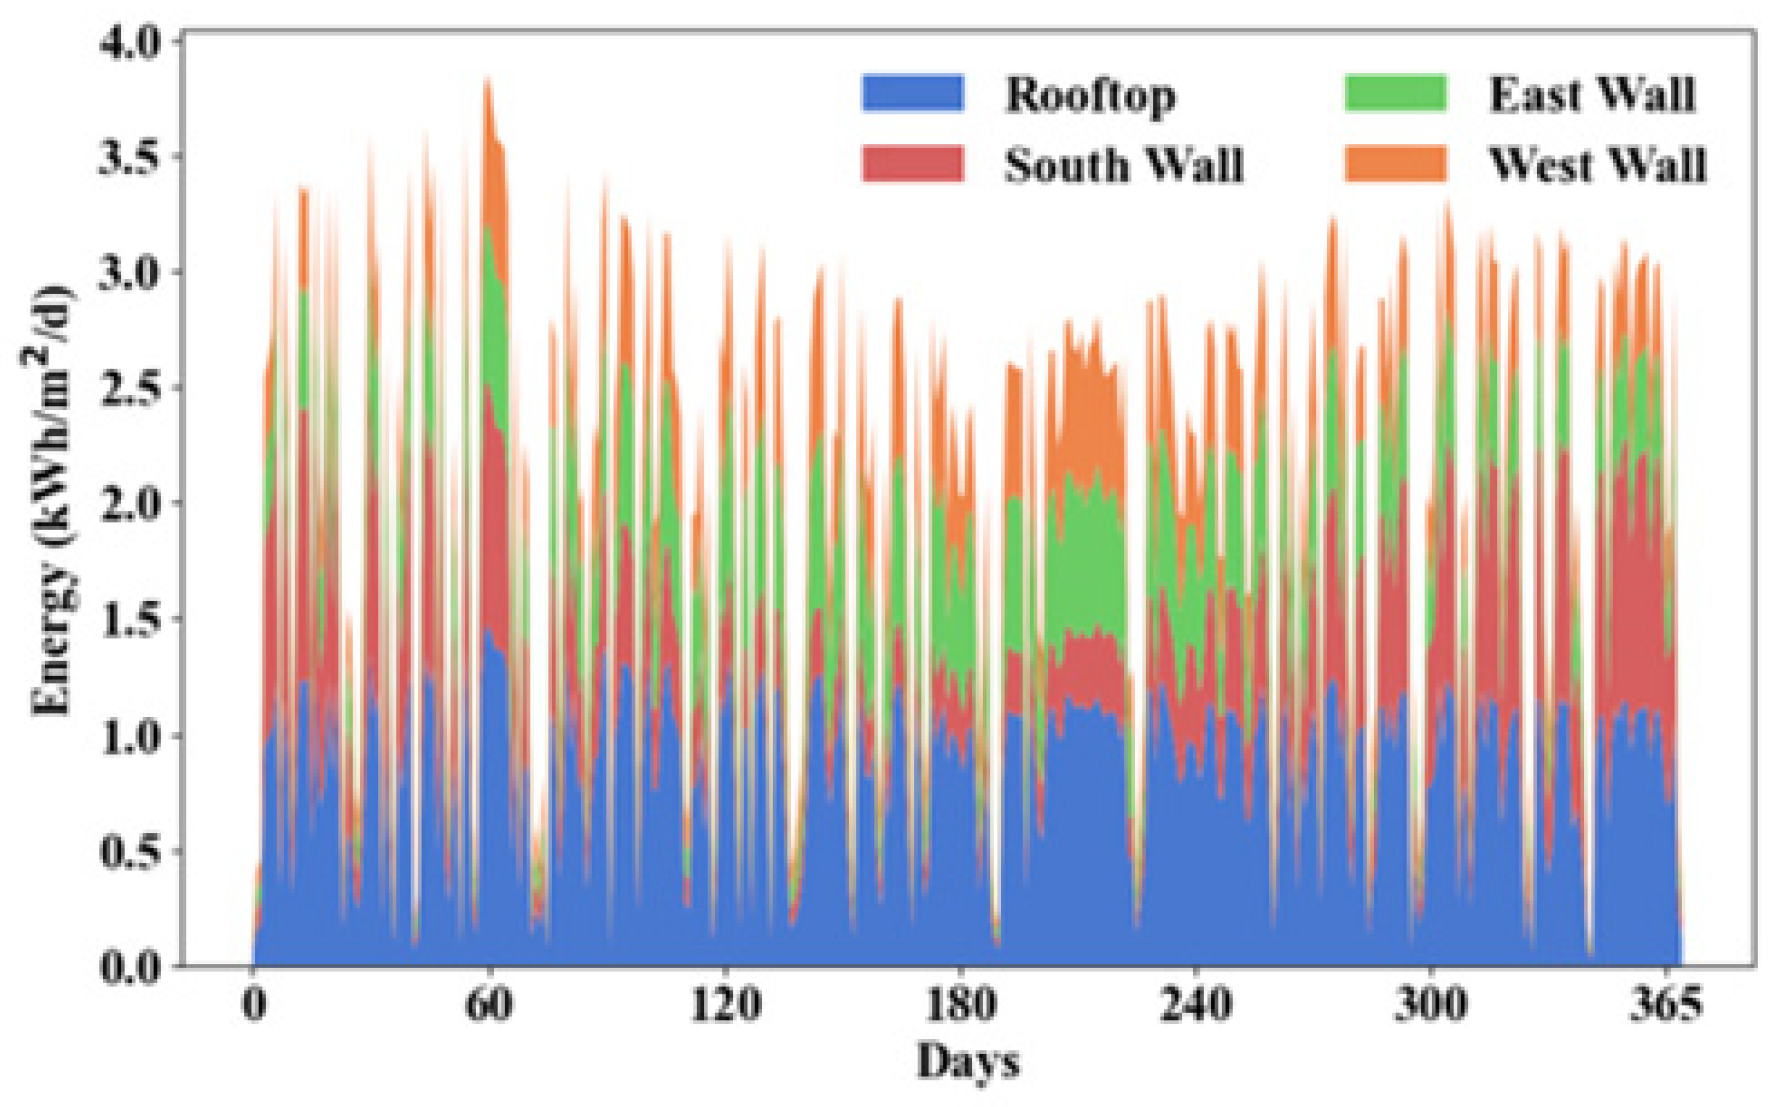
3.1.3. Photovoltaic Power Generation Potential Analysis
3.1.4. Economic Assessment
3.1.5. Simulation Parameter Settings
3.2. Data Analysis and Data Interoperability
3.3. Building Model Generation and Data Mapping
3.3.1. Building Model Slicing and Generation
3.3.2. Building Model Facade Splitting
3.3.3. Material and Color Mapping
4. Case Study
4.1. Overview
4.2. Results
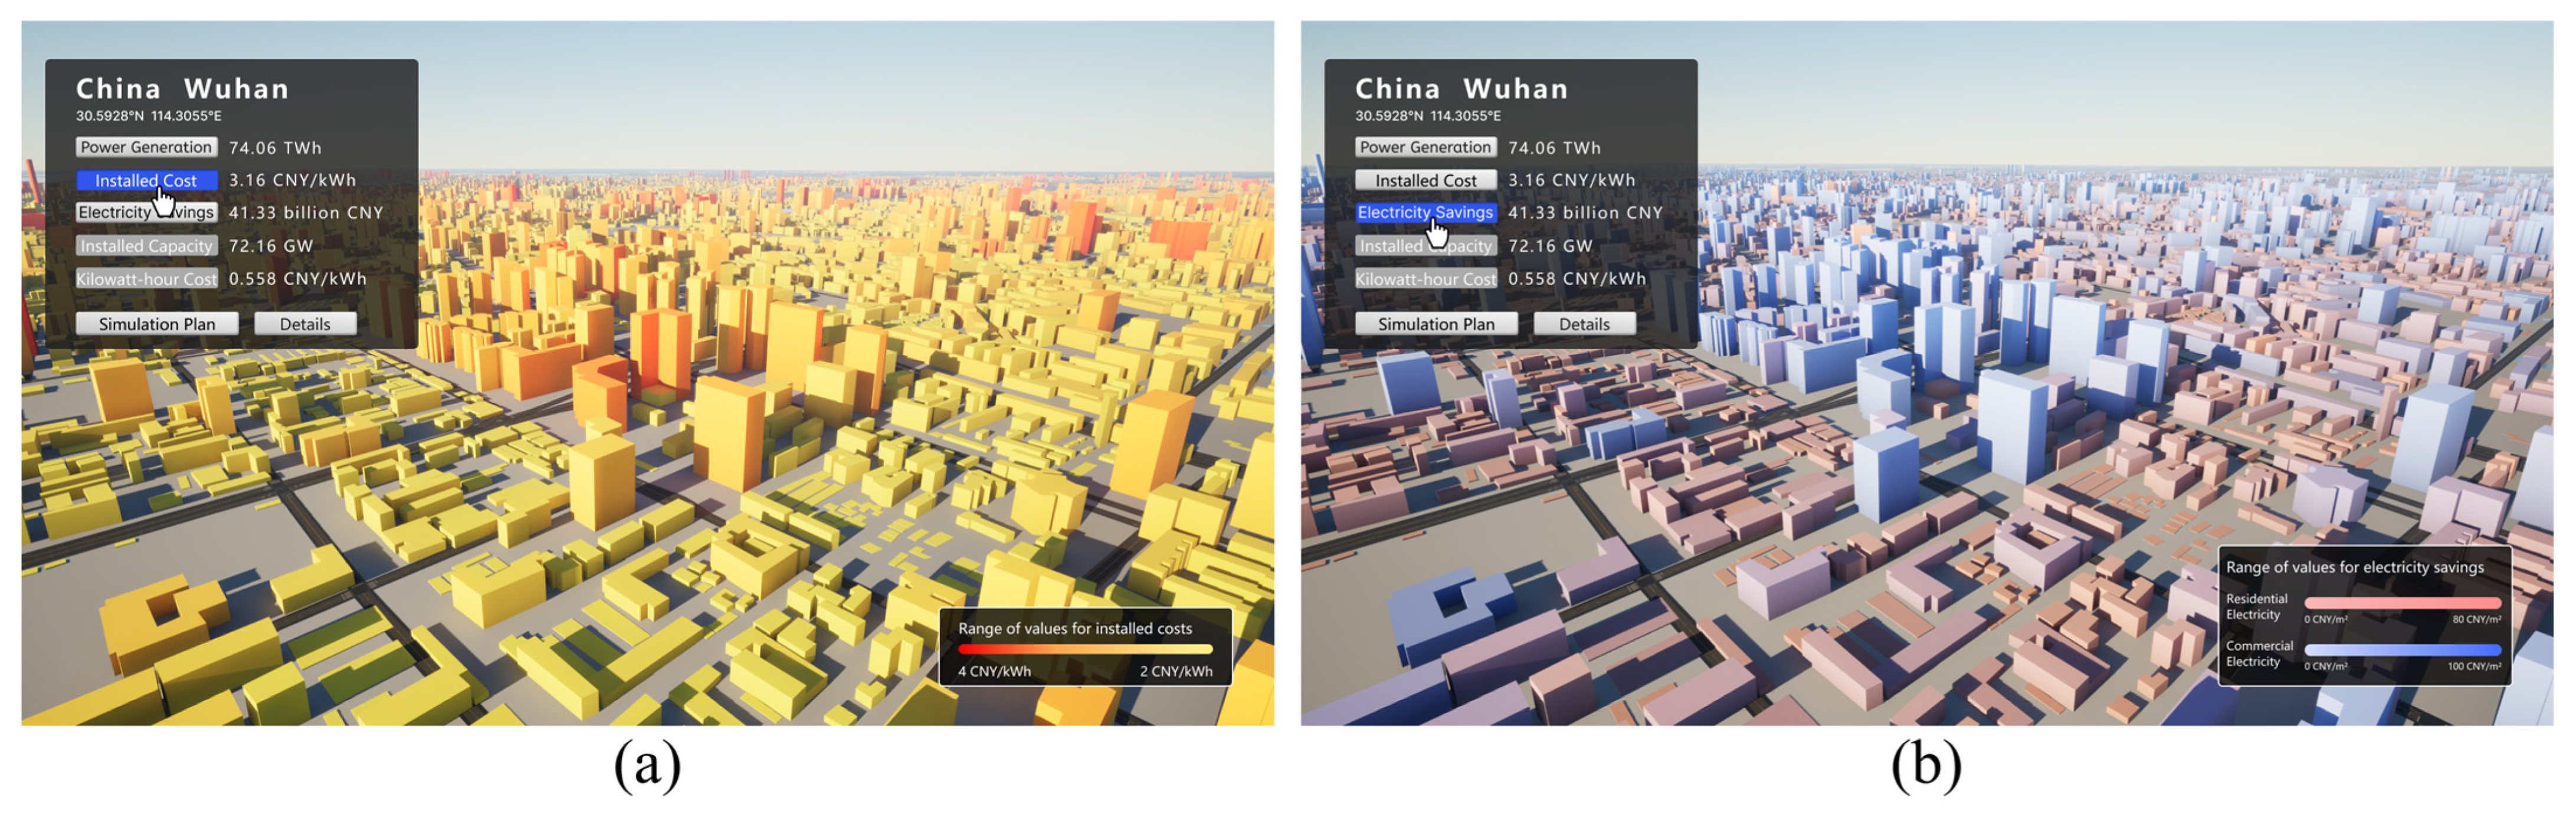
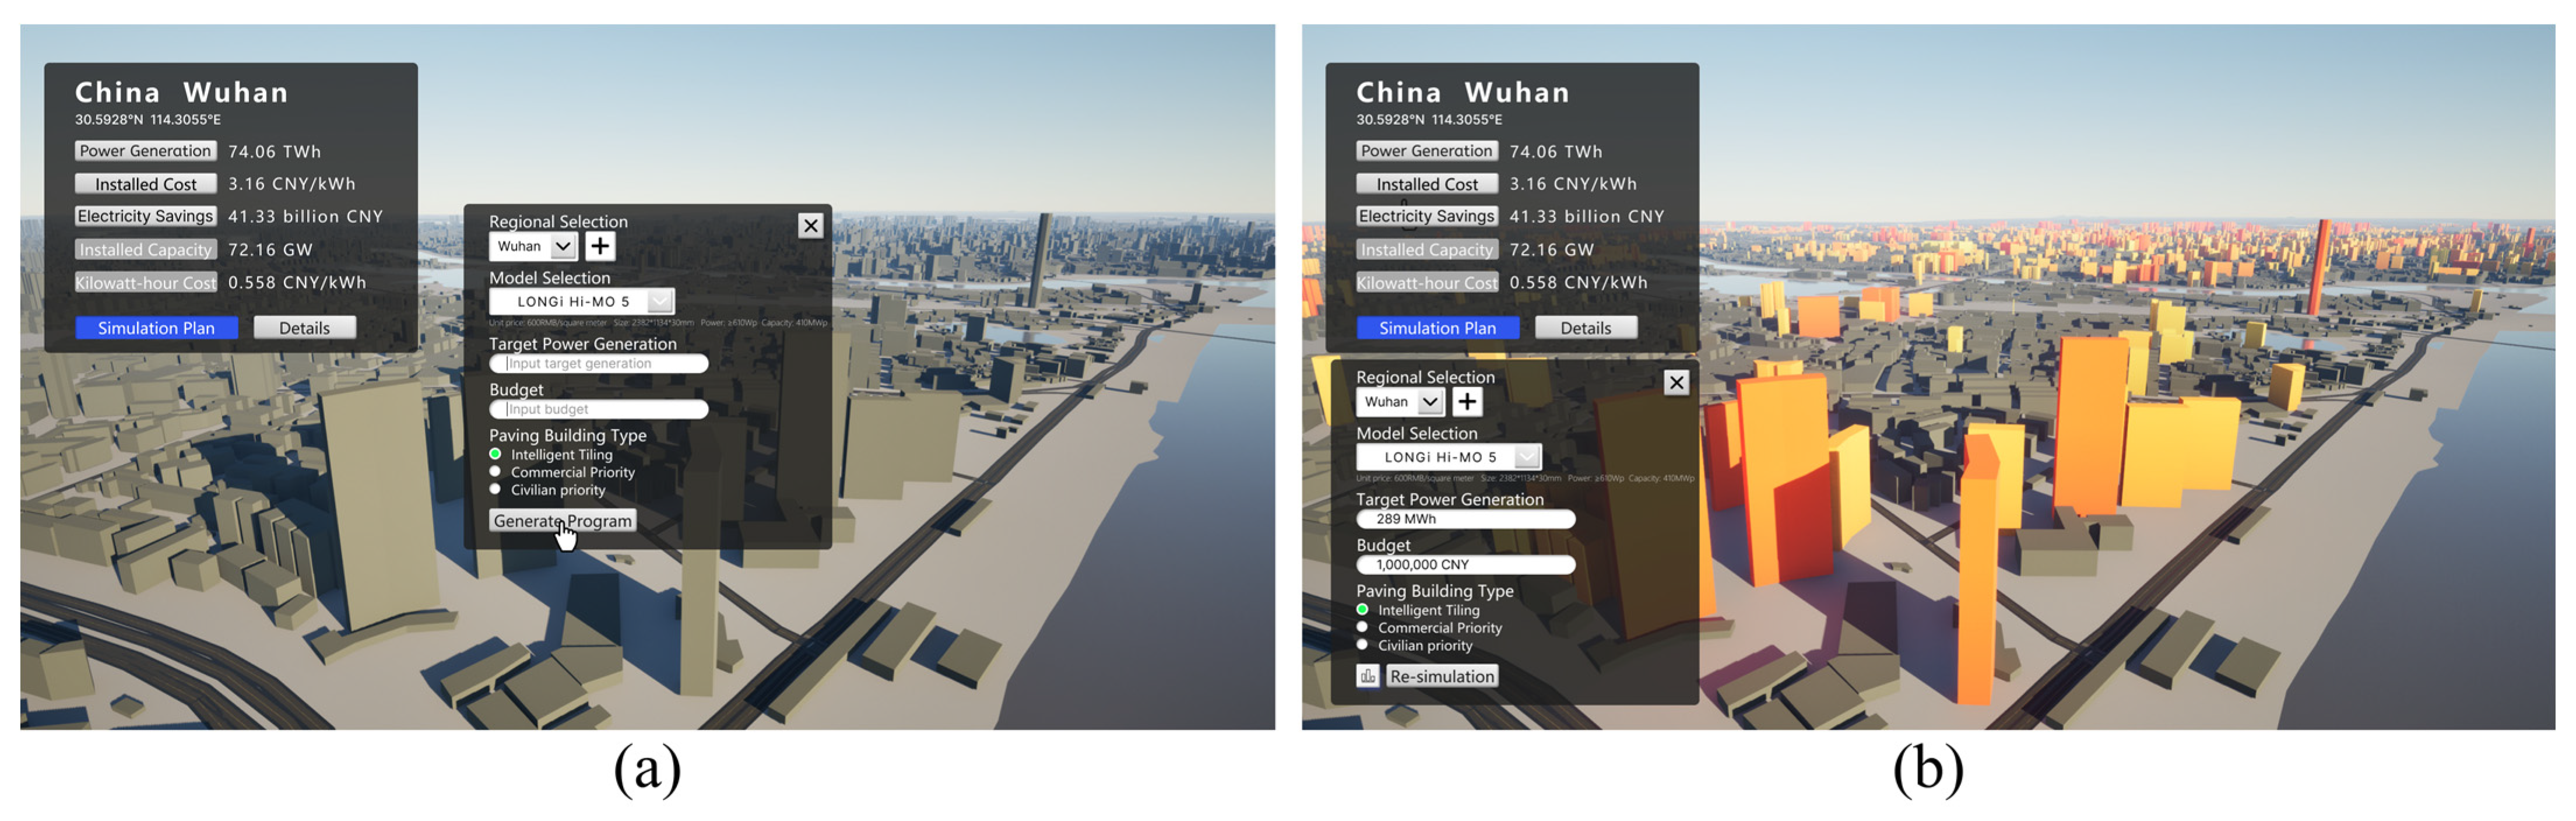
4.3. Interface Display Content and Effects
5. Discussion and Conclusions
Author Contributions
Funding
Data Availability Statement
Conflicts of Interest
References
- Sun, H.; Heng, C.K.; Tay, S.E.R.; Chen, T.; Reindl, T. Comprehensive feasibility assessment of building integrated photovoltaics (BIPV) on building surfaces in high-density urban environments. Sol. Energy 2021, 225, 734–746. [Google Scholar] [CrossRef]
- Nørgaard, P.; Poder, S.H. Perspectives on solar power in dense urban areas–with Copenhagen International School as a case study. J. Eng. 2019, 18, 5134–5137. [Google Scholar] [CrossRef]
- Vyas, M.; Chowdhury, S.; Verms, A.; Jain, V.K. Solar Photovoltaic Tree: Urban PV power plants to increase power-to-land occupancy ratio. Renew. Energy 2022, 190, 283–293. [Google Scholar] [CrossRef]
- Azizkhani, M. Assessment of Solar PV Potential on Facades: Toward Zero-Energy Buildings; Springer: Cham, Switzerland, 2021. [Google Scholar]
- Freitas, S.; Brito, M.C. Solar façades for future cities. Renew. Energy Focus 2019, 31, 73–79. [Google Scholar] [CrossRef]
- Gholami, H.; Røstvik, H.N. Economic analysis of BIPV systems as a building envelope material for building skins in Europe. Energy 2020, 204, 117931. [Google Scholar] [CrossRef]
- Liu, R.; Liu, Z.; Xiong, W.; Zhang, L.; Zhao, C.; Yin, Y. Performance simulation and optimization of building façade photovoltaic systems under different urban building layouts. Energy 2024, 288, 129708. [Google Scholar] [CrossRef]
- Li, J.; Wang, Y.; Xia, Y. A novel geometric parameter to evaluate the effects of block form on solar radiation towards sustainable urban design. Sustain. Cities Soc. 2022, 84, 104001. [Google Scholar] [CrossRef]
- Liu, J.; Liu, Z.; Wu, Y.; Chen, X.; Xiao, H.; Zhang, L. Impact of climate on photovoltaic battery energy storage system optimization. Renew. Energy 2022, 191, 625–638. [Google Scholar]
- Kazem, H.A.; Chaichan, M. Effect of environmental variables on photovoltaic performance based on experimental studies. Int. J. Civ. Mech. Energy Sci. 2016, 2, 1–8. [Google Scholar]
- Moraitis, P.; Kausika, B.B.; Nortier, N.; Sark, W.V. Urban environment and solar PV performance: The case of the Netherlands. Energies 2018, 11, 1333. [Google Scholar] [CrossRef]
- Zhu, R.; Wong, M.S.; Kwan, M.-P.; Chen, M.; Santi, P.; Ratti, C. An economically feasible optimization of photovoltaic provision using real electricity demand: A case study in New York City. Sustain. Cities Soc. 2022, 78, 103614. [Google Scholar] [CrossRef]
- Chen, X.; Chen, X. Data visualization in smart grid and low-carbon energy systems: A review. Int. Trans. Electr. Energy Syst. 2021, 31, e12889. [Google Scholar] [CrossRef]
- Healy, K. Data Visualization: A Practical Introduction; Princeton University Press: Princeton, NJ, USA, 2024. [Google Scholar]
- Telea, A.C. Data Visualization: Principles and Practice; CRC Press: Boca Raton, FL, USA, 2014. [Google Scholar]
- Baqir, M.; Channi, H.K. Analysis and design of solar PV system using Pvsyst software. Mater. Today Proc. 2022, 48, 1332–1338. [Google Scholar] [CrossRef]
- Romero-Ramos, J.A.; Gil, J.D.; Cardemil, J.M.; Escobar, R.A.; Ariasb, I.; Pérez-García, M. A GIS-AHP approach for determining the potential of solar energy to meet the thermal demand in southeastern Spain productive enclaves. Renew. Sustain. Energy Rev. 2023, 176, 113205. [Google Scholar] [CrossRef]
- Berrian, D.; Linder, J. Impact of large format solar panels on the balance of system costs of photovoltaic power plants. In Proceedings of the 8th World Conference on Photovoltaic Energy Conversion, Milan, Italy, 26–30 September 2022; Available online: https://userarea.eupvsec.org/proceedings/WCPEC-8/4BV.5.13/ (accessed on 23 September 2024).
- Ali, M.S.; Rima, N.N.; Sakib, M.I.H.; Khan, M.F. Helioscope-based design of a MWp solar PV plant on a marshy land of Bangladesh and prediction of plant performance with the variation of tilt angle. GUB J. Sci. Eng. 2018, 5, 1–5. [Google Scholar] [CrossRef]
- Sharma, D. Review and analysis of solar photovoltaic software. Int. J. Eng. Technol. 2014, 4, 725–731. [Google Scholar]
- Schupp, T. Workflow for solar irradiance concentration analysis. In Proceedings of the Illumination Optics VII, Proceedings of Spie Optical Systems Design, Strasbourg, France, 7–12 April 2024; Volume 13022, pp. 86–92. [Google Scholar]
- Geh, N.; Emuze, F. Solar photovoltaic deployment acceleration model to advance the sustainability of buildings in public universities in South Africa. Energy Build. 2023, 284, 112855. [Google Scholar] [CrossRef]
- Buyuksalih, I.; Bayburt, S.; Buyuksalih, G.; Baskaraca, A.P. 3D modeling and visualization based on the Unity game engine–advantages and challenges. ISPRS Ann. Photogramm. Remote Sens. Spat. Inf. Sci. 2017, 4, 161–166. [Google Scholar]
- Laksono, D.; Aditya, T.; Riyadi, G. Interactive 3D city visualization from structure motion data using a game engine. ISPRS Arch. Photogramm. Remote Sens. Spat. Inf. Sci. 2019, XLII-4/W16, 737–740. [Google Scholar] [CrossRef]
- Xu, H.; He, B.; Li, Z.; Lin, H. Efficient visualization of 3D city scenes by integrating GIS and Unreal Engine. In Proceedings of the Fourth International Conference on Geoscience and Remote Sensing Mapping (GRSM 2022), Changchun, China, 4–6 November 2022; SPIE: Bellingham, WA, USA, 2023; Volume 12551. [Google Scholar]
- Edler, D.; Keil, J.; Dickmann, F. From Na Pali to Earth—An ‘Unreal’ engine for modern geodata? In Modern Approaches to the Visualization of Landscapes; Springer VS: Wiesbaden, Germany, 2020. [Google Scholar]
- Xie, M.; Wang, M.; Zhong, H.; Li, X. The impact of urban morphology on the building energy consumption and solar energy generation potential of university dormitory blocks. Sustain. Cities Soc. 2023, 96, 104644. [Google Scholar] [CrossRef]
- Ghiasi, M.; Wang, Z.; Mehrandezh, M.; Paranjape, R. Enhancing efficiency through integration of geothermal and photovoltaic in heating systems of a greenhouse for sustainable agriculture. Sustain. Cities Soc. 2025, 118, 106040. [Google Scholar] [CrossRef]
- Kratochvil, J.; Boyson, W.; King, D. Photovoltaic Array Performance Model; SAND2004-3535; Sandia National Laboratories: Albuquerque, NM, Mexico, 2003. [Google Scholar]
- NSRDB. Available online: https://nsrdb.nrel.gov/ (accessed on 30 August 2023).
- Shi, M.; Lu, X.; Jiang, H.; Mu, Q.; Chen, S.; Fleming, R.M.; Zhang, N.; Wu, Y.; Foley, A.M. Opportunity of rooftop solar photovoltaic as a cost-effective and environment-friendly power source in megacities. iScience 2022, 25, 104890. [Google Scholar] [CrossRef]
- SolarWorld SunModule Pro 250 Watt, 20V Polycrystalline Solar Panel (SW250P). Available online: https://www.mrsolar.com/solarworld-sw250p-250w-24v-solar-panel/ (accessed on 10 October 2023).
- National Development and Reform Commission Energy Institute. Outlook for China’s Photovoltaic Development in 2050; National Development and Reform Commission Energy Institute: Beijing, China, 2019; Available online: http://sogrb.com/nd.jsp?id=32 (accessed on 17 December 2021).
- China Photovoltaic Industry Association. Roadmap for the Development of China’s Photovoltaic Industry (2023–2024); China Photovoltaic Industry Association: Beijing, China, 2024; Available online: https://www.chinapv.org.cn/ (accessed on 18 April 2024).
- Available online: https://fgw.hubei.gov.cn/fbjd/zc/zcwj/tz/202011/t20201126_3763550.shtml (accessed on 21 November 2022).
- Chen, Z.; Yang, B.; Zhu, R.; Dong, Z. City-scale solar PV potential estimation on 3D buildings using multi-source RS data: A case study in Wuhan, China. Appl. Energy 2024, 359, 122720. [Google Scholar] [CrossRef]
- Jun, Q. Multiple time scales analysis of climate variation in Wuhan during the last 100 years. J. Cent. China Norm. Univ. 2000, 5, 184–198. [Google Scholar]


| Government Department Commissioner | Power Industry Expert | Photovoltaic Investor | Total | ||
|---|---|---|---|---|---|
| Purpose of Use | Regional Photovoltaic Investment Planning | 5 | 5 | 5 | 15 |
| Large-Screen Report Presentation | 5 | 3 | 2 | 10 | |
| Data Content | Estimated Power Generation | 5 | 5 | 5 | 15 |
| Estimated Installation Cost | 5 | 5 | 5 | 15 | |
| Estimated Installed Capacity | 5 | 5 | 5 | 15 | |
| Estimated Electricity Cost Savings | 5 | 5 | 5 | 15 | |
| Building Data Information | 5 | 5 | 5 | 15 | |
| Display Preferences | Panoramic 3D Visualization | 5 | 4 | 4 | 13 |
| High-Precision Models for Significant Buildings | 3 | 3 | 5 | 11 | |
| Color-Coded System with Clear Data Correlations | 5 | 5 | 5 | 15 | |
| Interface Design for Large Screens | 5 | 3 | 2 | 10 | |
| Interface Design for Laptops | 2 | 4 | 3 | 9 | |
| Customized Photovoltaic Layout Plan | 5 | 4 | 5 | 14 | |
| Interaction Methods | Investment Plan Generation | 5 | 4 | 5 | 14 |
| Scene Roaming and Query | 5 | 4 | 4 | 13 | |
| Scene Display Switching | 5 | 5 | 4 | 14 | |
| Individual Buildings’ Detailed Information | 5 | 5 | 5 | 15 | |
| Adjustment of Installation Plans for Key Buildings | 2 | 3 | 5 | 10 | |
| Dynamic Effects for Interface Interaction | 5 | 3 | 3 | 9 |
| Parameters | Value |
|---|---|
| 90% | |
| 80.96% | |
| 80% | |
| 3.16 RMB/kW | |
| 0.047 RMB/kW | |
| for Residential | 0.5580 RMB/kW |
| for Commercial | 0.6907 RMB/kW |
| Classification | Data Header | Specific Value | Representative Meaning |
|---|---|---|---|
| Geographic Data for Reproducing Urban Architectural Models | Geometry Information Stored in .shp file | The longitude and latitude of each vertex of the building. | Different 3D modeling software uses this longitude and latitude information to generate models of the same geographical location. |
| ID | 1 | Identity Number of Each Building | |
| Elevation (m) | 3 | Building Height (determine the height of each building during white mold model slice generation in CesiumLab v0.25, Cesium GS, Inc., Salt Lake City, UT, USA.) | |
| Basic Data for Power Generation Calculations | FaceNum | 8 | Number of Building Planes |
| CenterX/Y/Z | 11,355,522.75, 11,355,506.25, 11,355,522.75, 11,355,506.25, 11,355,523.5, 11,355,531.0, 11,355,522.0, 11,355,498.0, 2,215,085.1875, 2,215,092.125, 2,215,085.1875, 2,215,092.125, 2,215,086.75, 2,215,081.75, 2,215,083.625, 2,215,095.625, 2,215,093.75, 2,215,090.5, 0.0, 0.0, 3.0, 3.0, 1.5, 1.5, 1.5, 1.5, 1.5, 1.5 | Plane Center Point Coordinates | |
| VectorX/Y/Z | 0.0, 0.0, 0.0, 0.0, 0.3807, 0.8321, −0.3887, −0.8517,0.0, 0.0, 0.0, 0.0, 0.9247, −0.5547, −0.9214, 0.5241, 0.9162, −0.9247, −1.0, −1.0, 1.0, 1.0, 0.0, 0.0, 0.0, 0.0, 0.0, 0.0 | Plane Normal Vector | |
| Rad (kWh/m2) | 283.7222, 283.7222, 1598.8638, 1598.8384, 425.9791, 922.2407, 960.1941, 665.7827 | Solar Radiation Results for Each Plane (Considering occlusions) | |
| Area (m2) | 61.875, 64.125, 61.875, 64.125, 55.1543, 10.8167, 52.0967, 11.4483 | Total Area of Each Plane | |
| Direction | Ground, Ground, Roof, Roof, North, East, South, West, North, South | The Orientation of Each Plane (Identified using VectorXYZ in Python 3.9) | |
| Computed Data for Display Mapping | RoofCap (kW) | 16.30588235 | Roof Facade Installed Capacity |
| NorthCap (kW) | 13.9178470588235 | North Facade Installed Capacity | |
| EastCap (kW) | 1.39980823529412 | East Facade Installed Capacity | |
| WestCap (kW) | 1.48154470588235 | West Facade Installed Capacity | |
| SouthCap (kW) | 13.8795411764706 | South Facade Installed Capacity | |
| RoofPower (kWh) | 37384.48032 | Roof Power Generation | |
| NorthPower (kWh) | 8008.86552001925 | North Facade Power Generation | |
| EastPower (kWh) | 1852.73434408509 | East Facade Power Generation | |
| WestPower (kWh) | 1404.61523382367 | West Facade Power Generation | |
| SouthPower (kWh) | 19,217.9880733783 | South Facade Power Generation | |
| BuildType | 1 | 1 for Residential Buildings, 2 for Public Buildings. |
| Generation of Each Face (TWh/year) | Capacity of Each Face (GW) | ||||||||
|---|---|---|---|---|---|---|---|---|---|
| Roof | South | East | West | North | Roof | South | East | West | North |
| 22.94 | 4.52 | 10.54 | 4.20 | 3.97 | 17.98 | 17.75 | 17.71 | 8.61 | 8.54 |
| Building PV Costs (Billion RMB) | Building PV Incomes (Billion RMB/year) | PBP (year) | Power Demand (TWh/year) | Self-Use Rate (%) | |||||
| 223 | 42.2 | 5.3 | 75.5 | 61.2 | |||||
| Index | Height (m) | Area (m2) | PBP (Year) | Power (GWh/Year) | Capacity (MW) | ||||||||
|---|---|---|---|---|---|---|---|---|---|---|---|---|---|
| Roof | South | East | West | North | Roof | South | East | West | North | ||||
| 1 | 54 | 478,122 | 4.87 | 79.16 | 4.73 | 2.95 | 2.91 | 2.20 | 56.92 | 5.33 | 4.04 | 4.03 | 5.43 |
| 2 | 54 | 478,122 | 4.88 | 79.16 | 4.48 | 2.95 | 2.89 | 2.20 | 56.92 | 5.33 | 4.04 | 4.03 | 5.43 |
| 3 | 18 | 148,161 | 4.79 | 24.52 | 1.64 | 0.28 | 0.29 | 0.65 | 17.64 | 1.87 | 0.43 | 0.42 | 1.87 |
| 4 | 15 | 106,328 | 4.82 | 17.31 | 0.39 | 0.33 | 0.23 | 0.32 | 12.66 | 0.71 | 0.44 | 0.44 | 0.91 |
| 5 | 12 | 94,659 | 4.71 | 15.64 | 0.56 | 0.31 | 0.22 | 0.19 | 11.27 | 0.70 | 0.42 | 0.42 | 0.70 |
| 6 | 12 | 91,042 | 4.68 | 14.99 | 0.50 | 0.33 | 0.33 | 0.19 | 10.84 | 0.59 | 0.47 | 0.48 | 0.59 |
| 7 | 21 | 76,910 | 5.67 | 12.66 | 1.51 | 0.27 | 0.62 | 0.54 | 9.16 | 1.92 | 0.61 | 0.88 | 2.25 |
| 8 | 21 | 81,569 | 3.73 | 12.81 | 0.54 | 0.44 | 0.45 | 0.81 | 9.71 | 0.95 | 1.06 | 0.58 | 3.14 |
| 9 | 3 | 86,288 | 4.35 | 14.28 | 0.30 | 0.00 | 0.00 | 0.17 | 10.27 | 0.33 | 0.00 | 0.00 | 0.33 |
| 10 | 12 | 80,151 | 4.70 | 13.24 | 0.53 | 0.20 | 0.19 | 0.26 | 9.54 | 0.68 | 0.31 | 0.29 | 0.68 |
Disclaimer/Publisher’s Note: The statements, opinions and data contained in all publications are solely those of the individual author(s) and contributor(s) and not of MDPI and/or the editor(s). MDPI and/or the editor(s) disclaim responsibility for any injury to people or property resulting from any ideas, methods, instructions or products referred to in the content. |
© 2025 by the authors. Licensee MDPI, Basel, Switzerland. This article is an open access article distributed under the terms and conditions of the Creative Commons Attribution (CC BY) license (https://creativecommons.org/licenses/by/4.0/).
Share and Cite
Chen, X.; Long, H.; Xia, Y. Development of a Visualization Platform for Power Generation Analysis in Urban Building-Integrated Photovoltaic Systems. Energies 2025, 18, 2409. https://doi.org/10.3390/en18102409
Chen X, Long H, Xia Y. Development of a Visualization Platform for Power Generation Analysis in Urban Building-Integrated Photovoltaic Systems. Energies. 2025; 18(10):2409. https://doi.org/10.3390/en18102409
Chicago/Turabian StyleChen, Xi, Hai Long, and Ye Xia. 2025. "Development of a Visualization Platform for Power Generation Analysis in Urban Building-Integrated Photovoltaic Systems" Energies 18, no. 10: 2409. https://doi.org/10.3390/en18102409
APA StyleChen, X., Long, H., & Xia, Y. (2025). Development of a Visualization Platform for Power Generation Analysis in Urban Building-Integrated Photovoltaic Systems. Energies, 18(10), 2409. https://doi.org/10.3390/en18102409