Review

Research Progress on Nano-Confinement Effects in Unconventional Oil and Gas Energy—With a Major Focus on Shale Reservoirs

1
University of Chinese Academy of Sciences, Beijing 100049, China
2
Institute of Porous Flow & Fluid Mechanics, Chinese Academy of Sciences, Langfang 065007, China
3
State Key Laboratory of Enhanced Oil Recovery, Research Institute of Petroleum Exploration and Development, China National Petroleum Corporation (CNPC), Beijing 100083, China
*
Author to whom correspondence should be addressed.
Energies 2025, 18(1), 166; https://doi.org/10.3390/en18010166
Submission received: 4 December 2024 / Revised: 24 December 2024 / Accepted: 30 December 2024 / Published: 3 January 2025
(This article belongs to the Section H: Geo-Energy)

Abstract

:
Compared to conventional reservoirs, the abundant nanopores developed in unconventional oil and gas reservoirs influence fluid properties, with nano-confinement effects. The phase behavior, flow characteristics, and solid–liquid interactions of fluids are different from those in conventional reservoirs. This review investigates the physical experiments, numerical simulations, and theoretical calculation methods used in the study of nano-confinement effects in unconventional oil and gas energy. The impact of different methods used in the analysis of fluid phase behavior and movement in nanopores is analyzed. Nanofluidic, Monte Carlo method, and modified equation of state are commonly used to study changes in fluid phase behavior. Nano-confinement effects become significant when pore sizes are below 10 nm, generally leading to a reduction in the fluid’s critical parameters. The molecular dynamic simulation, Monte Carlo, and lattice Boltzmann methods are commonly used to study fluid movement. The diffusion rate of fluids decreases as nanopore confinement increases, and the permeability of nanoscale pores is not only an inherent property of the rock but is also influenced by pressure and fluid–solid interactions. In the future, it will be essential to combine various research methods, achieve progress in small-scale experimental analysis and multiscale simulation.

1. Introduction

Currently, with the continuous advancement of exploration and development technologies, unconventional oil and gas energy, including shale oil, shale gas, tight oil, tight gas, and coalbed methane, as shown in the Figure 1, are gradually being developed and utilized [1]. Among them, the technically recoverable resources of low-maturity and medium- to high-maturity shale oil globally are substantial, amounting to 209.9 billion tonnes and 41.3 billion tonnes, respectively [2].
Research on unconventional oil and gas energy is highly significant, offering essential support for energy security and economic growth. As conventional oil and gas resources gradually deplete, unconventional oil and gas energy emerges as a key choice for optimizing energy structures, thanks to its abundant reserves and broad distribution [3]. Data from the U.S. Energy Information Administration estimate that global recoverable shale gas reserves amount to about 214 × 1012 m3. Furthermore, unconventional oil constitutes a larger share within formations compared to conventional oil reservoirs. The World Energy Council identifies the U.S. as the world’s largest holder of tight oil reserves, followed by China, Argentina, and Australia [4,5]. Table 1 lists the energy characteristics of different countries. Developing these resources can significantly decrease reliance on imported energy and improve regional energy independence, as exemplified by the U.S. shale revolution [6]. Additionally, the development of unconventional oil and gas has significantly driven economic growth, creating numerous jobs through technological innovations such as horizontal drilling and hydraulic fracturing [7]. However, the development of unconventional resources faces challenges such as technical and economic feasibility, requiring further research to improve extraction efficiency [8].
Unconventional reservoirs, compared to conventional ones, are generally found at greater depths, with well-developed nanopores and permeabilities typically less than 0.1 × 10⁻³ μm2 [9]. After reservoir modification, these unconventional reservoirs also exhibit clear multiscale seepage characteristics. The presence of nanopores creates differences between the development of unconventional and conventional energy resources, leading to changes in the physical properties and flow characteristics of fluids in unconventional reservoirs. Therefore, research on fluids within nanopores has garnered considerable attention from researchers [10].
According to the International Union of Pure and Applied Chemistry definitions and classifications, pores with a radius of less than 2 nm are defined as micropores, those with a radius between 2 nm and 50 nm as mesopores, and those with a radius larger than 50 nm as macropores [11]. In the microscopic scale of nanopores within unconventional reservoirs, particularly in micropores, the size of fluid molecules (e.g., methane with a diameter of 0.38 nm, carbon dioxide with a diameter of 0.33 nm [12]) is comparable to the pore size, leading to changes in fluid phase behavior, movement patterns, and fluid–solid interactions. These differences are significant when compared to the micron-sized pores of macroscopic conventional reservoirs and they greatly influence the understanding of microscopic mechanisms and the selection of development methods in unconventional oil and gas energy exploitation. Nanofluid mechanics is an emerging field of scientific research that has not yet been fully explored by humans. Understanding nanoscale fluid flow mechanisms is a crucial foundation for improving the effectiveness of unconventional oil and gas energy development.
However, there is currently a lack of comprehensive summaries and analyses of research techniques and results related to nano-confinement effects, which are essential for advancing our understanding of fluid mechanisms in unconventional oil and gas energy. This paper investigates the research methods used in studying nano-confinement effects in unconventional oil and gas energy, and provides a summary and analysis of the physical properties and movement characteristics of reservoir fluids under these effects (Figure 2). The first section primarily discusses the impacts of nano-confinement effects on different aspects of unconventional oil and gas energy development. Section 2, Section 3 and Section 4 focus on the physical experiments, numerical simulations, and theoretical calculation methods used to study nanopores, fluids, and their interactions, along with an analysis of the advantages and disadvantages of each method and their specific applications in research. The fifth section provides a comparative analysis of the results obtained from different research methods in studying the effects of nano-confinement, offering a systematic understanding of the differences between these methods in practical research. The final section summarizes the key findings and suggests future trends in the development of unconventional oil and gas energy technologies, with the goal of advancing the understanding of fluid properties and flow mechanisms under nano-confinement effects, thereby enhancing the efficient development and utilization of unconventional oil and gas energy.

2. Physical Properties and Flow Characteristics of Fluids at the Nanoscale

In unconventional reservoirs, the fluid phase behavior and movement patterns within nanopores differ from those in conventional reservoirs, influencing the development and utilization of unconventional oil and gas energy. Figure 3 illustrates images of nanoscale pores in unconventional reservoirs. In this section, the paper outlines the influence of nano-confinement effects on fluid physical properties and flow characteristics, with the goal of improving the understanding of mechanisms essential for the effective development of unconventional oil and gas energy.

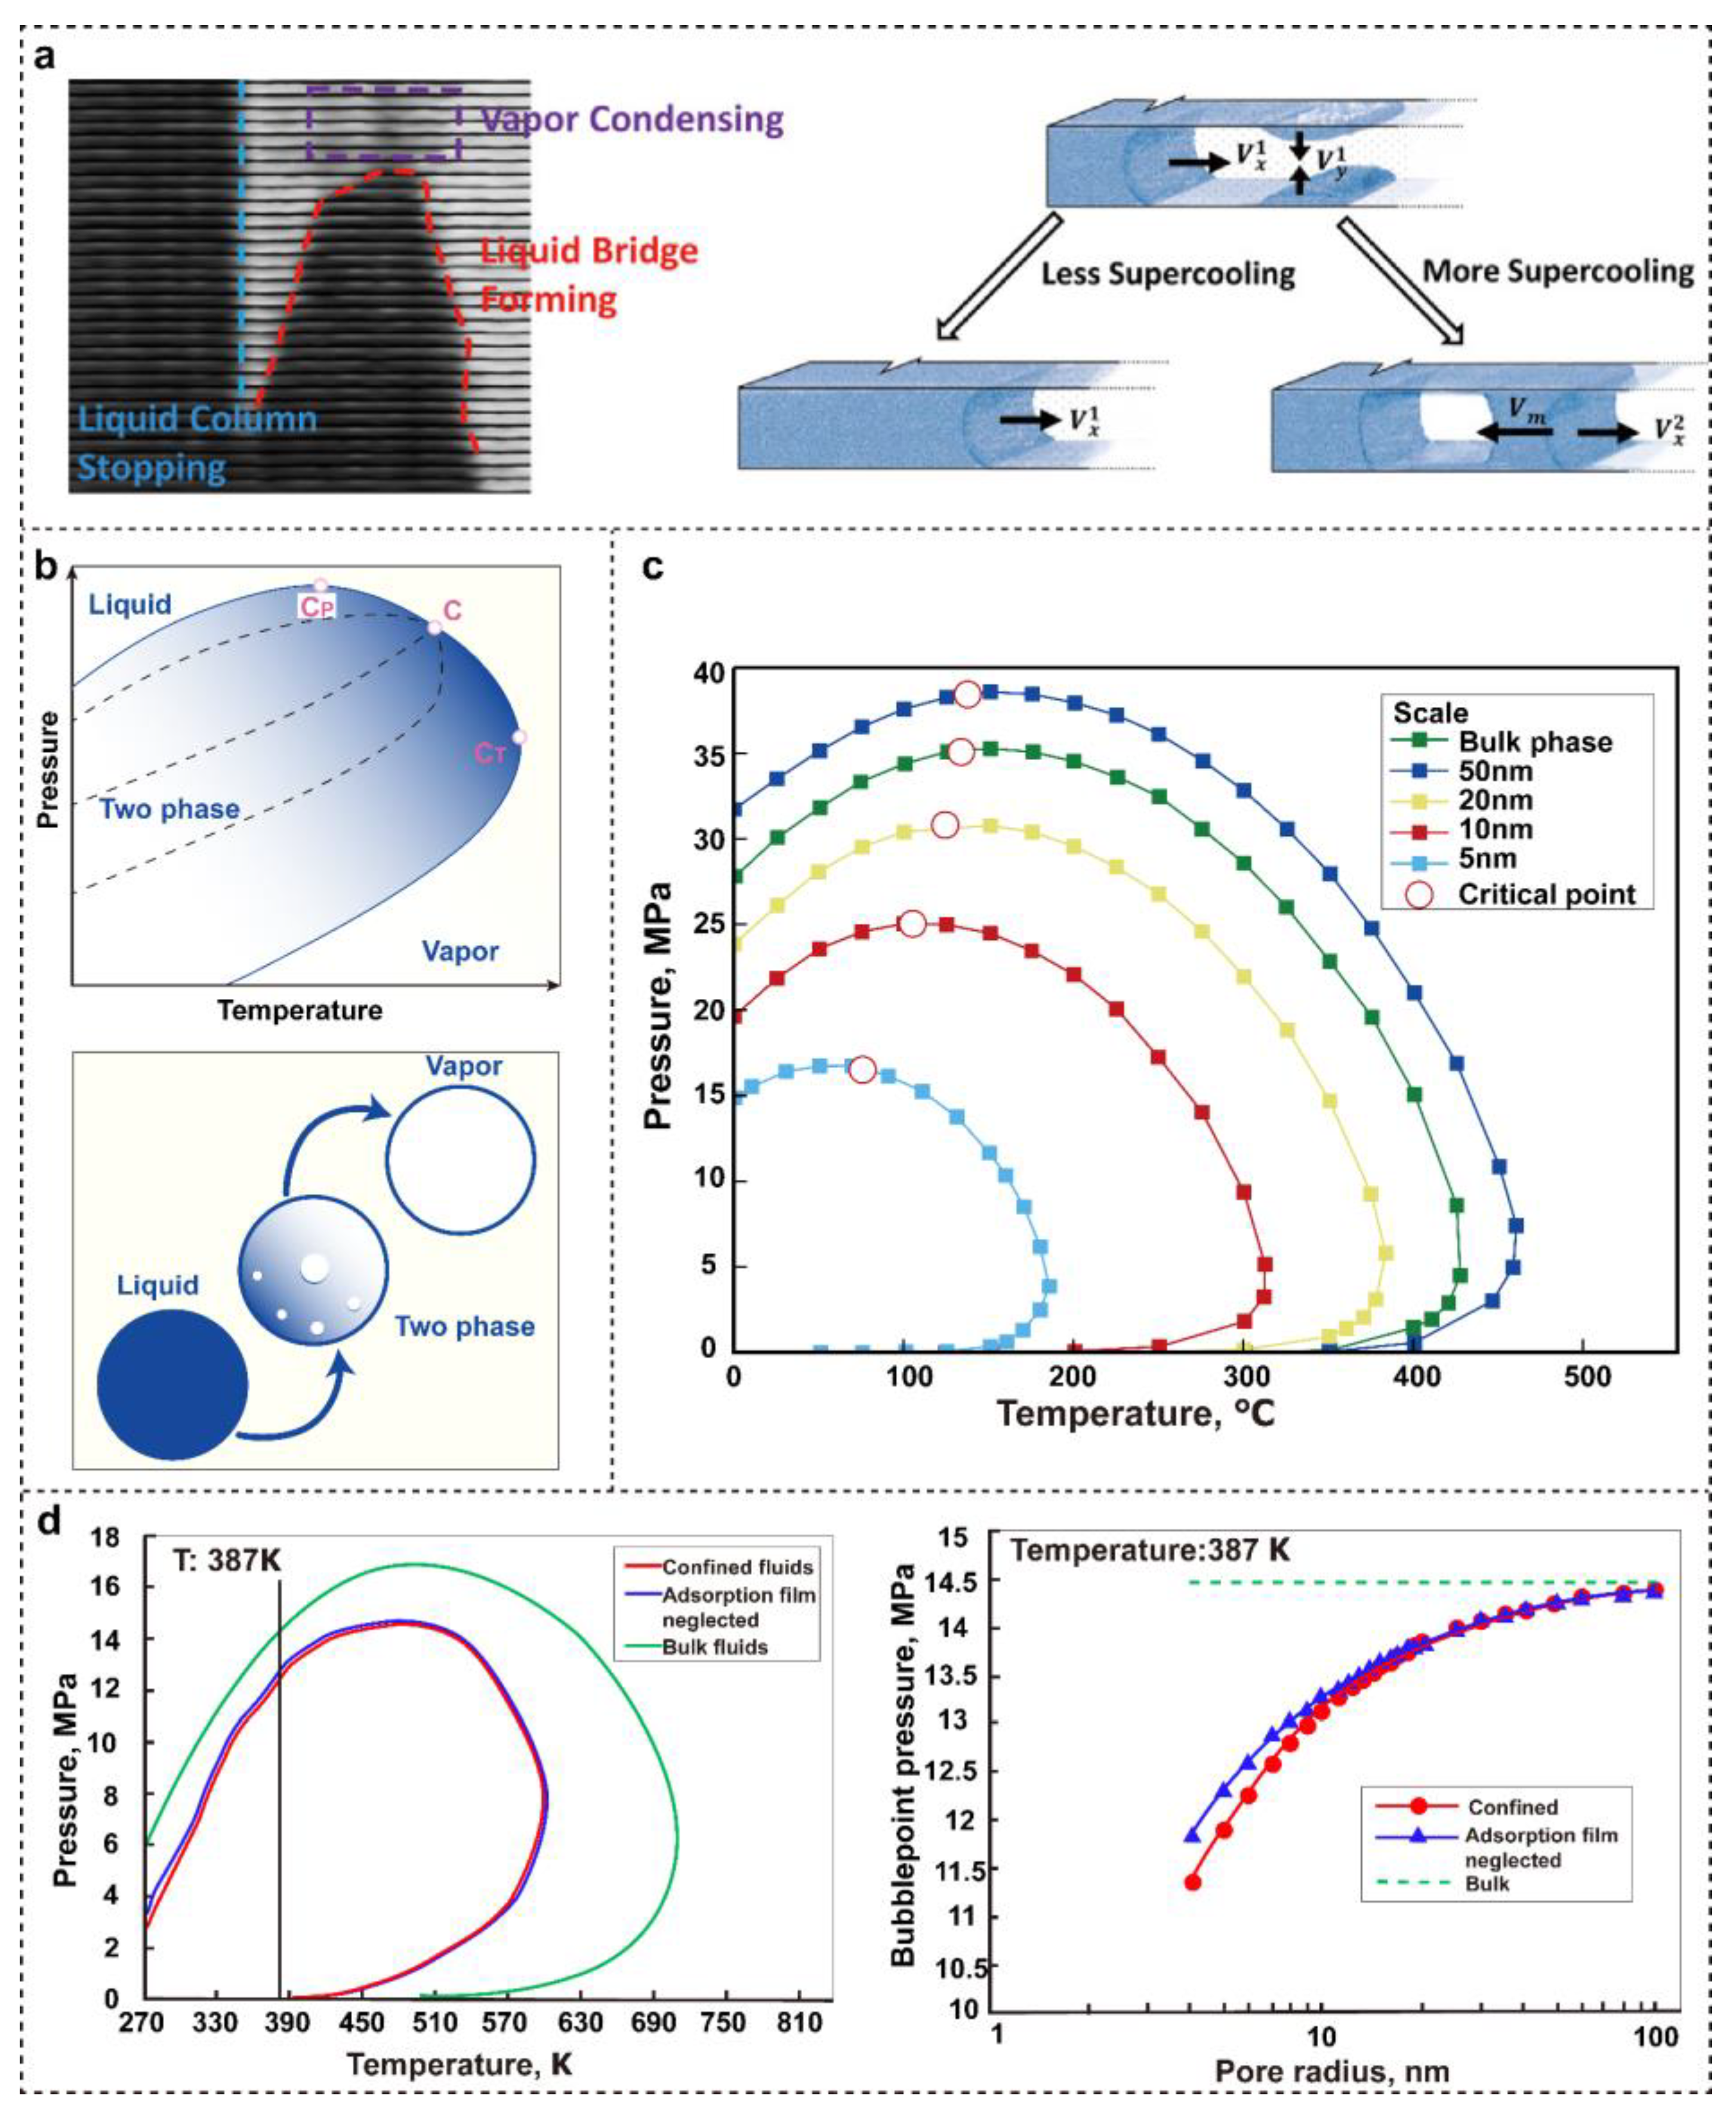
2.1. Phase Behavior of Fluids

Nano-confinement effects have a certain impact on fluid phase behavior which is shown in Figure 4, and changes in phase behavior subsequently affect the effective development and utilization of unconventional oil and gas energy [16,17]. Components under nano-confinement effects exhibit lower critical parameters compared to the bulk phase, with deviations increasing as pore size decreases [18,19]. This is because, under nano-confinement effects, solid–liquid interactions within pores are strong, mainly manifested by a high proportion of fluid adsorption, which leads to changes in effective pore size and contact angle, thereby enhancing capillary forces [20]. Capillary pressure significantly affects the mass transfer behavior and thermodynamic properties of oil and gas, which in turn influences the thermodynamic phase behavior, leading to differences between the physical properties of fluids in nanopores and those of the bulk phase. Additionally, these phase behaviors also affect fluid flow in porous media, ultimately impacting energy production [21].
Unconventional oil and gas energy consist of multi-component hydrocarbons. Compared to single-component substances, the phase diagram composed of pressure and temperature (P-T) for multi-component substances features three regions and critical points (Figure 4b): the liquid phase region, the two-phase coexistence region, and the gas phase region; the critical point (the convergence of the bubble point line and the dew point line), the critical condensate pressure point (the highest pressure point at which both phases can coexist), and the critical condensate temperature point (the highest temperature point at which both phases can coexist). Under nano-confinement effects, the P-T phase diagram of shale oil, as compared to conventional reservoirs, exhibits a contraction trend toward the vapor–liquid coexistence region, with the bubble point pressure, upper dew point pressure, critical pressure, and critical temperature of shale oil significantly lowered, and the critical point is shifted to the lower left, which is shown in Figure 4c,d [16,21,22].

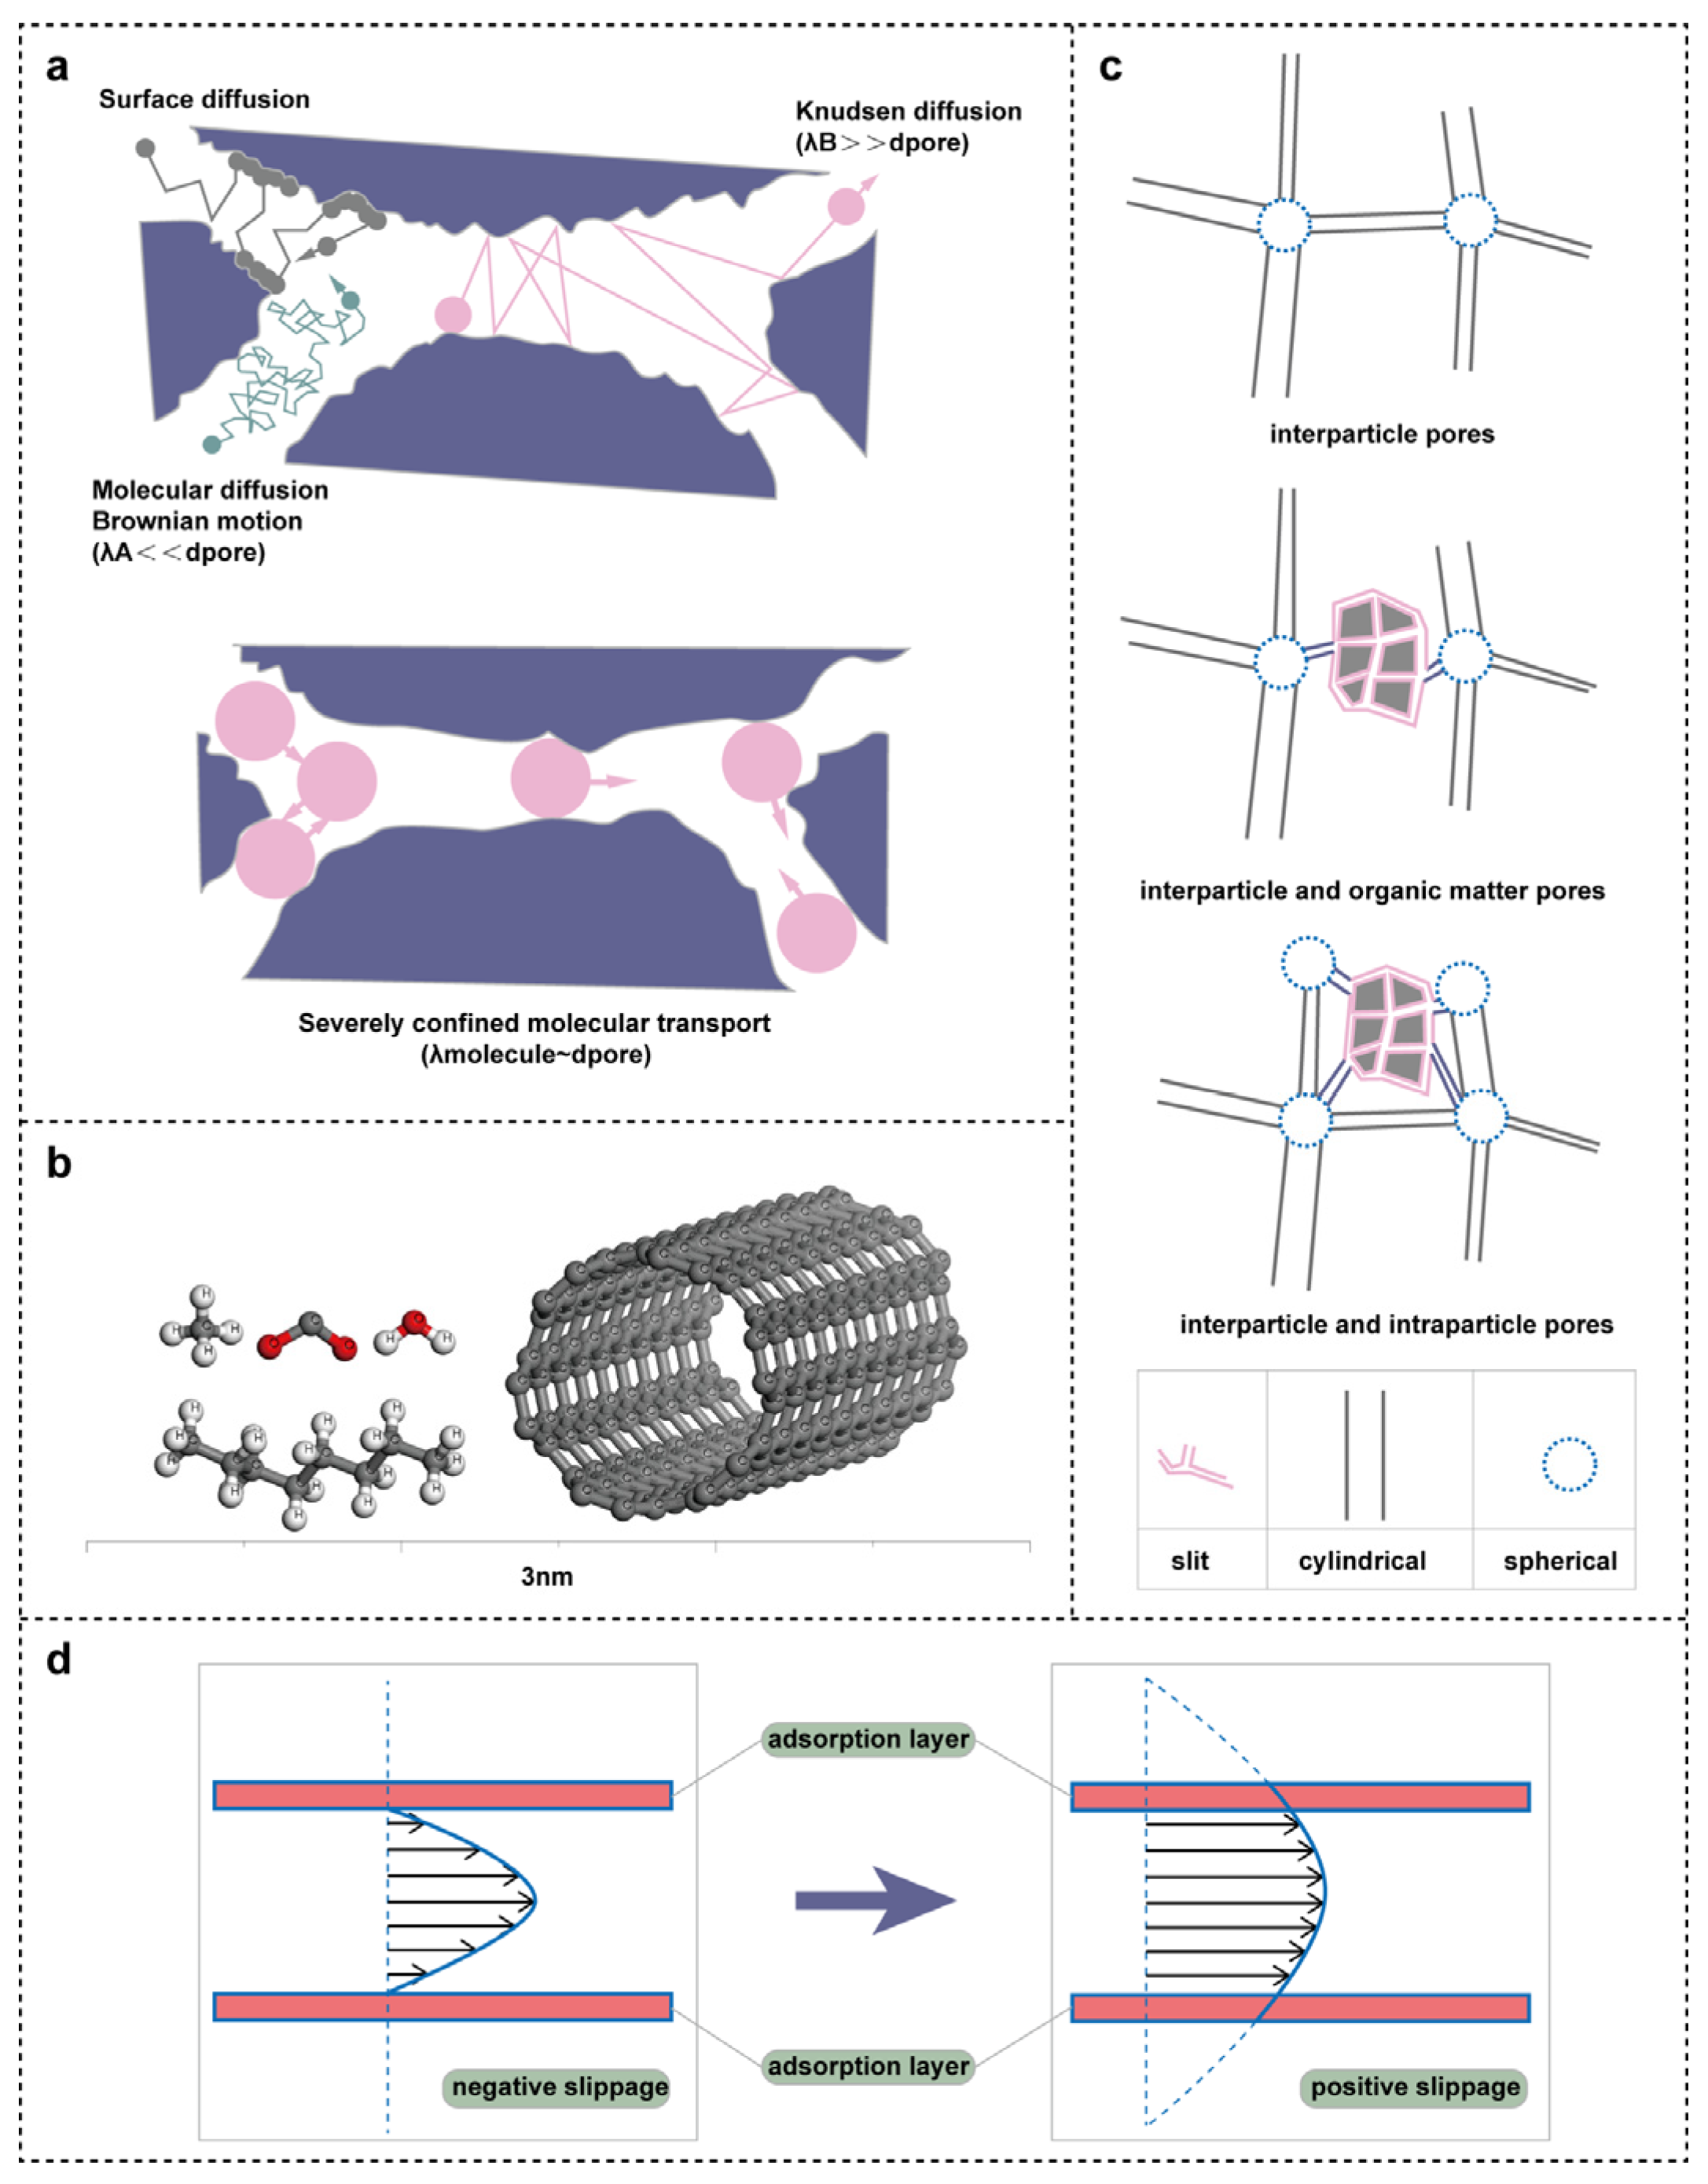
2.2. Fluid Flow Mechanisms

Fluid movement occurs as convection within the pores, flow along the pore walls, and diffusion. Under the influence of nano-confinement effects, molecules undergo three types of diffusion within real channels: bulk diffusion, Knudsen diffusion, and surface diffusion (Figure 5a). These three diffusion mechanisms combine to collectively influence the overall diffusion behavior within a single pore. In an equivalent resistance model, molecular bulk diffusion and Knudsen diffusion occur in series, while surface diffusion occurs in parallel to these two [23]. For gas molecular movement in unconventional reservoirs, Knudsen diffusion and surface diffusion are the most extensively studied. When the molecular mean free path λ is of the same order of magnitude as the pore size d, the collision frequency between molecules and pore walls exceeds that between molecules themselves. Figure 5b illustrates the diagram of the relative sizes of methane, carbon dioxide, water, octane molecules, and carbon nanotubes. In this scenario, molecules primarily collide with the pore walls rather than with each other [24]. Additionally, in organic nanopores, the boundary slip velocity of shale gas is positively correlated with pressure differential and the Knudsen number, and the fluid velocity perpendicular to the pore direction is non-zero [25]. Furthermore, wall interactions affect molecular collisions, rebounds, and movements, leading to alterations in fluid velocity distribution under nano-confinement effects [26]. Table 2 provides a comparative analysis of the features of three diffusion mechanisms.
However, in real materials, pore structures possess highly complex geometries. Knudsen diffusion typically considers smooth cylindrical channels, which are far from the actual pore structures found in reservoirs. Therefore, the relationship between pore shape and diffusion and adsorption under nano-confinement effects is a critical research topic (Figure 5c) [32]. In terms of adsorption measurement, Gibbs introduced the concept of absolute adsorption capacity [33], which is primarily measured through isothermal adsorption experiments, including volumetric and gravimetric methods. When the size of the diffusing molecules is comparable to the pore size, the complexity increases. Therefore, studying the diffusion coefficient of fluids in nanoscale pores is also crucial [23]. Compared to the traditional volumetric and gravimetric methods for measuring excess adsorption, the nuclear magnetic resonance method offers a novel approach by directly measuring adsorption capacity through the relaxation time contrast between gases inside and outside nanopores [34].
For liquids, the permeability of unconventional reservoirs typically ranges from nanodarcies to microdarcies. Under the influence of nano-confinement effects, fluid flow deviates from Darcy’s law, leading to increased attention on modifying the traditional linear Darcy relationship [35,36]. Furthermore, since fluids in nanopores flow at the molecular level, the continuum assumption becomes invalid, rendering the Navier–Stokes equations inapplicable (Equation (1)). However, given the very small free path of oil molecules, the continuum assumption remains valid for simulating fluid flow if slip and adsorption effects are correctly accounted for during the simulation [37].
ρ ( u t + ( u · ) u ) = p + μ 2 u + F
where ρ is the fluid density, u is the velocity vector, t is the time, p is the pressure, μ is the kinetic viscosity coefficient, and F is the external force.
Moreover, the influence of wall wettability on fluid flow is a critical aspect of unconventional oil development. Shale oil reservoirs are characterized by a complex pore structure with abundant nanoscale organic and inorganic pores. Wall interactions during fluid movement within pores significantly impact fluid flow in nanoporous media. The slip length of fluids along the wall varies depending on the wettability of the adsorbed phase within nanopores, thereby affecting the flow behavior (Figure 5d) [38]. Currently, low salinity waterflooding, surfactant flooding and CO2 flooding are commonly used to reduce the impact of wettability on crude oil flow [39,40,41].
Figure 5. Changes in fluid flow mechanisms under nano-confinement effects. (a) Different diffusion mechanisms in porous media (molecular, Knudsen and surface diffusion) [23]. (b) Diagram of the relative sizes of methane, carbon dioxide, water, octane molecules and carbon nanotubes. (c) Schematic of the three types of pore network and three types of pore shapes [32]. (d) Schematic diagram of the slip phenomenon in fluid flow within nanopores [38].
Energies 18 00166 g005

2.3. Changes in Other Areas

2.3.1. High-Viscosity Layer near the Wall

Compared to conventional reservoirs, shale and tight reservoirs have well-developed nanopores with a larger specific surface area. The flow of fluid within these pores is influenced not only by the fluid’s physical properties and the material of the reservoir rock but also by interactions with the pore walls under nano-confinement effects. As the pore size decreases, nano-confinement effects become more pronounced, especially when the size is below 10 nm. The interactions between fluid molecules and the pore walls become dominant, differing significantly from bulk fluid behavior, and the effects of surface–fluid interactions cannot be ignored [42]. Because of the strong solid–liquid interactions, the fluid demonstrates a higher adsorption percentage, with molecules forming a high-viscosity layer near the walls, as illustrated in Figure 6 [43,44].
The number of adsorption layers depends on the pore size and the composition of the fluid. The adsorption characteristics are reflected in the density distribution within the nanopores [45]. Figure 6 shows the fluid density distribution characteristics under nano-confinement effects, quantitatively analyzed using molecular simulation methods. In addition, there is a difference between the components of the fluid in the nanopore and the bulk phase [46]. This phenomenon affects not only the efficient development and utilization of unconventional oil and gas energy but also the accurate evaluation and prediction of recoverable reservoir reserves [47].

2.3.2. Imbibition

Imbibition is a common fluid flow phenomenon in porous media that occurs under the influence of capillary forces or osmotic pressure. In the context of unconventional oil and gas energy huff-puff development, imbibition plays a critical role [37]. Due to the influence of nano-confinement effects, fluids in unconventional reservoirs experience stronger capillary forces, leading to more pronounced spontaneous imbibition. Hydraulic fracturing is the predominant method for developing unconventional oil and gas resources, with evidence showing that fractures significantly benefit the development process [48]. Hydraulic fracturing helps increase the contact area between the matrix and the imbibing displacement fluid, facilitating fluid imbibition and replacement, thereby enhancing oil recovery [49]. Imbibition occurs in a multiscale flow space, primarily within the matrix, flowing through bedding planes to fractures and the wellbore. Jiang Tingxue et al. suggested that fractures enhance imbibition effects, a viewpoint validated by Yang Zhengming et al. through comparative studies between artificial fractured cores and matrix cores [37,50]. Additionally, Dehghanpour et al. discovered through experiments that as imbibition progresses, pore pressure increases, promoting the extension of existing fractures [51].
Moreover, in nanopores, the impact of surface roughness on fluid flow is more significant, and the dynamic contact angle between fluid and solid further influences fluid imbibition in nanopores. In micropores, the contact angle of fluids is independent of pore size. However, in nanopores, physical properties such as contact angle and surface tension are constrained by the pore size, complicating the calculation of capillary forces and the mechanisms of imbibition [52,53]. Surfactants are frequently employed in research to modify the contact angle and surface tension between the fluid and the nanopore walls, thereby promoting imbibition [9]. Surfactants are primarily used to reduce interfacial tension during oil displacement and alter wettability. Currently, surfactants employed in imbibition processes fall into three categories: cationic surfactants, anionic surfactants, and nonionic surfactants. In shale reservoir development, anionic surfactants are commonly used because positively charged organic matter in crude oil tends to adsorb onto positively charged shale reservoirs through electrostatic interactions. Anionic surfactants form ion pairs with these organic compounds, facilitating desorption and improving surface wettability [9,54]. In carbonate reservoirs, cationic surfactants are typically used to alter pore wall wettability while reducing adsorption [55]. Moreover, imbibition correlates with crude oil recovery, where oil recovery increases as water flooding pressure rises, but recovery by imbibition in nanopores decreases [56]. Fracturing increases the contact area between the matrix and the displacing fluid, encouraging imbibition and improving oil recovery rates [48,50].

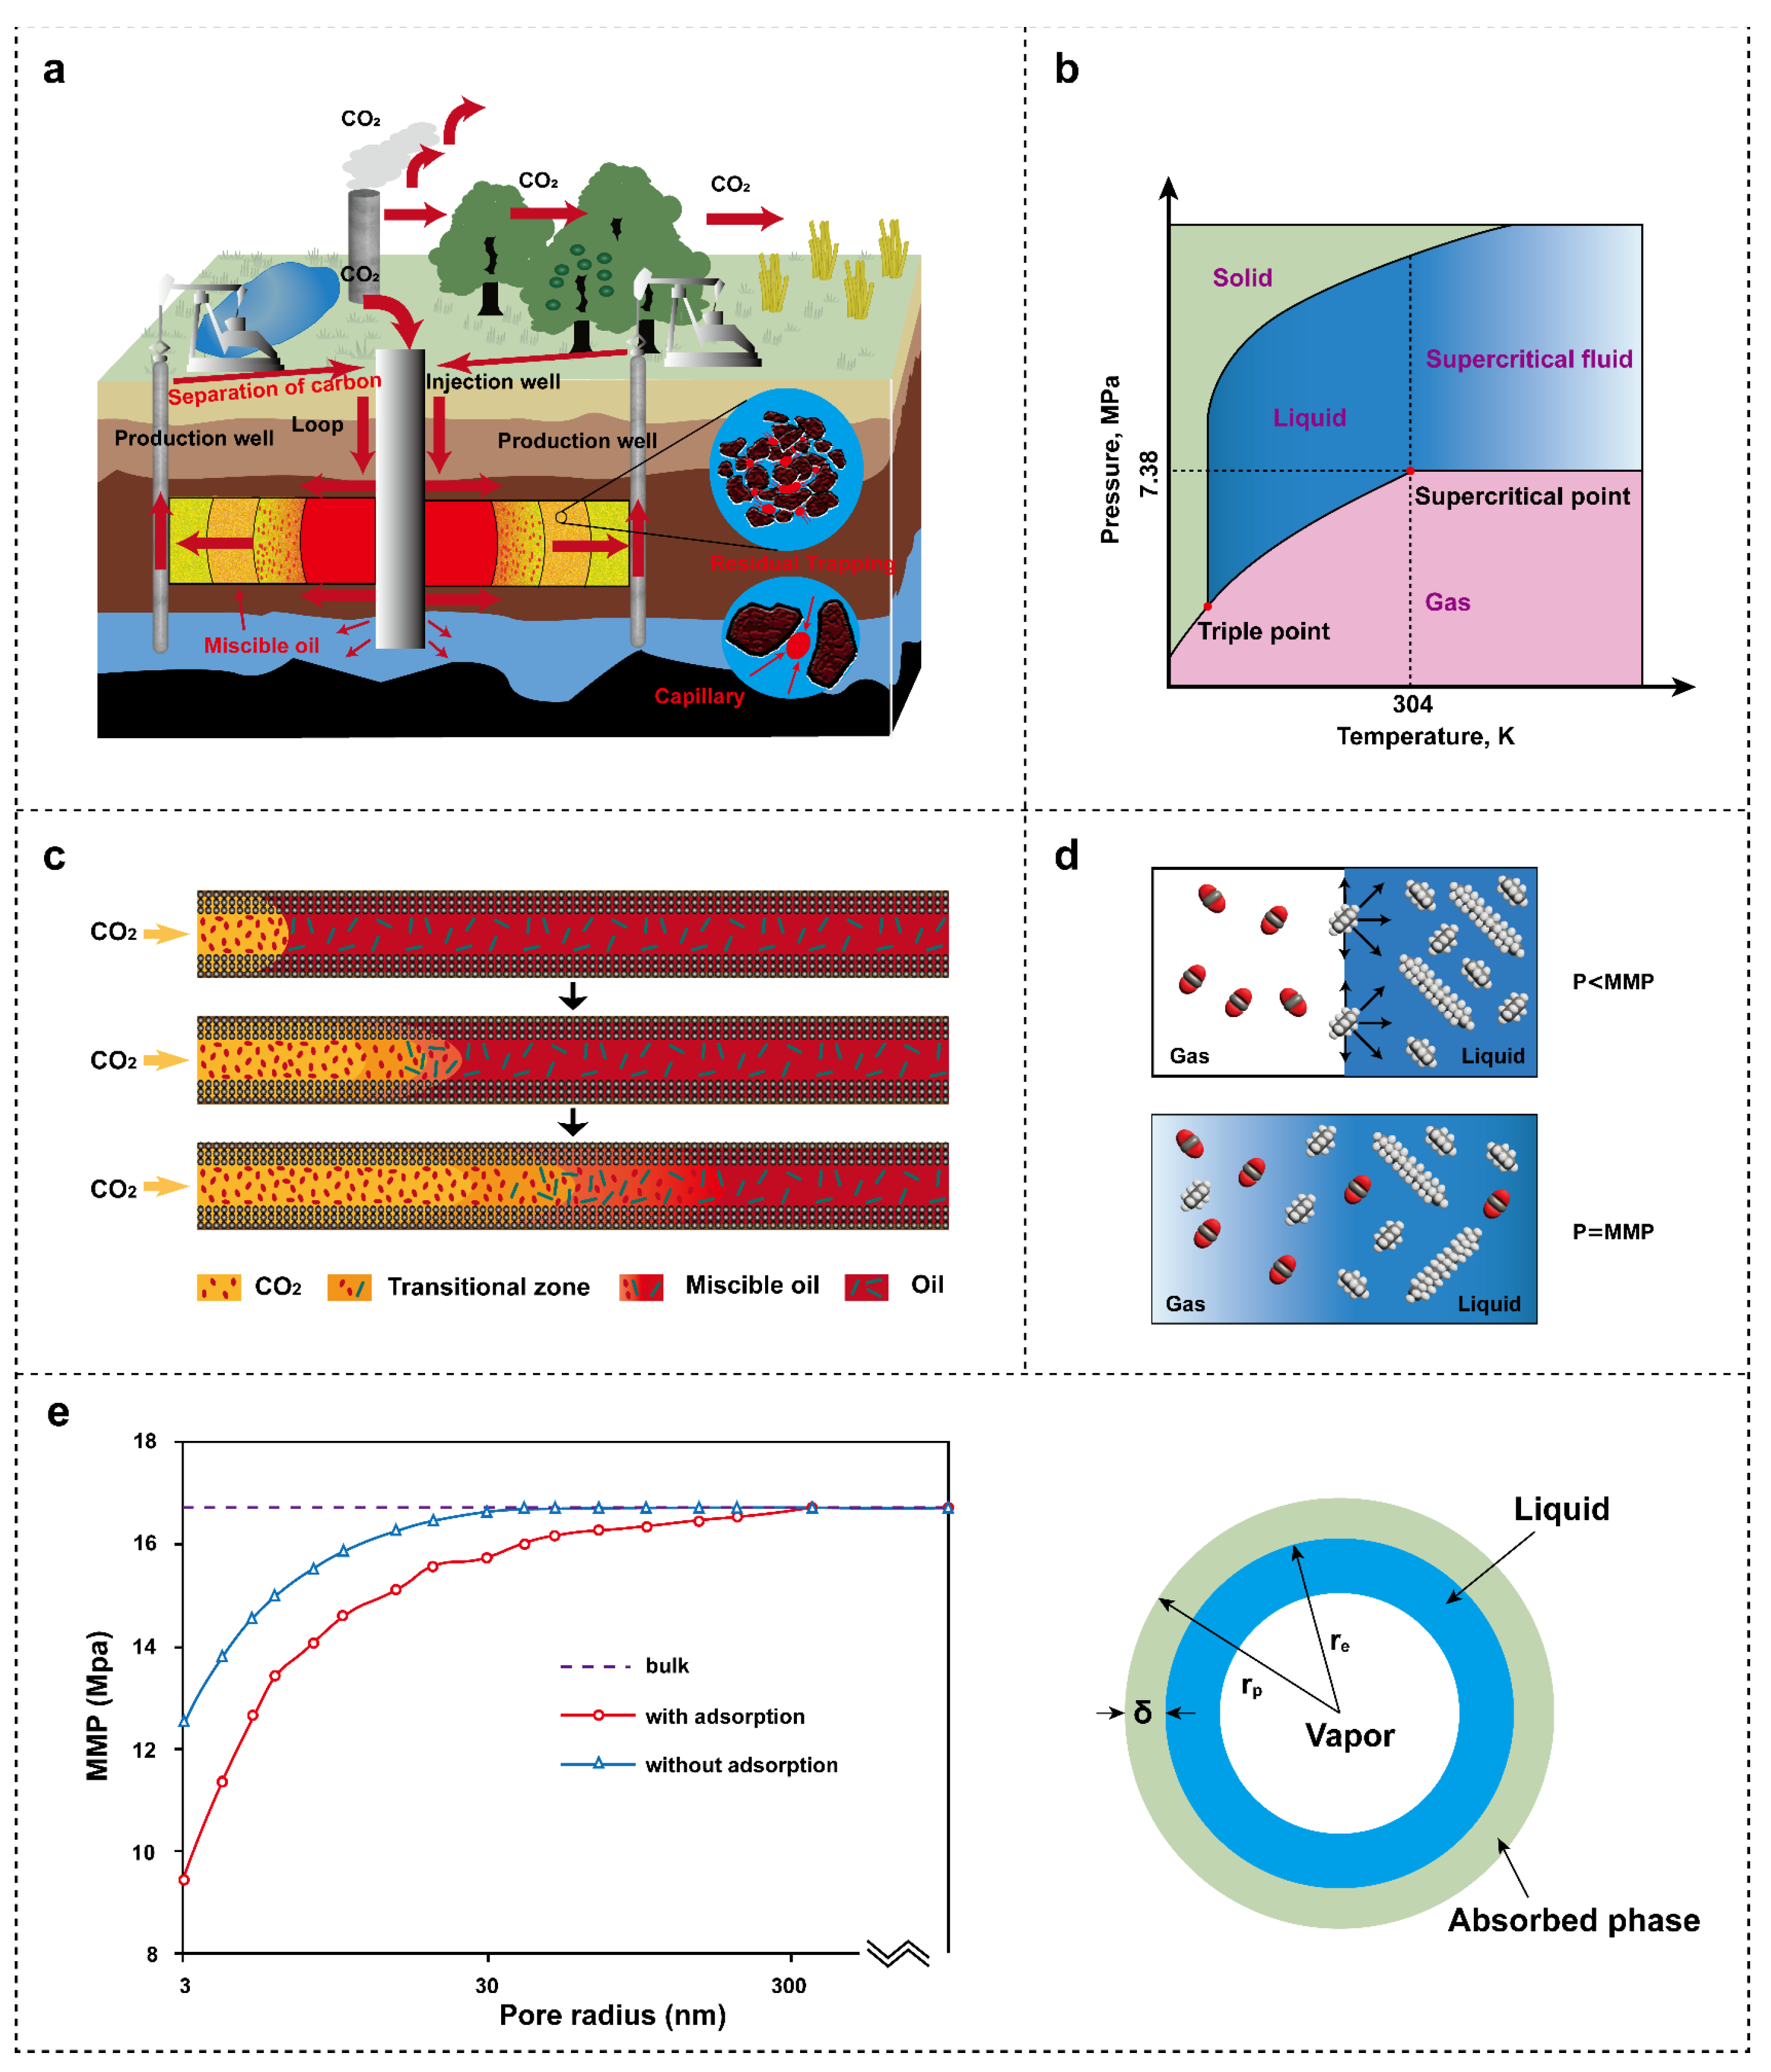
2.3.3. Minimum Miscibility Pressure

In the context of global climate change, carbon capture, utilization, and storage (CCUS) have garnered growing attention, and CO2 flooding is recognized as an effective carbon utilization method that enhances unconventional oil and gas energy development efficiency (Figure 7a). In the reservoir state, CO2 is in a supercritical state and is more likely to form a miscible phase with crude oil (Figure 7b). The key to enhancing oil recovery through CO2 flooding is the miscibility with crude oil (Figure 7c), which lowers interfacial tension [57]. Minimum miscibility pressure (MMP) is an important parameter in energy development. When the pressure is below the MMP, diffusion becomes the main driving force for mass transfer between CO2 and oil. When the pressure is above MMP, CO2 gradually becomes miscible with crude oil, the two-phase interface disappears, capillary forces decrease, and crude oil mobility improves (Figure 7d) [58]. In recent years, studies on enhancing oil recovery in nanopores using CO2 flooding have been on the rise [59,60]. The nano-confinement effects on fluid behavior cannot be ignored (Figure 7e). In nanopores, light components are more likely to enter the oil phase, reducing the compositional and density differences between the gas and liquid phases, which facilitates CO2 miscibility with shale oil and enhances oil recovery [61]. Additionally, the interfacial tension of confined fluids is closely related to the strength of nano-confinement effects. As nano-confinement effects intensify, interfacial tension decreases, making it easier for crude oil and CO2 to achieve miscibility [62].

2.4. Summary

This section primarily investigates and analyzes the changes in fluid physical properties and flow mechanisms under nano-confinement effects, divided into three subsections: changes in fluid phase behavior, alterations in flow mechanisms, and other related changes. The phase diagram of fluids in nano-reservoir pores of unconventional oil and gas energy exhibits a contraction trend compared to bulk-phase fluids, with reduced critical parameters, primarily due to the effects of capillary forces on mass transfer and thermodynamic properties. Furthermore, fluid mobility in nanopores is more significantly influenced by pore walls, necessitating a focus on Knudsen diffusion and surface diffusion. Finally, the high-viscosity layer formed on nanopore walls should be emphasized as it greatly affects fluid flow. In unconventional oil and gas development, imbibition effectiveness is influenced by various coupled factors, with high capillary pressure in nanoscale pores serving as the main source of imbibition force. For the widely studied CO2 flooding in unconventional energy development, nanoscale pores reduce the miscible pressure between CO2 and crude oil, enhancing oil and gas recovery rates.

3. Physical Experimental Methods

In the process of unconventional oil and gas energy development, small-scale effects in nanopores, as mentioned earlier, are frequently encountered. Several small-scale experimental analysis methods have been developed to study such issues. This section introduces the physical experimental methods used to study nano-confinement effects, highlighting the advantages and disadvantages of each method, and discussing their development and application in unconventional oil and gas energy research. It is worth noting that this section contains not only the experimental methods for studying fluid flow within nanopores but also the analytical techniques for nanopores where nano-confinement effects occur.

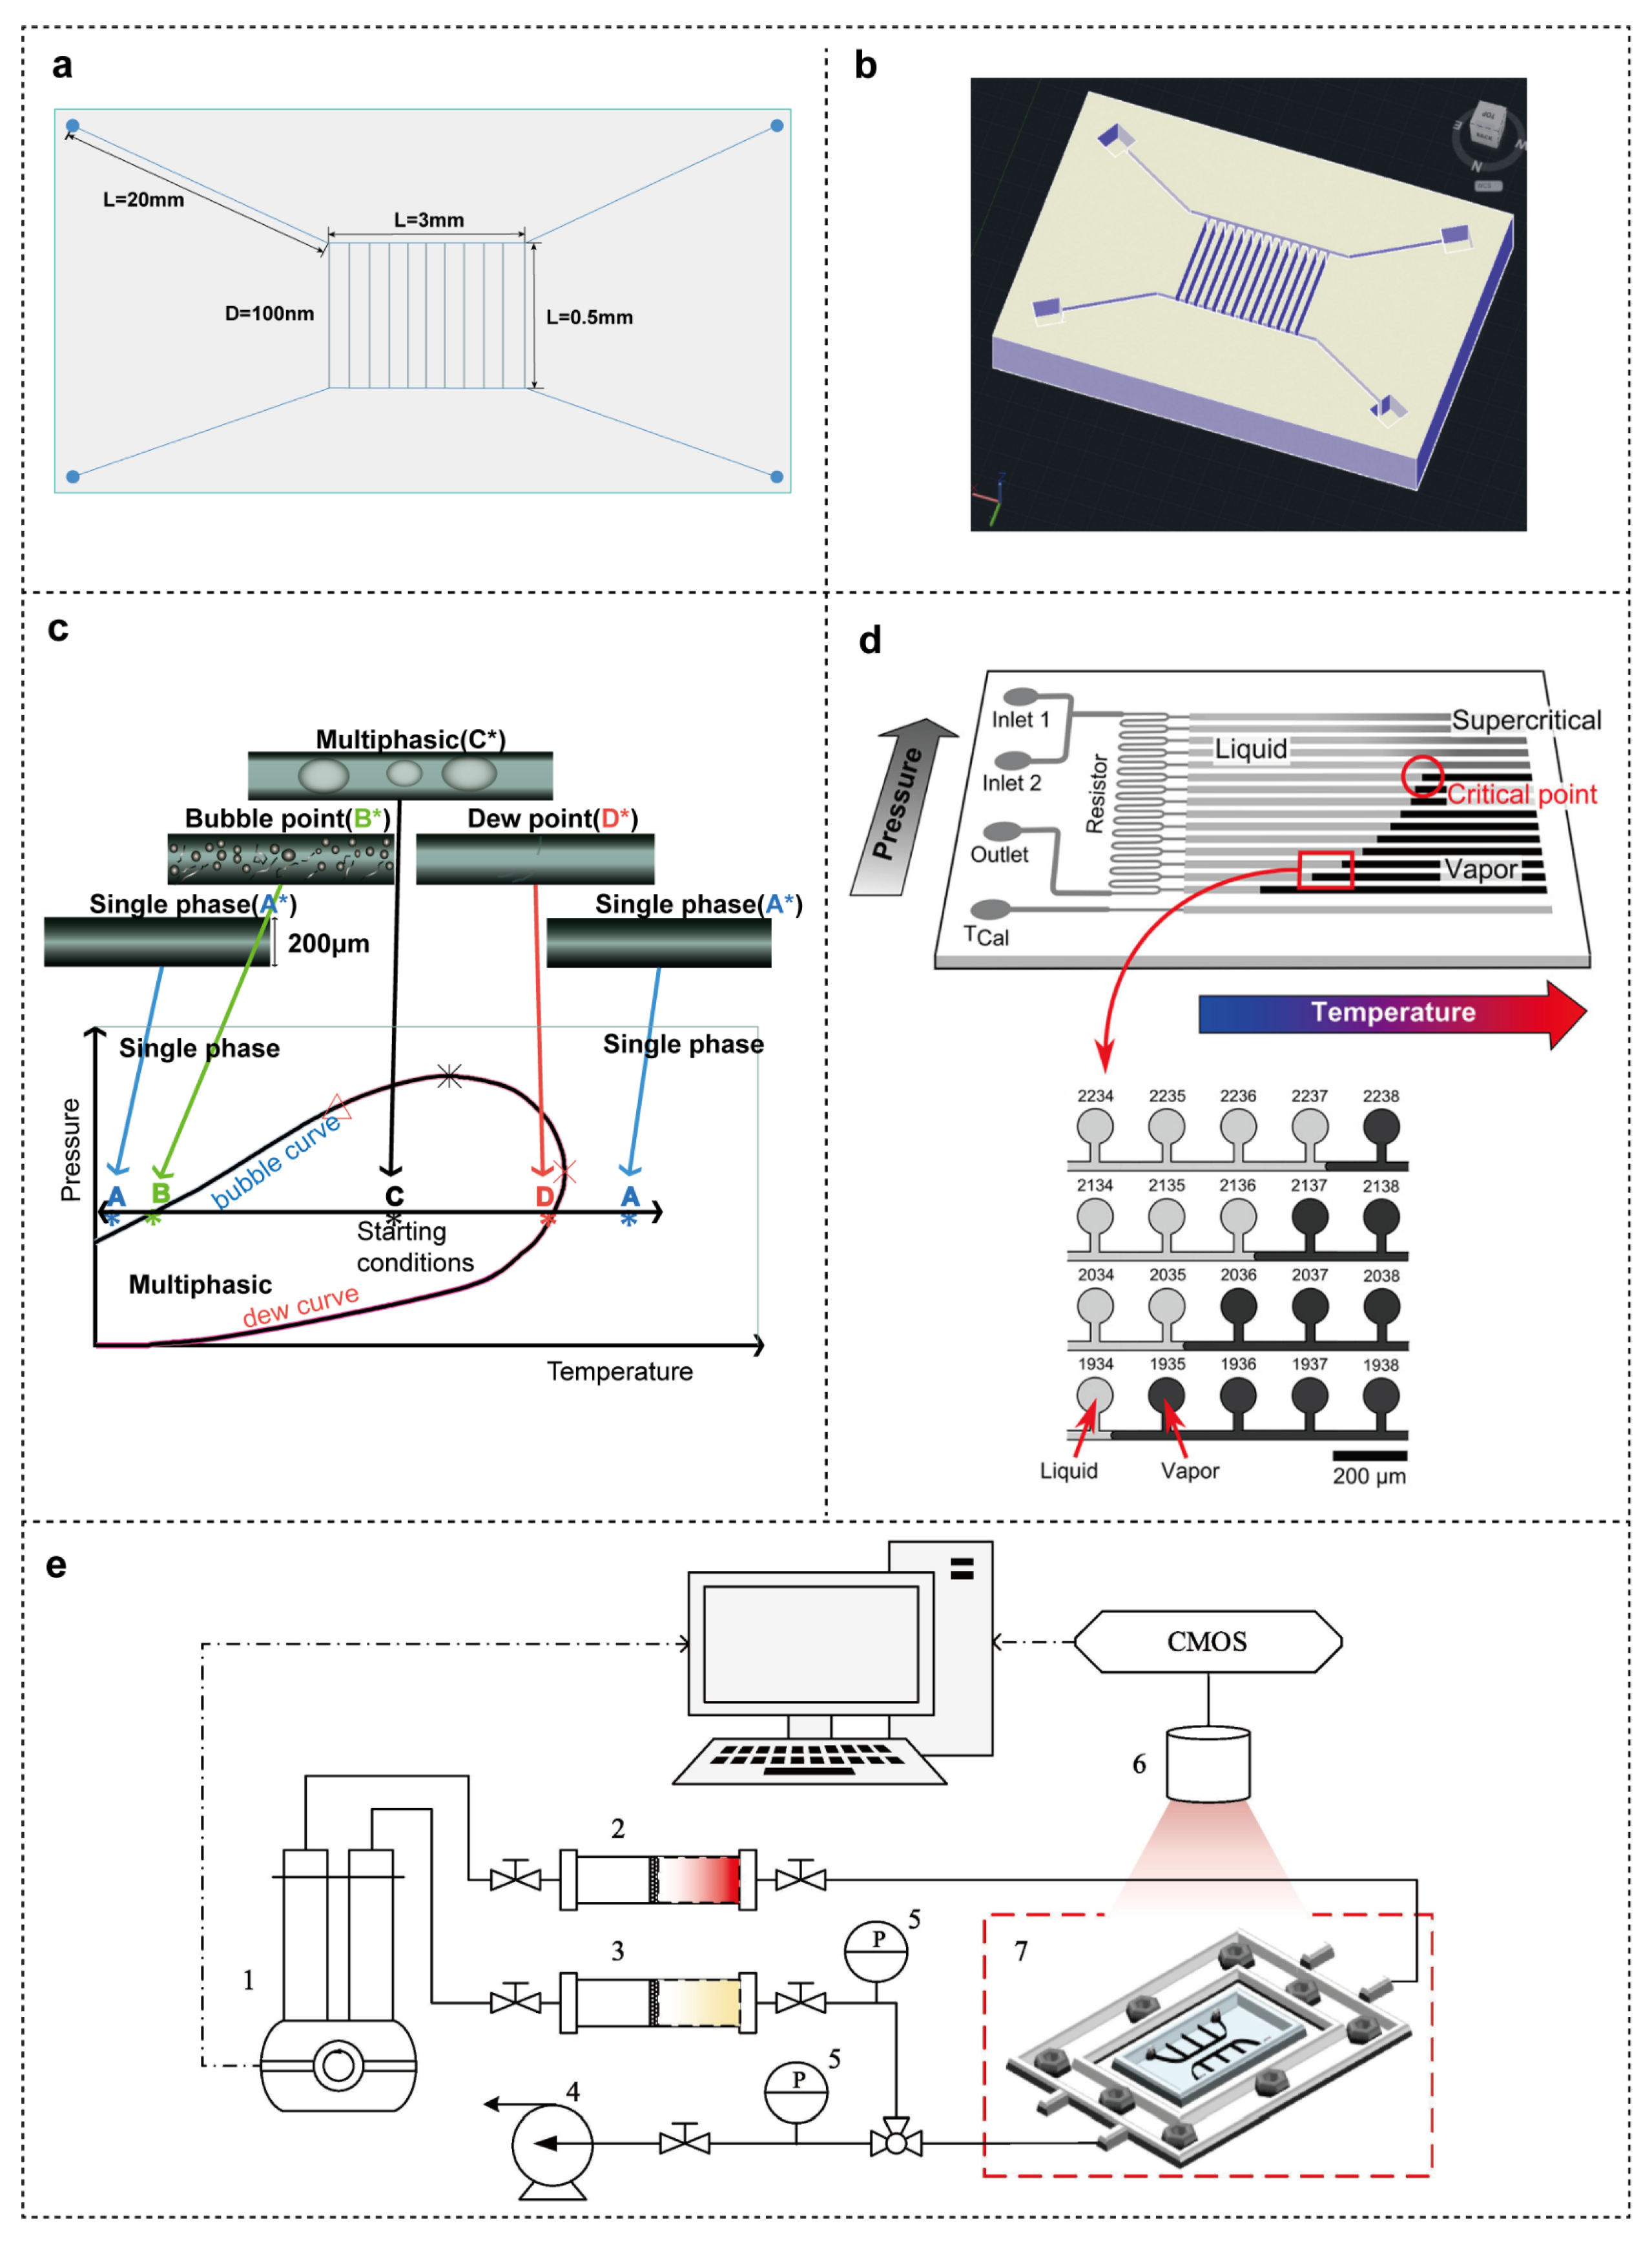
3.1. Nanofluidic Technology

Nanofluidic technology is a method used to study fluid transport and related physical properties at the nanoscale, with a wide range of applications, including but not limited to clinical diagnostics, cell analysis, drug metabolism, and environmental analysis [42,63,64,65]. In energy development, this technology enables the creation of pore sizes and connectivity networks that match those in porous media, using high-magnification microscopy and sensors to display changes in the physical parameters of fluids (Figure 8). Micro/nanofluidic technology is often used to improve measurement efficiency and is compared with numerical simulations, providing a transparent window into unconventional oil and gas energy development by visualizing fluid flow and phase behavior under reservoir conditions [66]. Its advantages include the ability to study small-scale and multiscale problems. However, its limitations include the use of optical methods for experimental observation, which restrict material selection, and the fact that simulation results may differ from actual reservoir conditions.
As early as the 1970s, Bonnet and Lenormand constructed microfluidic networks using photoresist and, combined with imaging techniques of the time, provided the first pore-scale quantification of fluid phase behavior [67]. Early microfluidic experiments testing fluid phase behavior used polydimethylsiloxane as the chip material [68]. However, due to the high-temperature and high-pressure conditions of reservoirs and the chemical complexity of fluids like oil and gas, more stable silicon-based materials such as silicon, quartz, glass, and their oxides/nitrides are required for testing reservoir fluids (Figure 8a,b [17,58,66,69,70,71,72,73]. However, these materials still differ from actual reservoir conditions, and the development of nanofluidic technology is closely tied to creating nano-controlled channels that better match real-world conditions and meet experimental requirements. Compared to silicon-based materials, carbon nanotubes, which have been commonly used in molecular dynamic simulations to model kerogen molecules in shale oil, have applications in nanofluid control research in other fields and may be applied in future experimental studies for unconventional oil and gas energy development [74,75,76].
In testing fluid physical properties, traditional micro/nanofluidic technology tests use a piston to apply pressure at both ends of the fluid, with volume and pressure measured by the piston’s position at different temperatures, but the accuracy is limited. Therefore, an efficient microfluidic technology was developed by Mostowfi using standard silicon photolithography, reactive ion etching, and anodic bonding, with serpentine microchannels set up and optical pressure sensors used to measure local pressure, marking the first application of microfluidics to measure phase behavior in hydrocarbon systems [77]. However, due to the high-pressure drop channel at the outlet of Mostowfi’s method, maintaining internal pressure was difficult. Building on this, a dynamic stop-flow mode was developed to rapidly measure fluid pressure and temperature parameters (Figure 8c). This flow mode was achieved by adding low-resistance bypass flow channels in parallel to reduce flow speed, allowing the capture of flow states at a lower camera sampling rate (from 300 fps in continuous flow to 4 fps). The accuracy of these measurements was verified using PR-EOS and literature comparisons [78]. To enhance testing efficiency, a microfluidic device was developed to incorporate multiple temperature and pressure conditions, enabling multiple measurements in a single run (Figure 8d) [79]. To further downscale the measurement, nanofluidic control chips can now be used to study phase transitions in pores smaller than 100 nm (13 nm) and to conduct nanofluidic experiments at high temperatures and pressures (150 °C and 40 MPa) [17,70,80].
In terms of analysis methods, high-resolution imaging techniques are often used, such as confocal Raman microscopy to analyze CO2 solubility in different fluids and inverted confocal microscopy equipment to study the effects of nano-confinement on fluid phase behavior [81,82]. In addition, optical measurement methods such as Raman spectroscopy can be used to analyze phase behavior in capillary multiphase flow. Fluorescence analysis (using ImageJ software) and high-speed cameras (PCO 1200s) can be used for rapid measurement and analysis of the minimum miscibility pressure between CO2 and reservoir fluids in micropores (Figure 8e) [58,83]. Finally, highly miniaturized sensors manufactured using MEMS technology can be applied to the precise measurement of fluid physical properties in nanopores, which is likely to be a future trend in precision analysis and measurement on a microscale [71].
Figure 8. (a) The nanofluidic devices fabricated through reactive ion etching of silicon with maximum operating pressures and temperatures of 40 MPa and 150 °C, respectively [70]. (b) Nanofluidic chips made of glass [82]. (c) A generalized cyclic method for constructing pressure–temperature phase diagrams by bubble dew point detection and phase envelopment [78]. (d) Schematic of the microfluidic fluid phase-mapping device [79]. (e) Schematic of the nanofluidic technology system, with images analyzed using ImageJ software [83].
Energies 18 00166 g008

3.2. Nuclear Magnetic Resonance

Nuclear magnetic resonance (NMR) measurements rely on the differences in spin motion of atomic nuclei, with research parameters determined through the measurement of atomic relaxation spectra. Compared to image analysis methods, NMR offers higher accuracy, avoiding the appearance of “false pores” that may occur during manual pore segmentation [84]. Compared to material injection methods, such as mercury intrusion or nitrogen adsorption, NMR is an emerging non-intrusive technique. It uses the melting points of saturated fluids within pores to detect pore size distributions, offering an efficient means for quantitative analysis. This method allows for the evaluation of pore structures, identification of pore fluids, study of fluid–rock interactions, and recording of fluid phase transitions in porous media under varying temperatures [85,86]. The limitation of this technique is that it provides overall characteristics of the sample but lacks the ability to capture specific details [87].
In terms of pore characterization, conventional NMR methods are no longer suitable for unconventional oil and gas energy development research due to accuracy limitations. NMR cryoporometry, which enhances testing precision, is now widely used to study pore size distributions and pore volumes in nanopores [86,88]. However, this technique depends on changes in the melting temperature of saturated fluids [89]. In the future, it can be combined with technologies such as FIB-SEM to improve the accuracy of nanopore characterization [90]. The resolution of NMR cryoporometry is determined by the Gibbs–Thomson coefficient of the adsorbed liquid and the instrument settings. Low-temperature NMR relaxation exhibits significant differences in transverse relaxation times between liquid and solid states, offering a broad range for measuring pore size distributions [87]. In addition, low-field NMR T2 spectra cannot measure organic materials like kerogen in unconventional reservoirs. However, at high frequencies (400 MHz), it can successfully measure pore characteristics in shale, reducing noise and scan time [91,92].
In specific experimental studies, NMR technology can be used to study the occurrence state of fluids in pores under nano-confinement effects and determine the minimum mobilizable pore size [93,94]. It can also detect diffusion and the migration of substances, analyze the effect of different surfactants on fluid spontaneous imbibition in nanopores, and quantitatively evaluate the effectiveness of CO2 flooding at different pressures in nanopores to enhance oil recovery [9,95,96,97].
Compared to 1D NMR, 2D NMR can not only characterize pore features but also more accurately identify fluids [98]. 2D NMR can resolve the issue of overlapping fluid signals in 1D NMR T2 spectra. D-T2 mapping can be used to identify fluids based on their different diffusion constants, but has been applied to only a few studies [99]. Another more practical spectrum is the T1 and T2 spectra. The structure and composition of rocks influence the longitudinal (T1) and transverse (T2) relaxation mechanisms in NMR. The T1 and T2 distributions of fluids are related to molecular motion, allowing NMR to characterize pore structures and distinguish fluid types [100,101]. In recent years, 3D NMR technology has been introduced into energy research [85,102]. 3D NMR expands the parameters to include relaxation times (T1, T2) and diffusion coefficients (D) to identify reservoir fluids based on the distribution of oil, gas and water, further improving material identification accuracy [103]. In the future, this technology is expected to be applied to the study of nano-confinement effects in unconventional oil and gas energy, promoting understanding of microscopic pore and fluid mechanisms.

3.3. Nano Computed Tomography

Nano computed tomography (nano-CT) is a non-destructive imaging technique based on the principle of exponential attenuation of X-ray intensity as it penetrates matter (low-density areas appear black with small attenuation coefficients, while high-density areas appear white with large attenuation coefficients). It is widely applied to pore detection in unconventional reservoirs. Unlike nanofluidic technology, this method enables dynamic optical observation of the interior of natural cores and allows for sample scanning analysis and three-dimensional (3D) reconstruction. A limitation of this method is that the threshold selection during 3D reconstruction can affect subsequent simulation results. It can be combined with SEM and NMR to achieve more accurate research outcomes [87]. In pore structure and connectivity evaluation, nano-CT technology also supports the identification of microscopic pore structures and the evaluation of pore networks and connectivity in unconventional oil and gas energy [104].
In 1991, Dunsmuir introduced CT technology to the petroleum industry [105]. Over the past few decades, this technology has been extensively applied to reservoir pore evaluation and the visualization of fluid migration [106,107]. For unconventional reservoirs, this technology provides two key application advantages.

3.3.1. Pore and Fluid Characterization

In the energy industry, nano-CT technology is directly applied to the characterization of pore structure and distribution [108]. This technology can be combined with high-temperature and high-pressure physical simulation experiments to study the evolution of 3D porosity in shale as its thermal maturity increases [109]. When integrated with focused ion beam scanning electron microscopy (FIB-SEM) technology, it can investigate the wettability and spontaneous imbibition of nanoscale ultra-tight shale reservoirs [110]. Additionally, it can be combined with experimental techniques to quantitatively analyze the anisotropy of permeability in shale reservoirs [111]. In current reservoir pore research, micron-scale CT is commonly used [112]. However, for the unique small-scale characteristics of unconventional reservoirs, precision gaps still exist. Future research in this area will focus on expanding small-scale CT studies, potentially including contrast agent injection and intelligent multiscale imaging. Furthermore, real-time CT technology (4D: three-dimensional space and real-time scanning) will improve our understanding of the dynamic microscopic structures and mechanisms in unconventional reservoirs.

3.3.2. Preprocessing for Numerical Simulations

In recent years, with the continuous enhancement of computational power, microscale numerical simulation methods have been increasingly researched and applied. In studying nano-confinement effects in nanopores, nano-CT technology provides microscopic pore structure characteristics to other numerical simulation methods, serving as a valuable aid for other numerical simulation methods. A commonly used method to study confinement effects in nanopores involves scanning rock pore structures using nano-CT, combining this with digital core technology, and using the lattice Boltzmann method (LBM) to analyze fluid flow [113,114,115]. Additionally, micro- and nano-CT can be combined with the finite element method, or with molecular simulations (GCMC) to study fluid adsorption behavior in different pore structures [116,117]. Digital core technology, which accurately reflects the true pore structure of reservoirs, can be combined with nano-CT and FIB-SEM to study full-scale pore structures of rocks, enabling 3D reconstruction of cores and extraction of pore network models (PNM) for multiscale research [118].

3.4. Scanning Electron Microscopy

When the pore size in the reservoir is at the nanoscale, the internal surface area is relatively large, leading to stronger interactions with reservoir fluids, which can affect the occurrence states of different fluid components [119]. Therefore, the study of pore structure becomes critically important. Optical microscopy cannot observe nanopores, so electron microscopy is necessary for examining nanoscale pores. SEM images offer a clear observation of the specific characteristics of pores in unconventional reservoirs and facilitate microscale analysis of porous media components, including organic materials in inorganic matrices [120]. When SEM is used, samples are typically polished layer by layer for imaging, achieving high resolution. Its characteristics are as follows: compared to CT technology, this method partially destroys the rock sample, cannot reveal pore depth or the spatial distribution of reservoir pores, and has a limited field of view, providing an incomplete depiction of the sample [112]. However, SEM achieves a higher resolution than CT scanning, making it easier to distinguish between rock pores and the matrix.
In 2007, SEM was initially applied to observe pore types in the Longmaxi Formation of unconventional reservoirs [121]. By 2010, this technology had advanced to produce 3D images of pores with a resolution of 4–5 nm [122]. Since then, researchers have frequently used SEM, FIB-SEM, and FESEM-FIB techniques to analyze the pore structures of unconventional oil and gas energy reservoirs [47,123,124]. Moreover, SEM observations of pore structures have shown the critical role of organic pores in the development of unconventional oil and gas energy [125,126]. SEM images show that most pores smaller than 50 nm in shale reservoirs are located within kerogen, i.e., in organic pores, leading to differences in interfacial phenomena such as fluid adsorption and desorption compared to conventional reservoirs [127].
However, the analysis area and scale of this method are limited, and the connectivity of the 3D pore network remains uncertain. Therefore, multiscale imaging techniques have increasingly gained the attention of researchers to obtain more comprehensive information about pore characteristics [128]. SEM images can be used to generate 3D data sets for reservoirs and to reconstruct the 3D volume characteristics of rocks from 2D images [119]. Therefore, this method is often used as a supplement to other methods in pore characterization when studying nano-confinement effects on unconventional oil and gas energy development and utilization. In research, it is often combined with nano-CT to achieve detailed and comprehensive pore network characterization [87,110], and paired with numerical or experimental methods for micro- and multiscale seepage studies [118,129]. For example, this method is often combined with pore network models to simulate seepage in unconventional oil and gas energy reservoirs [130]. Additionally, to achieve more precise characterization of pore structures, current studies employ neural network methods to segment the obtained binary pore images [131].

3.5. Summary

Microscopic experimental methods and analytical techniques are direct tools for studying nano-confinement effects. Nanofluidic technology makes microscopic visualization experiments possible and has been well-applied in the analysis of fluid phase behavior at the nanoscale, but it still has certain limitations. For example, the pore sizes of currently manufactured chips differ from those in actual unconventional reservoirs, making it difficult to study fluid properties at smaller scales. Currently, silicon-based chips are predominantly used, which differ from actual reservoir materials. In terms of analytical methods, more extensive application of MEMS in analyzing fluid properties in chips is expected in the future.
Additionally, nano-CT, NMR and SEM are analytical techniques for nanopores and fluids, widely used in unconventional oil and gas research. Nano-CT technology not only characterizes the pores of unconventional oil and gas reservoirs but also plays a role in pre-processing models for numerical simulations. NMR can quantitatively characterize nanopores and fluids, but it cannot capture the distribution characteristics of samples. In the future, higher-dimensional NMR technology should be introduced into unconventional oil and gas research to enhance our understanding of microscopic mechanisms. SEM can achieve higher resolution compared to nano-CT, but it cannot capture the three-dimensional characteristics of samples. Combining SEM with nano-CT is a way to improve analytical accuracy. Additionally, DSC, SAXS, and gas absorption methods are also techniques for analyzing nanopores and fluids, applicable to different scenarios and capable of being integrated with other methods to improve analytical precision and accuracy.

4. Numerical Simulation Methods

With the development of computational science and improvement in computational power, simulation methods have been widely used to study the physical properties and flow mechanisms of fluids in nanopores, making up for the limitations of physical experiments. The Knudsen number is the ratio of the fluid molecular mean free range to the pore diameter [132], and the magnitude of Knudsen number is commonly used by researchers to determine the flow state of a fluid and to select an appropriate simulation method. When the Knudsen number is less than 0.001, molecular collisions dominate, and fluid flow simulation can be carried out using the continuum assumption and no-slip boundary conditions by solving the Navier–Stokes (N-S) equations. When the Knudsen number is between 0.001 and 0.1, molecular collisions and collisions with the nanopore walls are comparable, and the continuum assumption with slip boundary conditions can be used. The N-S equations remain applicable. When the Knudsen number is greater than 0.1, collisions between molecules and nanopore walls dominate, and the continuity of fluid microelements can no longer be maintained. The continuum assumption breaks down, and molecular or mesoscopic simulation methods must be used (Figure 9a–c) [133,134]. The mean free range of oil and gas fluid molecules is similar to the nanoscale pore size of unconventional reservoirs, with large Knudsen numbers and obvious nano-confinement effects, which need to be investigated by molecular and mesoscopic scale simulation methods. Therefore, this paper reviews three microscale numerical simulation methods in this section (Figure 9d–f), and summarizes and analyzes the advantages and disadvantages of their existence and use scenarios.

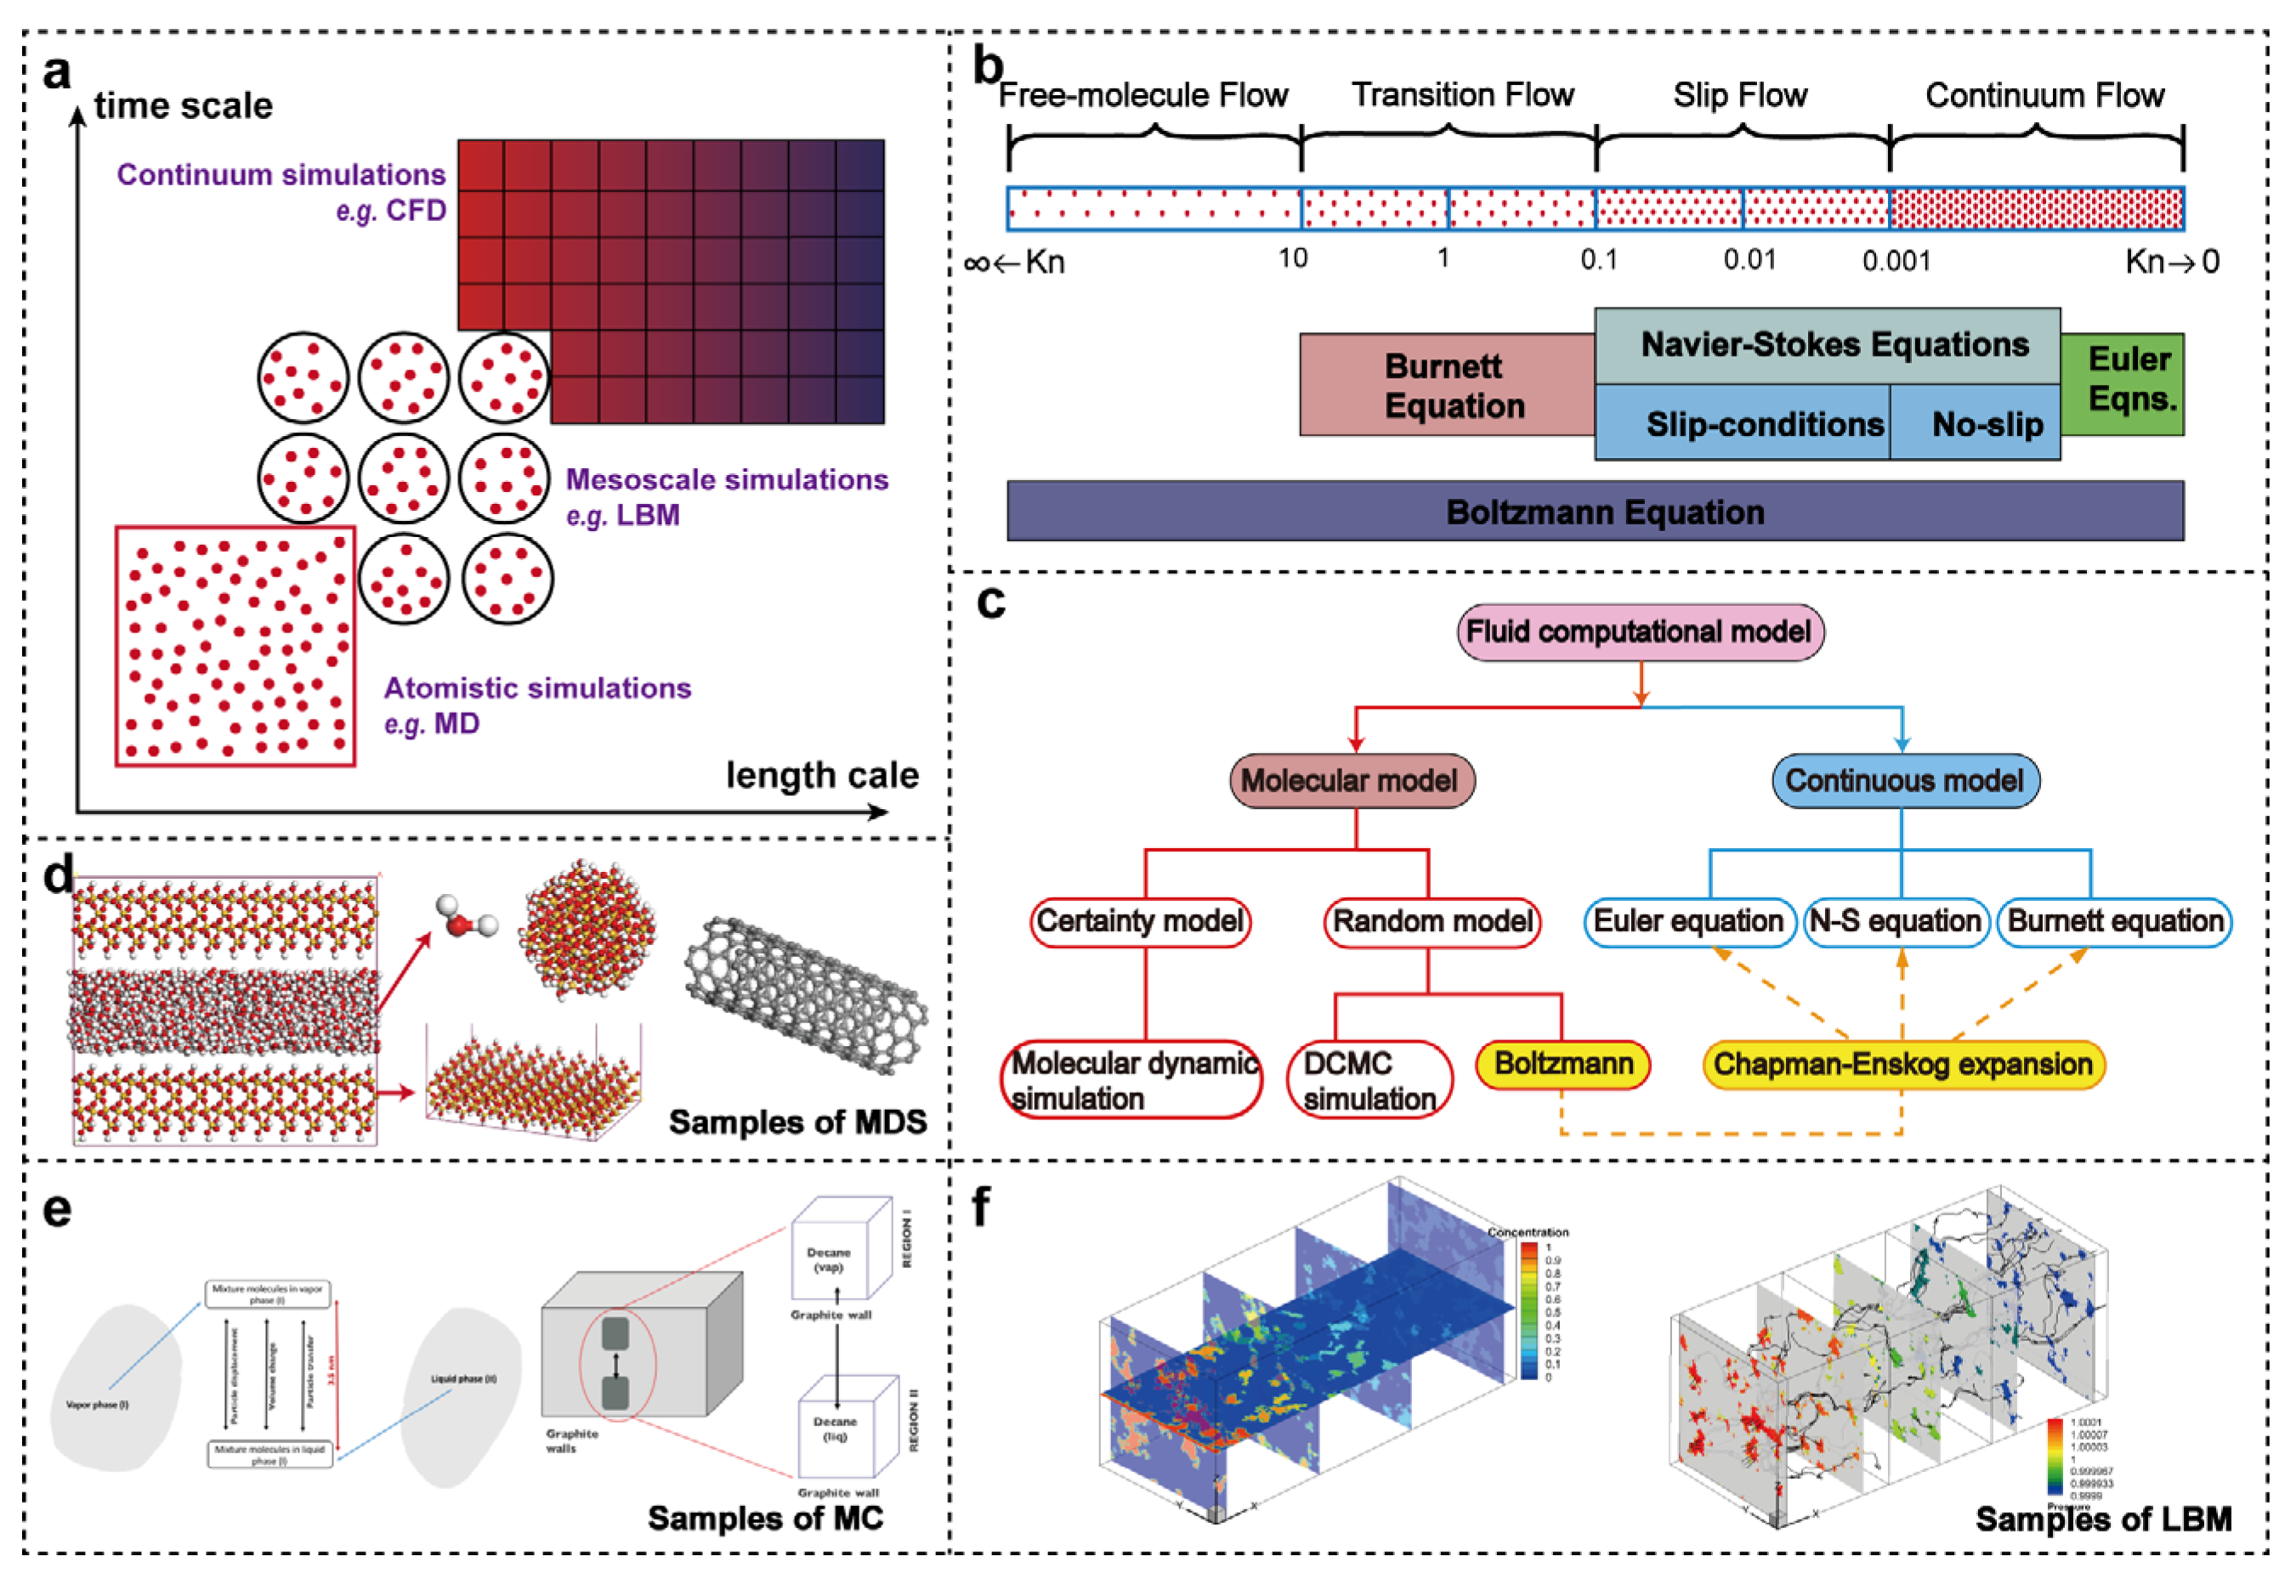
4.1. Molecular Dynamic Simulation

Molecular dynamic (MD) simulation is based on Newtonian mechanics, using computational techniques to simulate molecular interactions and movement at the molecular and atomic scales, enabling the study of microscopic fluid molecular motion mechanisms. MD was first used by Alder and Wainwright to study the dynamics of hard-sphere gases [137]. Later, Rahman introduced molecular dynamics into liquid simulations and performed detailed studies of liquids using the Lennard–Jones potential [138]. With the advancement of computer hardware and algorithms, this molecular-scale research has been realized and further developed [139]. This method is applicable to both equilibrium and non-equilibrium systems. Equilibrium MD can quantify the structure and diffusion properties of confined fluids, whereas non-equilibrium MD simulations can evaluate the transport properties of confined fluids [140,141]. The process of predicting molecular diffusion in microporous crystalline materials using MD simulations involves calculating the forces on all atoms at each time step and integrating Newton’s equations of motion over time [23]. However, this method has certain limitations, such as requiring significant computational time since it simulates the behavior of individual molecules at the microscopic scale. Commonly used simulation software to include Materials Studio 2023(23.1.0.3829) (commercial software) and Large-scale Atomic/Molecular Massively Parallel Simulator (29 August 2024 version) (open-source software).
MD simulations are often used to study molecular adsorption and desorption in nanopores of unconventional oil and gas energy. Billemont and You Jing, for example, used MD simulations to create a bituminous coal model and investigate methane and CO2 adsorption in coal seams [142,143]. Additionally, MD methods are often applied to study the adsorption effects of pore walls on hydrocarbons [144,145], the adsorption behavior of fluids in shale pores, and their impact on oil recovery [45]. Ambrose et al. used the MD simulation method to calculate in situ gas, achieving a 10–25% improvement compared to traditional calculation methods [47]. Sun Linghui et al. studied fluid adsorption in nanopores using MD simulations, concluding that oil molecules exist only in an adsorbed state in narrow pores smaller than 3 nm, while both adsorbed and free states coexist in larger pores [146]. Moreover, equilibrium and non-equilibrium MD simulations are frequently used in research to characterize the density distribution of fluids in nanopores under different conditions [120,147].
MD simulations are also extensively used to study fluid diffusion and transport in nanopores. It can predict not only the self-diffusion coefficient of molecules but also Fickian (or “transport”) diffusion coefficients and Maxwell–Stefan diffusion coefficients [148]. At the microscopic scale, calculating fluid flow using Knudsen diffusion and fluid dynamics-related formulas (such as the Hagen–Poiseuille equation) can result in significant errors. In such cases, dual-control volume-grand canonical molecular dynamics (DCV-GCMD) simulations can be used to study fluid flow in nanopores [141,149,150,151]. MD can simulate the diffusion of shale gas in single and multiple pores, but due to computational limitations, it has not yet been applied to simulate multiphase fluid flow in porous media [152]. The fluid velocity in nanopores is influenced by pore size and pressure. Wang Sen et al. used MD simulations to study fluid velocity in nanopores of unconventional oil and gas reservoirs, with pore sizes ranging from 2.08 to 10.0 nm and fluid viscosity ranging from 24.40 μPa·s to 24.67 μPa·s. Their study showed that methane molecules move significantly faster as the slit pore size increases, while smaller pores result in larger slip lengths [153]. Yu Hao et al. used MD simulations to study fluid velocity in nanopores under varying pressures, showing that methane adsorption on pore walls decreases with lower pressure, while fluid velocity near the walls increases as pressure drops [151]. Additionally, researchers have used this method to study the effects of mineral composition, roughness, and pore surface morphology on fluid transport [154].
MD simulations can also be used to study the relationship between pore size and fluid phase behavior under nano-confinement effects [155]. However, the study of fluid phase behavior in nanopores requires the use of additional programs, and there is still room for improvement in the research methods. Additionally, this method can be used to study the capillary condensation mechanisms of different mass components in nanopores [156].

4.2. Monte Carlo Method

The Monte Carlo (MC) method is a statistical sampling technique based on probability theory and mathematical statistics, using random numbers (or more commonly pseudo-random numbers) to solve real-world problems. It is often used to solve problems with inherent randomness and to study physical quantities that are difficult to observe under current conditions. Due to its randomness, the MC method has advantages over MD simulations, such as simpler programs and lower computational resource requirements [157]. However, to ensure that the random independent experiments produce consistent patterns, a large number of repetitions are needed to reach a confidence level. In 1953, Metropolis conducted the first MC simulation of fluids [158].
The MC method is a commonly used approach for studying the thermodynamic properties of fluids in nanopores. Compared to MD simulations, it does not need to follow natural paths, allowing molecules to move randomly, with some movements corresponding to large jumps in phase space [157]. Methods such as grand-canonical Monte Carlo (GCMC) and Gibbs ensemble Monte Carlo (GEMC) are well-suited for simulating phase separation and phase equilibrium in small pores and porous media [159]. GCMC is based on generating a series of molecular configurations with correct energy and density distributions using a Markov chain. It modifies the molecular configuration by creating new molecules at random locations, destroying existing molecules, or replacing molecules with random carriers. Singh used configurational-bias grand-canonical transition-matrix Monte Carlo simulations to explore how nanopore confinement affects the thermophysical properties of fluids [160]. Compared to traditional GCMC simulations, the GEMC method directly provides the density of coexisting phases in nanopores. It can establish phase equilibrium within nanopores and obtain more accurate pressure data for different fluid phases, avoiding the issue of determining phase transition locations [135]. In 2019, Sobecki developed a more stable GEMC NPT bubble-point Monte Carlo method within the GEMC NVT to estimate the thermodynamic properties of confined mixtures in nanopores at equilibrium [161].
Furthermore, the MC simulation method is well-suited for simulating fluid behavior in nanopores, and compared to MD simulations, it is more efficient in generating adsorption isotherms and offers greater convenience in simulation. Malek and Coppens conducted three-dimensional dynamic Monte Carlo simulations of Knudsen diffusion to investigate the effects of surface roughness on transport and self-diffusion [162,163,164,165]. However, traditional MC simulation methods cannot simulate long-chain alkanes. The configuration-bias Monte Carlo (CBMC) method effectively improves the sampling efficiency of chain molecule conformations, making long-chain alkane simulations possible. Jiang Jianwen used CBMC simulations to study the adsorption and separation of alkane mixtures in carbon nanotubes [157]. The GCMC method is also widely used to study adsorption and transport behavior in nanopores, as discussed above. It is often used to simulate the competitive adsorption behavior of hydrocarbons and CO2 mixtures in nanopores and to study the transport of hydrocarbons in nanoporous media [142,143,166,167,168].

4.3. Lattice Boltzmann Method

The lattice Boltzmann method (LBM) was originally based on the lattice gas automata, developed in the 1970s, which models a continuous fluid as a collection of virtual particles. Space and time are discretized into discrete units, and particles migrate and collide on a grid according to certain rules, with the macroscopic behavior of the fluid being derived through statistical analysis of local interactions. The governing equation of LBM (Equation (2)) is a discrete form of the Boltzmann equation.
f i ( x + c i Δ t , t + Δ t ) = f i ( x , t ) Δ t τ ( f i ( x , t ) f i e q ( x , t ) )
where f is the density distribution function, ω i is the weighting factor; c i is the lattice velocity in the i direction; τ is the relaxation time; and f e q is the equilibrium particle distribution function.
It uses a physical approach but does not account for molecular-level interactions [169]. The interactions between molecules and between molecules and pore walls are incorporated as external forces. As interaction forces between particles and walls were incorporated, LBM gained increased attention for its utility in fluid dynamics simulations [170,171,172]. In LBM simulations, the discrete velocity set describes how particle groups migrate to neighboring nodes in specific directions and with specific weights after collisions. The D2Q9 model was widely used in early studies [173]. As research progressed, finite-difference LBM was used to address the effects of complex boundary conditions on slip velocity [174,175,176,177]. This method allows different propagation velocities on the same lattice, with velocity dependent on fluid particle mass and lattice spacing [178], making it suitable for multi-component systems and multi-speed thermal models [179]. LBM is used to study fluid motion at the mesoscale [180]. Its core components include the particle distribution function, discrete velocity models, and equilibrium particle distribution. Compared to MD and MC methods, LBM has the advantage of lower computational cost.
LBM can be applied to simulate fluid flow under nano-confinement effects. The boundary conditions in LBM transmit particle groups. Compared to traditional numerical methods, LBM has higher degrees of freedom and requires handling larger numbers of particle groups. Therefore, earlier researchers used different boundary conditions to simulate microscale fluid flow, including diffuse reflection lattices [181], finite-difference LBM schemes [179], wall quasi-equilibrium schemes [182] and second-order slip bounce-back combined with specular reflection schemes [183]. However, these boundary conditions did not account for fluid adsorption and desorption in nanopores. The introduction of Langmuir boundary conditions resolved this issue and was applied to simulating seepage in organic pores in shale gas [25]. However, Langmuir boundary conditions could not solve micro-flow issues. To accurately study gas transport mechanisms in shale reservoirs, Gupta introduced the Langmuir-slip boundary condition, which effectively handled micro-flow problems [184]. Previous research paid little attention to critical fluid adsorption behavior, and the study of critical fluid adsorption in shale nanopores should not be overlooked [185].
In future research on multiscale problems, coupling LBM with MD simulations for modeling unconventional oil and gas energy development will be highly valuable. At present, these two methods can be coupled in two ways: bidirectional coupling (where overlapping regions are linked by resetting MD to match LBM or vice versa) and unidirectional mapping (where MD results are “mapped” into LBM) [186,187,188,189].

4.4. Summary

Numerical simulation methods address the limitations of microscopic experimental methods in terms of research scale and material selection, serving as a valuable complement to physical experimentation. MD is a computational method used to simulate the interactions and movements of molecules, primarily applied to study fluid adsorption and desorption in nanopores, as well as fluid motion within these pores. However, MD simulates molecular behavior on a microscopic scale, requiring substantial computational power, making the process time-consuming and limited by computational capacity. The MC method, compared to MD simulations, is relatively simpler and requires fewer computational resources, making it commonly used in studying the effects of nano-confinement on fluid phase behavior. However, it is based on probability theory and statistical methods, and thus exhibits stochastic characteristics. The LBM assumes fluids as aggregates of particles and serves as a mesoscale simulation method. It is frequently used to study fluid motion under nano-confinement effects. While LBM can simulate larger scales compared to MD, it is unable to capture molecular interactions at the microscopic level.
Compared to experimental methods, microscale simulation methods provide more precise analysis of microscopic pores and fluids. However, simulation technologies need to be integrated with physical experimental methods and cross-validated to truly foster the development of both theoretical and practical applications. Additionally, there are still limitations in the research on multiscale simulation methods. The future goal is to integrate microscopic molecular-scale simulations with mesoscale, and even macroscale simulations, to achieve multiscale simulation, which remains a constant pursuit. Table 3 provides a comparative analysis of three numerical simulation methods for investigating nano-confinement effects.

5. Theoretical Calculation Methods

5.1. Equation of State

The equation of state (EOS) is one of the earliest methods used to study fluid phase behavior. The Peng–Robinson equation of state (P-R EOS (Equation (3))) is widely used to describe the phase behavior and thermodynamic properties of bulk fluids and is extensively applied in reservoir fluid evaluations [190,191]. Current research on the properties of nanoscale fluids focuses on introducing parameters such as capillary pressure, fluid adsorption data and critical property modification into traditional equations of state to achieve EOS corrections.
P = R T V m b a V m 2 + 2 b V m b 2
where P is the pressure, T is the temperature, R is the gas constant, Vm is the molar volume, a is the attractive force parameter, considering intermolecular forces, and b is the repulsion parameter, representing the finite size of molecules.
Research has demonstrated that capillary pressure affects the phase behavior of fluids in nanopores, and the use of equilibrium EOS has played a crucial role in this research. Combining EOS with capillary pressure allows for a comprehensive assessment of the effects of nanopores on fluid saturation pressure and density [192]. Currently, many studies modify the PR-EOS by incorporating capillary pressure effects and changes in critical parameters to investigate the impact of nano-confinement on fluid flow in tight reservoirs [193]. These studies can be combined with MD simulations to examine the effects of CO2 injection on interfacial tension and miscibility pressure [62].
In nanopores, the interaction forces between fluid molecules and the solid pore walls, as well as adsorption effects, become more pronounced. These interaction forces are incorporated into the modification of EOS to establish phase equilibrium calculation methods that account for fluid–pore interactions and capillary forces [194,195,196]. Additionally, Zhang Kaiqiang developed a generalized EOS that includes the comprehensive confinement and pore–size distribution effects [70]. To simulate the complexity of nanopore surfaces, Dong Xiaohu proposed the assumption of a furrowed surface and sinusoidal surface to represent the heterogeneous nanopores in tight rocks and shales [197]. Based on these assumptions, the theory of multicomponent potential theory of adsorption was combined with the P-R EOS, simulating the heterogeneity of pore surfaces (including geometric and chemical heterogeneity) through spatial and amplitude distortions of the adsorption potential field.

5.2. Density Functional Theory

Density functional theory (DFT) is a quantum mechanical method based on ab initio theory, which does not track each electron in the system but uses electron density as the fundamental variable [198]. At its core is the Kohn–Sham equation, which is used in molecular structure optimization to calculate the total energy of a molecule and adjust its geometry to find the lowest energy structure. As a powerful computational tool, this method is widely used for optimizing molecular structures and calculating fluid adsorption in nano-confinement effects [199].
In studies on the adsorption behavior of fluids in nanopores during the development and utilization of unconventional oil and gas energy, this method is applied alone or in combination with other methods. First, it is frequently used to evaluate the adsorption of CO2 and methane [200]. By introducing the lattice DFT model, it can also address adsorption issues in different types of pores [201]. The lattice DFT model not only accounts for multilayer adsorption and surface interactions but also considers lateral interactions between adsorbate molecules through the concept of heat of liquefaction. However, the lattice DFT model does not account for multiscale pore size distribution. Xu and Prodanović addressed this issue by modifying the model and using the same approach to study gas adsorption in nanopores of various shapes [32]. Furthermore, DFT can be combined with other methods. Li Zhidong combined engineering DFT with the P-R EOS to study the adsorption and phase behavior of pure substances and mixtures in nanopores [202].

5.3. Summary

Theoretical calculation methods are based on fundamental theories and formulas in physics, chemistry, or mathematics, obtaining exact or approximate solutions through analytical or derivation processes, providing a means to validate numerical simulation methods. The EOS is one of the earliest methods used to study fluid phase behavior. Currently, researchers often modify the PR-EOS to study fluid phase behavior in nanopores. DFT considers electron density as the fundamental variable and is a quantum mechanical method, widely used to study fluid adsorption behavior in nanopores. However, due to the inability of theoretical models to fully simulate real physical environments, the results from theoretical calculations may deviate considerably from experimental results, necessitating their integration with other methods for more comprehensive studies.

6. Comparative Analysis of the Effects of Nano-Confinement on Fluid Properties

6.1. Influence on Fluid Phase Behavior

6.1.1. Phase Behavior

Nano-confinement effects alter the phase behavior of fluids in unconventional reservoirs, impacting the effective development and utilization of unconventional oil and gas energy. Traditional experimental measurement techniques face challenges in determining the critical parameters of fluid phase behavior in nanopores. To understand how nano-confinement alters fluid phase behavior, new simulation techniques and experimental methods are required. A review of the last decade’s research progress on the effects of nano-confinement on fluid phase behavior reveals that many studies have used MC methods for simulation [44,135,161,203], nanofluidic technology for experimental analysis [70,80,82] and modifications to equilibrium EOS (accounting for capillary forces [192,204], integrating DFT [202] and considering fluid–solid interactions [195]) for theoretical calculations. Figure 10 illustrates six typical phase diagram variations for fluids in nanopores, and Table 4 summarizes the comparative results from different research approaches. Current research on the phase behavior of pure hydrocarbon components shows relatively consistent results, with nano-confinement effects causing a reduction in critical parameters to varying degrees. However, the phase diagrams of multi-component hydrocarbons under nano-confinement show significant variation, making this a key focus and challenge for future research in the effective development of unconventional oil and gas energy.
There are three potential reasons for the differing P-T phase diagram distributions between multi-component hydrocarbons and bulk fluids: (1) differences in simulation methods, as each model considers different factors, leading to inevitable variations in accuracy; (2) differences in the selected fluids or pore materials and particle sizes; (3) variations in the accuracy of simulation methods, with some methods unable to capture critical parameters accurately, necessitating the use of other techniques for estimation.

6.1.2. Pore Size Classification

In studies on the effects of nano-confinement on fluid phase behavior, the size of nanopores significantly impacts fluid phase diagrams. However, recent research still shows disagreements regarding the classification of critical pore sizes. Initially, it was found that when the pore size is 3 nm, the fluid’s saturation pressure and critical temperature differ greatly from the bulk phase [202]. When the pore size is smaller than 10 nm, changes in critical pressure and temperature affect the applicability of traditional equations of state, and Langmuir adsorption isotherms are merely fitted to the data [203]. A comparative analysis using DSC to examine the critical parameters of hydrocarbons in controlled pore glasses of 4.3 nm and 38.1 nm found that nano-confinement effects were not significant in the 38.1 nm controlled-pore glasses (CPG), but two distinct bubble points were observed in the 4.3 nm CPG [205]. Recently, Wang Peng improved the traditional Soave–Redlich–Kwong (SRK) EOS and found that when pore sizes are smaller than 100 nm, nano-confinement effects on fluid phase behavior become significant. When the pore size is less than 2 nm, the confinement effect becomes even stronger, leading to large changes in the molar volume of the confined fluid, with the 2 nm pore size being referred to as the critical pore size [206].
In two-phase equilibrium calculation models and MMP assessments for oil and gas, it has been found that at reservoir temperature, when the pore radius is smaller than 100 nm, the content of components in the liquid phase increases with decreasing pore size, and the increase in lighter components is higher than that of heavier components. This is attributed to capillary forces, which raise gas phase pressure and enhance mass transfer between the gas and liquid phases, with lighter components transferring at a higher rate [207]. In studies of fluid composition, it was shown that in a 1D nano slit with a width of 6 nm, the fluid composition in the center is the same as the bulk phase; for a 2D cylindrical nanopore, this value is 8 nm [155].
The thermodynamic properties of fluids include temperature, pressure, volume, internal energy, enthalpy, entropy, and free energy, which are closely related to fluid adsorption isotherms [208]. Thermodynamic laws are based on certain assumptions. When the characteristic length scale of the system approaches the average distance between particles, collisions with system walls become dominant, leading to changes: momentum transfer becomes governed by pore walls, and flow and heat transfer models based on the continuum assumption fail to provide accurate predictions [209]. Under nano-confinement effects, fluid flow is influenced by charge, which in turn affects the thermodynamic driving force of the fluid [210,211]. Additionally, the interactions between the fluid and nanopore walls contribute significantly to surface free energy, reducing the fluid’s free energy and entropy [212], and influencing its thermodynamic properties [70,208]. Finally, by comparing the effects of nanopore size on fluid dynamics, molecular sieving, fluid structure, and thermodynamic behavior, a 10 nm pore size has been designated as the confinement threshold, and this is generally accepted as the most accurate critical pore size classification [213].

6.2. Influence on Fluid Movement

6.2.1. Fluid Diffusion

Based on the Maxwell−Stefan (MS) diffusion equation, the self-exchange MS diffusion coefficient indicates that for strongly constrained molecules passing through narrow pores, there is no strong intermolecular interaction; for weakly constrained molecules, strong intermolecular interactions occur at every step of the diffusion path [23]. Krishna used MD simulations to determine the MS diffusion rate at zero loading, observing a monotonic decrease in the fluid’s MS diffusion rate as the degree of confinement increases, as shown in Figure 11a–c [214]. The nature of nano-confinement effects differs depending on the pore size: in mesopores, molecules diffuse continuously, similar to the bulk phase; in micropores, diffusion tends to be activated, with molecules “hopping” from one adsorption site to another, resulting in a lower diffusion coefficient [23]. The Maxwell−Stefan (MS) diffusion equation is shown in Equation (4) [215].
F i = j i ς i , j x j ( u i u j )
where Fi is the driving force on component i, ς i , j is the friction coefficient between i and j, x j is the mole fraction of j, and u is the diffusion velocity.
Additionally, surface roughness affects fluid diffusion in nanopores. Coppens and Malek conducted 3D dynamic MC simulations of Knudsen diffusion in model pores with random fractal surface roughness to investigate the effects of roughness on transport and self-diffusion. Their conclusion was that self-diffusion is strongly influenced by surface roughness, while transport diffusion is unaffected [162,163,164,165].
The presence of other substances in the pores also affects molecular diffusion. Water experiences greater confinement-induced diffusion effects compared to oil, but when water is present in nanoscale pores, water molecules strongly adsorb to the clay surface, forming molecular bridges across the pore volume, which hinders the diffusion of hydrocarbon molecules (Figure 11d,e) [96]. Water molecules exhibit a stronger affinity for adsorption onto clay minerals, displacing CO2 into the center of the pore, which is unfavorable for CO2 sequestration [23]. In contrast, under the influence of salt ions, water molecules in calcite nanopores are located in the center, reducing the diffusion rate of water molecules [144].

6.2.2. Fluid Permeability

Fluid permeability is a crucial factor influencing oil and gas energy recovery efficiency, and the permeability of fluids under nano-confinement differs from that in conventional reservoirs, influencing the design and optimization of energy extraction methods. Cui Ronghao analyzed fluid flow characteristics in nanopores, concluding that wettability is the primary factor affecting oil phase flow capacity. After considering the slip effect, the relative permeability of the water phase increases, while that of the oil phase decreases [216]. Compared to conventional reservoirs, fluid permeability in nanopores of unconventional reservoirs is not solely an intrinsic property of the rock but also depends on pressure [130].
In actual nanopore reservoirs, gas flow depends on the pressure at both ends of the pore, and a single flow regime cannot accurately predict flow rates. Thus, researchers are dedicated to studying gas flow mechanisms under different flow regimes. Additionally, using SEM scanning images and the Markov chain MC method, researchers reconstructed the porous structure of shale. The LBM was then used to simulate fluid flow and Knudsen diffusion within shale, with corrections applied to permeability by accounting for Knudsen diffusion’s contribution to total flow. This method allows for the study of Knudsen diffusion, which consistently affects shale gas transport [136]. However, it is computationally demanding. A 3D mathematical nanoscale pore network modelling (PNM) has been developed to simulate shale gas flow, considering both Klinkenberg slip and Knudsen diffusion. This model is simpler and more accurate than the previous method [217]. The simulation results show that the apparent permeability differs from low-pressure laboratory experiments, being closely related to reservoir pore pressure and pore size, and generally lower than laboratory test results at low pressure. However, these methods do not consider the impact of varying organic content on fluid seepage. Yang Yongfei improved the flow equation for shale oil to develop a PNM. Simulation results showed that organic content plays a role in controlling shale oil flow. The control of permeability by total organic carbon (TOC) depends on the slip and adsorption conditions of organic and inorganic materials. As organic content increases, pore throat connectivity improves, and permeability changes (if the flow capacity of organic pores exceeds that of inorganic pores, permeability increases with higher TOC content) [38]. Furthermore, 3D reconstructions based on nanoscale FIB-SEM and nano-CT data were used to investigate changes in shale permeability under varying reservoir stresses. It was concluded that as burial depth increases, pore permeability decreases. Shale pore permeability also shows significant heterogeneity, with large variations depending on location and direction [218]. In recent years, researchers have recognized the critical role of three-phase permeability in oil and gas development, but its progress has been relatively slow [57]. The production process of shale reservoirs often involves three-phase flow. Huang Jingwei used the LBM method and capillary pressure curve experiments to obtain the relative permeabilities of water–oil and oil–gas, concluding that fluid permeability in shale reservoirs is correlated with pore types, with organic pores exhibiting lower permeability. The oil and gas recovery rate depends on mass transfer between the inorganic matrix and fractures [219]. In unconventional oil and gas energy development research, establishing predictive methods for phase permeability curves in nanopores, considering the effects of nano-confinement, and exploring fluid flow mechanisms is of great significance for the efficient development of unconventional oil and gas energy.

6.2.3. Surface Adsorption

Under the confinement of nanoscale pore sizes, fluid molecules exhibit stronger adsorption to the wall surface. Liquids show wall adsorption characteristics similar to gases, with higher density near the wall and the lowest density at the pore center. Configuration-bias grand-canonical transition matrix MC simulations can be used to study the distribution of fluid density in nanopores [160]. As shown in Figure 12a: Gas phase density exhibits a bimodal distribution, and as pore size decreases, the adsorbed fluid density near the pore wall decreases. Liquid phase density shows a trimodal distribution at a pore size of 15 Å, with lower peak values, but at pore sizes of 9 Å and 10 Å, it resembles the bimodal characteristics of the gas phase. MD simulations are also commonly employed to study adsorption between molecules and pore walls. Recent findings indicate that in unconventional reservoir nanopores, the adsorbed layer is significantly thicker compared to the bulk phase [47]. The thickness of the adsorption layer depends on pore size and oil composition, with heavier components displaying stronger adsorption tendencies. Pore shape also influences adsorption layer thickness (Figure 12b) [45].
Previous research did not address the impact of pressure on adsorption amounts for different components. Jin Zhehui and Firoozabadi used GCMC to study hydrocarbon mixture adsorption in carbon nanotubes. They found that with increasing pressure in nanopores, the adsorption of lighter components decreased, while heavier components (C1-nC14) showed increased adsorption [220]. Dong Xiaohu combined multicomponent potential theory of adsorption with the P-R EOS to study the effect of pore heterogeneity on the confined behavior of fluids (methane, ethane, propane) in nanopores. The study showed that in hydrocarbon fluids, as the amount of heavy components increases, the confined behavior of the fluid decreases. As nanopore size decreases, the effect of surface heterogeneity on confined behavior increases. Compared to smooth surfaces, fluid mixtures adsorb more near the pore wall, with the mole fraction of heavy components increasing near the wall and that of light components decreasing (Figure 12c) [197]. Other studies also show that heavy components exhibit stronger adsorption effects in nanopores compared to lighter components [47,147,156]. Wang Yuhang and Aryana used a modified EOS to study the effect of pressure on fluid transport properties in sealed nanopores of different sizes. They concluded that at relatively low pressure (0.5 MPa), Knudsen diffusion dominates transport, while at higher pressure (2.0 MPa), the flow mechanism is influenced by pore size [221]. Moreover, different pore types show distinct adsorption behaviors. Zhao Guozhong used NMR and MD to investigate Longmaxi shale oil, revealing that organic pores adsorb more than twice as much oil as inorganic pores. Under nano-confinement effects, fluids in small pores exhibit condensate gas-like characteristics, contrasting with the volatile state seen in larger pores [94].

6.3. Summary

The phase behavior and flow mechanisms of fluids in unconventional oil and gas resources change under nano-confinement effects, but current studies still present inconsistent conclusions and understanding. Nano-confinement effects modify the phase diagrams of fluids, leading to a contraction trend. However, variations in critical parameters remain inconsistent, indicating that results obtained from different methods lack uniformity and require further investigation to clarify this aspect. Pore size classifications under nano-confinement effects remain inconsistent, with most studies identifying 10 nm as the threshold where significant impacts on fluid properties occur. Furthermore, fluid flow behavior undergoes changes under nano-confinement effects, necessitating the inclusion of high-viscosity layers formed by wall adsorption in flow capacity calculations. Variations in wall roughness and surface geometry further impact fluid movement. This section presents a comparative analysis of results obtained using different research methods, helping to identify current research gaps and advance related studies, ultimately facilitating better development and utilization of unconventional oil and gas resources.

7. Practical Application in the Industry

Research on nano-confinement effects holds significant value for the practical application of unconventional oil and gas resource development, focusing on optimizing development parameters, studying multiscale seepage mechanisms, and using CO2 injection to enhance oil recovery [61,94,222,223].
During unconventional oil and gas development, nano-confinement effects in reservoir matrix pores impact fluid phase behavior and seepage characteristics. Failure to accurately understand these changes in nanoscale pores leads to a rapid production decline during development. Employing nanoscale research methods and molecular-scale simulation techniques can provide detailed micro-scale seepage parameters, enabling optimization of reservoir models, development well networks, and system designs [224,225]. Du Fengshuang et al. used simulation methods to study the impact of nano-confinement effects on fluid properties and phase behavior. Their findings suggest that nano-confinement effects resemble gravity in enhancing oil recovery, with a more pronounced impact as pore size decreases [226].
Hydraulic fracturing is commonly used in unconventional oil and gas development to enhance reservoir fluid flow capacity, but rapid production decline remains a prevalent issue. Studies indicate that unconventional reservoirs contain abundant nanoscale pores, bedding fractures, and large fractures created by hydraulic fracturing, exhibiting pronounced multiscale seepage characteristics [21]. A key issue is that residual oil is predominantly stored in nanoscale matrix pores, rendering it unrecoverable. Developing imbibition in nanoscale pores and integrating it with multiscale flow in pore–fracture networks presents a critical engineering challenge.
Additionally, microscale studies aid in improving CO2 sequestration in unconventional reservoirs and related theoretical frameworks, addressing environmental concerns [227]. Studies show that nano-confinement effects significantly influence CO2 adsorption/desorption and miscible displacement. Lee et al. reported that nano-confinement effects increased shale oil production by 42% during CO2 huff-n-puff operations but reduced oil production by 4% due to heavy component precipitation [223]. The competitive adsorption of CO2 and hydrocarbon molecules is strongly influenced by nano-confinement effects, significantly enhancing the mobility of oil and gas in nanopores. Moreover, under nano-confinement, the miscible pressure between CO2 and crude oil is reduced. Jia Zhihao et al. introduced a component mass transfer rate to establish a gas–liquid non-equilibrium thermodynamic model incorporating nano-confinement effects to simulate CO2 displacement efficiency [228].
In summary, research on nano-confinement effects provides crucial theoretical foundations and technical support for the efficient development and utilization of unconventional oil and gas resources, with significant engineering applications.

8. Current Challenges and Future Directions

Although the effects of nano-confinement on fluid phase behavior have been widely studied and generally understood, there are still some inconsistencies in the understanding of how nanopores influence the critical parameters of different fluid components. While many agree that nano-confinement effects lead to a contraction of fluid P-T phase diagrams compared to bulk phases, most research indicates that fluids with different pore sizes and components display specific characteristics. As a result, independent analysis of their physical parameters is necessary. Currently, experimental techniques for fluid phase behavior rely mainly on nanofluidic technology, with simulations largely based on MC methods and theoretical calculations focusing on modified P-R EOS. However, nanofluidic technology still has limitations compared to actual reservoir conditions, simulation methods require experimental validation and theoretical calculations must account for many influencing factors. In the future, it is necessary to summarize the general principles from current findings and to improve and update experimental techniques to better accommodate the measurement and analysis of fluid properties in different pore sizes and components.
Furthermore, numerical simulation methods for nanopore-scale unconventional reservoirs often require significant computational resources and time. They also struggle to accurately reflect complex real reservoir conditions, such as changes in wettability of pore walls and molecular interactions. Physical experimental methods also face limitations due to the availability of observable data, leaving substantial room for future research and development. The combination of artificial intelligence (AI) with nano-confinement effects in unconventional oil and gas energy will be a key focus in future studies, with emphasis on deep learning [229,230], large-scale AI models [231] and machine learning techniques [232]. For example, using AI techniques to analyze and predict nanoscale research findings can provide more accurate insights into the influencing factors of macroscopic parameters and their correlations. In the future, utilizing AI to create a multiscale simulation workflow linking molecular, mesoscale, core-scale, and even reservoir-scale models will significantly enhance the progress of multiscale simulations.
Nano-confinement effects in unconventional reservoirs are significant. As research progresses, accounting for these effects in simulations will greatly enhance their accuracy. In the near future, the continued refinement and application of these physical experiments, numerical simulations, and theoretical calculations for studying nano-confinement effects at the microscale, along with the integration of various research methods, will lead to a clearer understanding of fluid mechanisms in unconventional oil and gas energy development, guiding the advancement of its practical applications. Furthermore, future studies should focus on advancing small-scale experimental analysis and multiscale simulation techniques. Although there is still room for growth in small-scale simulation methods, researchers have already conducted significant work in this area. Currently, the pressing challenges we face are in small-scale experimental analysis techniques and multiscale simulation research. Advancing small-scale experimental analysis techniques requires not only continuous updates to existing methods but also the introduction of cutting-edge technologies from high-precision fields. Achieving multiscale simulation requires not only enhanced computational power but also a deeper understanding of the mechanisms behind multiscale simulations.

9. Conclusions

This paper provides a comprehensive analysis of the impact of nano-confinement effects on fluid phase behavior and flow mechanisms, with a focus on the relevant research progress in physical experiments, numerical simulations, and theoretical calculations methods in nanoscale studies for unconventional oil and gas energy development.
The differences and similarities in findings from different research methods on nanoscale fluid properties are compared and analyzed to deepen the understanding of nano-confinement effects.
The main insights gained in this paper are as follows:
  • Fluid critical parameters in nanopores differ from those in the bulk phase, but there is no consensus on how these parameters change.
  • Most studies suggest that nano-confinement effects cannot be ignored in pores smaller than 10 nm, becoming more pronounced as pore size decreases.
  • The diffusion rate of fluids in nanopores decreases as the degree of confinement increases.
  • Permeability also depends on pressure and other parameters like fluid–solid interactions.
  • Fluid in nanopores forms a high-viscosity layer on the pore walls, and the number of layers depends on the nature of the fluid and the wall surface.
Finally, Table 5 provides a summary and analysis of the advantages and disadvantages of various research methods.
This study presents a holistic review of nano-confinement in shale nano-pores and its associated influencing factors. The review considers physical experiments, numerical simulation and theoretical methods traditionally used to examine nano-confinement effects in porous media. The results analyzed and reviewed in this study are quite useful and will assist in a broader understanding of the subject matter.

Author Contributions

Conceptualization, G.W. and R.S.; methodology, S.X. and G.W.; formal analysis, G.W.; investigation, G.W., Y.M. and Q.D.; data curation, G.W.; writing—original draft preparation, G.W. and R.S.; writing—review and editing, R.S. and S.X.; supervision, S.C., H.S. and X.L.; project administration, S.C. and H.S.; funding acquisition, S.X. and X.L. All authors have read and agreed to the published version of the manuscript.

Funding

This research was funded by the project of CNPC—In Situ Characterization of Shale Oil and Gas Reservoirs and Fluids, grant number 2023ZZ0801.

Data Availability Statement

Data can be found within this study.

Conflicts of Interest

R.S., S.X., S.C., H.S. and X.L. were employed by China National Petroleum Corporation. The remaining authors declare that the research was conducted in the absence of any commercial or financial relationships that could be construed as a potential conflict of interest. The authors declare that this study received funding from China National Petroleum Corporation (CNPC). The funder was not involved in the study design, collection, analysis, interpretation of data, the writing of this article or the decision to submit it for publication.

References

  1. Zou, C.; Dong, D.; Wang, S.; Li, J.; Li, X.; Wang, Y.; Li, D.; Cheng, K. Geological characteristics and resource potential of shale gas in China. Pet. Explor. Dev. 2010, 37, 641–653. [Google Scholar] [CrossRef]
  2. Sun, H.; Wang, H.; Yang, Y.; Lyu, Q.; Zhang, F.; Liu, Z.; Lyu, J.; Chen, T.; Jiang, T.; Zhao, P.; et al. Iteration And Evaluation of Shale Oil Development Technology for Continental Rift Lake Basins. Pet. Explor. Dev. 2024, 51, 993–1008. [Google Scholar] [CrossRef]
  3. BP. Statistical Review of World Energy. 2024. Available online: https://www.bp.com/content/dam/bp/business-sites/en/global/corporate/pdfs/energy-economics/energy-outlook/bp-energy-outlook-2024.pdf (accessed on 22 December 2024).
  4. Muther, T.; Qureshi, H.A.; Syed, F.I.; Aziz, H.; Siyal, A.; Dahaghi, A.K.; Negahban, S. Unconventional hydrocarbon resources: Geological statistics, petrophysical characterization, and field development strategies. J. Pet. Explor. Prod. Technol. 2022, 12, 1463–1488. [Google Scholar] [CrossRef]
  5. World Energy Resources; IEA: Paris, France, 2020.
  6. Annual Energy Outlook; EIA: Washington, DC, USA, 2021.
  7. Smith, M.B.; Montgomery, C. Hydraulic Fracturing, 1st ed.; CRC Press: Boca Raton, FL, USA, 2015. [Google Scholar]
  8. Zhao, J.; Ren, L.; Lin, C.; Lin, R.; Hu, D.; Wu, J.; Song, Y.; Shen, C.; Tang, D.; Jiang, H. A review of deep and ultra-deep shale gas fracturing in China: Status and directions. Renew. Sustain. Energy Rev. 2025, 209, 115111. [Google Scholar] [CrossRef]
  9. Liu, J.; Sheng, J.J. Experimental investigation of surfactant enhanced spontaneous imbibition in Chinese shale oil reservoirs using NMR tests. J. Ind. Eng. Chem. 2019, 72, 414–422. [Google Scholar] [CrossRef]
  10. Zou, C.; Zhu, R.; Wu, S.; Yang, Z.; Tao, S.; Yuan, X.; Hou, L.; Yang, H.; Xu, C.; Li, D.; et al. Types, Characteristics, Mechanisms and Prospects of Conventional and Unconventional Oil and Gas Aggregation—An Example of Tight Oil and Tight Gas in China. J. Pet. 2012, 33, 173–187. [Google Scholar]
  11. Recent IUPAC recommendations. Anal. Proc. 1989, 26, 142–145. [CrossRef]
  12. Phuong, V.T.; Chokbunpiam, T.; Fritzsche, S.; Remsungnen, T.; Rungrotmongkol, T.; Chmelik, C.; Caro, J.; Hannongbua, S. Methane in zeolitic imidazolate framework ZIF-90: Adsorption and diffusion by molecular dynamics and Gibbs ensemble Monte Carlo. Microporous Mesoporous Mater. 2016, 235, 69–77. [Google Scholar] [CrossRef]
  13. Chen, L.; Jiang, Z.X.; Jiang, S.; Liu, K.Y.; Yang, W.; Tan, J.Q.; Gao, F.L. Nanopore Structure and Fractal Characteristics of Lacustrine Shale: Implications for Shale Gas Storage and Production Potential. Nanomaterials 2019, 9, 390. [Google Scholar] [CrossRef]
  14. Wu, J.G.; Luo, C.; Zhong, K.S.; Li, Y.; Li, G.L.; Du, Z.M.; Yang, J.J. Innovative characterization of organic nanopores in marine shale by the integration of HIM and SEM. Energy 2023, 282, 128390. [Google Scholar] [CrossRef]
  15. Chandra, D.; Vishal, V. A critical review on pore to continuum scale imaging techniques for enhanced shale gas recovery. Earth-Sci. Rev. 2021, 217, 103638. [Google Scholar] [CrossRef]
  16. Dong, X.; Liu, H.; Hou, J.; Wu, K.; Chen, Z. Phase Equilibria of Confined Fluids in Nanopores of Tight and Shale Rocks Considering the Effect of Capillary Pressure and Adsorption Film. Ind. Eng. Chem. Res. 2016, 55, 798–811. [Google Scholar] [CrossRef]
  17. Zhong, J.; Zandavi, S.H.; Li, H.; Bao, B.; Persad, A.H.; Mostowfi, F.; Sinton, D. Condensation in One-Dimensional Dead-End Nanochannels. ACS Nano 2017, 11, 304–313. [Google Scholar] [CrossRef] [PubMed]
  18. Firincioglu, T.; Ozkan, E.; Ozgen, C. Thermodynamics of Multiphase Flow in Unconventional Liquids-Rich Reservoirs. In Proceedings of the SPE Annual Technical Conference and Exhibition, San Antonio, TX, USA, 8–10 October 2012; p. SPE–159869-MS. [Google Scholar]
  19. Tan, S.P.; Qiu, X.; Dejam, M.; Adidharma, H. Critical Point of Fluid Confined in Nanopores: Experimental Detection and Measurement. J. Phys. Chem. C 2019, 123, 9824–9830. [Google Scholar] [CrossRef]
  20. Feng, Q.; Xu, S.; Xing, X.; Zhang, W.; Wang, S. Advances and challenges in shale oil development: A critical review. Adv. Geo-Energy Res. 2020, 4, 406–418. [Google Scholar] [CrossRef]
  21. Song, Y.L.; Song, Z.J.; Chen, Z.X.; Zhang, L.C.; Zhang, Y.F.; Feng, D.; Wu, Z.B.; Wu, J.P. Fluid Phase Behavior in Multi-Scale Shale Reservoirs With Nano-Confinement Effect. Energy 2024, 289, 130027. [Google Scholar] [CrossRef]
  22. Yuan, S.; Lei, Z.; Li, J.; Yao, Z.; Li, B.; Wang, R.; Liu, Y.; Wang, Q. Key theoretical and technical issues and countermeasures for effective development of Gulong shale oil, Daqing Oilfield, NE China. Pet. Explor. Dev. 2023, 50, 638–650. [Google Scholar] [CrossRef]
  23. Bukowski, B.C.; Keil, F.J.; Ravikovitch, P.I.; Sastre, G.; Snurr, R.Q.; Coppens, M.-O. Connecting theory and simulation with experiment for the study of diffusion in nanoporous solids. Adsorpt.-J. Int. Adsorpt. Soc. 2021, 27, 683–760. [Google Scholar] [CrossRef]
  24. Knudsen, M. The laws of molecular flow and of inner friction flow of gases through tubes. J. Membr. Sci. 1995, 100, 23–25. [Google Scholar] [CrossRef]
  25. Ning, Z.; Wang, B.; Yang, F.; Zeng, Y.; Chen, J.e.; Zhang, L. Microscale effect of microvadose in shale reservoirs. Pet. Explor. Dev. 2014, 41, 492–499. [Google Scholar] [CrossRef]
  26. Wu, K.; Chen, Z.; Li, J.; Lei, Z.; Xu, J.; Wang, K.; Li, R.; Dong, X.; Peng, Y.; Yang, S.; et al. Nanoconfinement Effect on n-Alkane Flow. J. Phys. Chem. C 2019, 123, 16456–16461. [Google Scholar] [CrossRef]
  27. Yao, J.; Song, W.; Wang, D.; Sun, H.; Li, Y. Multi-scale pore network modelling of fluid mass transfer in nano-micro porous media. Int. J. Heat Mass Transf. 2019, 141, 156–167. [Google Scholar] [CrossRef]
  28. Geng, L.; Li, G.; Zitha, P.; Tian, S.; Sheng, M.; Fan, X. A diffusion–viscous flow model for simulating shale gas transport in nano-pores. Fuel 2016, 181, 887–894. [Google Scholar] [CrossRef]
  29. Goyal, I.; Srivastava, S.; Tankeshwar, K. Controlling Diffusion by Varying Width of Layers in Nano Channel. Nano-Micro Lett. 2012, 4, 154–157. [Google Scholar] [CrossRef]
  30. He, J.; Ju, Y.; Lammers, L.; Kulasinski, K.; Zheng, L. Tortuosity of kerogen pore structure to gas diffusion at molecular- and nano-scales: A molecular dynamics simulation. Chem. Eng. Sci. 2020, 215, 115460. [Google Scholar] [CrossRef]
  31. Wang, Y.; Xue, J.; Wang, D.; Xue, Q. Lattice Boltzmann method for simulation of shale gas flow in kerogen nano-pores considering temperature dependent adsorption. Int. J. Oil Gas Coal Technol. 2020, 23, 409–426. [Google Scholar] [CrossRef]
  32. Xu, R.; Prodanović, M. Effect of pore geometry on nitrogen sorption isotherms interpretation: A pore network modeling study. Fuel 2018, 225, 243–255. [Google Scholar] [CrossRef]
  33. Gibbs, J.W. On the equilibrium of heterogeneous substances. Am. J. Sci. Arts 1878, 3, 441–458. [Google Scholar] [CrossRef]
  34. Zeng, K.; Xu, R.; Lu, T.; Tian, Z.; Jiang, P. NMR Measurements for Gas Adsorption Characterization on Shale: State of the Art and Perspectives. Energy Fuels 2023, 37, 8824–8835. [Google Scholar] [CrossRef]
  35. Javadpour, F. Nanopores and Apparent Permeability of Gas Flow in Mudrocks (Shales and Siltstone). J. Can. Pet. Technol. 2009, 48, 16–21. [Google Scholar] [CrossRef]
  36. Javadpour, F.; Fisher, D.; Unsworth, M. Nanoscale Gas Flow in Shale Gas Sediments. J. Can. Pet. Technol. 2007, 46, PETSOC-07-10-06. [Google Scholar] [CrossRef]
  37. Yang, Z.; Liu, X.; Li, H.; Lei, Q.; Luo, Y.; Wang, X. Analysis on the influencing factors of imbibition and the effect evaluation of imbibition in tight reservoirs. Pet. Explor. Dev. 2019, 46, 779–785. [Google Scholar] [CrossRef]
  38. Yang, Y.; Wang, K.; Zhang, L.; Sun, H.; Zhang, K.; Ma, J. Pore-scale simulation of shale oil flow based on pore network model. Fuel 2019, 251, 683–692. [Google Scholar] [CrossRef]
  39. Arain, A.H.; Negash, B.M.; Yekeen, N.; Farooqi, A.S.; Alshareef, R.S. Synergising nanoparticles and low salinity waterflooding for enhanced oil recovery: A state-of-the-art review. J. Mol. Liq. 2024, 400, 124495. [Google Scholar] [CrossRef]
  40. Ahmadi, M.A.; Shadizadeh, S.R. Experimental investigation of a natural surfactant adsorption on shale-sandstone reservoir rocks: Static and dynamic conditions. Fuel 2015, 159, 15–26. [Google Scholar] [CrossRef]
  41. Zhang, Z.; Bai, M.; Xu, L.; Du, S.; Liu, Y.; Yang, E.; Shan, J. Study on Oil Extraction Characteristics in Micropores of a Typical Terrestrial Shale Reservoir in China by CO2 Injection and Surfactant Imbibition. Energy Fuels 2024, 38, 6927–6937. [Google Scholar] [CrossRef]
  42. Bao, B.; Riordon, J.; Mostowfi, F.; Sinton, D. Microfluidic and nanofluidic phase behaviour characterization for industrial CO2, oil and gas. Lab Chip 2017, 17, 2740–2759. [Google Scholar] [CrossRef]
  43. Salahshoor, S.; Fahes, M.; Teodoriu, C. A review on the effect of confinement on phase behavior in tight formations. J. Nat. Gas Sci. Eng. 2018, 51, 89–103. [Google Scholar] [CrossRef]
  44. Didar, B.R.; Akkutlu, I.Y. Pore-Size Dependence of Fluid Phase Behavior and Properties in Organic-Rich Shale Reservoirs. In Proceedings of the SPE International Symposium on Oilfield Chemistry, The Woodlands, TX, USA, 8–10 April 2013; p. SPE–164099-MS. [Google Scholar]
  45. Wang, S.; Feng, Q.; Javadpour, F.; Xia, T.; Li, Z. Oil adsorption in shale nanopores and its effect on recoverable oil-in-place. Int. J. Coal Geol. 2015, 147–148, 9–24. [Google Scholar] [CrossRef]
  46. Baek, S.; Yucel Akkutlu, I. CO2 Stripping of Kerogen Condensates in Source Rocks. SPE J. 2019, 24, 1415–1434. [Google Scholar] [CrossRef]
  47. Ambrose, R.J.; Hartman, R.C.; Diaz-Campos, M.; Akkutlu, I.Y.; Sondergeld, C.H. Shale Gas-in-Place Calculations Part I: New Pore-Scale Considerations. SPE J. 2011, 17, 219–229. [Google Scholar] [CrossRef]
  48. Su, Y.; Sun, Q.; Wang, W.; Guo, X.; Xu, J.; Li, G.; Pu, X.; Han, W.; Shi, Z. Spontaneous imbibition characteristics of shale oil reservoir under the influence of osmosis. Int. J. Coal Sci. Technol. 2022, 9, 69. [Google Scholar] [CrossRef]
  49. Yan, X.; Dai, C.; Wang, R.; Liu, H.; Meng, S.; Jin, X.; Hu, Y.; Wu, Y. Experimental study on countercurrent imbibition in tight oil reservoirs using nuclear magnetic resonance and AFM: Influence of liquid–liquid/solid interface characteristics. Fuel 2024, 358, 130026. [Google Scholar] [CrossRef]
  50. Jiang, T.; Shen, Z.; Wang, L.; Qi, Z.; Xiao, B.; Qin, Q.; Fan, X.; Wang, Y.; Qu, H. Optimization Method of fracturing fluid volume intensity for SRV fracturing technique in shale oil reservoir based on forced imbibition: A case study of well X-1 in Biyang Sag of Nanxiang Basin, China. Pet. Explor. Dev. 2024, 51, 674–683. [Google Scholar] [CrossRef]
  51. Dehghanpour, H.; Lan, Q.; Saeed, Y.; Fei, H.; Qi, Z. Spontaneous Imbibition of Brine and Oil in Gas Shales: Effect of Water Adsorption and Resulting Microfractures. Energy Fuels 2013, 27, 3039–3049. [Google Scholar] [CrossRef]
  52. Werder, T.; Walther, J.H.; Jaffe, R.L.; Halicioglu, T.; Koumoutsakos, P. On the water-carbon interaction for use in molecular dynamics simulations of graphite and carbon nanotubes. J. Phys. Chem. B 2003, 107, 1345–1352. [Google Scholar] [CrossRef]
  53. Tolman, R.C. The Effect of Droplet Size on Surface Tension. J. Chem. Phys. 1949, 17, 333–337. [Google Scholar] [CrossRef]
  54. Liu, J.; Sheng, J.J.; Wang, X.; Ge, H.; Yao, E. Experimental study of wettability alteration and spontaneous imbibition in Chinese shale oil reservoirs using anionic and nonionic surfactants. J. Pet. Sci. Eng. 2019, 175, 624–633. [Google Scholar] [CrossRef]
  55. Yao, Y.; Wei, M.; Bai, B. Descriptive statistical analysis of experimental data for wettability alteration with surfactants in carbonate reservoirs. Fuel 2022, 310, 122110. [Google Scholar] [CrossRef]
  56. Du, M.; Yang, Z.; Lyu, W.; Li, Z.; Wang, G.; Chen, X.; Qi, X.; Yao, L.; Zhang, Y.; Jia, N.; et al. Experiment of dynamic seepage of tight/shale oil under matrix fracture coupling. Pet. Explor. Dev. 2024, 51, 403–415. [Google Scholar] [CrossRef]
  57. Mei, Y.; Lv, W.; Zhou, X.; Huang, J.; Jia, N.; Wang, G. Current methods for measuring three-phase relative permeability and its influencing factors. Adv. Geo-Energy Res. 2023, 10, 21–38. [Google Scholar] [CrossRef]
  58. Nguyen, P.; Mohaddes, D.; Riordon, J.; Fadaei, H.; Lele, P.; Sinton, D. Fast Fluorescence-Based Microfluidic Method for Measuring Minimum Miscibility Pressure of CO2 in Crude Oils. Anal. Chem. 2015, 87, 3160–3164. [Google Scholar] [CrossRef] [PubMed]
  59. Wang, Z.; Liu, T.; Liu, S.; Jia, C.; Yao, J.; Sun, H.; Yang, Y.; Zhang, L.; Delshad, M.; Sepehrnoori, K.; et al. Adsorption Effects on CO2-Oil Minimum Miscibility Pressure in Tight Reservoirs. Energy 2024, 288, 129815. [Google Scholar] [CrossRef]
  60. Pan, X.; Sun, L.; Chen, F.; Huo, X.; Wang, Y.; Feng, C.; Zheng, X.; Zhang, Z. Minimum Miscibility Pressure of the CO2-Hydrocarbon System Based on Nanofluidics. Energy Fuels 2024, 38, 10904–10913. [Google Scholar] [CrossRef]
  61. Song, Y.L.; Song, Z.J.; Meng, Y.F.; Chen, Z.X.; Han, X.; Feng, D. Multi-Phase Behavior And Pore-Scale Flow in Medium-High Maturity Continental Shale Reservoirs With Oil, CO2, And Water. Chem. Eng. J. 2024, 484, 149679. [Google Scholar] [CrossRef]
  62. Sun, Q.; Zhang, N.; Zhu, P.; Liu, W.; Guo, L.; Fu, S.; Bhusal, A.; Wang, S. Confined Fluid Interfacial Tension and Minimum Miscibility Pressure Prediction in Shale Nanopores. Fuel 2024, 364, 130949. [Google Scholar] [CrossRef]
  63. Bocquet, L. Nanofluidics coming of age. Nat. Mater. 2020, 19, 254–256. [Google Scholar] [CrossRef]
  64. Bocquet, L.; Charlaix, E. Nanofluidics, from bulk to interfaces. Chem. Soc. Rev. 2010, 39, 1073–1095. [Google Scholar] [CrossRef]
  65. Sattari, A.; Hanafizadeh, P.; Hoorfar, M. Multiphase flow in microfluidics: From droplets and bubbles to the encapsulated structures. Adv. Colloid Interface Sci. 2020, 282, 102208. [Google Scholar] [CrossRef]
  66. Sinton, D. Energy: The microfluidic frontier. Lab Chip 2014, 14, 3127–3134. [Google Scholar] [CrossRef]
  67. Bonnet, J.; Lenormand, R. Ralisation de micromodles pour l’tude des coulements polyphasiques en milieux poreux. Oil Gas Sci. Technol. Rev. L Inst. Fr. Pet. 1977, 32, 477–490. [Google Scholar]
  68. Shim, J.-u.; Cristobal, G.; Link, D.R.; Thorsen, T.; Jia, Y.; Piattelli, K.; Fraden, S. Control and measurement of the phase behavior of aqueous solutions using microfluidics. J. Am. Chem. Soc. 2007, 129, 8825–8835. [Google Scholar] [CrossRef] [PubMed]
  69. Bao, B.; Zhao, S. A review of experimental nanofluidic studies on shale fluid phase and transport behaviors. J. Nat. Gas Sci. Eng. 2021, 86, 103745. [Google Scholar] [CrossRef]
  70. Zhang, K.; Jia, N.; Li, S.; Liu, L. Static and dynamic behavior of CO2 enhanced oil recovery in shale reservoirs: Experimental nanofluidics and theoretical models with dual-scale nanopores. Appl. Energy 2019, 255, 113752. [Google Scholar] [CrossRef]
  71. Sullivan, M.T.; Angelescu, D.E. Microfluidic Bubble Point Measurement Using Thermal Nucleation. Energy Fuels 2016, 30, 2655–2661. [Google Scholar] [CrossRef]
  72. Luther, S.K.; Schuster, J.J.; Leipertz, A.; Braeuer, A. Non-invasive quantification of phase equilibria of ternary mixtures composed of carbon dioxide, organic solvent and water. J. Supercrit. Fluids 2013, 84, 146–154. [Google Scholar] [CrossRef]
  73. Lefortier, S.G.R.; Hamersma, P.J.; Bardow, A.; Kreutzer, M.T. Rapid microfluidic screening of CO2 solubility and diffusion in pure and mixed solvents. Lab Chip 2012, 12, 3387–3391. [Google Scholar] [CrossRef]
  74. Wang, S.; Liang, Y.; Feng, Q.; Javadpour, F. Sticky layers affect oil transport through the nanopores of realistic shale kerogen. Fuel 2022, 310, 122480. [Google Scholar] [CrossRef]
  75. Bocquet, L.; Tabeling, P. Physics and technological aspects of nanofluidics. Lab Chip 2014, 14, 3143–3158. [Google Scholar] [CrossRef]
  76. Holt, J.K.; Park, H.G.; Wang, Y.; Stadermann, M.; Artyukhin, A.B.; Grigoropoulos, C.P.; Noy, A.; Bakajin, O. Fast Mass Transport Through Sub-2-Nanometer Carbon Nanotubes. Science 2006, 312, 1034–1037. [Google Scholar] [CrossRef]
  77. Mostowfi, F.; Molla, S.; Tabeling, P. Determining phase diagrams of gas–liquid systems using a microfluidic PVT. Lab Chip 2012, 12, 4381–4387. [Google Scholar] [CrossRef] [PubMed]
  78. Pinho, B.; Girardon, S.; Bazer-Bachi, F.; Bergeot, G.; Marre, S.; Aymonier, C. A microfluidic approach for investigating multicomponent system thermodynamics at high pressures and temperatures. Lab Chip 2014, 14, 3843–3849. [Google Scholar] [CrossRef] [PubMed]
  79. Bao, B.; Riordon, J.; Xu, Y.; Li, H.; Sinton, D. Direct Measurement of the Fluid Phase Diagram. Anal Chem 2016, 88, 6986–6989. [Google Scholar] [CrossRef] [PubMed]
  80. Lu, Z.; Wan, Y.; Xu, L.; Fang, D.; Wu, H.; Zhong, J. Nanofluidic Study of Multiscale Phase Transitions And Wax Precipitation in Shale Oil Reservoirs. Energies 2024, 17, 2415. [Google Scholar] [CrossRef]
  81. Liu, N.; Aymonier, C.; Lecoutre, C.; Garrabos, Y.; Marre, S. Microfluidic approach for studying CO2 solubility in water and brine using confocal Raman spectroscopy. Chem. Phys. Lett. 2012, 551, 139–143. [Google Scholar] [CrossRef]
  82. Alfi, M.; Nasrabadi, H.; Banerjee, D. Experimental investigation of confinement effect on phase behavior of hexane, heptane and octane using lab-on-a-chip technology. Fluid Phase Equilibria 2016, 423, 25–33. [Google Scholar] [CrossRef]
  83. Wang, Y.; Lei, Z.; Sun, L.; Pan, X.; Liu, Y.; Xu, Z.; Zheng, X.; Wang, Y.; Liu, P. Study on The Minimum Miscibility Pressure and Phase Behavior of CO2–Shale Oil in Nanopores. Chem. Eng. J. 2024, 497, 154493. [Google Scholar] [CrossRef]
  84. Zhang, Q.; Dong, Y.; Tong, S.; Li, X.; Wang, L. Nuclear magnetic resonance cryoporometry as a tool to measure pore size distribution of shale rock. Chin. Sci. Bull. 2016, 61, 2387–2394. [Google Scholar] [CrossRef]
  85. Zhang, X.; Wei, B.; You, J.; Liu, J.; Wang, D.; Lu, J.; Tong, J. Characterizing pore-level oil mobilization processes in unconventional reservoirs assisted by state-of-the-art nuclear magnetic resonance technique. Energy 2021, 236, 121549. [Google Scholar] [CrossRef]
  86. Petrov, O.V.; Furó, I. NMR cryoporometry: Principles, applications and potential. Prog. Nucl. Magn. Reson. Spectrosc. 2009, 54, 97–122. [Google Scholar] [CrossRef]
  87. Huang, J.; Xu, K.; Guo, S.; Guo, H. Comprehensive Study on Pore Structures of Shale Reservoirs Based on SEM,NMR and X-CT. Mod. Geol. 2015, 29, 198–205. [Google Scholar]
  88. Firouzi, M.; Rupp, E.C.; Liu, C.W.; Wilcox, J. Molecular simulation and experimental characterization of the nanoporous structures of coal and gas shale. Int. J. Coal Geol. 2014, 121, 123–128. [Google Scholar] [CrossRef]
  89. Fleury, M.; Fabre, R. Comparison of pore size distribution by nmr relaxation and nmr cryoporometry in shales. In Proceedings of the International Symposium of the Society of Core Analysts, St. John’s, NL, Canada, 16–21 August 2015. [Google Scholar]
  90. Tong, S.-q.; Dong, Y.; Zhang, Q.; Elsworth, D.; Liu, S. Quantitative Analysis of Nanopore Structural Characteristics of Lower Paleozoic Shale, Chongqing (Southwestern China): Combining FIB-SEM and NMR Cryoporometry. Energy Fuels 2017, 31, 13317–13328. [Google Scholar] [CrossRef]
  91. McDowell, B.; Tutuncu, A.; Yang, Y. High-Frequency (400 MHz) T2 Measurements Using a Custom-Built NMR Probe, Eagle Ford Shale, Gonzales and La Salle Counties, Texas. In Proceedings of the Unconventional Resources Technology Conference, Houston, TX, USA, 23–25 July 2018; Society of Exploration Geophysicists, American Association of Petroleum Geologists, Society of Petroleum Engineers: Houston, TX, USA, 2018; pp. 2315–2333. [Google Scholar]
  92. Xie, Z.H.; Gan, Z. Value of 20Mhz NMR Core Analysis for Unconventional Mudstones. In Proceedings of the SPWLA 59th Annual Logging Symposium, London, UK, 2–6 June 2018; p. D043S009R005. [Google Scholar]
  93. Zhang, P.; Lu, S.; Li, J.; Chang, X. 1D and 2D Nuclear magnetic resonance (NMR) relaxation behaviors of protons in clay, kerogen and oil-bearing shale rocks. Mar. Pet. Geol. 2020, 114, 104210. [Google Scholar] [CrossRef]
  94. Zhao, G.; Cheng, L.; Jia, P.; Liu, Y.; Feng, H.; Kuang, T.; Wang, Q. Initial Occurrence State and Movability Evaluation of the Gulong Shale Oil Reservoir, Songliao Basin. Energies 2024, 17, 1358. [Google Scholar] [CrossRef]
  95. Liu, D.; Ge, H.; Liu, J.; Shen, Y.; Wang, Y.; Liu, Q.; Jin, C.; Zhang, Y. Experimental investigation on aqueous phase migration in unconventional gas reservoir rock samples by nuclear magnetic resonance. J. Nat. Gas Sci. Eng. 2016, 36, 837–851. [Google Scholar] [CrossRef]
  96. Maojin, T.; Kun, W.; Youlong, Z.; Siyu, W.; Yuyang, F.; Xiangzhi, C. Nuclear magnetic resonance simulations of nano-scale cores and microscopic mechanisms of oil shale. Fuel 2019, 256, 115843. [Google Scholar] [CrossRef]
  97. Huang, X.; Li, X.; Zhang, Y.; Li, T.; Zhang, R. Microscopic production characteristics of crude oil in nano-pores of shale oil reservoirs during CO2 huff and puff. Pet. Explor. Dev. 2022, 49, 636–643. [Google Scholar] [CrossRef]
  98. Kausik, R.; Fellah, K.; Feng, L.; Simpson, G. High- and Low-Field NMR Relaxometry and Diffusometry of the Bakken Petroleum System. Petrophysics—SPWLA J. Form. Eval. Reserv. Descr. 2017, 58, 341–351. [Google Scholar]
  99. Kausik, R.; Minh, C.C.; Zielinski, L.; Vissapragada, B.; Akkurt, R.; Song, Y.; Liu, C.; Jones, S.; Blair, E. Characterization of Gas Dynamics in Kerogen Nanopores by NMR. In Proceedings of the SPE Annual Technical Conference and Exhibition, Denver, CO, USA, 30 October 2011; p. SPE–147198-MS. [Google Scholar]
  100. Liu, B.; Jiang, X.-W.; Bai, L.-H.; Lu, R.-S. Investigation of oil and water migrations in lacustrine oil shales using 20 MHz 2D NMR relaxometry techniques. Pet. Sci. 2022, 19, 1007–1018. [Google Scholar] [CrossRef]
  101. Zhong, J.; Yan, R.; Zhang, H.; Feng, Y.; Li, N.; Liu, X. A decomposition method of nuclear magnetic resonance T2 spectrum for identifying fluid properties. Pet. Explor. Dev. 2020, 47, 740–752. [Google Scholar] [CrossRef]
  102. Oschkinat, H.; Griesinger, C.; Kraulis, P.J.; Sørensen, O.W.; Ernst, R.R.; Gronenborn, A.M.; Clore, G.M. Three-dimensional NMR spectroscopy of a protein in solution. Nature 1988, 332, 374–376. [Google Scholar] [CrossRef] [PubMed]
  103. Guo, J.; Xie, R.; Xiao, L. Pore-fluid characterizations and microscopic mechanisms of sedimentary rocks with three-dimensional NMR: Tight sandstone as an example. J. Nat. Gas Sci. Eng. 2020, 80, 103392. [Google Scholar] [CrossRef]
  104. Wang, P.; Jiang, Z.; Chen, L.; Yin, L.; Li, Z.; Zhang, C.; Tang, X.; Wang, G. Pore structure characterization for the Longmaxi and Niutitang shales in the Upper Yangtze Platform, South China: Evidence from focused ion beam–He ion microscopy, nano-computerized tomography and gas adsorption analysis. Mar. Pet. Geol. 2016, 77, 1323–1337. [Google Scholar] [CrossRef]
  105. Dunsmuir, J.H.; Ferguson, S.R.; D’Amico, K.L.; Stokes, J.P. X-Ray Microtomography: A New Tool for the Characterization of Porous Media. In Proceedings of the SPE Annual Technical Conference and Exhibition, Dallas, TX, USA, 6–9 October 1991; p. SPE–22860-MS. [Google Scholar]
  106. Fang, Y.; Yang, E.; Guo, S.; Cui, C.; Zhou, C. Study on micro remaining oil distribution of polymer flooding in Class-II B oil layer of Daqing Oilfield. Energy 2022, 254, 124479. [Google Scholar] [CrossRef]
  107. Seright, R.S.; Prodanovic, M.; Lindquist, W.B. X-Ray Computed Microtomography Studies of Fluid Partitioning in Drainage and Imbibition Before and After Gel Placement: Disproportionate Permeability Reduction. SPE J. 2006, 11, 159–170. [Google Scholar] [CrossRef]
  108. Li, W.; Kuang, Y.; Lu, S.; Cheng, Z.; Xue, H.; Shi, L. Porosity Enhancement Potential through Dolomite Mineral Dissolution in the Shale Reservoir: A Case Study of an Argillaceous Dolomite Reservoir in the Jianghan Basin. Energy Fuels 2019, 33, 4857–4864. [Google Scholar] [CrossRef]
  109. Wu, S.; Zhu, R.; Cui, J.; Cui, J.; Bai, B.; Zhang, X.; Jin, X.; Zhu, D.; You, J.; Li, X. Characteristics of lacustrine shale porosity evolution, Triassic Chang 7 Member, Ordos Basin, NW China. Pet. Explor. Dev. 2015, 42, 185–195. [Google Scholar] [CrossRef]
  110. Akbarabadi, M.; Saraji, S.; Piri, M.; Georgi, D.; Delshad, M. Nano-scale experimental investigation of in-situ wettability and spontaneous imbibition in ultra-tight reservoir rocks. Adv. Water Resour. 2017, 107, 160–179. [Google Scholar] [CrossRef]
  111. Backeberg, N.R.; Iacoviello, F.; Rittner, M.; Mitchell, T.M.; Jones, A.P.; Day, R.; Wheeler, J.; Shearing, P.R.; Vermeesch, P.; Striolo, A. Quantifying the anisotropy and tortuosity of permeable pathways in clay-rich mudstones using models based on X-ray tomography. Sci. Rep. 2017, 7, 14838. [Google Scholar] [CrossRef]
  112. Liu, Q.; Sun, M.; Sun, X.; Liu, B.; Ostadhassan, M.; Huang, W.; Chen, X.; Pan, Z. Pore network characterization of shale reservoirs through state-of-the-art X-ray computed tomography: A review. Gas Sci. Eng. 2023, 113, 204967. [Google Scholar] [CrossRef]
  113. Jia, N.; Lv, W.; Liu, Q.; Wang, D.; Liu, F.; Hu, Z. Pore-Scale Modeling of Pressure-Driven Flow and Spontaneous Imbibition in Fracturing-Shut-In-Flowback Process of Tight Oil Reservoirs. Int. J. Energy Res. 2024, 2024, 3505763. [Google Scholar] [CrossRef]
  114. Wei, J.; Li, J.; Yang, Y.; Zhang, A.; Wang, A.; Zhou, X.; Zeng, Q.; Shang, D. Digital-Rock Construction of Shale Oil Reservoir and Microscopic Flow Behavior Characterization. Processes 2023, 11, 697. [Google Scholar] [CrossRef]
  115. Sun, H.; Tao, G.; Vega, S.; Al-Suwaidi, A. Simulation of gas flow in organic-rich mudrocks using digital rock physics. J. Nat. Gas Sci. Eng. 2017, 41, 17–29. [Google Scholar] [CrossRef]
  116. Adeleye, J.O.; Akanji, L.T. A quantitative analysis of flow properties and heterogeneity in shale rocks using computed tomography imaging and finite-element based simulation. J. Nat. Gas Sci. Eng. 2022, 106, 104742. [Google Scholar] [CrossRef]
  117. Wang, T.-Y.; Tian, S.-C.; Liu, Q.-L.; Li, G.-S.; Sheng, M.; Ren, W.-X.; Zhang, P.-P. Pore structure characterization and its effect on methane adsorption in shale kerogen. Pet. Sci. 2021, 18, 565–578. [Google Scholar] [CrossRef]
  118. Qie, Z.; Rabbani, A.; Liang, Y.; Sun, F.; Behnsen, J.; Wang, Y.; Wang, S.; Zhang, Y.; Alhassawi, H.; Gao, J.; et al. Multiscale investigation of pore network heterogeneity and permeability of fluid catalytic cracking (FCC) particles. Chem. Eng. J. 2022, 440, 135843. [Google Scholar] [CrossRef]
  119. Curtis, M.E.; Sondergeld, C.H.; Ambrose, R.J.; Rai, C.S. Microstructural investigation of gas shales in two and three dimensions using nanometer-scale resolution imaging. AAPG Bull. 2012, 96, 665–677. [Google Scholar] [CrossRef]
  120. Ambrose, R.J.; Hartman, R.C.; Diaz-Campos, M.; Akkutlu, I.Y.; Sondergeld, C.H. New Pore-scale Considerations for Shale Gas in Place Calculations. In Proceedings of the SPE Unconventional Gas Conference, Pittsburgh, PA, USA, 23–25 February 2010; p. SPE–131772-MS. [Google Scholar]
  121. Loucks, R.G.; Ruppel, S.C. Mississippian Barnett Shale: Lithofacies and depositional setting of a deep-water shale-gas succession in the Fort Worth Basin, Texas. Aapg Bull. 2007, 91, 579–601. [Google Scholar] [CrossRef]
  122. Sondergeld, C.H.; Ambrose, R.J.; Rai, C.S.; Moncrieff, J. Micro-Structural Studies of Gas Shales. In Proceedings of the SPE Unconventional Gas Conference, Pittsburgh, PA, USA, 23–25 February 2010; p. SPE–131771-MS. [Google Scholar]
  123. Slatt, R.M.; O’Brien, N.R. Pore types in the Barnett and Woodford gas shales: Contribution to understanding gas storage and migration pathways in fine-grained rocks. Aapg Bull. 2011, 95, 2017–2030. [Google Scholar] [CrossRef]
  124. Jiao, K.; Yao, S.; Liu, C.; Gao, Y.; Wu, H.; Li, M.; Tang, Z. The characterization and quantitative analysis of nanopores in unconventional gas reservoirs utilizing FESEM–FIB and image processing: An example from the lower Silurian Longmaxi Shale, upper Yangtze region, China. Int. J. Coal Geol. 2014, 128–129, 1–11. [Google Scholar] [CrossRef]
  125. Hou, Y.; He, S.; Yi, J.; Zhang, B.; Chen, X.; Wang, Y.; Zhang, J.; Cheng, C. Effect of pore structure on methane sorption potential of shales. Pet. Explor. Dev. 2014, 41, 272–281. [Google Scholar] [CrossRef]
  126. Wang, P.; Jiang, Z.; Ji, W.; Zhang, C.; Yuan, Y.; Chen, L.; Yin, L. Heterogeneity of intergranular, intraparticle and organic pores in Longmaxi shale in Sichuan Basin, South China: Evidence from SEM digital images and fractal and multifractal geometries. Mar. Pet. Geol. 2016, 72, 122–138. [Google Scholar] [CrossRef]
  127. Etminan, S.R.; Javadpour, F.; Maini, B.B.; Chen, Z. Measurement of gas storage processes in shale and of the molecular diffusion coefficient in kerogen. Int. J. Coal Geol. 2014, 123, 10–19. [Google Scholar] [CrossRef]
  128. Yang, Y.; Liu, F.; Zhang, Q.; Li, Y.; Wang, K.; Xu, Q.; Yang, J.; Shang, Z.; Liu, J.; Wang, J.; et al. Recent Advances in Multiscale Digital Rock Reconstruction, Flow Simulation, and Experiments during Shale Gas Production. Energy Fuels 2023, 37, 2475–2497. [Google Scholar] [CrossRef]
  129. Pathak, M.; Kweon, H.; Deo, M.; Huang, H. Kerogen Swelling and Confinement: Its implication on Fluid Thermodynamic Properties in Shales. Sci. Rep. 2017, 7, 12530. [Google Scholar] [CrossRef]
  130. Mehmani, A.; Prodanović, M.; Javadpour, F. Multiscale, Multiphysics Network Modeling of Shale Matrix Gas Flows. Transp. Porous Media 2013, 99, 377–390. [Google Scholar] [CrossRef]
  131. Wang, Y.D.; Blunt, M.J.; Armstrong, R.T.; Mostaghimi, P. Deep learning in pore scale imaging and modeling. Earth-Sci. Rev. 2021, 215, 103555. [Google Scholar] [CrossRef]
  132. Wang, F.P.; Reed, R.M.; John, A.; Katherine, G. Pore Networks and Fluid Flow in Gas Shales. In Proceedings of the SPE Annual Technical Conference and Exhibition, New Orleans, LA, USA, 4–7 October 2009; p. SPE–124253-MS. [Google Scholar]
  133. Gad-el-Hak, M. The Fluid Mechanics of Microdevices—The Freeman Scholar Lecture. J. Fluids Eng. Trans. Asme 1999, 121, 5–33. [Google Scholar] [CrossRef]
  134. Roy, S.; Raju, R.; Chuang, H.F.; Cruden, B.A.; Meyyappan, M. Modeling gas flow through microchannels and nanopores. J. Appl. Phys. 2003, 93, 4870–4879. [Google Scholar] [CrossRef]
  135. Pathak, M.; Cho, H.; Deo, M. Experimental and Molecular Modeling Study of Bubble Points of Hydrocarbon Mixtures in Nanoporous Media. Energy Fuels 2017, 31, 3427–3435. [Google Scholar] [CrossRef]
  136. Chen, L.; Zhang, L.; Kang, Q.; Viswanathan, H.S.; Yao, J.; Tao, W. Nanoscale simulation of shale transport properties using the lattice Boltzmann method: Permeability and diffusivity. Sci. Rep. 2015, 5, 8089. [Google Scholar] [CrossRef] [PubMed]
  137. Alder, B.J.; Wainwright, T.E. Studies in Molecular Dynamics. I. General Method. J. Chem. Phys. 1959, 31, 459–466. [Google Scholar] [CrossRef]
  138. Rahman, A. Correlations in the Motion of Atoms in Liquid Argon. Phys. Rev. 1964, 136, A405–A411. [Google Scholar] [CrossRef]
  139. Swai, R.E. A review of molecular dynamics simulations in the designing of effective shale inhibitors: Application for drilling with water-based drilling fluids. J. Pet. Explor. Prod. Technol. 2020, 10, 3515–3532. [Google Scholar] [CrossRef]
  140. Chen, X.; Cao, G.; Han, A.; Punyamurtula, V.K.; Liu, L.; Culligan, P.J.; Kim, T.; Qiao, Y. Nanoscale Fluid Transport: Size and Rate Effects. Nano Lett. 2008, 8, 2988–2992. [Google Scholar] [CrossRef]
  141. Riewchotisakul, S.; Akkutlu, I.Y. Adsorption-Enhanced Transport of Hydrocarbons in Organic Nanopores. SPE J. 2016, 21, 1960–1969. [Google Scholar] [CrossRef]
  142. Billemont, P.; Coasne, B.; De Weireld, G. Adsorption of Carbon Dioxide, Methane, and Their Mixtures in Porous Carbons: Effect of Surface Chemistry, Water Content, and Pore Disorder. Langmuir 2013, 29, 3328–3338. [Google Scholar] [CrossRef]
  143. You, J.; Tian, L.; Zhang, C.; Yao, H.; Dou, W.; Fan, B.; Hu, S. Adsorption behavior of carbon dioxide and methane in bituminous coal: A molecular simulation study. Chin. J. Chem. Eng. 2016, 24, 1275–1282. [Google Scholar] [CrossRef]
  144. Fazelabdolabadi, B.; Alizadeh-Mojarad, A. On the adsorption and hydrodynamics behavior of H2S and CO2 molecules in organic liquids inside nanoslit pores in vicinity of calcite {101¯4} surface. J. Nat. Gas Sci. Eng. 2016, 28, 106–120. [Google Scholar] [CrossRef]
  145. Yang, Y.; Liu, J.; Yao, J.; Kou, J.; Li, Z.; Wu, T.; Zhang, K.; Zhang, L.; Sun, H. Adsorption behaviors of shale oil in kerogen slit by molecular simulation. Chem. Eng. J. 2020, 387, 124054. [Google Scholar] [CrossRef]
  146. Sun, L.; Jia, N.; Feng, C.; Wang, L.; Liu, S.; Lyu, W. Exploration of Oil/Water/Gas Occurrence State in Shale Reservoir by Molecular Dynamics Simulation. Energies 2023, 16, 7253. [Google Scholar] [CrossRef]
  147. Liu, J.; Yang, Y.; Sun, S.; Yao, J.; Kou, J. Flow behaviors of shale oil in kerogen slit by molecular dynamics simulation. Chem. Eng. J. 2022, 434, 134682. [Google Scholar] [CrossRef]
  148. Dubbeldam, D.; Snurr, R.Q. Recent developments in the molecular modeling of diffusion in nanoporous materials. Mol. Simul. 2007, 33, 305–325. [Google Scholar] [CrossRef]
  149. Jin, Z.; Firoozabadi, A. Flow of methane in shale nanopores at low and high pressure by molecular dynamics simulations. J Chem Phys 2015, 143, 104315. [Google Scholar] [CrossRef] [PubMed]
  150. Xu, H.; Yu, H.; Fan, J.; Zhu, Y.; Wang, F.; Wu, H. Two-Phase Transport Characteristic of Shale Gas and Water through Hydrophilic and Hydrophobic Nanopores. Energy Fuels 2020, 34, 4407–4420. [Google Scholar] [CrossRef]
  151. Yu, H.; Fan, J.; Chen, J.; Zhu, Y.; Wu, H. Pressure-dependent transport characteristic of methane gas in slit nanopores. Int. J. Heat Mass Transf. 2018, 123, 657–667. [Google Scholar] [CrossRef]
  152. Zhang, H.; Moh, D.Y.; Wang, X.; Qiao, R. Review on Pore-Scale Physics of Shale Gas Recovery Dynamics: Insights from Molecular Dynamics Simulations. Energy Fuels 2022, 36, 14657–14672. [Google Scholar] [CrossRef]
  153. Wang, S.; Feng, Q.; Javadpour, F.; Yang, Y.-B. Breakdown of Fast Mass Transport of Methane through Calcite Nanopores. J. Phys. Chem. C 2016, 120, 14260–14269. [Google Scholar] [CrossRef]
  154. Sun, S.; Liang, S.; Liu, Y.; Liu, D.; Gao, M.; Tian, Y.; Wang, J. A review on shale oil and gas characteristics and molecular dynamics simulation for the fluid behavior in shale pore. J. Mol. Liq. 2023, 376, 121507. [Google Scholar] [CrossRef]
  155. Welch, W.R.W.; Piri, M. Pore diameter effects on phase behavior of a gas condensate in graphitic one-and two-dimensional nanopores. J. Mol. Model. 2016, 22, 22. [Google Scholar] [CrossRef] [PubMed]
  156. Wang, S.; Zhang, H.; Jin, B.; Qiao, R.; Wen, X.-H. Molecular insights of condensate trapping mechanism in shale oil reservoirs and its implications on lean gas enhanced oil recovery. Chem. Eng. J. 2023, 476, 146366. [Google Scholar] [CrossRef]
  157. Jiang, J.; Sandler, S.I.; Schenk, M.; Smit, B. Adsorption and separation of linear and branched alkanes on carbon nanotube bundles from configurational-bias Monte Carlo simulation. Phys. Rev. B 2005, 72, 045447. [Google Scholar] [CrossRef]
  158. Metropolis, N.; Rosenbluth, A.W.; Rosenbluth, M.N.; Teller, A.H.; Teller, E. Equation of State Calculations by Fast Computing Machines. J. Chem. Phys. 1953, 21, 1087–1092. [Google Scholar] [CrossRef]
  159. Gelb, L.D.; Gubbins, K.E.; Radhakrishnan, R.; Sliwinska-Bartkowiak, M. Phase separation in confined systems. Rep. Prog. Phys. 2000, 63, 727. [Google Scholar] [CrossRef]
  160. Singh, S.K.; Sinha, A.; Deo, G.; Singh, J.K. Vapor-Liquid Phase Coexistence, Critical Properties, and Surface Tension of Confined Alkanes. J. Phys. Chem. C 2009, 113, 7170–7180. [Google Scholar] [CrossRef]
  161. Sobecki, N.; Nieto-Draghi, C.; Di Lella, A.; Ding, D.Y. Phase behavior of hydrocarbons in nano-pores. Fluid Phase Equilibria 2019, 497, 104–121. [Google Scholar] [CrossRef]
  162. Malek, K.; Coppens, M.-O. Knudsen self- and Fickian diffusion in rough nanoporous media. J. Chem. Phys. 2003, 119, 2801–2811. [Google Scholar] [CrossRef]
  163. Coppens, M.-O.; Malek, K. Dynamic Monte-Carlo simulations of diffusion limited reactions in rough nanopores. Chem. Eng. Sci. 2003, 58, 4787–4795. [Google Scholar] [CrossRef]
  164. Malek, K.; Coppens, M.-O. Pore roughness effects on self- and transport diffusion in nanoporous materials. Colloids Surf. A: Physicochem. Eng. Asp. 2002, 206, 335–348. [Google Scholar] [CrossRef]
  165. Malek, K.; Coppens, M.-O. Effects of Surface Roughness on Self- and Transport Diffusion in Porous Media in the Knudsen Regime. Phys. Rev. Lett. 2001, 87, 125505. [Google Scholar] [CrossRef] [PubMed]
  166. Huang, L.; Zhang, L.; Shao, Q.; Lu, L.; Lu, X.; Jiang, S.; Shen, W. Simulations of Binary Mixture Adsorption of Carbon Dioxide and Methane in Carbon Nanotubes:  Temperature, Pressure, and Pore Size Effects. J. Phys. Chem. C 2007, 111, 11912–11920. [Google Scholar] [CrossRef]
  167. Wang, S.; Yao, X.; Feng, Q.; Javadpour, F.; Yang, Y.; Xue, Q.; Li, X. Molecular insights into carbon dioxide enhanced multi-component shale gas recovery and its sequestration in realistic kerogen. Chem. Eng. J. 2021, 425, 130292. [Google Scholar] [CrossRef]
  168. Falk, K.; Coasne, B.; Pellenq, R.; Ulm, F.-J.; Bocquet, L. Subcontinuum mass transport of condensed hydrocarbons in nanoporous media. Nat. Commun. 2015, 6, 6949. [Google Scholar] [CrossRef]
  169. McNamara, G.R.; Zanetti, G. Use of the Boltzmann Equation to Simulate Lattice-Gas Automata. Phys. Rev. Lett. 1988, 61, 2332–2335. [Google Scholar] [CrossRef]
  170. Shan, X.; Chen, H. Lattice Boltzmann model for simulating flows with multiple phases and components. Phys. Rev. E 1993, 47, 1815–1819. [Google Scholar] [CrossRef]
  171. Sukop, M.C.; Or, D. Lattice Boltzmann method for modeling liquid-vapor interface configurations in porous media. Water Resour. Res. 2004, 40, W01509. [Google Scholar] [CrossRef]
  172. Zhao, J.; Wang, J.; Zhang, G.; Zhou, D.; Chen, L.; Viswanathan, H.; Kang, Q. Minireview on Lattice Boltzmann Modeling of Gas Flow and Adsorption in Shale Porous Media: Progress and Future Direction. Energy Fuels 2023, 37, 1511–1524. [Google Scholar] [CrossRef]
  173. Qian, Y.H.; Humières, D.D.; Lallemand, P. Lattice BGK Models for Navier-Stokes Equation. Europhys. Lett. 1992, 17, 479. [Google Scholar] [CrossRef]
  174. Cao, N.Z.; Shen, S.Y.; Jin, S.; Martinez, D. Physical symmetry and lattice symmetry in the lattice Boltzmann method. Phys. Rev. E 1997, 55, R21–R24. [Google Scholar] [CrossRef]
  175. Mei, R.W.; Shyy, W. On the finite difference-based lattice Boltzmann method in curvilinear coordinates. J. Comput. Phys. 1998, 143, 426–448. [Google Scholar] [CrossRef]
  176. Seta, T.; Kono, K.; Martinez, D.; Chen, S. Lattice Boltzmann Scheme for Simulating Two-Phase Flows. JSME Int. J. Ser. B 2000, 43, 305–313. [Google Scholar] [CrossRef]
  177. Sofonea, V.; Sekerka, R.F. Viscosity of finite difference lattice Boltzmann models. J. Comput. Phys. 2003, 184, 422–434. [Google Scholar] [CrossRef]
  178. He, X.Y.; Luo, L.S. Theory of the lattice Boltzmann method: From the Boltzmann equation to the lattice Boltzmann equation. Phys. Rev. E 1997, 56, 6811–6817. [Google Scholar] [CrossRef]
  179. Sofonea, V.; Sekerka, R.F. Boundary conditions for the upwind finite difference Lattice Boltzmann model: Evidence of slip velocity in micro-channel flow. J. Comput. Phys. 2005, 207, 639–659. [Google Scholar] [CrossRef]
  180. Chen, S.; Doolen, G.D. Lattice boltzmann method for fluid flows. Annu. Rev. Fluid Mech. 1998, 30, 329–364. [Google Scholar] [CrossRef]
  181. Guo, Z.L.; Zhao, T.S.; Shi, Y. Physical symmetry, spatial accuracy, and relaxation time of the lattice Boltzmann equation for microgas flows. J. Appl. Phys. 2006, 99, 074903. [Google Scholar] [CrossRef]
  182. Lee, T.; Lin, C.L. A characteristic Galerkin method for discrete Boltzmann equation. J. Comput. Phys. 2001, 171, 336–356. [Google Scholar] [CrossRef]
  183. Zhang, Y.H.; Qin, R.S.; Emerson, D.R. Lattice Boltzmann simulation of rarefied gas flows in microchannels. Phys. Rev. E 2005, 71, 047702. [Google Scholar] [CrossRef]
  184. Gupta, N.; Fathi, E.; Belyadi, F. Effects of nano-pore wall confinements on rarefied gas dynamics in organic rich shale reservoirs. Fuel 2018, 220, 120–129. [Google Scholar] [CrossRef]
  185. Xu, R.; Prodanović, M.; Landry, C.J. Study of subcritical and supercritical gas adsorption behavior in different nanopore systems in shale using lattice Boltzmann method. Int. J. Coal Geol. 2019, 212, 103263. [Google Scholar] [CrossRef]
  186. Dupuis, A.; Kotsalis, E.M.; Koumoutsakos, P. Coupling lattice Boltzmann and molecular dynamics models for dense fluids. Phys. Rev. E 2007, 75, 046704. [Google Scholar] [CrossRef] [PubMed]
  187. He, Y.-L.; Tao, W.-Q. Numerical Solutions of Nano/Microphenomena Coupled With Macroscopic Process of Heat Transfer and Fluid Flow: A Brief Review. J. Heat Transf. 2015, 137, 090801. [Google Scholar] [CrossRef]
  188. Zhao, J.; Kang, Q.; Yao, J.; Zhang, L.; Li, Z.; Yang, Y.; Sun, H. Lattice Boltzmann simulation of liquid flow in nanoporous media. Int. J. Heat Mass Transf. 2018, 125, 1131–1143. [Google Scholar] [CrossRef]
  189. Zhang, T.; Li, X.; Yin, Y.; He, M.; Liu, Q.; Huang, L.; Shi, J. The transport behaviors of oil in nanopores and nanoporous media of shale. Fuel 2019, 242, 305–315. [Google Scholar] [CrossRef]
  190. Peng, D.-Y.; Robinson, D.B. A New Two-Constant Equation of State. Ind. Eng. Chem. Fundam. 1976, 15, 59–64. [Google Scholar] [CrossRef]
  191. Robinson, D.B.; Peng, D.-Y.; Chung, S.Y.K. The development of the Peng—Robinson equation and its application to phase equilibrium in a system containing methanol. Fluid Phase Equilibria 1985, 24, 25–41. [Google Scholar] [CrossRef]
  192. Nojabaei, B.; Johns, R.T.T.; Chu, L. Effect of Capillary Pressure on Phase Behavior in Tight Rocks and Shales. SPE Reserv. Eval. Eng. 2013, 16, 281–289. [Google Scholar] [CrossRef]
  193. Zhang, Y.; Yu, W.; Sepehrnoori, K.; Di, Y. Investigation of nanopore confinement on fluid flow in tight reservoirs. J. Pet. Sci. Eng. 2017, 150, 265–271. [Google Scholar] [CrossRef]
  194. Song, Y.; Song, Z.; Guo, J.; Feng, D.; Chang, X. Phase Behavior and Miscibility of CO2–Hydrocarbon Mixtures in Shale Nanopores. Ind. Eng. Chem. Res. 2021, 60, 5300–5309. [Google Scholar] [CrossRef]
  195. Li, Y.; Li, X.; Teng, S.; Xu, D. Phase Equilibrium Calculations Considering Pore-Throat-Fluid-Molecule Interactions and Capillary Forces. J. Pet. 2015, 36, 511–515. [Google Scholar]
  196. Zhang, Y.; Zhang, M.; Liu, R.; Chen, J. Mechanism of CO2 oil drive considering the effect of micro- and nano-confinement effects on phase equilibrium. Geol. Front. 2023, 30, 306–315. [Google Scholar] [CrossRef]
  197. Dong, X.; Luo, Q.; Wang, J.; Liu, H.; Chen, Z.; Xu, J.; Zhang, G. Confined Behavior of Hydrocarbon Fluids in Heterogeneous Nanopores by the Potential Theory. In Proceedings of the SPE Annual Technical Conference and Exhibition, Huston, TX, USA, 11–14 October 2020; p. D022S061R040. [Google Scholar]
  198. Levy, M. Universal variational functionals of electron densities, first-order density matrices, and natural spin-orbitals and solution of the v-representability problem. Proc. Natl. Acad. Sci.USA 1979, 76, 6062–6065. [Google Scholar] [CrossRef] [PubMed]
  199. Yu, J.; Xie, L.-H.; Li, J.-R.; Ma, Y.; Seminario, J.M.; Balbuena, P.B. CO2 Capture and Separations Using MOFs: Computational and Experimental Studies. Chem. Rev. 2017, 117, 9674–9754. [Google Scholar] [CrossRef]
  200. Qin, Q.; Liu, H.; Zhang, R.; Ling, L.; Fan, M.; Wang, B. Application of density functional theory in studying CO2 capture with TiO2-supported K2CO3 being an example. Appl. Energy 2018, 231, 167–178. [Google Scholar] [CrossRef]
  201. Qajar, A.; Daigle, H.; Prodanović, M. Methane dual-site adsorption in organic-rich shale-gas and coalbed systems. Int. J. Coal Geol. 2015, 149, 1–8. [Google Scholar] [CrossRef]
  202. Li, Z.; Jin, Z.; Firoozabadi, A. Phase Behavior and Adsorption of Pure Substances and Mixtures and Characterization in Nanopore Structures by Density Functional Theory. Spe J. 2014, 19, 1096–1109. [Google Scholar] [CrossRef]
  203. Jin, Z.; Firoozabadi, A. Thermodynamic Modeling of Phase Behavior in Shale Media. SPE J. 2016, 21, 190–207. [Google Scholar] [CrossRef]
  204. Teklu, T.W.; Alharthy, N.; Kazemi, H.; Yin, X.; Graves, R.M.; AlSumaiti, A.M. Phase Behavior and Minimum Miscibility Pressure in Nanopores. SPE Reserv. Eval. Eng. 2014, 17, 396–403. [Google Scholar] [CrossRef]
  205. Luo, S.; Nasrabadi, H.; Lutkenhaus, J.L. Effect of confinement on the bubble points of hydrocarbons in nanoporous media. AIChE J. 2016, 62, 1772–1780. [Google Scholar] [CrossRef]
  206. Wang, P. Prediction Method and Application of Heavy Organic Matter Deposition During CO2 Injection in Shale Oil Reservoirs. Ph.D. Thesis, China University of Petroleum, Beijing, China, 2022. [Google Scholar]
  207. Song, Z.; Deng, S.; Song, Y.; Liu, Y.; Xian, C.; Zhang, J.; Han, X.; Cao, S.; Fu, L.; Cui, H. High-Pressure Phase State And Mass Transfer Law of Oil-CO2 in Gulong Shale, Daqing Oilfield. J. Pet. 2024, 45, 390–402. [Google Scholar]
  208. Li, M.; Sun, M.; Mohammadian, E.; Ji, Y.; Blach, T.P.; Ostadhassan, M.; Wen, J.; Wu, C.; Pan, Z. Confinement effect in nanopores of shale and coal reservoirs: A review on experimental characterization methods. Gas Sci. Eng. 2024, 123, 205249. [Google Scholar] [CrossRef]
  209. Salama, A.; Amin, M.F.E.; Kumar, K.; Sun, S. Flow and Transport in Tight and Shale Formations: A Review. Geofluids 2017, 2017, 4251209. [Google Scholar] [CrossRef]
  210. Bazant, M.Z.; Storey, B.D.; Kornyshev, A.A. Double Layer in Ionic Liquids: Overscreening versus Crowding. Phys. Rev. Lett. 2011, 106, 046102. [Google Scholar] [CrossRef]
  211. Bazant, M.Z.; Kilic, M.S.; Storey, B.D.; Ajdari, A. Towards an understanding of induced-charge electrokinetics at large applied voltages in concentrated solutions. Adv. Colloid Interface Sci. 2009, 152, 48–88. [Google Scholar] [CrossRef]
  212. Gelb, L.D.; Gubbins, K.E. Pore Size Distributions in Porous Glasses:  A Computer Simulation Study. Langmuir 1999, 15, 305–308. [Google Scholar] [CrossRef]
  213. Faucher, S.; Aluru, N.; Bazant, M.Z.; Blankschtein, D.; Brozena, A.H.; Cumings, J.; Pedro de Souza, J.; Elimelech, M.; Epsztein, R.; Fourkas, J.T.; et al. Critical Knowledge Gaps in Mass Transport through Single-Digit Nanopores: A Review and Perspective. J. Phys. Chem. C 2019, 123, 21309–21326. [Google Scholar] [CrossRef]
  214. Krishna, R. Describing the Diffusion of Guest Molecules Inside Porous Structures. J. Phys. Chem. C 2009, 113, 19756–19781. [Google Scholar] [CrossRef]
  215. Noordman, T.R.; Wesselingh, J.A. Transport of large molecules through membranes with narrow pores: The Maxwell–Stefan description combined with hydrodynamic theory. J. Membr. Sci. 2002, 210, 227–243. [Google Scholar] [CrossRef]
  216. Cui, R.; Feng, Q.; Chen, H.; Zhang, W.; Wang, S. Multiscale random pore network modeling of oil-water two-phase slip flow in shale matrix. J. Pet. Sci. Eng. 2019, 175, 46–59. [Google Scholar] [CrossRef]
  217. Zhang, P.; Hu, L.; Meegoda, J.N.; Gao, S. Micro/Nano-pore Network Analysis of Gas Flow in Shale Matrix. Sci. Rep. 2015, 5, 13501. [Google Scholar] [CrossRef] [PubMed]
  218. Goral, J.; Panja, P.; Deo, M.; Andrew, M.; Linden, S.; Schwarz, J.-O.; Wiegmann, A. Confinement Effect on Porosity and Permeability of Shales. Sci. Rep. 2020, 10, 49. [Google Scholar] [CrossRef] [PubMed]
  219. Huang, J.; Jin, T.; Chai, Z.; Barrufet, M.; Killough, J. Compositional simulation of three-phase flow in mixed-wet shale oil reservoir. Fuel 2020, 260, 116361. [Google Scholar] [CrossRef]
  220. Jin, Z.; Firoozabadi, A. Phase behavior and flow in shale nanopores from molecular simulations. Fluid Phase Equilibria 2016, 430, 156–168. [Google Scholar] [CrossRef]
  221. Wang, Y.; Aryana, S.A. Coupled confined phase behavior and transport of methane in slit nanopores. Chem. Eng. J. 2021, 404, 126502. [Google Scholar] [CrossRef]
  222. Lee, J.H.; Lee, K.S. Investigation of asphaltene-derived formation damage and nano-confinement on the performance of CO2 huff-n-puff in shale oil reservoirs. J. Pet. Sci. Eng. 2019, 182, 106304. [Google Scholar] [CrossRef]
  223. Lee, J.H.; Jeong, M.S.; Lee, K.S. Comprehensive modeling of CO2 Huff-n-Puff in asphaltene-damaged shale reservoir with aqueous solubility and nano-confinement. J. Ind. Eng. Chem. 2020, 90, 232–243. [Google Scholar] [CrossRef]
  224. Du, F.; Nojabaei, B. A diffusion-based compositionally-extended black oil model to investigate produced gas re-injection EOR in Eagle Ford. Fuel 2021, 306, 121711. [Google Scholar] [CrossRef]
  225. Luo, S.; Lutkenhaus, J.; Nasrabadi, H. A novel and practical framework for incorporating nanopores in existing compositional simulators to model the unusually high GOR observed in shale reservoirs. J. Pet. Sci. Eng. 2020, 195, 107887. [Google Scholar] [CrossRef]
  226. Du, F.; Huang, J.; Chai, Z.; Killough, J. Effect of vertical heterogeneity and nano-confinement on the recovery performance of oil-rich shale reservoir. Fuel 2020, 267, 117199. [Google Scholar] [CrossRef]
  227. Jia, Z.; Cheng, L.; Feng, H.; Cao, R.; Jia, P.; Pu, B.; Pan, Q.; Shi, J. Full composition numerical simulation of CO2 utilization process in shale reservoir using projection-based embedded discrete fracture model (pEDFM) considering nano-confinement effect. Gas Sci. Eng. 2023, 111, 204932. [Google Scholar] [CrossRef]
  228. Jia, Z.; Cao, R.; Pu, B.; Cheng, L.; Li, P.; Awotunde, A.A.; Lin, Y.; Pan, Q.; Sun, Y. Effects of non-equilibrium phase behavior in nanopores on multi-component transport during CO2 injection into shale oil reservoir. Energy 2024, 307, 132614. [Google Scholar] [CrossRef]
  229. Wang, Z.; Chen, L.; Wei, H.; Dai, Z.; Kang, Q.; Tao, W.-Q. Pore-scale study of mineral dissolution in heterogeneous structures and deep learning prediction of permeability. Phys. Fluids 2022, 34, 116609. [Google Scholar] [CrossRef]
  230. Zhou, L.; Sun, H.; Fan, D.; Zhang, L.; Imani, G.; Fu, S.; Yang, Y.; Zhang, K.; Yao, J. Flow Prediction of Heterogeneous Nanoporous Media Based on Physical Information Neural Network. Gas Sci. Eng. 2024, 125, 205307. [Google Scholar] [CrossRef]
  231. Liu, H.; Ren, Y.; Li, X.; Deng, Y.; Wang, Y.; Cao, Q.; Du, J.; Lin, Z.; Wang, W. Research Status and Application of Artificial Intelligence Large Models in the Oil and Gas Industry. Pet. Explor. Dev. 2024, 51, 1049–1065. [Google Scholar] [CrossRef]
  232. Santos, J.E.; Mehana, M.; Wu, H.; Prodanović, M.; Kang, Q.; Lubbers, N.; Viswanathan, H.; Pyrcz, M.J. Modeling Nanoconfinement Effects Using Active Learning. J. Phys. Chem. C 2020, 124, 22200–22211. [Google Scholar] [CrossRef]
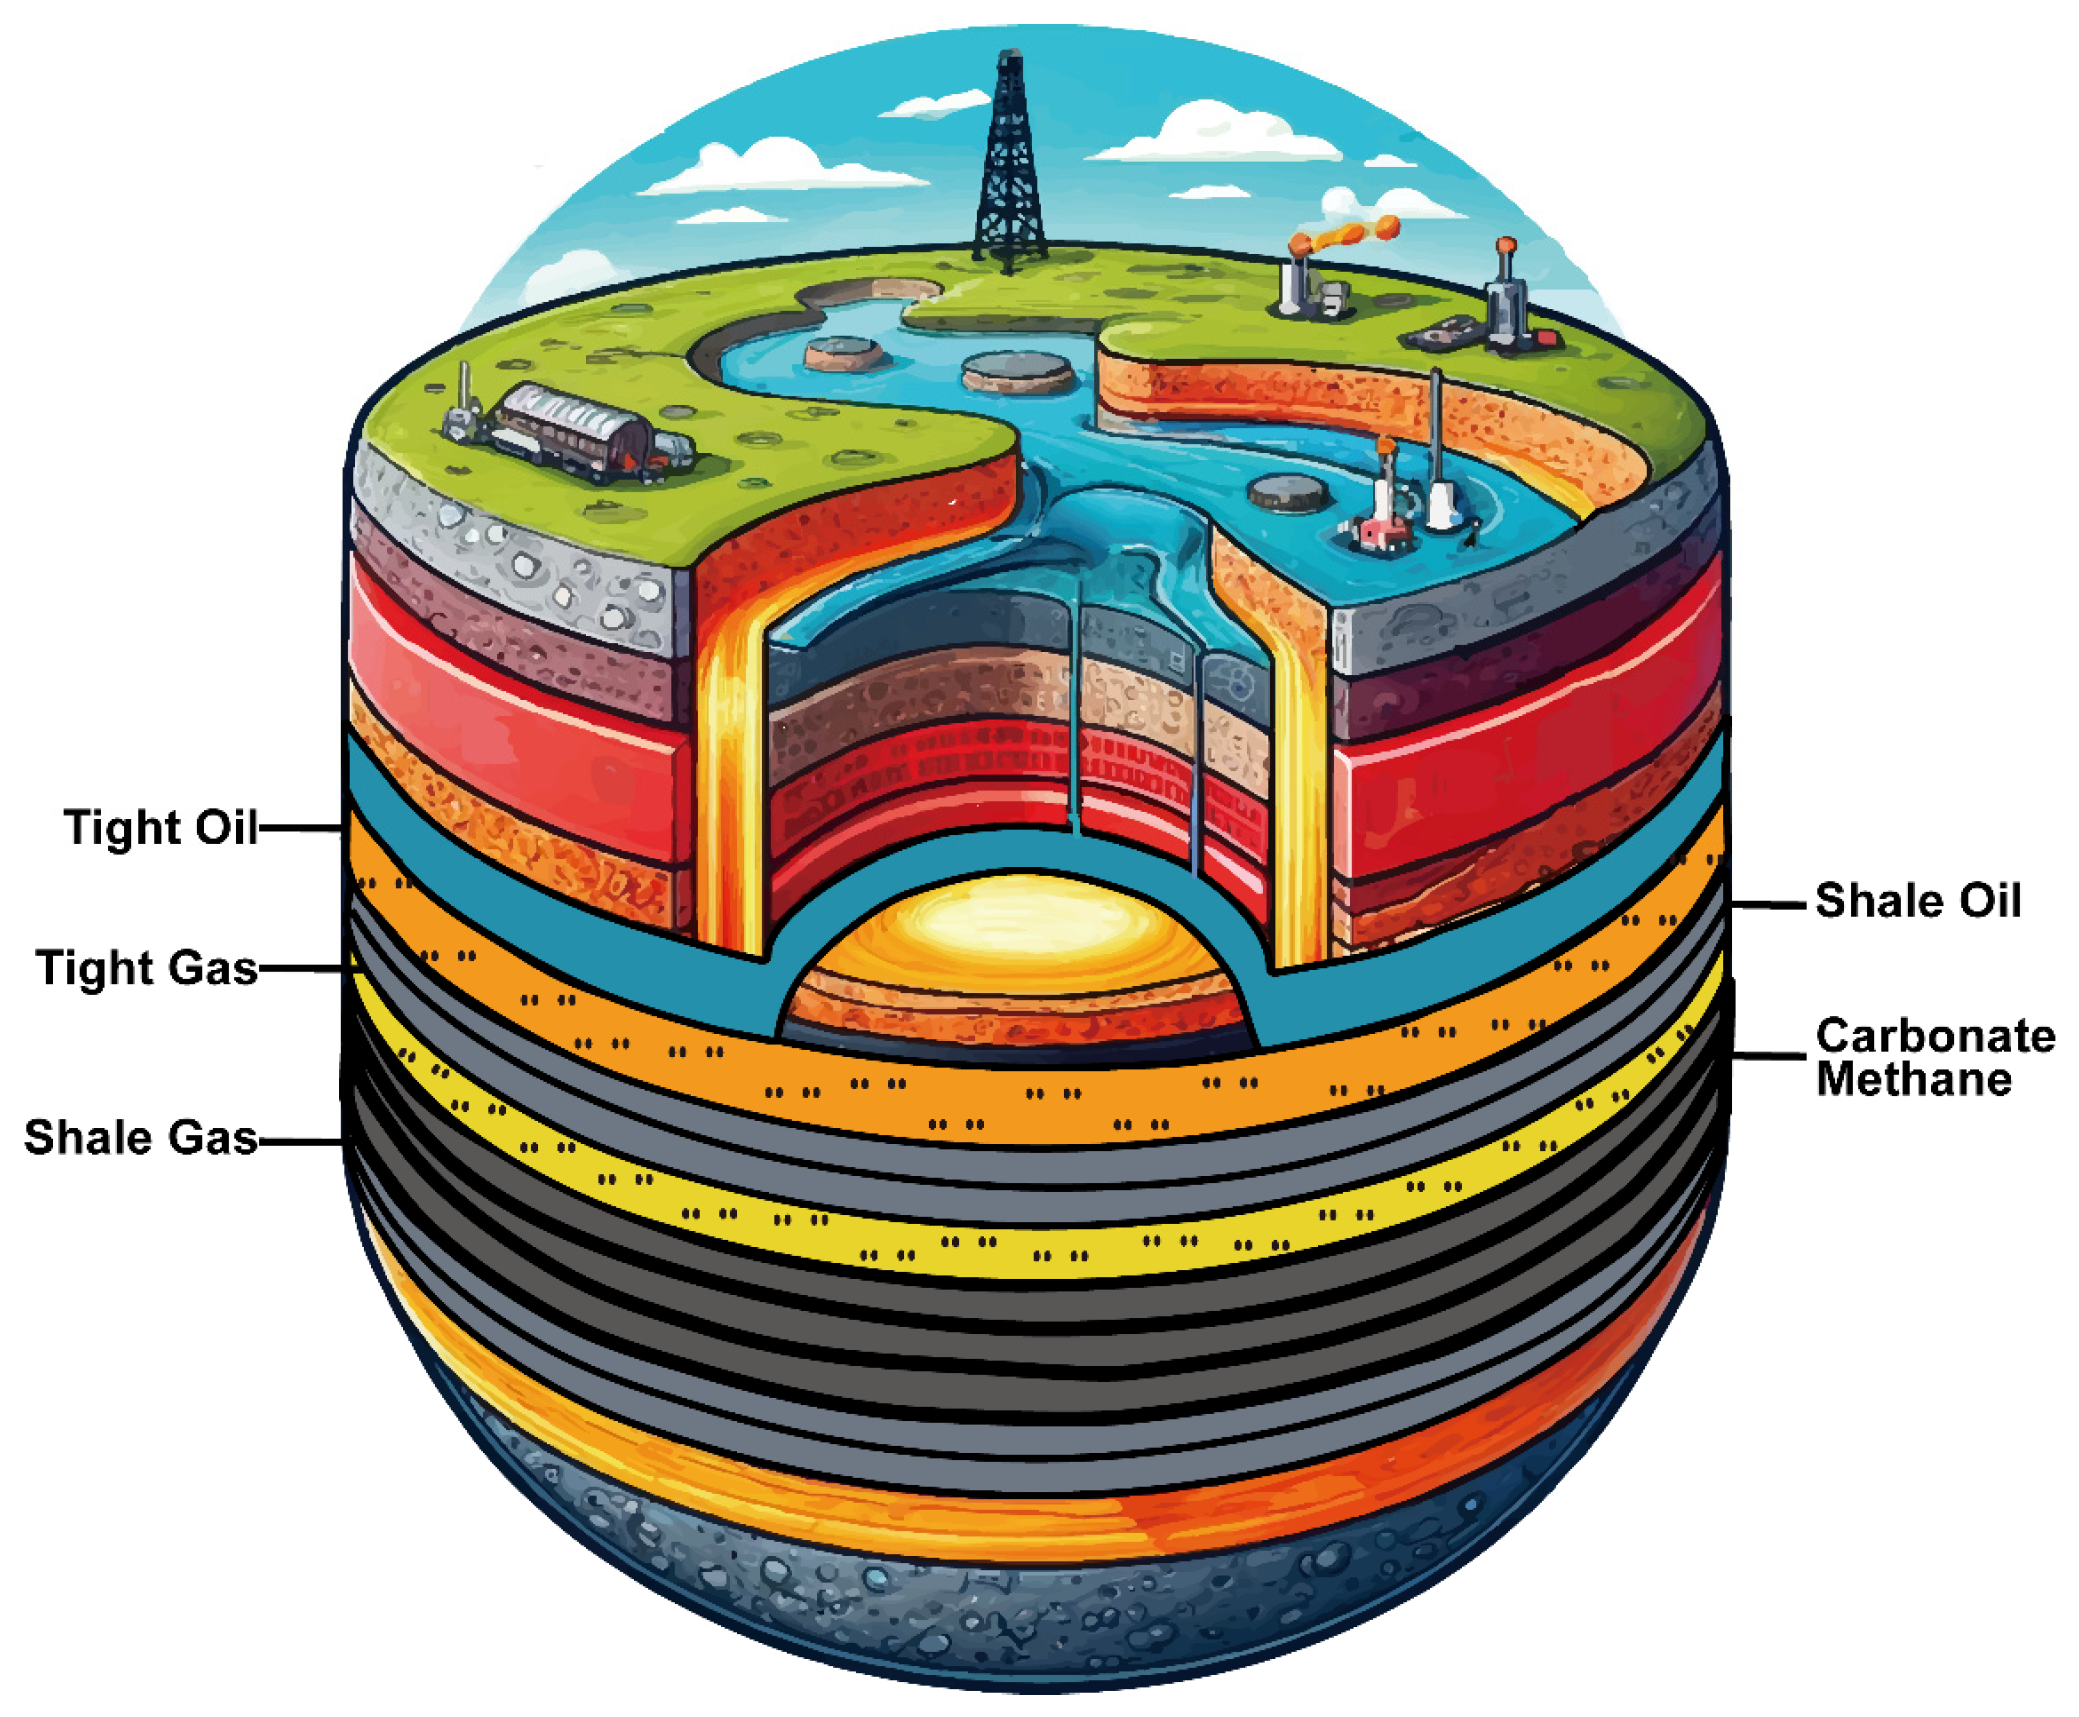
Figure 1. Schematic representation of the five key unconventional oil and gas energy sources of interest.
Energies 18 00166 g001
Figure 2. The main sections of this review, including unconventional energy resources, nano-confinement effects, research methods, and comparison and analysis.
Energies 18 00166 g002
Figure 3. Images of nanoscale pores in unconventional reservoirs [13,14,15].
Energies 18 00166 g003
Figure 4. Changes in fluid phase behavior under nano-confinement effects. (a) Different types of condensed growth of fluids in nanochannels [17]. (b) Multi-component hydrocarbon phase diagrams and phase change diagrams. (c) P-T phase diagram of shale oil under nano-confinement effects [22]. (d) P-T phase diagram of Eagle Ford oil in 8 nm pores and bubble point pressure for different pore sizes [16].
Energies 18 00166 g004
Figure 6. High-viscosity layer on the walls of nanopores. (a) The initial and final stages for multi-component adsorption in organic slit-pore [44]. (b) Schematic diagram of nanopore walls forming a highly viscous layer (left: large pores with negligible nano-confinement effects; right: small pores with significant nano-confinement effects) [43]. (c) Mass density distribution of n-C8H18 in the 4.43 nm carbon slit (353 K) [45]. (d) Effects of slit size on the mass density profiles for n-octane in carbonaceous slits [45]. (e) Effects of single-component fluid and multi-component mixtures on the mass density profiles for alkanes in a 4.54 nm carbonaceous slit [45].
Energies 18 00166 g006
Figure 7. (a) CCUS process in the oil and gas energy sector [57]. (b) Carbon dioxide phase diagram. (c) Microscopic diagram of CO2 miscible flooding (the arrow indicates the degree of miscibility between CO2 and crude oil over time.). (d) Molecular behavior of oil and water below and at the MMP (the arrow indicates the possible direction of molecular motion.) [58]. (e) The MMP in nanopores decreases compared to the bulk phase, and the MMP is further reduced by considering the adsorption phenomenon in nanopores [59].
Energies 18 00166 g007
Figure 9. Range of Knudsen numbers and simulation methods. (a) Simulation at different scales. (b) Knudsen number regimes [134]. (c) Molecular and continuum flow models [133]. (d) Samples of molecular dynamic simulation. (e) Samples of Monte Carlo method [135]. (f) Samples of lattice Boltzmann method [136].
Energies 18 00166 g009
Figure 10. The impact of nano-confinement effects on phase transitions in unconventional oil and gas energy. (a) Phase envelope changes in hydrocarbon mixtures in 2 nm and 3 nm pores [44]. (b,c) P-T phase diagrams for nanopores considering the impact of throats and the impact of capillary forces [195]. (d) Simulated P-T diagram of a confined binary mixture (90:10 decane-methane mixture) [135]. (e) Example of a P-T diagram for a mixture of 59.7% of ethane and 40.3% of n-pentane [161]. (f) P-T phase diagram of shale oil, accounting for nano-confinement effects and capillary forces [61].
Energies 18 00166 g010
Figure 11. (a) MS diffusion rate under zero load from MD simulations [214]. (b) Lennard–Jones interaction potential of atoms in the silica wall surface in a 2 nm cylindrical mesopore [214]. (c) Location of CH4 and CO2 molecules in the pores [214]. (d) The 2D NMR method was used to determine the fluid confinement effect [96]. (e) 2D NMR results show enhanced fluid-limited diffusion within the pores with decreasing pore size [96].
Energies 18 00166 g011
Figure 12. (a) Local z-density distribution for three different slits (left: saturated gas phase; right: saturated liquid phase methane) [160]. (b) The effect of pore geometry on the percentage of adsorbed layers. The horizontal axis is the proportion of slit-like pores (Nu,s) to the total number of pores (Nu,s and Nu,c) [45]. (c) Vertical density distribution at a given location along the nanopore. D is the amplitude of the geometric ripple, Y characterizes the degree of chemical heterogeneity of the nanopore) [197].
Energies 18 00166 g012
Table 1. Characteristics of energy resources across various countries [4].
CountryCharacteristics
USAThe total unproved technical recoverable tight/shale oil reserves are estimated to be 174.0 billion bbls, whereas the gas recoverable gas quantities are estimated to be 1611.1 TCF.
ChinaThe geological resources of medium- and high-maturity shale oil are approximately 100 × 108 t, while tight oil resources are about 178.2 × 10⁸ t, shale gas is 650.44 × 10¹² m3, and tight gas is 95.16 × 10¹² m3.
AustraliaShale gas reserves are 396 TCF, tight gas reserves are 20 TCF, and coalbed methane reserves are 235 TCF.
Table 2. Features comparison of three distinct diffusion mechanisms in porous media.
Types of DiffusionFeatureAdvantageDisadvantage
Bulk diffusionPrimarily governed by molecular interactions.The flow velocity is highest, with limited impact from pore walls, facilitating easier modeling and prediction [27].When the pore diameter approaches the molecular diameter, conventional research methods become inapplicable.
Knudsen diffusionMolecules collide within the pores.This mechanism is widely observed in the flow of fluids within nanopores, and its study contributes to a deeper understanding of microscopic flow mechanisms [24].The flow velocity is slower because of the high ratio of molecular mean free path to pore size [28].
Surface diffusionPredominantly influenced by interactions between molecules and pore walls.Substantial studies show that adsorption layers constitute a considerable portion in nanopores [29]. Advances in this field can effectively enhance the recovery of unconventional oil and gas [30].The flow velocity is the slowest, primarily influenced by pore walls, which is unfavorable for enhancing oil and gas recovery [31].
Table 3. Comparison of three numerical simulation methods applied to nano-confinement effects.
Numerical Simulation MethodsFeatureAdvantageDisadvantage
MDBased on Newtonian mechanics, it investigates intermolecular interactions.Enables the study of nanoscale microscopic mechanisms, primarily applied to simulating fluid adsorption and desorption, as well as fluid transport behavior in nanopores.Limited by computational power, the simulation scale is relatively small.
MCBased on probability theory, it examines the random distribution of molecules.Requires fewer computational resources, making it relatively simple to simulate, and is primarily used for studying fluid phase behavior.Exhibits randomness, resulting in reduced accuracy compared to MD simulations.
LBMBased on the Boltzmann equation, it employs discrete solutions and focuses on particle groups.Can simulate larger scales and is mainly used to study fluid flow behavior, including fluid transport in porous media under complex boundary conditions.Compared to MD simulations, it cannot capture molecular-level interactions.
Table 4. Summary of nano-confinement effects on fluid phase behavior across various research methods.
ReferenceMethodsSimplePore Scale (nm)Critical TemperatureCritical Pressure
Bubble Point (K)Dew Point (K)Bubble PointDew Point
Singh, S. K. (2009) [160]TMMClight n-alkanes2362.1428.04 bar
3387.3339.15 bar
Didar, B. R. (2013) [44]MCC14.1from 190.6 to 177from 651 to 465 psi
3.7from 190.6 to 170from 651 to 449 psi
2.9from 190.6 to 168from 651 to 221 psi
1.5from 190.6 to 150from 651 to 150 psi
hydrocarbon mixtures2
3
phase envelope shrinks inward
Nojabaei, B. (2013) [192]EOShydrocarbon mixtures10-decreasedecrease or increase (depending on which part of the phase envelope is located)
Teklu, T. W. (2014) [204]modified conventional gas/liquid balance calculationshydrocarbon mixtures3 and 10-decreaseupper dew point increases, lower dew point
Li, Z. (2014) [202]DFT + PR-EOSC310very small change
3decreasedecrease
Li, Y. (2015) [195]PR-EOShydrocarbon mixtures2, 4, 5 and 10-increasedecrease
Alfi, M. (2016) [82]nanofluidic technologyC6depth: 50
width: 50
from 340.7 to 341.9-
C7from 374.4 to 373.3
C8from 400.7 to 398.7
Pathak, M. (2017) [129]DSC + MDC1017.7decrease 7.8 °C--
hydrocarbon mixturesdecrease of about 50 °C
Pathak, M. (2017) [135]GCMCC103.5decrease 125 K (unable to capture critical parameters, using inferential estimation)
decrease 85 K
decrease
C10:C10 = 9:1decreasedecrease
Zhang, K. (2019) [70]nanofluidic technology + modified PSD EOSCO2–C10depth: 100
width: 100
--decrease
(T = 25 °C, decreased 10.19%; T = 53 °C, decreased 7.26%)
-
Lu, Z. (2024) [80]nanofluidic technologycrude oil100--from 34.3 to 30.1 MPa (no-water)-
10from 28.2 to 24.9 MPa (water)
Table 5. Summary and analysis of the advantages and disadvantages of various research methods of nano-confinement effects.
MethodsAdvantagesDisadvantages
Physical Experimental MethodsNanofluidicIt makes microscopic visualization experiments possible and has been well-applied in the analysis of fluid phase behavior at the nanoscale.The pore sizes of currently manufactured chips differ from those in actual unconventional reservoirs, making it difficult to study fluid properties at smaller scales. Currently, silicon-based chips are predominantly used, which differ from actual reservoir materials.
NMRIt can quantitatively characterize nanopores and fluids.It cannot capture the distribution characteristics of samples.
Nano-CTIt not only characterizes the pores of unconventional oil and gas reservoirs but also plays a role in pre-processing models for numerical simulations.It has lower resolution than SEM.
SEMIt can achieve higher resolution compared to nano-CT.It cannot capture the three-dimensional characteristics of samples.
Numerical Simulation MethodsMDIt primarily applied to study fluid adsorption and desorption in nanopores, as well as fluid motion within these pores.It simulates molecular behavior on a microscopic scale, requiring substantial computational power, making the process time-consuming and limited by computational capacity.
MCCompared to MD simulations, it is relatively simpler and requires fewer computational resources.It is based on probability theory and statistical methods, and thus exhibits stochastic characteristics.
LBMIt can not only simulate fluid flow at the mesoscale with complex boundary conditions but also enable parallel computing.Particles serve as the smallest unit in its simulation, which constrains the precision of the results.
Theoretical Calculation MethodsEOSResearchers often modify the PR-EOS to study fluid phase behavior in nanopores.Theoretical models to fully simulate real physical environments and their calculations are more complicated.
DFTIt has been widely used to study fluid adsorption behavior in nanopores.Theoretical models to fully simulate real physical environments and their calculations are more complicated.
Disclaimer/Publisher’s Note: The statements, opinions and data contained in all publications are solely those of the individual author(s) and contributor(s) and not of MDPI and/or the editor(s). MDPI and/or the editor(s) disclaim responsibility for any injury to people or property resulting from any ideas, methods, instructions or products referred to in the content.

