Abstract
This article presents an analysis of the performance of a 14.04 kWp grid-connected photovoltaic (PV) installation consisting of monocrystalline silicon, polycrystalline silicon and bifacial glass–glass monocrystalline silicon modules. The photovoltaic system was mounted in Poland, a location characterized by temperate climate conditions. On the basis of the obtained results, the photovoltaic parameters were determined in accordance with the international standard. The annual energy yield of the entire system was 1033 kWh/kWp, and the performance ratio achieved was 83%. The highest average daily final yield was in the range of 4.0–4.5 kWh/kWp for each photovoltaic technology under investigation. In the cold part of the year, the efficiency of the photovoltaic modules was estimated to be 15%, and it was estimated to be 7% during the warm part of the year. Array capture losses accounted for around 0.75 kWh/kWp of energy loss per day, whereas the inverter efficiency was over 95% during the months that are beneficial for energy production.
1. Introduction
Industrial development and the popularization of new useful electronic technologies, especially in developed countries, as well as the continuous growth of the world’s population have resulted in an increasing demand for energy. The competition for access to energy resources between different countries and climate changes are the most disturbing issues experienced by the modern world. The use of renewable energy sources contributes to resolving both of those problems since the conversion of energy from renewable sources can be performed locally without long-distance transmission, and it can limit harmful emissions from fossil fuel combustion. Technical solutions based on energy provided by renewable sources are therefore consistent with the idea of sustainable development, which, in the broader perspective, addresses the standard of life of subsequent generations.
Among the various renewable energy sources, the sun is one of particular importance because its solar energy is available all over the earth. It reaches various regions of the globe in different amounts, but it is independent from local conflicts, and only natural processes seasonally limit the access of incident solar radiation. In this context, investigations on the performance of photovoltaic technologies in particular regions of the world which differ in climatic conditions are of high importance.
The operation of solar modules under real external conditions differs from the results obtained by manufacturers in laboratory tests in which the efficiency is determined in Standard Test Conditions (STCs—irradiance 1000 W/m2, temperature of 25 °C and AM 1.5 spectrum of light). In the real world, it is not possible to make measurements under the conditions mentioned above since the changes in temperature and light intensity are dynamic. Hence, there is a need to determine indices to compare the efficiency of modules made with different technologies operating over a period of several years under different meteorological conditions. The solar irradiance in the plane of the photovoltaic module, the temperature of the photovoltaic cells and losses occurring in individual parts of the system have the most significant and direct influence on photovoltaic (PV) performance. Photovoltaic systems with different configurations, monitored in different locations, can be easily compared by assessing their standardized photovoltaic performance indicators.
However, this research topic is mainly exploited in low-latitude countries characterized by high insolation due to the popularity of photovoltaic installations in such places [1,2,3]. Numerous reports showed the analysis of energy production, losses and the degradation of solar modules under high solar radiation.
In Egypt, rooftop installation using monocrystalline Si, polycrystalline Si and CdTe modules was experimentally investigated under real external conditions, i.e., a hot and dry climate, and compared with the results simulated in the PVSyst software. The research showed the highest degradation rate of 1.67% per year for thin-film CdTe technology [4]. In Morocco, where very good solar conditions are also met, monocrystalline Si, polycrystalline Si and amorphous Si modules were studied under the mountain temperate climate. The results demonstrate that poly-Si is the most suitable technology in this location for its highest monthly average performance ratio of 66–83%, the lowest degradation rate of 0.2–0.36% per year and the cost-effectiveness expressed as the price of 0.09 USD/kWh [5]. A performance analysis of the same set of PV technologies in Malaysia also showed the advantages of poly-Si modules that demonstrated an array efficiency of 12.17%, a system efficiency of 11.33% and beneficial values of other parameters in comparison to mono-Si and a-Si [6]. In some locations with a dry climate, high insolation is accompanied by dust deposition on the surface of modules, which can be a reason for a monthly efficiency reduction of up to 80%. Such investigations have revealed that desert areas with large spaces and high irradiation suffer from a decrease in photovoltaic yield due to dust, which is suspended in the air and accumulates on the modules [7].
In relation to the implementation of installations based on bifacial photovoltaic modules, there are few studies at low latitude despite such places having beneficial solar conditions. A recently developed model and experimental investigations carried out in five climatic zones in India demonstrated that bifacial modules had better performance by up to 34.93% per year than monofacial modules at the very beneficial albedo of 30% [8]. Tests of different azimuth and tilt angles of bifacial modules in the hot desert climate of Qatar showed that an east–west orientation and a vertical position of modules provide comparable results with tilted modules facing south. The annual gain of 16.3% of energy production was obtained due to the 90% bifaciality of the used modules [9]. A tilt angle of 45° was applied in Saudi Arabia, where the performance assessment of bifacial crystalline modules exhibited the advantages of bifacial technology since the modules showed a gain of up to 15% when compared to monofacial ones [10].
Low values of solar irradiation and significant seasonal changes in solar irradiation are characteristic of higher latitude locations where photovoltaic technology gradually gains interest in spite of the limited access of insolation.
In the Netherlands, a study on PV performance showed that changes in irradiance and module temperature have the strongest impacts, leading to gains or losses from +2.8% to −3.2% for the influence of irradiance and −0.5% to −2.2% for the module temperature [11]. In the case of thin film modules, low irradiance was the reason for the 1.2% reduction in the annual energy yield of the CIGS modules and 1% for CdTe. A spectral impact on the energy yield was also identified in Germany, where gains of 1.1% for high-efficiency crystalline silicon, 2.4% for CdTe and 0.6% for CIGS were determined [12].
Research in areas with higher latitude is limited, especially in countries where photovoltaic technology only started to become popular in recent years, when supporting financial programs were introduced. An example of such country is Poland, where the yearly sum of irradiation reaches 1000–1100 kWh/m2 and the boom for photovoltaics started in 2018; however, it was partially limited due to difficulties with the excess of generated electric energy transmission through an outdated, non-modern electric grid. The few investigations performed under Polish climatic conditions showed that polycrystalline Si technology had an annual energy yield of 1098–1130 kWh/kWp, an energy density of 188 kWh/m2, a capacity factor of 12.53% and a performance ratio of 82% [13,14].
The vast majority of investigations are devoted to conventional monofacial silicon modules; however, bifacial technology with the promise of gains in energy production of up to 30% is projected to achieve an 85% market share by 2031 [15]. Therefore, the evaluation of bifacial modules in real environments is a challenge worth taking up.
In Sweden, under snowy climate conditions, the performance of bifacial technology was investigated with a dependence on the tilt angle, showing that the highest energy output was obtained at 35–45° [16]. Despite the low insolation, bifacial modules were also mounted and tested at various configurations in a northern location in Alaska. The study indicated that east–west-oriented vertical bifacial modules can outperform south-oriented monofacial modules, and a 20% bifaciality gain was achieved from April to July [17]. The performance of bifacial modules mounted via off-grid installation was assessed in the UK under a temperate climate in relation to several ground coverages, which differed in albedo in the range of 0.1–0.15 for soil and 0.7–0.8 for white tiles. The largest energy production increase of 14.3–25% was achieved with white tiles, and the overall bifacial gain reached 25.66% on cloudy days compared to 16% on a sunny day [18]. The elimination of metallic rear contact and a transparent back surface enables bifacial modules to absorb light at both sides. An analysis of the influence of external factors on bifacial modules can be useful in predicting the performance of bifacial modules in a given location. Studies on the realistic efficiency of bifacial modules mounted in different climate conditions are necessary to support investors at the planning stage of PV installations since insufficient knowledge hinders bifacial technology from being implemented.
However, there is a lack of long-term investigations which include bifacial photovoltaic modules among other technologies installed for comparison in the same location. The current paper bridges this gap and presents a performance analysis of a grid-connected installation constituting three types of solar modules, such as monocrystalline silicon, polycrystalline silicon and bifacial monocrystalline silicon of a similar nominal power in the southeast part of Poland. This work thoroughly examines the energy production of three different photovoltaic technologies installed with the same tilt and azimuth, offering a detailed analysis compared to the data in the literature. This paper highlights the fundamental role of meteorological data during the year as well as the particularly noteworthy role of energy loss in the representative period. The analysis relates to the 2023 year and includes data on the energy output, performance ratio, efficiency of modules and inverter, array yield, final yield and losses.
2. Experimental Methods
The considered PV system was installed at the end of 2018 in Rzeszów city in the southeast part of Poland (50°02′ N, 22°00′ E) on the roof of a building belonging to the Rzeszów University of Technology. The entire PV generator is composed of 49 modules with a total nominal power of 14.04 kWp and a three-phase inverter, which is located in the building, together with data acquisition devices of the measuring system. Attaching the module support system directly to the original roofing felt was not recommended, so the ballast system was used. Figure 1 shows a photo of the analyzed rooftop installation with a 38° southwest orientation, tilted 25°. Each type of module is connected into one separate string, which is depicted in Figure 2.
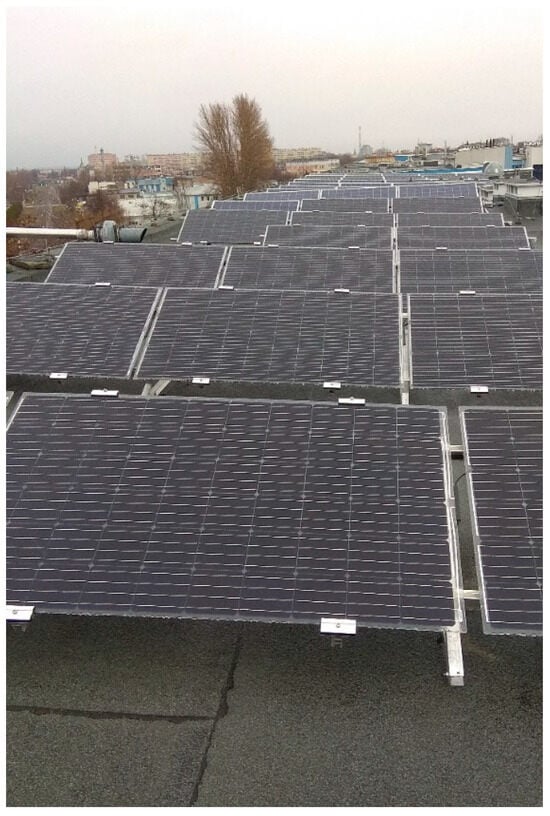
Figure 1.
View of analyzed photovoltaic installation.

Figure 2.
Diagram of connecting modules in three strings.
The three strings were composed of different types of modules, namely monocrystalline silicon (1), polycrystalline silicon (2) and bifacial glass–glass monocrystalline silicon (3), the technical data of which are shown in Table 1. The modules were connected to the Solaredge SE 12.5k inverter, and its specifications are given in Table 2. The product warranty for all of the installed modules is 12 years, and they are expected to maintain 80% efficiency for 25 years. According to manufacturer’s data, the modules present a minimum of 97% STC efficiency under low irradiance at 200 W/m2.

Table 1.
Technical data of photovoltaic modules.

Table 2.
Manufacturer data of inverter.
The scheme of the PV system and registered parameters are presented in Figure 3. The following nomenclature was adopted:
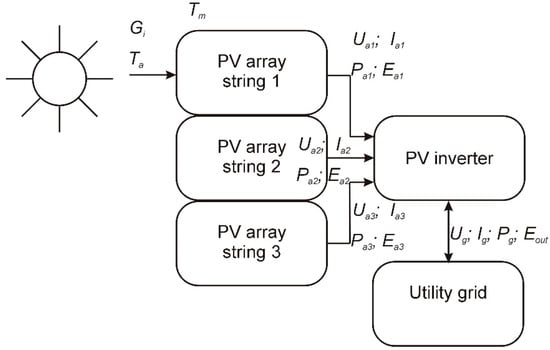
Figure 3.
Parameters measured in analyzed PV system.
Ta—ambient temperature (°C);
Tm—temperature of photovoltaic module (°C);
Ia1, Ia2, Ia3—strings (1, 2, 3) of DC currents in PV system (A);
Ua1, Ua2, Ua3—string (1, 2, 3) of DC voltages in PV system (V);
Pa1, Pa2, Pa3—string (1, 2, 3) of DC power in PV system (kW);
Ea1, Ea2, Ea3—string (1, 2, 3) of DC energy in PV system (kWh);
Ig—grid current (AC side PV inverter) (A);
Ug—grid voltage (AC side PV inverter) (V);
Pg—grid power (AC side PV inverter) (kW);
Eout—grid energy (AC side of PV inverter) (kWh).
The acquisition of the measured data of the analyzed system, such as the voltage, current, power and energy, was carried out using the recording capabilities of the devices included in the system. The meteorological parameters (the solar radiation on a given plane and the temperature of the module and the surroundings) were recorded using the sensors, the range and accuracy of which are listed in Table 3.

Table 3.
Data of sensors.
The irradiance sensor is mounted in the plane of the modules. It measures the natural solar irradiance, and the uncertainty of the registered values is valid for spectrum AM 1.5. It also poses external temperature compensation. The temperature is measured using the thermocouple mounted on the back side of the module. The data were recorded in 5 min intervals and registered using the Solaredge monitoring system.
3. Results
3.1. Characteristics of Climate Conditions in Location
According to Köppen’s climate classification, the considered location for photovoltaic installation has a warm summer continental climate, which is characterized by significant differences between summer and winter in terms of the daytime length, solar radiation intensity, cloud cover and ambient temperature. Around 80% of the solar irradiation in Poland is received during the warm part of the year (April–September). In such a climate, the set of standard test conditions (solar irradiance of 1000 W/m2, ambient temperature of 25 °C and air mass of 1.5), which is applied by manufacturers when new modules undergo performance tests, is rarely met. Under real external conditions, the modules operate in broad ranges of irradiance and temperature values, which sometimes change drastically on a daily basis.
Table 4 presents the main climatic parameters, which directly or indirectly affect the yield of a solar module, i.e., the solar irradiation, ambient temperature and temperature of the modules measured in the location of photovoltaic installation in this study. In the warm part of the year, the monthly sum of solar irradiation exceeds 173 kWh/m2,and the monthly mean module temperature, which is higher than ambient temperature due to heating from solar insolation, reaches 26.5 °C. In winter months, the irradiation is very low; however, a meaningful improvement in solar conditions is observed in the spring. The monthly average temperature of the modules is close to 0 °C in the winter and is equal to ambient temperature when the impact of solar radiation is negligible, and then it achieves higher values in the fall and spring months. The yearly sum of irradiation in the module plane equals 1205 kWh/m2 in which the contribution of warm months is 74.3%.

Table 4.
Irradiation data, temperature data and electric energy produced by whole PV system in two parts of 2023.
3.2. Seasonal Performance Assessment
The broad range of changes in weather conditions throughout the entire year influences the power output of solar modules on an ongoing basis. The impacts of irradiation and external temperature variation play the most important roles among various external parameters, which is clearly visible in the daily analysis of photovoltaic performance.
In order to track the weather effects in detail, four characteristic days were chosen, and parameters such as irradiation, ambient temperature and the temperature of the modules (Figure 4) were analyzed during these days and then juxtaposed with the output DC power (Figure 5). The selected days include the following: a sunny warm day, a sunny cold day, a cloudy warm day and a cloudy cold day. On a sunny day, when the irradiation reaches 250 Wh/m2, the external temperature is over 30 °C under a clear sky and drops to around 20 °C under overcast conditions. On cloudy days, the irradiation value is well below 200 Wh/m2 in the summer and decreases to around 8 Wh/m2 in the winter when the ambient temperature is below 0 °C. These changes are accompanied by the significant differences in the daytime, specifically a maximum of 16 h in the summer and a minimum of 8 h in the winter, and consequently, the incoming amount of solar radiation in these two seasons of the year is drastically affected and—as a result—the solar modules’ electric energy production is also affected.
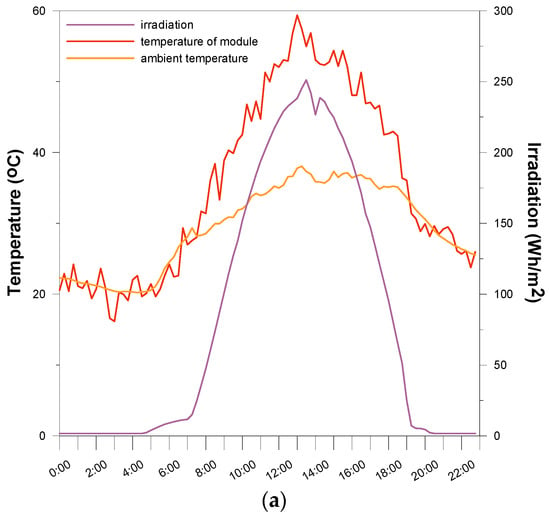
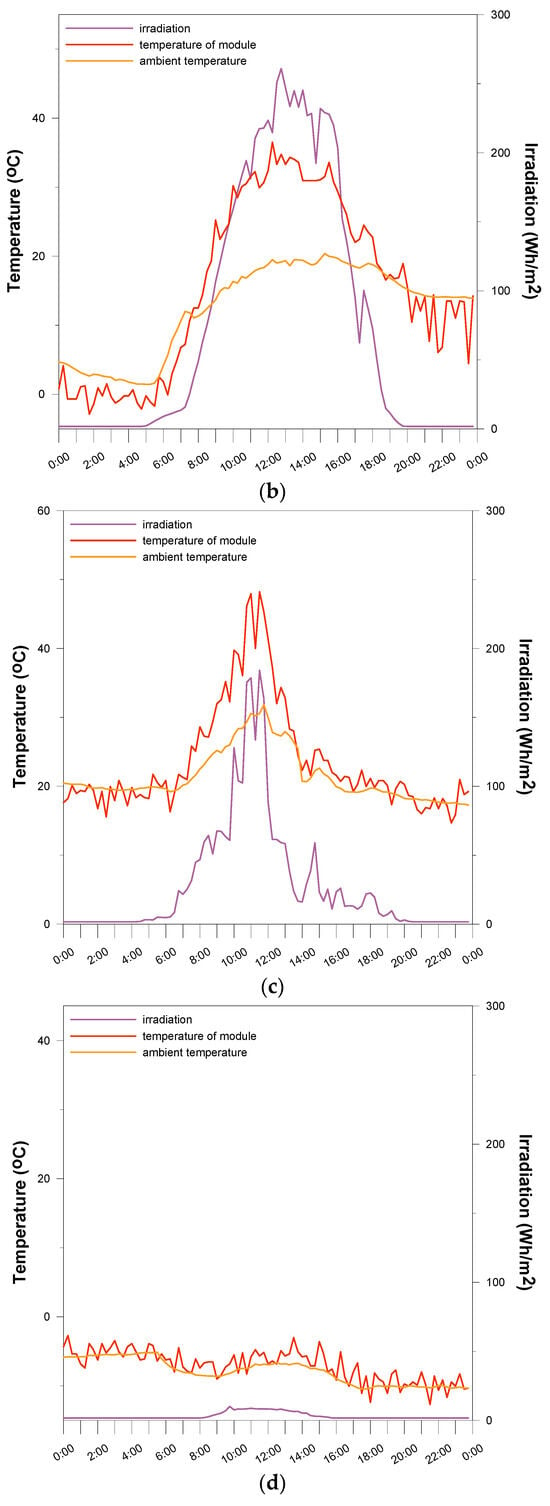
Figure 4.
Irradiation, temperature of module and ambient temperature on characteristic days: (a) sunny warm day (16 July 2023), (b) sunny cold day (4 May 2021), (c) cloudy warm day (13 July 2023) and (d) cloudy cold day (17 January 2021).
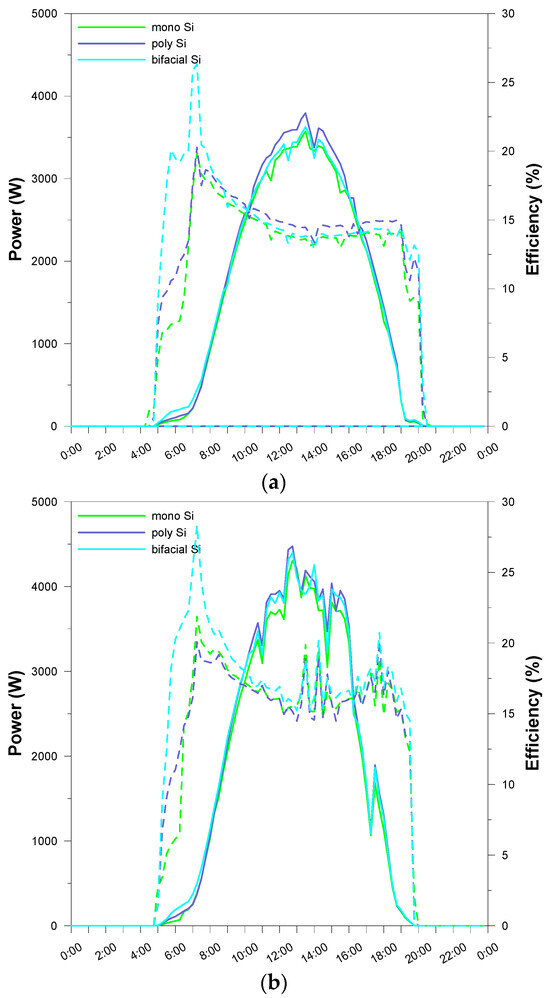
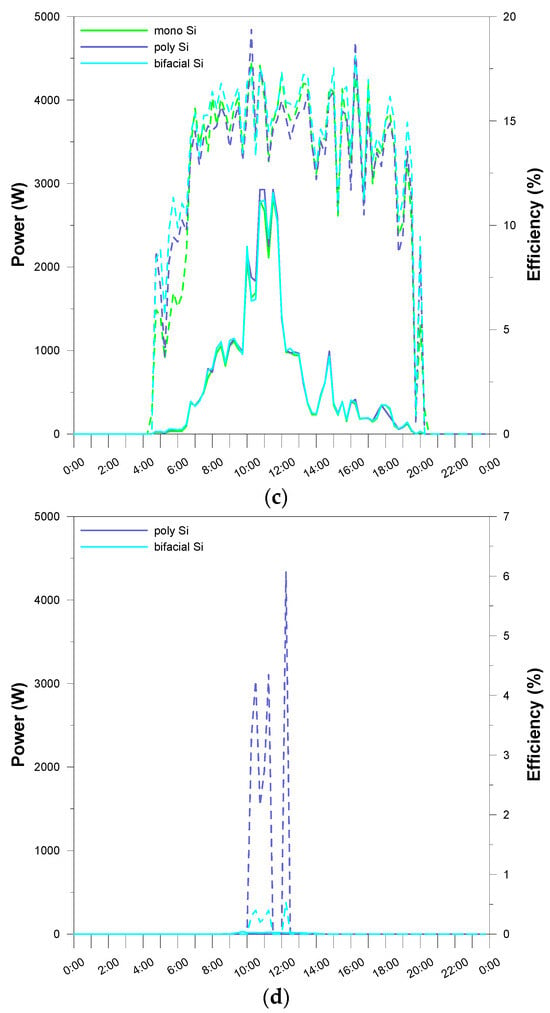
Figure 5.
Daily power (solid line) and daily efficiency (dashed line) of three PV technologies on characteristic days: (a) sunny warm day (16 July 2023), (b) sunny cold day (4 May 2021), (c) cloudy warm day (13 July 2023) and (d) cloudy cold day (17 January 2021).
The factor strongly influencing the performance of the modules is also the temperature of the modules determined by the ambient temperature and the incident solar radiation. As it is visible in Figure 4, the temperature of the modules always follows the trend of the external temperature, and in the daytime, it achieves higher values. On sunny days, the difference between the module’s temperature and the ambient temperature reaches 20 °C since the modules are heated by the sun and their temperature exceeds 55 °C. Under cloudy conditions, the difference between these two temperature values decreases due to a reduction in the heating effect by the sun. On a cold and overcast winter day, the temperature of the module is close to the ambient temperature, which is below 0 °C.
Electric power production directly reflects the access to daylight and follows the shape of irradiation on each analyzed day. The values of output power depend on the amount of irradiation; however, the impact of the external temperature on the modules is also visible. The comparison of the results obtained on a sunny warm day (16 July 2023) and sunny cold day (4 May 2021) show that under similar irradiation, power production increases when the temperature of the modules is lower. On these two sample days, the lowering of the modules’ temperature by over 20 °C can be observed. Quantitatively, these trends are reflected by energy production, as presented in Table 4.
The production of power by each type of photovoltaic technology is directly determined by the illumination of the modules; therefore, the fluctuations in power, which are depicted in Figure 5, correspond to the changes in solar irradiation shown in Figure 4. On a cloudy winter day, when the incoming solar irradiance is very low, the inverter cannot begin operating; thus, the generated power is negligible. The efficiency of the photovoltaic modules reaches values over 15% when the weather conditions are favorable.
3.3. Performance of Photovoltaic Installation
3.3.1. Performance Indicators of Photovoltaic System
To analyze the performance of the tested 14.04 kWp photovoltaic system, consisting of three strings of PV modules in mono-Si, poly-Si and mono-Si bifacial technologies connected to the grid, the performance indicators were determined according to the IEC 61724 norm [19] and the methodology adopted for the PV energy assessment. Standardized indicators of performance are important because they provide a basis to compare PV systems under different operating conditions.
According to the norm, the performance of a PV system is characterized by a typical set of parameters:
Gi—solar irradiance in-plane of modules (W/m2);
Hi—solar insolation in-plane of modules (kWh/m2);
EDC—DC side energy of PV system (kWh);
Eout—AC side energy of PV system (kWh);
P0—rated power of PV system (kWp);
P0AC—rated power (AC) of PV panel (kW);
PR—performance ratio (%);
Lc—capture losses (h/day);
Ls—system losses (h/day);
YA—array yield (kWh/kWp);
YF—final yield (kWh/kWp);
YR—reference yield (kWh/kWp);
AA—summarized PV module area (m2);
η—efficiency (%).
The quantities that describe the solar radiation reaching the Earth’s surface (per square meter) are irradiation and solar irradiance. Irradiance is the instantly measured power of solar radiation on the surface per defined unit area, and in the international system of units, it is measured in W/m2. Irradiation, which refers to an interval of time, means the amount of incoming energy on a surface unit in a given time period, and it is expressed in J/m2 or Wh/m2.
The performance of a grid-connected photovoltaic system can be determined after the calculation of several important parameters based on the data recorded during its operation at a given location. These parameters include the following: the total output energy generated by the PV system (Eout), array yield (YA), final yield (YF), reference yield (YR) and performance ratio (PR).
The array yield (YA) is the quotient of the DC energy generated by the modules comprising the PV installation and the rated power of the array P0:
YA determines the actual performance of the PV array in relation to its rated power. Taking into account the collected data regarding the daily or monthly DC energy, the yield can be determined on a daily or monthly basis, and they represent the specific time interval over which the PV array can operate at the rated power. Most commonly, this coefficient, denoted as YA,d, is defined on a daily basis according to the following formula:
For the monthly interval, the array yield YA,m is calculated as an average of the sum of the daily values:
where N—the number of days in the considered month.
The array yield for each analyzed string of modules (string 1—mono-Si; string 2—poly-Si; string 3—mono-Si bifacial) is presented in Figure 6. The array yield achieved in the subsequent months follows the variations in the solar irradiation values shown in Table 4. The highest YA value, which is over 4.5 kWh/kWp per day, is observed in July and May. In June and August, when the irradiation is lower, the YA value also drops. During the spring months (March and April), YA outperforms the values obtained in October and November due to there being more cloudy days in the autumn. Taking into account the warm half of the year, when there is no snow cover, the comparison of the YA value for separate strings indicates that the poly-Si modules achieved the highest values, followed by mono-Si bifacial technology.
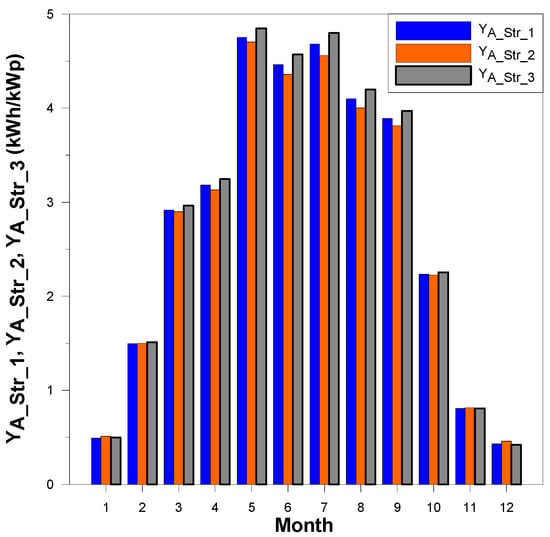
Figure 6.
Monthly average of daily PV array yield for separate strings of modules (mono-Si, poly-Si and mono-Si bifacial).
The final performance indicator for a PV system, denoted as YF, is the ratio of the energy on the AC side of the inverter Eout to the rated DC power P0 of the PV panels. YF compares the energy produced by the system in relation to its rated output. In other words, the final output of a PV system, YF, is the fraction of the daily or monthly energy production of the entire PV system that has been delivered by the PV array in relation to the installed PV array power P0:
This indicator can also be determined on a daily basis as YF,d, the daily final yield of a PV system, expressed in (h/day):
In the case of monthly intervals, the monthly averaged final yield of the PV system YF,m can be calculated as an average of the sum of the daily indicators:
Thus, YF represents the number of hours (per day or month) during which a PV panel would have to operate at its rated power P0.
In order to determine the available energy resources, the PV system reference yield index YR was introduced. YR is the in-plane irradiation divided by the array reference irradiance, which is 1000 W/m2. Therefore, it represents the equivalent peak sun hours according to the following formula:
The YA, YF and YR indicators for the entire photovoltaic system are presented in Figure 7, and for three PV strings (str_1—mono-Si, str_2—poly-Si and str_3—mono-Si bifacial), they are depicted in Figure 8, Figure 9 and Figure 10. The variations of YA and YF follow the changes in irradiation that are available at the module plane. First of all, May and July are the most favored months for electric energy production, followed by the rest of the months belonging to the warm part of the year: June, August, September and April. The monthly average daily final yield is in the range of over 3 kWh/kWp in April to 4.5 kWh/kWp in May and drops below 4 kWh/kWp in September. Among the cold months, attention can be drawn to March, which is when YF is around 2.75 kWh/kWp.
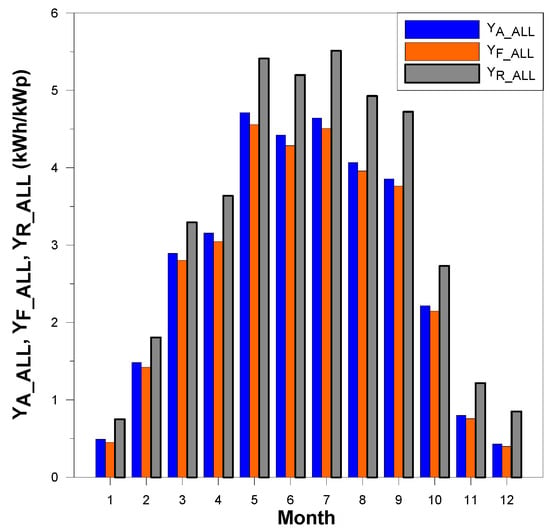
Figure 7.
Monthly values of array yield, final yield and reference yield of analyzed PV system.
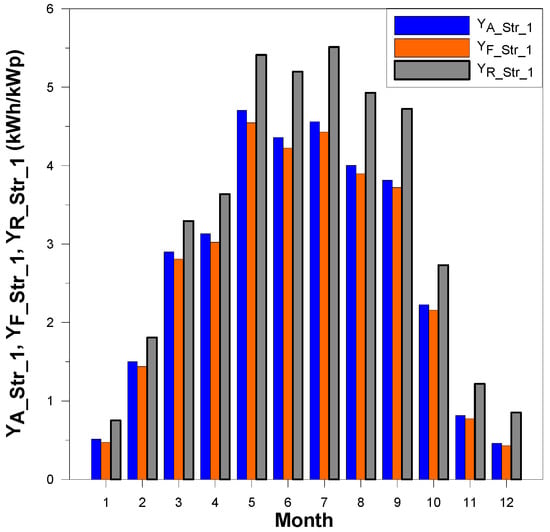
Figure 8.
Monthly values of array yield, final yield and reference yield for mono-Si modules.
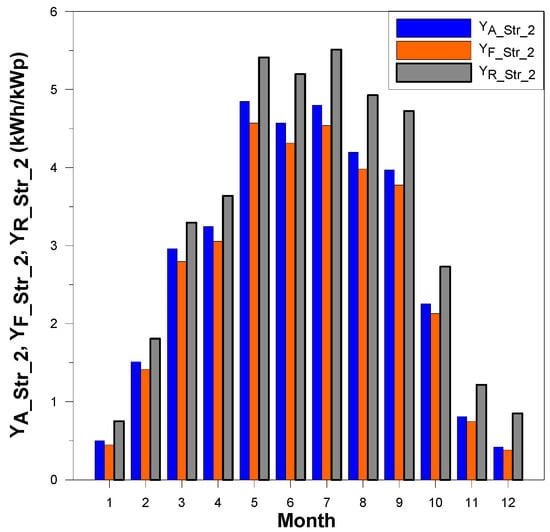
Figure 9.
Monthly values of array yield, final yield and reference yield for poly-Si modules.
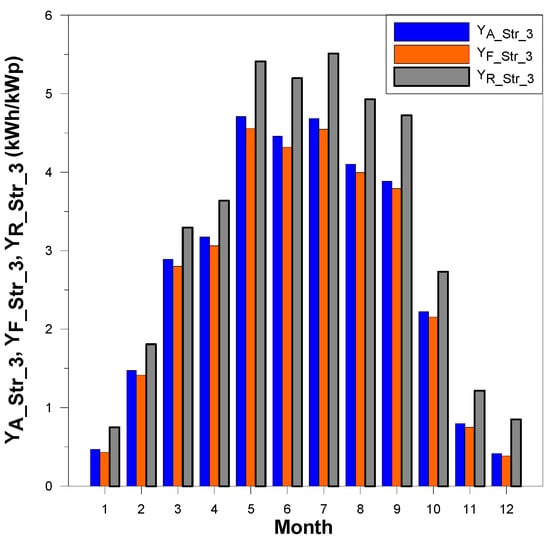
Figure 10.
Monthly values of array yield, final yield and reference yield for mono-Si bifacial modules.
The PR performance factor indicates the overall impact of losses on the rated output of the PV array due to the temperature variation in the modules, spectral mismatch and other failures of component parts of the PV. In other words, PR is the ratio of the energy delivered to the grid Eout that would have been generated if the system converted solar energy to electric energy at the level expected from the PV array rating:
The PR presented in Figure 11 indicates the overall effect of losses on the system output, and it is the quotient of the given PV string’s final yield (YF_Str_1, YF_Str_2 and YF_Str_3) to its reference yield YR.
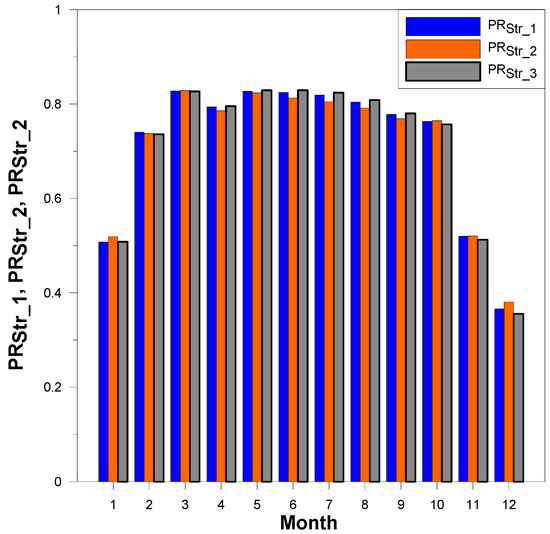
Figure 11.
Monthly values of performance ratio for all three PV strings (str_1—mono-Si; str_2—poly-Si; str_3—mono-Si bifacial).
In the months of the warm half of the year, from April to September, the PR value exceeds 80% for each string of modules. The tested PV technologies can be ordered in the following way, starting from the best PR: mono-Si bifacial, poly-Si and mono-Si. During the rest of months, the PR decreases significantly; however, in March, the PR achieves a value similar to that in summer months due to relatively high irradiation.
Referring to the analysis of four characteristic days (v.s.), it can be noted that the PR values of the three studied photovoltaic technologies in the selected characteristic days presented in Table 5 clearly reflect the roles of irradiation and temperature in the final yield of the photovoltaic array. The highest PR was achieved on 4 May due to a beneficial combination of the external conditions.

Table 5.
Performance ratio of system on four characteristic days.
3.3.2. Standardized Power Losses
Normalized losses are calculated as a difference in capacity. They are expressed in (kWh/kW), (h/day) or (h/month) and indicate the time during which the array would have to operate at the rated power P0 to cover the losses. System losses LS, which represent the losses in the individual components of the PV system, are mainly a result of inverter operation; they were determined according to the following equation:
These losses represent the amount of time that would be required for the array to operate at rated power P0 to ensure that losses are adequately balanced over this period.
The normalized array capture losses LC for the conversion of radiation energy into electrical energy are calculated as the difference of the reference yield and the array yield of the PV installation:
This indicator represents the energy conversion losses in the PV array.
The monthly average daily capture and system losses for the whole system are visible in Figure 12, and for separate PV technologies, they are shown in Figure 13, Figure 14 and Figure 15. The losses vary between the winter and summer months and are around two times higher in the summer due to the temperature effect.
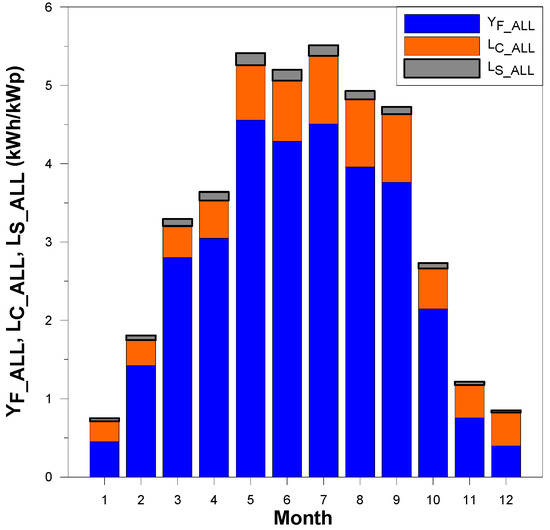
Figure 12.
Monthly values of PV final yield, capture losses and system losses.
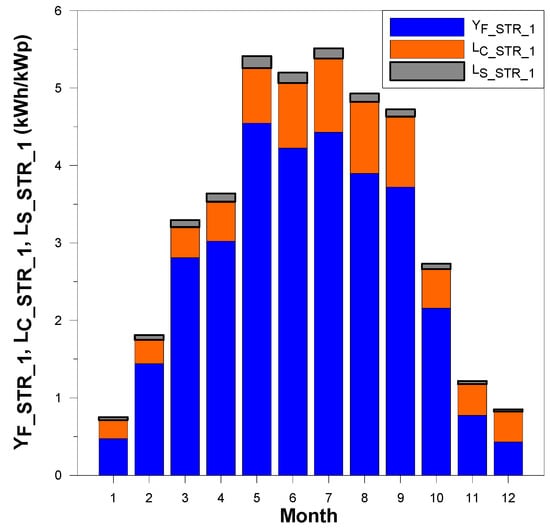
Figure 13.
Monthly values of PV final yield, capture losses and system losses for mono-Si modules.
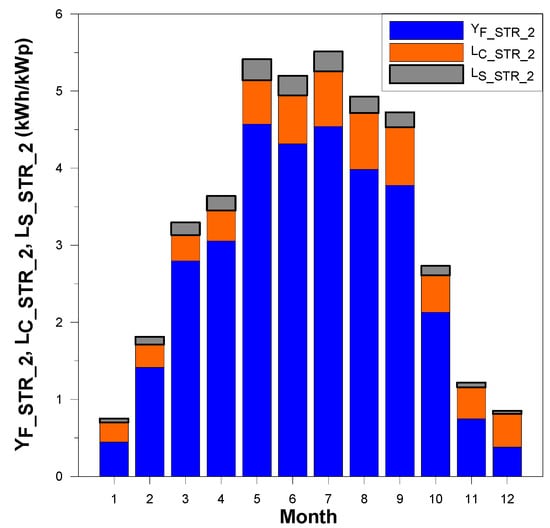
Figure 14.
Monthly values of PV final yield, capture losses and system losses for poly-Si modules.
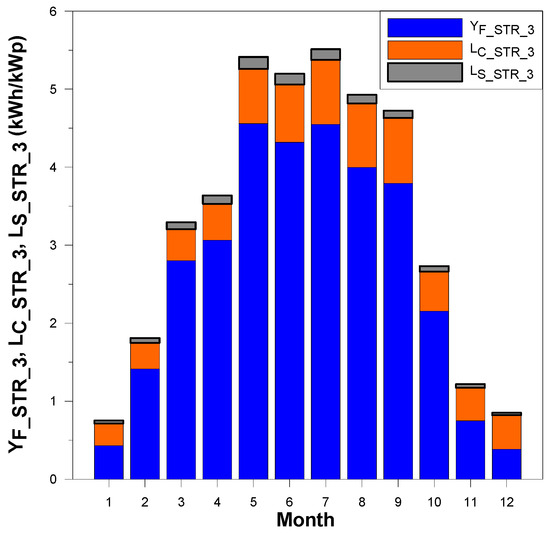
Figure 15.
Monthly values of PV final yield, capture losses and system losses for mono-Si bifacial modules.
All of the studied PV technologies exhibit the highest monthly average array capture losses during the period characterized by the best insolation due to their sensitivity to temperature increases. In the performance of the Si-mono technology, both the monofacial and bifacial array capture losses have a value of around 0.75 kWh/kWp. In the case of the Si-poly technology system, the losses play a relatively more important role in the warmer months. System losses, which are ascribed mainly to the performance of the inverter (v.i.), are much lower than array losses.
3.3.3. System Efficiency
The conversion efficiency of photovoltaic (PV) modules ηPV is the percentage of solar radiation energy incident on the active surface of PV cells that is converted into useful electrical energy:
where AA is the total surface area of the PV modules of the photovoltaic system.
Achieving improvements in PV conversion efficiency is a key research goal and helps to make PV technologies cost-competitive with conventional energy sources.
The average efficiency of the PV array over the analyzed period (daily and monthly) is defined as follows:
The PV inverter efficiency is given by
The monthly inverter efficiency (ηInv,m) is calculated as
All elements—system instantaneous PV system efficiency:
The average efficiency of the system (ηsys,m) is calculated as
All of the PV efficiency values presented in Figure 16 are lower than the nominal values shown in Table 1 due to the available real irradiance level, temperature, module degradation, optimizer efficiency loss, PV array and wiring mismatch losses as well as inverter losses. The efficiency of each studied PV technology exceeds 14% from March to August. A comparison of the three strings of modules (str_1—mono-Si; str_2—poly-Si; str_3—mono-Si bifacial) indicates that the efficiency of the bifacial modules outperformed those of the monofacial mono-Si and poly-Si, and the efficiency of mono-Si is higher than that of poly-Si, which is in accordance with the small differences in the nominal efficiency of the tested technologies. The average monthly efficiency of the PV array presents similar values; however, the average efficiency of the entire system is lower. The efficiency of the inverter increases with the DC input from March to October, reaching 95–98% under the highest input conditions (for the DC input, the efficiency is above 20% of the inverter rated capacity). Due to low insolation periods in the winter, instantaneous input power to the inverter is very low, and the efficiency of the inverter decreases.
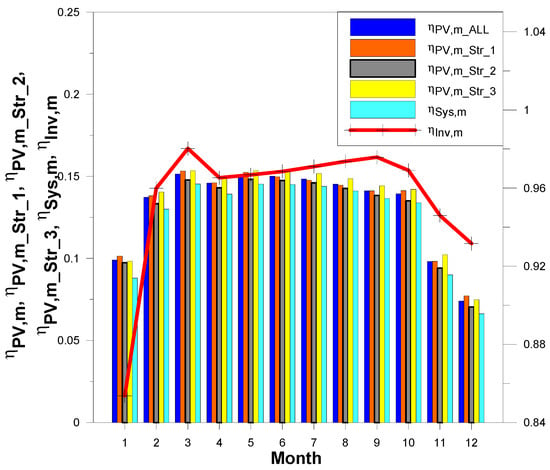
Figure 16.
The monthly values of the inverter efficiency, the efficiency of the whole system and the efficiency of three separate strings (str_1—mono-Si; str_2—poly-Si; str_3—mono-Si bifacial) over the year.
4. Discussion
The results of operating photovoltaic modules under real external conditions in Poland show some similarities to the results presented in the literature on other systems operating at a high latitude.
The parameter exhibiting strong dependence on the location of the PV system and the availability of solar radiation is the annual energy yield. The following annual yield values were recorded for the installations with silicon modules in countries located at different latitudes: 990 kWh/kWp in Sweden, 1047 kWh/kWp in the UK, 1030–1095 kWh/kWp in central Poland [20], 1100 kWh/kWp and 1080 kWh/kWp in southeast Poland [13,21], 1033 kWh/kWp in the present study, 1000 kWh/kWp in Germany, 1445 kWh/kWp in France, 1181 kWh/kWp in Italy, 1540 kWh/kWp at high irradiation combined with a higher temperature in Peru [22] and 1470 kWh/kWp in Morocco [5]. The comparison of the annual yield in various locations and different latitudes on the globe shows that the values of annual energy yield obtained in the present work are in the range that is typical for high-latitude countries.
The highest average daily final yield in this research is in the range of 4.0–4.5 kWh/kWp for all three studied photovoltaic technologies, which is lower than the maximum values of 5.2 kWh/kWp for Si-poly and 5.3 kWh/kW for Si-mono that were reached in May, June and July at a lower latitude in Morocco under a cold and temperate climate. In Malasia, the daily final yields for the mono-Si modules were 2.9 kWh/kWp in July and 4.14 kWh/kWp in March [23].
The performance ratio, which is also influenced by external conditions and the quality of modules, was 83% in this study, 81.5% in Dublin [24], 87% in the earlier study conducted in Poland [13], below 80% due to high temperatures during the summer in India [25], 70–90% for c-Si [26], 96% in a beneficial region of a cold and sunny climate in India and 90–91% in a hot and humid area [27], 79.1% in Malaysia [6], 84% in Peru under high irradiation [22] and a maximum of 85% in Morocco [5].
Another important parameter of the photovoltaic modules under investigation is efficiency. The nominal efficiency of the modules in this study was over 17%; however, in a real environment the efficiency of 7% was exhibited in the cold part of the year, and it increased to 15% during the warm part of the year. The highest values were obtained in March and May, when relatively good insolation was accompanied by a low temperature of the modules (monthly sum of irradiation of 95.36 kWh in March and 165.46 kWh in May and temperature of modules of 5.72 °C in March and 18.26 °C in May). In Poland, a similar efficiency of 14.5% for silicon modules was obtained in earlier studies [13,28]. In a mountainous region of North Africa where the temperature does not reach high levels, the efficiency varied between 10–12.8% and 10.4–12.7%, respectively, for p-Si and m-Si modules characterized by a lower nominal efficiency of 15% [5]. An investigation of multicrystalline modules showed a lower efficiency ranging from 6.2% to 10.4% in the summer and winter, respectively [29].
The array capture losses determined in this work, which account for around 0.75 kWh/kWp of energy loss per day, are in the range from 0.22 kWh/kWp/day [24] to 0.81 kWh/kWp/day, as reported in the literature [30]. This kind of loss is linked to the irradiance level, the temperature of modules and their quality. The total (array and system) daily losses were estimated to be 0.95–1.5 kWh/kWp for crystalline silicon technologies at a low-latitude location [5]. The main contribution to system losses comes from an inverter, which is characterized by the efficiency value, power threshold, voltage threshold and maximum power point tracking. In general, the efficiency of an inverter under good radiation is high, which was confirmed in the presented results where the inverter efficiency was over 95% during the months that are beneficial for energy production. Similar results were obtained in Ireland where the inverter efficiency varied from 86% in winter to 91% in summer [24].
In terms of the performance of bifacial photovoltaic modules, the investigations presented in the literature indicated the roles of the tilt angle, ground albedo, height over the ground and occurrence of diffuse light. According to the observations, a tilt angle of 35–45° was advantageous in Sweden where snow cover can shadow the modules, and a tilt angle of 22° facing east–west was advantageous in Qatar under much better solar conditions [9,31]. At an intermediate latitude, in Milano, the final yield gain due to bifaciality was 10.8% for rooftop monocrystalline silicon bifacial modules [19]. Satisfactory results were also obtained due to the increase in the height of the modules to 1 m over the ground, which provided a 20% bifacial gain at an albedo of 0.5 [32]. The comparative study performed in Frankfurt (Germany) and Catania (Italy) indicated that gains of up to 13.5% can be achieved with bifacial modules, and a higher latitude location in Frankfurt is beneficial due to the greater contribution of diffuse light that can be utilized by bifacial modules [33]. Such an observation was confirmed by the results of investigations carried in Saudi Arabia, where the gains were registered in the operation of bifacial modules in comparison to monofacial modules due to sandstorms [10].
5. Conclusions
The presented work is a comparative outdoor study of three photovoltaic technologies with similar rated power, namely 4.640 kWp mono-Si, 4.760 kWp poly-Si and 4.640 kWp mono-Si bifacial, in a rooftop-mounted installation at a high latitude. Despite the growing use of bifacial modules around the world, this technology is rarely met in Poland, and there is a lack of research on the operation of bifacial modules under the warm summer continental climate of Poland.
Under these conditions, the most important factors influencing PV production, such as irradiation and ambient temperature, fluctuate in a broad range during the subsequent seasons of the year. The temperature of the modules changes from −10 °C to 60 °C, and the monthly sum of irradiation increases from 26.6 Wh/m2 to 173.2 Wh/m2 in the winter and summer, respectively. In the year 2023, 1205 kWh/m2 of irradiation was accessible in the plane of modules, in which the contribution of the warm half of the year was 74.3%, and the whole system’s 14.04 kWp of rated power produced 14,141 MWh of electric energy.
On the basis of the research of three photovoltaic installations operating under the considered climate conditions, the conclusions drawn are as follows:
- The annual yield of each tested technology was 1002 kWh/kWp for mono-Si, 1009 kWh/kWp for poly-Si and 1011 kWh/kWp for mono-Si bifacial;
- The annual energy yield of the entire system was 1033 kWh/kWp, and the performance ratio achieved was 83%;
- The highest average daily final yield was in the range of 4.0–4.5 kWh/kWp for each photovoltaic technology under investigation;
- In the cold part of the year, the efficiency of the photovoltaic modules was estimated to be 15%, and it was estimated to be 7% during the warm part of the year;
- Array capture losses accounted for around 0.75 kWh/kWp of energy loss per day, and the inverter efficiency was over 95% during months that are beneficial for energy production;
- All three studied silicon technologies have positive values for the temperature coefficient of power and are sensitive to temperature increases, both of which are due to ambient temperature growth and the heat coming from solar radiation, which results in a decrease in power production and losses in efficiency;
- March and May were the most beneficial months due to the combination of relatively high irradiation and a low temperature;
- The tilt angle and the orientation of the bifacial modules were the same as those for the other types of tested modules, which resulted in a limitation of access to light on the back side of the modules, and the value of the annual energy yield was only slightly higher than that for traditional mono-Si modules. However, increasing the tilt angle would result in shading, which could be avoided by reducing the number of modules and, thus, the installed power on the roof with the limited area;
- December and January are the months that can be excluded from the analysis due to the possible occurrence of snow cover, which limits the access of solar radiation. For the purpose of future studies, the determination of the snow cover factor based on long-term research would be useful; however, the unpredictable weather conditions evoked by climate change make such a prediction difficult.
In Poland, the warm half of the year receives three times more solar energy than the cold half of the year. However, the annual yield of 1000–1100 kWh/kWp achieved in Poland is in the same range as in Great Britain, the Netherlands and Germany, which have been the world leaders in photovoltaics for many years. Important factors promoting the development of photovoltaics include, of course, financial investment support programs offered in countries such as Poland.
Author Contributions
Conceptualization, A.Z.; methodology, A.Z. and D.S.; formal analysis, A.Z. and D.S.; investigation, D.S. and A.Z.; resources, D.S.; data curation, D.S.; writing—original draft preparation, A.Z.; visualization, D.S. and A.Z.; supervision, A.Z.; funding acquisition, A.Z. All authors have read and agreed to the published version of the manuscript.
Funding
The research leading to these results has received funding from the commissioned task entitled “VIA CARPATIA Universities of Technology Network named after the President of the Republic of Poland Lech Kaczyński”, contract no. MEiN/2022/DPI/2575, 22 October 2022, and the action entitled “In the neighborhood—inter-university research internships and study visits”.
Data Availability Statement
The raw data supporting the conclusions of this article will be made available by the authors upon request.
Conflicts of Interest
The authors declare no conflicts of interest.
References
- Salameh, T.; Hamid, A.K.; Farag, M.M.; Abo-Zahhad, E.M. Experimental and numerical simulation of a 2.88 kW PV grid-connected system under the terrestrial conditions of Sharjah city. Energy Rep. 2023, 9, 320–327. [Google Scholar] [CrossRef]
- Tamoor, M.; Bhatti, A.R.; Farhan, M.; Zaka, M.A.; ZakaUllah, P. Solar Energy Capacity Assessment and Performance Evaluation of Designed Grid-Connected Photovoltaic Systems. Eng. Proc. 2023, 37, 39. [Google Scholar] [CrossRef]
- Dang, D.N.; Le Viet, T.; Takano, H.; Duc, T.N. Estimating parameters of photovoltaic modules based on current–voltage characteristics at operating conditions. Energy Rep. 2023, 9, 18–26. [Google Scholar] [CrossRef]
- Othman, R.; Hatem, T.M. Assessment of PV technologies outdoor performance and commercial software estimation in hot and dry climates. J. Clean. Prod. 2022, 340, 130819. [Google Scholar] [CrossRef]
- Ameur, A.; Berrada, A.; Bouaichi, A.; Loudiyi, K. Long-term performance and degradation analysis of different PV modules under temperate climate. Renew. Energy 2022, 188, 37–51. [Google Scholar] [CrossRef]
- Akhter, M.N.; Mekhilef, S.; Mokhlis, H.; Olatomiwa, L.; Muhammad, M.A. Performance assessment of three grid-connected photovoltaic systems with combined capacity of 6.575 kWp in Malaysia. J. Clean. Prod. 2020, 277, 123242. [Google Scholar] [CrossRef]
- Kazem, H.A.; Chaichan, M.T.; Al-Waeli, A.H.A.; Sopian, K. A review of dust accumulation and cleaning methods for solar photovoltaic systems. J. Clean. Prod. 2020, 276, 123187. [Google Scholar] [CrossRef]
- Johnson, J.; Manikandan, S. Experimental study and model development of bifacial photovoltaic power plants for Indian climatic zones. Energy 2023, 284, 128693. [Google Scholar] [CrossRef]
- Baloch, A.A.B.; Hammat, S.; Figgis, B.; Alharbi, F.H.; Tabet, N. In-field characterization of key performance parameters for bifacial photovoltaic installation in a desert climate. Renew. Energy 2020, 159, 50–63. [Google Scholar] [CrossRef]
- Katsaounis, T.; Kotsovos, K.; Gereige, I.; Basaheeh, A.; Abdullah, M.; Khayat, A.; Al-Habshi, E.; Al-Saggaf, A.; Tzavaras, A.E. Performance assessment of bifacial c-Si PV modules through device simulations and outdoor measurements. Renew. Energy 2019, 143, 1285–1298. [Google Scholar] [CrossRef]
- Louwen, A.; de Waal, A.C.; Schropp, R.E.I.; Faai, A.P.C.; van Sark, W.G.J.H.M. Comprehensive characterization and analysis of PV module performance under real operating conditions. Prog. Photovolt. Res. Appl. 2017, 25, 218–232. [Google Scholar] [CrossRef]
- Dirnberger, D.; Blackburn, G.; Müler, B.; Reise, C. On the impact of solar spectral irradiance on the yield of different PV technologies. Sol. Energy Mater. Sol. Cells 2015, 132, 431–442. [Google Scholar] [CrossRef]
- Zdyb, A.; Gulkowski, S. Performance Assessment of Four Different Photovoltaic Technologies in Poland. Energies 2020, 13, 196. [Google Scholar] [CrossRef]
- Zdyb, A.; Szałas, G. Rooftop Low Angle Tilted Photovoltaic Installation Under Polish Climatic Conditions. J. Ecol. Eng. 2021, 22, 223–233. [Google Scholar] [CrossRef] [PubMed]
- International Technology Roadmap for Photovoltaic. 2022. Available online: https://etip-pv.eu/news/other-news/international-technology-roadmap-for-photovoltaic-itrpv-r-d-findings-from-the-13th-edition/ (accessed on 15 January 2024).
- Granlund, A.; Narvesjö, J.; Petersson, A.M. The Influence of Module Tilt on Snow Shadowing of Frameless Bifacial Modules. Available online: https://www.diva-portal.org/smash/get/diva2:1384575/FULLTEXT01.pdf (accessed on 20 January 2024).
- Pike, C.; Whitney, E.; Wilber, M.; Stein, J.S. Field Performance of South-Facing and East-West Facing Bifacial Modules in the Arctic. Energies 2021, 14, 1210. [Google Scholar] [CrossRef]
- Alam, M.; Gul, M.S.; Muneer, T. Performance analysis and comparison between bifacial and monofacial solar photovoltaic at various ground albedo conditions. Renew. Energy Focus 2023, 44, 295–316. [Google Scholar] [CrossRef]
- IEC TS 61724-3:2016; Photovoltaic System Performance—Part 3: Energy Evaluation Method. Available online: https://webstore.iec.ch/publication/25466 (accessed on 29 April 2024).
- Pietruszko, S.M.; Gradzki, M. Performance of a grid connected small PV system in Poland. Appl. Energy 2003, 74, 177–184. [Google Scholar] [CrossRef]
- Dragan, P.; Zdyb, A. Reduction of Pollution Emission by Using Solar Energy in Eastern Poland. J. Ecol. Energy 2017, 18, 231–235. [Google Scholar] [CrossRef] [PubMed]
- Romero-Fiances, I.; Muñoz-Cerón, E.; Espinoza-Paredes, R.; Nofuentes, G.; de la Casa, J. Analysis of the Performance of Various PV Module Technologies in Peru. Energies 2019, 12, 186. [Google Scholar] [CrossRef]
- Humada, A.M.; Hojabri, M.; Hamada, H.M.; Samsuri, F.B.; Ahmed, M.N. Performance evaluation of two PV technologies (c-Si and CIS) for building integrated photovoltaic based on tropical climate condition: A case study in Malaysia. Energy Build. 2016, 119, 233–241. [Google Scholar] [CrossRef]
- Ayompe, L.M.; Duffy, A.; McCormack, S.J.; Conlon, M. Measured performance of a 1.72 kW rooftop grid connected photovoltaic system in Ireland. Energy Convers. Manag. 2011, 52, 816–825. [Google Scholar] [CrossRef]
- Sharma, V.; Kumar, A.; Sastry, O.S.; Chandel, S.S. Performance assessment of different solar photovoltaic technologies under similar outdoor conditions. Energy 2013, 58, 511–518. [Google Scholar] [CrossRef]
- Ozden, T.; Akinoglu, B.G.; Turan, R. Long term outdoor performances of three different on-grid PV arrays in central Anatolia—An extended analysis. Renew. Energy 2017, 101, 182–195. [Google Scholar] [CrossRef]
- Bora, B.; Kumar, R.; Sastry, O.S.; Prasad, B.; Mondal, S.; Tripathi, A.K. Energy rating estimation of PV module technologies for different climatic conditions. Sol. Energy 2018, 174, 901–911. [Google Scholar] [CrossRef]
- Gułkowski, S.; Zdyb, A.; Dragan, P. Experimental Efficiency Analysis of a Photovoltaic System with Different Module Technologies under Temperate Climate Conditions. Appl. Sci. 2019, 9, 141. [Google Scholar] [CrossRef]
- Gaglia, A.G.; Lykoudis, S.; Argiriou, A.A.; Balaras, C.A.; Dialynas, E. Energy efficiency of PV panels under real outdoor conditions—An experimental assessment in Athens, Greece. Renew. Energy 2017, 101, 236–243. [Google Scholar] [CrossRef]
- Mondol, J.D.; Yohanis, Y.; Smyth, M.; Norton, B. Long term performance analysis of a grid connected photovoltaic system in Northern Ireland. Energy Convers. Manag. 2006, 47, 2925–2947. [Google Scholar] [CrossRef]
- Alexander, J.N.; Granlund, A.M.P. The influence of module tilt on snow shadowing of frameless bifacial modules. In Proceedings of the 36th European Photovoltaic Solar Energy Conference and Exhibition (EU PVSEC) (2019), Marseille, France, 9–13 September 2019; pp. 1650–1654. [Google Scholar]
- Sun, X.; Khan, M.R.; Deline, C.; Alam, M.A. Optimization and performance of bifacial solar modules: A global perspective. Appl. Energy 2018, 212, 1601–1610. [Google Scholar] [CrossRef]
- Tina, G.M.; Scavo, F.B.; Merlo, L.; Bizzarri, F. Comparative analysis of monofacial and bifacial photovoltaic modules for floating power plants. Appl. Energy 2021, 281, 116084. [Google Scholar] [CrossRef]
Disclaimer/Publisher’s Note: The statements, opinions and data contained in all publications are solely those of the individual author(s) and contributor(s) and not of MDPI and/or the editor(s). MDPI and/or the editor(s) disclaim responsibility for any injury to people or property resulting from any ideas, methods, instructions or products referred to in the content. |
© 2024 by the authors. Licensee MDPI, Basel, Switzerland. This article is an open access article distributed under the terms and conditions of the Creative Commons Attribution (CC BY) license (https://creativecommons.org/licenses/by/4.0/).