Article

Performance Characteristics and Optimization of a Single-Stage Direct Air Capture Membrane System in Terms of Process Energy Intensity

Department of Power Engineering and Turbomachinery, Faculty of Energy and Environmental Engineering, Silesian University of Technology, 44-100 Gliwice, Poland
*
Author to whom correspondence should be addressed.
Energies 2024, 17(9), 2046; https://doi.org/10.3390/en17092046
Submission received: 2 April 2024 / Revised: 23 April 2024 / Accepted: 24 April 2024 / Published: 25 April 2024
(This article belongs to the Special Issue Advances in Efficient Thermal Conversion of Carbon-Based Fuels)

Abstract

:
The increase in emissions and concentration of carbon dioxide in the atmosphere necessitates the implementation of direct carbon dioxide capture technologies. The article presents the characteristics of a single-stage membrane unit for the direct capture of carbon dioxide from the air. A membrane with a selectivity of α C O 2 / N 2 = 70 and permeability P C O 2 = 108 m 3 ( S T P ) ( m 2 · h · b a r ) is chosen as the reference variant. It is demonstrated that increasing the pressure difference in the system by reducing the pressure of the permeate stream results in an improvement of all analyzed parameters. Manipulating both the membrane surface and its CO2 permeability yields similar results. With an increase in permeability or membrane surface area, the proportion of CO2 in the retentate and permeate decreases, while the degree of carbon dioxide recovery increases. However, the energy intensity of the process is a complex issue due to the presence of a local minimum in the obtained characteristics. Therefore, a relationship between the constants of energy intensity values for the separation process on the surface area field and CO2 membrane permeability is presented. The minimum energy intensity of the process obtained is 22.5 k W h / k g C O 2 . The CO2 content in the retentate for all analyses did not exceed 280 ppm.

1. Introduction

Carbon dioxide is commonly regarded as the leading greenhouse gas (GHG). Despite having a lower global warming potential (GWP) compared to methane or freons, its significant emission from anthropogenic sources and relatively long atmospheric lifespan play a significant role in global warming [1]. The highest emissions of carbon dioxide for years have mainly originated from sectors such as electricity and heat generation and transportation, as well as manufacturing and construction [2]. The mining industry, primarily serving the energy sector, is also characterized by high emissions. Special attention should be paid to coal mines, which, in addition to CO2 emissions, are responsible for significant amounts of methane emissions [3,4,5]. The development of renewable energy sources and electrification in sectors like heating or transportation plays a significant role in reducing carbon dioxide emissions. However, the actions taken so far are still insufficient [6]. According to the latest report from the International Energy Agency (IEA) in 2023, there was a 1.1% increase in CO2 emissions associated with energy alone [7]. Global CO2 emissions from energy combustion and industrial processes reached 37.2 Gt compared to 36.8 Gt in 2022. Despite a significant increase in the share of renewable energy sources in the global energy structure, emissions are rising, leading to record-high concentrations of carbon dioxide in the atmosphere. As reported by the National Oceanic and Atmospheric Administration (NOAA), which monitors atmospheric conditions, the CO2 concentration in May 2022 was 421 ppm compared to about 280 ppm before the industrial era [8]. According to the scenario considering the fulfillment of national commitments to reduce CO2 emissions by individual countries, the peak of global carbon dioxide emissions from fossil fuel combustion and industrial processes is expected to be achieved before 2030 [9,10]. Continued downward emission trends are projected to lead to significant reductions in CO2 emissions by 2050, as shown by region in Figure 1 [9]. The Asia–Pacific region has the highest CO2 emissions, reaching 18,871 Mt CO2 in 2020. In comparison, the second highest emitting region, North America, reached emissions of 5051 Mt in 2022. By 2050, all regions except Africa are expected to achieve significant emission reductions, with the Asia–Pacific region projected to reduce emissions by about half. However, the scientific community has stressed for years that it may not be possible to meet reduction commitments without the implementation of negative CO2 emission technologies [11,12,13,14]. Consequently, there is a growing focus in the scientific community on the widespread implementation of direct air capture (DAC) technology as a key element towards achieving a net zero emissions (NZE) scenario by 2050 [15,16]. The DAC concept aims to significantly reduce atmospheric CO2 concentrations in the long term.
Unlike traditional carbon dioxide sequestration methods such as carbon capture and storage (CCS) or carbon capture and utilization (CCU), direct air capture relies on the carbon dioxide already present in the atmosphere. Consequently, this process can be conducted independently of emitters [6,17,18]. DAC installations can be located near suitable geological formations for storage or industrial facilities utilizing carbon dioxide as a substrate in various technological processes, such as within Power-to-X technologies [19,20,21,22,23]. This eliminates the need for costly gas transportation over long distances via pipelines. Another advantage of this technology is the potential to reduce carbon dioxide emissions from sources where other methods are not feasible for various reasons. DAC can play a crucial role in reducing carbon dioxide emissions, especially in sectors like aviation, maritime transport, or heavy industry, where electrification is relatively challenging [16,17,18]. According to the IEA, 27 different DAC installations have been commissioned worldwide so far, with six more under construction [15]. However, there are considerations for at least 130 different projects related to the direct air capture of CO2. Direct air capture technology has caught the attention of Microsoft, a global leader in the technology industry. Microsoft has committed to achieving negative carbon dioxide emissions by 2030. Part of this goal involves purchasing tokens representing the removal of a certain amount of carbon dioxide from the atmosphere, which is facilitated by companies specializing in DAC technology [24,25,26].
While various technologies considered and used in post combustion capture (PCC) can be modified for direct air capture purposes, currently, two technological approaches are employed for capturing CO2 directly from the atmosphere: liquid (L-DAC) and solid (S-DAC) [15]. In the case of L-DAC, liquid solvents are utilized for carbon dioxide absorption. Although the process is less energy-intensive than S-DAC (approximately 6.5 GJ/t CO2), sorbent regeneration occurs at high temperatures (300–900 °C) by burning natural gas. S-DAC utilizes porous solid sorbents to capture carbon dioxide on their surface, and due to the lower required operating temperatures (80–120 °C), there is potential to power the process using renewable energy sources. However, the overall energy consumption of the process can reach up to 10 GJ/t CO2 [15]. The high energy consumption of the process resulting from the low concentration of carbon dioxide in the atmosphere is the main obstacle to the development of DAC technology. The direct air capture of carbon dioxide from the atmosphere consequently entails high costs per ton of captured CO2. As reported by Kiani et al. [27], the total cost range for L-DAC can vary from 273 to 1227 USD per ton of CO2 depending on various economic parameters such as electricity, heat price, installation lifespan, and investment costs. However, typically, the estimated cost in the literature ranges from USD 100 to 1000 for both S-DAC and L-DAC, with the prospect of reduction over the years as the still young technology scales up [17,28,29,30,31,32]. Consequently, efforts are underway to develop alternative methods for CO2 capture from the air.
Membrane separation is a well-established and developed technology proposed as part of the post-combustion capture process [33,34,35,36,37,38,39]. Unlike sorption methods, this technology does not require chemicals or an energy-intensive regeneration process. It is characterized by lower investment costs, surface area consumption, and the ease of process operation [40]. Due to its use of only electrical energy, the implementation of direct air capture membrane units may serve as an effective tool for stabilizing the electrical grid in the future, which will be increasingly important with the growing share of renewable energy sources. However, due to the low concentration of carbon dioxide in the atmosphere and the lack of membranes with suitable separation properties, this concept was not considered feasible for DAC for many years. The low permeability of CO2 membranes requires high pressure differentials in the system or membranes with sufficiently large surface areas for effective gas capture [41]. The required membrane surface area is inversely proportional to the permeability properties [42]. Consequently, this technology seemed unprofitable. However, the situation has changed with the dynamic development of membranes with ultra-high selectivity and permeability for the separated gas, mainly based on polymers [43,44,45]. For example, Fujikawa et al. announced the development of a membrane with the highest reported CO2 permeability to date, reaching nearly 40,000 GPU [43]. As a result of membrane advancements in recent years, several publications have emerged regarding the use of membrane technology in DAC installations [40,41,42,46,47]. However, they are largely review papers on the development of the diaphragm segment in terms of its use in DAC systems. Nevertheless, the concept of a multi-stage membrane DAC unit was discussed in work by Fujikawa et al. [42]. Based on a membrane with a CO2 permeability of 40,000 GPU and a CO2/N2 selectivity of 70, the authors demonstrated the possibility of achieving a 30% carbon dioxide content in the permeate in a four-stage system. They assumed a CO2 concentration in the retentate of 300 ppm. Additionally, the authors showed that with a membrane permeability of 10,000 GPU and a realistic CO2/N2 selectivity of 30, a 40% CO2 content in the permeate could be achieved. The lack of sufficient research on membrane separation in the context of its use in DAC is noted by Castel et al. [46]. Therefore, the researchers in their work determined the key parameters of a single-stage membrane unit’s operation and discussed its capabilities and limitations. They pointed out that in the case of a single-stage membrane separation process based on currently available technologies on the market, the maximum CO2 content in the permeate could be 2%, and the process energy consumption is around 18,000 kWh/t CO2. The energy demand can be minimized through vacuum pumping, but this results in an increase in the membrane surface area.
The literature regarding the characteristics of membrane-based direct air capture systems remains relatively scarce, and the impact of individual process parameters is still relatively poorly understood. This study focused on identifying relationships between changes in selected process parameters and key parameters characterizing membrane separation in a single-stage system. In contrast to existing literature, part of the analysis was conducted in the context of changes in membrane permeability over a wide range, rather than just its selectivity. For membrane DAC technology to effectively compete with sorption methods, it is necessary to understand the relationship between the membrane’s sorption capabilities and its surface area in the context of process energy intensity. Therefore, this study paid particular attention to the complexity of carbon dioxide capture energy intensity and proposed an optimization criterion, filling an existing gap in the literature in this area.

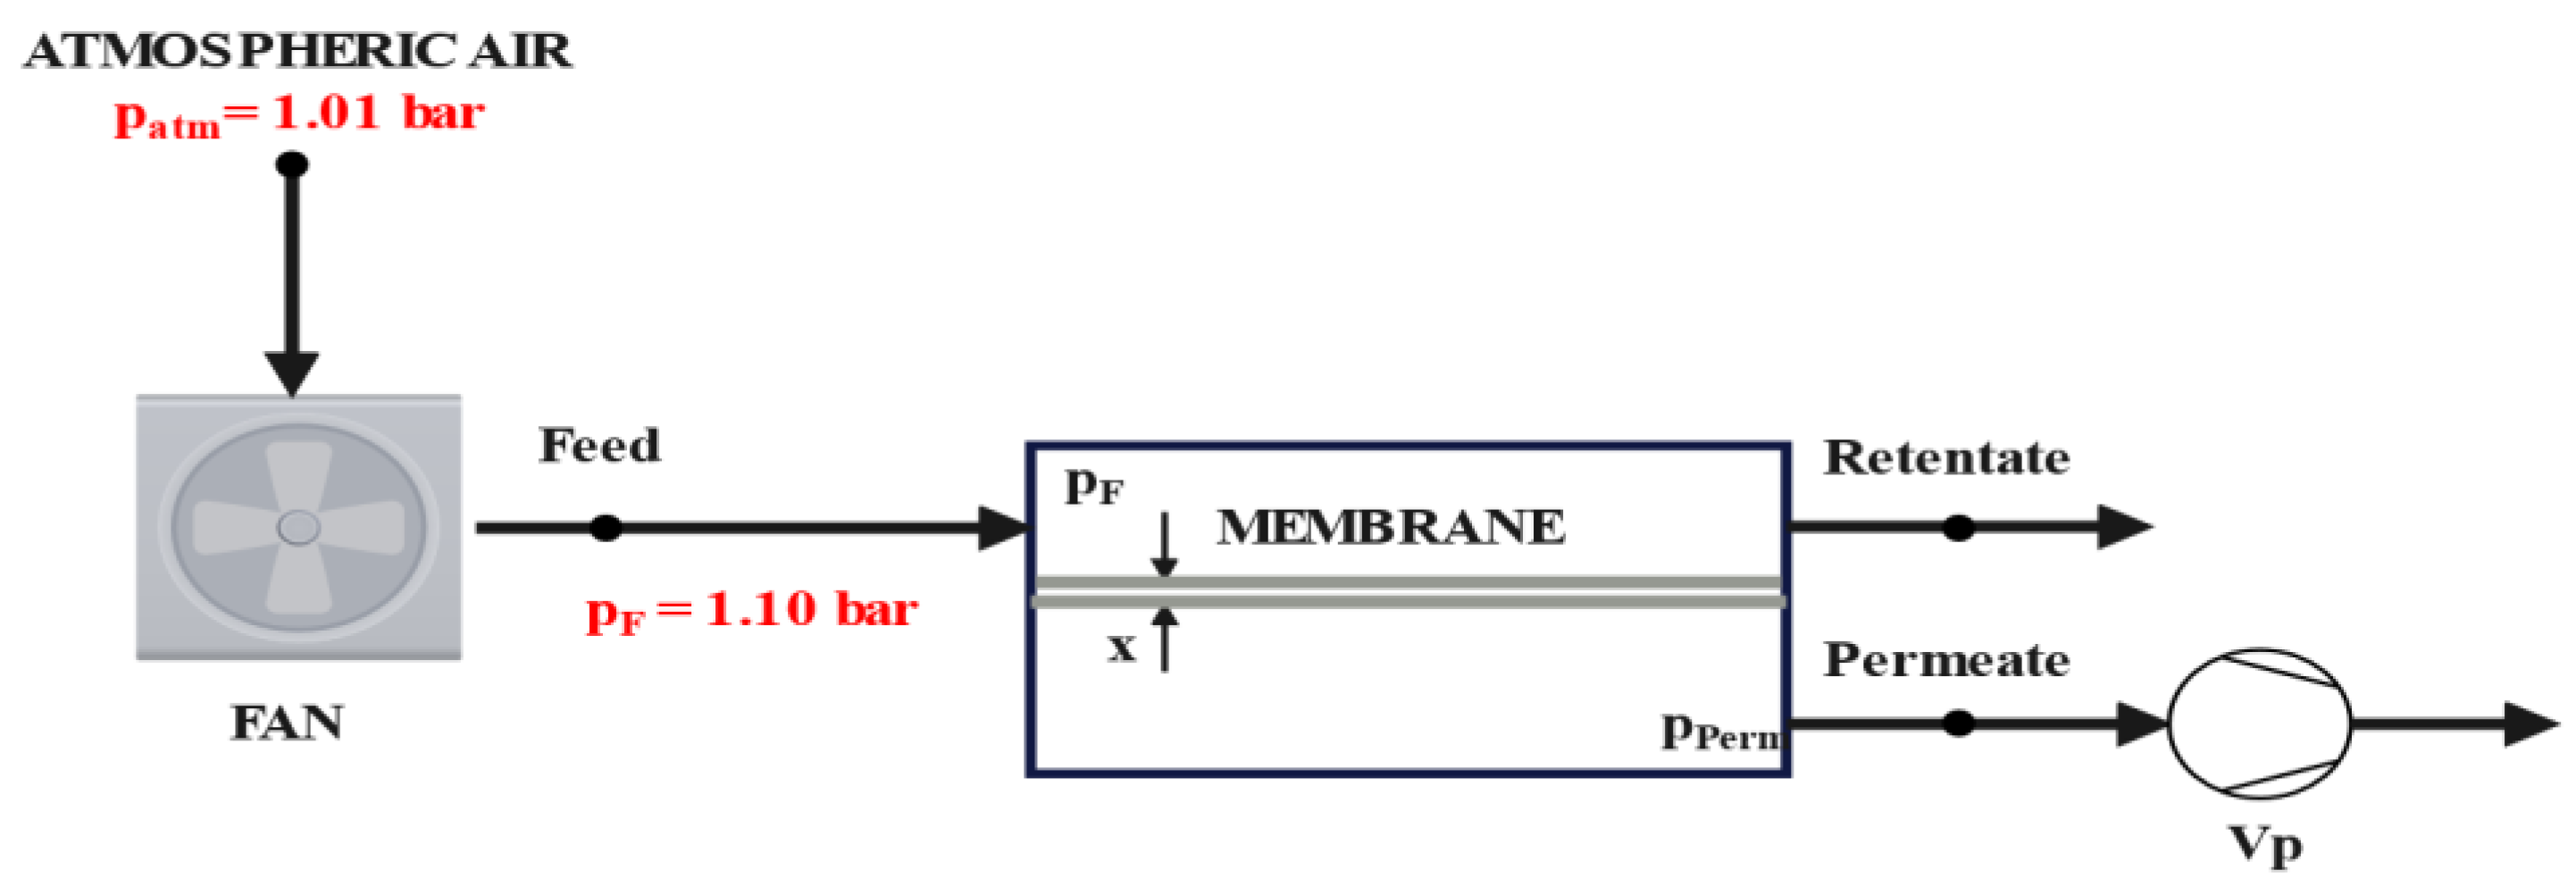
2. Materials and Methods

The process of single-stage membrane separation is depicted in the diagram in Figure 2. A unit for the direct capture of carbon dioxide from the air using membrane technology in its simplest single-stage configuration consists of a pre-fan, membrane, and vacuum pump. The pre-fan is responsible for providing slight positive pressure to the atmospheric air to feed the membrane. As a result of membrane separation, the feed stream is separated into the retentate stream and the permeate stream. The retentate stream consists of atmospheric air purified to some extent from carbon dioxide, while the permeate stream contains the separated gas component of certain purity. The efficiency of the membrane separation process is mainly determined by the pressure difference between the feed and permeate [34,35]. To ensure the pressure difference in the system, a vacuum pump is employed.
To achieve adequate separation process efficiency, membranes must possess high selectivity and permeability for the gas being separated. This is a key area of research in membrane technology development, determining their future applications. In this study, in the initial calculation stage, similar assumptions were adopted as Fujikawa et al. [42]. For calculation purposes, the authors of this study determined the membrane’s CO2 permeability and selectivity based on two different membranes [43,48]. The first consists of free-standing siloxane nanomembrane with a record CO2 permeability of 40,000 GPU. The second is a multilayer membrane made of Pebax-1657 (Arkema, Colombes, France), with an oxygen plasma-activated poly(dimethylsiloxane) (PDMS) surface used as a gutter layer with a selectivity of 70 CO2/N2. Some analyses allow for achieving CO2 permeability at the level of 50,000 GPU. This is associated with the dynamic development of membrane technology and expected improvements in membrane separation capabilities. Modeling carbon dioxide capture directly from the atmosphere using membrane separation was conducted in Aspen Plus Customer V.12 software, a program that is part of the Aspen Plus V.12 using the Peng-Robinson thermodynamic model. The membrane module consists of cross-flow capillaries and the separation process is isothermal [34,35]. This software does not allow for the use of permeability expressed in GPU units. Therefore, carbon dioxide permeability expressed in GPU ( 1   G P U = 7.5 · 10 12 m 3 S T P ( m 2 · s · P a ) ) was converted to the units used in the Aspen Plus software, expressed in m 3 ( S T P ) ( m 2 · h · b a r ) . The analysis of the simulation results was carried out using Matlab software R2022b. The key calculation assumptions are presented in Table 1. A constant CO2 fraction in the retentate at the level of 300 ppm, as proposed by Fujikawa et al. [42], was not established. The carbon dioxide fraction in the retentate stream is an outcome and is intended to assess the suitability of membrane technology in DAC systems for reducing atmospheric carbon dioxide concentration and achieving NZE scenarios.
The parameters, such as the permeation coefficient value P i (permeability), membrane surface area A, and the partial pressure difference of the separated component across the membrane on both sides, determine the value of the permeate flux [35]. This is described by the following equation:
d J i = P i p F Z i p P e r m Y i d A
where
  • Z—the share of the gaseous component in the feed;
  • Y—the share of the gaseous component in the permeate;
  • i—gaseous component, e.g., CO2.
The difference in partial pressures on both sides of the membrane is the driving force behind the separation process. In general, in membrane separation technology, in order to achieve the highest possible pressure difference, treatments such as the following are used [34,35]:
-
Increasing the feed pressure;
-
Lowering the permeate pressure;
-
Increasing the concentration of the permeate component at the membrane inlet;
-
Reducing the permeate concentration on the permeate side by using additional sweep gas.
In this study, it was decided to adjust the permeate pressure. A vacuum pump was used to provide the pressure difference between the feed and permeate streams. Therefore, the driving energy of the vacuum pump and the fan supplying air to the membrane is the only energy expenditure. Hence, the energy intensity of the membrane separation process can be determined, for example, in terms of the energy consumed by these flow machines per kilogram of captured CO2, according to Equation (2). The optimization of the operation of flow machines in terms of power consumption, such as the fan or vacuum pump, is not part of this study. The focus, however, is on parameters directly related to membrane separation, such as permeability, selectivity, membrane surface area, and pressure difference in the system, to understand their overall impact on the energy intensity of the separation process. Therefore, for calculations, a simple single-stage model of the vacuum pump and fan was used, with efficiencies presented in Table 1.
E s e p = N e l V P + N e l V A N m ˙ P C O 2 ,   k W h / k g C O 2
where
  • N e l V P —the power requirement of the vacuum pump, kW;
  • N e l W —the power requirement of the pre-fan, kW;
  • m ˙ P C O 2 —CO2 flow rate in the permeate, k g C O 2 / h .
Membrane selectivity is an important parameter that determines the membrane’s ability to selectively allow the passage of one or more chemical compounds while blocking the passage of others. It is defined as the ratio of the permeabilities of selected gas components, which for example, for CO2 and N2, is presented in Equation (3).
α C O 2 / N 2 = P C O 2 P N 2
According to Table 1, the reference value for membrane selectivity α C O 2 / N 2 is 70, while the permeability of CO2 is 108   m 3 ( S T P ) ( m 2 · h · b a r ) . The permeability of other gas components L x , such as nitrogen, oxygen, and argon, is assumed to be constant relative to each other and depends on the permeability of carbon dioxide P C O 2 and the selectivity index α C O 2 / N 2 , as described by Equation (4).
L x = P C O 2 α C O 2 / N 2
The carbon dioxide recovery rate provides information on the portion of carbon dioxide from atmospheric air that is present in the permeate, as depicted by the following relationship:
R = n P e r m ( Y C O 2 ) n F ( Z C O 2 )
where
  • n P e r m permeate molar flux, kmol/h;
  • n F permeate molar flux, kmol/h.

3. Results and Discussion

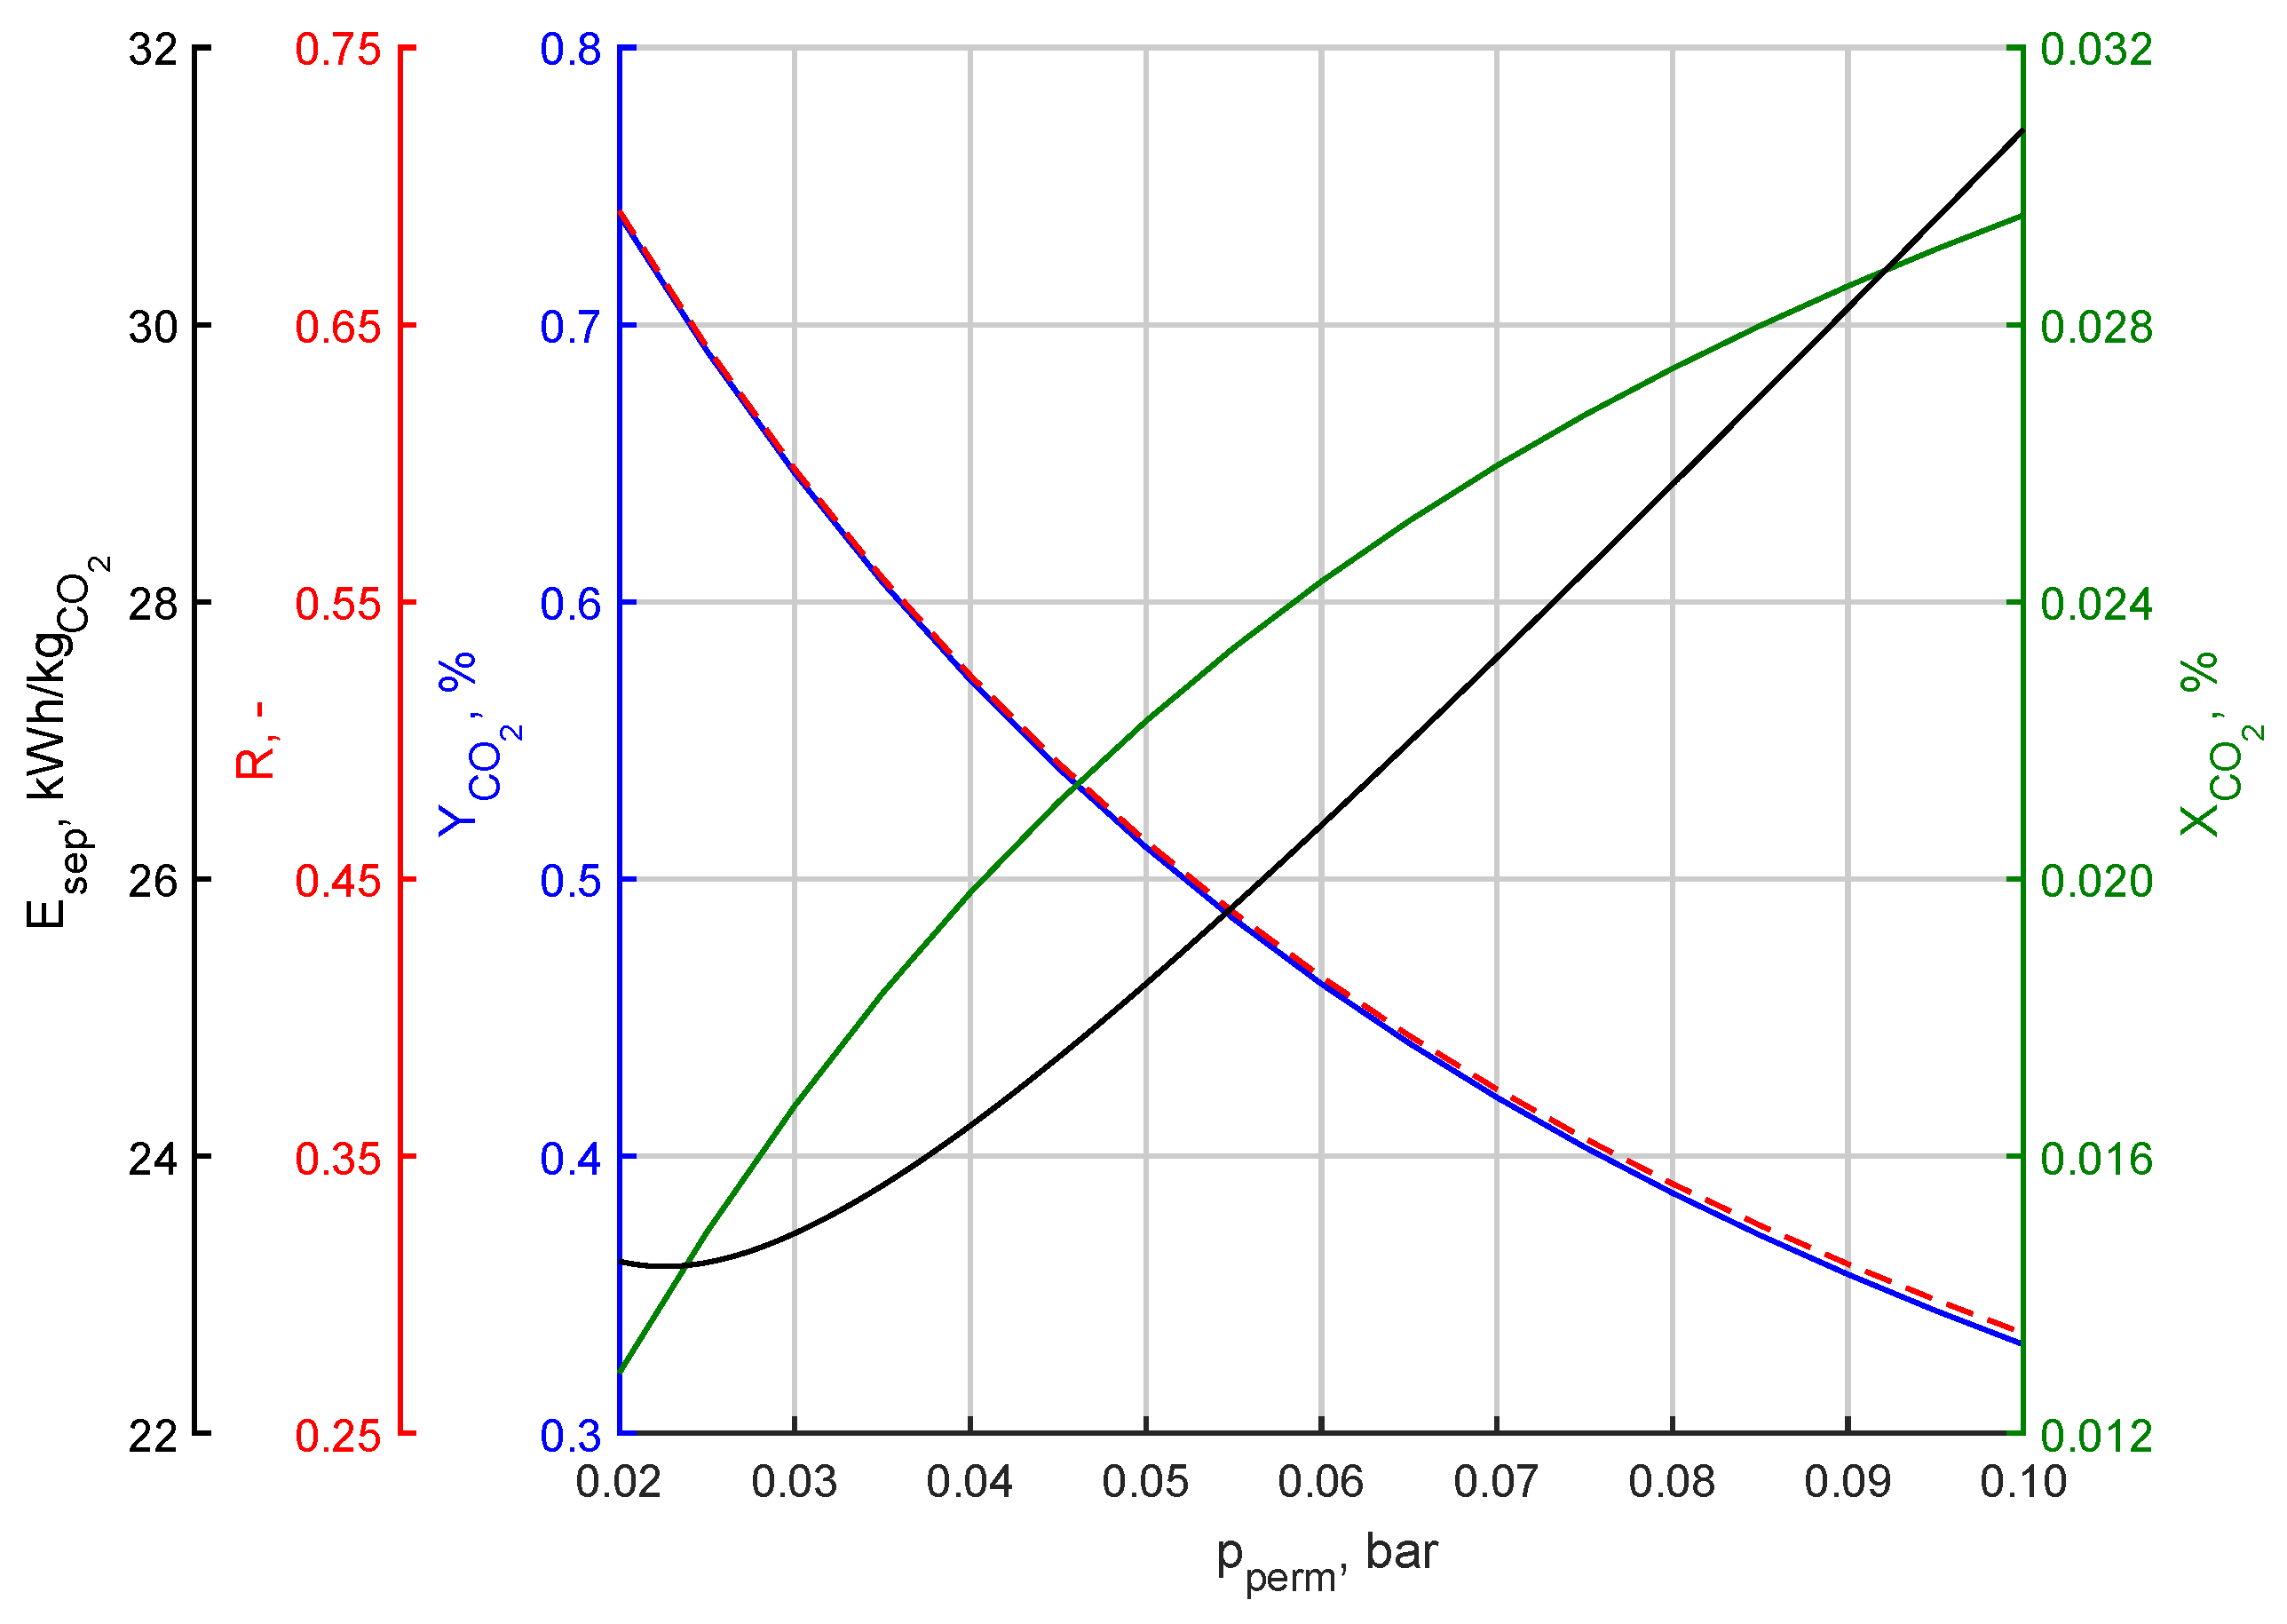
3.1. Effect of Changing Permeate Pressure

In the first stage of calculations, the influence of permeate pressure change on the basic characteristics of the membrane separation unit was determined. Parameters such as the carbon dioxide content in the permeate ( Y C O 2 ) and retentate ( X C O 2 ) , recovery rate ( R ) , and energy intensity ( E s e p ) were presented as functions of p p e r m for the reference membrane with a selectivity of α C O 2 / N 2 = 70 and permeability of P C O 2 = 108 m 3 ( S T P ) ( m 2 · h · b a r ) . The membrane surface area was assumed to be A = 50   m 2 for the calculations. The graphical interpretation of the results for the permeate pressure range of 0.02 bar to 0.1 bar is shown in Figure 3. Changes in pressure were made with a step of 0.01 bar. With an increase in permeate pressure, a decrease in both the recovery rate and the percentage of CO2 in the permeate can be observed. The greater the pressure difference between the feed stream and the permeate, the more efficient the separation process. By increasing the permeate pressure, we decrease the pressure difference in the system, resulting in a smaller amount of captured CO2. Consequently, the carbon dioxide content in the retentate increases. Due to the inefficiency of the process, even with a reduction in the power consumption of the vacuum pump, there is a noticeable increase in energy consumption expressed in kWh per kg of separated CO2. Therefore, maximizing the pressure difference is beneficial in terms of achieving the highest recovery rate and CO2 content in the permeate, and the lowest energy intensity and CO2 content in the retentate.

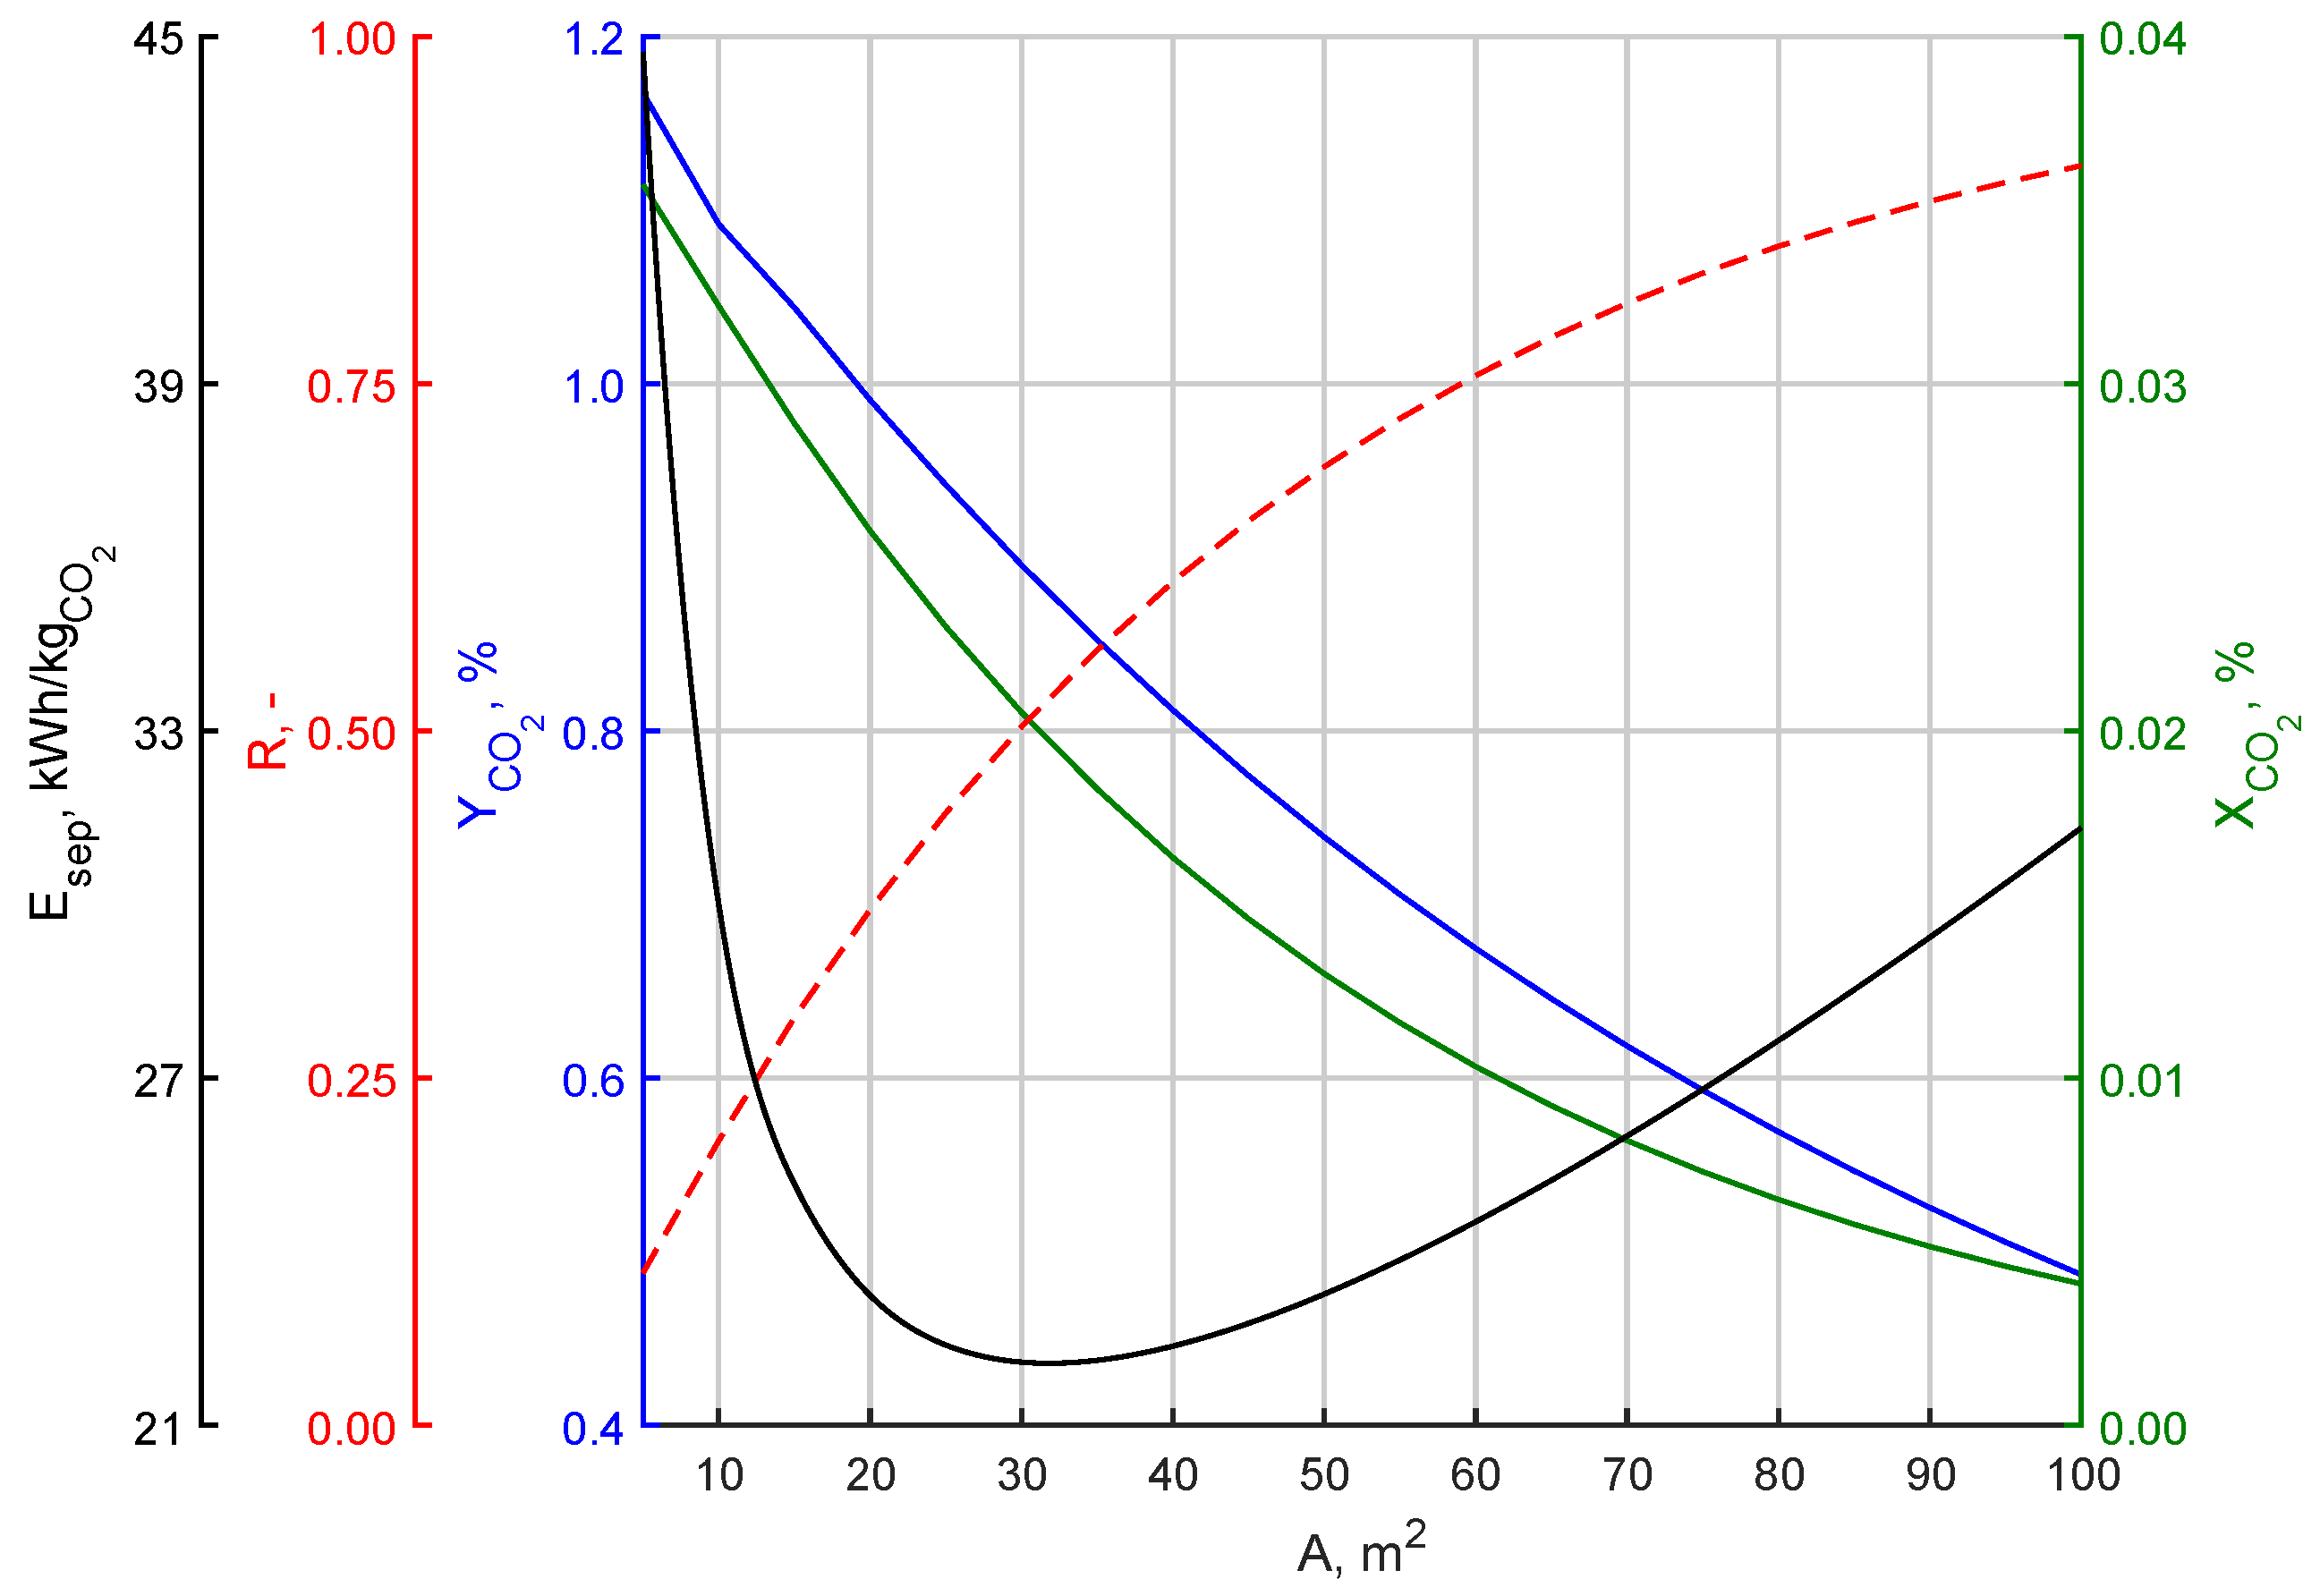
3.2. Effect of Changing the Membrane Surface

Understanding the impact of pressure changes on key system parameters, the focus was on analyzing the effect of membrane surface area. According to Equation (1), membrane surface area determines the value of the permeating flux through the membrane. It also has economic significance. For the reference membrane, based on the analysis results presented in Figure 2, the lowest permeate pressure was set to p P e r m = 0.02   b a r . The membrane surfaces were varied in the range from 5 m2 to 100 m2 with a step of 5 m2. The results are shown in Figure 4. For larger membrane surfaces, the system exhibits a high degree of carbon dioxide recovery. However, the share of CO2 in the permeate decreases, indicating that the membrane tends to allow other gas components to pass through. Selecting the optimal membrane surface area to minimize the energy intensity of the separation process can be challenging. Both too large and too small membrane surfaces lead to an increase in the energy required to separate 1 kg of carbon dioxide. Therefore, there is an optimum membrane surface area selection to minimize the energy intensity of the carbon dioxide separation process from the air. The minimization of process energy intensity can be observed in the area defined by the intersection points of the characteristics of carbon dioxide content in the permeate and retentate with the recovery degree characteristic. However, an increase in process energy intensity becomes noticeable after exceeding the intersection point of the CO2 content characteristic in the permeate. If there is a decrease in CO2 participation in the permeate along with a decrease in its participation in the retentate, it means that the membrane, although capable of separating carbon dioxide, tends to allow the passage of other gas components. As a result, the gas flow handled by the vacuum pump increases, directly impacting energy intensity in the process. Therefore, the compromise between Y C O 2 and the recovery coefficient R , represented by their intersection point on the characteristic as a function of membrane surface area, determines the optimal membrane surface area in terms of energy intensity.

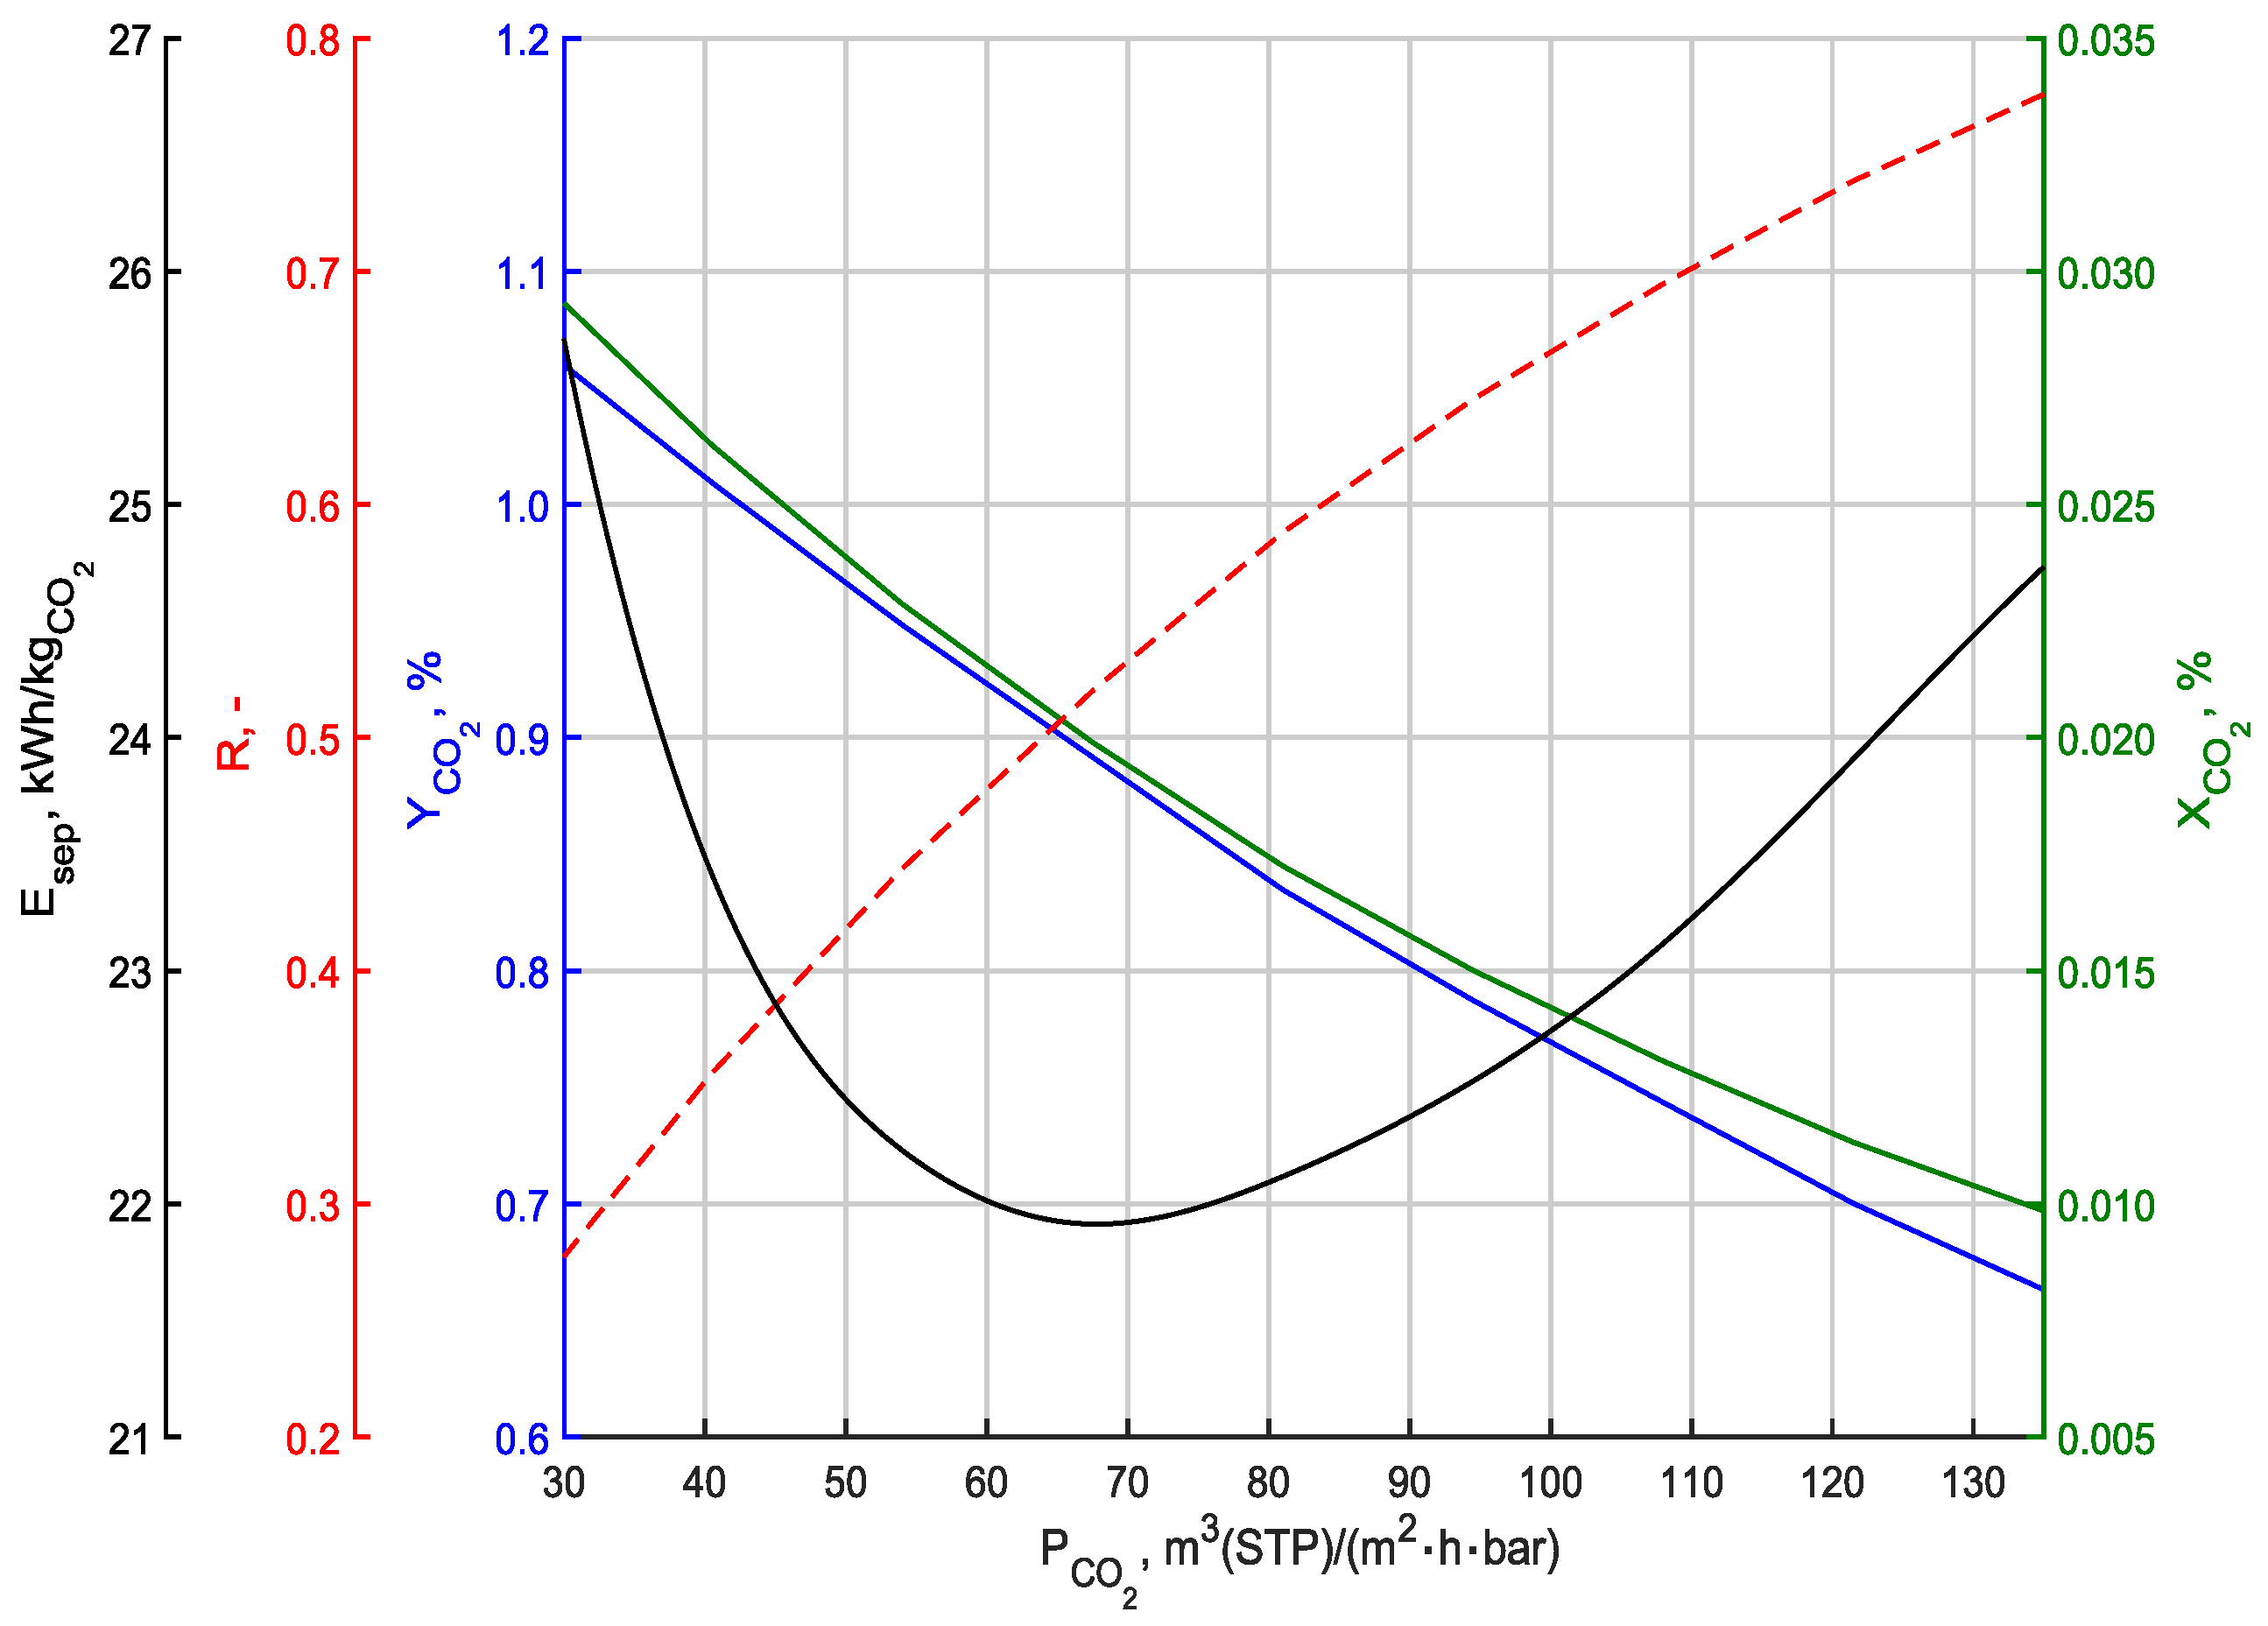
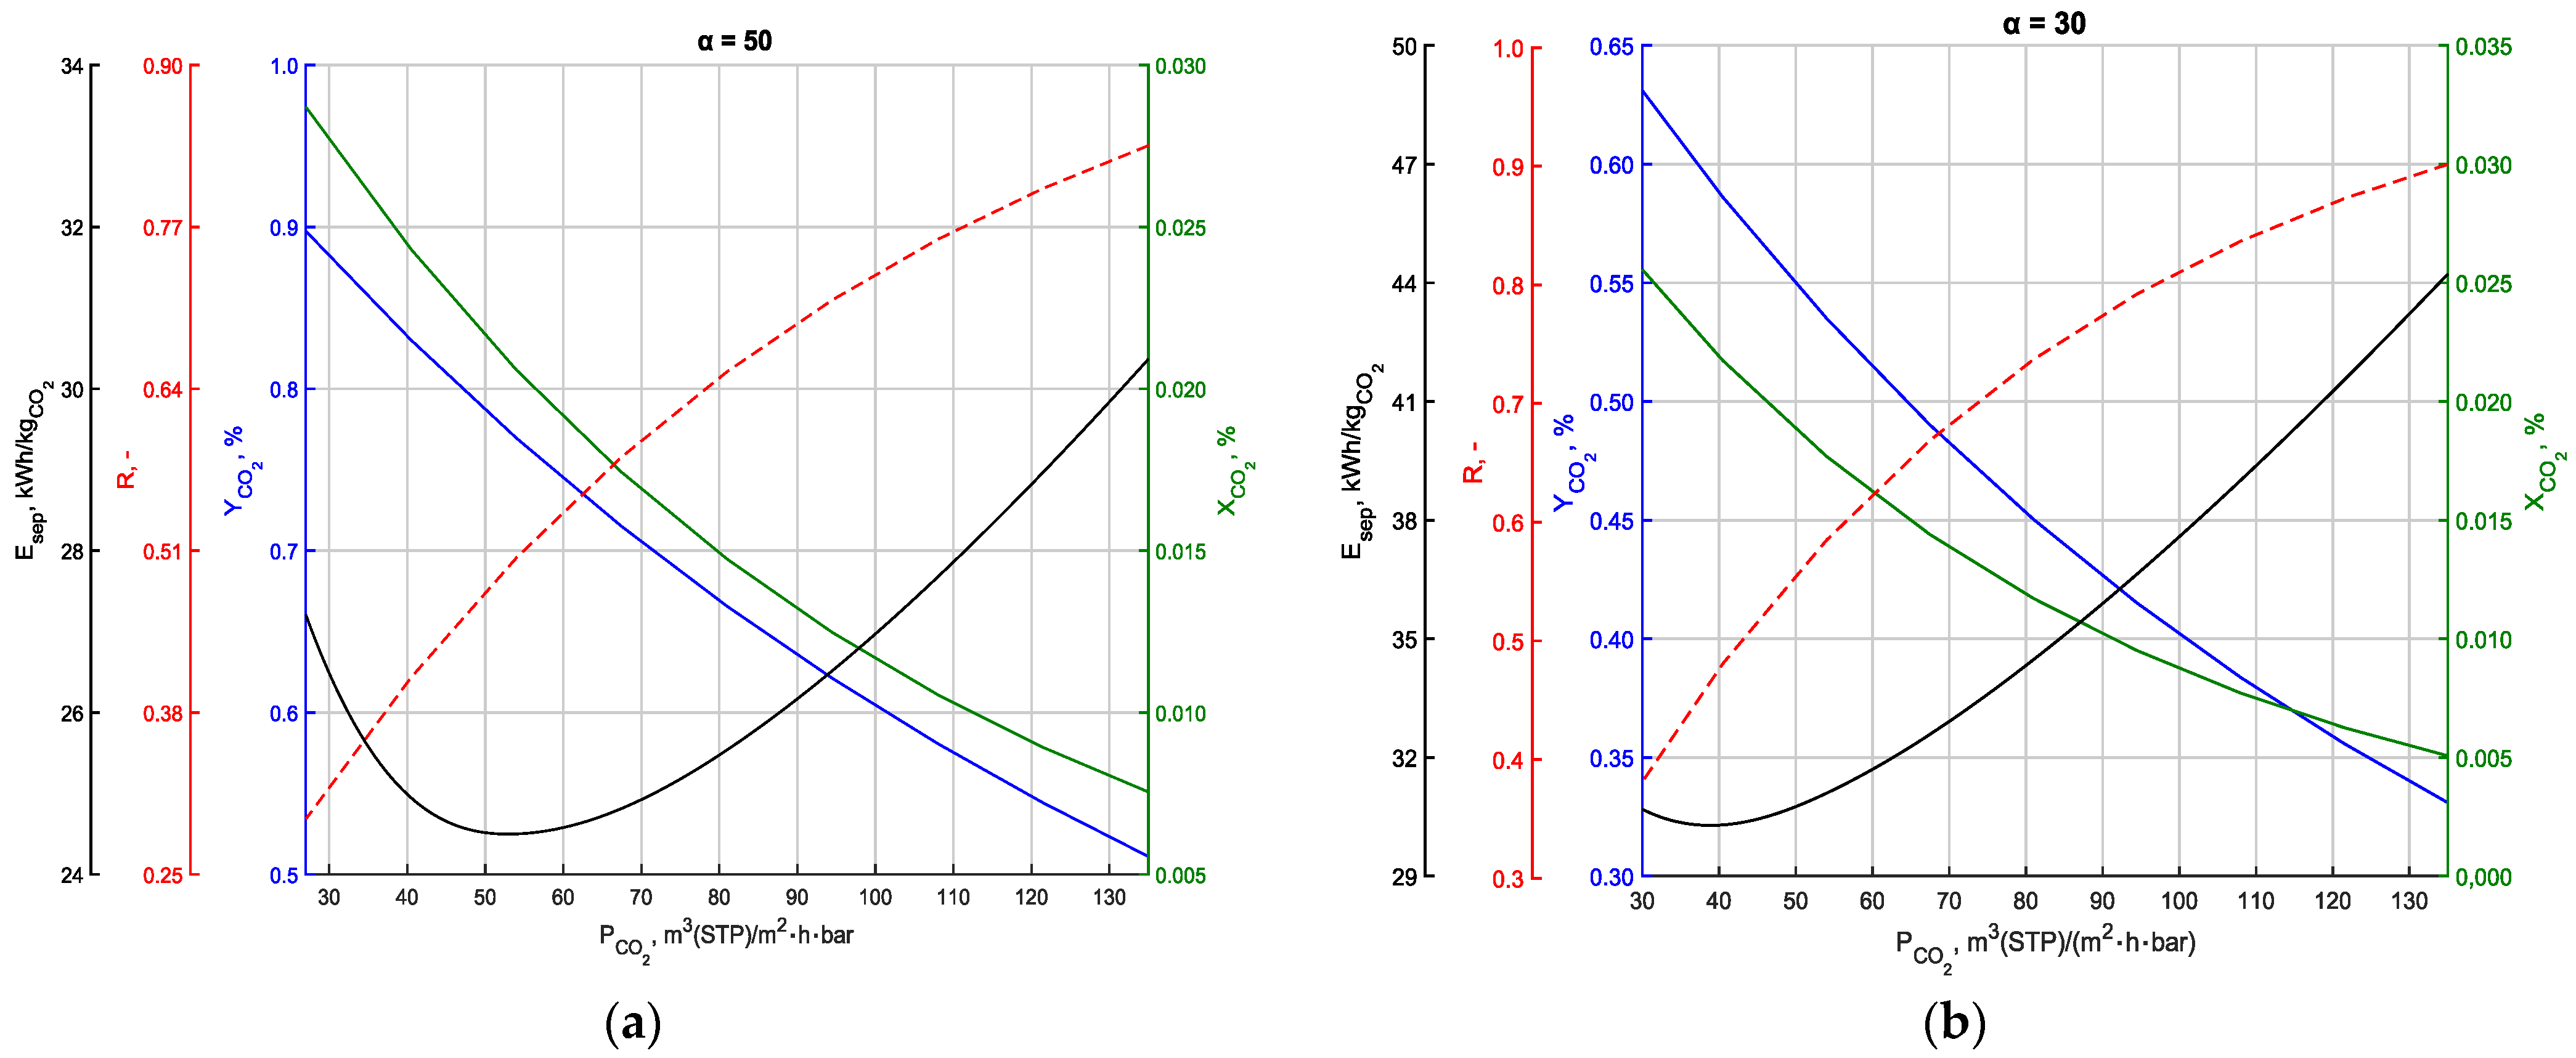
3.3. Effect of Changing the Permeability of Carbon Dioxide

The effect of changing the permeability of CO2 on the performance characteristics of the membrane separation system was also determined. The analysis was conducted for a membrane selectivity of α C O 2 / N 2 = 70 . Again, a permeate pressure of p P e r m = 0.02   b a r was applied, and the membrane surface area for calculations was assumed to be A = 50   m 2 . The results are presented in Figure 5. Table 2 shows the CO2 permeability and permeability of other gas components depending on membrane selectivity. The obtained characteristics as a function of changes in permeability are similar in trend to the characteristics obtained as a function of changes in membrane surface area. Both the CO2 content in the permeate and in the retentate decrease with increasing CO2 permeability P C O 2 across the entire analyzed range. The opposite situation occurs for the purity index of the permeate R. Higher membrane permeability allows for more CO2 to be recovered in the permeate stream. However, according to the data presented in Table 2, it also affects the increase in the permeability of other gas components, resulting in a decrease in the percentage of CO2 in the permeate. As a result, a product of low purity is obtained. In the case of energy intensity, a local minimum occurs again. Initially, the energy intensity of the process decreases, but after crossing a certain threshold, it increases with increasing CO2 permeability. Again, the critical point is the intersection of the characteristics of the CO2 content of the permeate and the recovery factor. The decrease in the carbon dioxide content of the permeate as the permeability of the membrane increases and its selectivity remains constant can be explained by Equation (4). According to this, as the permeability of CO2 increases, the permeability of the other gas components also increases, as shown in Table 2. Consequently, the gas flow operated by the vacuum pump increases again, leading to an increased energy intensity of the process.

3.4. Effect of Changing Membrane Selectivity

In the next step, the analysis focused on the impact of changing membrane selectivity on the system’s performance characteristics. For this purpose, calculations similar to those presented in Figure 5 were repeated for selectivities of α C O 2 / N 2 = 50 and 30. The results are shown in Figure 6. With a change in membrane selectivity, its ability to permeate other gas components also changes, according to Table 2. Comparing Figure 5 and Figure 6, it can be observed that reducing membrane selectivity results in a decrease in the proportion of CO2 in both the permeate and retentate, while the recovery rate increases. A membrane with higher selectivity thus ensures a better concentration of carbon dioxide in the permeate, but this leads to a greater loss of the separated gas component in the retentate stream. For example, considering a membrane with α C O 2 / N 2 = 70 and a permeability of P C O 2 = 108 m 3 ( S T P ) ( m 2 · h · b a r ) , the CO2 content in the permeate is 0.74%. However, for α = 50 and 30, it is 0.58% and 0.38%, respectively. Consequently, a multi-stage membrane DAC system based on membranes with lower selectivity will require more separation stages to obtain a permeate with high final purity. Therefore, the use of low-selectivity membranes is inappropriate, consistent with the results presented in other studies [42,46]. Comparing the recovery rate, it is 69.5% for α C O 2 / N 2 = 70 , and 76.0% and 83.5% for α C O 2 / N 2 = 50 and 30, respectively. With decreasing membrane selectivity, the energy intensity of the process also significantly increases. For example, considering a membrane with a permeability P C O 2 = 108 m 3 ( S T P ) ( m 2 · h · b a r ) , the energy intensity of the process was 23.12 k W h / k g C O 2 27.68 k W h / k g C O 2 , and 39.01 k W h / k g C O 2 for α C O 2 / N 2 = 70, 50, and 30, respectively. In the case of a membrane with α C O 2 / N 2 = 30, unlike the other variants, a local minimum occurs for the lowest values of the analyzed carbon dioxide permeabilities.

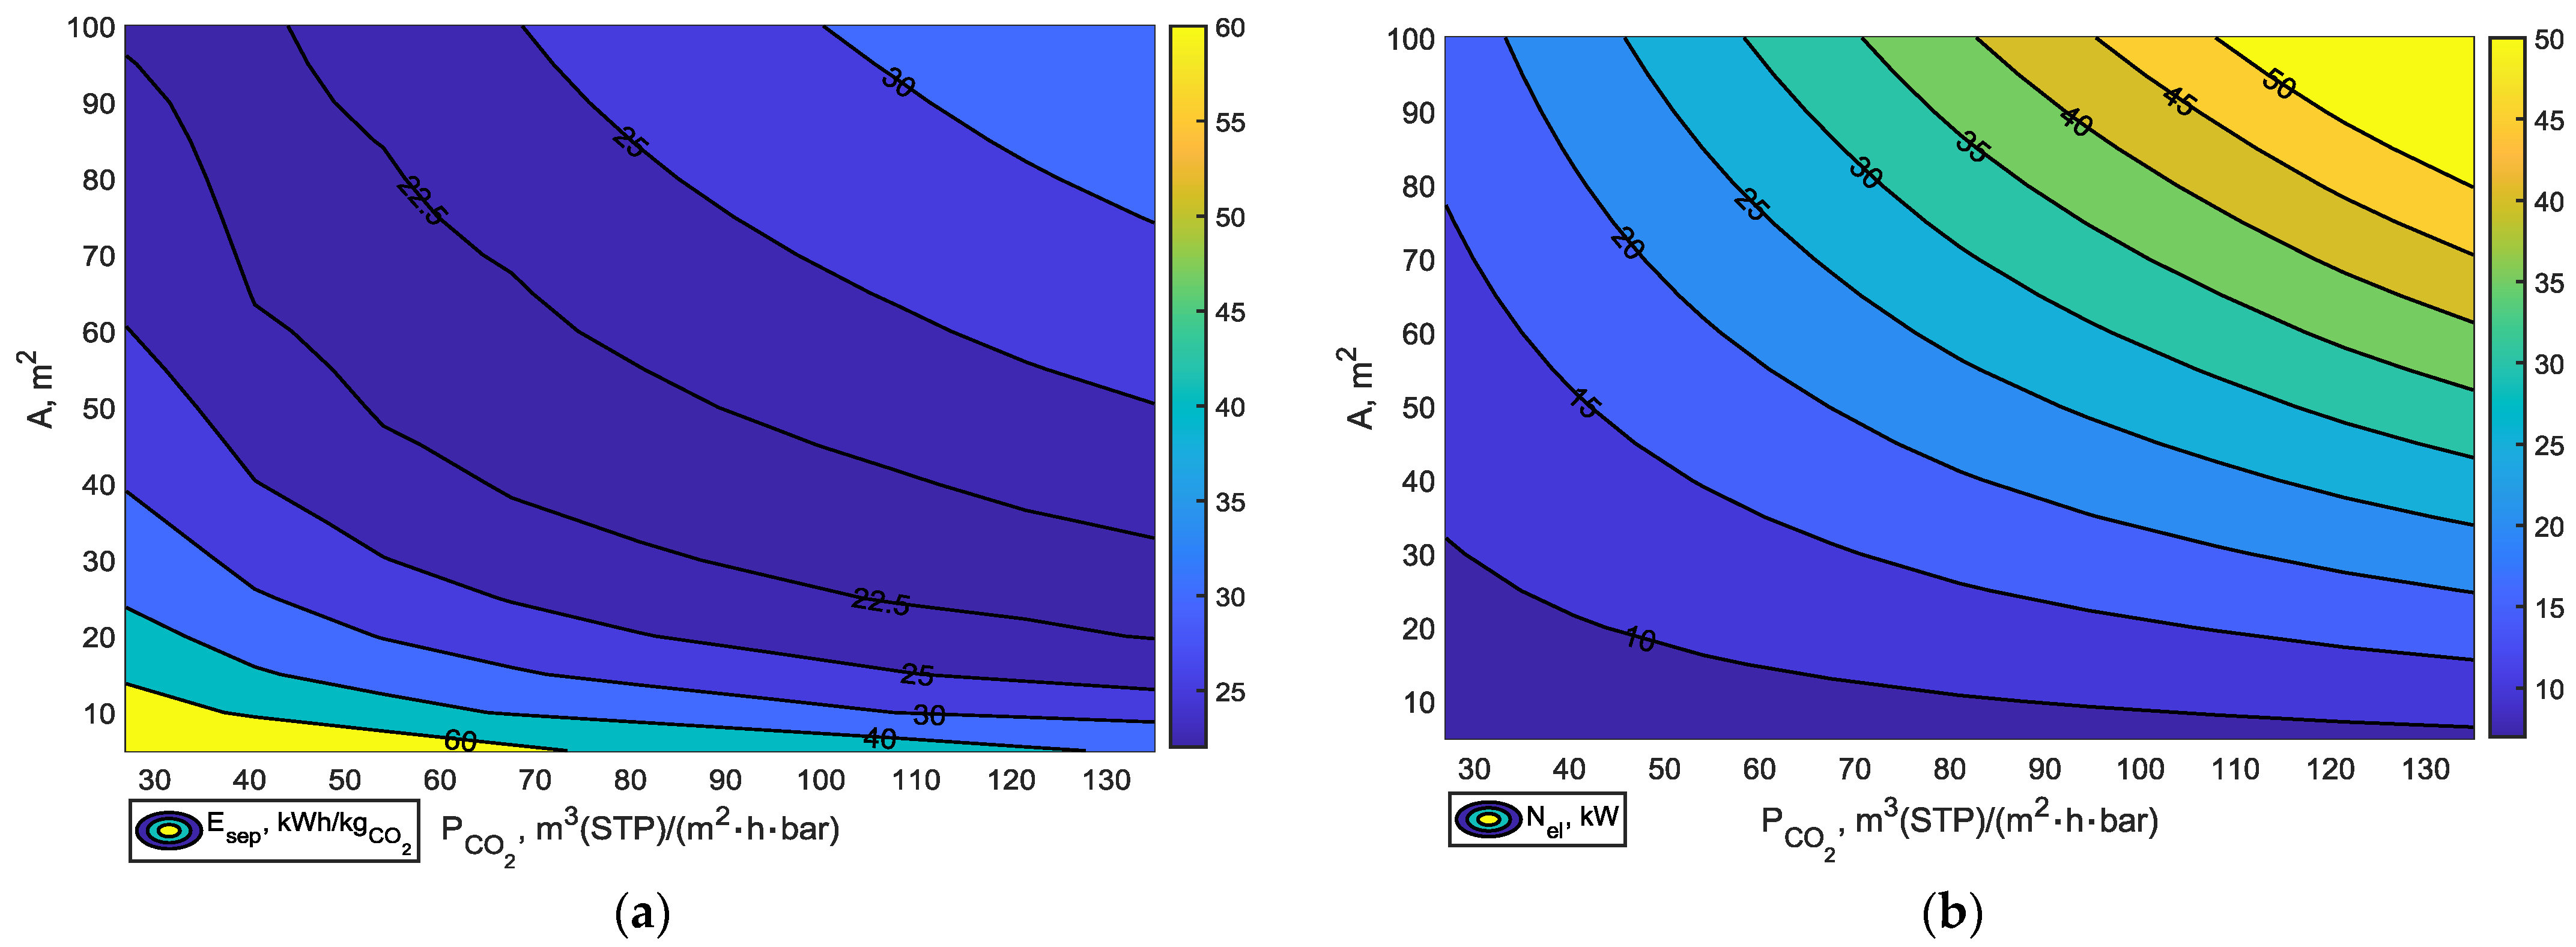
3.5. Energy Intensity of the Process

Selecting the appropriate membrane and process parameters is highly challenging. A membrane separation process should be characterized by the highest possible content of the desired gas indicator in the permeate and the highest possible recovery rate. From an energy perspective, the process should also exhibit minimal energy intensity while ensuring the highest possible values of the aforementioned parameters. As mentioned earlier, the driving force of the membrane separation process is the pressure difference across the membrane. Ensuring a greater pressure difference between the feed and the permeate, despite the increased power demand of vacuum pumps, does not necessarily result in increased energy consumption of the process in terms of energy used to separate 1 kg of carbon dioxide, as shown in Figure 3. Properly selected pressure values will affect the efficiency of the separation process by increasing the amount of separated gas component, directly influencing the defined energy intensity expressed in k W h / k g C O 2 . To better illustrate the problem, Figure 7a shows the power consumption of flow machines in a single-stage membrane separation process as a function of carbon dioxide permeability for a membrane with parameters A = 50   m 2 and α C O 2 / N 2 = 70 . Calculations were performed for various permeate pressures. Figure 7b, on the other hand, shows the energy intensity of the process. The power of the vacuum pump increases with the increasing permeability of CO2 throughout the analyzed range. This is because, with increasing CO2 permeability, the permeate flow increases, and thus the flow that the vacuum pump must handle also increases. Due to the constant flow of intake air, the power of the pre-fan remains constant. Comparing both analyses, it is also clear that a greater pressure difference between the feed and the permeate (thus a lower permeate pressure) translates into lower energy intensity of the process of separating 1 kg of carbon dioxide. Only in the case of membranes with high permeability of the separated gas does the energy intensity of the process for a pressure of 0.02 bar clearly increase, reaching a level corresponding to a pressure of 0.04 bar. Table S1 in the Supplementary Materials contains trend line equations and the coefficient of determination (R2) for the data presented in Figure 4, Figure 5, Figure 6 and Figure 7.
The above calculations have allowed an understanding of the key dependencies in the single-stage membrane separation system. The problem is to select the appropriate membrane area and permeability to reduce the energy intensity of the process. In order to optimize the system for the energy intensity of capture, the relationship of the constant lines of energy intensity values on the plane of membrane area and permeability will be particularly helpful. These are illustrated in Figure 8a. Additionally, Figure 8b includes similar relationships for power demand. These criteria can be especially useful in modeling multi-stage systems because the first stage of separation significantly influences the outcomes. Due to the highest feed flow rate and low concentration of CO2 in the first separation stage, it is characterized by the highest electricity demand and energy intensity in k W h / k g C O 2 . According to Figure 8a, the lowest energy intensity of the process can be achieved by appropriately selecting the membrane surface area and its CO2 permeability. The area between the contour lines of 22.5 k W h / k g C O 2 corresponds to the minimum energy intensity of the process. According to the contour lines on the graph, for lower values of permeability, to limit the energy intensity of capture, a membrane with a larger surface area should be used. As the permeability of the separated gas increases, the required membrane surface area decreases to minimize the energy intensity of the process. In the case of the electrical power demand of the flow machine, it is lowest for contour lines < 10 kW. Increasing the permeability of the separated gas narrows the range of applicable surface areas for this region.
The results show a similar range of process energy intensity to the work of Fujikawa et al. [42] where membranes with similar permeability and selectivity were analyzed. Additionally, they reveal higher process energy intensity compared to conventionally used sorption methods. As mentioned in the theoretical introduction, the range of energy intensity for conventional methods varies from 6.5 to 10 G J / k g C O 2 , depending on the type of sorbent used [15]. The analyses conducted showed that the lowest energy intensity of the process is 22.5 k W h / k g C O 2 . This value corresponds to 81 G J / k g C O 2 . However, a study by Castel et al. [46] showed that the use of ultra-selective experimental membranes can significantly reduce the energy intensity to a level comparable to sorption units. In addition to the use of membranes with better separation properties, the energy consumption of the process can be reduced by the proper optimization of the flow equipment. As the total compression ratio, the temperature of the compressed gas increases, which directly increases the energy consumption of the vacuum pump and pre-fan. Therefore, the use of intercooling for the vacuum pump can significantly reduce the energy consumption of the process.

4. Conclusions

The selection of appropriate process parameters and membrane properties for direct carbon capture is highly challenging. This is mainly due to the relatively low concentration of CO2 in ambient air. Consequently, the membrane should exhibit a high selectivity for the separated gas, as emphasized by various authors and a relationship also demonstrated in this study. For membranes with the highest selectivity, the highest CO2 content in the permeate and the lowest process energy intensity were achieved. However, a drawback is the reduction in the recovery rate R compared to membranes with lower selectivity. Another crucial aspect is the selection of an appropriate pressure difference between the feed and permeate sides. Increasing this pressure difference by reducing the permeate pressure across the entire range analyzed resulted in improvements in all studied performance characteristics. Even with a significant increase in the electrical power demand of flow machine drive systems, increasing the pressure difference led to a decrease in process energy consumption expressed in k W h / k g C O 2 . Only for membranes with the highest analyzed permeability did the process energy intensity significantly increase for the highest pressure differences. It was also demonstrated that both changes in membrane surface area and CO2 permeability shape the system’s performance characteristics in a similar manner. With the increase in these parameters, the CO2 content in both the permeate and retentate decreases, while the recovery rate increases.
Several studies in the literature have highlighted the role of developing high-permeability carbon dioxide membranes to advance the concept of membrane-based direct air capture units. However, from the point of view of the energy intensity of the process, this aspect turns out to be a complex issue due to the presence of a local minimum in the obtained characteristics both as a function of permeability and membrane area. The analyses showed that the increase in CO2 permeability can contribute to the energy intensity of the process. Therefore, constant lines of process energy intensity values on the membrane surface area and permeability plane were proposed as a convenient tool for optimizing the system’s energy intensity. This is particularly important because, in the case of multi-stage systems, the first separation stage, due to the high feed flow rate with low CO2 concentration, will largely determine the total process energy intensity. The energy intensity of a membrane plant is high compared to the sorption methods used. However, because there is a gap in the literature regarding the effect of changing individual parameters on the energy intensity of the process, the research presented here focuses on identifying the most important relationships between them, leaving aside the aspect of optimizing the system for the operation of, for example, flow machines. The appropriate optimization of vacuum pump operation by using, for example, inter-cooling can significantly reduce the energy intensity of the process and will be the subject of future studies. In addition, based on the results obtained, future calculations will be based on highly selective membranes to analyze their impact on the energy intensity of the process.
Additionally, the study showed the possibility of achieving a CO2 content below 280 ppm without CO2 recovery in the retentate. This could be crucial in efforts to reduce the concentration of CO2 in ambient air and restore it to pre-industrial levels. A significant portion of the analysis was conducted for membranes with properties reported only experimentally. The implementation of membrane separation within direct air capture processes remains dependent on progress in the field of membranes with high separation capabilities. The identified relationships between the various parameters, especially in the context of process energy intensity, will be used in future studies of multi-stage membrane separation systems. The article did not present an analysis of changes in membrane surface areas for different permeate pressures, which could be the subject of future research. Membranes with larger surface areas can separate a greater amount of the desired gas. However, membranes with larger surface areas also have a greater ability to permeate other gas components, directly influencing the resulting CO2 content in the permeate, recovery rate, and energy consumption in the process. As demonstrated in the study, the pressure difference between the feed and permeate is one of the key parameters of membrane separation process efficiency. In addition, analyses are planned on the practical feasibility and economic viability of implementing membrane-based direct air capture systems on a larger scale.

Supplementary Materials

The following supporting information can be downloaded at: https://www.mdpi.com/article/10.3390/en17092046/s1, Table S1: Trend line equations and coefficient of determination R2 for the characteristics shown in Figure 4, Figure 5, Figure 6 and Figure 7.

Author Contributions

Conceptualization, K.N. and J.K.; methodology, K.N. and J.K.; software, K.N. and O.B.; validation, K.N. and J.K.; formal analysis, K.N.; investigation, K.N.; data curation, K.N. and O.B.; writing—original draft preparation, K.N. and I.M.; writing—review and editing, K.N. and I.M.; visualization, K.N. and O.B.; supervision, J.K.; project administration, J.K.; funding acquisition, I.M. All authors have read and agreed to the published version of the manuscript.

Funding

Research work funded by the statutory research of the Silesian University of Technology.

Data Availability Statement

All data is contained within the article.

Conflicts of Interest

The authors declare no conflicts of interest. The funders had no role in the design of the study; in the collection, analyses, or interpretation of data; in the writing of the manuscript; or in the decision to publish the results.

References

  1. The Atmosphere: Getting a Handle on Carbon Dioxide. Available online: https://science.nasa.gov/earth/climate-change/greenhouse-gases/the-atmosphere-getting-a-handle-on-carbon-dioxide/ (accessed on 26 March 2024).
  2. Ritchie, H.; Rosado, P.; Roser, M. Emissions by Sector: Where Do Greenhouse Gases Come From? Available online: https://ourworldindata.org/emissions-by-sector (accessed on 21 March 2024).
  3. Warmuzinski, K. Harnessing Methane Emissions from Coal Mining. Process Saf. Environ. Prot. 2008, 86, 315–320. [Google Scholar] [CrossRef]
  4. McKinsey. Climate Risk and Decarbonization: What Every Mining CEO Needs to Know. Available online: https://www.mckinsey.com/capabilities/sustainability/our-insights/climate-risk-and-decarbonization-what-every-mining-ceo-needs-to-know (accessed on 23 April 2024).
  5. Azadi, M.; Northey, S.A.; Ali, S.H.; Edraki, M. Transparency on Greenhouse Gas Emissions from Mining to Enable Climate Change Mitigation. Nat. Geosci. 2020, 13, 100–104. [Google Scholar] [CrossRef]
  6. Sanz-Pérez, E.S.; Murdock, C.R.; Didas, S.A.; Jones, C.W. Direct Capture of CO2 from Ambient Air. Chem. Rev. 2016, 116, 11840–11876. [Google Scholar] [CrossRef]
  7. IEA. CO2 Emissions in 2023. 2024. Available online: https://www.iea.org/reports/co2-emissions-in-2023 (accessed on 21 March 2024).
  8. National Oceanic and Atmospheric Administration. Carbon Dioxide Now More than 50% Higher than Pre-Industrial Levels. Available online: https://www.noaa.gov/news-release/carbon-dioxide-now-more-than-50-higher-than-pre-industrial-levels (accessed on 24 March 2024).
  9. Enerdata. CO2 Emissions 2050 Forecast: World Trends from Fuel Combustion. Available online: https://eneroutlook.enerdata.net/forecast-co2-emissions-data-from-fuel-combustion.html (accessed on 23 April 2024).
  10. Duffour, G. Bchin Q Enerdata—Global Energy Trends—2023 Edition. A Troubled, Yet Promising Year for Energy Transition? 2022. Available online: https://www.enerdata.net/publications/reports-presentations/world-energy-trends.html (accessed on 1 April 2024).
  11. Greig, C.; Uden, S. The Value of CCUS in Transitions to Net-Zero Emissions. Electr. J. 2021, 34, 107004. [Google Scholar] [CrossRef]
  12. Gasser, T.; Guivarch, C.; Tachiiri, K.; Jones, C.D.; Ciais, P. Negative Emissions Physically Needed to Keep Global Warming below 2 °C. Nat. Commun. 2015, 6, 7958. [Google Scholar] [CrossRef]
  13. Fuss, S.; Canadell, J.G.; Peters, G.P.; Tavoni, M.; Andrew, R.M.; Ciais, P.; Jackson, R.B.; Jones, C.D.; Kraxner, F.; Nakicenovic, N.; et al. Betting on Negative Emissions. Nat. Clim. Chang. 2014, 4, 850–853. [Google Scholar] [CrossRef]
  14. Desport, L.; Selosse, S. Perspectives of CO2 Utilization as a Negative Emission Technology. Sustain. Energy Technol. Assess. 2022, 53, 102623. [Google Scholar] [CrossRef]
  15. IEA. Direct Air Capture—Energy System. Available online: https://www.iea.org/energy-system/carbon-capture-utilisation-and-storage/direct-air-capture (accessed on 25 March 2024).
  16. Okonkwo, E.C.; AlNouss, A.; Shahbaz, M.; Al-Ansari, T. Developing Integrated Direct Air Capture and Bioenergy with Carbon Capture and Storage Systems: Progress towards 2 °C and 1.5 °C Climate Goals. Energy Convers. Manag. 2023, 296, 117687. [Google Scholar] [CrossRef]
  17. IEA. Direct Air Capture. 2022. Available online: https://www.iea.org/reports/direct-air-capture-2022 (accessed on 25 March 2024).
  18. Bouaboula, H.; Chaouki, J.; Belmabkhout, Y.; Zaabout, A. Comparative Review of Direct Air Capture Technologies: From Technical, Commercial, Economic, and Environmental Aspects. Chem. Eng. J. 2024, 484, 149411. [Google Scholar] [CrossRef]
  19. Quang, D.V.; Milani, D.; Abu Zahra, M. A Review of Potential Routes to Zero and Negative Emission Technologies via the Integration of Renewable Energies with CO2 Capture Processes. Int. J. Greenh. Gas Control 2023, 124, 103862. [Google Scholar] [CrossRef]
  20. Mostafa, M.; Antonicelli, C.; Varela, C.; Barletta, D.; Zondervan, E. Capturing CO2 from the Atmosphere: Design and Analysis of a Large-Scale DAC Facility. Carbon Capture Sci. Technol. 2022, 4, 100060. [Google Scholar] [CrossRef]
  21. Drechsler, C.; Agar, D.W. Characteristics of DAC Operation within Integrated PtG Concepts. Int. J. Greenh. Gas Control 2021, 105, 103230. [Google Scholar] [CrossRef]
  22. Daggash, H.A.; Patzschke, C.F.; Heuberger, C.F.; Zhu, L.; Hellgardt, K.; Fennell, P.S.; Bhave, A.N.; Bardow, A.; MacDowell, N. Closing the Carbon Cycle to Maximise Climate Change Mitigation: Power-to-Methanol vs. Power-to-Direct Air Capture. Sustain. Energy Fuels 2018, 2, 1153–1169. [Google Scholar] [CrossRef]
  23. Motlaghzadeh, K.; Schweizer, V.; Craik, N.; Moreno-Cruz, J. Key Uncertainties behind Global Projections of Direct Air Capture Deployment. Appl. Energy 2023, 348, 121485. [Google Scholar] [CrossRef]
  24. Joppa, L.; Luers, A.; Willmott, E.; Friedmann, S.J.; Hamburg, S.P.; Broze, R. Microsoft’s Million-Tonne CO2-Removal Purchase—Lessons for Net Zero. Nature 2021, 597, 629–632. [Google Scholar] [CrossRef]
  25. The Verge. Microsoft Inks Another Deal to Capture and Store Its Carbon Emissions Underground. Available online: https://www.theverge.com/2023/3/22/23651587/microsoft-climate-tech-startup-carboncapture-wyoming (accessed on 25 March 2024).
  26. The New York Times. Heirloom Opens First U.S. Direct Air Capture Plant. Available online: https://www.nytimes.com/2023/11/09/climate/direct-air-capture-carbon.html (accessed on 25 March 2024).
  27. Kiani, A.; Jiang, K.; Feron, P. Techno-Economic Assessment for CO2 Capture from Air Using a Conventional Liquid-Based Absorption Process. Front. Energy Res. 2020, 8, 517915. [Google Scholar] [CrossRef]
  28. Fasihi, M.; Efimova, O.; Breyer, C. Techno-Economic Assessment of CO2 Direct Air Capture Plants. J. Clean. Prod. 2019, 224, 957–980. [Google Scholar] [CrossRef]
  29. Young, J.; McQueen, N.; Charalambous, C.; Foteinis, S.; Hawrot, O.; Ojeda, M.; Pilorgé, H.; Andresen, J.; Psarras, P.; Renforth, P.; et al. The Cost of Direct Air Capture and Storage Can Be Reduced via Strategic Deployment but Is Unlikely to Fall below Stated Cost Targets. One Earth 2023, 6, 899–917. [Google Scholar] [CrossRef]
  30. Kulkarni, A.R.; Sholl, D.S. Analysis of Equilibrium-Based TSA Processes for Direct Capture of CO2 from Air. Ind. Eng. Chem. Res. 2012, 51, 8631–8645. [Google Scholar] [CrossRef]
  31. Broehm, M.; Strefler, J.; Bauer, N. Techno-Economic Review of Direct Air Capture Systems for Large Scale Mitigation of Atmospheric CO2. SSRN Electron. J. 2015. [Google Scholar] [CrossRef]
  32. Realmonte, G.; Drouet, L.; Gambhir, A.; Glynn, J.; Hawkes, A.; Köberle, A.C.; Tavoni, M. An Inter-Model Assessment of the Role of Direct Air Capture in Deep Mitigation Pathways. Nat. Commun. 2019, 10, 3277. [Google Scholar] [CrossRef]
  33. Kárászová, M.; Zach, B.; Petrusová, Z.; Červenka, V.; Bobák, M.; Šyc, M.; Izák, P. Post-Combustion Carbon Capture by Membrane Separation, Review. Sep. Purif. Technol. 2020, 238, 116448. [Google Scholar] [CrossRef]
  34. Kotowicz, J.; Janusz-Szymańska, K.; Wiciak, G. Technologie Membranowe Wychwytu Dwutlenku Węgla Ze Spalin Dla Nadkrytycznego Bloku Węglowego; Wydawnictwo Politechniki Śląskiej: Gliwice, Poland, 2015. [Google Scholar]
  35. Kotowicz, J.; Chmielniak, T.; Janusz-Szymańska, K. The Influence of Membrane CO2 Separation on the Efficiency of a Coal-Fired Power Plant. Energy 2010, 35, 841–850. [Google Scholar] [CrossRef]
  36. Wu, H.; Li, Q.; Guo, B.; Sheng, M.; Wang, D.; Mao, S.; Ye, N.; Qiao, Z.; Kang, G.; Cao, Y.; et al. Industrial-Scale Spiral-Wound Facilitated Transport Membrane Modules for Post-Combustion CO2 Capture: Development, Investigation and Optimization. J. Membr. Sci. 2023, 670, 121368. [Google Scholar] [CrossRef]
  37. Gkotsis, P.; Peleka, E.; Zouboulis, A. Membrane-Based Technologies for Post-Combustion CO2 Capture from Flue Gases: Recent Progress in Commonly Employed Membrane Materials. Membranes 2023, 13, 898. [Google Scholar] [CrossRef]
  38. Carapellucci, R.; Giordano, L.; Vaccarelli, M. Study of a Natural Gas Combined Cycle with Multi-Stage Membrane Systems for CO2 Post-Combustion Capture. Energy Procedia 2015, 81, 412–421. [Google Scholar] [CrossRef]
  39. Merkel, T.C.; Lin, H.; Wei, X.; Baker, R. Power Plant Post-Combustion Carbon Dioxide Capture: An Opportunity for Membranes. J. Membr. Sci. 2010, 359, 126–139. [Google Scholar] [CrossRef]
  40. Castro-Muñoz, R.; Zamidi Ahmad, M.; Malankowska, M.; Coronas, J. A New Relevant Membrane Application: CO2 Direct Air Capture (DAC). Chem. Eng. J. 2022, 446, 137047. [Google Scholar] [CrossRef]
  41. Fujikawa, S.; Selyanchyn, R. Direct Air Capture by Membranes. MRS Bull. 2022, 47, 416–423. [Google Scholar] [CrossRef]
  42. Fujikawa, S.; Selyanchyn, R.; Kunitake, T. A New Strategy for Membrane-Based Direct Air Capture. Polym. J. 2020, 53, 111–119. [Google Scholar] [CrossRef]
  43. Fujikawa, S.; Ariyoshi, M.; Selyanchyn, R.; Kunitake, T. Ultra-Fast, Selective CO2 Permeation by Free-Standing Siloxane Nanomembranes. Chem. Lett. 2019, 48, 1351–1354. [Google Scholar] [CrossRef]
  44. Yoo, M.J.; Kim, K.H.; Lee, J.H.; Kim, T.W.; Chung, C.W.; Cho, Y.H.; Park, H.B. Ultrathin Gutter Layer for High-Performance Thin-Film Composite Membranes for CO2 Separation. J. Membr. Sci. 2018, 566, 336–345. [Google Scholar] [CrossRef]
  45. Bandehali, S.; Ebadi Amooghin, A.; Sanaeepur, H.; Ahmadi, R.; Fuoco, A.; Jansen, J.C.; Shirazian, S. Polymers of Intrinsic Microporosity and Thermally Rearranged Polymer Membranes for Highly Efficient Gas Separation. Sep. Purif. Technol. 2021, 278, 119513. [Google Scholar] [CrossRef]
  46. Castel, C.; Bounaceur, R.; Favre, E. Membrane Processes for Direct Carbon Dioxide Capture from Air: Possibilities and Limitations. Front. Chem. Eng. 2021, 3, 668867. [Google Scholar] [CrossRef]
  47. Ignatusha, P.; Lin, H.; Kapuscinsky, N.; Scoles, L.; Ma, W.; Patarachao, B.; Du, N. Membrane Separation Technology in Direct Air Capture. Membranes 2024, 14, 30. [Google Scholar] [CrossRef]
  48. Selyanchyn, O.; Selyanchyn, R.; Fujikawa, S. Critical Role of the Molecular Interface in Double-Layered Pebax-1657/PDMS Nanomembranes for Highly Efficient CO2/N2 Gas Separation. ACS Appl. Mater. Interfaces 2020, 12, 33196–33209. [Google Scholar] [CrossRef]
Figure 1. Forecast of CO2 emissions by region until 2050. * CIS—Commonwealth of Independent States [9].
Energies 17 02046 g001
Figure 2. Diagram of a single-stage membrane separation for direct carbon dioxide capture from air. Vp—vacuum pump, pF—feed pressure, pPerm—permeate pressure, and x—membrane thickness.
Energies 17 02046 g002
Figure 3. Y C O 2 , X C O 2 , R , and E s e p as a function of permeate pressure.
Energies 17 02046 g003
Figure 4. Y C O 2 , X C O 2 , R , and E s e p as a function of membrane surface area for p P e r m = 0.02   b a r .
Energies 17 02046 g004
Figure 5. Y C O 2 , X C O 2 , R , E s e p as a function of carbon dioxide permeability P C O 2 for permeate pressure p P e r m = 0.02   b a r .
Energies 17 02046 g005
Figure 6. Y C O 2 , X C O 2 , R , and E s e p as a function of carbon dioxide permeability P C O 2 for a permeate pressure of p P = 0.02   b a r : (a) with membrane selectivity α C O 2 / N 2 = 50 and (b) with membrane selectivity α C O 2 / N 2 = 30 .
Energies 17 02046 g006
Figure 7. (a) Electrical power demand in a single-stage membrane separation process as a function of CO2 permeability for various permeate pressure values. (b) Energy intensity of a single-stage membrane separation process as a function of CO2 permeability for various permeate pressure values.
Energies 17 02046 g007
Figure 8. (a) The dependence of the line constants of the values of the energy intensity of the separation process on the plane of the area and CO2 permeability of the A P C O 2 membrane. (b) The dependence of the line constants of the value of the consumed electric driving power of the flow machines on the plane of the surface area and CO2 permeability of the membrane A P C O 2 .
Energies 17 02046 g008
Table 1. Computational assumptions for modelling direct carbon dioxide capture from air in a single-stage membrane separation system.
ParameterSymbolValueUnit
Composition of ambient air:- %
-N278.08
-O220.95
-Ar0.93
-CO20.04
Molar flux of the feed n F 100kmol/h
Atmospheric pressure p a t m 1.01bar
Feed pressure p F 1.10bar
Air temperature T P o w 298.15K
Isentropic efficiency of pump and fan η i s 90%
Mechanical efficiency of the pump and fan η m 99%
Membrane selectivity α C O 2 / N 2 70-
CO2 permeability P C O 2 108 m 3   ( S T P ) ( m 2 · h · b a r )
Membrane surface A 50m2
Table 2. The permeability of carbon dioxide and the permeability of other gas components for different values of membrane selectivity.
P C O 2 P C O 2 L(x)
α C O 2 / N 2
705030
GPU m 3 ( S T P ) ( m 2 · h · b a r ) m 3 ( S T P ) ( m 2 · h · b a r )
50,000135.01.932.704.50
45,000121.51.742.434.05
40,000108.01.542.163.60
35,00094.51.351.893.15
30,00081.01.161.622.70
25,00067.50.961.352.25
20,00054.00.771.081.80
15,00040.50.580.811.35
10,00027.00.390.540.90
* Carbon dioxide permeability expressed in GPU.
Disclaimer/Publisher’s Note: The statements, opinions and data contained in all publications are solely those of the individual author(s) and contributor(s) and not of MDPI and/or the editor(s). MDPI and/or the editor(s) disclaim responsibility for any injury to people or property resulting from any ideas, methods, instructions or products referred to in the content.

