1. Introduction
Solid- and heavy-hydrocarbon feedstocks such as coal, shale, heavy petroleum residue and coal tar are a promising source of important elements including germanium, gallium, vanadium, nickel and rare earths (yttrium, scandium, silver and others) [
1,
2,
3,
4,
5]. Eigthy-four elements of the periodic system were found in solid- and heavy-hydrocarbon materials, mainly in the form of trace elements. Heavy metals contained in heavy oil and oil residues preclude the recovery of catalyst activity during the processing of heavy-hydrocarbon materials [
6].
In most cases, trace elements are present in solid- and heavy-hydrocarbon feedstocks at a level greater than or equal to that in ore feedstocks [
4]. Therefore, special attention is paid to demetallization technologies that allow such raw materials to be included in processing procedures. The analysis of literature sources showed [
6,
7] that there are various methods for the demetallization of heavy-oil raw materials (heavy oil, oil residues, tar, oil sludge, etc.); however, the accumulation of microelements into the solid phase from coal tar and coal shale has not been sufficiently investigated [
4]. It should be noted that coal tar resulting from the coking of coal contains the largest amount of valuable trace elements. Oil shales, in turn, differ from coals by comtaining from 8 to 20% of organic substances. They also contain valuable trace elements such as germanium, lanthanum, vanadium, molybdenum and others, the content of which is comparable to that in industrial ores [
4,
8,
9,
10,
11].
Our objective was to integrate rare elements from sources such as coal shale, coal tar and the high-temperature coal tar fraction into a solid product composition. The use of coal shale and the high-temperature fraction of coal tar provides high value to our research.
The demetallization by destructive conversion of a mixture of coal tar and coal shale involves processes that should provide the highest degree of conversion of the mixture and the lowest amount of non-converted residue in which the metals of the raw material are concentrated. In this regard, the development and implementation of technologies for processing the mixture create real prerequisites for the achievement of the high-inversion complex processing of the heavy fraction of coal tar and coal shale, with metals concentrated in a solid product. Using combustible coal shale in the processing of the heavy fraction of coal tar, it is possible to obtain a raw material enriched in metals.
Due to the complex composition of the mixture of coal tar heavy fraction and coal shale, detailed data on the decomposition rate of their organic components at different temperatures are required to develop efficient and selective processing methods. The investigation of the demetallization mechanism of solid-hydrocarbon feedstock, such as a mixture of coal resin fractions and coal shale, is of great interest.
The study of the demetallization process includes two main stages: the first is a thermogravimetric analysis, and the second is the creation of a kinetic model for the hydrodemetallization of coal resin and shale. We previously investigated the thermal decomposition of primary coal tar by heterogeneous catalysts using the thermogravimetric analysis method. This method allowed us to determine mass loss and kinetic parameters and to carry out the process of thermal decomposition of the resin at different heating rates [
12,
13].
The purpose of this work was to study the kinetics of thermal degradation using the thermogravimetry method and perform a kinetic analysis of the hydrodemetallization of a mixture of low-temperature coal tar and coal shale.
2. Materials and Methods
The heavy fraction of low-temperature coal tar obtained by the fractionation of low-temperature coal tar at atmospheric pressure was selected for the study.
Two mixtures containing 5% coal shale and the heavy fraction of low-temperature coal tar and 13% coal shale and the heavy fraction low-temperature coal tar were prepared. The ratio of coal tar heavy fraction to coal shale (with 5 and 13% of coal shale) was selected on the basis of literature sources [
14,
15].
The original coal shale was shredded in a shear mill, and particles smaller than 0.1 and 0.1 mm in size were screened out using a SieveShaker OBRK-SA (Cangzhou oubeiruike instrument and Equipment CO., LTD., Cangzhou, China, 2022) device and stored in polyethylene bags.
The IR spectra of the mixture of the heavy fraction of coal tar and coal shale were recorded on an FSM1201 IR-Fourier spectrometer, with the following specifications: transmission mode, range 400–4000 cm−1, resolution 8.0 cm−1, 20 scans, comparison spectrum—general, KBr beam splitter with coating based on Ge.
Thermal decomposition of the mixture was carried out using a LabsysEvoTG-DTA/DSC (Setaram, Caluire, France, 2012г) derivatograph in corrundum crucibles in the temperature range from 30 to 600 °C in an argon stream (the flow rates of the protective and purge gas were 20 and 50 mL per minute, respectively). The measurement results were processed using the OriginLab software package and the Python Anaconda3 distribution, version 3.11.15. A reference standard—CaCO3, calcium carbonate—was used to control the thermal degradation of the mixture.
The kinetics of thermal degradation of the mixture was determined by the Ozawa–Flynn–Wall, Friedman, non-parametric kinetics and Šesták–Berggren methods.
At the starting time,
α is equal to 0, and at the end of the process,
α = 1. A mathematical model of the reactions can be represented by a differential equation with the initial condition corresponding to the value of
α of reagent
A at the start of the reaction (t = 0):
The determination of kinetic parameters using the TG curve is based on the formal equation of kinetics:
where
α is the degree of completion of the process,
t is time,
T is temperature,
β is the heating rate (K/min),
f(α) is the kinetic model,
k(T) is a rate constant that depends on the temperature according to the Arrhenius equation, with the parameters
A (pre-exponential factor) and
Ea—(activation energy), and
R is the universal gas constant.
The Friedman method [
16] is the most common and frequently used isoconversion method. This method is based on the following equation [
17]:
Using Equation (2) as a basis, Friedman proposes to take the logarithm of the reaction rate dα/dt as a function of temperature at a given conversion rate. The resulting Friedman kinetic model for the n-order reaction is as follows:
The dependence of the conversion rate expressed as the dα/dt logarithm of the inverse of the temperature, 1/T, is described by a straight line, the inclination angle of which is m = Ea/R.
Mathematically, the Ozawa–Flynn–Wall method is represented as follows:
The logarithm of the ln(β) ratio depending on the inverse of the temperature, 1/T, defines a straight line with an angular coefficient m = −1.052 Ea/R.
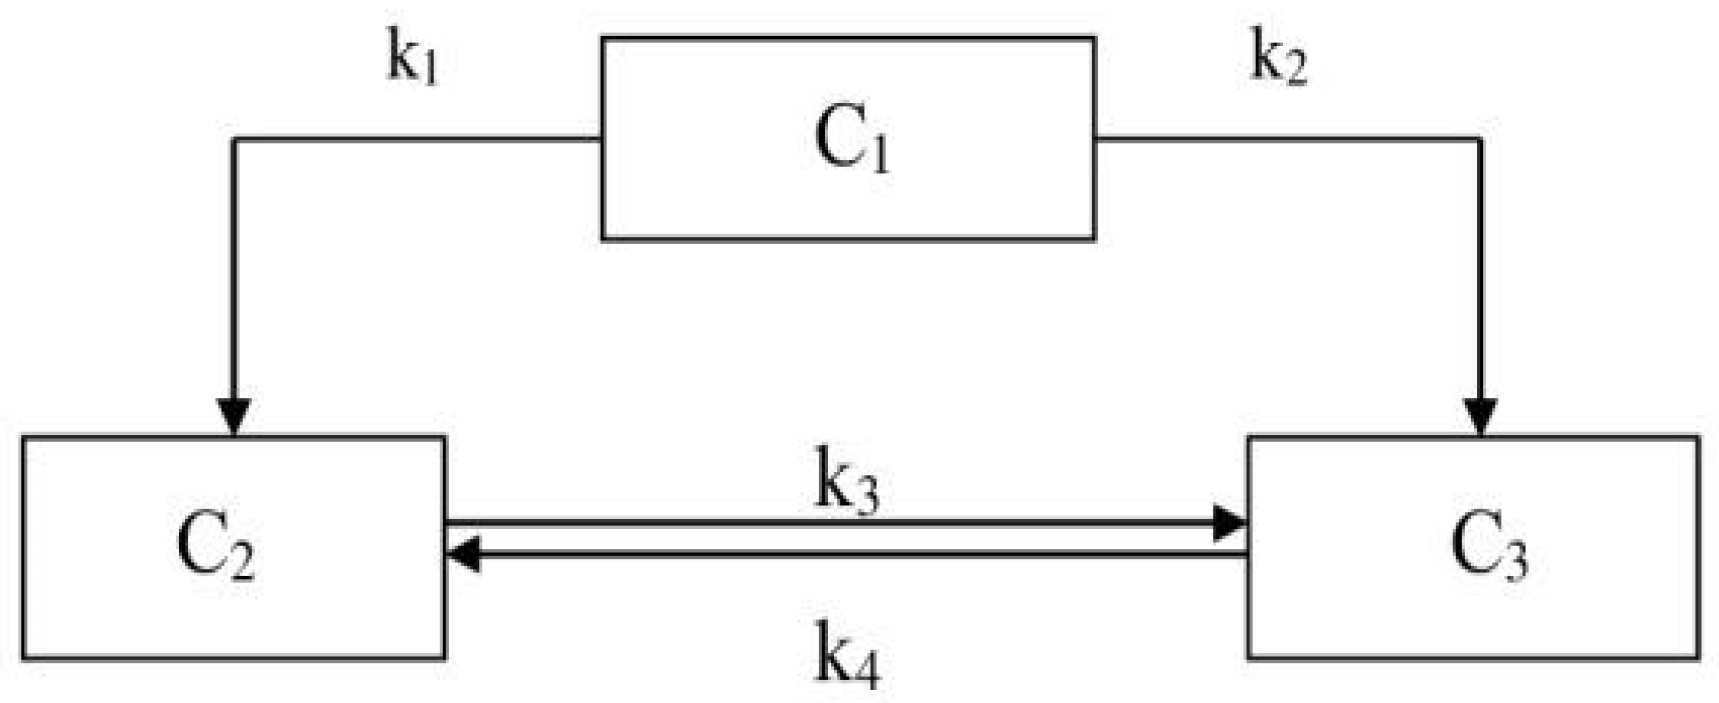
The kinetics analysis of the hydrodemetallization process of the mixture was carried out according to a formalized scheme (
Figure 1), where C
1 is the content of trace elements in the mixture of coal shale and the heavy fraction of low-temperature tar with a boiling point above 300 °C, C
2 is the content of trace elements in the hydrogenate, and C
3 is the content of trace elements in the solid residue, in %.
The rate constants were calculated on the basis of experimental data, duration of the experiments from 15 to 75 min and temperature of 380–420 °C. In accordance with the proposed scheme, a kinetic model of the mixture hydrodemetallization process was compiled, which has the following form:
where
indicate the trace element content at a point in time τ. The system of differential equations was solved using the Davidon–Fletcher–Powell method and the random search method.
The hydrodemetallization kinetics of the mixture was determined in a high-pressure reactor with a stirring device and a volume of 0.5 L. The initial hydrogen pressure was 4 MPa, the weight of the mixture charge was 4 g, the duration of the analysis was from 15 to 75 min, the heating temperature was from 380 to 420 °C.
The concentration of trace elements in the initial mixture, hydrogenate and solid residue was determined using an atomic emission spectral method based on electric arc burning of the sample by emplyoing a diffraction spectrograph 8 equipped with a multichannel atomic emission spectrum analyzer (MAES).
3. Results and Discussion
The heavy fraction of coal tar with boiling point above 300 °C had the following elemental composition in wt%: Hdaf—8.0, Cdaf—62,0, Sdaf—1.0, Ndaf—2.0, Odaf—39.0. The elemental composition of coal shale, in wt%, was the following: Hdaf—7.79, Cdaf—63.08, Sdaf—4.68, Ndaf—1.74, Odaf—22.77, Wa—3.17, Aa—64.58.
The elemental composition of the mixture of 13% coal shale and the heavy fraction of coal tar with boiling point above 300 °C, in wt%, was the following: Hdaf—6.58, Cdaf—69.69, Sdaf—0.37, Ndaf—1.16, Odaf—22.21, Aa—11.2.
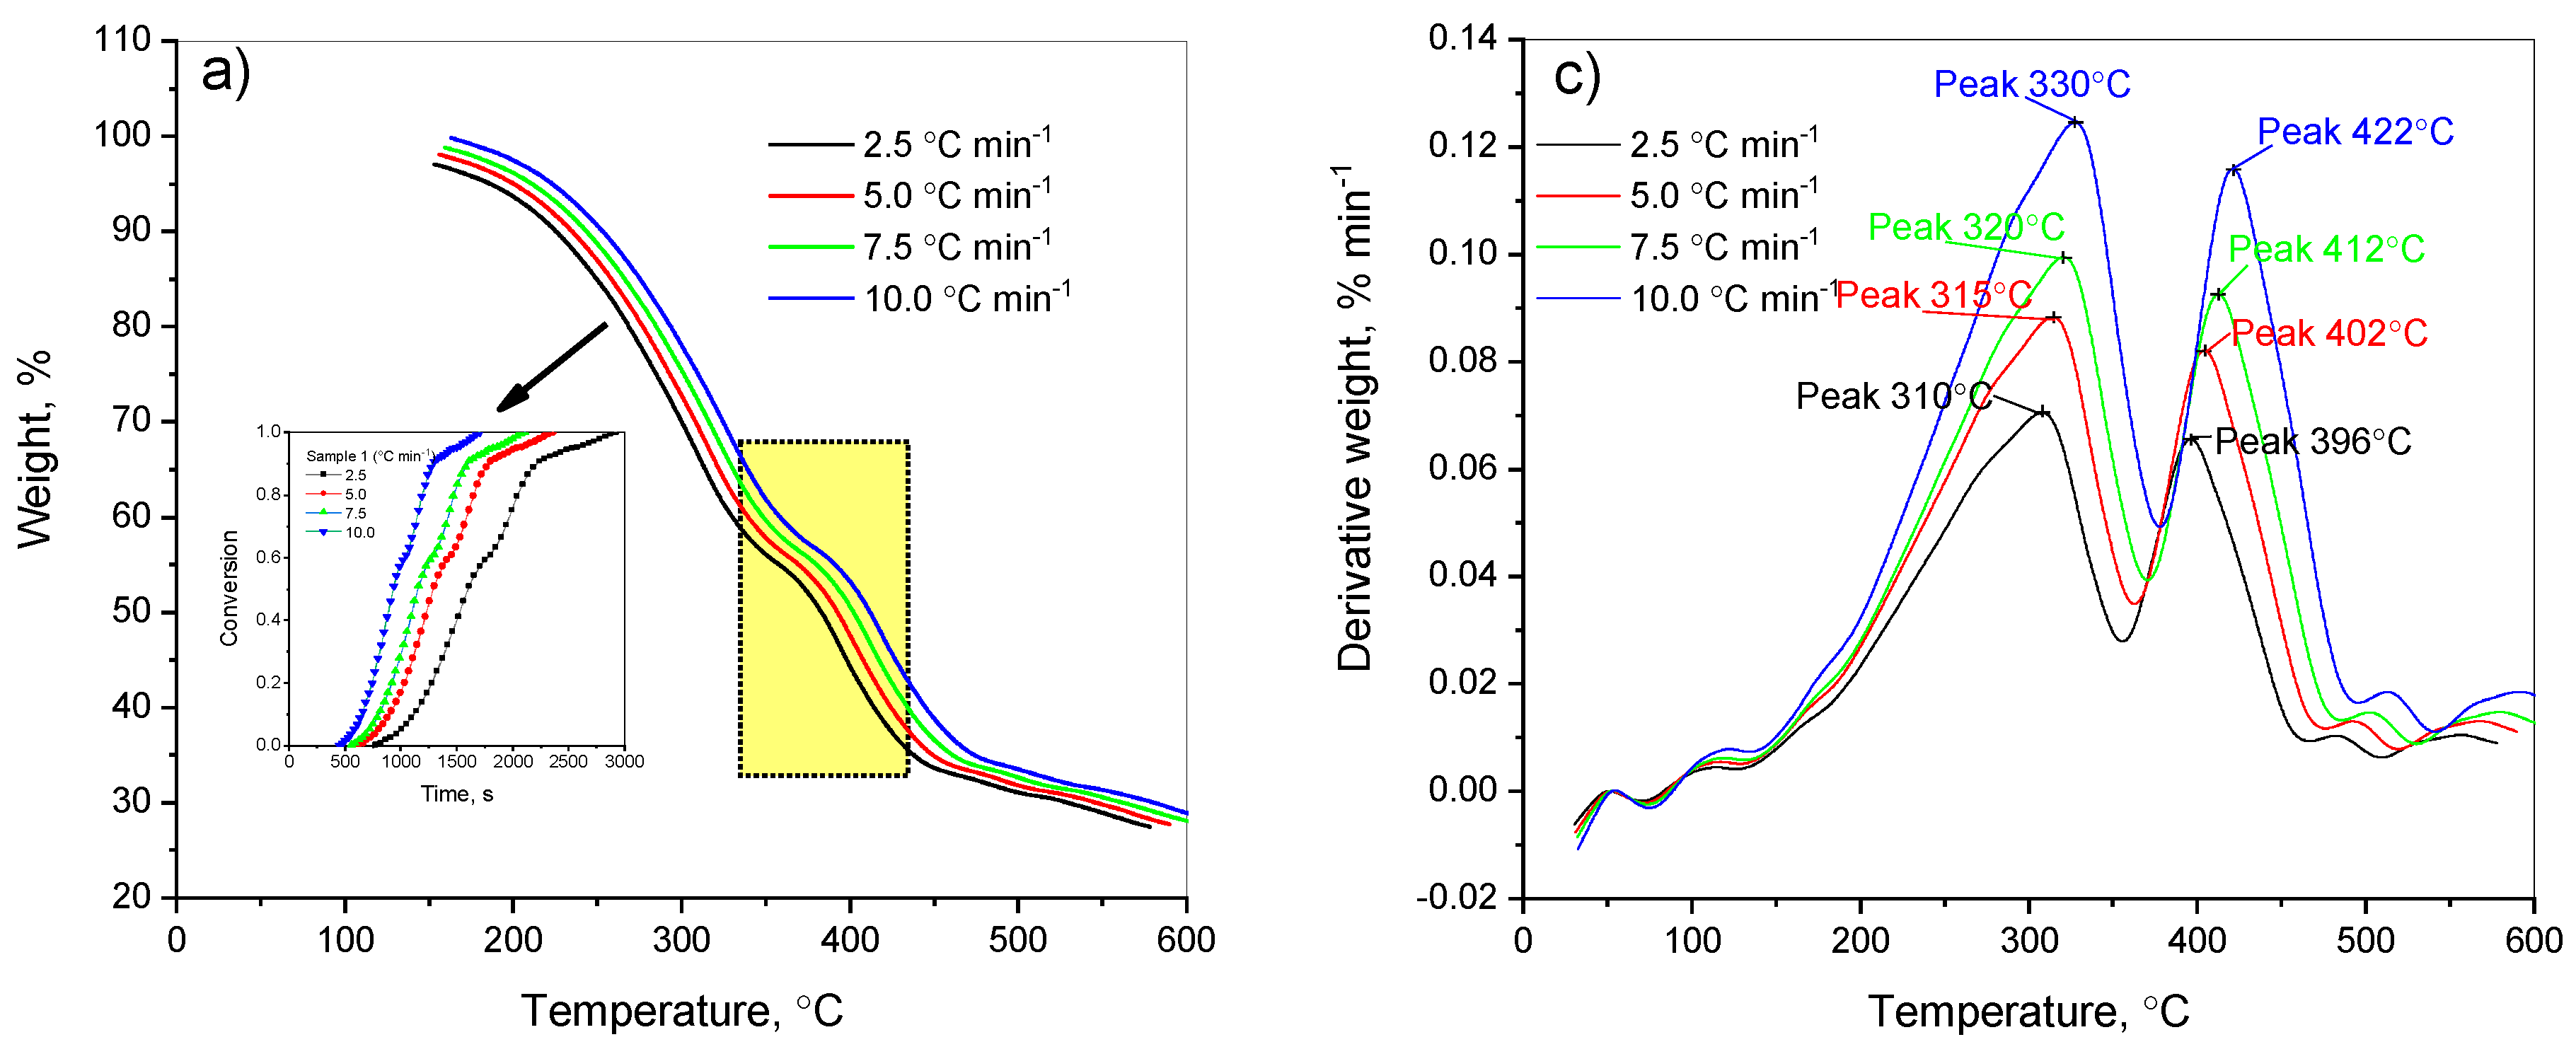
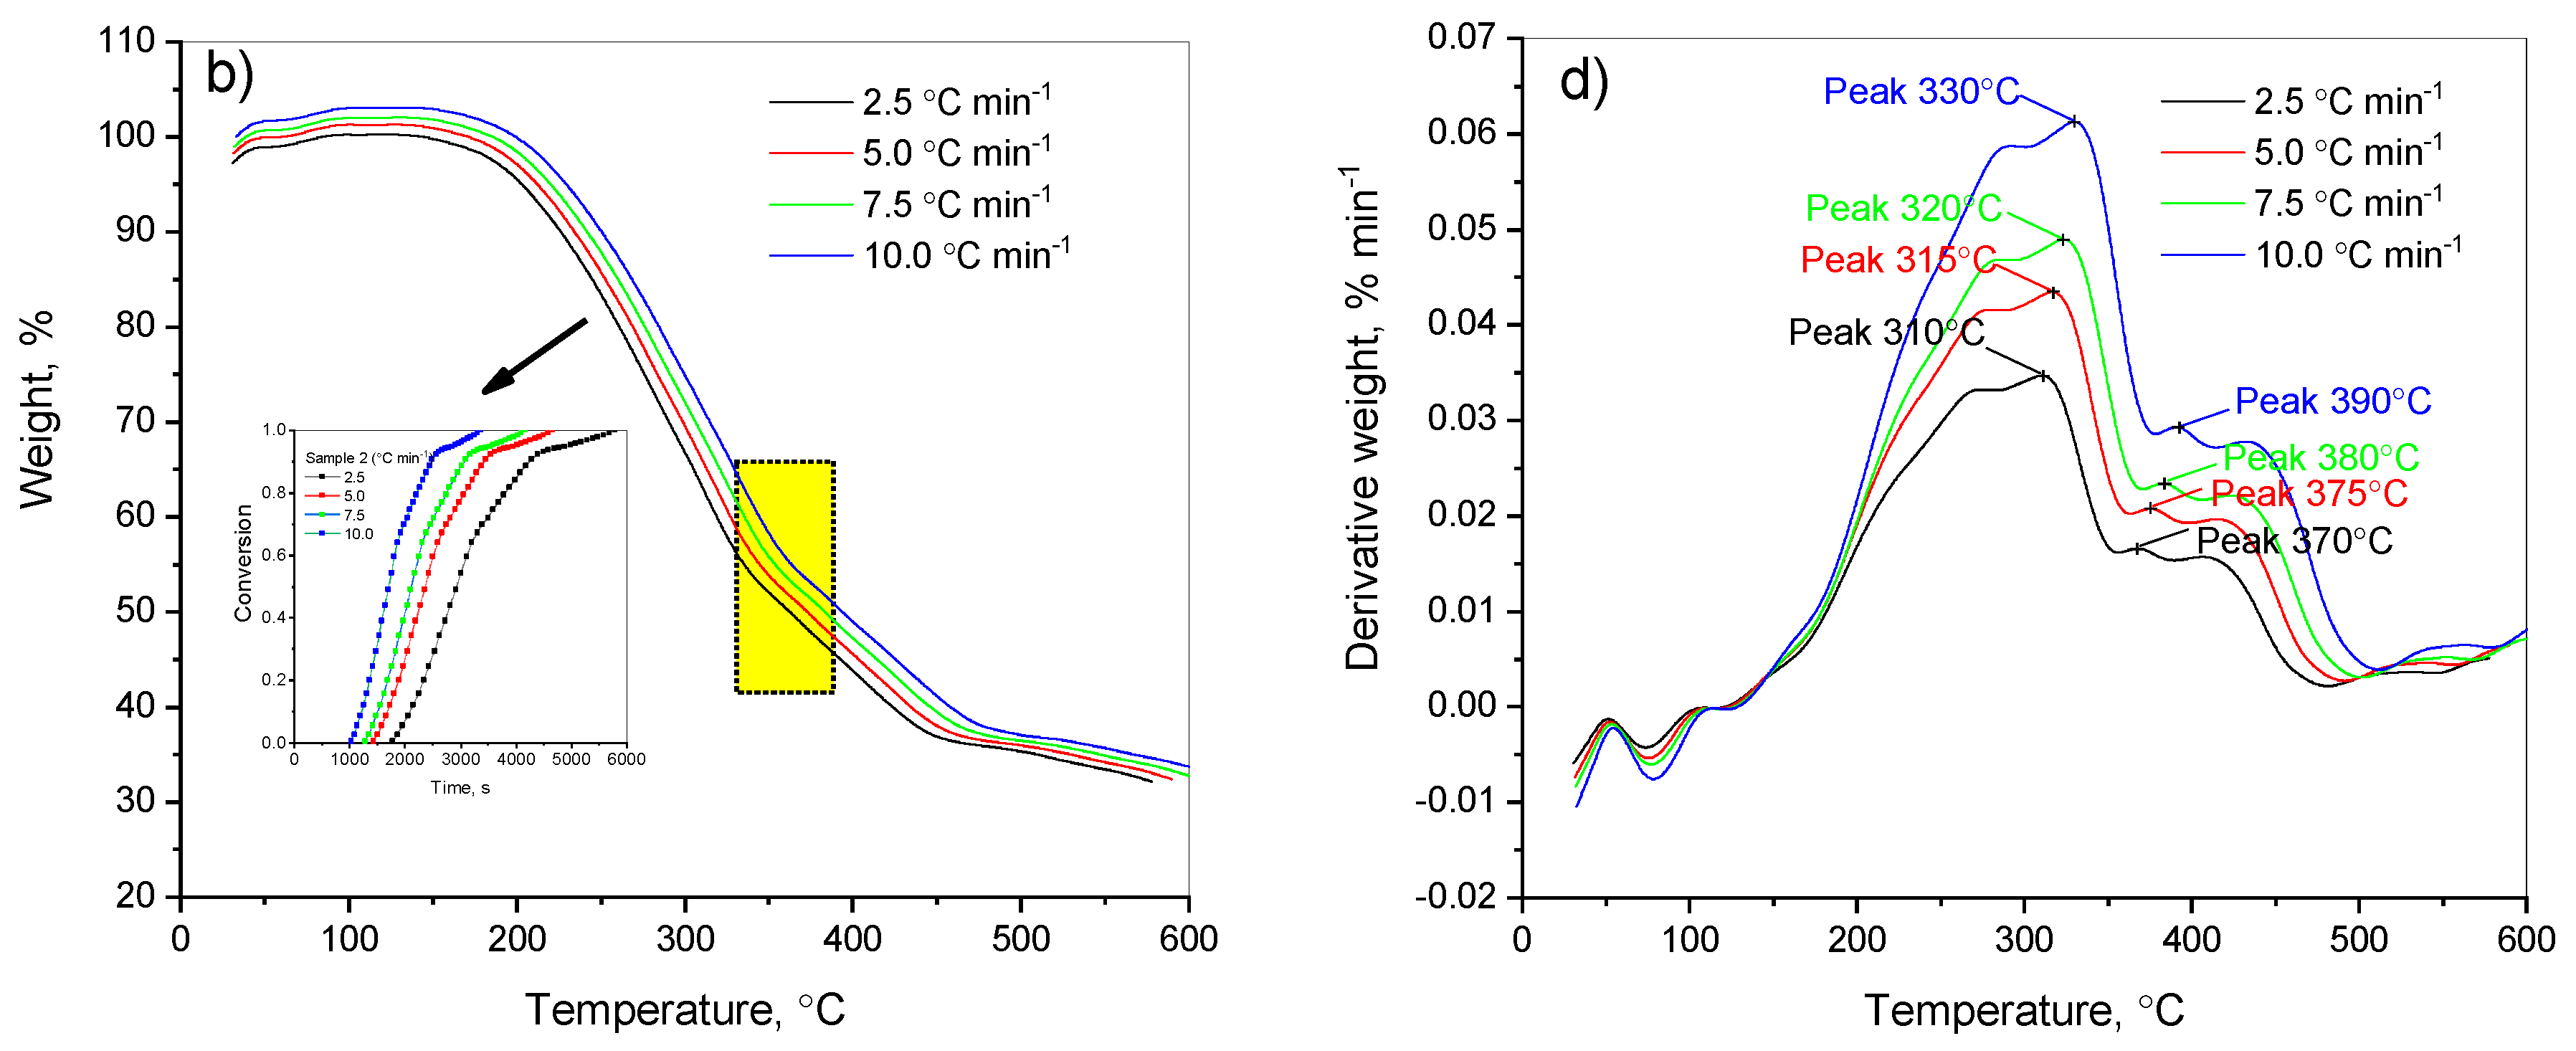
The studied samples, including the mixture of the heavy fraction of low-temperature coal tar and coal shale (5% and 13%), made it possible to evaluate the effect of the added coal shale amount on the thermal degradation of the mixture. Carrying out the thermal destruction of the heavy fraction of low-temperature coal tar including 13% and 5% of coal shale under various temperature conditions allowed us to predict the likelihood of accumulation of trace elements in the solid residue. As a result of our research, using isoconversion models, we identified the main kinetic characteristics of the decomposition process of the heavy fraction of low-temperature coal tar including 13% and 5% of coal shale. The results of the study showed the practical value of this method. The curves of the thermogravimetric analysis and decomposition rate obtained are presented in
Figure 2.
As shown in
Figure 2, samples of the heavy fraction of coal tar + 13% and 5% of coal shale in a nitrogen atmosphere began to decompose at ~100 °C. Then, till ~150 °C, a slight decomposition of the sample, with evaporation of the internal and hygroscopic moisture, was observed. Observing the thermogravimetric curves of the heavy fraction of coal tar with 13% and 5% of shale (
Figure 2a,b), we concluded that the coal tar with the addition of 13% of coal shale reached the maximum decomposition rate of the sample, which is reflected by the peak in the DTG curve (
Figure 2c), at a temperature of about 323 °C. In this case, the total weight loss of the sample during heating wa s approximately 78.21% (
Figure 2a). A similar behavior was observed for the heavy fraction of coal tar with the addition of 5% of coal shale: the maximum decomposition rate of the sample, as seen from the peak in the DTG curve, occurred at a temperature of about 350 °C, and the total mass loss of the second copolymer when heated was about 77.07% (
Figure 2b). The degradation process of both samples was substantially complete at a temperature of about 600 °C.
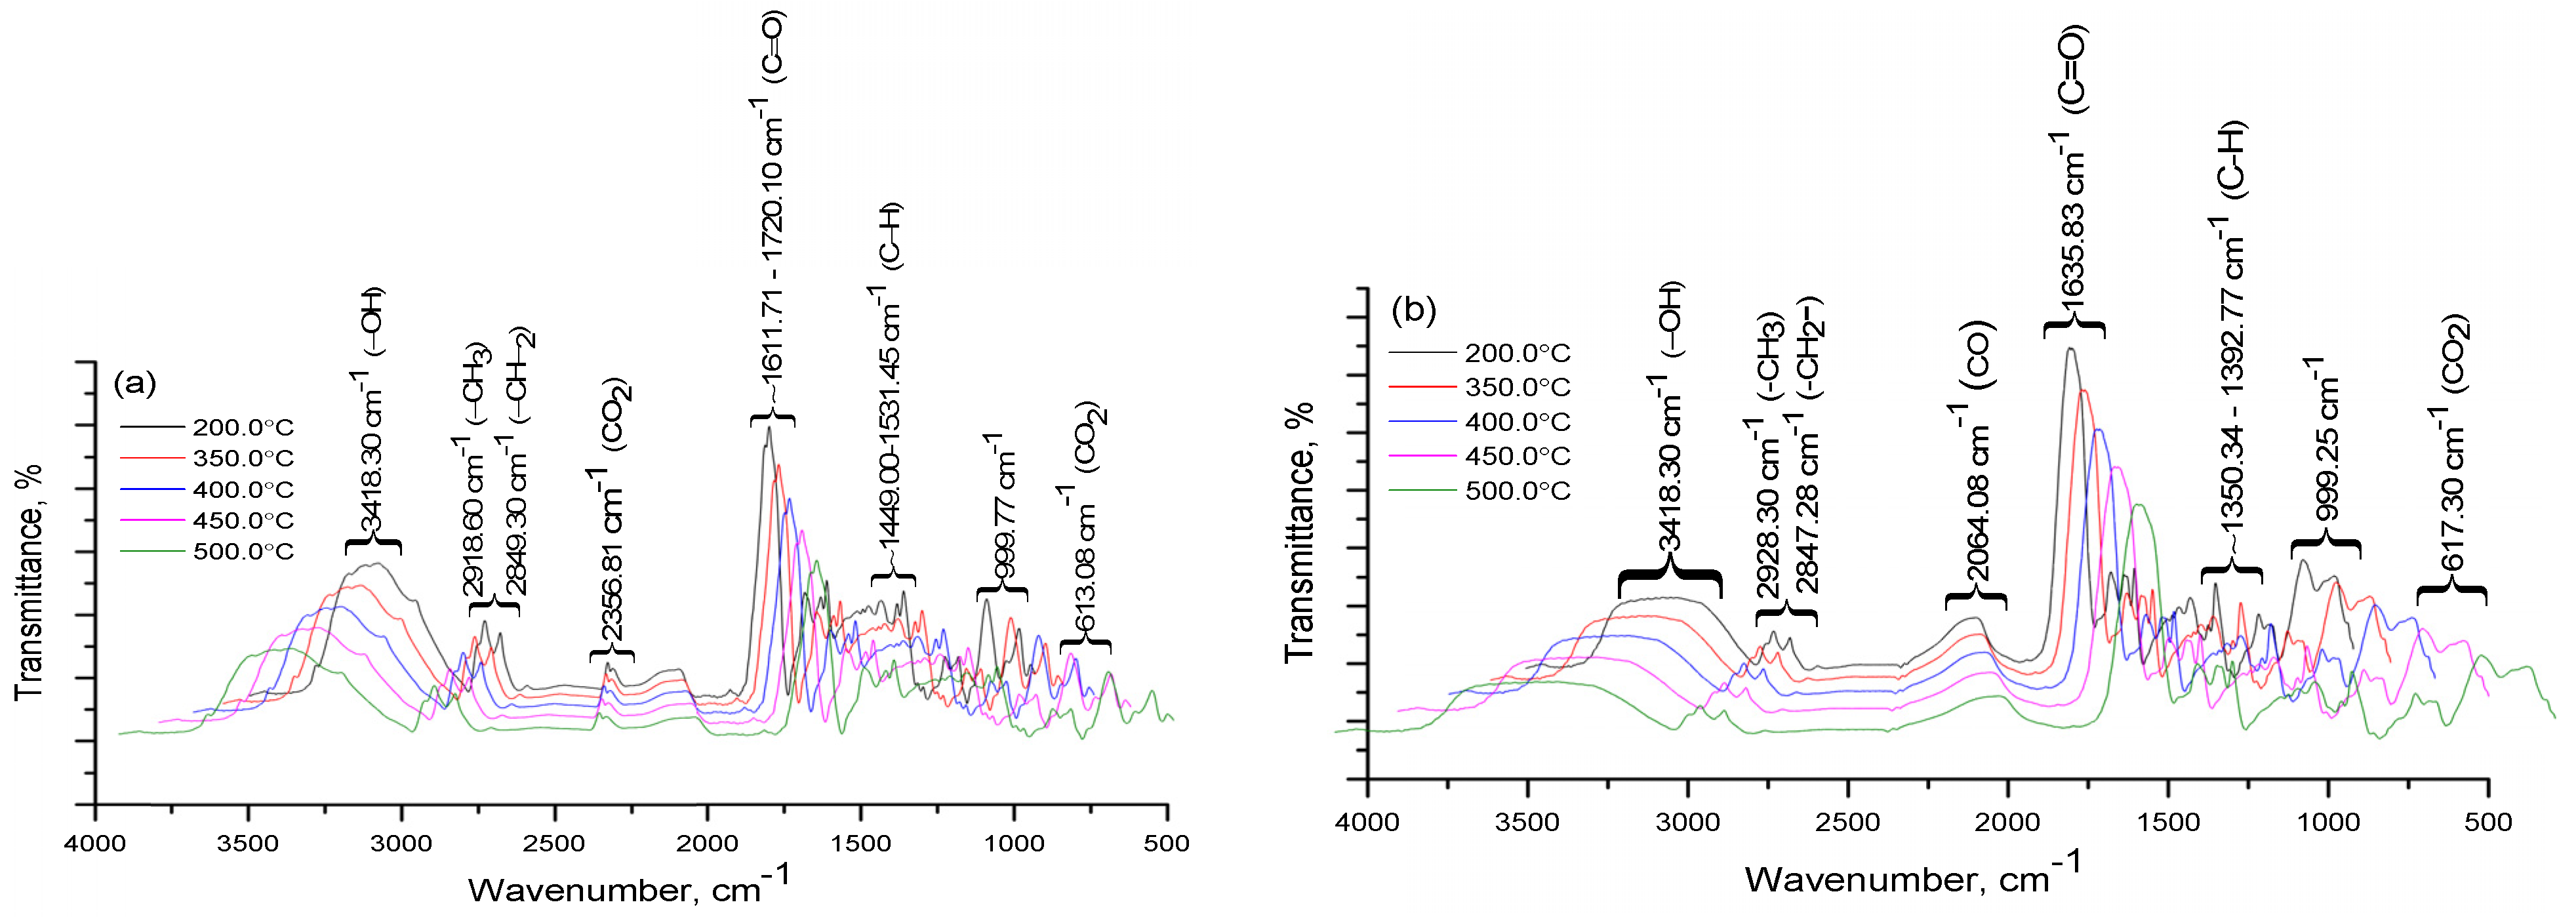
Some volatile products present in the heavy coal tar fraction containing 13% and 5% of coal shale could be determined from a specific strong infrared absorption peak, indicating that the gas phase components of the pyrolysis products were mainly CO
2 (2356 cm
−1) and molecules containing CH
2 aliphatic groups. The IR spectra confirmed that the absorption of the CH
2 aliphatic group in the region of valence (2918, 2849 cm
−1) and deformation (613, 999, 1454 cm
−1) vibrations signified a high content of hydrogenated cycles. In the IR decomposition spectrum (
Figure 3) of the heavy fraction of coal tar containing 13% of coal shale at a temperature from 350 to 600 °C, the intensity of the valence oscillation band of CO
2 groups (2360 cm
−1) increased.
An analysis of the literature on the thermal degradation of the heavy fraction of coal tar with the addition of coal shale [
18,
19,
20,
21,
22] showed that the available information on thermogravimetric and IR spectroscopic analyses was incomplete, which prevented us from conducting a comparative analysis of the results obtained.
Reactions involving solids, such as the thermal decomposition of coal, belong to a special class of topological processes that are characterized by the localization of the reaction zone at the interface between the solid reactant and the reaction product. Under these conditions, the concept of concentration of a reactant substance loses its meaning, and it is more convenient to use the parameter α, which denotes the proportion of reacted substances at a point in time.
The key fact that attracted the attention of scientists [
14,
15,
16,
23] during these studies is that the kinetic characteristics calculated based on isothermal data are not directly related to the chosen model, while kinetic values based on non-isothermal methods show an inverse relationship.
The method of calculating non-isothermal kinetics was proposed simultaneously in the works of Ozawa [
23] and Flynn and Wall [
24]. The advantage of this method is the ability to determine the activation energy without knowing the functions
f(
α) and
g(
α), but this is only true under the assumption that the reaction is one-step.
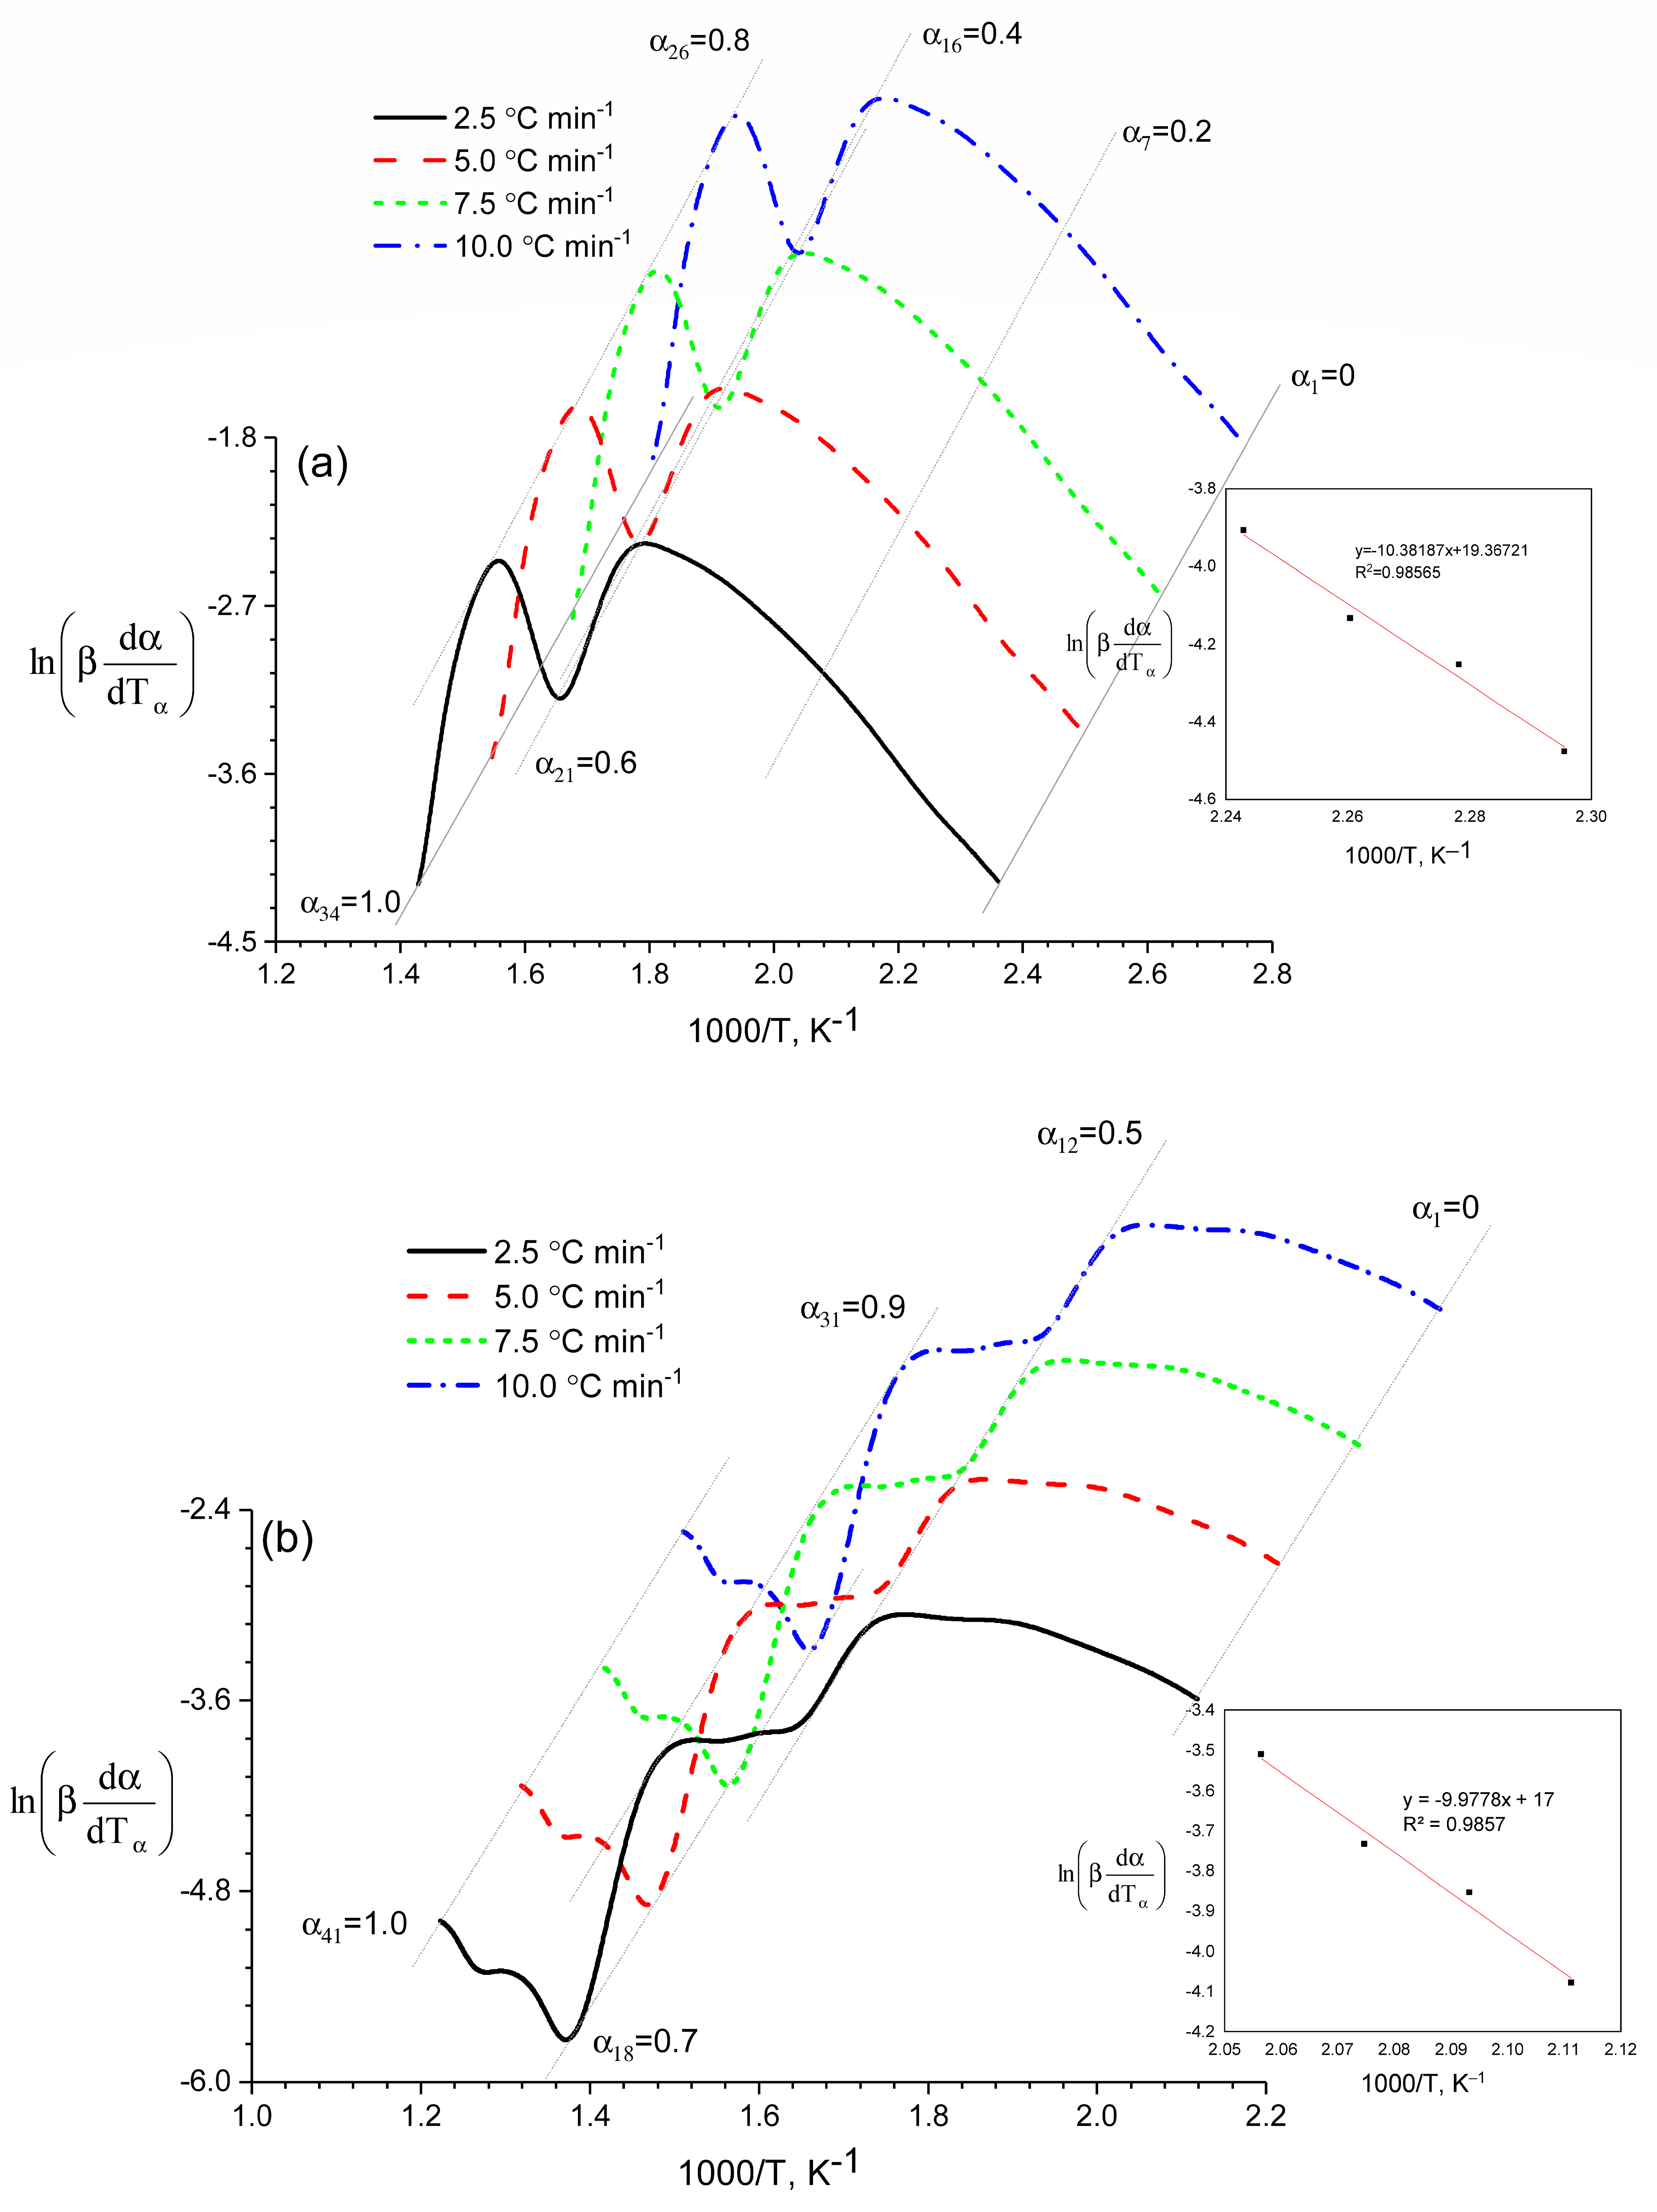
The use of the above methods made it possible to graphically determine the thermodynamic parameters of the process of thermal decomposition of the heavy fraction of coal tar including 13% and 5% of coal shale at different heating rates and conversion levels (
Figure 4,
Table 1).
The analysis showed that the values of the kinetic parameters of the overall reaction obtained by calculation (
Table 1 and
Figure 4) were lower than those of each single parallel reaction, namely,
Ē = 86.32 kJ/mol,
α = 0.1 and
Ē = 87.52 kJ/mol,
α = 1.0, that is, the parameters of the gross process were of a purely formal nature.
Both groups of methods described above are based on the use of the Arrhenius equation. It should be noted that in the Arrhenius equation
the rate constant k and temperature T play the role of dependent and independent variables, and
k0 and
Ea are the parameters to be estimated.
The partial derivatives of k with respect to the other parameters are equal to:
The observed triplet (which is a term often used to describe one set of A, Ea and f(α) or g(α) values) depends on the ratio of the rate constants of the chemical process. But it should be borne in mind that this equation describes only the part of the S-shaped curve lying after the inflection point. In other words, Equation (9) is a special case of the more general kinetic equation .
One of the methods that well describes the course of a reaction that occurs with an increase in the reaction rate is the informal kinetics method (IKM). The main distinguishing feature of the informal kinetics method is that it allows for determining formal kinetic parameters when processing a certain set of values (dα/dt, T and α).
It is necessary to consider in more detail the mathematical side of the nonparametric kinetics method. The nonparametric kinetics method [
25] is based on constructing a matrix containing information on
k(
T) and
f(
α).
This matrix can generally be represented in the form of a singular value decomposition algorithm,
[
25,
26,
27,
28]. Below, the kinetic matrix (IKM) method is reported, where the reaction rate can be expressed as the product of two independent functions [
18],
and
.
The information matrix is equal to:
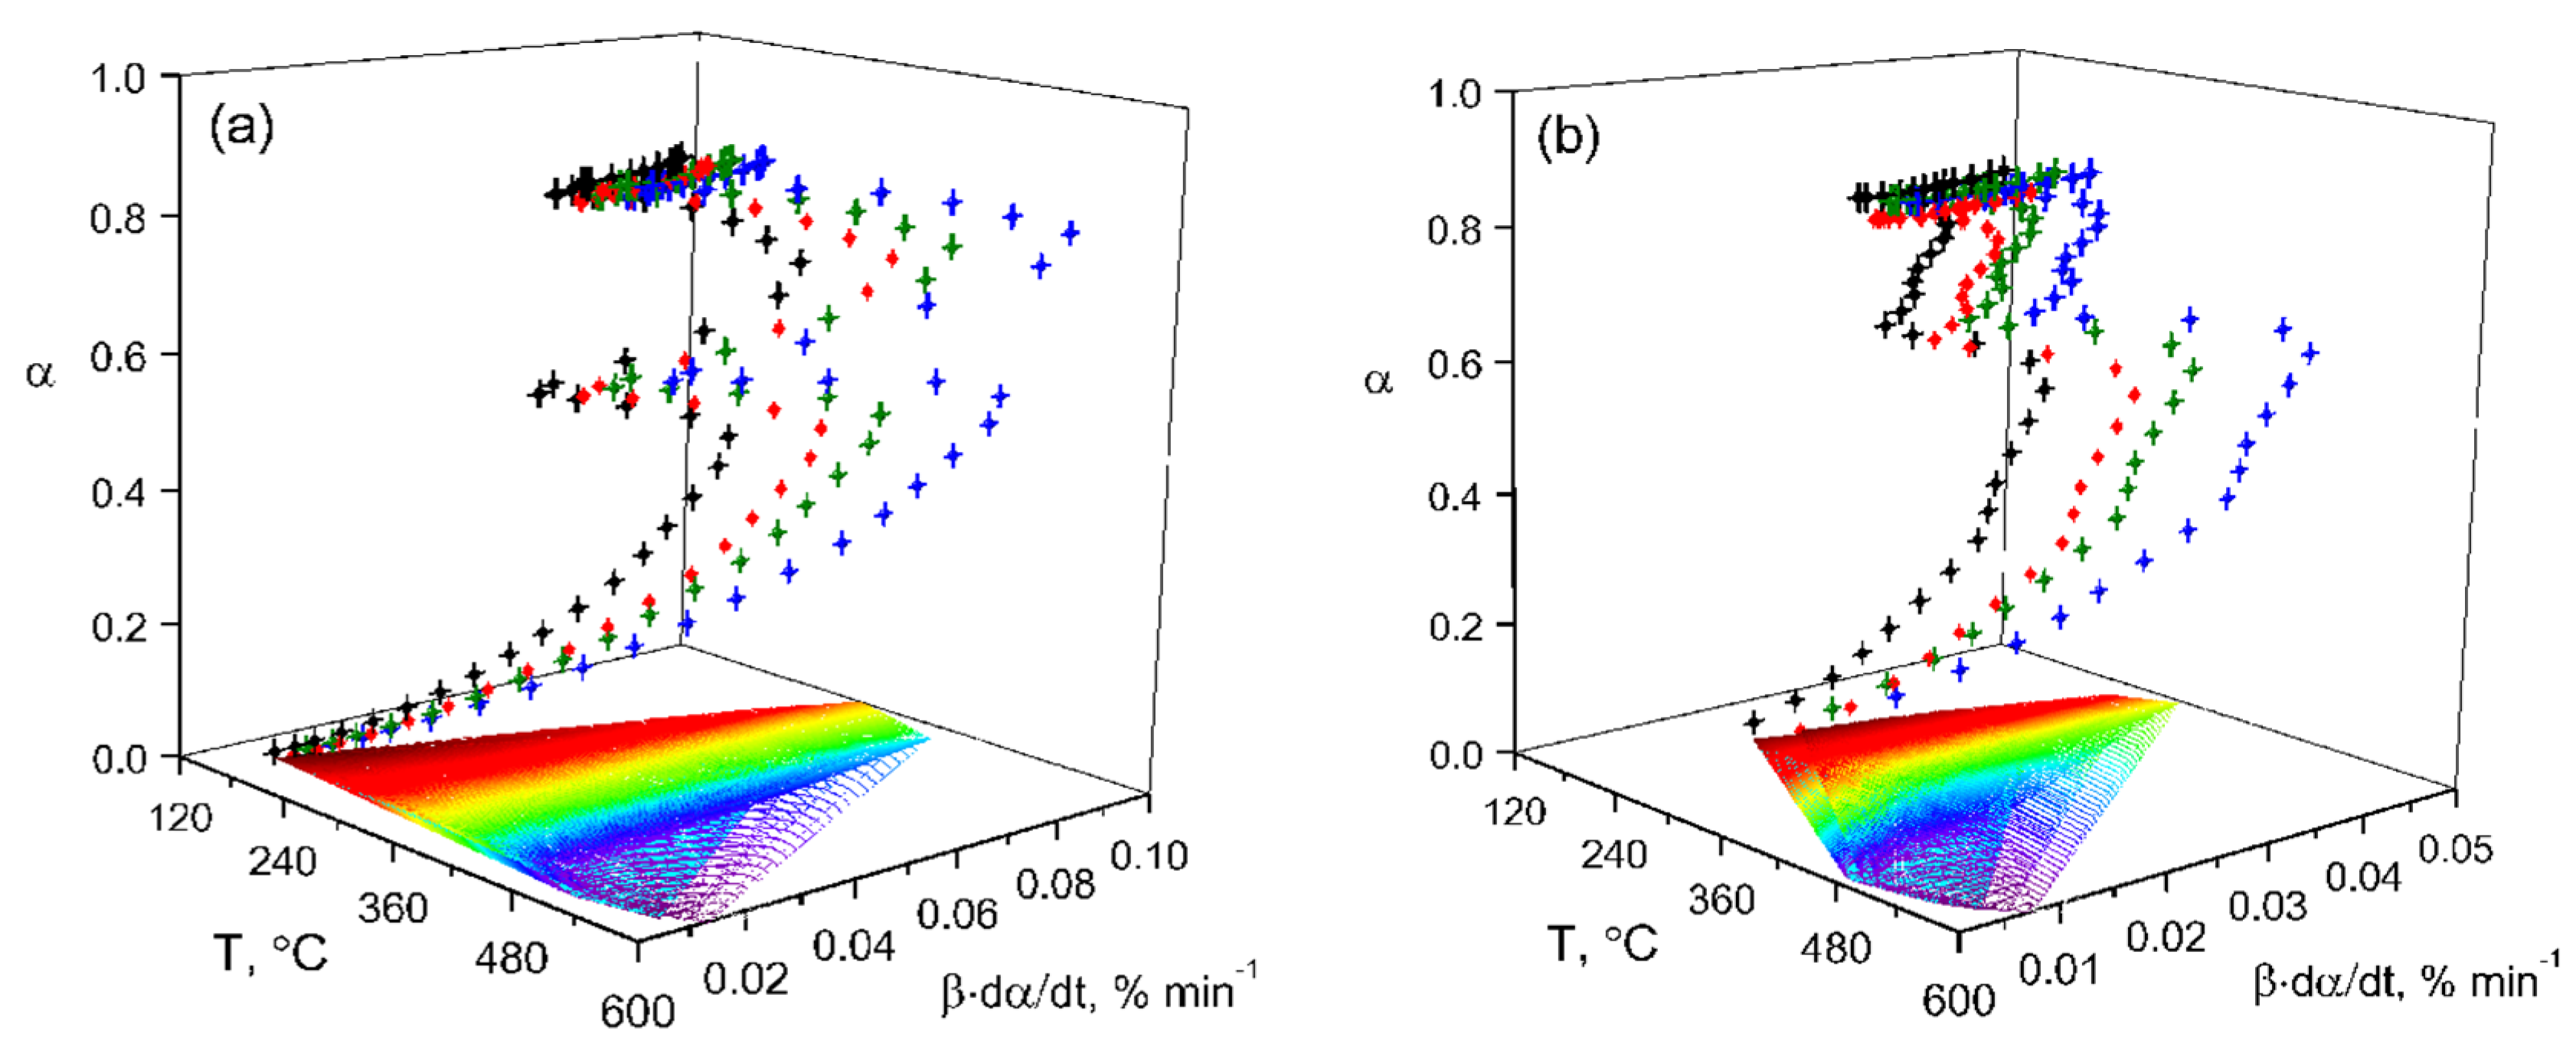
The experimental reaction rate data were obtained using Equation (5) (
Table 2) and are presented in a 3D system (
Figure 5).
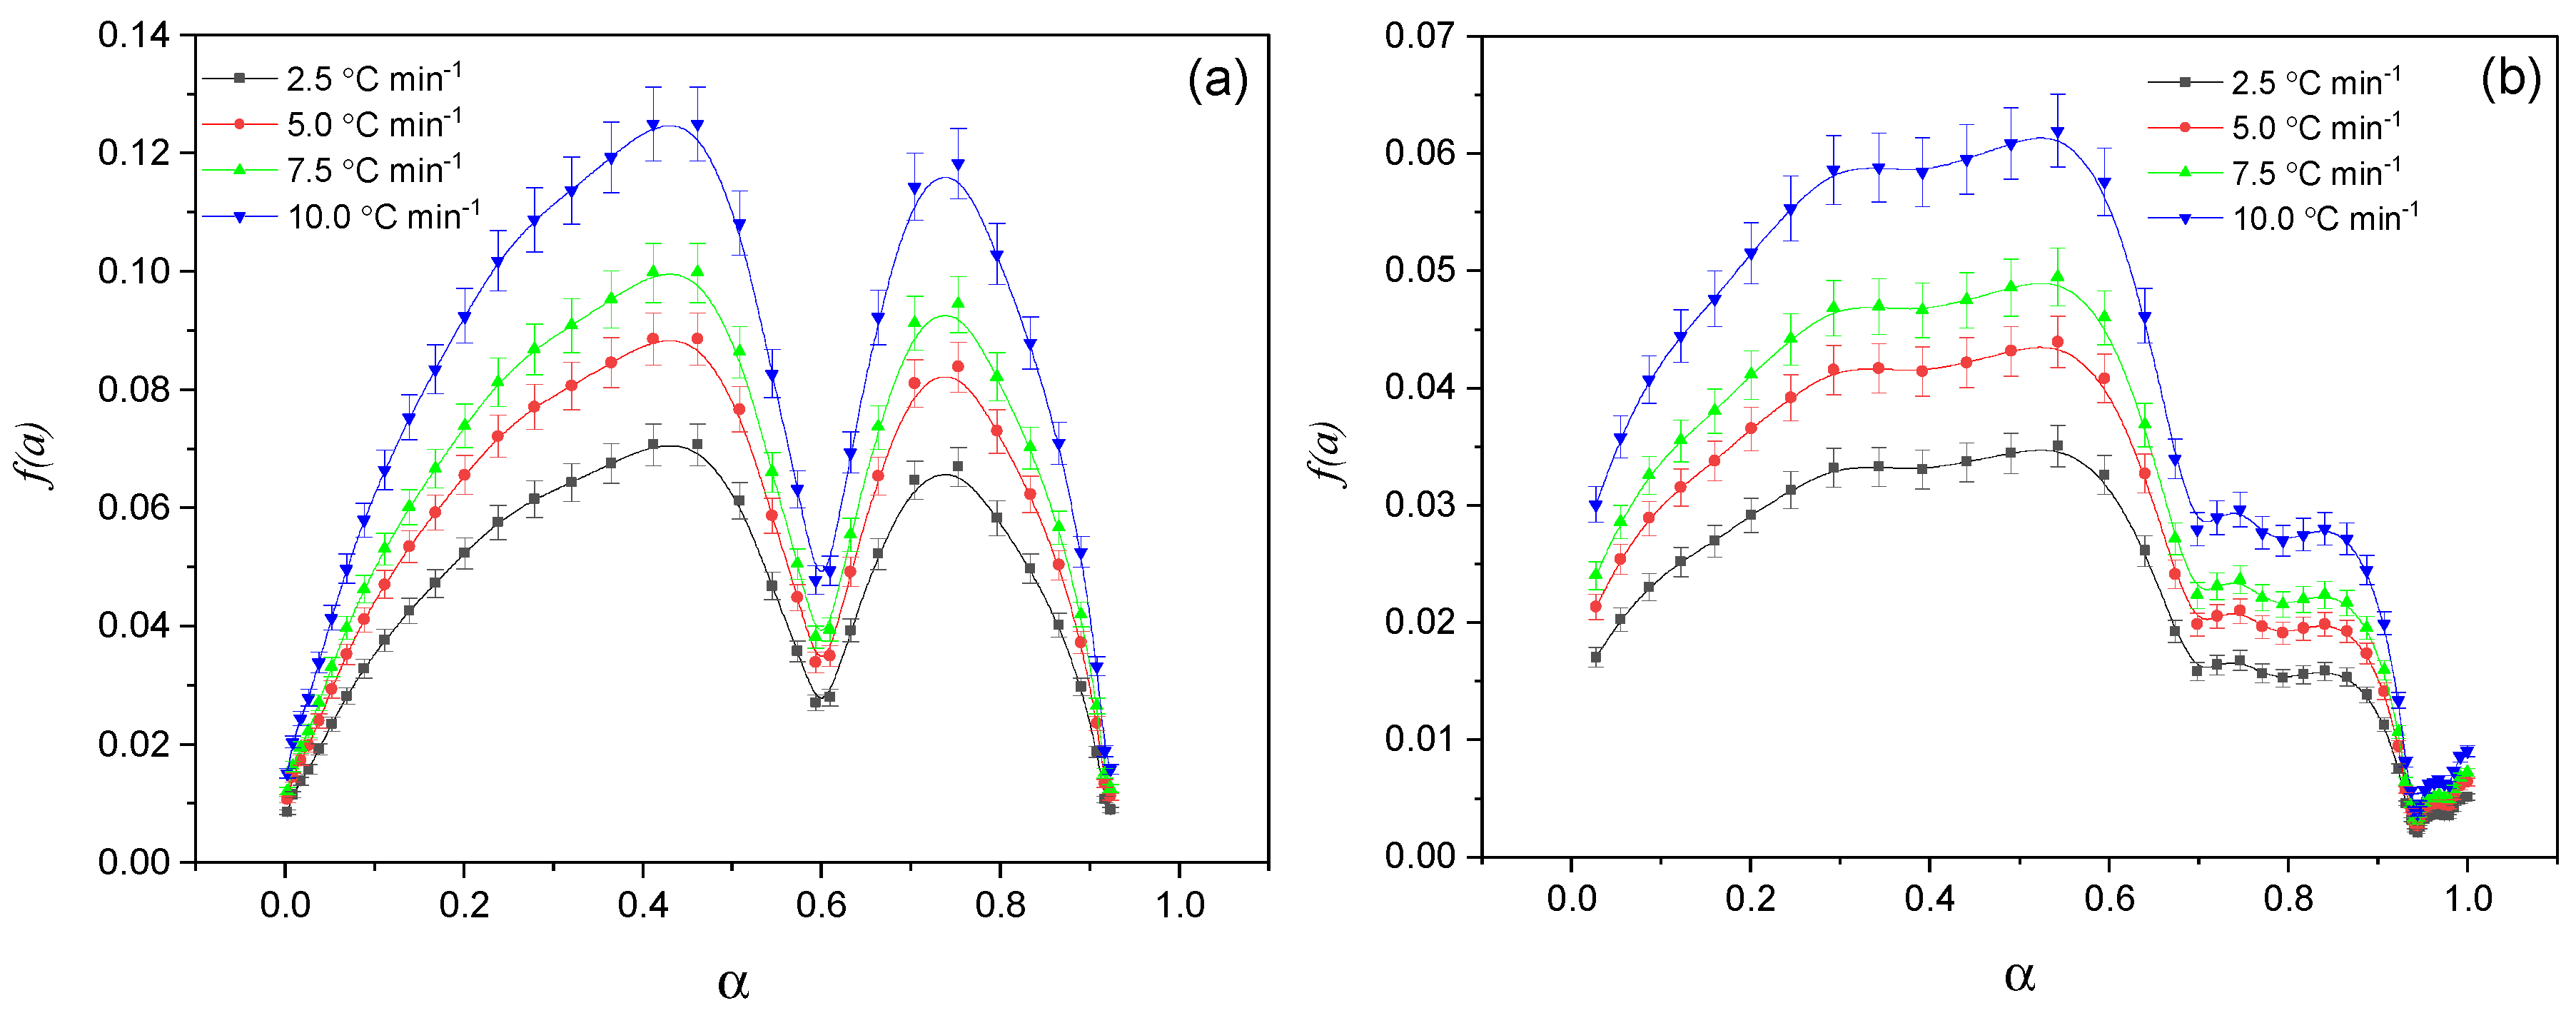
The choice of
f(α) was carried out using the Šesták–Berggren method, often called the Prout–Tompkins (P-T) equation [
26,
27], by selecting the most appropriate model in the coordinates (
dα/
dt) −
α at different heating rates (
β).
was used as the function
f(α). The parameters m and n affect the shape and position of the maximum of the curve (
dα/
dt) (
Figure 6). The results of the kinetic analysis are shown in
Figure 6 and
Table 2.
For the data in
Figure 6a, the equation
f(
α) =
α0.23(1 −
α)
0.55 was obtained, while, for the data in
Figure 6b, the equation
f(
α) =
α0.41(1 −
α)
0.76 was derived. As can be seen in
Figure 6, the exponents
m and
n (where >1) are concave downwards, which corresponds to a retarding type of kinetics. This indicates that in the processes described by these equations, the maximum activation energy was achieved at the initial stage and gradually decreased with the increasing degree of decomposition.
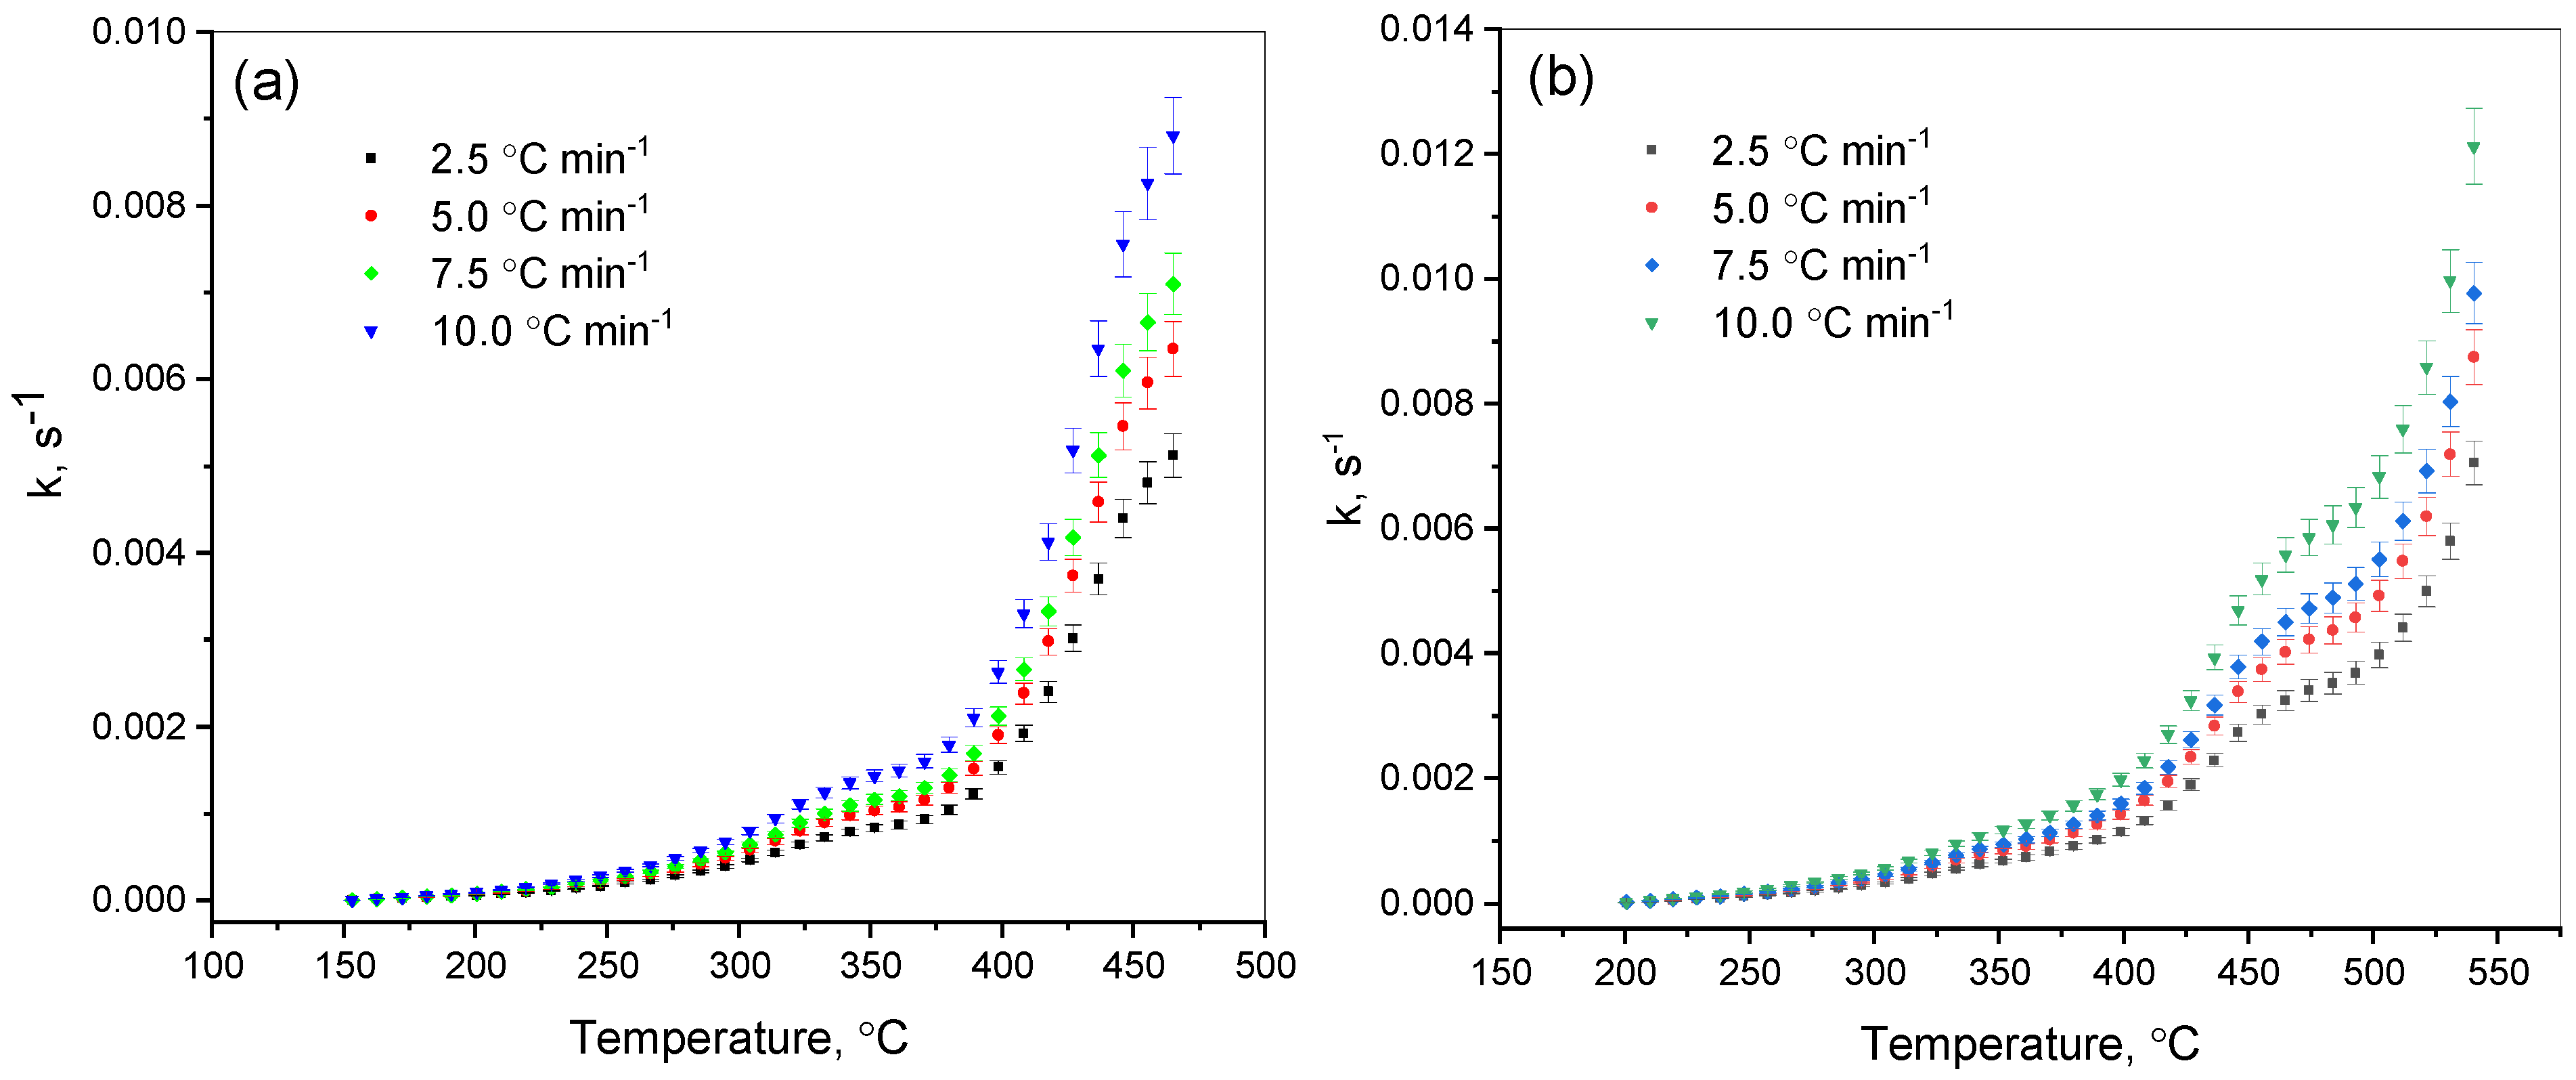
The expression of the kinetics of thermal destruction made it possible to establish the influence of temperature on the reaction rate constant. It was established that the parameter
k obeys the Arrhenius law (
Figure 7).
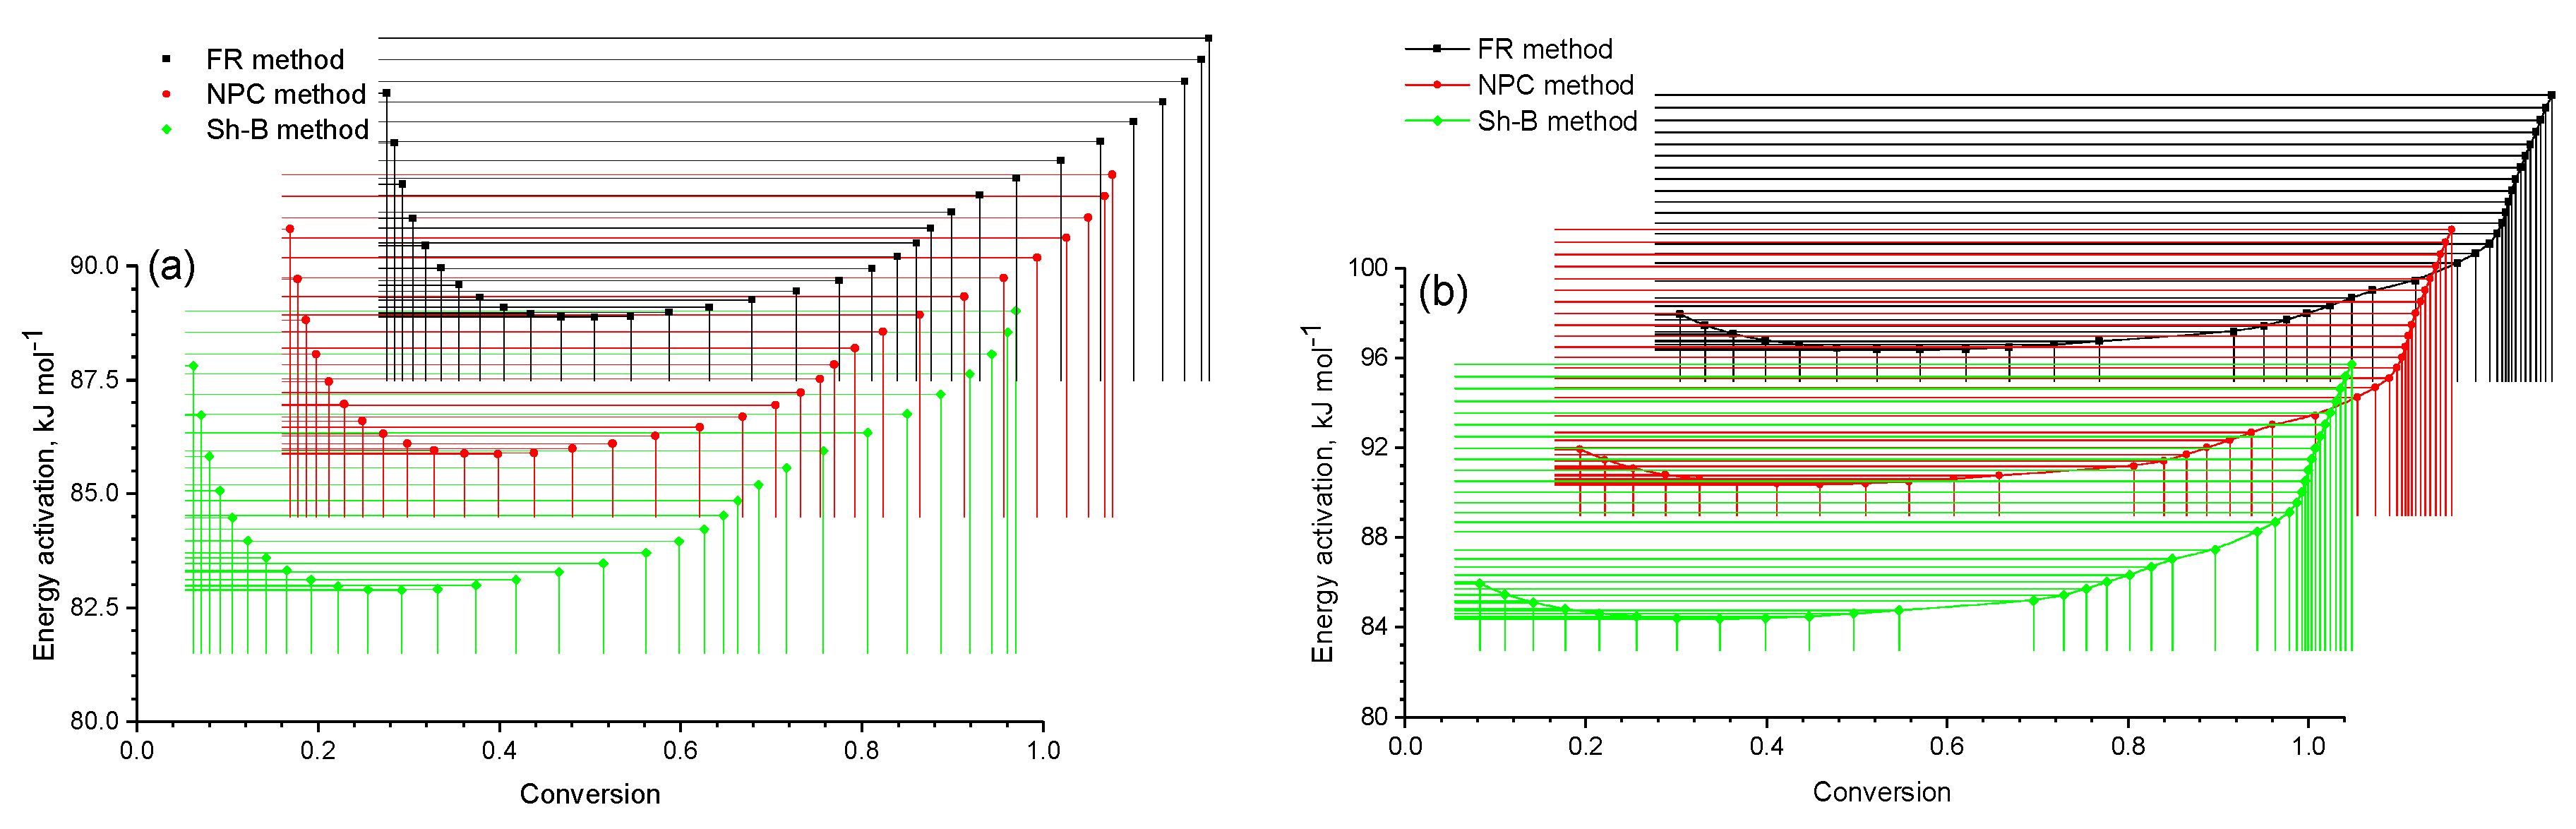
A review of the results showed that the
E–
α curves (
Figure 8) from each individual method (FR, NPK and SH-B) had the same shape. According to the data reported in
Table 2 and
Figure 8a, we obtained the values
α = 0.1 and
α = 1.0 with
Ēmax(0.1) = 86.32 kJ/mol and
Ēmax(1.0) = 87.52 kJ/mol. For the mixture of 5% of coal shale + the heavy fraction of coal tar, one point corresponding to the maximum value of the activation energy was obtained in the decomposition zone of the heavy fraction of coal tar. The degree of conversion in this case was 1.0, and the activation energy was 93.86 kJ/mol (
Figure 8b).
Thus, based on the results obtained, it can be concluded that the thermal destruction process of the mixture with 13% of coal shale was carried out under milder conditions than that of the mixture with 5% of coal shale. This was proved by the obtained data on the dependence of the sample mass on the temperature and the rate of change in the mass of the mixture.
For the further study of the hydrodemetallization kinetics of the mixture of the heavy fraction of low-temperature tar and coal shale, the mixture consisting of the heavy fraction of low-temperature tar and 13% of coal shale was used.
To determine the kinetic parameters, the hydrodemetallization of the mixture was carried out at temperatures from 380 to 420 °C for a duration of 15 to 75 min. The concentration of trace elements in the mixture components depending on the temperature and holding time is presented in
Table 3.
The kinetics of the hydrometallization process of the mixture of coal shale and tar fraction with boiling point higher than 300 °C was established using the Davidon–Fletcher–Powell method under a low initial hydrogen pressure. The formalized scheme includes reactions leading to the formation of products that contain trace elements (
Figure 1). In the proposed scheme, [C
i] is the content of trace elements at the i time. The system of differential equations was solved using a random search method. The velocity constants were optimized to minimize the sum of the squares of the differences between the experimental and the calculated values of the weight fractions of the hydrodemetallization products from the mixture.
The reaction rate constants of the components were calculated according to the formalized scheme. The rate constants k
1, k
2, k
3 and k
4 characterized the reaction rate of the hydrodemetallization of the mixture and the distribution of trace elements in its components. The rate constants were calculated based on the experimental data reported in
Table 3.
The velocity constants were optimized on the condition of the minimum sum of the squared deviations between experimental and calculated values of the weight fractions of the hydrodemetallization products of the mixture. The values obtained for the direct rate constants k1, k2, k3 of the hydrodemetallization process showed the rapid progress of direct hydrodemetallization reactions in the mixture. The inverse rate constant k3, indicating the content of trace elements in the hydrogenate, suggested a low speed.
The reaction rate constants of the accumulation of trace elements in the three components were calculated. The calculated rate constants of the hydrodemetallization reactions in the mixture are presented in
Table 4.
In the process of creating the kinetic model of the mixture hydrodemetallization, it was necessary to estimate the rate constants at different temperatures. The calculation of these constants was carried out on the basis of the experimental data on the hydrodemetallization of the mixture, presented in
Table 3.
Table 4 shows the calculated rate constants of the mixture hydrodemetallization process.
From the data presented in
Table 4, it follows that the rate constant increased as the temperature increased. At the same time, the distribution of trace elements in the hydrogenate from the initial mixture (k
1) and in the hydrogenate from the solid residue (k
4) showed relatively low values of reaction rate constants. The maximum microelement distribution rate was achieved in the solid residue from the hydrogenate (k
3).
The activation energy was calculated using the Arrhenius equation. The results showed the concentration of trace elements in the hydrogenate and solid residue, as well as the calculated activation energy values, which were 30.7 kJ/mol, 32.0 kJ/mol, 67.47 kJ/mol and 91.3 kJ/mol. The data obtained indicate that the distribution of trace elements in the hydrogenate and solid product was the least energetically hindered stage. The activation energy of the distribution of trace elements from the hydrogenate to the solid residue and back was three times higher than the activation energy for the C3-to-C2 step, amounting to 91.3 kJ/mol. From this, it can be concluded that in order to ensure the selectivity of the hydrodemetallization process aimed at distributing trace elements into a solid residue and reducing their content in the hydrogenate, the increase in the process temperature should be limited.
The results of the analysis of the metal content in the solid product (presented in
Table 3) confirmed that the process of hydrodemetallization of the mixture was also influenced by sorption processes. When, besides the temperature, the contact time increased from 15 to 75 min, the content of trace elements in the solid product increased from 28.9 to 64.5 wt%.
The data obtained show that the process of demetallization of the heavy fraction of low-temperature coal tar during hydrogenation with coal shale is a complex of chemical interactions. These include interactions of heavy-fraction metal-containing fragments with organic and mineral parts of coal shale, as well as the possible adsorption of metals in the heavy-fraction tar on the mineral surface of coal shale. Probably, organomineral components are able to catalyze the process of destruction of high-molecular-weight compounds in the heavy fraction of coal tar. This will facilitate their more intensive conversion to light liquid and gaseous products and also promote the formation of densification products. Such densification products will bind the metals in the heavy fraction of coal tar and in coal shale.
The described technology of hydrodemetallization of the mixture of the heavy fractioncoal tar and coal shale can lead to the production of solid products with a significant content of rare metals.


 ,
, 


