Abstract
Certain oxygenated compounds, when blended with gasoline, have the ability to inhibit the occurrence and decrease the intensity of engine knock, helping improve engine efficiency. Although ethanol has had widespread use as an oxygenate, higher alcohols, such as butanol, exhibit superior properties in some respects. Besides alcohols, glycerol derivatives such as glycerol tert-butyl ether (GTBE), among others, also have the potential to be used as gasoline oxygenates. This work provides a direct comparison, performed on a modified Waukesha CFR engine, of C1–C4 alcohols and the glycerol derivatives GTBE, solketal, and triacetin, all blended with a gasoline surrogate in different concentrations. The tests focused on how these oxygenated compounds affected the knocking behavior of the fuel blends, since it directly impacts engine efficiency. The test matrices comprised spark-timing sweeps at two different compression ratios, at stoichiometric conditions and constant engine speed. The results showed that, in general, the C1–C4 alcohols and the glycerol derivatives were effective in decreasing knock intensity. n-Butanol and solketal were the noteworthy exceptions, due to their demonstrated inferior knock-inhibiting abilities. On the other hand, isopropanol, isobutanol, and GTBE performed particularly well, indicating their potential to be used as gasoline oxygenates for future engines, as alternatives to ethanol.
1. Introduction
Road transportation, encompassing around 1.2 billion passenger cars and 380 million commercial vehicles on the roads, is responsible for 23% of global CO2 emissions [1]. Internal combustion (IC) engines, powering around 99.8% of transport [2] and accounting for about 17% of the total greenhouse gas (GHG) emissions [3], are expected to remain the dominant source of transportation power in the foreseeable future [4]. Indeed, it is expected that, even by 2040, IC engines running on conventional fuels will account for 85–90% of the global transportation energy [2]. While a number of potential solutions have been proposed for future vehicles (such as electrification), it is evident that the huge ‘legacy fleet’ currently in operation, powered by IC engines, will need to burn some type of fuel. This fact alone emphasizes the need to develop alternative fuels that are not only environmentally friendly, but also technically and economically feasible. However, given the complexity of the matter, it is worth keeping in mind that there is no one-size-fits-all solution for the decarbonization of transport. Instead, a mix of different technologies that are region-dependent, including electrification, hybridization, along with IC engines and advanced fuels, will be necessary for the energy transition away from fossil fuels [5].
When it comes to IC engines, there are a number of different approaches with the potential to reduce GHG emissions significantly, such as developing highly efficient powertrains [3,6] featuring advanced technologies, such as boosting and downsizing, among others [7,8]. In addition, the development and utilization of affordable, scalable, and sustainable biofuels and bioadditives should be pursued [9,10,11,12,13,14]. Such biofuels can be obtained from a variety of renewable sources, e.g., biomass and waste (fats, sugars, starch, and lignocellulosic materials) or renewable hydrogen and CO2 [15].
Therefore, a combination of advanced biofuel technology and highly efficient engines will be necessary to reduce the carbon footprint of road transportation. However, the quest for high engine efficiencies inevitably means confronting a phenomenon that has long been the Achilles’ heel of spark-ignition engines: knock.
1.1. Engine Knock
Engine knock is a combustion anomaly that is characterized by the autoignition of the fuel-air mixture ahead of the propagating flame [16], giving rise to intense pressure oscillations that can ultimately cause severe engine damage. It is named after the characteristic noise associated with such pressure oscillations. Because it limits the maximum allowable compression ratio, thus impairing the engine’s thermal efficiency [17], it is and has been a hurdle in the development of spark-ignition engines since their inception [18]. Furthermore, due to the more demanding operating conditions brought about by modern engine technologies such as downsizing and high boosting, as well as stoichiometric operation over the entire speed-load range, the possibility of knock occurring becomes even more important, since it can preclude the achievement of the desired performance targets.
Knock is closely related to the autoignition properties of a fuel, which, in turn, are connected to the fuel’s ignition delay characteristics [19]. Knock-resistant fuels tend to exhibit long ignition delays [20,21]. In other words, there is a strong relationship between the magnitude of the ignition delay period and the fuel’s knock resistance. The presence of fuel-bound oxygen, through the addition of an oxygen-containing substance—an oxygenate—to the base gasoline has the potential to significantly decrease the fuel’s reactivity and suppress autoignition, thus increasing the ignition delay period and inhibiting the occurrence of knock [22]. Moreover, this knock-suppressing mechanism is usually more pronounced at regimes of low temperature, characteristic of the beginning of the ignition process [23,24,25,26,27].
Among gasoline oxygenates, ethanol is of particular relevance due to the fact that it can easily be biologically produced from a wide range of sugary or starchy feedstocks by a variety of techniques [28]. Another example of a relatively common oxygenate is methyl tert-butyl ether (MTBE), though its widespread use has diminished somewhat due to its role in groundwater contamination [29].
There are, however, several oxygenate alternatives to ethanol and MTBE that are considered promising and worth investigating; for instance, the other lower alcohols (methanol, isopropanol, n-butanol and isobutanol) and a number of glycerol derivatives, such as glycerol tertiary butyl ethers (GTBEs), solketal, and triacetin.
1.2. C1–C4 Alcohols
Compared to conventional gasolines, the C1–C4 alcohols (that is, methanol, ethanol, and the isomers of propanol and butanol) exhibit properties that make them particularly suitable to be used as spark–ignition engine fuels, such as higher heat of vaporization and superior knock resistance [30]. The enhanced cooling effect caused by their high heat of vaporizations can increase an engine’s volumetric efficiency, while the enhanced knock resistance enables the use of higher compression ratios, thus increasing engine efficiency.
In addition, the possibility of producing the C1–C4 alcohols from renewable feedstocks and using them as drop-in gasoline oxygenates is another attractive feature, allowing them to be used in the transportation sector as promising alternatives to fossil fuels.
A brief introduction to each of the alcohols used in this work follows, addressing their production routes and use as fuels for IC engines.
Methanol was historically produced as part of the mixture of substances obtained from the destructive distillation (i.e., pyrolysis) of wood and it was not until 1923 that an industrial process was developed to produce it from synthesis gas [31]. Therefore, methanol can be obtained from virtually any carbon source, fossil or renewable, via gasification to syngas and the subsequent catalytic synthesis. In recent years, there has been much discussion on the production of renewable methanol through the so-called catalytic regenerative conversion of carbon dioxide with hydrogen. In this process, CO2 from natural and industrial sources, or even from the air itself, reacts with hydrogen, preferably obtained from water electrolysis using electricity from renewable sources, such as solar, wind, and geothermal [32]. The literature on methanol fuel is extensive; however, comprehensive reviews on its production and use as a fuel for IC engines can be found in the works of Landälv [33] and Verhelst et al. [34].
First-generation ethanol is one of the most common and abundant biofuels [35] and it is typically obtained by the fermentation of sugar or starch. As a fuel, it has first been put into large-scale use in Brazil, where both neat hydrous ethanol and ethanol blends with gasoline are marketed. It is also a well-established gasoline blend component in the United States, as well as in other countries [36]. Second-generation bioethanol, on the other hand, is achieved through the fermentation of non-food, lignocellulosic biomass, including forest and agricultural residues or municipal solid waste [37,38]. The literature on ethanol fuel is vast; a good review on the topic is found in the 2022 article by Mendiburu et al. [39].
Isopropanol (2-propanol), the simplest secondary alcohol, is commonly used as an industrial solvent, as an antiseptic, and as a chemical intermediate [40]. Even though it is typically synthesized from fossil routes, it can also be obtained using engineered microorganisms such as Clostridium beijerinckii, Escherichia coli, and Corynebacterium glutamicum [41,42,43,44,45]. As a fuel, it exhibits very good knock resistance and also a slightly higher heating value, relative to ethanol. However, compared to other C1–C4 alcohols, biochemical synthesis routes for isopropanol are less developed. Indeed, the state of the technology to produce it from biomass has prevented it from receiving much attention as a potential engine fuel and is likely the primary technical barrier to its use as a gasoline oxygenate [9,46]. Nevertheless, a few recent engine studies on the use of gasoline-isopropanol blends can be found in the literature; for instance, the articles by Sivasubramanian et al. [47] and Kumar et al. [48].
n-Butanol (1-butanol) and isobutanol (2-methyl-1-propanol) are the butanol isomers most commonly considered for fuel applications. Both are mainly used as industrial solvents and are typically produced from fossil sources, though they can also be obtained from renewable feedstocks [49]. Before the petrochemical routes became economically competitive, n-butanol was traditionally produced by the so-called ABE (acetone, butanol, ethanol) fermentation using the bacterium Clostridium acetobutylicum, among others [49].
Isobutanol, in particular, has been touted as a feasible alternative to ethanol as a gasoline oxygenate, primarily due to its good octane-boosting capacity and its higher heating value. In addition, it exhibits lower water affinity, lower corrosiveness, and lower impact on the fuel’s vapor pressure (see discussion in following paragraph). Moreover, recent advances in biotechnology have increased the efficiency of isobutanol production through biochemical routes, using microorganisms such as Escherichia coli and Saccharomyces cerevisiae, among others, which can make it more economically feasible. A review of isobutanol as a fuel for IC engines was recently published by the authors [50].
The use of alcohols in blends with gasoline involves some practical aspects that must be considered. Alcohols tend to be corrosive, especially the ones with shorter molecules [51], which can damage fuel system components. The corrosiveness of methanol is particularly well-documented [52]. An alcohol’s water affinity can restrict its transportation in pipelines, due to the risk of corrosion and also due to the possibility of water-induced phase separation of gasoline–alcohol blends [53]. Finally, alcohols can distort the vapor pressure behavior and the distillation properties of their blends with gasoline, which can have a negative impact on the evaporative emissions, engine cold start, and drivability [54,55,56].
1.3. Glycerol Derivatives
In addition to alcohols, glycerol-derived compounds also have the potential for fuel applications as additives to diesel fuel or gasoline. Ideally, such compounds should be produced using the by-product glycerol generated by the biodiesel (FAME, fatty acid methyl esters) industry in order to valorize a substance that is considered waste and is typically disposed of as such.
In this work, the glycerol derivatives considered are the glycerol tert-butyl ethers (GTBEs), solketal, and triacetin.
GTBE is the product of the etherification of glycerol with a tert-butylating agent, usually tert-butanol or isobutylene. It exists as three different components, depending on the number of hydroxyl groups (OH) in the glycerol molecule that were substituted with tert-butyl groups. Those components are called mono-GTBE, di-GTBE, and tri-GTBE, though they can be simply referred to collectively as ‘GTBE’. The relative amounts of any of the three components produced depend on the conditions of the etherification reaction [57]. Tri-GTBE, because it consumes the largest amount of reactants, is the most expensive to produce. Therefore, in practice, the conditions controlling the reaction are often adjusted to drive its selectivity towards mono- and di-GTBE. A 2020 patent by Versteeg et al. [58] describes, in detail, the production of such ‘mono-shifted’ and ‘di-shifted’ GTBE mixtures (i.e., mono-GTBE-rich and di-GTBE-rich, respectively) for use as gasoline octane boosters. As such, GTBE can be considered an environmentally friendly alternative to methyl tert-butyl ether (MTBE), which has been phased out in many places [59]. Indeed, GTBE has been shown to be effective in increasing the octane rating of gasolines, confirming its suitability to be used as gasoline additives [60]. As an example, a recent study by Samoilov et al. [61] investigated several glycerol derivatives and found that di-GTBE was the most effective compound, exhibiting superior octane-boosting performance when compared to the usual gasoline oxygenates ethanol and MTBE.
When glycerol is reacted with a ketone, the reaction is commonly called ketalization, and the product is called a ketal. A typical example is the reaction of glycerol with acetone, yielding solketal, a chemical that can be used as a biodiesel additive or as a gasoline oxygenate [57]. As an example of the latter, the effect of the addition of solketal to gasoline was investigated by Alptekin and Canakci, in their 2017 article [62]. For their experiments, a blend of 9 vol.% solketal in gasoline was prepared and compared to neat fossil gasoline. They observed that the addition of solketal caused a slight increase in the octane number (RON) of the base gasoline while fulfilling the requirements of the EN 228 fuel standard [63].
Another way of producing glycerol-derived additives is to react it with carboxylic acids to form esters. For fuel additive applications, a possible conversion pathway is the esterification of glycerol with acetic acid or acetic anhydride to yield glycerol acetates (also called acetins). Triacetylglycerol, also known as triacetin, is suited as a fuel additive, usually as biodiesel cold flow improver or gasoline octane booster. A 2016 patent by Puche [64] describes a process for producing triacetin to be used in both applications.
A review study on the use of glycerol-derived compounds as fuel additives was recently published by the authors [57].
1.4. Article Outline
As described in this Introduction, the scope of the present work is quite large, including ten different compounds, for a total of sixteen test blends, as explained further below. Even though the literature contains studies on the individual types of chemical compounds to be used as gasoline oxygenates (e.g., alcohols, glycerol ethers, etc.), a direct experimental comparison of a variety of compounds, carried out on the same engine, as is the case in this work, was found to be lacking. Therefore, the goal of the present study is to provide such a comparison. To that end, the oxygenated compounds, including alcohols and glycerol derivatives, were individually blended with a gasoline surrogate and tested on a Waukesha CFR (Cooperative Fuel Research) engine to evaluate their combustion characteristics and knock resistance. Most, but not all, compounds were mixed with the surrogate in two concentrations and tested on the engine through performing spark-timing sweeps at two different compression ratios. All tests were done in stoichiometric conditions, at a single speed, with a constant intake air temperature. Focusing on one single spark timing, the results were then analyzed and discussed, with the help of some statistical concepts to characterize the occurrence and intensity of knock. Finally, in the Conclusions section, a general assessment is presented, along with suggestions for subsequent studies.
2. Materials and Methods
2.1. Engine and Instrumentation
The engine used throughout the tests was a modified Waukesha CFR F-1/F-2 test unit. This naturally aspirated, throttle-less single-cylinder engine features a variable compression ratio and is the de facto standard measurement device used for the octane rating of SI fuels according to the ASTM D 2699 and D 2700 standard test methods, corresponding to the research octane number (RON) and motor octane number (MON) methods, respectively [65,66].
The CFR engine features design characteristics that are considered odd by modern standards, such as a flat piston top, a nearly cylindrical combustion chamber, and a side-mounted spark plug. As a result of that, the CFR engine tends to produce knock at much lower compression ratios when compared to a modern engine running on the same fuel [67], which is not surprising, since its primary function is to evaluate the knock resistance of SI fuels. In other words, the CFR engine is designed for knocking operation.
Some of the CFR engine’s specifications are shown in Table 1 and Figure 1 shows a schematic of the engine in the test cell.

Table 1.
Basic specifications of the engine [68].
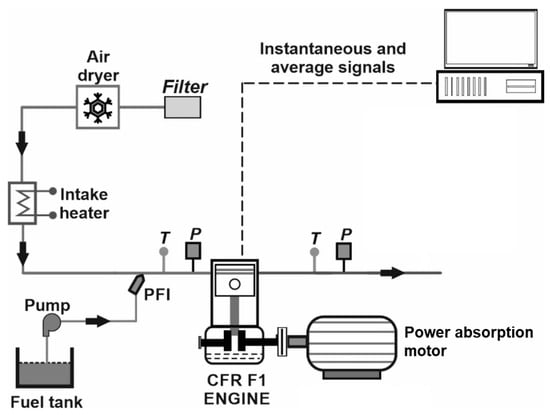
Figure 1.
Schematic of the CFR engine setup. (T: temperature; P: pressure; PFI: port fuel injection).
For the tests described in this study, some of the engine’s original systems remained the same, including the intake air refrigeration unit, which provides filtered and dehumidified combustion air, as well as the cylinder jacket cooling system.
The main modification made on the engine was the removal of the original four-bowl carburetor assembly and the installation of four electronically controlled Bosch 0280150712 (Bosch, Gerlingen, Germany) fuel injectors installed in the engine’s intake runner. In addition, the original power absorption electric motor was substituted with a Lönne 14BG 206-2AA60-Z motor (Lönne, Kaunas, Lithuania), which was used to start the engine, absorb the power output of the engine and maintain constant engine speed). The modified setup also included a Leister LE 3000 (Leister, Solingen, Germany) intake air heater mounted on the intake manifold. To measure fuel consumption, a Sartorius CPA62025 (Sartorius, Göttingen, Germany) scale was used. The in-cylinder pressure trace was measured with a water-cooled Kistler Type 7061B piezoelectric pressure transducer (Kistler, Winterthur, Switzerland) mounted in the cylinder head and connected to a Kistler Type 5011 change amplifier (Kistler, Winterthur, Switzerland). This transducer was mounted in the same hole normally used by the D-1 Detonation Pickup, the pressure sensor used by the engine in its original configuration. Crankshaft position was measured by a Leine & Linde RSI 503 22990963-06 shaft encoder (Leine & Linde, Strängnäs, Sweden), with a resolution of 1800 pulses per revolution (0.2 crank angle degrees). The relative air–fuel ratio (lambda) was measured by a Bosch UEGO (universal exhaust–gas oxygen) sensor mounted in the exhaust pipe and coupled to an ETAS LA4 Lambda Meter. The engine was controlled, and the several test variables were recorded by a custom-built LabVIEW 2011 program.
The in-cylinder pressure was pegged to the pressure in the intake manifold when the piston was in the bottom dead-center position of the intake stroke. Moreover, the absolute crank position was calibrated based on the peak motoring in-cylinder pressure having an offset of 0.4 crank angle degree before top dead center, within the range recommended by Tunestål [69].
2.2. Heat Release Calculation
Based on the in-cylinder pressure trace, the rate of heat release was evaluated at each engine firing cycle and the results were based on the average value of 1000 firing cycles. The heat release calculations were done according to the single-zone method outlined by Gatowski et al. [70] according to Equation 1 below, assuming the crevice flows to be negligible. In this equation, Q is the gross heat release, θ is the crank-angle degree, γ is the ratio of specific heats, p is cylinder pressure, V is cylinder volume, and QHT is the heat transfer to the cylinder walls. In addition, the working fluid’s temperature and composition were assumed to be uniform.
Heat transfer was calculated from Woschni’s correlation [71] and the heat release from motored cycles was subtracted from the fired heat release to reduce measurement and model errors [72]. The heat transfer model required the determination of the in-cylinder gas temperature at the time of inlet valve closing. This was calculated from the measured intake temperature, which was then corrected with a simple temperature model, taking into account the heating from intake walls and from mixing with hot residuals. A detailed description of the heat release calculations can be found in a study by Truedsson et al. [72], carried out on the same engine.
2.3. Fuels Tested
The fuel matrix was comprised of a pure-hydrocarbon gasoline surrogate plus oxygenated fuel blends; that is, mixtures of that surrogate with several oxygenated compounds, as described below.
The gasoline surrogate, called TPRF (toluene primary reference fuel) in this study, is the non-oxygenated reference fuel in this work. This surrogate, described in a 2014 study by Foong at al. [73], was a blend of 53 vol.% isooctane, 17 vol.% n-heptane, and 30 vol.% toluene, resulting in a RON of around 91 and an H/C ratio of approximately 1.85. Test reproducibility was the main reason for choosing a surrogate, instead of using commercial gasoline.
Some select properties of the TPRF blend are shown in Table 2.

Table 2.
Select properties of the TPRF blend used in this work.
The oxygenated compounds that were blended with the surrogate consisted of a number of glycerol derivatives and C1–C4 alcohols, except for the less common C3 and C4 isomers, e.g., n-propanol, sec-butanol, and tert-butanol.
The oxygenated reference fuels, to which the oxygenated blends were compared were mixtures of TPRF with ethanol, at 10 and 20 vol.% blending ratios, referred to as EtOH10.0 and EtOH20.0, respectively. The rationale for choosing these blending amounts is that E10 and E20 (gasolines containing 10 and 20 vol.% ethanol, respectively) are relatively common in several countries. Those blends contained 3.7 and 7.4 wt.% oxygen, respectively, and all other oxygenated blends in this study were prepared by blending the various oxygenates with TPRF in the amounts necessary to achieve those fuel oxygen levels. However, three compounds could not be mixed at the 7.4% oxygen level: triacetin, due to miscibility issues, and the two GTBE mixes, due to the excessive viscosity of the final blends.
The oxygenated compounds are listed in Table 3. The numbers in the blend names indicate the amounts of the compounds, in vol.%, that were blended with TPRF to achieve the desired oxygen contents. It should be noted that the RON values of the neat glycerol derivatives are not listed because their octane testing is not usually performed, due to their low volatility and/or high viscosity.

Table 3.
Select properties of the oxygenates used in this work.
2.4. Test Procedure
The calibration of the compression ratio was done according to the procedure described in the engine’s documentation [68].
The evaluation of the fuel blends in this work was carried out at the constant engine speed of 600 rpm and at an intake air temperature (IAT) of 52 °C, as prescribed by the ASTM RON test protocol [65]. At those conditions, spark timing sweeps were then performed at the compression ratios of 6:5 and 7:5. The three spark timings were chosen so that the intermediate ignition timing produced a 50% mass fraction burn angle (CA50) around 8° ATC. Subsequently, based on that intermediate spark timing, one timing 6° earlier and another one 6° later were also tested. Spark timing was changed manually by rotating the ignition timer’s shaft until the desired timing was displayed on the engine’s digital timing and tachometer indicator, installed on the unit’s instrument panel.
The higher compression ratio (7.5:1) was determined based on the knock intensity obtained by running the engine on the gasoline surrogate (i.e., the least knock-resistant fuel) at the earliest timing, so that the knocking would not be excessive. The lower compression ratio (6.5:1) was then arbitrarily chosen as being one unit below the higher one.
Table 4 shows the selected compression ratio and spark timings.

Table 4.
The chosen compression ratios and spark timings used in the tests.
Because engine knock is essentially an acoustic phenomenon, the resulting resonant vibration modes of the combustion chamber are a function of cylinder geometry and gas properties [75,76,77]. Therefore, the in-cylinder pressure signal has to be filtered to remove the unnecessary frequencies, leaving only the frequencies associated with those relevant vibration modes. Therefore, the in-cylinder pressure signal was band-pass filtered using a Butterworth filter implemented in the LabVIEW code. In this study, the frequencies of interest were the ones associated with the so-called first circumferential mode, which has been described in the literature as being around 5.8–6.9 kHz for the CFR engine [75,76] [78,79]. This mode is particularly important since it contains most of the energy of the knocking vibrations [80]. Accordingly, the in-cylinder pressure signal was filtered with a 10th-order Butterworth filter with cut-off frequencies of 4 and 8 kHz (i.e., centered at the critical frequency of 6 kHz). According to a study by Swarts et al. [79], filters with high orders give better transient response and remove the bulk cylinder pressure.
The so-called absolute value of the maximum amplitude of pressure oscillations (MAPO) was the metric chosen to characterize knock intensity. It is defined at the maximum amplitude of the filtered in-cylinder pressure [17,81,82,83]. Figure 2 illustrates how MAPO is defined.
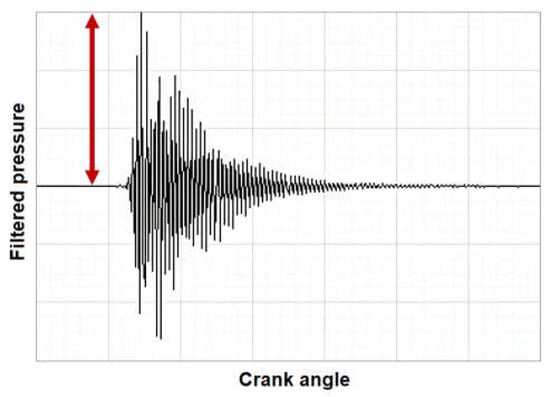
Figure 2.
A graphical description of MAPO, as indicated by the arrow.
Moreover, the MAPO was logged for each engine cycle, and it was calculated in the crank angle range from 10° BTC to 70° ATC to avoid interference from ignition noise and/or valve closing events [79].
At each operating condition, after stabilizing the engine for about ten minutes, indicated data corresponding to a total of 1000 consecutive firing engine cycles were logged for each experimental point in order to improve any subsequent statistical analysis of the knock intensity [84]. During that time, 70 low-speed, time-based measurements were also logged. In addition, motoring cycles were also sampled at both compression ratios, to be used in the heat-release calculation, as explained further below.
3. Results and Discussion
This section presents the overall results obtained with the different fuel blends throughout the test campaign. The combustion analysis, based on the heat release data, shows the impacts of fuel composition on the combustion process and the corresponding performance characteristics of the engine. Subsequently, the important issue of how the fuel oxygenates affect engine knock is introduced and discussed.
3.1. Choice of Engine Parameters
In this section, the main experimental results are presented and discussed. Due to the large amount of data that were produced and due to space limitations, only a part of all results, corresponding to just one spark timing and one compression ratio, is considered. The choice of these two engine parameters was based on the combustion phasing and the corresponding engine efficiency obtained with the gasoline surrogate (TPRF) baseline fuel. The chosen spark timing was determined based on the peak thermal efficiencies, as the following plots show. The plots below show how the spark timings and the compression ratios affected engine performance, as represented by the CA50 angle, the indicated thermal efficiency (ITE), and the indicated mean effective pressure. For the indicated results, the error bars in the plots represent the standard deviation of the measured values corresponding to 1000 engine cycles.
Figure 3 shows that the middle spark timings, at the compression ratios used in this study, gave CA50 angles of around 8° ATC. Moreover, as shown in Figure 4, these ‘middle timings’ resulted in improved thermal efficiencies. In addition, as expected, the compression ratio of 7.5 resulted in slightly higher thermal efficiencies, when compared to the compression ratio of 6.5.
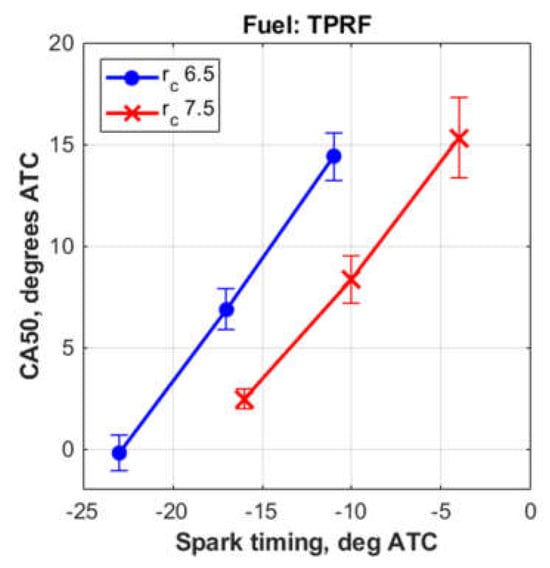
Figure 3.
CA50 angles obtained with the TPRF blend.
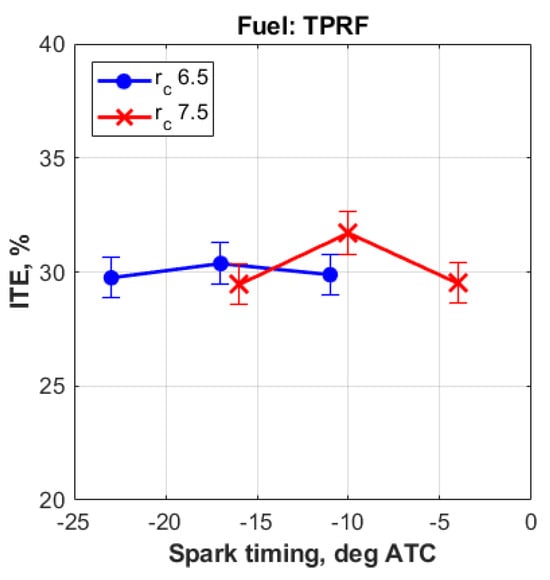
Figure 4.
Indicated thermal efficiencies obtained with the TPRF blend.
Finally, Figure 5 shows that the maximum loads (expressed as IMEP, indicated mean effective pressure), achieved with the surrogate fuel at both compression ratios were slightly above 8 bar.
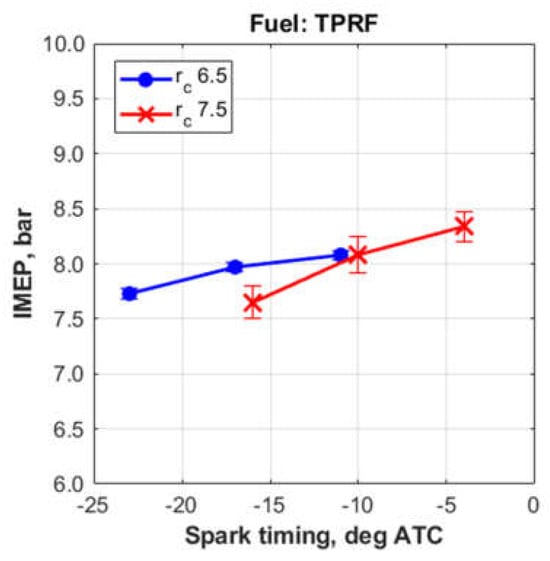
Figure 5.
Indicated mean effective pressures obtained with the TPRF blend.
At this point, it is also worth discussing how the IMEP varied among all tested fuel blends, as Figure 6 shows. (The black color means that the TPRF blend does not contain any oxygen). It can be seen that the blends produced roughly the same output of 8 bar IMEP, indicating the absence of significant differences in the heating values of the blends. Indeed, the average lower heating value for the 3.7%-oxygen blends was 41.3 MJ/kg, whereas the 7.4%-oxygen blends had a mean value of 39.6 MJ/kg.
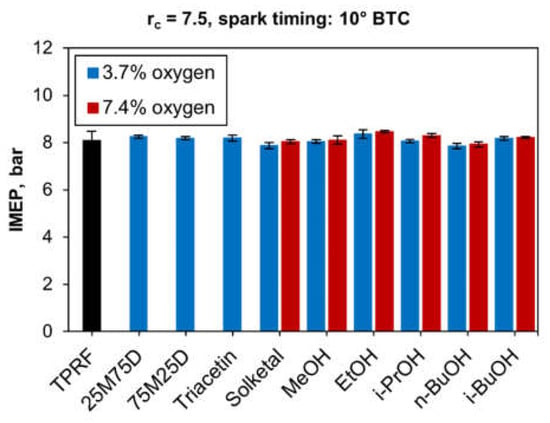
Figure 6.
Indicated mean effective pressures for all the tested blends.
Therefore, based on these data, the compression ratio of 7.5, together with the spark timing of 10° BTC, were chosen to represent the experimental results for the remainder of this study.
Furthermore, due to the large number of fuel blends tested (16 in total), the results are divided into three parts, based on oxygen content, keeping in mind that the number in each compound’s name represents the vol% amount of that compound that was mixed with the gasoline surrogate.
- 3.7 wt.% oxygen part I: Includes the reference blends TPRF and EtOH10.0, plus the glycerol derivatives:
- TPRF
- EtOH10.0
- 25M75D11.7
- 75M25D9.5
- Solketal7.3
- Triacetin5.5
- 2.
- 3.7 wt.% oxygen part II: Includes the reference blends TPRF and EtOH10.0, plus the other alcohols:
- TPRF
- EtOH10.0
- MeOH7.0
- i-PrOH13.0
- n-BuOH16.0
- i-BuOH16.0
- 3.
- 7.4 wt.% oxygen: Includes the alcohols plus solketal (the only glycerol derivative that could be blended at that oxygen level). The EtOH20.0 blend is the only reference fuel in this part:
- EtOH20.0
- MeOH14.0
- i-PrOH26.0
- n-BuOH32.0
- i-BuOH32.0
- Solketal14.6
3.2. Combustion Characteristics
In this section, the characteristics of the combustion process of the different fuel blends that can influence knock onset and intensity are presented and discussed.
3.2.1. Combustion Phasing
The 50% fuel mass burn angles (CA50) for the tested fuel blends are shown in Figure 7 below. It can be noticed that the addition of any of the oxygenated compounds to the TPRF blend extended the 50% burn angles, suggesting relatively slower combustion rates with the oxygenated blends.
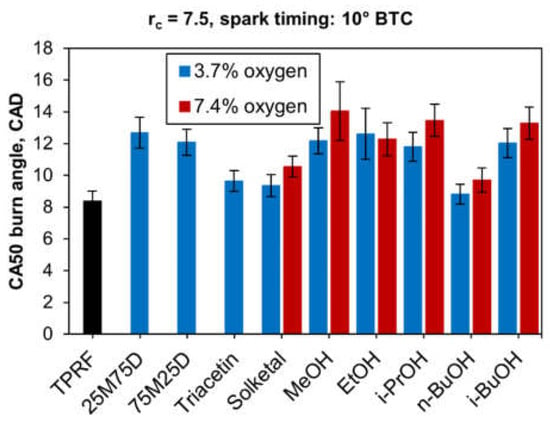
Figure 7.
50% burn angles for all blends.
3.2.2. Heat-Release Rates
The plots that follow show the impact of the oxygenates on the heat-release behavior of the fuel blends. The first two plots, Figure 8 and Figure 9, show the glycerol derivatives and the alcohols, respectively, comprising the blends of ‘low’ (3.7 wt.%) oxygen content, in addition to the ‘neat’ TPRF as reference fuel. The third plot, Figure 10, displays the ‘high’ oxygen (7.4 wt.%) blends. In this particular case, the blend containing 20 vol.% ethanol (EtOH20.0) is used as reference. For ease of comparison, all plots have the same y-axis scale.
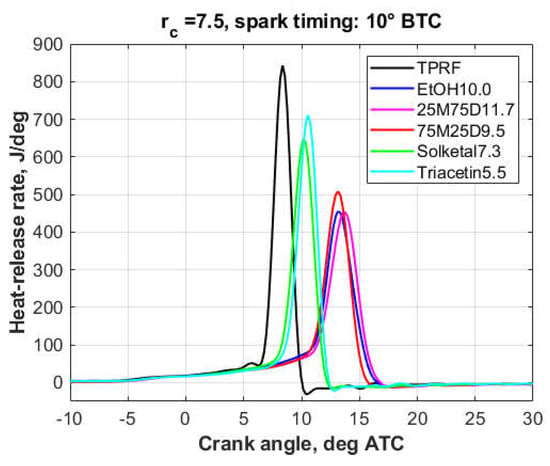
Figure 8.
Heat-release rates, 3.7 wt.% oxygen blends, Part I.
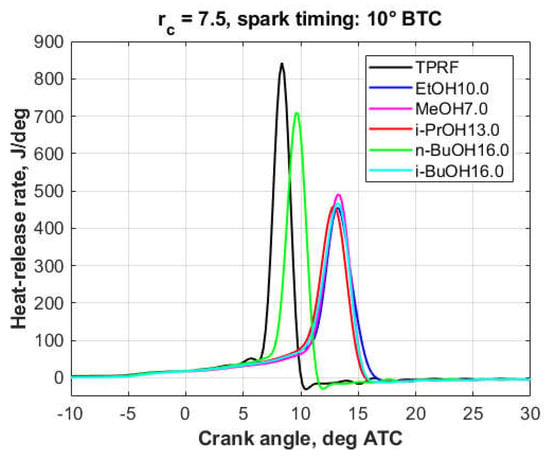
Figure 9.
Heat-release rates, 3.7 wt.% oxygen, Part II.
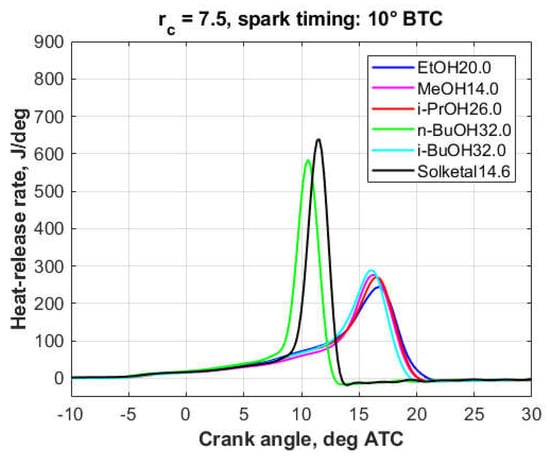
Figure 10.
Heat-release rates, 7.4 wt.% oxygen.
As it will be discussed in more detail in Section 3.3, the engine was knocking to some extent in the case of all 3.7%-oxygen blends, though knock was more intense with the TPRF, Triacetin5.5, and Solketal7.3 blends. At the 7.4% oxygen level, except for the Solketal14.6 and n-BuOH32.0 blends, engine operation was essentially knock-free.
At the 3.7% oxygen level (Figure 8 and Figure 9), the oxygenated blends both delayed the combustion process and decreased the peak heat-release rates. However, this effect was less pronounced with the triacetin, solketal, and n-butanol blends, a fact reflected in their knock behavior. At the 7.4% oxygen level (Figure 10), compared to the other fuels, the solketal and n-butanol blends exhibited a much shorter combustion development, together with a higher and sharper heat-release peak, which is consistent with their inferior knock performance.
This behavior is in line with the results from a 2018 article by Hoth et al. [85], in which they found that the MAPO intensity correlated well with the peak heat-release rate and the rate of heat release after the onset of autoignition leading to knock. They also observed that the addition of ethanol to the base fuel reduced both MAPO and the heat-release rate after knock onset. Similar conclusions were drawn by Rockstroh et al. in their 2018 article [83], in which they found a correlation between MAPO and the heat-release rate after knock onset.
In summary, the heat-release patterns displayed in these plots are closely related to the knock behavior of the fuel blends, as described in the next section of this article.
3.3. Knock Characterization
This section briefly describes some important features of engine knock and the means to characterize its occurrence and intensity. Subsequently, the knock-related experimental results are presented and analyzed using the methods introduced in the next paragraphs. At this point, it is worth mentioning that the criterion used to define knock occurrence can be rather arbitrary. In this work, a firing engine cycle was considered to be knocking if its measured MAPO value exceeded 1.0 bar, a commonly used threshold. However, any cycle will have some MAPO value associated with it, ranging from background noise to heavy knock. Moreover, the occurrence of one single cycle having a MAPO above the chosen threshold does not necessarily mean that the engine is knocking—hence, the usefulness of the statistical approach described below. That being said, it should be kept in mind that the choice of the threshold value can have an influence on how the results as a whole are interpreted, as illustrated in the following paragraph.
It has been long known that the combustion process in spark-ignition engines exhibits relatively large cycle-to-cycle variations [86,87], even at constant speed and load conditions. The existence of knock only complicates the situation even further. As a typical example, Figure 11 shows the knock intensity, expressed as MAPO, for 1000 consecutive measured engine cycles under knocking conditions. In this particular case, the engine was running on the TPRF surrogate, at the compression ratio of 7.5 and a spark timing of 10° BTC., in which conditions 96.7% of the cycles were knocking (i.e their measured MAPO values were above 1.0 bar).
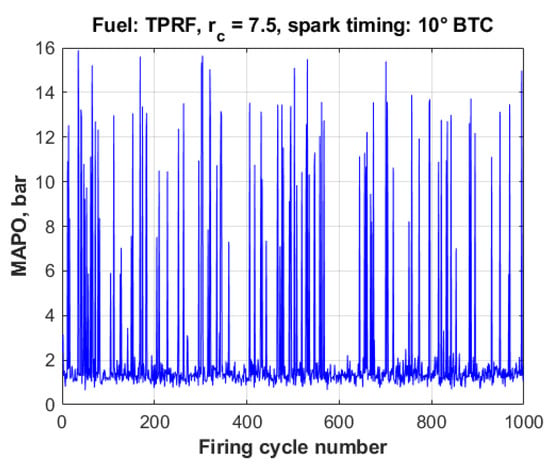
Figure 11.
Cycle-to-cycle variations in knock intensity, TPRF, rc = 7.5, spark timing: 10° BTC.
The stochastic nature of such large cyclic variations requires statistical analysis [88]. Indeed, the characterization of the magnitude of knock can be effectively described as a statistical distribution of its intensity values measured over a sufficiently large number of cycles and calculated at each individual firing cycle. Therefore, the experimental knock data were processed and characterized using a few basic statistical techniques, as described in this section.
Histograms are a useful tool to visualize and characterize random data, a good example of which is the representation of engine knock intensity [17]. The histograms shown in Figure 12 illustrate the general features of typical knock events; in this case, caused by variations in fuel quality. Those histograms show the distributions of the measured MAPO values for the ‘neat’ TPRF and the 10 vol.% and 20 vol.% ethanol blends, at the compression ratio of 7.5 and the spark timing of 10° BTC. A few things can be inferred from those histograms. First, it is evident that the presence of ethanol significantly inhibits the occurrence and the intensity of knock, especially at the 7.4 wt.% fuel oxygen level (i.e., blend EtOH20.0). Secondly, all three distributions are skewed to the right, towards higher MAPO values, suggesting the existence of knock events of comparatively higher magnitude, though at much lower frequencies in the case of the oxygenated blends. Thirdly, the spread of knock intensity decreases with decreasing MAPO values.
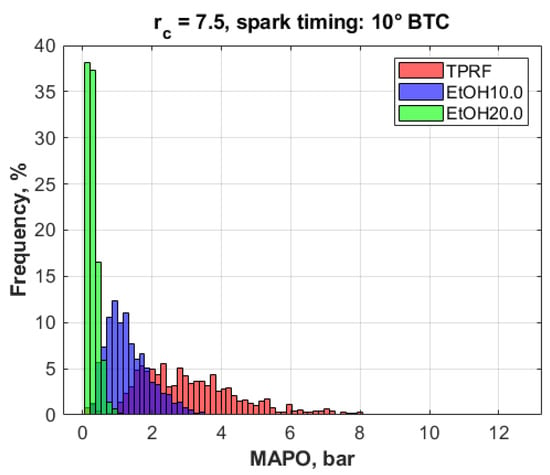
Figure 12.
Knock intensity (MAPO) distributions, rc = 7.5, spark timing 10° BTC.
Those histograms can be further described by calculating some relevant statistics pertaining to the MAPO distributions of each fuel blend, as shown in Table 5. A fact not shown in the table is that, according to the results of a Shapiro–Wilk test at the 5% significance level, all three datasets in Figure 12 were found to be normally distributed, a fact that can be partly attributed to the central limit theorem of statistics, which states that large enough samples converge to a standard normal distribution.

Table 5.
Knock intensity statistics for the fuel blends described in Figure 12.
As Figure 12 shows, the increase in knock resistance, brought about by the addition of ethanol to the fuel, causes significant decreases in the mean MAPO values. Moreover, the spread of the distributions, represented by their standard deviations, decreases with increasing ethanol content. Finally, the statistical concepts of skewness and kurtosis can be useful in characterizing the shape of the MAPO distributions [89]. Skewness is a measure of the asymmetry of the shape of the distribution, while kurtosis is a measure of the ‘peakedness’ of the distribution relative to the length and size of its tails [90,91,92]; in other words, it can be interpreted a measure of the prevalence and influence of outliers. These two statistics can also be used to help assess departures from normality in a distribution. (The skewness and the kurtosis of a normal distribution are 0 and 3, respectively).
All three fuel blends exhibited positive skewness values, implying that their MAPO distributions were skewed to the right, that is, towards higher knock intensities, as is usually the case. In comparison to the TPRF and the EtOH20.0 blends, the EtOH10.0 blend had a lower skewness associated with it, implying a more symmetric distribution. Moreover, that blend, when compared to the other two cases, produced a MAPO distribution with a lower kurtosis, closer to that of a normal distribution, indicating a less peaked and less ‘tail-heavy’ shape, implying that outliers were not as prevalent and influential as in the other two blends; in other words, a more ‘consistent’ pattern, a fact reflected in the COV (coefficient of variation) of MAPO of the EtOH10.0 blend, the lowest among the three cases.
Cumulative Frequency Distributions
Besides ordinary histograms, empirical cumulative frequency distribution plots are a convenient way of characterizing knock intensity [89]. In such plots, the x-axis represents an appropriate range of MAPO values, while the y-axis shows the proportion (in %) of the measured data points having values less than or equal to a given MAPO. In practice, the more a curve is shifted to the right-hand side, the higher the overall knock intensities. Cumulative frequency distribution plots, thus, provide a good way to distinguish between the knock intensity levels caused by different fuels and different engine operating conditions.
3.4. wt.% Fuel Oxygen Blends
The plots that follow show the cumulative frequency distributions of the MAPO for all fuel blends tested, at the compression ratio of 7.5 and a spark timing of 10° BTC. Each curve was calculated based on a minimum of 1000 engine cycles.
Figure 13 shows the cumulative frequency distributions for the MAPO obtained from the gasoline surrogate (TPRF) and the 10 vol.% ethanol–surrogate blend (EtOH10.0) as baseline, plus the 3.7%-oxygen blends of TPRF with the glycerol derivatives, i.e., Part I of the 3.7% oxygen blends.
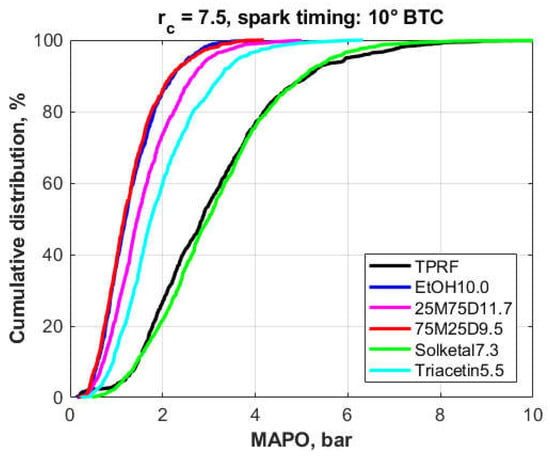
Figure 13.
Cumulative frequency distributions of the MAPO for the fuel blends (3.7% fuel oxygen, Part I).
This figure clearly shows that both the 75M25D9.5 and EtOH10.0 blends produced the best results; that is, they caused the largest decrease in the MAPO levels compared to the reference TPRF blend. Another feature is that their MAPO distributions are nearly colinear. Indeed, a two-sample z-Test at the 5% significance level and a Mann–Whitney U test were performed on those distributions, with both suggesting that there was no statistical difference between them. The 25M75D11.7 and the Triacetin5.5 blends gave intermediate results, with the former causing higher knock inhibition. Finally, the plot demonstrates that the Solketal7.3 blend, when compared to the TPRF, did not seem to cause a significant improvement, if any, in knock resistance.
Among the 3.7% oxygen blends of TPRF with the alcohols, i.e., 3.7% oxygen, Part II (Figure 14), the situation was similar. In this case, the n-butanol-surrogate performed very poorly, showing even MAPO values slightly higher than the ones produced by the TPRF blend, a suspicion confirmed by a two-sample z-Test at the 5% significance level and a Mann–Whitney U test. In contrast, methanol performed the best among the alcohol oxygenates while ethanol, isopropanol and isobutanol also produced significant reductions in knock intensity. The results of both tests suggested that the knock intensities produced by the ethanol and isopropanol blends were slightly different, whereas the isobutanol and isopropanol blends did not produce statistically different results.
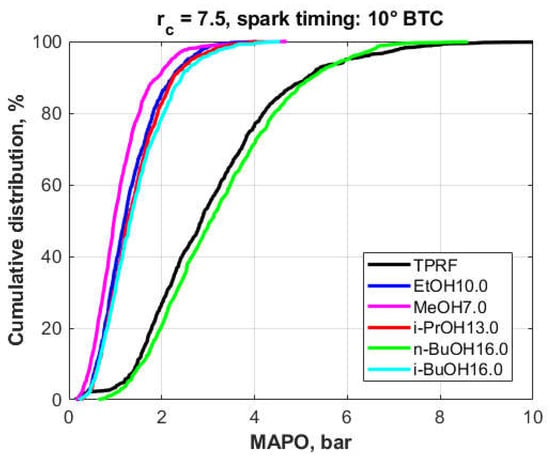
Figure 14.
Cumulative frequency distributions of the MAPO for the fuel blends (3.7% fuel oxygen, Part II).
Table 6 shows the relevant statistics for the MAPO distributions of all tested blends containing 3.7 wt.% oxygen, displayed in ascending order of mean MAPO values. Those statistics show that the fuel producing the highest knock intensities, the n-butanol blend, resulted in the narrowest, most symmetrical MAPO distribution and the one with comparatively fewer outliers, as evidenced by the distribution’s COV of MAPO, skewness, and kurtosis. These numbers suggest that most knock events were roughly evenly distributed over a relatively narrow interval of high MAPO values centered around the mean, hence the COV of MAPO exhibited by that distribution being the lowest among all blends. This behavior also implies that the distribution tended towards symmetry, which resulted in the lowest skewness overall. Finally, it is suggested that a very large fraction of the firing cycles was knocking (as confirmed by the bar plot in Section 3.5) at high intensity, a consistency that left less room for outliers, resulting in a kurtosis value close to 3. On the other hand, the fuel that produced the distribution with lowest MAPO values, the methanol blend, exhibited the highest COV of MAPO, skewness, and kurtosis. The existence of fewer knocking cycles (see bar plot in Section 3.5) implies more randomness, leading to knock events that are more widely distributed around the mean, which helps explain the highest overall COV of MAPO. Also, due to the overall low mean MAPO value, an occasional, more intense knock event would be considered extreme, and it could disproportionately cause the distribution to skew to the right, explaining the relatively high skewness. In addition, the occurrence of such occasional outliers would result in a distribution with heavier tails, hence the higher kurtosis.

Table 6.
Knock intensity statistics for TPRF and the 3.7 wt.% fuel oxygen blends.
3.5. wt.% Fuel Oxygen Blends
In the case of the blends containing 7.4 wt.% fuel oxygen, Figure 15, the reference fuel was the 20 vol.% ethanol-TPRF blend, EtOH20.0. In this case, the n-BuOH32.0 blend produced the worst results, followed by the Solketal14.6 blend. The results obtained with the other compounds were clearly superior and, while their distributions are close to each other, a pattern can be discerned, with the ethanol blend exhibiting the overall best knock-inhibiting behavior.
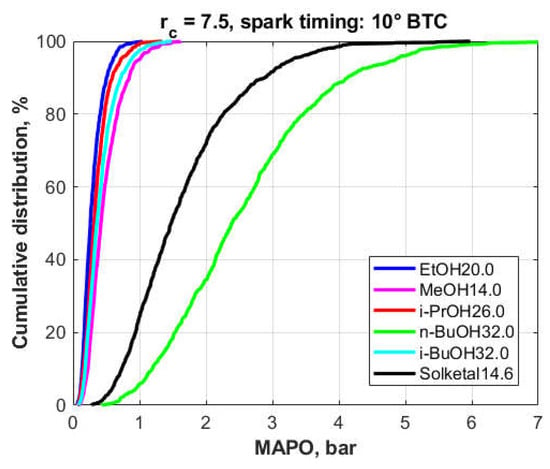
Figure 15.
Cumulative frequency distribution of the MAPO for the different fuel blends (7.4% fuel oxygen).
Table 7 shows the relevant statistics for the MAPO distributions corresponding to the fuel blends shown in Figure 15, i.e., the blends containing 7.4 wt.% oxygen. As in Table 6, the blends are displayed in ascending order of mean MAPO values. Compared to the previous case, similar patterns can be recognized here, but only in the case of the fuel producing the highest knock levels, the n-butanol blend. As Table 7 shows, its MAPO distribution exhibits the lowest values of the COV of MAPO, skewness, and kurtosis, a result likely caused by the existence of higher intensity knock events occurring narrowly about the mean, with relatively fewer outliers. However, the picture is less clear in the case of the blends producing the lowest MAPO levels as they did not seem to follow the same trends displayed in the previous table. The ethanol blend resulted in the lowest mean MAPO, while it was the isopropanol blend that exhibited the highest skewness and kurtosis. Part of the explanation most likely lies in the fact that, as previously stated, the results of a two-sample Z-test showed that the MAPO characteristics of these two blends were not significantly different at the 5% significance level. Moreover, in the case of such low mean MAPO values, corresponding essentially to knock-free operation, the distributions tend to be more random in nature.

Table 7.
Knock intensity statistics for the 7.4 wt.% fuel oxygen blends.
Being a stochastic phenomenon, engine knock is more properly characterized by methods that take into account the variability and randomness of its occurrence. Statistical plots such as histograms and cumulative frequency distributions are very useful in describing knock. However, a simple metric such as the mean MAPO, representing an aggregate value of many firing cycles, can provide a quick and convenient quantitative measure of knock intensity. Bar plots displaying mean MAPO values can, therefore, be effective in illustrating the overall knock-inhibiting performance of different fuels, as is the case in Figure 16, which shows the mean MAPO values for all blends tested. This plot confirms the fact that both the ethanol and the 75M25D blends exhibit essentially the same knock behavior, as discussed above.
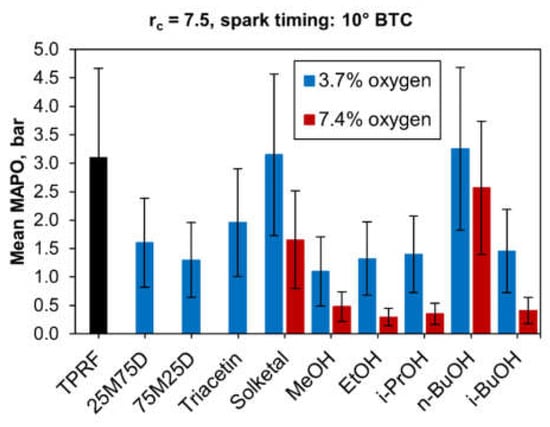
Figure 16.
Mean values of knock intensities (MAPO).
Moreover, Figure 16 illustrates the poor performance of solketal and n-butanol in improving the TPRF’s knock resistance, particularly at the 3.7 wt.% oxygen level. At that level, the blends achieved with those compounds seemed to produce even slightly higher mean MAPO values, compared to the TPRF fuel, though the variability in the data was significant, as displayed by the large error bars.
In addition to increases in mean MAPO, another characteristic that demonstrates the presence of knock is an increasing ratio of knocking cycles to the total number of firing cycles measured. As stated above, in this work, a knocking cycle is defined as one whose measured MAPO was above 1 bar. Figure 17 shows the knocking-cycle fractions of all blends tested, at a compression ratio of 7.5 and a spark timing of 10° BTC. This plot shows the exact same trends displayed in Figure 16, where both the EtOH10.0 and the 75M25D9.5 blends exhibited essentially the same knock behavior while the Solketal7.3 and the n-BuOH16.0 performed very poorly. The low knock-inhibiting capacity of solketal and n-butanol is also evident among the 7.4 wt.% fuel oxygen level, as their blends produced the worst results. On the other hand, the high-concentration blends containing ethanol and isopropanol gave excellent results, followed closely by the isobutanol and methanol blends.
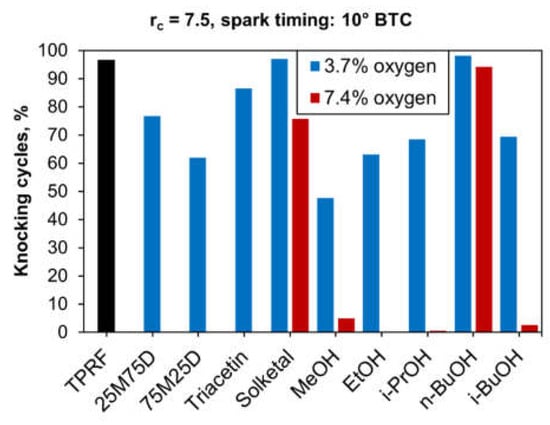
Figure 17.
Fractions of knocking cycles to sampled firing cycles.
As shown in the preceding paragraphs, there was a considerable variability in the knock-inhibiting capacity of the oxygenates tested. The C1–C3 alcohols performed particularly well, while, among the glycerol derivatives, both GTBE types gave the best results. On the other hand, n-butanol and solketal did not seem to produce any significant improvement in knock resistance.
4. Conclusions
This work set out to investigate the suitability of a number of potentially renewable compounds to be used as gasoline oxygenates, as alternatives to ethanol and MTBE. Those compounds comprised glycerol derivatives and C1–C4 alcohols (including ethanol itself as the reference oxygenate). The main focus was on the knock behavior of the fuels. To this end, tests were carried out on a modified spark-ignition Waukesha CFR engine operating at a fixed speed, at different compression ratios and spark timings. A gasoline surrogate containing toluene was used as baseline fuel, along with a blend of that surrogate with 10 vol% ethanol. In addition, blends of the surrogates were prepared so as to match the oxygen content of the reference ethanol blends.
The results showed distinguishable trends in the knock-inhibiting characteristics of the different oxygenates. Among the glycerol derivatives, both GTBE types, when considered together, performed the best, resulting in significant reductions in knock intensity when added to the ‘neat’ TPRF blend. However, GTBE’s relatively high viscosity and low vapor pressure precluded it from being blended with gasoline at higher concentrations. Solketal, while having better miscibility with the TPRF, produced inferior knock-inhibiting capacity.
All alcohols also increased the knock resistance of the base fuel appreciably, the sole exception being n-butanol, likely due to its straight-chain molecular structure. Both methanol and ethanol, in spite of their good performance, exhibit well-known issues like their corrosiveness, affinity for water, and negative impact on the fuel blend’s vapor pressure, as discussed earlier. Therefore, if such non-combustion-related characteristics are taken into consideration, one could say that isopropanol and isobutanol were the best overall performing alcohols.
In summary, the main takeaways from this study can be listed as follows:
- Among the glycerol derivatives, both GTBE mixtures resulted in good knock reduction, while the performance of solketal was inferior;
- Triacetin gave good results, but its miscibility with hydrocarbons can be a problem at higher concentrations and/or cold temperatures;
- Among the alcohols, all performed well, with the notable exception of n-butanol, which gave very poor knock results, likely by virtue of its straight-chain molecular structure;
- Methanol and ethanol, unsurprisingly, exhibited very good knock inhibition performance, but their effect on the volatility of their blends with gasoline can be an issue.
- Isopropanol was also very effective in decreasing knock and its ability to distort the volatility characteristics of the base fuel was lower, compared to methanol and ethanol. However, the technology to produce it feasibly from renewable sources does not seem to be very developed yet;
- Isobutanol exhibited very good knock-inhibiting characteristics, while having a higher energy density and lower water affinity, when compared to the smaller alcohols, due to its molecular structure.
In general terms, glycerol derivatives can possess superior knock-inhibiting capacities, but their miscibility with hydrocarbons may be an issue at higher concentrations and/or lower temperatures. C1–C4 alcohols can also perform very well, but it must be kept in mind that the smallest ones (methanol and ethanol) present issues such as corrosiveness, water miscibility, and blend vapor pressure distortion. In this regard, isobutanol seems very promising among the alcohols. Finally, isopropanol performed well enough to warrant further work, since there are relatively very few studies dedicated to its use as a fuel for internal combustion engines.
However, it should be noted that, while these conclusions appear to be valid and within expectations, they were drawn based on a simple test procedure, without considering the complicating effects of parameters such as boosting or EGR. Moreover, while the CFR engine is the standard device used for the octane rating of fuels, its design exhibits characteristics that are markedly different from the ones found in modern SI engines. Therefore, one obvious suggestion for future work is to further investigate the same oxygenates treated in this study on a state-of-the art SI engine, featuring technologies such as direct injection and turbocharging, among others. Nevertheless, it is hoped that the experiments presented in this work and their conclusions can be valuable in providing fuel-related information, bridging the gap between the CFR and modern production engines.
Author Contributions
Conceptualization, A.L.O.; methodology, A.L.O.; software, A.L.O.; validation, A.L.O., S.V. and M.T.; formal analysis, A.L.O., S.V. and M.T.; investigation, A.L.O.; resources, S.V. and M.T.; data curation, A.L.O.; writing—original draft preparation, A.L.O.; writing—review and editing, S.V. and M.T.; visualization, A.L.O., S.V. and M.T.; supervision, S.V. and M.T.; project administration, S.V.; funding acquisition, S.V. and M.T. All authors have read and agreed to the published version of the manuscript.
Funding
This work was supported by the European Union’s Horizon 2020 Framework Program for Research and Innovation, Grant Agreement No. 818310.
Data Availability Statement
Data are contained within the article.
Conflicts of Interest
The authors declare no conflict of interest.
References
- Kalghatgi, G. Is it really the end of internal combustion engines and petroleum in transport? Appl. Energy 2018, 225, 965–974. [Google Scholar] [CrossRef]
- Leach, F.; Kalghatgi, G.; Stone, R.; Miles, P. The scope for improving the efficiency and environmental impact of internal combustion engines. Transp. Eng. 2020, 1, 100005. [Google Scholar] [CrossRef]
- Reitz, R.D.; Ogawa, H.; Payri, R.; Fansler, T.; Kokjohn, S.; Moriyoshi, Y.; Agarwal, A.K.; Arcoumanis, D.; Assanis, D.; Bae, C.; et al. IJER editorial: The future of the internal combustion engine. Int. J. Engine Res. 2019, 21, 3–10. [Google Scholar] [CrossRef]
- Kalghatgi, G.T. The outlook for fuels for internal combustion engines. Int. J. Engine Res. 2014, 15, 383–398. [Google Scholar] [CrossRef]
- Senecal, P.K.; Leach, F. Diversity in transportation: Why a mix of propulsion technologies is the way forward for the future fleet. Results Eng. 2019, 4, 100060. [Google Scholar] [CrossRef]
- Reitz, R.D. Directions in internal combustion engine research. Combust. Flame 2013, 160, 1–8. [Google Scholar] [CrossRef]
- Turner, J.W.G.; Popplewell, A.; Patel, R.; Johnson, T.R.; Darnton, N.J.; Richardson, S.; Bredda, S.W.; Tudor, R.J.; Bithell, C.I.; Jackson, R.; et al. Ultra Boost for Economy: Extending the Limits of Extreme Engine Downsizing. SAE Int. J. Engines 2014, 7, 387–417. [Google Scholar] [CrossRef]
- Joshi, A. Review of Vehicle Engine Efficiency and Emissions. SAE Int. J. Adv. Curr. Pract. Mobil. 2020, 2, 2479–2507. [Google Scholar] [CrossRef]
- Gaspar, D. Top Ten Blendstocks for Turbocharged Gasoline Engines: Bio-Blendstocks with the Potential to Deliver the Highest Engine Efficiency; PNNL-28713; Pacific Northwest National Laboratory: Richland, WA, USA, 2019. [Google Scholar]
- Larsson, T.; Stenlåås, O.; Erlandsson, A.C. Future Fuels for DISI Engines: A Review on Oxygenated, Liquid Biofuels; SAE Technical Paper 2019-01-0036; SAE International: Warrendale, PA, USA, 2019. [Google Scholar] [CrossRef]
- Malaquias, A.C.T.; Netto, N.A.D.; Filho, F.A.R.; DA Costa, R.B.R.; Langeani, M.; Baêta, J.G.C. The misleading total replacement of internal combustion engines by electric motors and a study of the Brazilian ethanol importance for the sustainable future of mobility: A review. J. Braz. Soc. Mech. Sci. Eng. 2019, 41, 567. [Google Scholar] [CrossRef]
- Duarte Souza Alvarenga Santos, N.D.S.A.; Roso, V.R.; Malaquias, A.C.T.; Baêta, J.G.C. Internal combustion engines and biofuels: Examining why this robust combination should not be ignored for future sustainable transportation. Renew. Sustain. Energy Rev. 2021, 148, 111292. [Google Scholar] [CrossRef]
- Elfasakhany, A. State of Art of Using Biofuels in Spark Ignition Engines. Energies 2021, 14, 779. [Google Scholar] [CrossRef]
- Geissler, C.H.; Ryu, J.; Maravelias, C.T. The future of biofuels in the United States transportation sector. Renew. Sustain. Energy Rev. 2024, 192, 114276. [Google Scholar] [CrossRef]
- Khan, A.; Khan, H.A.; Ravi, S.S.; Turner, J.W.G.; Aziz, M. Potential of clean liquid fuels in decarbonizing transportation—An overlooked net- zero pathway? Renew. Sustain. Energy Rev. 2023, 183, 113483. [Google Scholar] [CrossRef]
- Corrigan, D.J.; Fontanesi, S. Knock: A Century of Research. SAE Int. J. Engines 2021, 15, 57–127. [Google Scholar] [CrossRef]
- Chun, K.M.; Heywood, J.B. Characterization of Knock in a Spark-Ignition Engine. In Proceedings of the International Congress and Exposition, Detroit, MI, USA, 27 February–3 March 1989; p. 890156. [Google Scholar] [CrossRef]
- Wang, Z.; Liu, H.; Reitz, R.D. Knocking combustion in spark-ignition engines. Prog. Energy Combust. Sci. 2017, 61, 78–112. [Google Scholar] [CrossRef]
- Sarathy, S.M.; Osswald, P.; Hansen, N.; KOHSE-Höinghaus, K. Alcohol combustion chemistry. Prog. Energy Combust. Sci. 2014, 44, 40–102. [Google Scholar] [CrossRef]
- Tanaka, S.; Ayala, F.; Keck, J.C.; Heywood, J.B. Two-stage ignition in HCCI combustion and HCCI control by fuels and additives. Combust. Flame 2003, 132, 219–239. [Google Scholar] [CrossRef]
- Bradley, D.; Head, R.A. Engine autoignition: The relationship between octane numbers and autoignition delay times. Combust. Flame 2006, 147, 171–184. [Google Scholar] [CrossRef]
- Boot, M.D.; Tian, M.; Hensen, M.J.M.; Sarathy, S.M. Impact of fuel molecular structure on auto-ignition behavior—Design rules for future high performance gasolines. Prog. Energy Combust. Sci. 2017, 60, 1–25. [Google Scholar] [CrossRef]
- Cheng, S.; Kang, D.; Fridlyand, A.; Goldsborough, S.S.; Saggese, C.; Wagnon, S.W.; Mcnenly, M.J.; Mehl, M.; Pitz, W.J.; Vuilleumier, D. Autoignition behavior of gasoline/ethanol blends at engine-relevant conditions. Combust. Flame 2020, 216, 369–384. [Google Scholar] [CrossRef]
- Goldsborough, S.S.; Cheng, S.; Kang, D.; Saggese, C.; Wagnon, S.W.; Pitz, W.J. Effects of isoalcohol blending with gasoline on autoignition behavior in a rapid compression machine: Isopropanol and isobutanol. Proc. Combust. Inst. 2021, 38, 5655–5664. [Google Scholar] [CrossRef]
- Cheng, S.; Boehman, A.L.; Goldsborough, S.S.; Saggese, C.; Wagnon, S.W.; Pitz, W.J. Experimental and modeling study of C2–C4 alcohol autoignition at intermediate temperature conditions. Proc. Combust. Inst. 2021, 38, 709–717. [Google Scholar] [CrossRef]
- Cheng, S.; Saggese, C.; Kang, D.; Goldsborough, S.S.; Wagnon, S.W.; Kukkadapu, G.; Zhang, K.; Mehl, M.; Pitz, W.J. Autoignition and preliminary heat release of gasoline surrogates and their blends with ethanol at engine-relevant conditions: Experiments and comprehensive kinetic modeling. Combust. Flame 2021, 228, 57–77. [Google Scholar] [CrossRef]
- Singh, E.; Tingas, E.-A.; Goussis, D.; Im, H.G. Chemical Ignition Characteristics of Ethanol Blending with Primary Reference Fuels. Energy Fuels 2019, 33, 10185–10196. [Google Scholar] [CrossRef]
- Dietler, M. Alcohol: Anthropological/Archaeological Perspectives. Annu. Rev. Anthropol. 2006, 35, 229–249. [Google Scholar] [CrossRef]
- Hartley, W.R.; Englande, A.J.; Harrington, D.J. Health risk assessment of groundwater contaminated with methyl tertiary butyl ether (MTBE). Water Sci. Technol. 1999, 39, 305–310. [Google Scholar] [CrossRef]
- Gainey, B.; O’DONNELL, P.; Yan, Z.; Moser, S.; Lawler, B. LTC performance of C1–C4 water-alcohol blends with the same cooling potential. Fuel 2021, 293, 120480. [Google Scholar] [CrossRef]
- Sheldon, D. Methanol Production—A Technical History. Johns. Matthey Technol. Rev. 2017, 61, 172–182. [Google Scholar] [CrossRef]
- Olah, G.A.; Goeppert, A.; Prakash, G.K.S. Chemical Recycling of Carbon Dioxide to Methanol and Dimethyl Ether: From Greenhouse Gas to Renewable, Environmentally Carbon Neutral Fuels and Synthetic Hydrocarbons. J. Org. Chem. 2009, 74, 487–498. [Google Scholar] [CrossRef]
- Landälv, I. Methanol as a Renewable Fuel—A Knowledge Synthesis; Report No 2015:08; The Swedish Knowledge Centre for Renewable Transportation Fuels: Göteborg, Sweden, 2017. [Google Scholar]
- Verhelst, S.; Turner, J.W.G.; Sileghem, L.; Vancoillie, J. Methanol as a fuel for internal combustion engines. Prog. Energy Combust. Sci. 2019, 70, 43–88. [Google Scholar] [CrossRef]
- Kohse-Höinghaus, K.; Osswald, P.; Cool, T.A.; Kasper, T.; Hansen, N.; Qi, F.; Westbrook, C.K.; Westmoreland, P.R. Biofuel Combustion Chemistry: From Ethanol to Biodiesel. Angew. Chem. Int. Ed. 2010, 49, 3572–3597. [Google Scholar] [CrossRef] [PubMed]
- Dabelstein, W.; Reglitzky, A.; Schütze, A.; Reders, K.; Brunner, A. Automotive Fuels. In Ullmann’s Encyclopedia of Industrial Chemistry; Ley, C., Ed.; Wiley-VCH Verlag GmbH & Co. KGaA: Weinheim, Germany, 2016; pp. 1–41. [Google Scholar] [CrossRef]
- Zabed, H.; Sahu, J.N.; Boyce, A.N.; Faruq, G. Fuel ethanol production from lignocellulosic biomass: An overview on feedstocks and technological approaches. Renew. Sustain. Energy Rev. 2016, 66, 751–774. [Google Scholar] [CrossRef]
- Zabed, H.; Sahu, J.N.; Suely, A.; Boyce, A.N.; Faruq, G. Bioethanol production from renewable sources: Current perspectives and technological progress. Renew. Sustain. Energy Rev. 2017, 71, 475–501. [Google Scholar] [CrossRef]
- Mendiburu, A.Z.; Lauermann, C.H.; Hayashi, T.C.; Mariños, D.J.; Rodrigues Da Costa, R.B.; Coronado, C.J.R.; Roberts, J.J.; DE Carvalho, J.A. Ethanol as a renewable biofuel: Combustion characteristics and application in engines. Energy 2022, 257, 124688. [Google Scholar] [CrossRef]
- Klabunde, J.; Bischoff, C.; Papa, A.J. Propanols. In Ullmann’s Encyclopedia of Industrial Chemistry; Ley, C., Ed.; Wiley-VCH Verlag GmbH & Co. KGaA: Weinheim, Germany, 2018; pp. 1–14. [Google Scholar] [CrossRef]
- Dürre, P. New insights and novel developments in clostridial acetone/butanol/isopropanol fermentation. Appl. Microbiol. Biotechnol. 1998, 49, 639–648. [Google Scholar] [CrossRef]
- Koppolu, V.; Vasigala, V.K.R. Role of Escherichia coli in Biofuel Production. Microbiol. Insights 2016, 9, MBI.S10878. [Google Scholar] [CrossRef]
- Ko, Y.J.; Cha, J.; Jeong, W.-Y.; Lee, M.-E.; Cho, B.-H.; Nisha, B.; Jeong, H.J.; Park, S.E.; Han, S.O. Bio-isopropanol production in Corynebacterium glutamicum: Metabolic redesign of synthetic bypasses and two-stage fermentation with gas stripping. Bioresour. Technol. 2022, 354, 127171. [Google Scholar] [CrossRef] [PubMed]
- Inokuma, K.; Liao, J.C.; Okamoto, M.; Hanai, T. Improvement of isopropanol production by metabolically engineered Escherichia coli using gas stripping. J. Biosci. Bioeng. 2010, 110, 696–701. [Google Scholar] [CrossRef]
- Jang, Y.-S.; Malaviya, A.; Lee, J.; Im, J.A.; Lee, S.Y.; Lee, J.; Eom, M.-H.; Cho, J.-H.; Seung, D.Y. Metabolic engineering ofClostridium acetobutylicumfor the enhanced production of isopropanol-butanol-ethanol fuel mixture. Biotechnol. Prog. 2013, 29, 1083–1088. [Google Scholar] [CrossRef]
- Schubert, T. Production routes of advanced renewable C1 to C4 alcohols as biofuel components—A review. Biofuels Bioprod. Biorefining 2020, 14, 845–878. [Google Scholar] [CrossRef]
- Sivasubramanian, H.; Pochareddy, Y.K.; Dhamodaran, G.; Esakkimuthu, G.S. Performance, emission and combustion characteristics of a branched higher mass, C 3 alcohol (isopropanol) blends fuelled medium duty MPFI SI engine. Eng. Sci. Technol. Int. J. 2017, 20, 528–535. [Google Scholar] [CrossRef]
- Kumar, N.; Jain, S.; Bagla, A.; Sharma, S.; Tomar, M. Study of Performance and Emission Characteristics of Propan-2-ol and Gasoline Fuel Blends in an Unmodified Spark Ignition Engine. In Proceedings of the WCX SAE World Congress Experience, Detroit, MI, USA, 9–11 April 2019; p. 2019-01-0793. [Google Scholar] [CrossRef]
- Hahn, H.-D.; Dämbkes, G.; Rupprich, N.; Bahl, H.; Frey, G.D. Butanols. In Ullmann’ s Encyclopedia of Industrial Chemistry; Ley, C., Ed.; Wiley-VCH Verlag GmbH & Co. KGaA: Weinheim, Germany, 2013. [Google Scholar] [CrossRef]
- Olson, A.L.; Tunér, M.; Verhelst, S. A Review of Isobutanol as a Fuel for Internal Combustion Engines. Energies 2023, 16, 7470. [Google Scholar] [CrossRef]
- Kameoka, A.; Nagai, K.; Sugiyama, G.; Seko, T. Effect of Alcohol Fuels on Fuel-Line Materials of Gasoline Vehicles. In Proceedings of the Powertrain & Fluid Systems Conference & Exhibition, San Antonio, TX, USA, 24–27 October 2005; p. 2005-01-3708. [Google Scholar] [CrossRef]
- Kumar, T.S.; Ashok, B. Material compatibility of SI engine components towards corrosive effects on methanol-gasoline blends for flex fuel applications. Mater. Chem. Phys. 2023, 296, 127344. [Google Scholar] [CrossRef]
- Belincanta, J.; Alchorne, J.A.; Teixeira Da Silva, M. The Brazilian experience with ethanol fuel: Aspects of production, use, quality and distribution logistics. Braz. J. Chem. Eng. 2016, 33, 1091–1102. [Google Scholar] [CrossRef]
- Furey, R.L. Volatility Characteristics of Gasoline-Alcohol and Gasoline-Ether Fuel Blends. In Proceedings of the 1985 SAE International Fall Fuels and Lubricants Meeting and Exhibition, Warrendale, PA, USA, 2 November 1985; p. 852116. [Google Scholar] [CrossRef]
- Andersen, V.F.; Anderson, J.E.; Wallington, T.J.; Mueller, S.A.; Nielsen, O.J. Distillation Curves for Alcohol−Gasoline Blends. Energy Fuels 2010, 24, 2683–2691. [Google Scholar] [CrossRef]
- Andersen, V.F.; Anderson, J.E.; Wallington, T.J.; Mueller, S.A.; Nielsen, O.J. Vapor Pressures of Alcohol−Gasoline Blends. Energy Fuels 2010, 24, 3647–3654. [Google Scholar] [CrossRef]
- Olson, A.L.; Tunér, M.; Verhelst, S. A concise review of glycerol derivatives for use as fuel additives. Heliyon 2023, 9, e13041. [Google Scholar] [CrossRef] [PubMed]
- Versteeg, G.F.; Wermink, W.N. GTBE Compositions, Methods and Installations for Enhanced Octane Boosting. U.S. Patent US20200080014A1, 12 March 2020. [Google Scholar]
- Squillace, P.J.; Zogorski, J.S.; Wilber, W.G.; Price, C.V. Preliminary Assessment of the Occurrence and Possible Sources of MTBE in Groundwater in the United States, 1993−1994. Environ. Sci. Technol. 1996, 30, 1721–1730. [Google Scholar] [CrossRef]
- Wessendorf, R. Glycerol derivatives as fuel components. Erdol Kohle Erdgas Petrochem. 1995, 48, 138–143. [Google Scholar]
- Samoilov, V.O.; Borisov, R.S.; Stolonogova, T.I.; Zarezin, D.P.; Maximov, A.L.; Bermeshev, M.V.; Chernysheva, E.A.; Kapustin, V.M. Glycerol to renewable fuel oxygenates. Part II: Gasoline-blending characteristics of glycerol and glycol derivatives with C3-C4 alkyl(idene) substituents. Fuel 2020, 280, 118585. [Google Scholar] [CrossRef]
- Alptekin, E.; Canakci, M. Performance and emission characteristics of solketal-gasoline fuel blend in a vehicle with spark ignition engine. Appl. Therm. Eng. 2017, 124, 504–509. [Google Scholar] [CrossRef]
- BS EN 228:2012+A1:2017; Automotive Fuels—Unleaded Petrol—Requirements and Test Methods. Swedish Institute for Standards: Stockholm, Sweden, 2017.
- Puche, J.D. Procedure to Obtain Biodiesel Fuel with Improved Properties at Low Temperature. Patent WO2016180498A1, 29 December 2009. [Google Scholar]
- ASTM D2699-23a; Test Method for Research Octane Number of Spark-Ignition Engine Fuel. ASTM International: West Conshohocken, PA, USA, 2023. [CrossRef]
- ASTM D2700-16; Test Method for Motor Octane Number of Spark-Ignition Engine Fuel. ASTM International: West Conshohocken, PA, USA, 2022. [CrossRef]
- Swarts, A.; Yates, A.; Viljoen, C.; Coetzer, R. A Further Study of Inconsistencies between Autoignition and Knock Intensity in the CFR Octane Rating Engine. In Proceedings of the 2005 SAE Brasil Fuels & Lubricants Meeting, Rio De Janiero, Brazil, 11–13 May 2005; p. 2005-01-2081. [Google Scholar] [CrossRef]
- Waukesha Engine Dresser, Inc. Waukesha CFR F-1 & F-2 Octane Rating Units Operation & Maintenance, 2nd ed.; Form 847; Waukesha Engine Dresser, Inc.: Waukesha, WI, USA, 2003. [Google Scholar]
- Tunestål, P. TDC Offset Estimation from Motored Cylinder Pressure Data based on Heat Release Shaping. Oil Gas Sci. Technol. Rev. D’ifp Energ. Nouv. 2011, 66, 705–716. [Google Scholar] [CrossRef]
- Gatowski, J.A.; Balles, E.N.; Chun, K.M.; Nelson, F.E.; Ekchian, J.A.; Heywood, J.B. Heat release analysis of engine pressure data. In Proceedings of the 1984 SAE International Fall Fuels and Lubricants Meeting and Exhibition, Baltimore, MD, USA, 8–11 October 1984; p. 841359. [Google Scholar] [CrossRef]
- Woschni, G. A Universally Applicable Equation for the Instantaneous Heat Transfer Coefficient in the Internal Combustion Engine. SAE Tech. Pap. Ser. 1967, 670931. [Google Scholar] [CrossRef]
- Truedsson, I.; Tunér, M.; Johansson, B.; Cannella, W. Pressure Sensitivity of HCCI Auto-Ignition Temperature for Primary Reference Fuels. SAE Int. J. Engines 2012, 5, 1089–1108. [Google Scholar] [CrossRef]
- Foong, T.M.; Morganti, K.J.; Brear, M.J.; DA Silva, G.; Yang, Y.; Dryer, F.L. The octane numbers of ethanol blended with gasoline and its surrogates. Fuel 2014, 115, 727–739. [Google Scholar] [CrossRef]
- Gainey, B.; Lawler, B. The role of alcohol biofuels in advanced combustion: An analysis. Fuel 2021, 283, 118915. [Google Scholar] [CrossRef]
- Draper, C.S. Pressure Waves Accompanying Detonation in the Internal Combustion Engine. J. Aeronaut. Sci. 1938, 5, 219–226. [Google Scholar] [CrossRef]
- Checkel, M.D.; Dale, J.D. Computerized Knock Detection from Engine Pressure Records. In Proceedings of the SAE International Congress and Exposition, Detroit, MI, USA, 24–28 February 1986; p. 860028. [Google Scholar] [CrossRef]
- Scholl, D.; Davis, C.E.; Russ, S.; Barash, T. The Volume Acoustic Modes of Spark-Ignited Internal Combustion Chambers. In Proceedings of the International Congress & Exposition, Detroit, MI, USA, 23–26 February 1998; p. 980893. [Google Scholar] [CrossRef]
- Benson, G.; Fletcher, E.A.; Murphy, T.E.; Scherrer, H.C. Knock (Detonation) Control by Engine Combustion Chamber Shape. In Proceedings of the SAE International Congress and Exposition, Detroit, MI, USA, 28 February–4 March 1983; p. 830509. [Google Scholar] [CrossRef]
- Swarts, A.; Anderson, G.L.; Wallace, J.M. Comparing Knock between the CFR Engine and a Single Cylinder Research Engine. In Proceedings of the 2019 JSAE/SAE Powertrains, Fuels and Lubricants, Kyoto, Japan, 26–29 August 2019; p. 2019-01-2156. [Google Scholar] [CrossRef]
- Eng, J.A. Characterization of Pressure Waves in HCCI Combustion. In Proceedings of the SAE Powertrain & Fluid Systems Conference & Exhibition, San Diego, CA, USA, 21–24 October 2002; p. 2002-01-2859. [Google Scholar] [CrossRef]
- Puzinauskas, P.V. Examination of Methods Used to Characterize Engine Knock. SAE Tech. Pap. Ser. 1992, 920808. [Google Scholar] [CrossRef]
- Shahlari, A.J.; Ghandhi, J.B. A Comparison of Engine Knock Metrics. In Proceedings of the 2012 Small Engine Technology Conference & Exhibition, Pisa, Italy, 8–11 September 2012; p. 2012-32-0007. [Google Scholar] [CrossRef]
- Rockstroh, T.; Kolodziej, C.P.; Jespersen, M.C.; Goldsborough, S.S.; Wallner, T. Insights into Engine Knock: Comparison of Knock Metrics across Ranges of Intake Temperature and Pressure in the CFR Engine. SAE Int. J. Fuels Lubr. 2018, 11, 545–561. [Google Scholar] [CrossRef]
- Brunt, M.; Pond, C.D.; Biundo, J. Gasoline Engine Knock Analysis using Cylinder Pressure Data. In Proceedings of the International Congress & Exposition, Detroit, MI, USA, 23–26 February 1998; p. 980896. [Google Scholar] [CrossRef]
- Hoth, A.; Kolodziej, C.P.; Rockstroh, T.; Wallner, T. Combustion Characteristics of PRF and TSF Ethanol Blends with RON 98 in an Instrumented CFR Engine. In Proceedings of the International Powertrains, Fuels & Lubricants Meeting, Heidelberg, Germany, 17–19 September 2018; p. 2018-01-1672. [Google Scholar] [CrossRef]
- Patterson, D.J. Cylinder Pressure Variations, a Fundamental Combustion Problem. In Proceedings of the 1966 Automotive Engineering Congress and Exposition, Detroit, MI, USA, 10–14 January 1966; p. 660129. [Google Scholar] [CrossRef]
- Barton, R.K.; Kenemuth, D.K.; Lestz, S.S.; Meyer, W.E. Cycle-by-Cycle Variations of a Spark Ignition Engine—A Statistical Analysis. In Proceedings of the Mid-Year Meeting, Detroit, MI, USA, 18–22 May 1970; p. 700488. [Google Scholar] [CrossRef]
- Ghandhi, J.; Kim, K.S. A Statistical Description of Knock Intensity and Its Prediction. In Proceedings of the WCX™ 17: SAE World Congress Experience, Detroit, MI, USA, 3–5 April 2017; p. 2017-01-0659. [Google Scholar] [CrossRef]
- Leppard, W.R. Individual-Cylinder Knock Occurrence and Intensity in Multicylinder Engines. In Proceedings of the SAE International Congress and Exposition, Detroit, MI, USA, 22–26 February 1982; p. 820074. [Google Scholar] [CrossRef]
- Ruppert, D. What is Kurtosis? An Influence Function Approach. Am. Stat. 1987, 41, 1–5. [Google Scholar] [CrossRef]
- Balanda, K.P.; Macgillivray, H.L. Kurtosis: A Critical Review. Am. Stat. 1988, 42, 111–119. [Google Scholar] [CrossRef]
- Decarlo, L.T. On the meaning and use of kurtosis. Psychol. Methods 1997, 2, 292–307. [Google Scholar] [CrossRef]
Disclaimer/Publisher’s Note: The statements, opinions and data contained in all publications are solely those of the individual author(s) and contributor(s) and not of MDPI and/or the editor(s). MDPI and/or the editor(s) disclaim responsibility for any injury to people or property resulting from any ideas, methods, instructions or products referred to in the content. |
© 2024 by the authors. Licensee MDPI, Basel, Switzerland. This article is an open access article distributed under the terms and conditions of the Creative Commons Attribution (CC BY) license (https://creativecommons.org/licenses/by/4.0/).