Article

Research on Sub-Synchronous-Oscillation Energy Analysis and Traceability Method Based on Refined Energy

1
School of Electrical Engineering, Northeast Electric Power University, Jilin 132012, China
2
State Grid Jilin Electric Power Company Limited, Changchun 130028, China
3
State Grid Jilin Electric Power Research Institute, Changchun 130021, China
*
Author to whom correspondence should be addressed.
Energies 2024, 17(7), 1683; https://doi.org/10.3390/en17071683
Submission received: 24 January 2024 / Revised: 23 March 2024 / Accepted: 28 March 2024 / Published: 1 April 2024
(This article belongs to the Section A1: Smart Grids and Microgrids)

Abstract

:
At present, most studies use the direct method to analyze the oscillation problem of modern power systems. However, these studies often only simplify the external characteristics of the wind turbine and lack an in-depth understanding of its internal refined energy structure. In this paper, based on the direct-drive permanent magnetic synchronous generator’s detailed model (D-PMSG), combined with the dynamic energy of its port, layers of analysis are performed on the wind turbine’s internal connections, and a detailed model of the energy structure is created. Then, the interaction mechanism of each control link in the wind turbine is analyzed by combining the energy function of the wind turbine with the improved perturbation method. Finally, this paper constructs a sub-synchronous oscillation (SSO) scenario of weak damping and a forcing type and proves the accuracy and effectiveness of the traceability method based on the refined energy of D-PMSG. This traceability method based on refined energy is expected to provide a new solution to the stability problem caused by the integration of new energy.

1. Introduction

The large-capacity, long-distance cross-regional transmission characteristics of new energy present significant obstacles to power systems’ ability to dampen and regulate, making power-system stability issues even more complicated and challenging to handle in the face of minor disturbances. Following widespread use of power electronic equipment, the system’s inertia decreases, immunity is compromised, and the power oscillation’s amplitude greatly increases [1,2]. Among them, the problem of SSO caused by the access of D-PMSG to weak AC systems is becoming more and more prominent. Since 2009, SSO problems have occurred in wind farms in Texas and Guyuan [3], North China. These accidents lead to several wind turbines being off the grid, which has a significant effect on the wind farm’s regular operations. In these two accidents, experts have investigated the SSO issue in great detail [4,5] of doubly fed wind turbines and discussed causes and solutions. However, it is worth noting that a direct-drive wind farm in Hami, Xinjiang, China, also experienced continuous power SSO problems. Unlike the previous doubly fed wind turbine [6], this time involves D-PMSGs. The occurrence of this accident has attracted much attention from experts and scholars because D-PMSGs occupy an increasingly important position in wind farms [7]. The accident not only caused the loss of the wind farm itself but also led to the tripping of the adjacent thermal power units, which had an effect on the stability of the entire power system. This accident has aroused the attention and research of experts and scholars on the SSO problem of D-PMSGs.
With the continuous expansion of wind farms and the increase in new energy penetration, the effect of sub-synchronous oscillation on power-system stability is becoming more and more prominent. Therefore, the in-depth study of the SSO problem of D-PMSGs not only helps to improve the operational stability of wind farms but also helps to promote the further development of new energy technologies. In wind farms, The SSO phenomenon is explained by the negative damping theory. SSO may occur when the sub-synchronous mode has negative damping characteristics. Although the oscillation problem is frequently studied using the direct technique, the understanding of the internal energy structure of the wind turbine is not deep enough. Some scholars believe that the SSO problem about wind farms is associated with forced-disturbance sources [8]. Through the forced-SSO theory, the generation mechanism of the three features is understood. These characteristics are generated by the system’s feeble damping-SSO mode excited by the forced-disturbance source.
In addition, the authors of ref. [9] pointed out that one potential source of disturbance for forced SSO is the sub-synchronous interharmonics produced by the wind turbine converter. With the aim of controlling SSO, it is very important to identify its source quickly and accurately, including negative-damping and forcing types. Therefore, the traceability analysis of SSO is of practical significance, which is helpful to better understand the SSO problem of wind farms and take appropriate control measures. The authors of Reference [10] constructed an SSO-traceability architecture based on sub/super-synchronous phasor wide-area monitoring. It is possible to pinpoint the exact cause of the SSO by computing the sub-synchronous power flow of the entire system and using the power criterion. A real-time approach based on measurement data was presented in reference [11] to determine which wind farms are the biggest contributors to SSO. This technique tracks the amount and direction of sub-synchronous power produced by various wind farms or wind turbines in order to quantify and identify important wind farms. Many researchers believe that the energy-based oscillation-tracing method [12,13,14] has a wide range of practical application prospects [13]. This method can more accurately reflect the interaction mechanism of energy inside the system and offers a fresh perspective on resolving the power system stability issue brought on by the new energy-grid link. The transient energy-flow approach has shown impressive results in the localization of power-oscillation sources [15]. In the practical system application of ISO New England, this method is successfully applied to the online oscillation-management system, which automatically processes a large number of actual oscillation events and accurately identifies the low-frequency oscillation sources.
When dealing with SSO-disturbance-source location [16,17], the existing methods usually can only attribute the problem to a specific wind turbine, but lacks in-depth research on the internal control links of the wind turbine. This constraint could result in a lack of understanding of the oscillation’s underlying cause, thus affecting effective control and management [18]. Based on the fine model of the D-PMSG converter, this paper not only analyzes the internal links of D-PMSG in detail but also accurately models its energy structure. This analysis method aims to understand the working principle and dynamic characteristics of D-PMSG more deeply [19,20]. By constructing an energy function that is capable of capturing D-PMSG’s dynamic properties and fully taking into account the impact of its internal control connection, the disturbance source of the specific control link can be located more accurately. This research provides a more solid and comprehensive theoretical basis for the modeling and coordinated control of high-proportion renewable energy systems. The establishment of this theoretical basis not only helps to enhance the grid-connected stability of renewable energy but also helps to promote the optimization and upgrading of the entire energy system. It offers a fresh viewpoint and methodology for future research and facilitates the continued advancement and use of innovative energy technology [21].

2. Construction and Analysis of Fine Energy Function of D-PMSG Grid-Connected System

In this section, the construction of each control link’s tiny signal model comes after the topological makeup of the D-PMSG linked to a weak AC power grid has been established. Combined with the transient energy-function equation, the refined energy function of D-PMSG including each control link is derived.

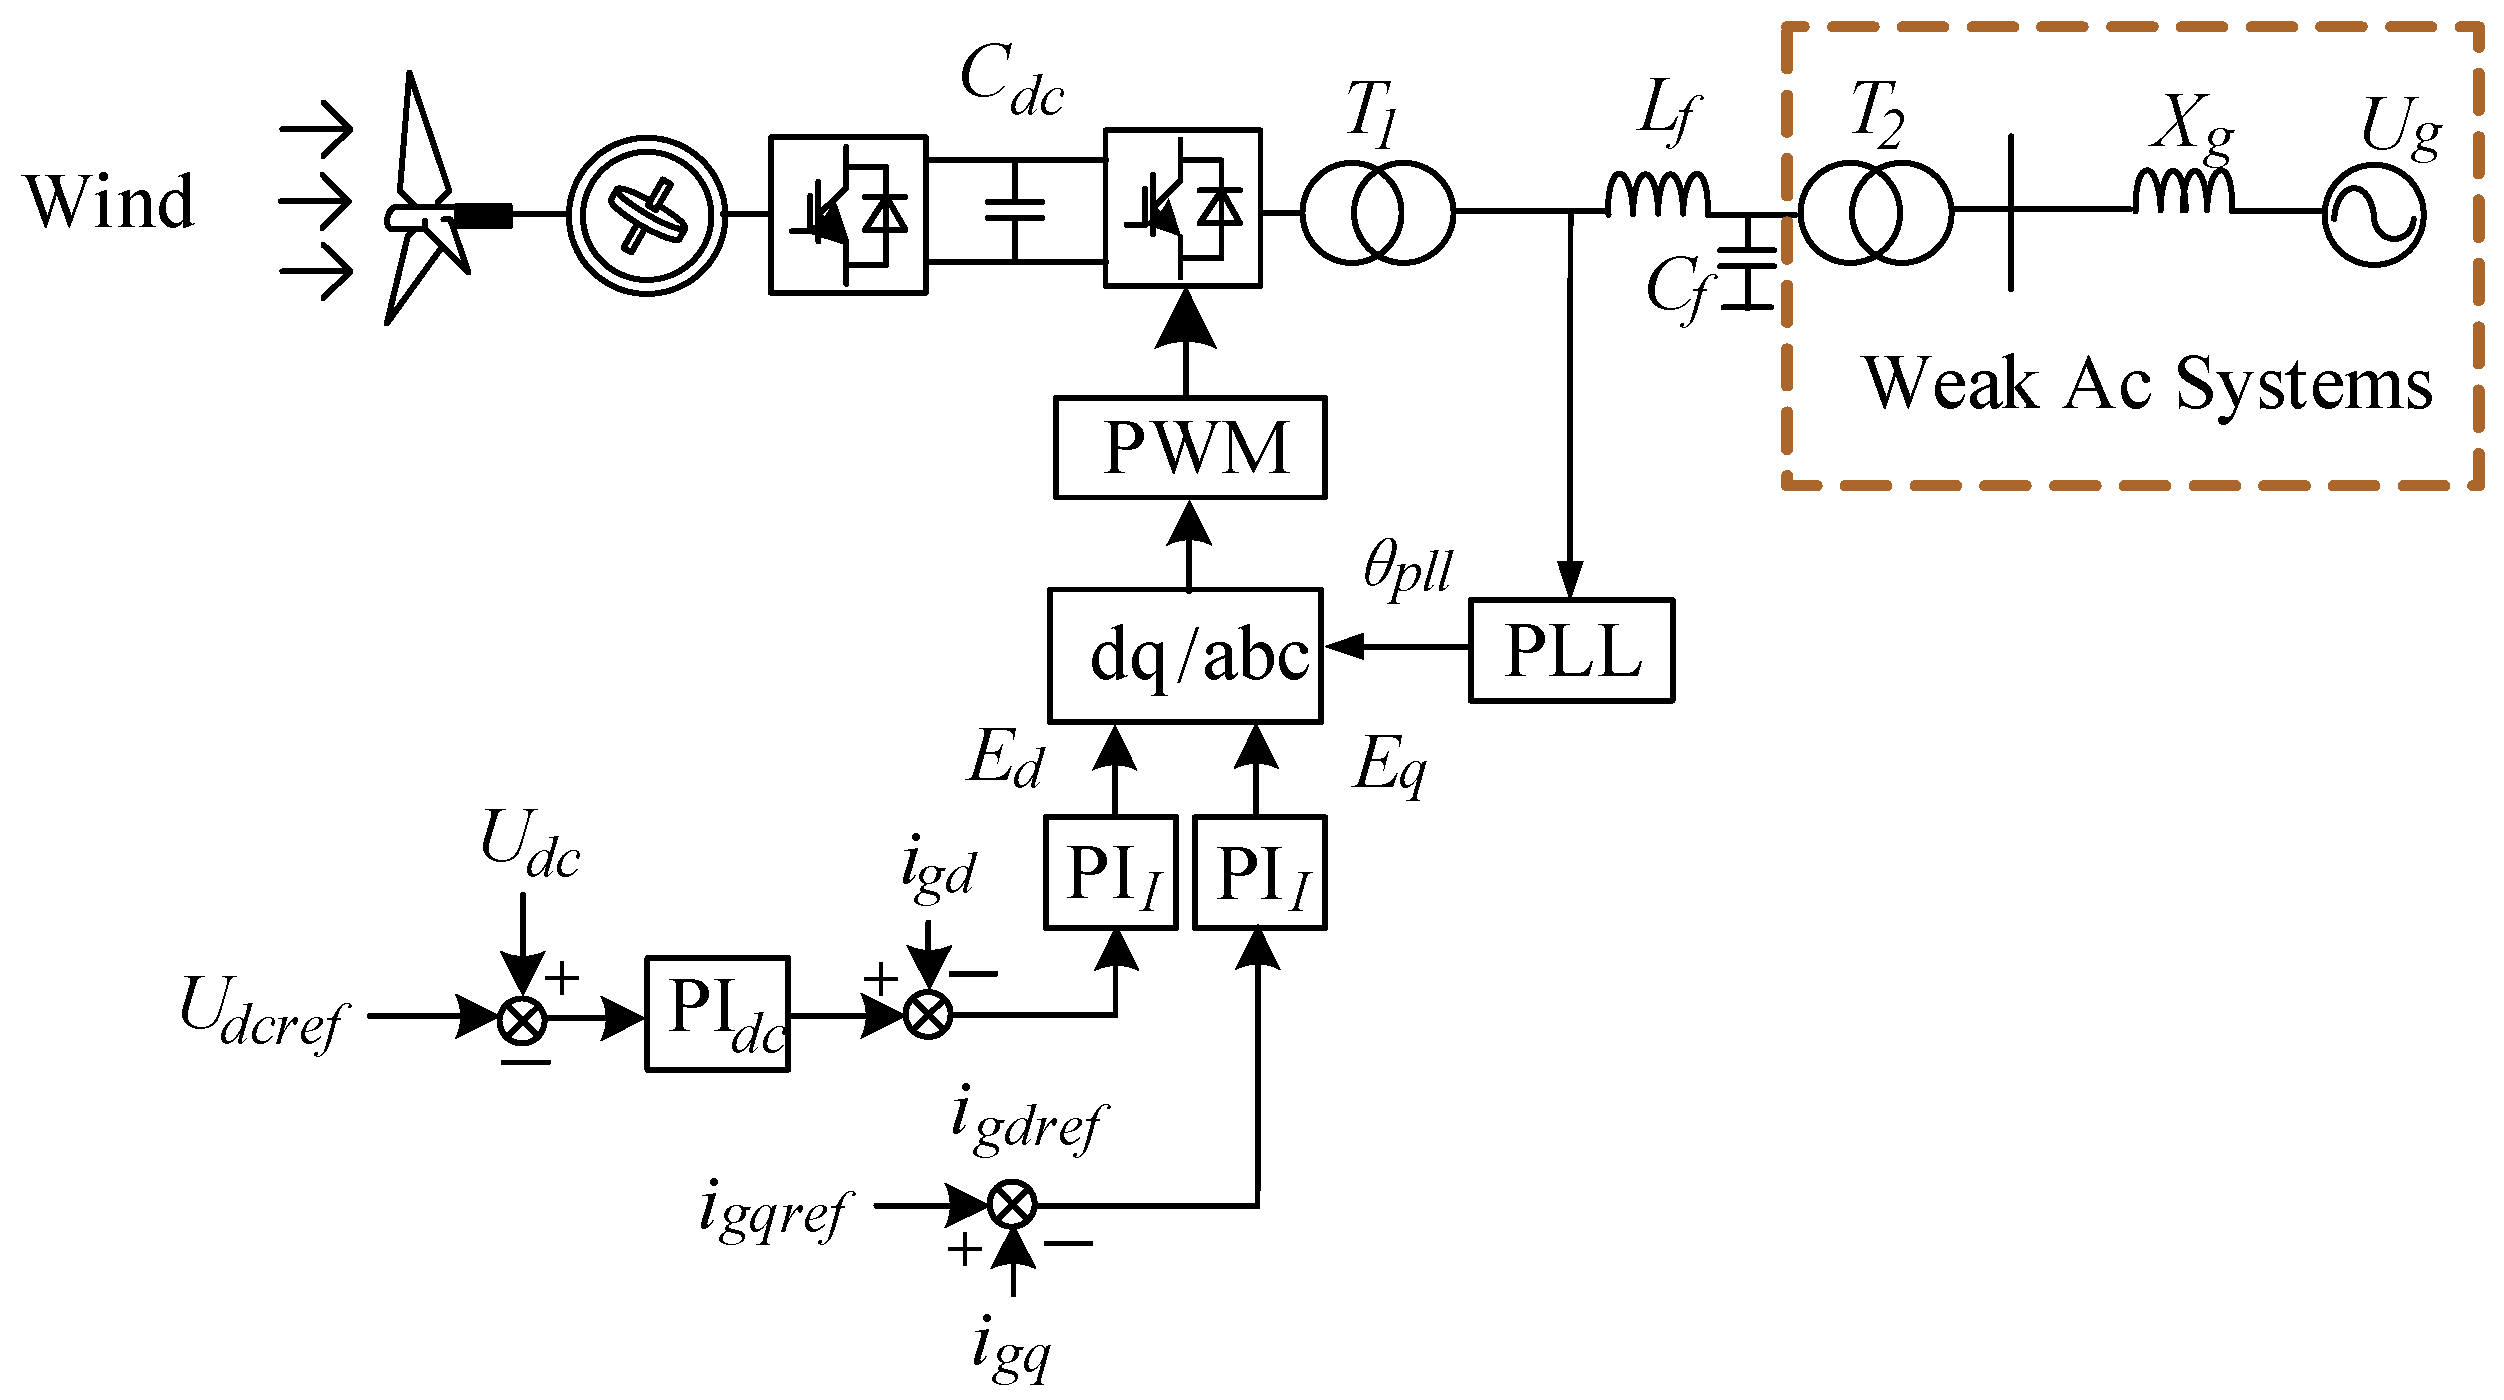
2.1. System Topology Structure

Figure 1 shows the topological structure of the system used in this paper. It includes two parts: a D-PMSG subsystem composed of 50 2 MW D-PMSGs and a weak AC system with a short circuit ratio (SCR) of 2.4. SCR is an indicator used to measure the relative strength of the D-PMSG and photovoltaic equipment input to the AC system. In general, when the SCR of the wind turbine is high (for example, greater than or equal to 3), the risk of an oscillation divergence of the wind turbine is low. On the contrary, when the SCR of the wind turbine access point is low (for example, less than 2, or even close to 1), the risk of an unstable oscillation of the wind turbine will increase. The parameters used in the emulation process are shown in Table 1, containing some reference values of the system and PI parameters of the converter control.
S C R = S B S W = U N 2 Z B S W
In the equation, UN is the rated voltage of the system; ZB is the equivalent impedance from the grid-connected point to the AC system; and SW is the total capacity of the wind turbine. SB is the short-circuit capacity of the AC system at the grid-connected point.

2.2. Small Signal Model of Each Control Link

The SSO phenomena resulting from D-PMSG access to the system frequently originate from the interaction between the grid-side converter and the weak AC grid. As a result, the operation of these grid-side converter control linkages and the interaction of the control loops will be the main topics of this paper.
(1)
Small signal model of the current loop
The current loop adopts classical PI control, and its control equation is the following:
u d = ( k p d + k i d 1 s ) ( i d r e f i d ) ω L f i q + e g d u q = ( k p q + k i q 1 s ) ( i q r e f i q ) + ω L f i d + e g q
In the equation, the q-axis-current loop’s PI parameters are kpq and kiq, while ud and uq are the dq-axis voltage of the current-loop control output, respectively. The d-axis-current reference value is denoted by idref, while the q-axis current reference value is designated as a constant value during model construction. The filter inductance is denoted by lf, and the dq axis grid voltage feedforward terms are egd and egq. The system angular frequency is represented by w, and the PI parameters of the d-axis current loop are kpd and kid. Separately, the dq axis currents are represented separately by id and iq.
Linearization analysis of the above equation yields the following equation:
Δ u d = ( k p d + k i d 1 s ) ( Δ i d r e f Δ i d ) ω 0 L f Δ i q Δ ω L f i q 0 + Δ e g d Δ u q = ( k p q + k i q 1 s ) Δ i q + Δ ω L f i d 0 + ω 0 L f Δ i d + Δ e g q
In the equation, the system’s steady-state values of angular frequency, w0, and dq axis current, id0 and iq0, are represented in the equation.
(2)
Small signal model of DC voltage loop
The equation related to DC voltage-control can be expressed as the following:
U d c = 2 ( P i n P ) / ( s C d c )
i d r e f = ( U d c U d c r e f ) ( k p d c + k i d c / s )
In the equation: the voltage of the DC capacitor is Udc. The DC capacitor voltage reference value is Udcref. Pe is the network side’s input power, whereas Pin is the machine side’s output power; C indicates the DC capacitor; and kpdc and kidc are PI parameters of the DC voltage loop.
By linearizing Equations (4) and (5) at the working point, the following equations are obtained:
Δ U d c = 1 s C d c U d c 0 ( Δ P i n Δ P e )
Δ i d r e f = Δ U d c ( k p d c + k i d c / s ) = ( k p d c + k i d c / s ) s C d c U d c 0 ( Δ P i n Δ P e )
Δ P e = 1.5 ( u d 0 Δ i d + Δ u d i d 0 + u q 0 Δ i q + Δ u q i q 0 )
(3)
The linearization model of PLL is as follows:
Δ θ p l l = k i p + s k p p s 2 Δ u q
d Δ θ p l l = k i p Δ u q d t + k p p Δ u q
In the equation, kpp, kip are the loop’s PI parameters; the phase-locked loop voltage at the grid-connected point of the D-PMSG is utilized as an input, yet the phase-locked loop output is expressed by θpll. The phase-locked error angle of the phase-locked loop output can be represented by Δθpll.

2.3. Refined Energy Function Construction of D-PMSG

In the analysis of SSO, this paper focuses on whether D-PMSG emits energy or absorbs energy, and judges whether D-PMSG provides positive damping or negative damping for the system, so as to judge whether the disturbance source is inside the D-PMSG.
Using the port node information of D-PMSG, the transient energy can be obtained as follows:
Δ V = Im ( Δ i G d Δ u G )   = Δ i d d Δ u q Δ i q d Δ u d + Δ P e d Δ θ p l l
The aforementioned equation shows that the former energy is connected to the port’s voltage and current on the dq axis; the latter denotes the dynamic energy component directly determined by the phase-locked loop and the active power.
This is expanded as follows:
Δ V = Δ i d d Δ u q Δ i q d Δ u d + Δ P e d Δ θ p l l = Δ i d d Δ u q Δ i q d Δ u d + Δ P e Δ ω p l l d t   = [ Δ i d ( ( k p q s + k i q ) Δ i q + s Δ ω L f i d 0 + s ω 0 L f Δ i d + s Δ e g q ) Δ i q ( s k p d + k i d ) ( Δ i d r e f Δ i d ) s ω 0 L f Δ i q s Δ ω L f i q 0 + s Δ e g d ) ] d t   + C d c U d c 0 Δ U d c ( k i p Δ u q + k p p Δ u q s ) d t
The energy of each control link of D-PMSG can be obtained by combining Equations (12) and (3):
The energy expression dominated by the DC voltage control link is as follows:
Δ V d c = Δ i q Δ U d c ( s k p d + k i d ) ( k p d c + k i d c / s ) d t
The energy expression dominated by the current loop is as follows:
Δ V I = Δ i d Δ i q ( k p q s + k i q ) d t + Δ i d ( s Δ ω L f i d 0 + s ω 0 L f Δ i d ) + Δ i q ( s ω 0 L f Δ i q + s Δ ω L f i q 0 ) d t + ( Δ i d s Δ e g q Δ i q s Δ e g d ) d t + Δ i d Δ i q ( s k p d + k i d ) d t = Δ V I 1 + Δ V I 2 + Δ V I 3 + Δ V I 4
In the equation, ΔVI1 is mainly affected by the kpq and kiq; ΔVI2 is the energy dominated by the dq-axis cross-coupling term; ΔVI3 is the energy dominated by the dq-axis voltage feedforward term; and ΔVI4 is mainly affected by the kpd and kid.
The energy expression dominated by phase-locked control is as follows:
Δ V P L L = C d c U d c 0 Δ U d c Δ i q ( k i p + k p p s ) ( k p q + k i q 1 s ) d t C d c U d c 0 Δ U d c ( k i p + k p p s ) ( Δ ω L f i d 0 + ω 0 L f Δ i d ) d t C d c U d c 0 Δ U d c Δ e g q ( k i p + k p p s ) d t = Δ V P L L 1 + Δ V P L L 2 + Δ V P L L 3
According to the derived expression, it can be seen that ΔVPLL1 is mainly affected by the control parameters of the phase-locked loop and the parameters of the q-axis current loop; ΔVPLL2 is the energy dominated by the interaction between the phase-locked loop and the dq-axis cross-coupling term. ΔVPLL3 is mainly affected by the q-axis voltage feedforward term and the control parameters of the phase-locked loop.

3. Sensitivity Analysis

The conventional approach to sensitivity analysis primarily involves using analytical techniques. For the refined energy function of D-PMSG, the sensitivity expression is the following:
S i = Δ V Δ x
where Si is the sensitivity of the i-th variable and x-related variables.
While Equation (16) is capable of computing sensitivity, bringing refined energy function into this method involves a more complex procedure. As a result, the perturbation strategy is used in this study to ascertain each variable’s sensitivity inside the refined energy function.
By measuring the energy levels immediately prior to and following the disturbance after deploying the identical disturbance to all state variables, it is possible to ascertain the impact of state variables on energy. Equation (17) displays the energy levels both before and after the disturbance:
V p 1 = f ( x ) V p 2 = f ( x + Δ x )
Among them are Vp1V before applying disturbance; Vp2V after applying disturbance; the correlation between f-state variables and energy in terms of their functions; x-state variable; and Δx—perturbation.
The impact of each variable is quantified using Equation (18). By deducting the pre-disturbance energy from the post-disturbance energy for each data point and taking the average’s absolute value, the required measure is derived. The notation for this measurement is SV, and it is known as the sensitivity of the state variable to energy.
S V = | V p 1 V p 2 | ¯
Since each state variable applies the same disturbance, only the difference in energy can be compared to see the state variable’s impact on the energy. Furthermore, as the disturbance occurs simultaneously, it is possible to negate the effect of the initial steady state. This enables the determination and ranking of sensitivity values SV for each state variable. The variable with the highest SV shows the greatest energy sensitivity. Thus, identifying one or more such highly sensitive state variables is feasible. Adjusting these key state variables allows for the effective modulation of D-PMSG’s refined energy function, facilitating energy control.
The D-PMSG state variables are divided into five parts, and the specific state variables related to each part of the D-PMSG are shown in Table 2.
The associated variables are the d and q axis components d and q, and the state variables of the PLL are represented by xa and xb in Table 2. The following expressions include the values for variables x1 through x6, where the variable reference has a given value.
d x a d t = u q g d x b d t = ω 0 + u q g k p p l l + u q g T i p l l = ω
d x 1 d t = i d s r e f i d s d x 2 d t = ω s r e f ω s d x 3 d t = i q s r e f i q s d x 4 d t = u d c u d c r e f d x 5 d t = i d g r e f i d g d x 6 d t = i q g r e f i q g

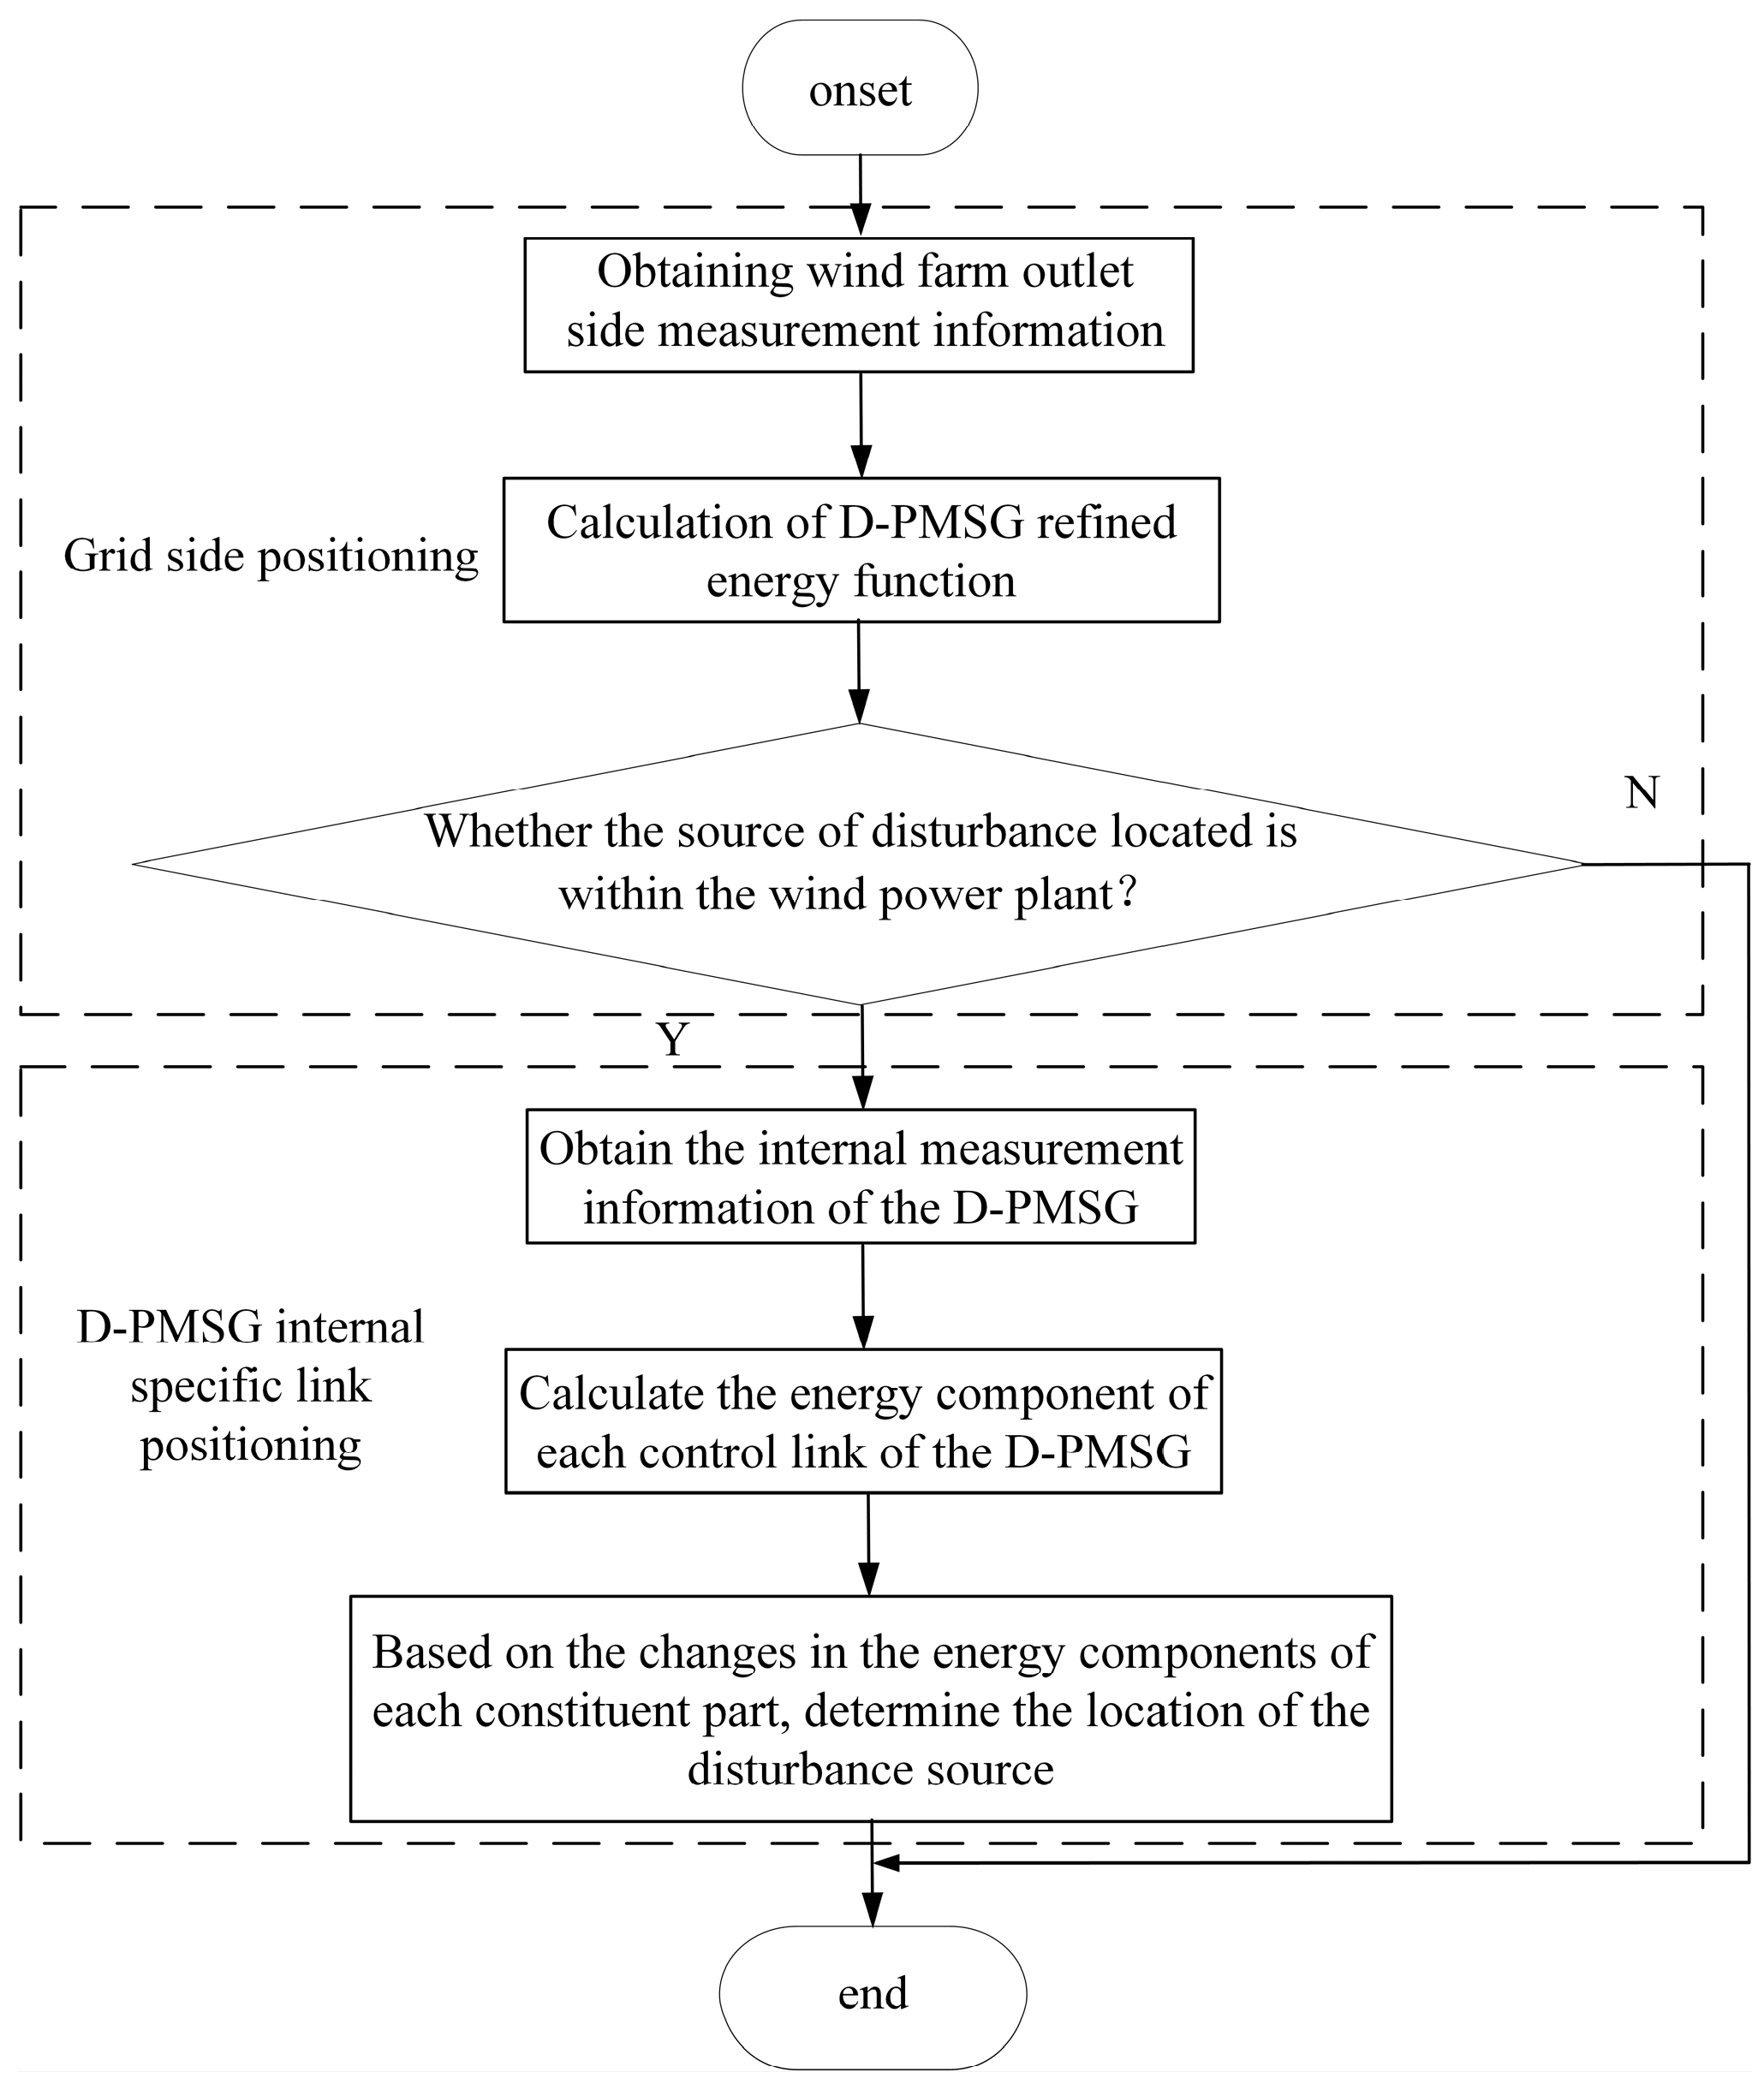
4. Results Simulation Analysis

This section firstly builds the corresponding electromagnetic transient model in MATLAB/SIMULINK 2020b, calculates the port transient energy of D-PMDG based on the measured electrical quantities, and compares it with the total of the improved energy function that is suggested in this study. Then, it is demonstrated that the approach suggested in this research may be used in the field of SSO-disturbance-source location in the two scenarios of forced-oscillation-type SSO and weak damping-type SSO. Moreover, the method flow chart used in this study is shown in Figure 2.

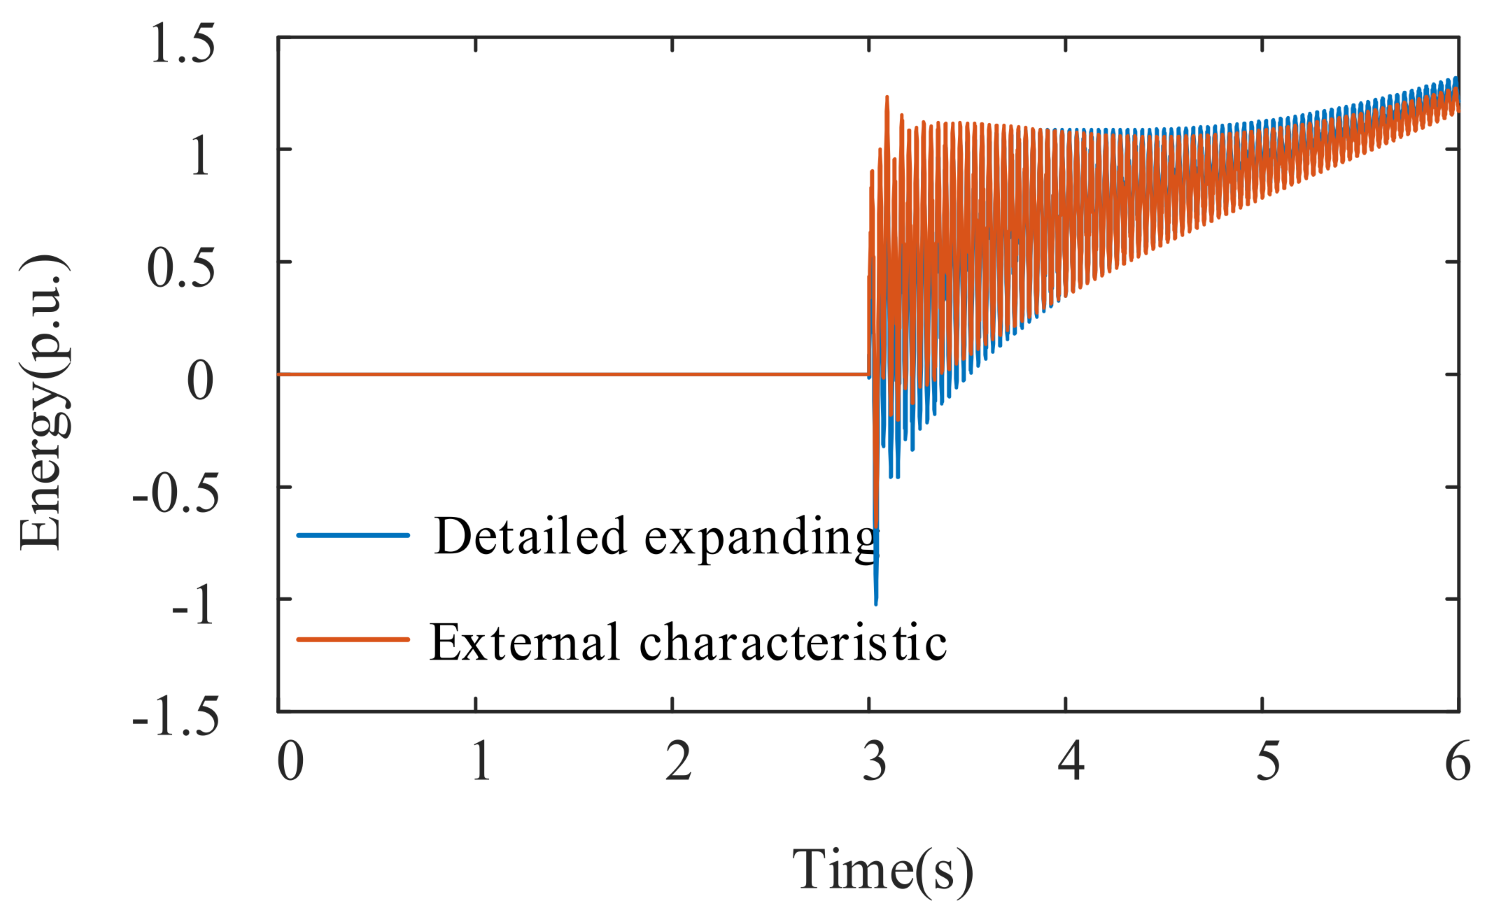
4.1. Validation of the Technique

With the purpose of authenticating the correctness of the proposed technique, the decomposed energy is compared with the exterior features of the D-PMSG. The external characteristic mentioned here is to regard the output of D-PMSG as the load power with negative power. By figuring out the load energy, the calculation equation of load energy is introduced to replace the energy of D-PMSG, which is called the external characteristic energy later. This investigation verifies the applicability of the energy function model to the later SSO analysis if the external characteristic energy agrees with the refined energy that was established in this paper. And on the basis of this analysis, the remaining properties of the energy function generated are examined.
For the purpose of facilitating the investigation of the generated energy function’s characteristics, D-PMSG is linked to the infinite bus system. At 3 s into the simulation and extending to the conclusion, the D-PMSG has a connection to the weak AC grid. The external-characteristic energy curve of D-PMSG and the constructed refined-energy curve are shown in Figure 3. The difference can be made between the external-characteristic calculation and the refined-energy-function curve generated by this study since both of them are a simplified D-PMSG energy and the second is not the actual energy of D-PMSG. Additionally, there is some inconsistency in the curves generated through the two energy functions as a result of issues like measurement errors and model discrepancies. This paper’s energy function is going to go through several integrations, and initially not many deviations will progressively increase. Therefore, this paper only makes a qualitative comparison, and the elimination of errors will be studied in detail in the future. It can be demonstrated from the figure that the refined-energy-function curve’s trend and the energy curve derived from the external characteristic data are essentially consistent. As a result, to some extent, the energy function established during the present investigation may symbolize the energy of D-PMSG.

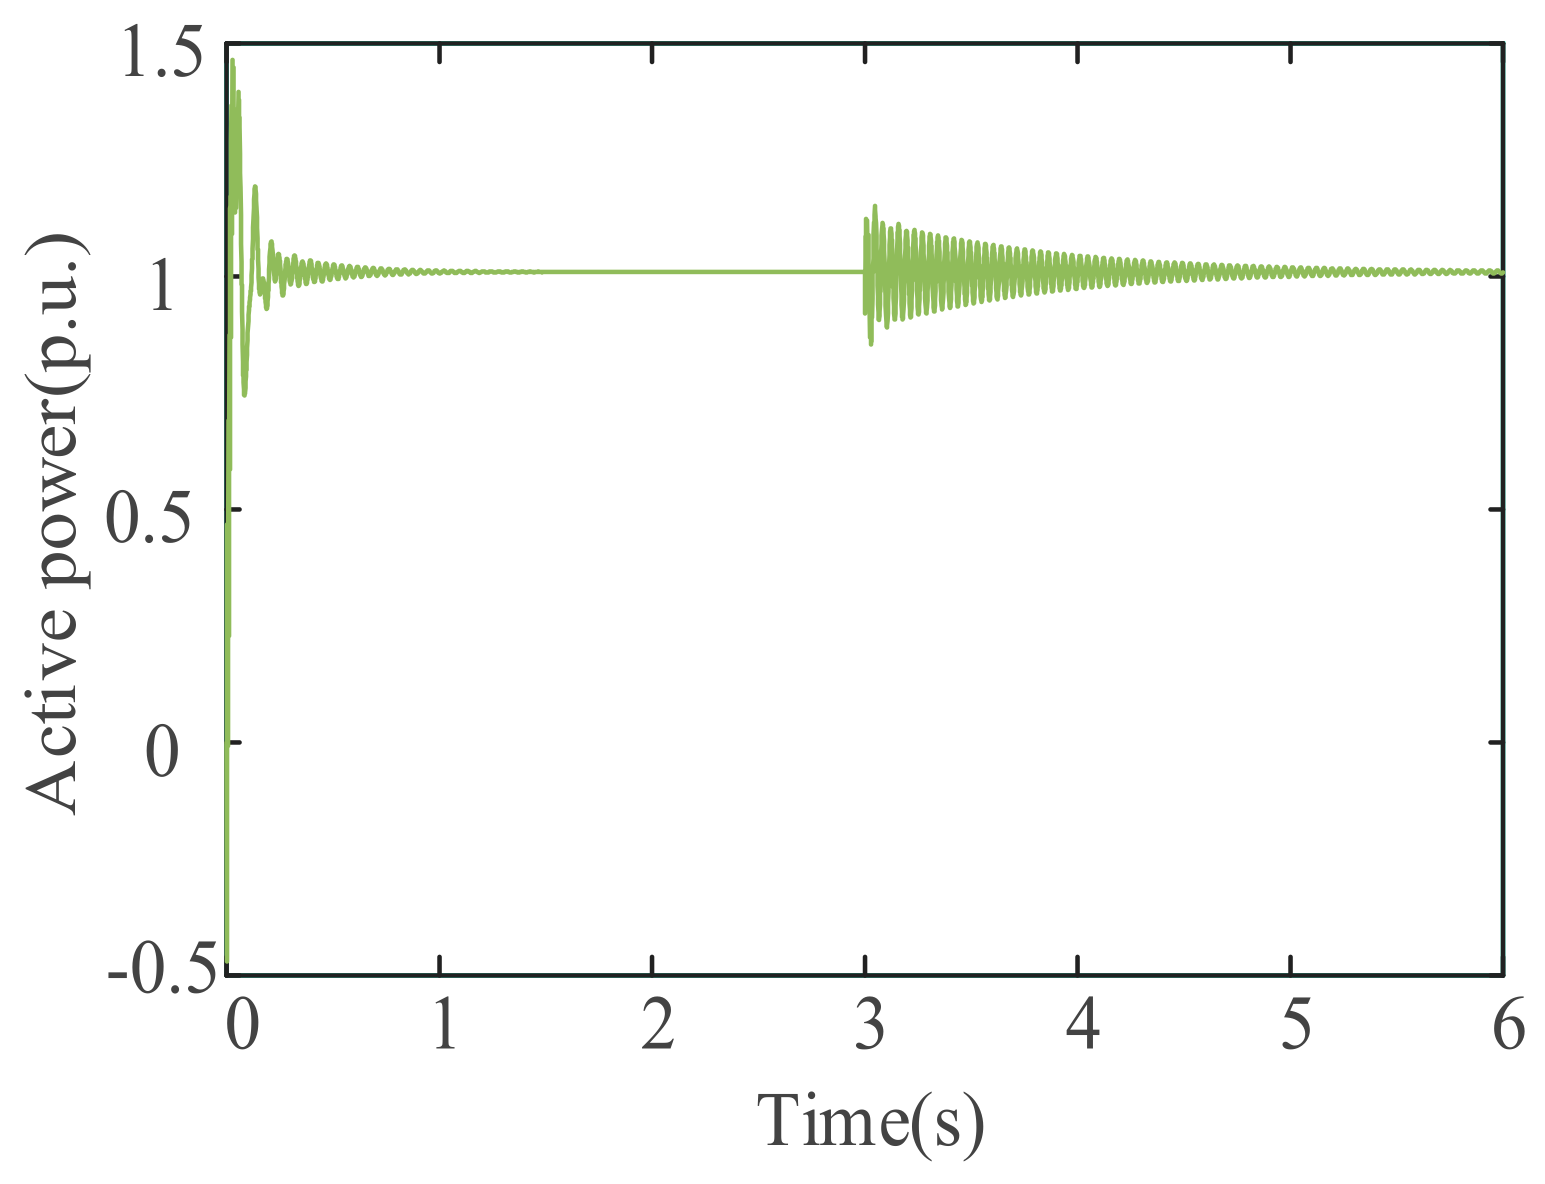
4.2. Example Analysis

(1)
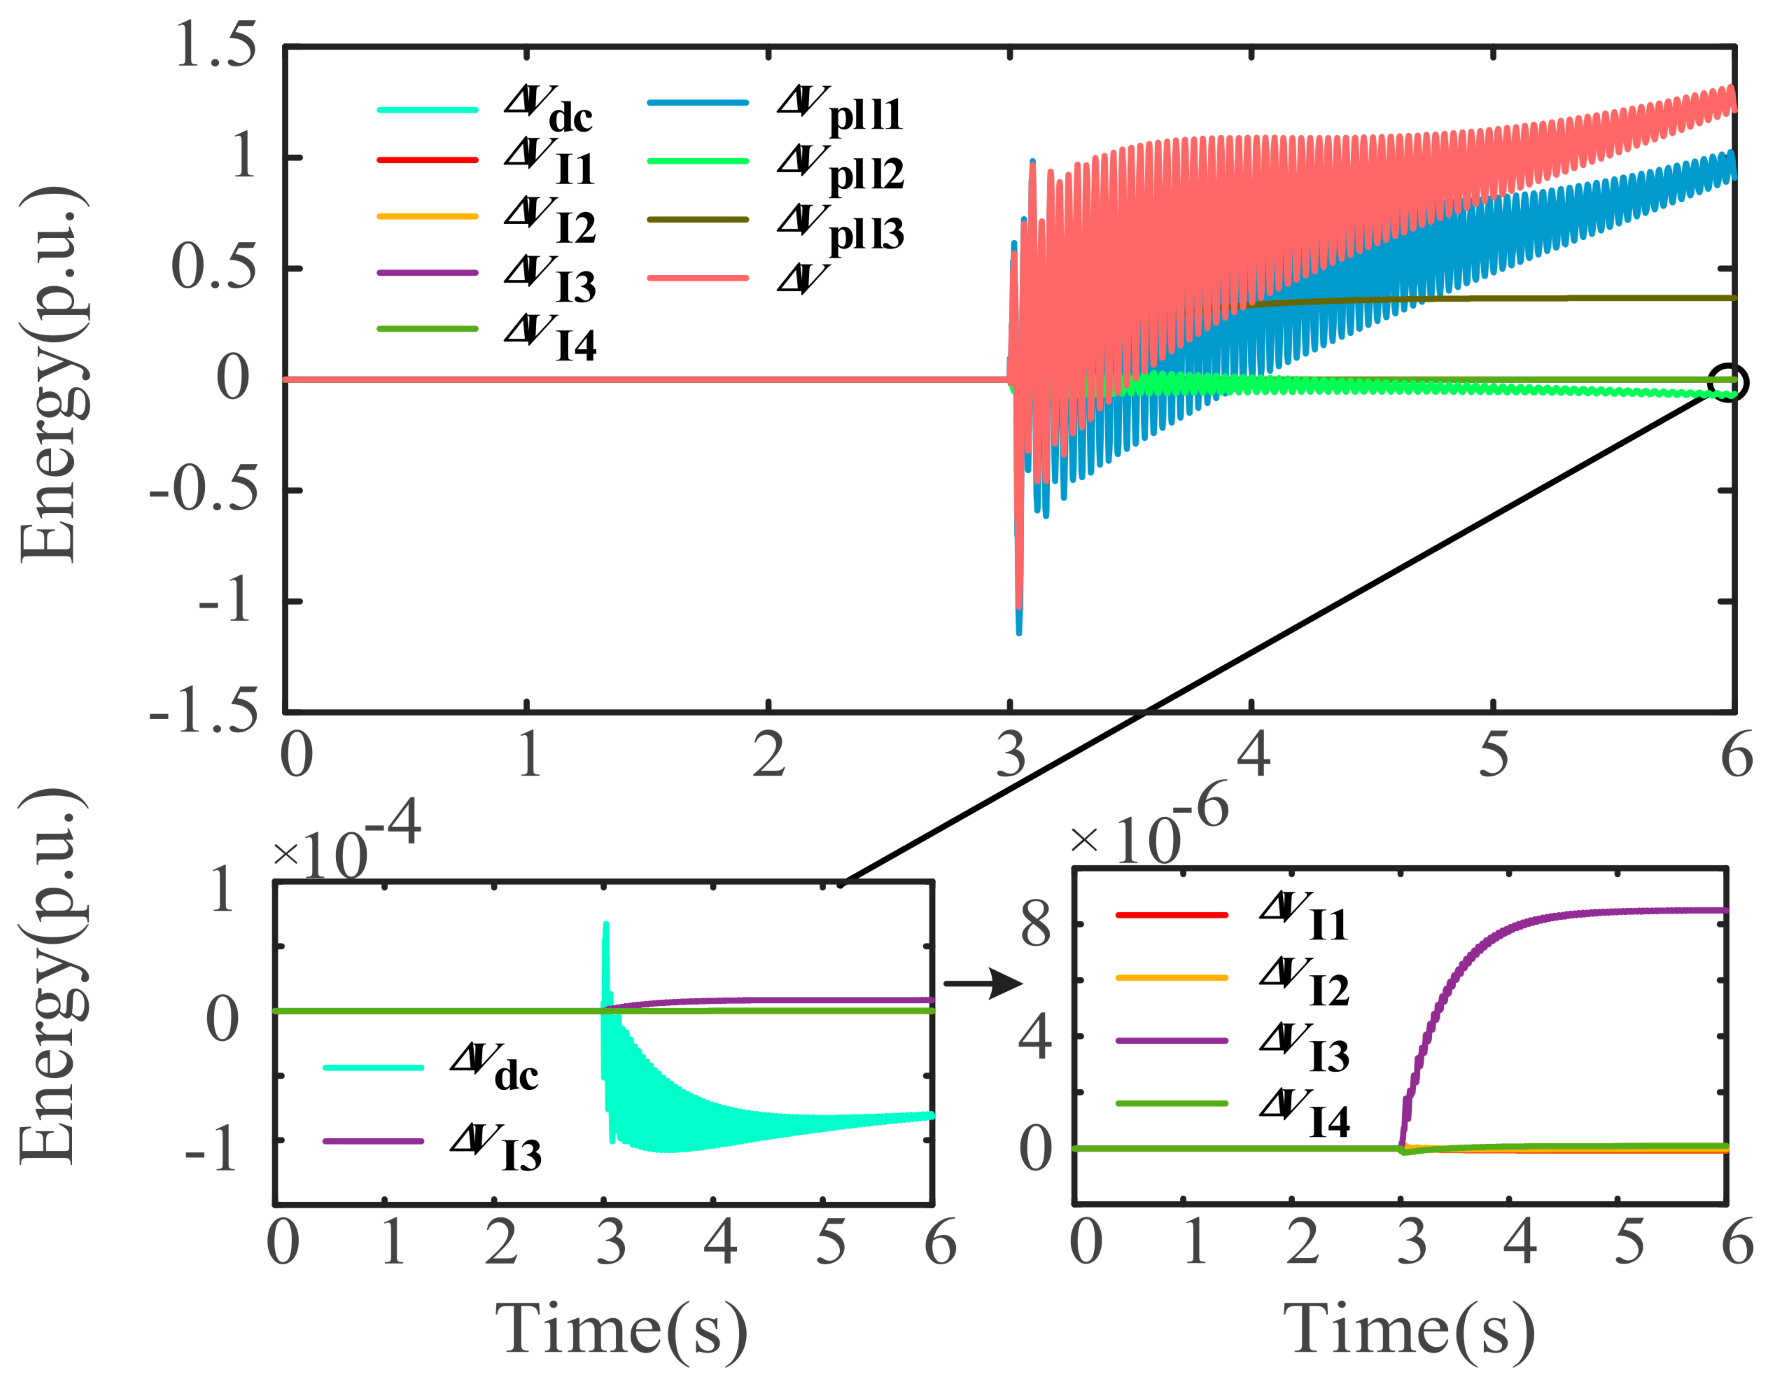
Weak damping-type SSO
Weak damping oscillation may occur in the power grid under certain conditions, such as power grid failure, load mutation, the failure of control measures, etc. If effective measures are not taken in time to suppress it, it could represent a risk to the stable and secure functioning of the electrical grid. Therefore, this paper focuses on the SSOs of the weak damping type.
Using the simulation system depicted in Figure 1 as a foundation, the D-PMSG is switched from an infinite system to a weak AC system in the third second after the simulation starts; that is, the relative strength of the D-PMSG connected to the system is weakened and continues until the simulation concludes. Currently, Figure 4 displays the active power output of the D-PMSG. The weak damping-type attenuation oscillation of the system is evident.
The Lyapunov second stability principle states that if the free dynamical system’s total energy V changes at a constant negative rate with respect to time ΔV, The overall energy of the system will continue to decrease, maintaining system stability. On the contrary, when ΔV is constantly positive, the system stability will gradually decline as the system’s overall energy continues to rise. Therefore, the buildup and consumption pattern of total energy can be used to assess the stability of D-PMSG.
The energy-function equation is dominated by each control link in the grid-side converter, as deduced in the Section 2. The specific distribution of the internal energy of D-PMSG is obtained as shown in Figure 5. From the diagram, it can be seen that the energy component dominated by the phase-locked loop is larger. Of these energy constituents, ΔVPLL1 tied to the PI parameters of the phase-locked loop and the q-axis current loop is much larger than other energy components, and its energy-change rate is positive, leading to the system’s continual negative damping properties and transient energy. Furthermore, unstable SSO may occur in the system. The energy dominated by the DC voltage control link and the energy dominated by the D-axis current loop account for a relatively small proportion of the system, and the energy-change rate is negative. An increase in these two energy components will strengthen the system’s favorable damping effect in the sub-synchronous frequency range and increase its degree of stability. We infer that the SSO issue this scenario exhibits is the result of an interaction between the phase-locked loop and the q-axis current loop (Figure 5).
According to the improved perturbation method and the state variable grouping proposed in the Section 3, the system is analyzed. The sensitivity analysis results show that the state variables xa, xb, corresponding to the D-PMSG phase-locked loop control and the q-axis component igq of the D-PMSG grid-side current flowing to the AC network as shown in Figure 6, are mainly involved in the SSO phenomenon, which is consistent with the results based on the refined energy analysis.
(2)
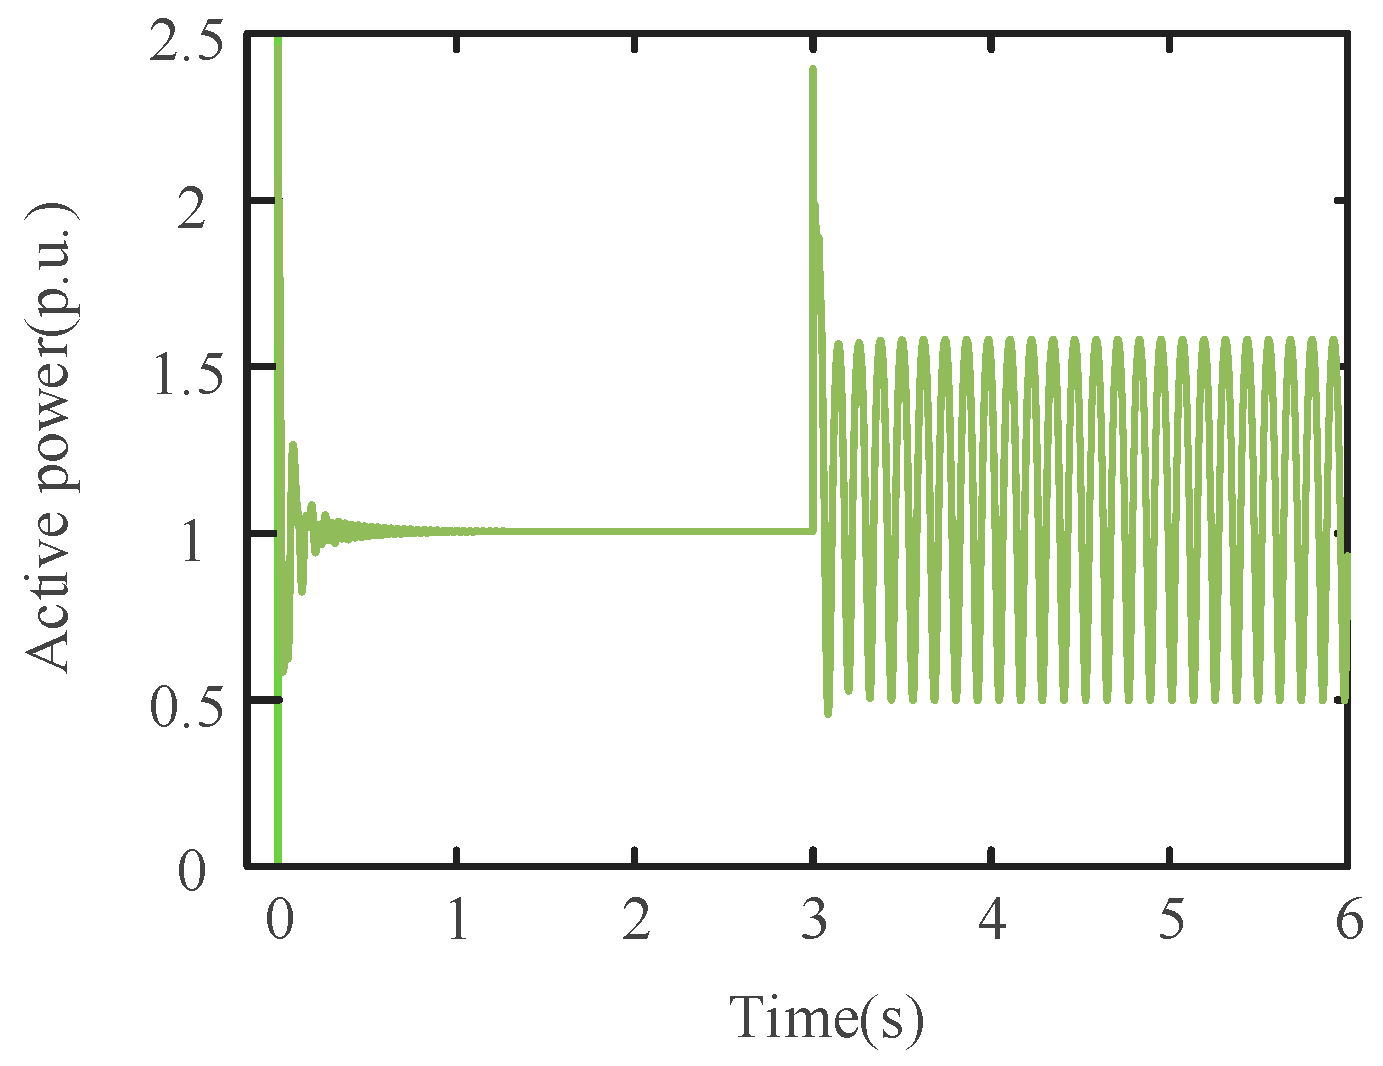
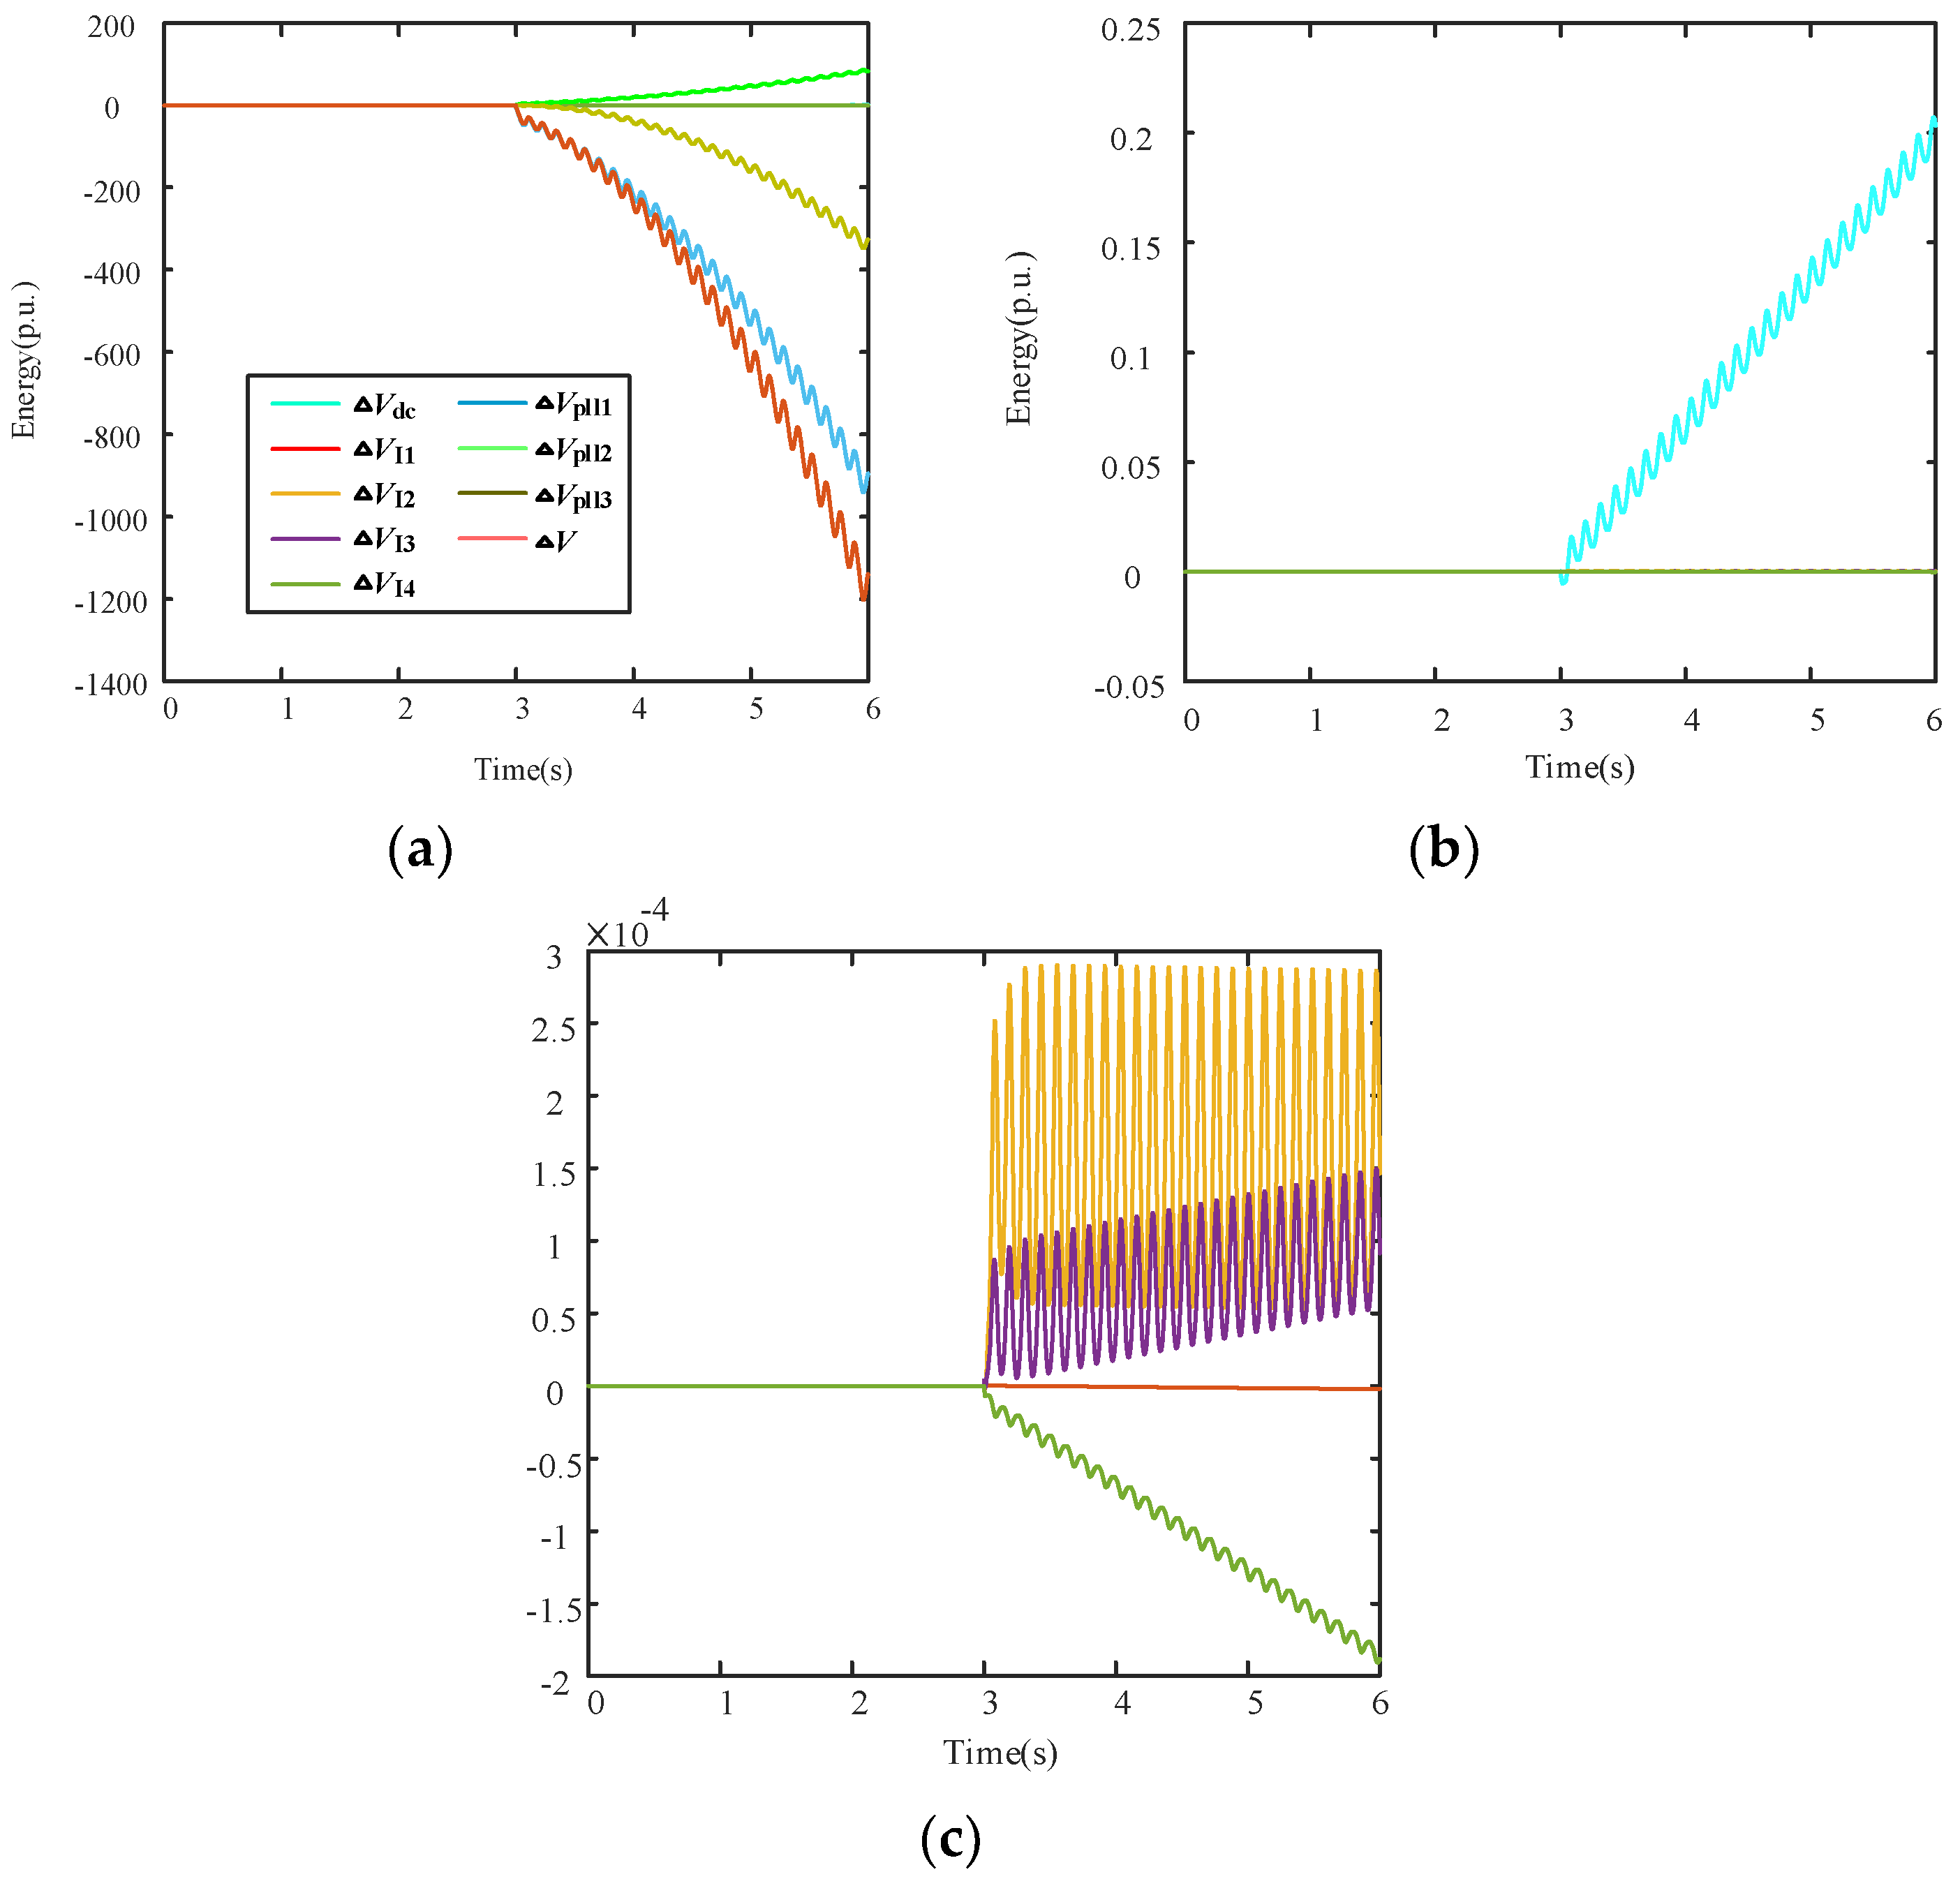
Forced-oscillation-Type SSO
In the mechanism depicted in Figure 1, a sinusoidal current source is added to the high-voltage side of the transformer T2 at the outlet of the D-PMSG. There is a 25 Hz oscillation with an amplitude of 2 kA. The disturbance starts at the third second of the simulation and continues until the end. The output port’s active-power curve can be shown in Figure 7, and it is clear that the system oscillates with exactly the same amplitude.
The energy components that each grid-side converter control link dominated and the total energy synthesized are shown in Figure 8. It can be seen that the energy-change rate is dominated by the DC voltage control, and the energy-change rate is dominated by the dq-axis cross-coupling term, while the phase-locked loop and the q-axis current loop combine to dominate the energy-change rate, which is positive. It can be indicated that these components provide the system with negative damping energy. In line with the disturbance-source-setting result, the total energy-change rate of D-PMSG is negative, demonstrating that the disturbance source is not inside the wind turbine.

5. Conclusions

The primary goal of the current research on sub-synchronous oscillation-disturbance-source localization for grid-connected D-PMSG is to determine if the disturbance source is situated on the generator side or the grid side of the D-PMSG, or if it is internal to the D-PMSG. On the other hand, the internal components’ particular control loop has not been thoroughly examined. This study explores the construction of a refined energy function for D-PMSG from an energy perspective. This will allow for the localization of disturbance sources within certain D-PMSG control loops during sub-synchronous oscillation (SSO). The analysis results are verified by analyzing the sensitivity of different parameters to energy. The following are this paper’s primary contributions:
(1)
The development of an improved D-PMSG energy function. A layered analysis is performed based on the small-signal models of different control loops in D-PMSG, and transient energy methods are used to meticulously analyze the energy structure. As a result, a refined-energy function that captures the dynamic properties of D-PMSG and accounts for its internal control loops is developed. In the example study employed in this research, it is observed through simulations in SIMULINK that the majority of the energy of D-PMSG is concentrated in the phase-locked loop;
(2)
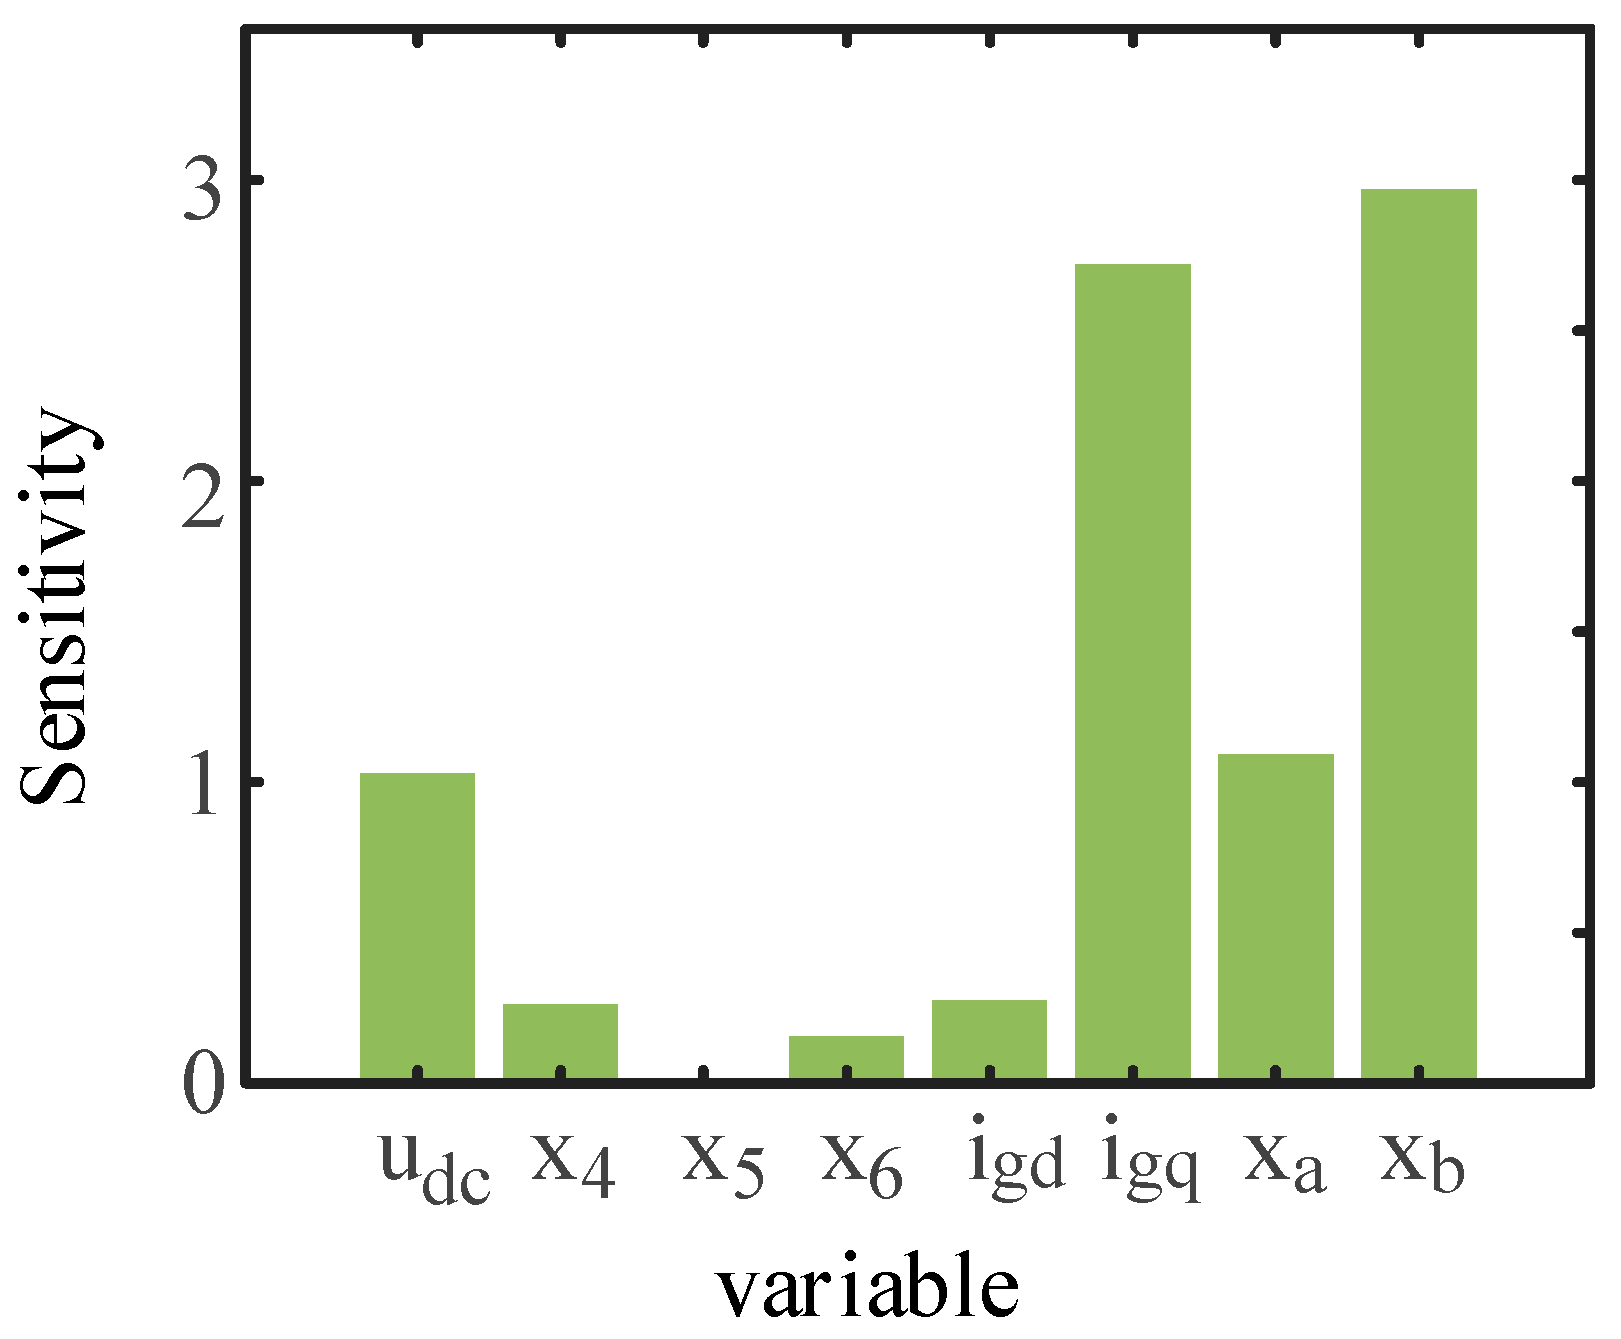
The identification of internal state variables in D-PMSG that exhibit high sensitivity to energy. By improving upon the traditional perturbation method, a sensitivity analysis is conducted on various state variables of D-PMSG with respect to the refined-energy function constructed in this paper. The analysis reveals that, in the case study used here, the state variables xa, xb, corresponding to the D-PMSG phase-locked loop control and the q-axis component igq related to phase-locked loop control, are primarily involved in SSO phenomena, which aligns with the results obtained through the disturbance-source-localization method employed in this paper;
(3)
The validation of the suggested approach within the framework of forced-oscillation SSO. A forced-oscillation SSO scenario is created in SIMULINK simulations by putting the disturbance source on the grid side. The efficacy of the suggested approach is validated when the disturbance source is found not to originate from within D-PMSG using the disturbance-source-localization method employed in this work.
Using the improved energy function this study produced, the future construction of additional damping controllers for important control loops that affect the incidence of SSO is the goal of this paper. This method provides a fresh viewpoint on the coordinated control of networked power grids that use D-PMSG, which improves stability and dependability in power systems that rely on renewable energy.

Author Contributions

Conceptualization, methodology, investigation, resources, writing—review and editing, visualization, C.L. and Z.Z.; software, formal analysis, writing—original draft, data curation, S.Z., S.G., J.Y. and Z.C. All authors have read and agreed to the published version of the manuscript.

Funding

The authors declare that this study received funding from the JBGS project ‘Research and Application of Key Technologies for Identification and Early Warning of Broadband Oscillation in Jilin Power Grid’ which is supported by State Grid Jilin Electric Power Co., Ltd. The funder had the following involvement with the study: the collection, analysis, or interpretation of data.

Data Availability Statement

The data presented in this study are available on request from the corresponding author. The data are not publicly available due to that the project involved in the manuscript is not yet completed and is not in the public stage.

Conflicts of Interest

Author Jingying Yang was employed by State Grid Jilin Electric Power Company Limited. Authors Shuyu Zhou and Song Gao were employed by the company State Grid Jilin Electric Power Research Institute. The remaining authors declare that the research was conducted in the absence of any commercial or financial relationships that could be construed as a potential conflict of interest.

References

  1. Yang, D.; Sun, Y. Generalized Impedance-Based Stability Analysis for System- Level Small-Signal Stability Assessment of Large-Scale Power Electronics-Dominated Power Systems. In Proceedings of the 2021 IEEE 12th Energy Conversion Congress & Exposition—Asia (ECCE-Asia), Virtual, 24 May 2021; IEEE: Singapore; pp. 2069–2074. [Google Scholar]
  2. Xiao, X.; Luo, C.; Liao, K. Review of the Research on Subsynchronous Oscillation Issues in Electric Power System with Renewable Energy Sources. Diangong Jishu Xuebao/Trans. China Electrotech. Soc. 2017, 32, 85–97. [Google Scholar]
  3. Xie, X.; Zhang, X.; Liu, H.; Liu, H.; Li, Y.; Zhang, C. Characteristic Analysis of Subsynchronous Resonance in Practical Wind Farms Connected to Series-Compensated Transmissions. IEEE Trans. Energy Convers. 2017, 32, 1117–1126. [Google Scholar] [CrossRef]
  4. Shao, B.; Zhao, Z.; Xiao, Q.; Yang, Z.; Meng, X. Weak Robustness Analysis of Close Subsynchronous Oscillation Modes’ Participation Factors in Multiple Direct-Drive Wind Turbines with the VSC-HVDC System. Diangong Jishu Xuebao/Trans. China Electrotech. Soc. 2023, 38, 754–769. [Google Scholar]
  5. Adams, J.; Carter, C.; Huang, S.-H. ERCOT Experience with Sub-Synchronous Control Interaction and Proposed Remediation. In Proceedings of the PES T&D 2012, Orlando, FL, USA, 7–10 May 2012; IEEE: Orlando, FL, USA; pp. 1–5. [Google Scholar]
  6. Sun, Z.; Cai, G.; Yang, D.; Liu, C.; Wang, B.; Wang, L. A Method for the Evaluation of Generator Damping During Low-Frequency Oscillations. IEEE Trans. Power Syst. 2019, 34, 109–119. [Google Scholar] [CrossRef]
  7. Ma, J.; Wang, L.; Shen, Y. Interaction Energy-Based Stability Analysis Method and Application in Grid-Tied Type-4 Wind Turbine Generator. IEEE J. Emerg. Sel. Top. Power Electron. 2021, 9, 5542–5557. [Google Scholar] [CrossRef]
  8. Chen, X.; Wu, X.; Gu, W.; Fan, L. Research on Energy Analysis and SSO Source Location Method for Power Grids with DFIGs Based on the Sub-Synchronous Modal Energy. Zhongguo Dianji Gongcheng Xuebao/Proc. Chin. Soc. Electr. Eng. 2023, 43, 5863–5876. [Google Scholar]
  9. Chen, W.; Yu, X.; Han, X.; Jia, Y.; Chang, X.; Guo, X. Analysis of Forced SSOs Excited by Subsynchronous Interharmonics From DPMSG-Based Wind Farms. IEEE Trans. Sustain. Energy 2021, 12, 978–989. [Google Scholar] [CrossRef]
  10. Xie, X.; Zhan, Y.; Shair, J.; Ka, Z.; Chang, X. Identifying the Source of Subsynchronous Control Interaction via Wide-Area Monitoring of Sub/Super-Synchronous Power Flows. IEEE Trans. Power Deliv. 2020, 35, 2177–2185. [Google Scholar] [CrossRef]
  11. Gao, B.; Wang, Y.; Xu, W.; Yang, G. Identifying and Ranking Sources of SSR Based on the Concept of Subsynchronous Power. IEEE Trans. Power Deliv. 2020, 35, 258–268. [Google Scholar] [CrossRef]
  12. Chen, L.; Min, Y.; Hu, W. Low Frequency Oscillation Analysis and Oscillation Source Location Based on Oscillation Energy. Part One: Mathematical Foundation and Energy Flow Computation. Dianli Xitong Zidonghua/Autom. Electr. Power Syst. 2012, 36, 22–27+86. [Google Scholar]
  13. Maslennikov, S.; Wang, B.; Litvinov, E. Dissipating Energy Flow Method for Locating the Source of Sustained Oscillations. Int. J. Electr. Power Energy Syst. 2017, 88, 55–62. [Google Scholar] [CrossRef]
  14. Maslennikov, S.; Litvinov, E. ISO New England Experience in Locating the Source of Oscillations Online. IEEE Trans. Power Syst. 2021, 36, 495–503. [Google Scholar] [CrossRef]
  15. Liu, C.; Diao, S.; Cai, G.; Zhang, Y.; Yu, F. Construction of Detailed Energy Function of Double-fed Induction Generator for Small Signal Stability Analysis of Power Systems with a High Penetration of Double-fed Induction Generator. IET Gener. Trans. Dist. 2022, 16, 4761–4774. [Google Scholar] [CrossRef]
  16. Wu, M.; Xie, L.; Cheng, L.; Sun, R. A Study on The Impact of Wind Farm Spatial Distribution on Power System Sub-Synchronous Oscillations. IEEE Trans. Power Syst. 2016, 31, 2154–2162. [Google Scholar] [CrossRef]
  17. Perera, U.; Oo, A.M.T.; Zamora, R. Sub Synchronous Oscillations under High Penetration of Renewables—A Review of Existing Monitoring and Damping Methods, Challenges, and Research Prospects. Energies 2022, 15, 8477. [Google Scholar] [CrossRef]
  18. Yan, X.; Chang, W.; Cui, S.; Rasool, A.; Jia, J.; Sun, Y. Recurrence of Sub-Synchronous Oscillation Accident of Hornsea Wind Farm in UK and Its Suppression Strategy. Energies 2021, 14, 7685. [Google Scholar] [CrossRef]
  19. Mourabit, Y.E.; Salime, H.; Bossoufi, B.; Motahhir, S.; Derouich, A.; Mobayen, S.; Zhilenkov, A. Enhanced Performance in PMSG-Based Wind Turbine Systems: Experimental Validation of Adaptive Backstepping Control Design. Energies 2023, 16, 7481. [Google Scholar] [CrossRef]
  20. Ashraf, A.; Saadi, M. The Impact of Phase-Locked Loop (PLL) Architecture on Sub-Synchronous Control Interactions (SSCI) for Direct-Driven Permanent Magnet Synchronous Generator (PMSG)-Based Type 4 Wind Farms. World Electr. Veh. J. 2023, 14, 206. [Google Scholar] [CrossRef]
  21. Chao, W.; Deng, C.; Huang, J.; Dai, L.; Min, Y.; Cheng, Y.; Wang, Y.; Liao, J. A Sub-Synchronous Oscillation Suppression Strategy Based on Active Disturbance Rejection Control for Renewable Energy Integration System via MMC-HVDC. Electronics 2023, 12, 2885. [Google Scholar] [CrossRef]
Figure 1. Grid-connected topology structure of D-PMSGs.
Energies 17 01683 g001
Figure 2. The process diagram of the method used in this paper.
Energies 17 01683 g002
Figure 3. Comparison of energy curves between amplitude-phase motion-equation model and simulation model.
Energies 17 01683 g003
Figure 4. D-PMSG output active-power curve (weak damping-type SSO).
Energies 17 01683 g004
Figure 5. D-PMSG refine energy curve.
Energies 17 01683 g005
Figure 6. Sensitivity of each state variable.
Energies 17 01683 g006
Figure 7. D-PMSG output active-power curve (forced-oscillation-type SSO).
Energies 17 01683 g007
Figure 8. Refined energy decomposition diagram: (a) synthesize the total energy and the energy component dominated by the phase-locked loop; (b) the DC voltage ring dominated the energy component; and (c) the energy component dominated by the current loop.
Energies 17 01683 g008
Table 1. Parameters used in the simulation process.
ParametersNumerical Value
System reference valueLine-voltage reference value Vbase690 V
Frequency reference value fbase50 Hz
Power reference value Sbase2 MW
Normal grid inductance Lg0.63 mH
Weak grid inductance Lg11.7 mH
Parameters of D-PMSGDC capacitor Cdc0.1 F
Filter inductance Lf0.1 p.u.
Grid-side d-axis current control parameters kpd, kid0.3, 160
DC voltage control reference value Udcref1 p.u.
DC voltage control parameters kpdc, kidc3.5, 140
Phase-locked control parameters kpp, kip50, 2000
Grid-side q-axis current-control parameters kpq, kiq0.3, 160
Table 2. State variable grouping.
ModuleCorresponding State Variables
ShaftingFan speed ωs
Direct-drive permanent magnet synchronous generatorStator d, q axis current ids, iqs
ConverterDirect current voltage udc
Fixed d-axis current of machine-side converter x1
The fixed speed of the outer ring and inner ring of the machine-side converter x2, x3
The outer ring and inner ring of the grid-side converter are fixed DC voltage x4, x5
Fixed q-axis current of grid-side converter x6
Collecting power linesThe d-axis and q-axis currents at the outlet of the grid-side converter idg, iqg
The d-axis and q-axis voltage of the grid-side converter outlet udg, uqg
PLLxa, xb
Disclaimer/Publisher’s Note: The statements, opinions and data contained in all publications are solely those of the individual author(s) and contributor(s) and not of MDPI and/or the editor(s). MDPI and/or the editor(s) disclaim responsibility for any injury to people or property resulting from any ideas, methods, instructions or products referred to in the content.

