Article

Characteristics of Micro–Nano-Pores in Shallow Shale Gas Reservoirs and Their Controlling Factors on Gas Content

1
National Key Laboratory of Petroleum Resources & Engineering, China University of Petroleum, Beijing 102249, China
2
Unconventional Petroleum Science and Technology Institute, China University of Petroleum, Beijing 102249, China
3
PetroChina Zhejiang Oilfield Company, Hangzhou 310000, China
*
Author to whom correspondence should be addressed.
Energies 2024, 17(7), 1682; https://doi.org/10.3390/en17071682
Submission received: 31 December 2023 / Revised: 19 March 2024 / Accepted: 29 March 2024 / Published: 1 April 2024
(This article belongs to the Section H: Geo-Energy)

Abstract

:
This investigation ventures into the nuanced porosity traits of shallow shale gas reservoirs, pinpointing the critical determinants of their gas content with a nuanced touch. By harnessing sophisticated microscopy and analytical methods, we embarked on an exploration into the porosity architecture of shale, identifying the distinct pore spaces that harbor shale gas and applying gas adsorption techniques to evaluate its storage potential. Noteworthy is our utilization of diverse adsorption mechanisms and models to accurately fit methane adsorption data while carefully considering the influence of marine shallow shale’s pore structure peculiarities, total organic carbon (TOC) content, and clay mineral content on its adsorption prowess. We introduce a refined model for appraising gas adsorption volumes, an innovative stride toward bolstering the precise estimation of reserves in marine dam shallow shale gas and shedding light on accurate gas adsorption volume calculations in analogous shallow shale gas scenarios. This manuscript offers profound insights into the sophisticated interplay between shale porosity and gas storage, enriching our understanding and enabling more accurate future resource estimations.

1. Progress in the Study of Pore Characteristics and Gas Content in Shale Gas Reservoirs

Shale gas, as a significant unconventional natural gas resource, has garnered widespread attention in the global energy sector [1,2]. The investigation of shallow shale porosity characteristics and the study of factors controlling gas content hold paramount importance in the realms of modern geology and energy development [3]. Firstly, as a clean and efficient unconventional natural gas resource, shale gas occupies an indispensable position within the global energy mix [4]. An in-depth exploration of the porosity traits of shallow shale can aid scientists and engineers in better understanding the gas storage mechanisms and flow properties of shale gas reservoirs. This understanding is crucial for evaluating the potential of shale gas resources, optimizing extraction methods, and enhancing gas recovery efficiency [5]. This manuscript not only elucidates the scientific significance of studying shallow shale porosity and gas content control factors but also emphasizes the role of shale gas in advancing a sustainable and efficient global energy landscape.
The primary storage spaces for shale gas are located within the micro- to nanoscale pores of shale, rendering in-depth analysis of its microscopic pore structure particularly crucial. The characterization techniques for shale porosity can be broadly categorized into two main types: those based on physical experimental measurements and those relying on high-resolution imaging observations [6]. In physical experimental measurement techniques, depending on the pore size, methods primarily include low-temperature nitrogen adsorption, low-temperature carbon dioxide adsorption, high-pressure mercury intrusion, and nuclear magnetic resonance (NMR) technologies [7]. Each technique targets pores within different size ranges; for example, low-temperature gas adsorption is suitable for detecting mesopores and micropores [8], while high-pressure mercury intrusion is more apt for characterizing macropores [9]. Although these methods have their strengths, limitations exist, such as the potential for high-pressure mercury intrusion to damage samples [10], whereas low-temperature gas adsorption can avoid sample destruction, thereby increasing sample usability [11]. On the other hand, high-resolution imaging techniques employ various microscopic imaging technologies, such as optical microscopy and scanning electron microscopy (SEM), to directly observe the micro-features of shale pores [12,13,14]. These technologies provide intuitive images of pore structures but, due to the extremely small size of shale pores, require very high imaging resolutions [15,16]. Common experimental methods include isothermal adsorption experiments and high-pressure methane adsorption experiments. These experiments can determine the adsorption capacity of methane in shale under different conditions (such as varying temperatures and pressures) [17,18].
To predict and calculate the gas content of shale gas, researchers have developed experimental methods for determining gas content more accurately. These models and methods are designed to combine the pore characteristics of shale and the adsorption behavior of methane to provide more precise estimates of gas content. As early as 1915, Gibbs proposed the Gibbs adsorption equation based on classical thermodynamics, applicable to all interfaces [19]. In 1918, Langmuir introduced the classic monolayer adsorption model theory, which later became the Langmuir model [20]. In 1930, Mikhail I. Temkin proposed the original Temkin model [21], and in 1938, S. Brunauer, P.H. Emmett, and E. Teller derived the multilayer adsorption model equation based on monolayer adsorption, the BET (Brunauer–Emmett–Teller) model [22]. In the exploration of gas adsorption mechanisms, various theoretical models have been widely used to deepen the understanding of the adsorption process. These models include but are not limited to the Langmuir, Freundlich, and Temkin adsorption models, which provide a foundation for revealing the adsorption characteristics of gases such as methane on catalyst surfaces and within shale pores [23,24,25]. With the advancement of research, the phenomenon of adsorption under high-pressure conditions has prompted scholars to compare and revise traditional models, thereby proposing improved theories such as Toth–Langmuir and multicomponent adsorption [26]. Furthermore, in response to the complex behavior of methane adsorption, more advanced models such as Sips, Freundlich–Langmuir, and Redlich–Peterson have been developed to achieve the accurate fitting of adsorption data [27]. Recently, the proposal of micropore filling theory and the development of multiscale models based on the Sips model have provided new perspectives for the study of gas transport and adsorption mechanisms in microporous structures [28,29]. Especially considering the complexity of conditions such as multilayer adsorption, supercritical adsorption, and exceptionally high pressure in shale gas, the BET adsorption model has been modified to enhance its relevance and accuracy in practical applications [30,31]. The advancements in these theories have not only propelled a deeper understanding of adsorption science but also provided solid theoretical support for the exploitation and application of shale gas.
This study plans to first conduct mineral analysis; scanning electron microscopy; specific surface area and pore size analysis; low-temperature nitrogen adsorption; and methane isotherm adsorption experiments on samples collected from the research area. Following the analysis of empirical data to clarify the microstructural pore characteristics and properties of shallow marine shale gas, different adsorption mechanisms and models will be employed to fit the methane adsorption capacity. This will also consider the impact of marine shale pore structure features, total organic carbon (TOC) content, and clay mineral content on shale adsorption capacity. By establishing the correlation of these parameters with experimental parameters such as maximum adsorption capacity through nonlinear regression fitting, this study aims to refine the gas content calculation model, enhance the precision of model computations, and provide support for accurate reserve estimation.

2. Sample and Experimental Methods

2.1. Sample Description

The research area of this study is located in the central part of the Zhaotong shale gas demonstration area in the Wumeng Mountain area, which transitions from the Yunnan–Guizhou Plateau to the Sichuan Basin. It is situated at the overlap of the western margin of the Yangtze Craton’s Sanjiang orogenic belt and the forefront of the southeastern margin’s Jiangnan–Xuefeng structural zone. The specific study range is within the pink rectangle, developing structural units from north to south in sequence, including the Taiyang anticline, the Xuyong syncline, the Haiba anticline, and the Hualang syncline (Figure 1). The samples for this study were collected from the Wufeng Formation of the Upper Ordovician (O3w) and the Longmaxi Formation of the Lower Silurian (S1L), with codes S1L111 to L114. The burial depth ranges from 2000 m to 500 m, and the lithology is predominantly black marine shale.

2.2. Experimental Methods and Procedures

2.2.1. Analysis of Microporosity Structure

Scanning electron microscopy (SEM) represents the most prevalent method for examining the microstructural characteristics of shale’s pore spaces, enabling the precise identification of microscopic pores and fracture types through high-resolution SEM imagery, thus determining the distribution features of shale pores [32,33]. In this SEM analysis, the equipment employed was the Quanta FEG 450 field emission scanning electron microscope from FEI Company (Hillsboro, OH, USA). The detailed experimental procedure commenced with the collected shale core samples first cut into small cubic pieces of approximately 0.8 cm in edge length. These pieces were then solidified with AB adhesive for over four hours, followed by polishing with a polishing wheel to achieve a smooth surface. This was succeeded by extensive polishing with argon ions for four hours at a working voltage of 5 kv and a current of 2.2 mA. Finally, the samples were affixed to an SEM stub using carbon coating for scanning. The raw grayscale images obtained from scanning were converted into binary images, which were then subjected to image analysis using the Image J software (V1.8.0) to investigate the pore structure characteristics of the samples.

2.2.2. Analysis of Mineral Content

Prior to all experiments and analyses, the shale samples collected underwent necessary pre-treatment to ensure that they met the standards and requirements of the study. Total organic carbon (TOC) measurement was conducted using a YQ-VIIIA-type oil and gas show evaluation instrument. The samples were ground to a particle size of about 100 mesh to ensure uniformity. Inorganic carbon was removed from the samples through dilute hydrochloric acid treatment. The samples were then dried at specified temperatures to remove moisture. The treated samples were placed in a TOC analyzer. Under anoxic conditions, the samples were heated to a range of temperatures, typically from 300 °C to 1000 °C, to record the number of hydrocarbons released by pyrolysis, including parameters such as S0, S1, S2, S3, S4, Tmax, and RC, thereby evaluating the organic matter richness and hydrocarbon generation potential of the rock. Additionally, to determine the mineral composition of the samples, X-ray diffraction (XRD) technology was used. All samples were ground to a fine powder of about 100 mesh and then analyzed using a Panalytical X’Pert PRO MPD X-ray diffractometer (Almelo, Netherlands, utilizing Cu Kα radiation, a working voltage of 40 kV, and a current of 40 mA) at angles ranging from 5° to 45°, with a scanning rate of 2°/min.

2.2.3. Low-Temperature Nitrogen Adsorption Experiment

This study initially involved the preliminary preparation of shale samples from different stratigraphic levels and burial depths, including sieving the samples to a specific granularity of 150 mesh and employing high-vacuum degassing at a temperature of 80 °C to remove physically adsorbed substances from the sample surfaces. Following this, the Micromeritics ASAP2420 surface area and porosity analyzer was used to conduct low-temperature nitrogen adsorption experiments at approximately 77 K. The total surface area and pore size distribution of the samples were calculated using the Brunauer–Emmett–Teller (BET) equation and the Barrett–Joyner–Halenda (BJH) algorithm, with a detailed analysis of the experimental data performed. The primary aim of this research was to analyze the trends in surface area, pore size distribution, and pore volume in shale samples from the Longmaxi to Wufeng Formations. Additionally, this study explored the correlation between these changes and the total organic carbon (TOC) content.

2.2.4. Methane Isotherm Adsorption Experiments and Adsorption Isotherm Curve Fitting

To measure the methane adsorption isotherms, approximately 100 g of crushed and sieved samples with diameters ranging from 0.84 mm to 2.36 mm (8 to 20 mesh) were used. Prior to analysis, all samples were dried at 110 °C and subjected to vacuum degassing for 7 h to fully eliminate impurity gases and moisture from the internal voids. All measurements were conducted at 40 °C using a high-pressure gas adsorption analyzer (3H-2000PH690, Micromeritics Instrument Corporation, Norcross, GA, USA), which operates within a temperature range of 20 °C to 70 °C and a pressure range of 0 to 30 MPa, employing the volumetric method.
Subsequently, we utilized three different models—Langmuir, spreading pressure-dependent real gas (SDR), and Ono–Kondo—to fit the methane adsorption data and compare the fitting precision of these three models to select the most suitable one for in-depth analysis. Through the Langmuir and SDR models, we calculated the maximum absolute adsorption capacity and adsorption phase density for each sample. Coupled with information on total organic carbon (TOC) content, specific surface area, and pore volume, we explored the factors influencing these parameters.
N e x = V L P P L + P 1 ρ g a s ρ a d s
V e x ( p ) = T O C V L p p L + p 1 ρ f r e e ρ a d s
Many scholars have introduced an excess adsorption correction term based on the behavior that supercritical shale methane adsorption follows Gibbs’s excess adsorption, resulting in the excess adsorption isotherm model (Equation (1)) [22,34,35,36]. Wenbin J, et al. [25] proposed the modified Langmuir equation (Equation (2)) on this basis, which includes three key parameters: VL, PL, and ρads, primarily utilized to simulate the behavior of excess adsorption isotherms, Vex(p). In this context, VL signifies the maximum adsorption capacity (measured in g/mL), PL refers to the Langmuir pressure (in MPa), and ρads indicates the density of the adsorbed phase (in g/cm3). Additionally, ρfree represents the density of free gas at a specific pressure, P (in MPa) (in g/cm3). This study opts to employ the revised Langmuir equation given its reduced parameter count and the clear physical significance of each parameter, thereby making the equation more straightforward to understand and interpret. However, it is crucial to emphasize that this mathematical formulation does not suggest that methane adsorption in shale strictly adheres to the monolayer adsorption mechanism proposed in the Langmuir model, particularly under actual reservoir conditions.

2.3. Analysis of Experimental Results

2.3.1. Electron Microscopy Analysis of Micropore Characteristics

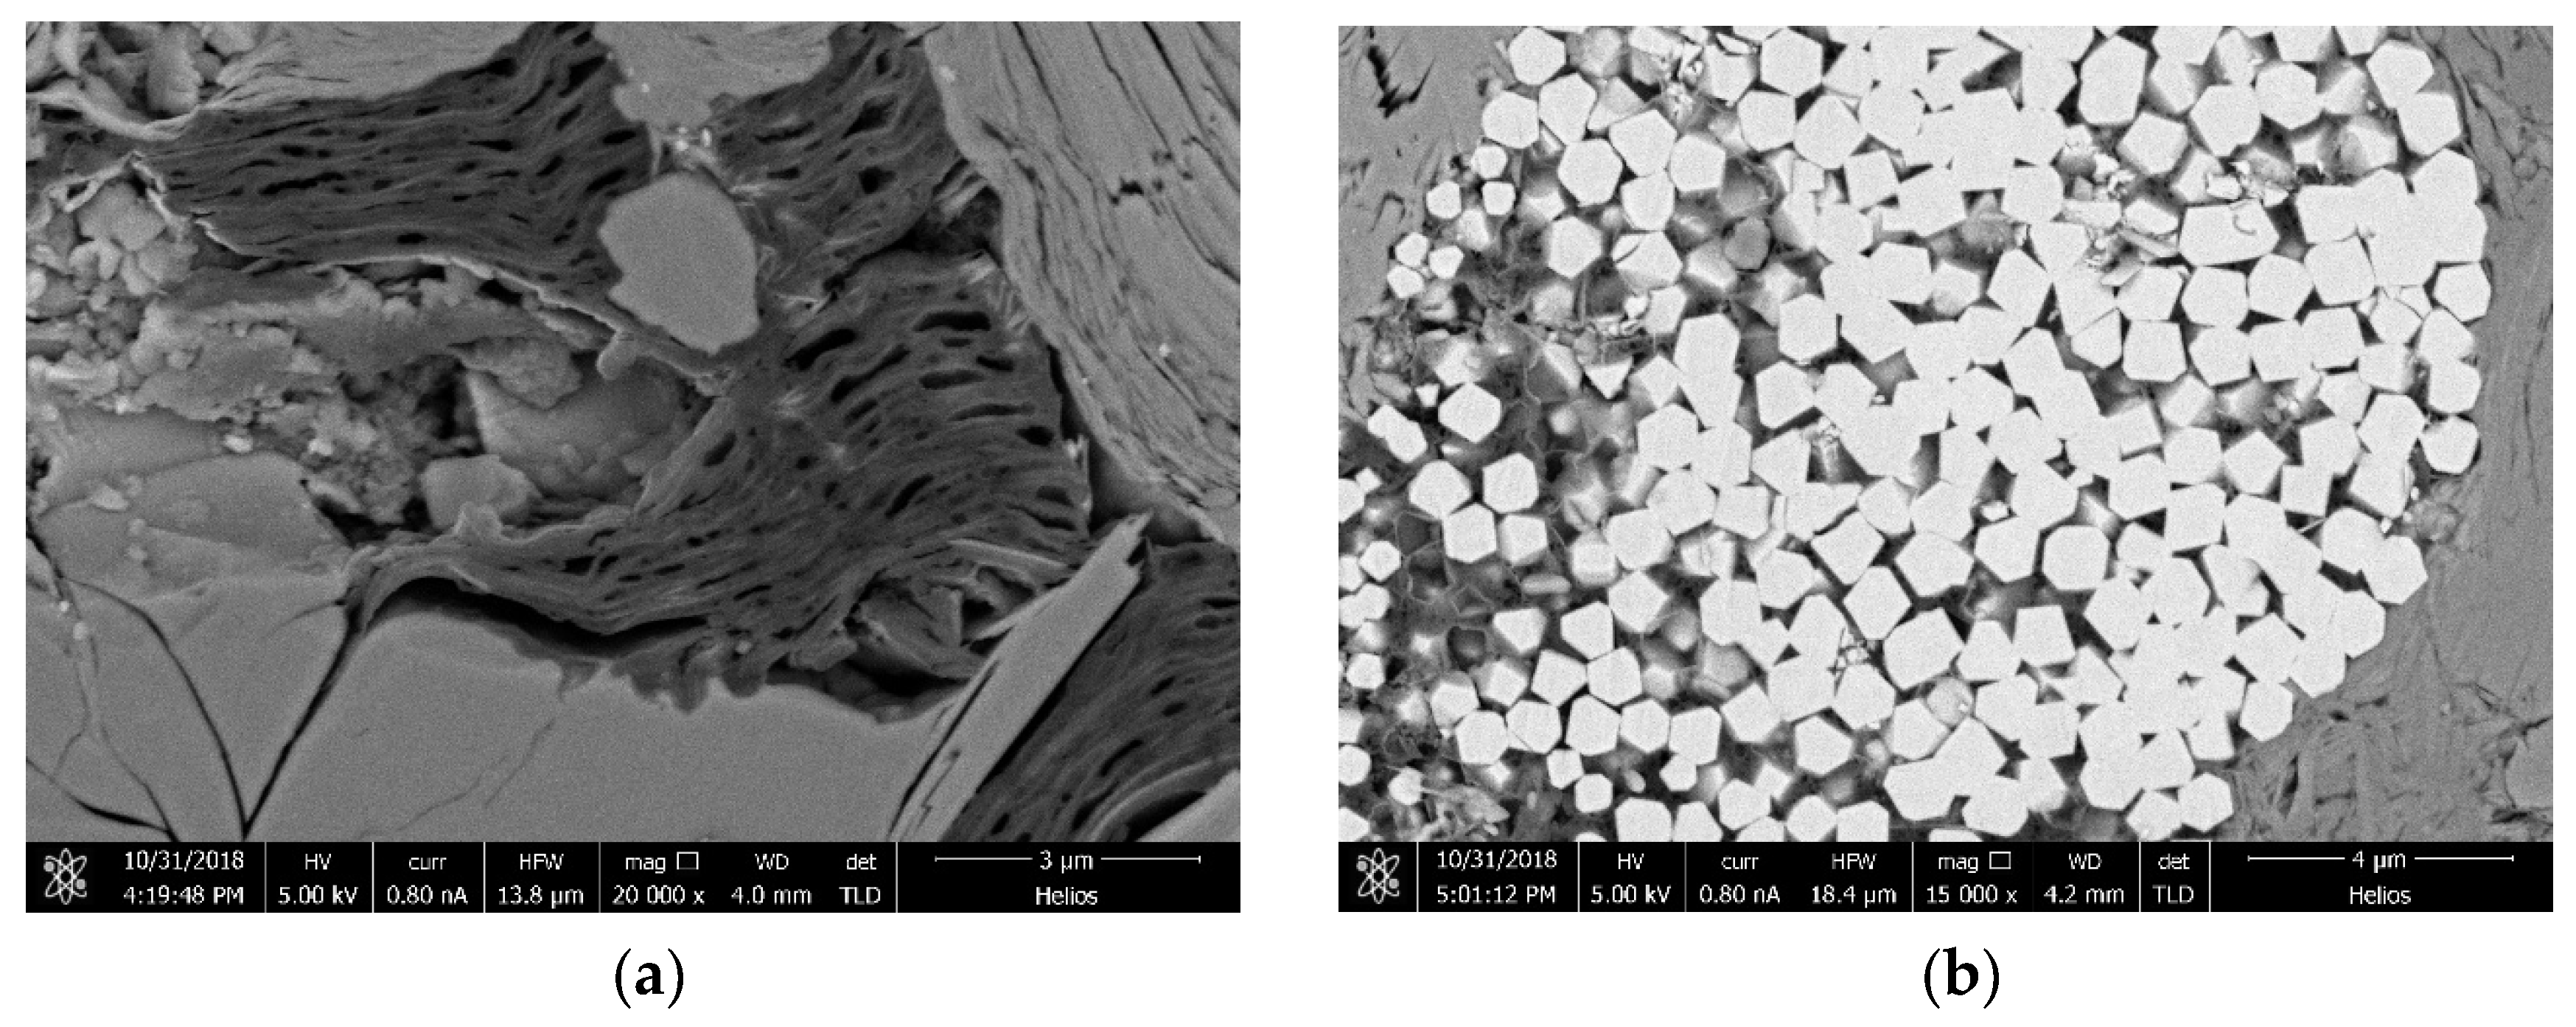
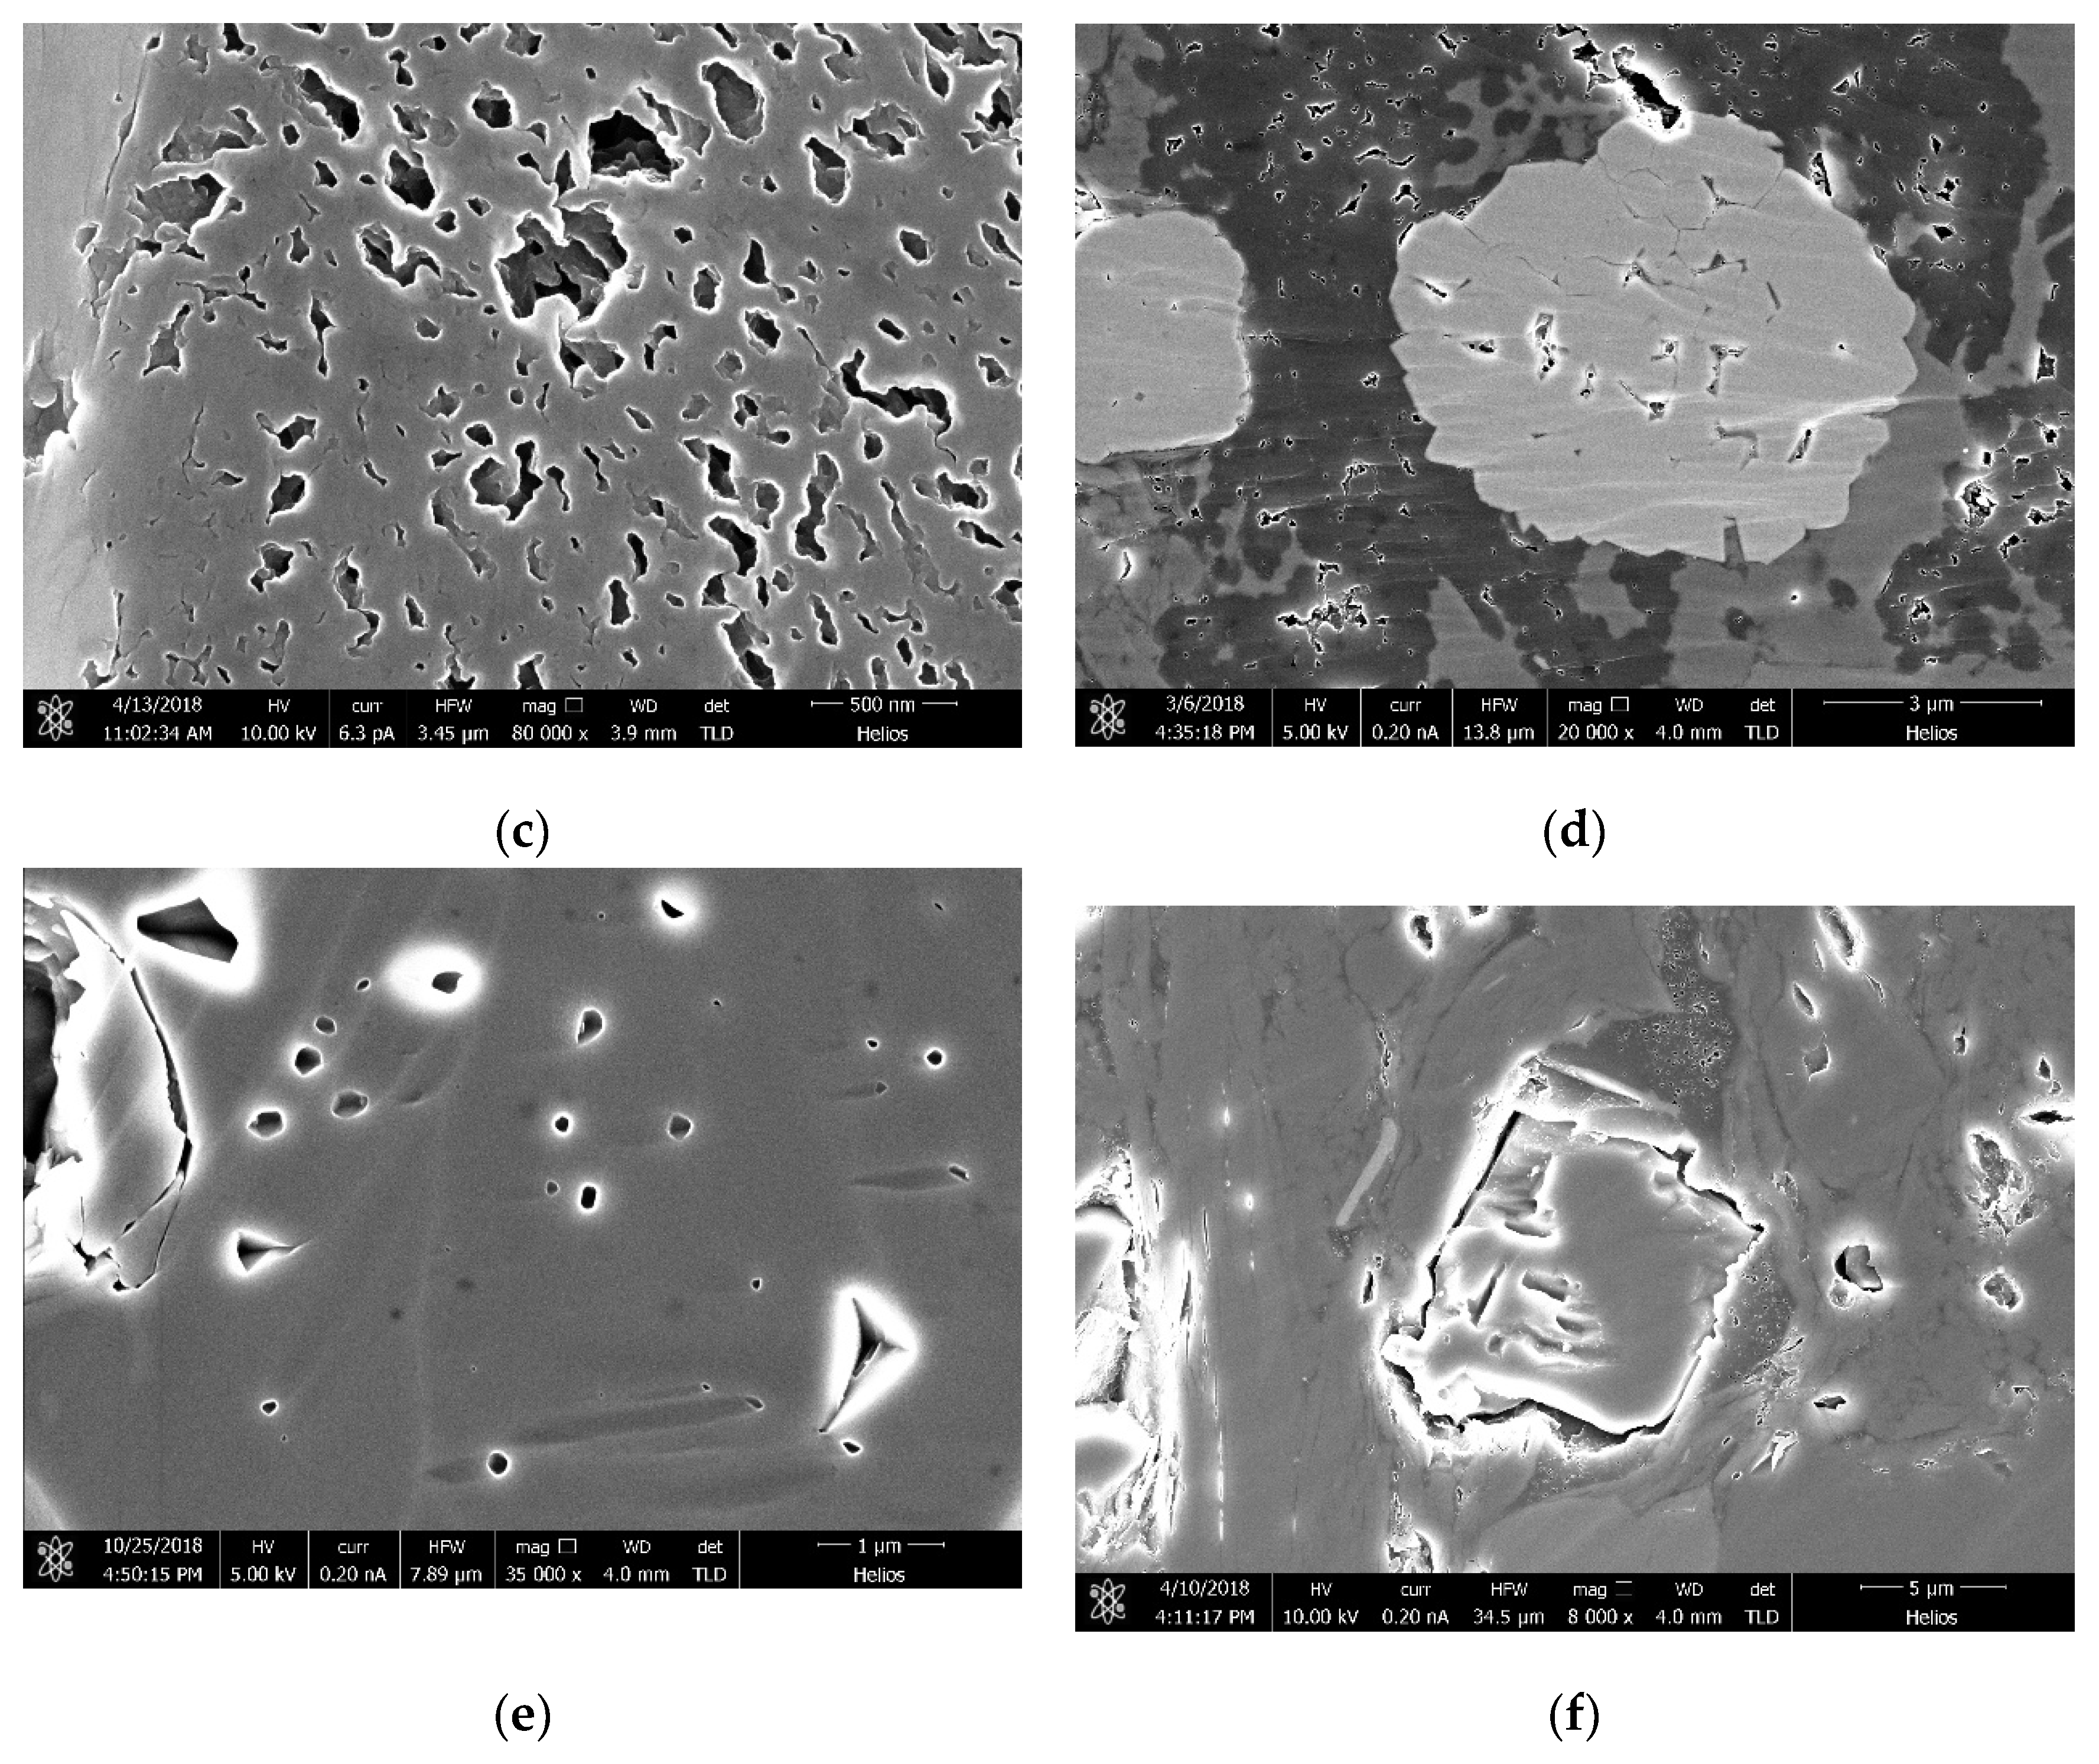
As illustrated in Figure 2, through observations using scanning electron microscopy (SEM) and detailed statistical analysis of samples from the study area, we identified the primary pore types in the gas storage spaces to include organic matter pores, intergranular pores, intragranular pores, and microfractures. Among these pores, organic matter, predominantly of type III kerogen, exhibited a moderate development level, primarily characterized by elongated clay associations and in situ autogenic pores. Microfractures are commonly filled with organic matter.
The morphology and distribution of organic matter can be categorized into several types: regular-shaped organic matter, primarily distributed as isolated dots; dispersed amorphous organic matter, often concentrated between clay mineral particles and authigenic quartz grains, especially the organic matter between quartz grains, which tends to be net-like in distribution with organic matter of varying sizes interconnected; pore-filling organic matter, such as dissolution pores, clay pores, and pyrite-intergranular-filled organic matter—these types of organic matter are mostly flake-like in distribution among clay mineral particles, with some forming a network, although their connectivity is relatively poor; and organic matter associated with other minerals, commonly found in association with clay minerals.
Based on the origin of organic matter, it can be classified into two major categories: migrated organic matter and sedimentary organic matter. Migrated organic matter primarily resides within mineral pores and consists of asphalt or petroleum that has migrated from external locations. With increasing thermal maturity, it can transform into solid asphalt or pyrobitumen. Its typical characteristic is the development of authigenic minerals around the organic matter perimeter. Sedimentary organic matter, on the other hand, comprises the original organic material and its alteration products, which have not undergone migration. This category mainly includes kerogen and its evolution into solid asphalt or pyrobitumen, characterized by clear boundaries with inorganic minerals and the absence of surrounding authigenic minerals.
In SEM imaging analysis, types of organic pores include elongated-clay-associated organic pores, pyrite-associated organic pores, and in situ autogenic organic pores, among others. These organic pores exhibit a variety of shapes, including irregular, flattened, and circular forms, reflecting the complexity and diversity of the reservoir’s microstructure.

2.3.2. Total Organic Carbon and Mineral Content

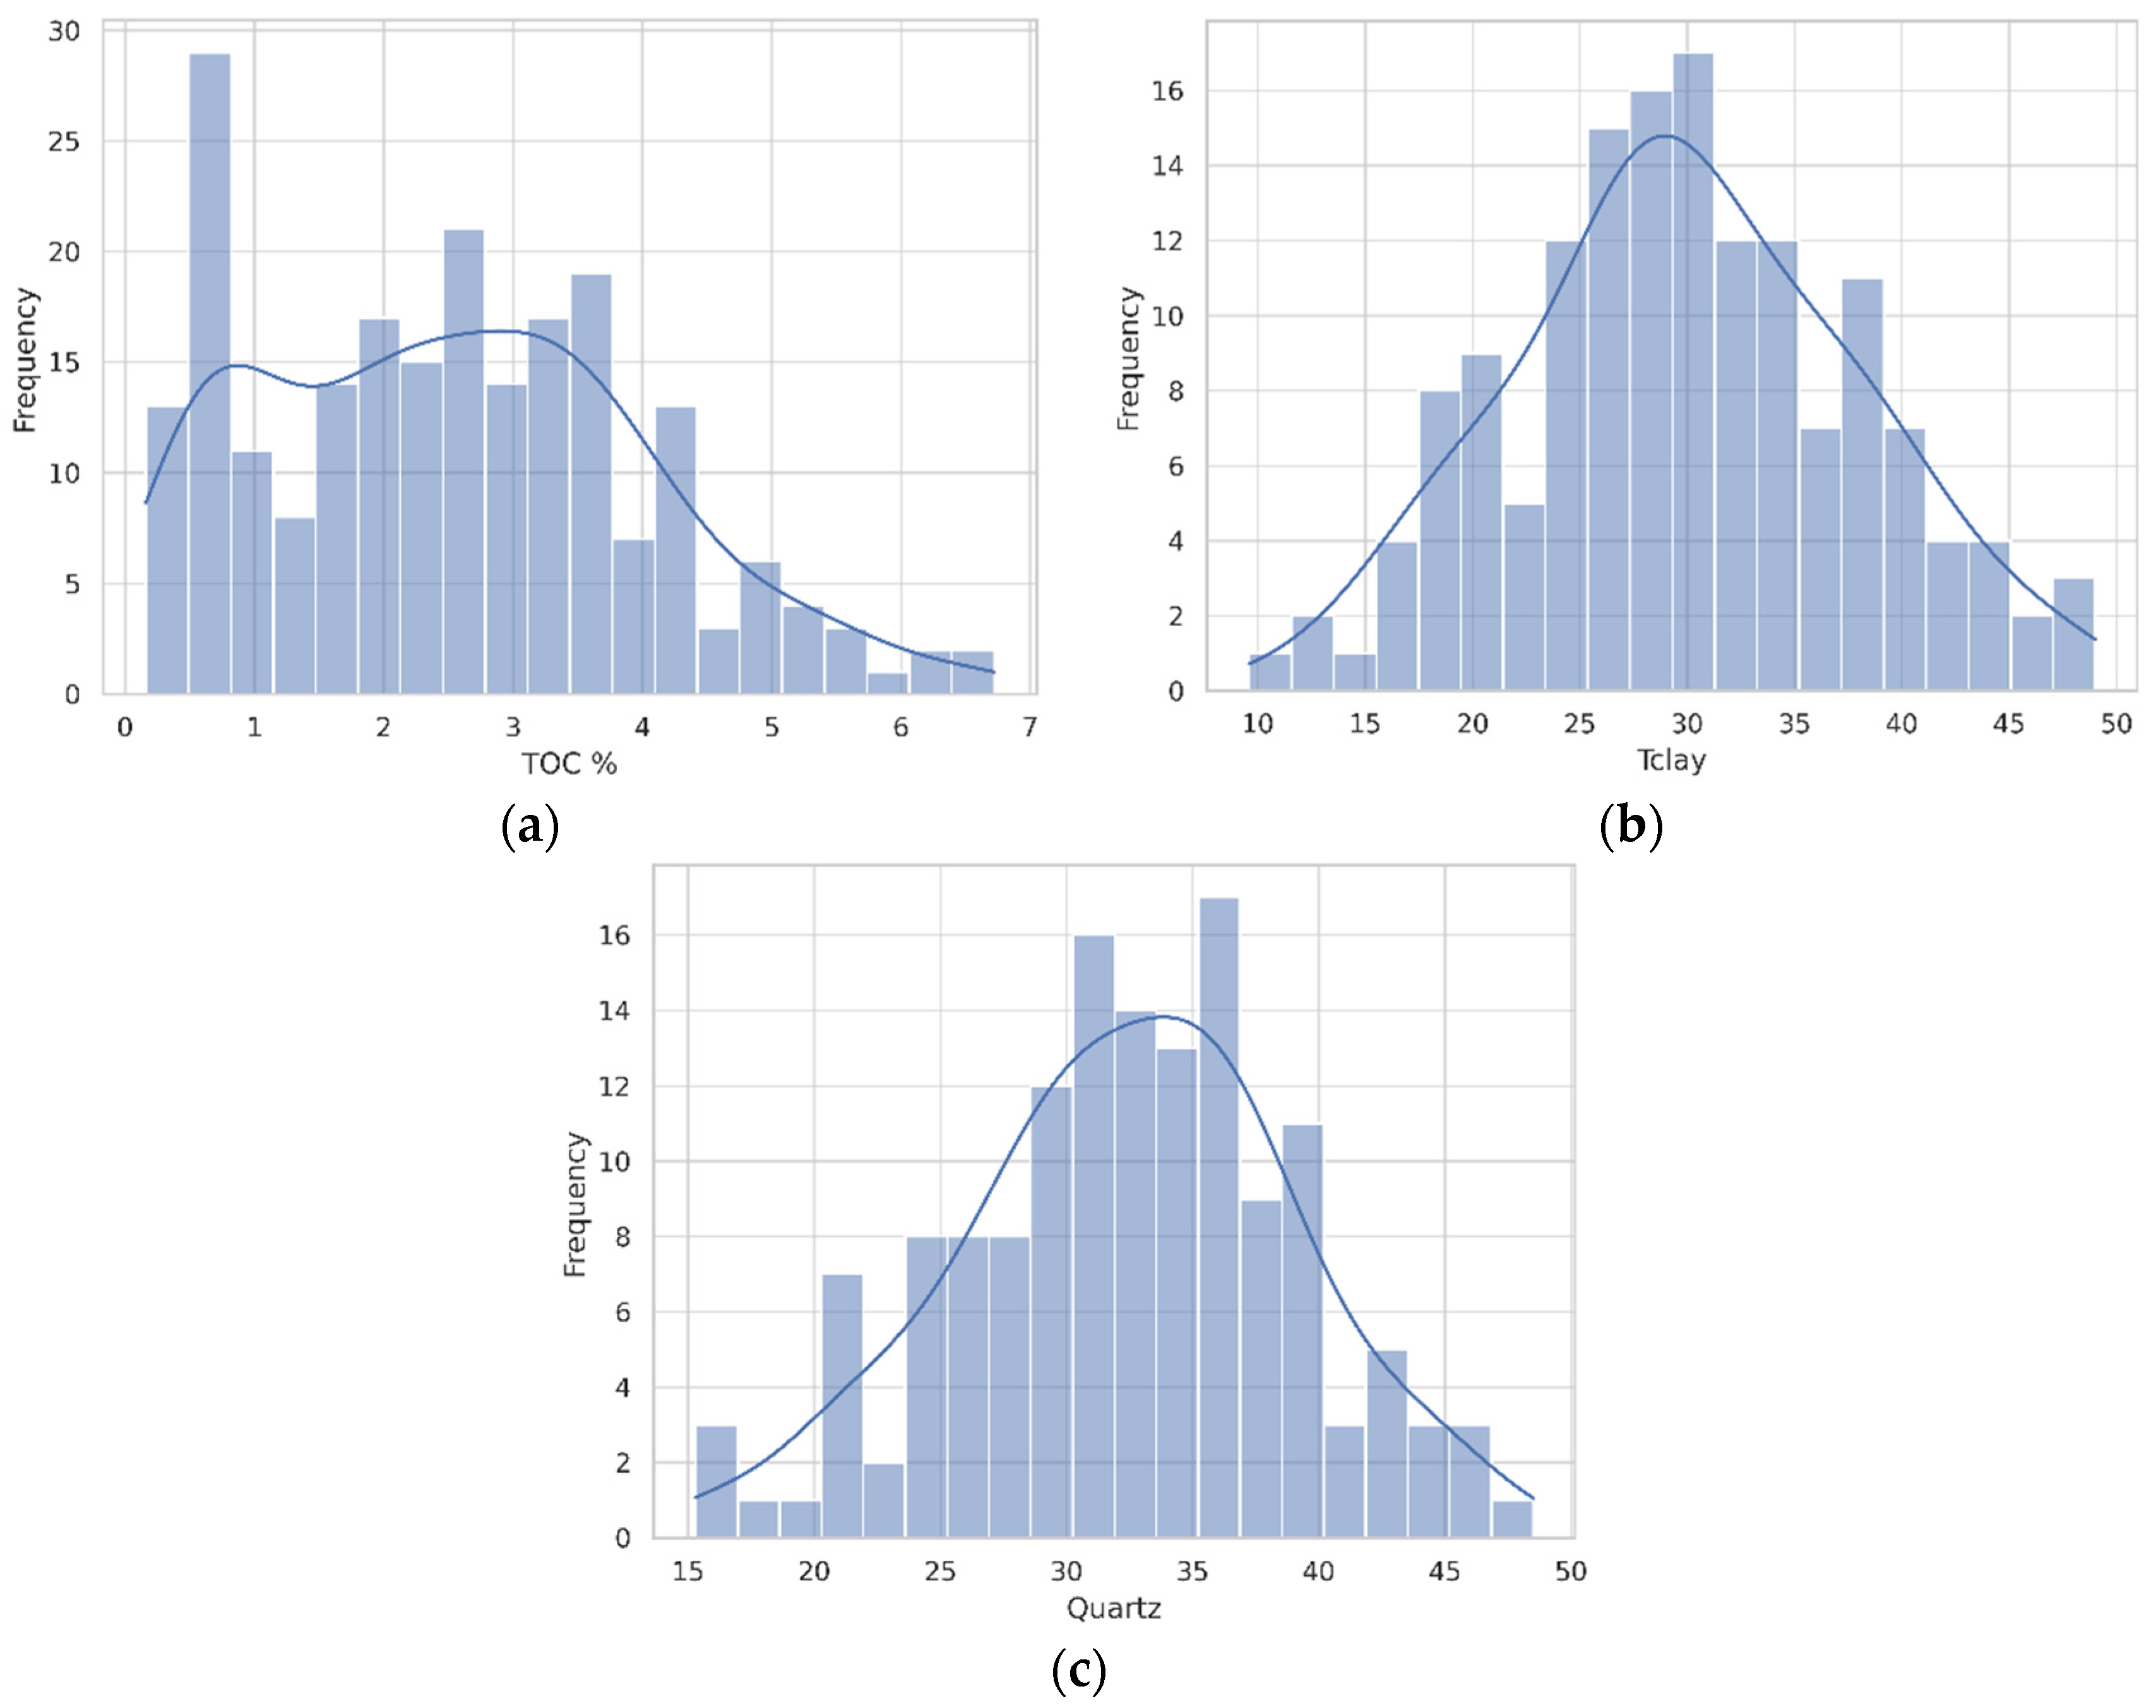
Figure 3 displays the distribution of total organic carbon (TOC), the content of clay minerals (TClays), and quartz mineral content measured via X-ray diffraction in 155 samples from the study area. The TOC values of the samples in the study area range from 0.16% to 7.4%, with an average value of 2.55% and a standard deviation of 1.53%. The TClay values range from 7.8% to 49.0%, with an average value of 29.63% and a standard deviation of 8.29%. Meanwhile, the X-ray diffraction quartz mineral content ranges from 7.0% to 63.3%, with an average value of 32.98% and a standard deviation of 8.79%.
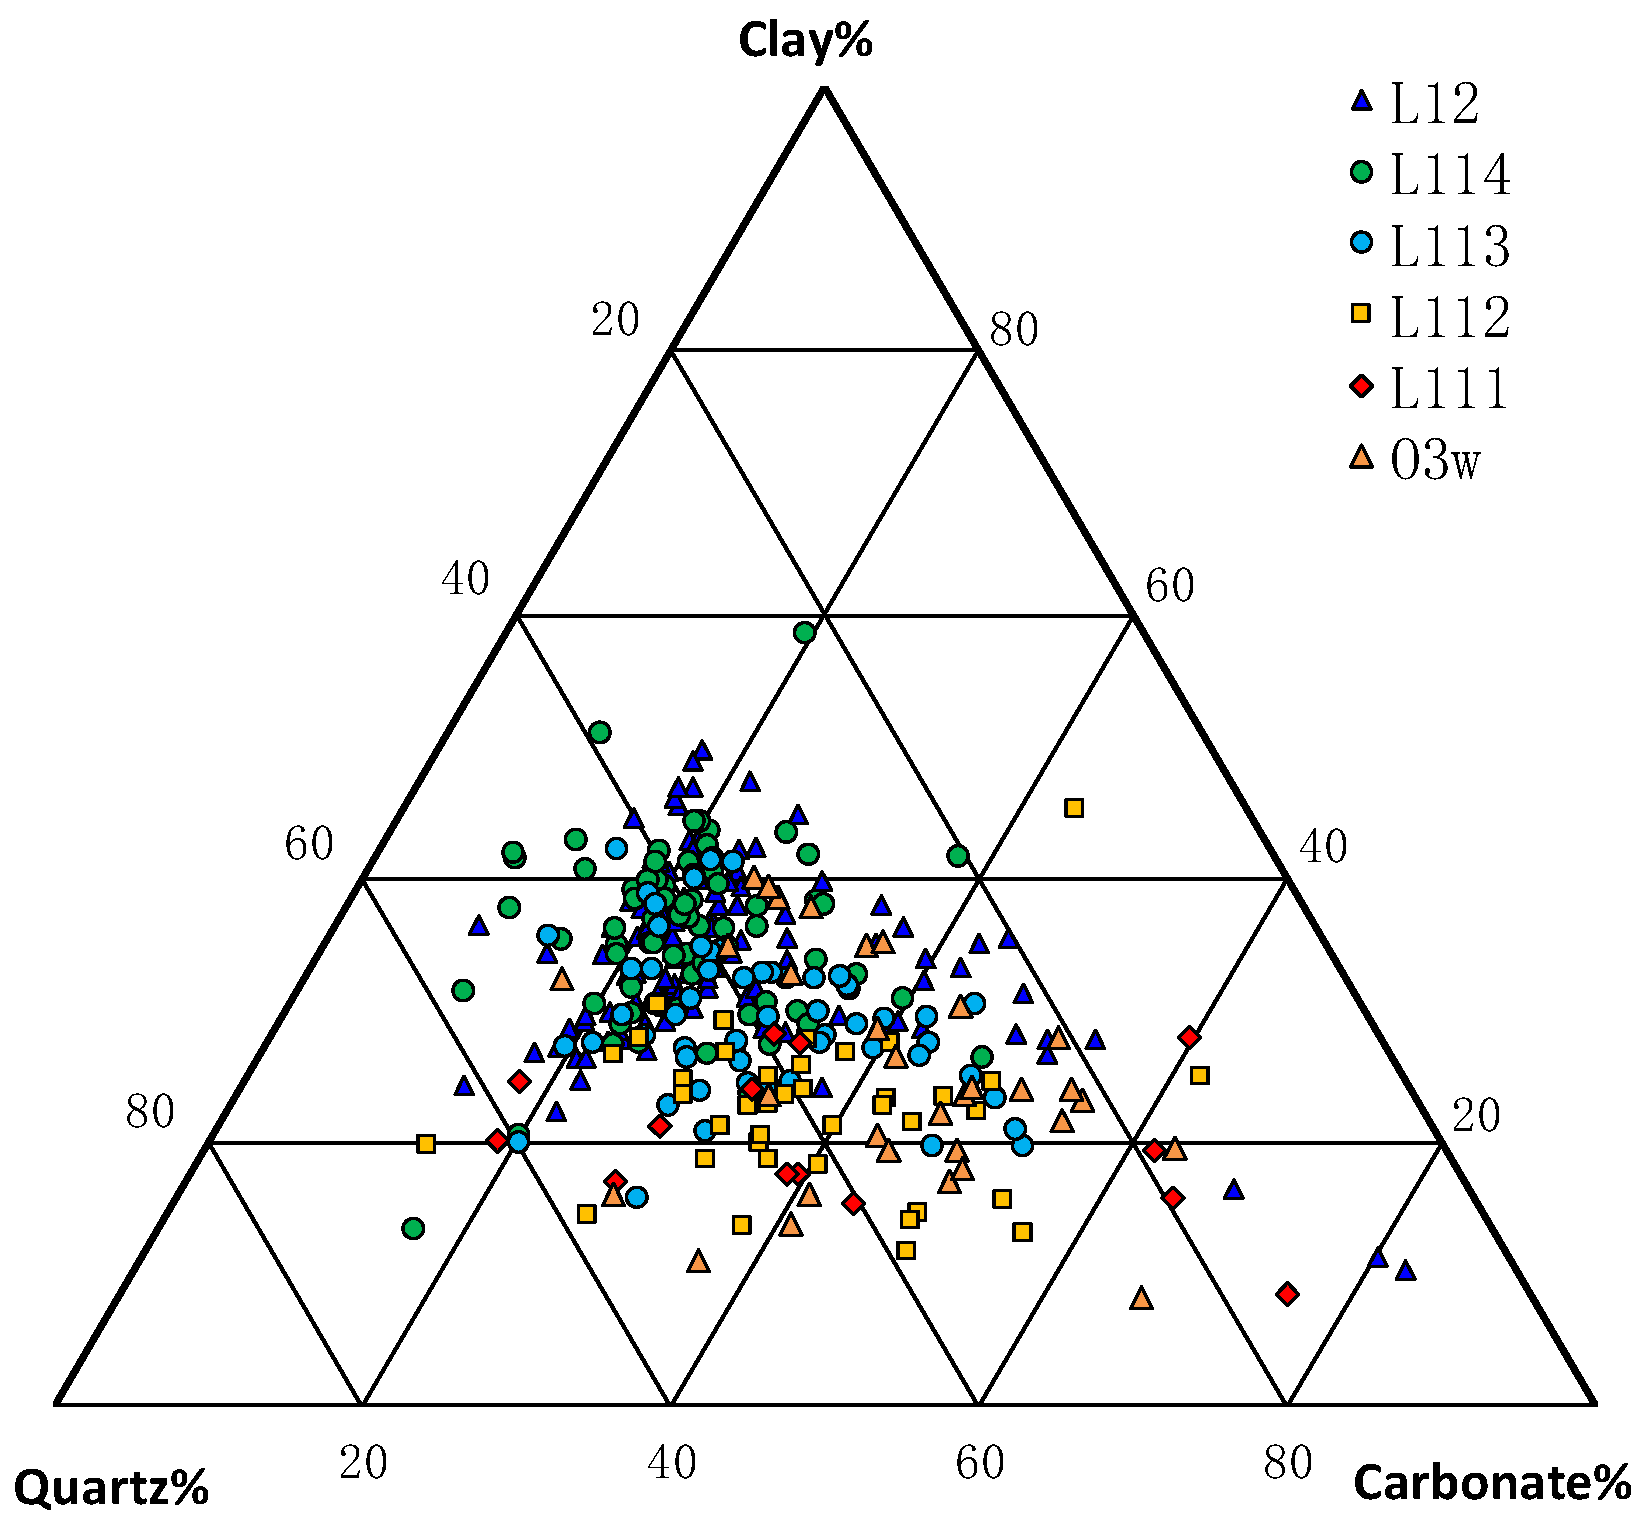
As shown in Figure 4, the analysis of whole-rock minerals and clay minerals from 155 samples across 31 wells in the target area reveals that the Haiba Wufeng–Longmaxi Formation is predominantly composed of quartz, with an average content of 34.42%, followed by carbonate minerals, with an average of 34.94%, and clay minerals, averaging 26.74%. Among the clay minerals, illite is the dominant type, averaging 55.8%, followed by mixed-layer illite/montmorillonite, averaging 29.32%. The content of brittle minerals is relatively high, accounting for 34.4%, indicating the rocks’ moderate brittleness. Vertically, within a single well, as the burial depth increases, the content of illite in the Longmaxi Formation gradually decreases. Horizontally, the correlation between burial depth and mineral composition is not significant; high-quality reservoirs with high gas content tend to have lower illite content.

2.3.3. Specific Surface Area Analysis

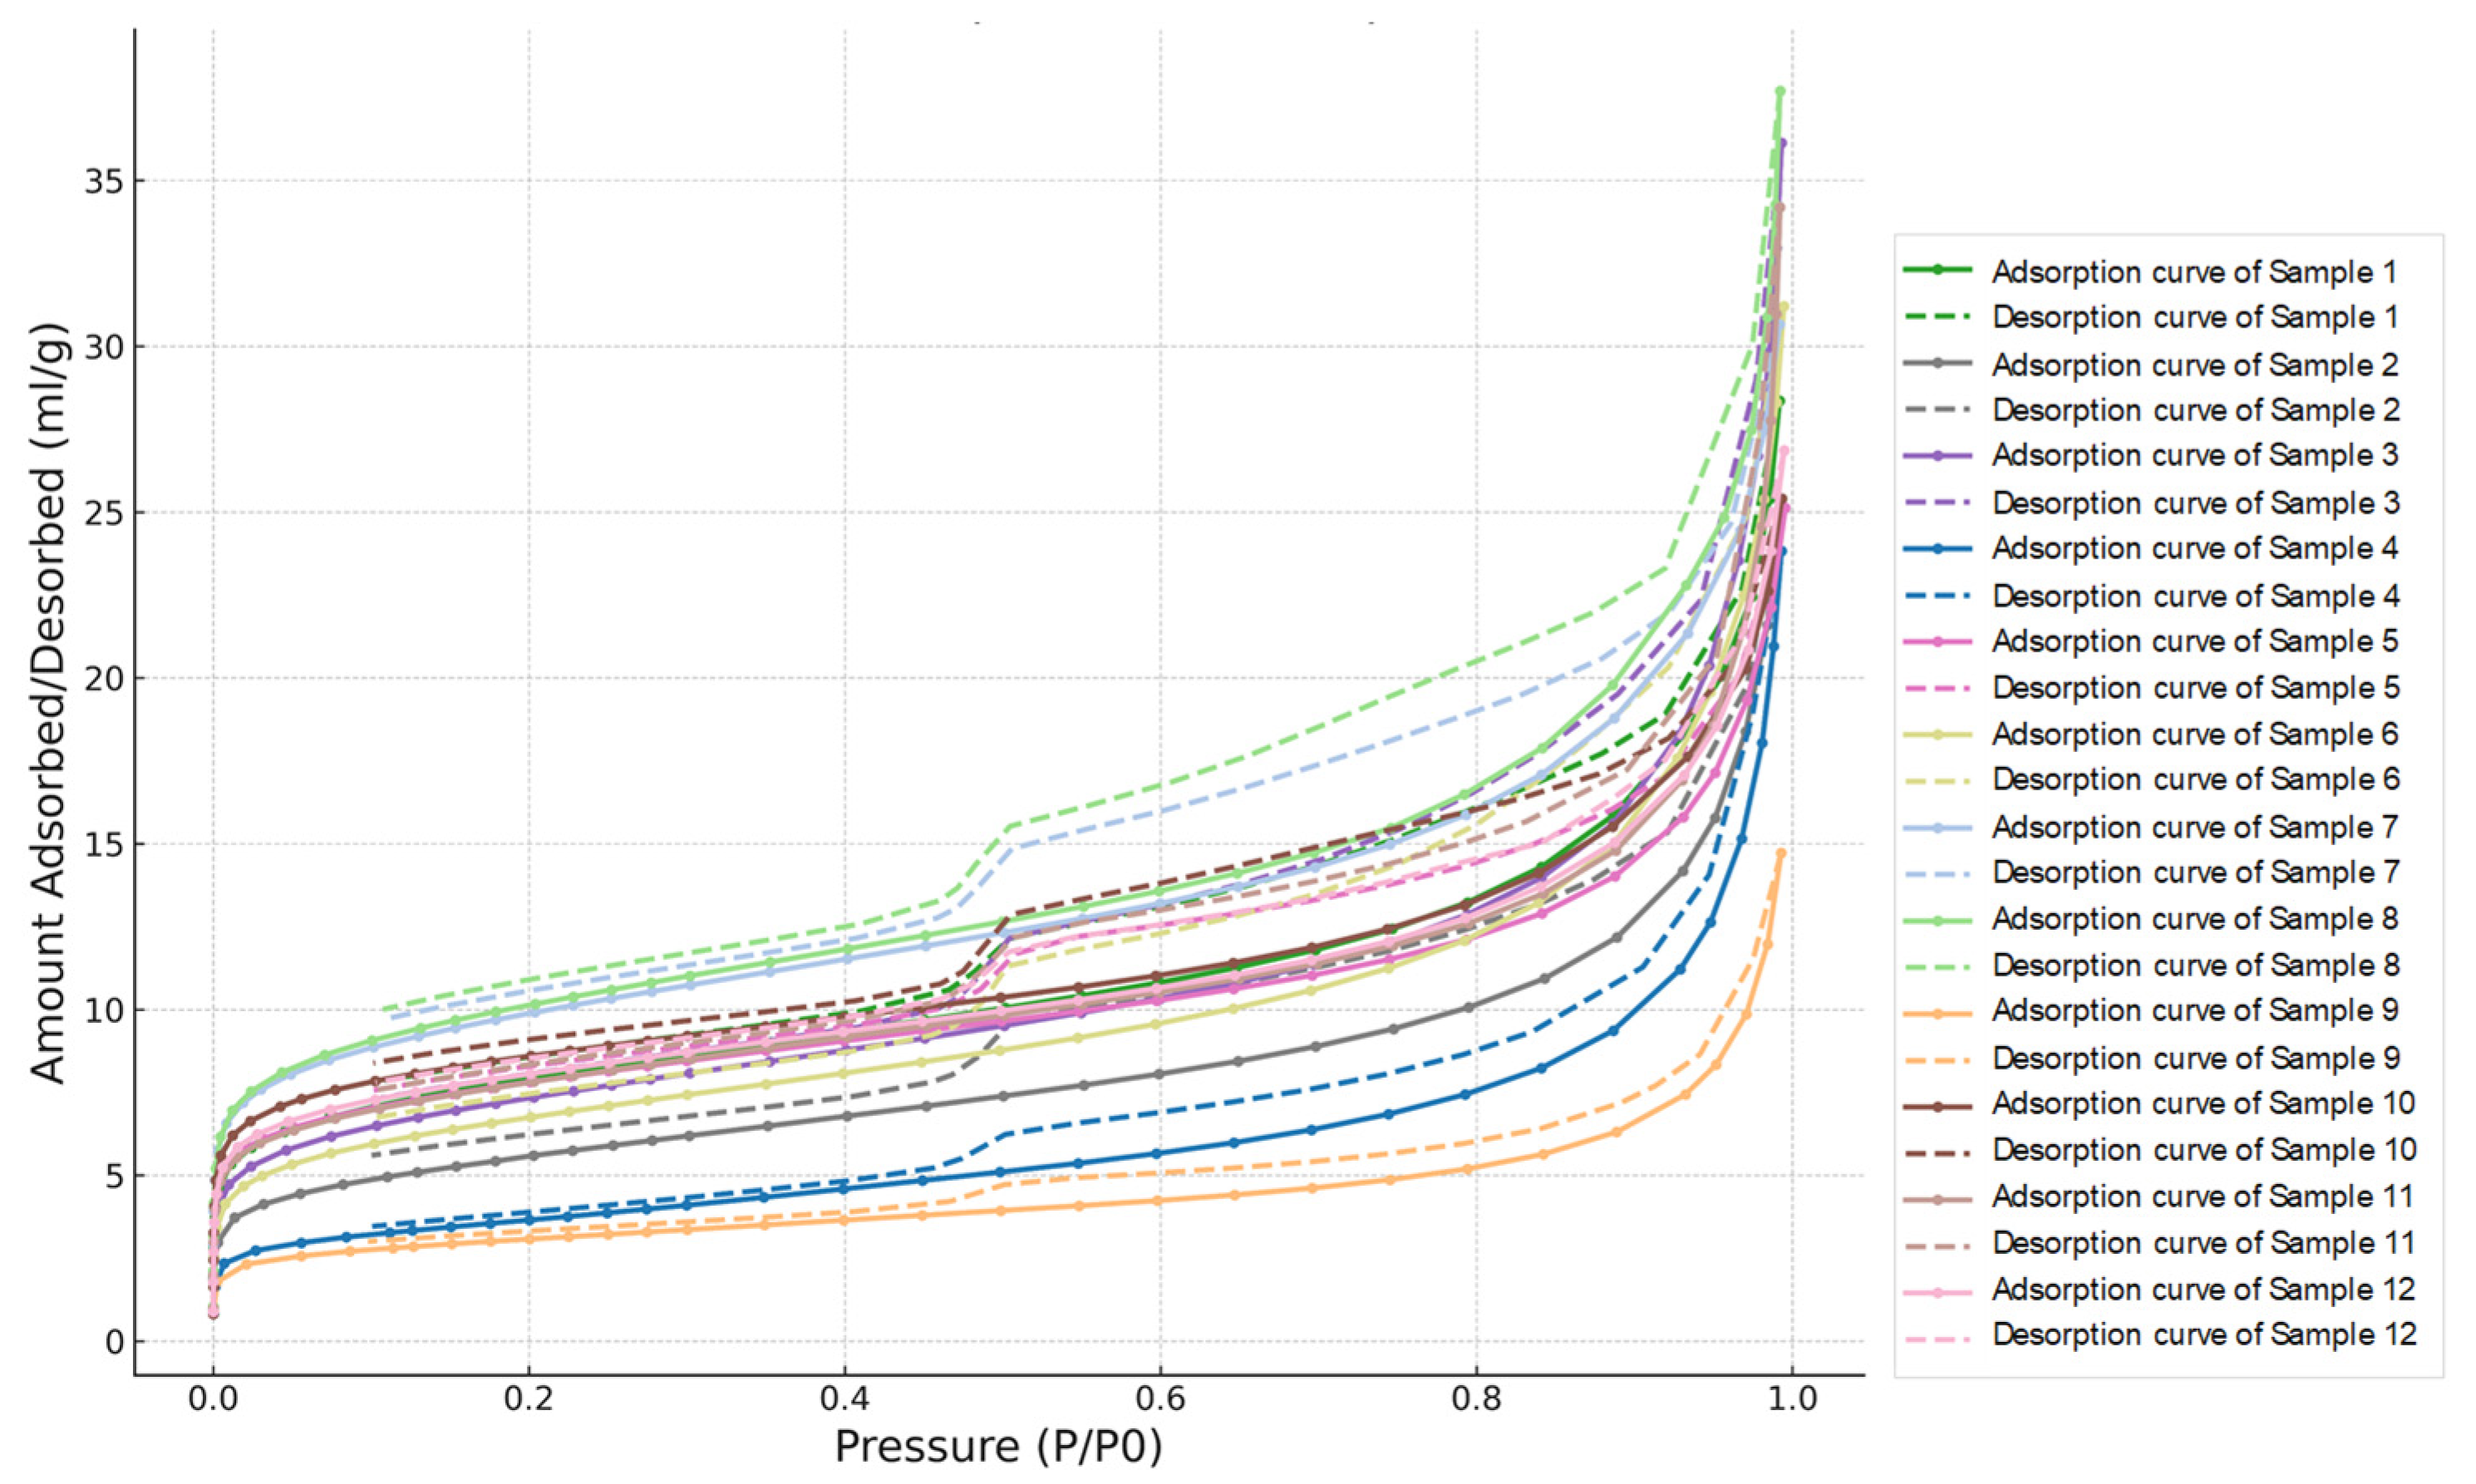
Figure 5 presents the isothermal adsorption–desorption curves from partial low-temperature nitrogen adsorption experiments. The curve shape is essentially a reverse S-type, akin to the type IV classification in the BDDT isothermal adsorption curve categories proposed by Brunauer et al. [20]. This suggests that the shale samples exhibit monolayer–multilayer adsorption at low pressure. Parameters such as the specific surface area of the experimental samples can be calculated using the BET equation based on experimental data obtained before capillary condensation occurs.
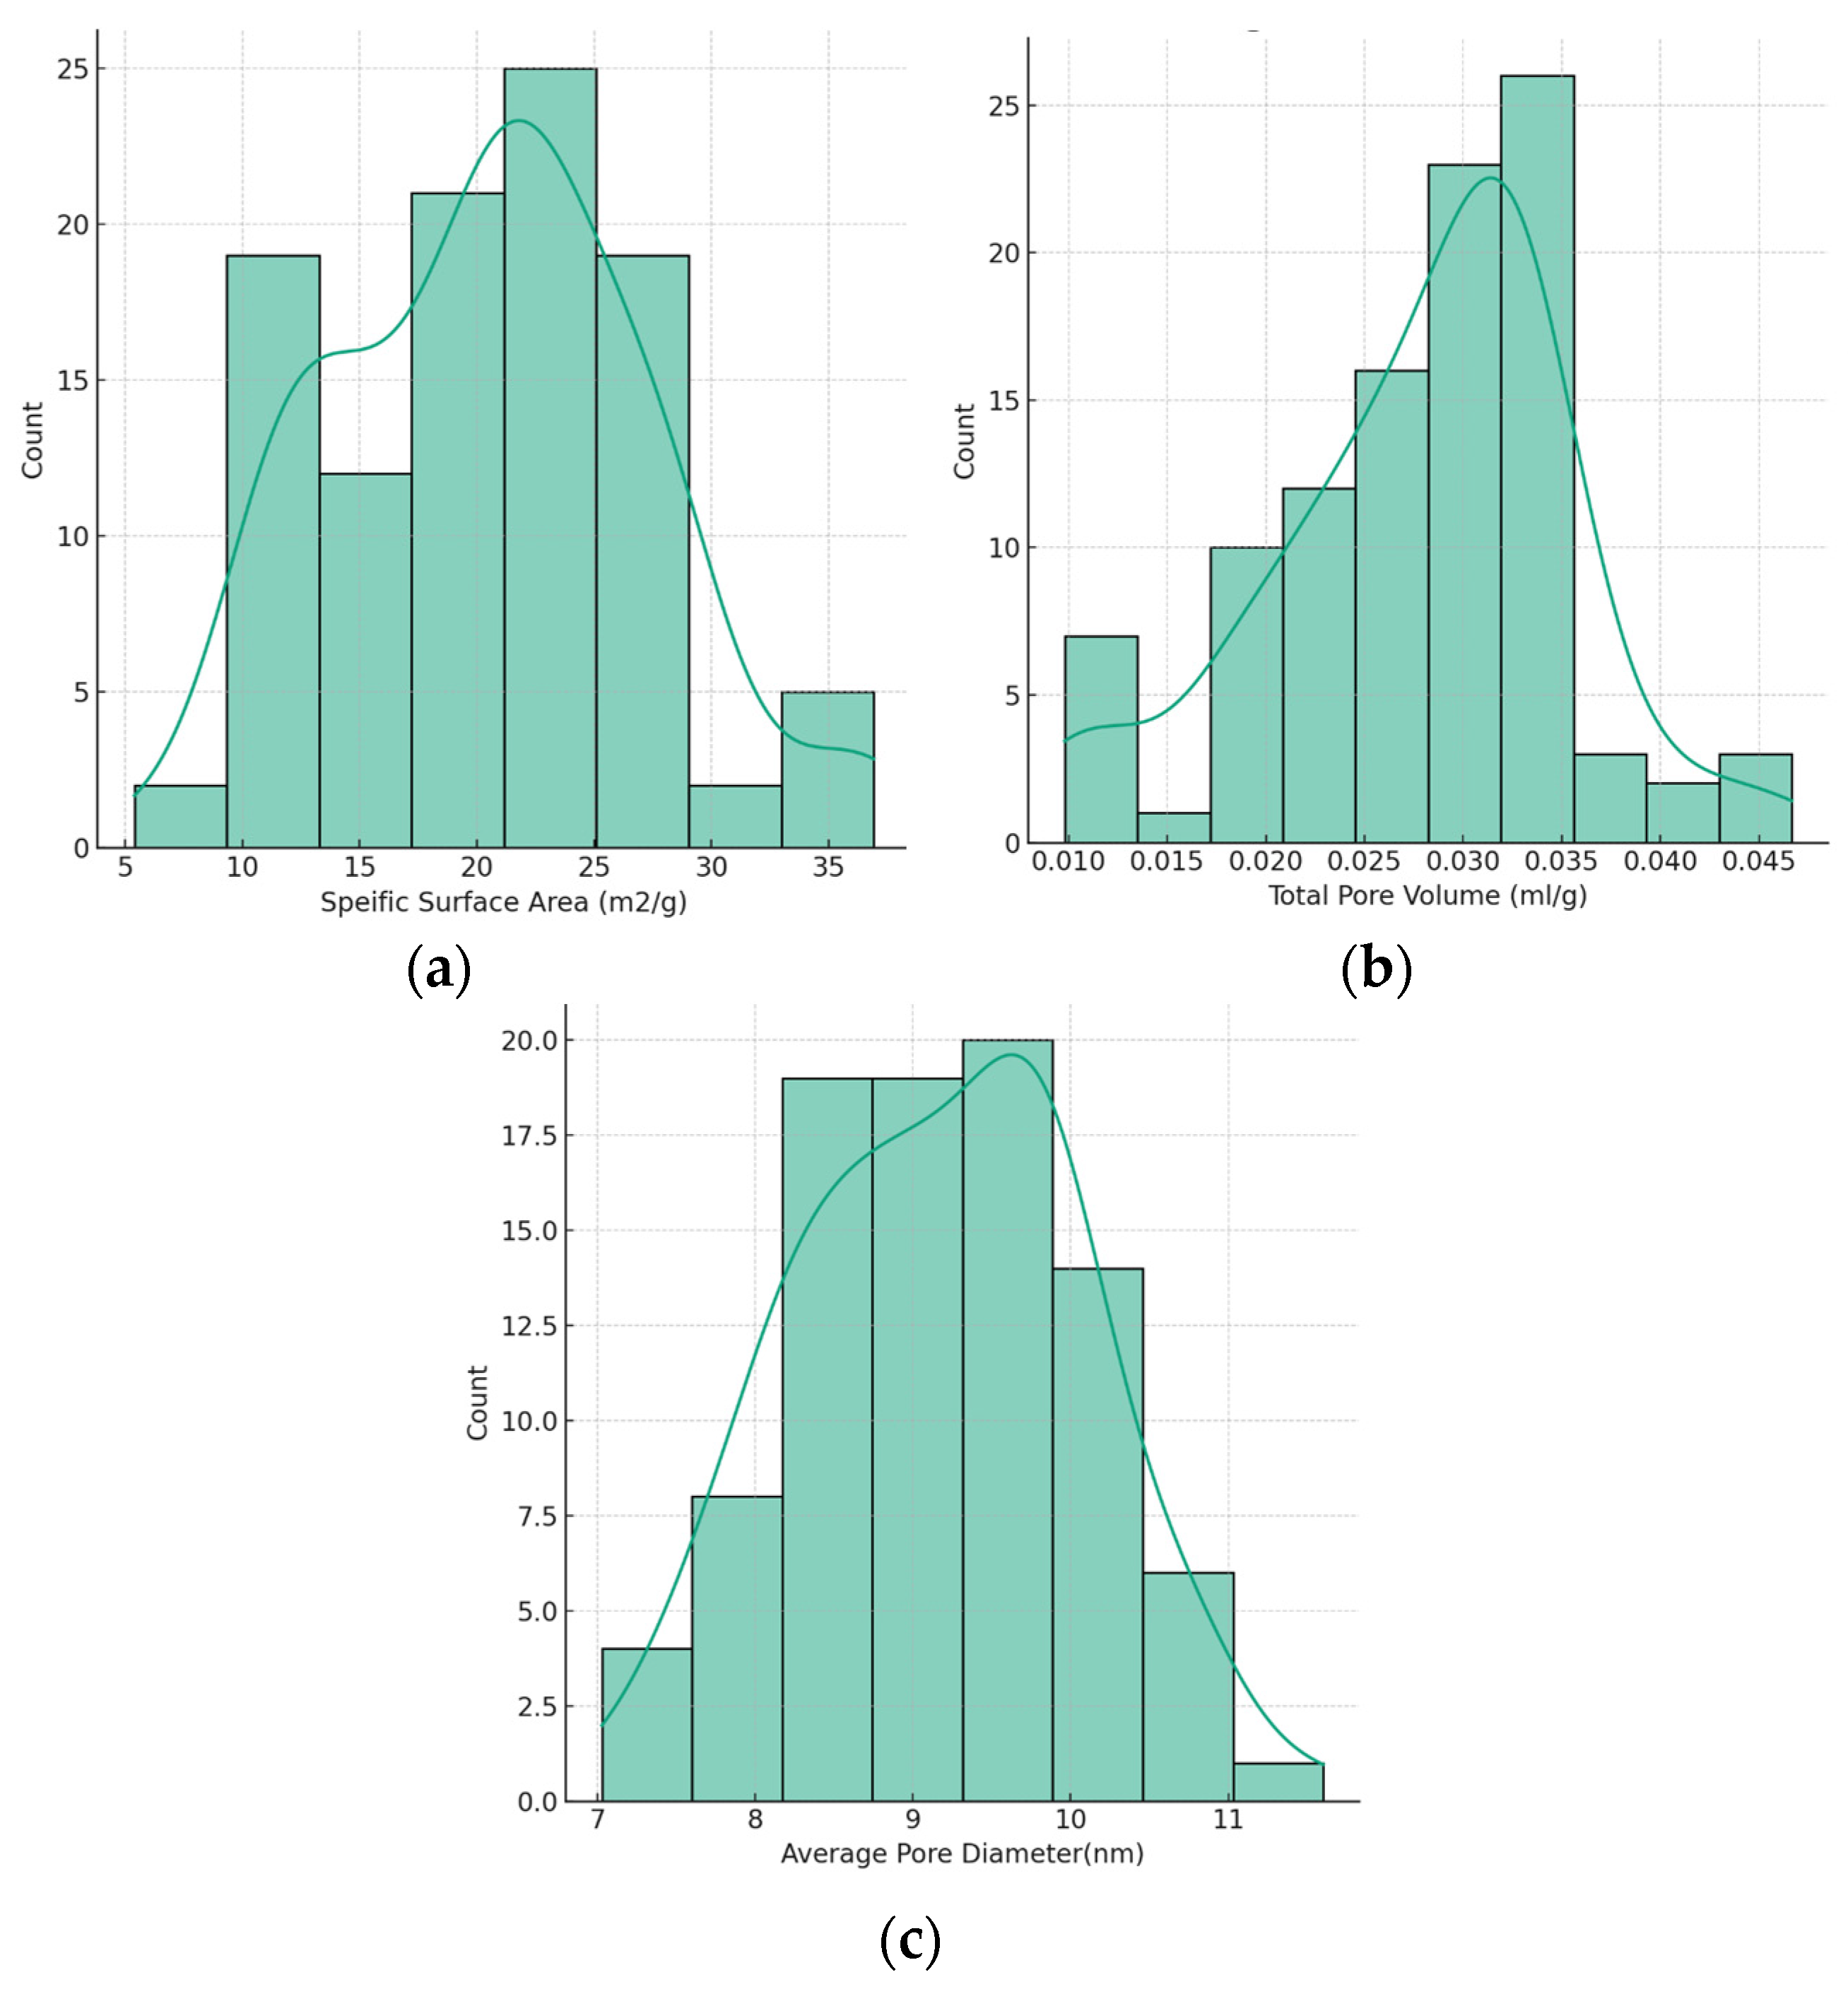
Figure 6 presents the distribution of specific surface area, total pore volume, and average pore diameter for 85 samples from the study area. The specific surface area values of the samples range from 5.40 m2/g to 40.62 m2/g, with an average of 20.832 m2/g and a variance of 6.732 m2/g. The total pore volume values range from 0.0098 mL/g to 0.0467 mL/g, with an average of 0.0279 mL/g and a variance of 0.0077 mL/g. The average pore diameter distribution ranges from 7.03 nm to 11.05 nm, with an average of 9.17 nm and a variance of 0.93 nm.

2.3.4. Methane Adsorption Characteristic Parameter Analysis

The three-parameter Langmuir equation, as illustrated in Equation (1), has been applied to fit various adsorption isotherms, and the fitting results have been consistently satisfactory. Through this fitting approach, the adjusted R2 values obtained range from 0.98 to 1.0, with an average of 0.99. This indicates that the three-parameter Langmuir equation, encompassing VL, PL, and ρads, effectively describes the trend of adsorption quantity as a function of pressure. Compared with using complete isotherms containing 10 to 12 data points, employing these three parameters for subsequent analysis and prediction is more convenient and efficient. This method not only enhances the efficiency of analysis but also maintains the accuracy and reliability of data processing.
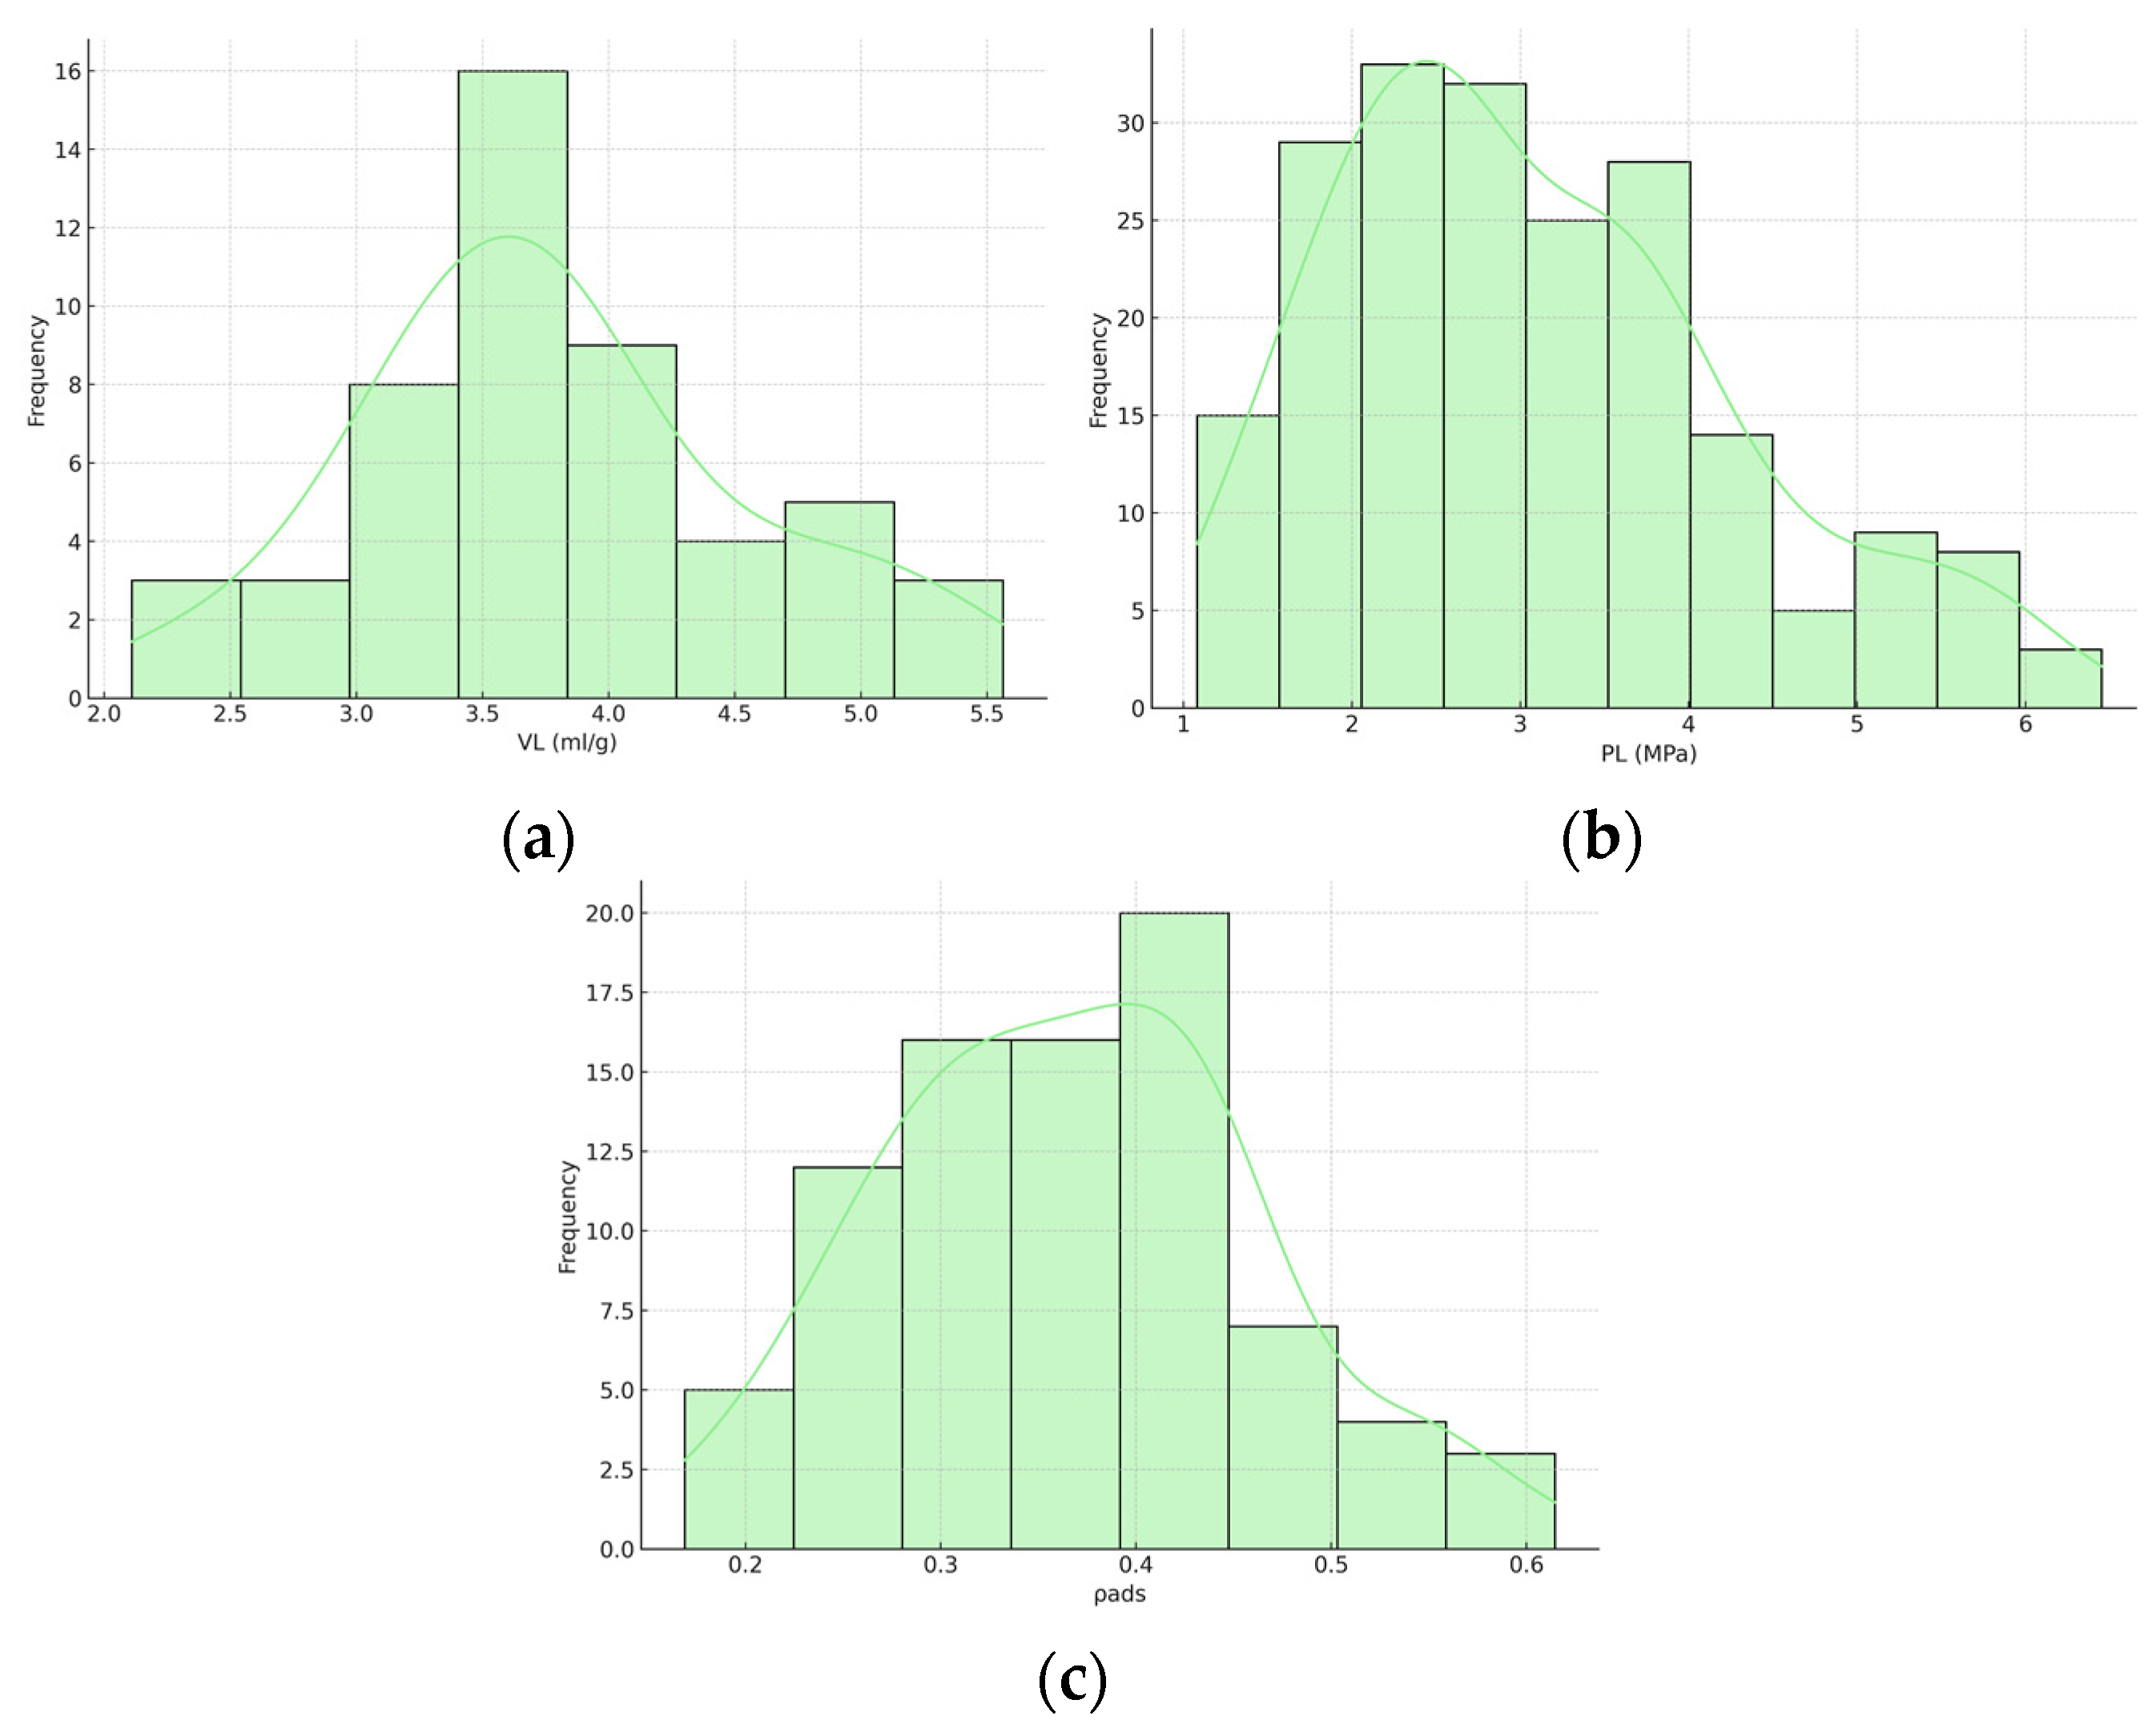
As shown in Figure 7, the distribution ranges of the VL and PL values for all samples are summarized. The VL values range from 0.68 mL/g to 8.57 mL/g, with an average of 2.7 mL/g. The PL values vary from 0.18 MPa to 32.23 MPa, with an average of 3.25 MPa. Additionally, the ρads values range from 0.169 g/cm3 to 0.661 g/cm3, with an average of 0.367 g/cm3.

3. Analysis of Factors Affecting Shale Gas Content

This study aims to analyze the factors influencing shale gas content by examining the correlations between various parameters, including the micropore characteristics (specific surface area (SSA) and total pore volumes (TPVs)) geochemistry (TOC), mineralogy (quartz and clay content as determined by XRD analysis), and methane adsorption (VL, PL, and ρads) across different layers of shale within the study area. The objective is to identify the primary controlling factors of methane adsorption properties in shale and, consequently, unveil the determinants of shale gas content.

3.1. The Influence of Micropore Characteristics on Gas Content

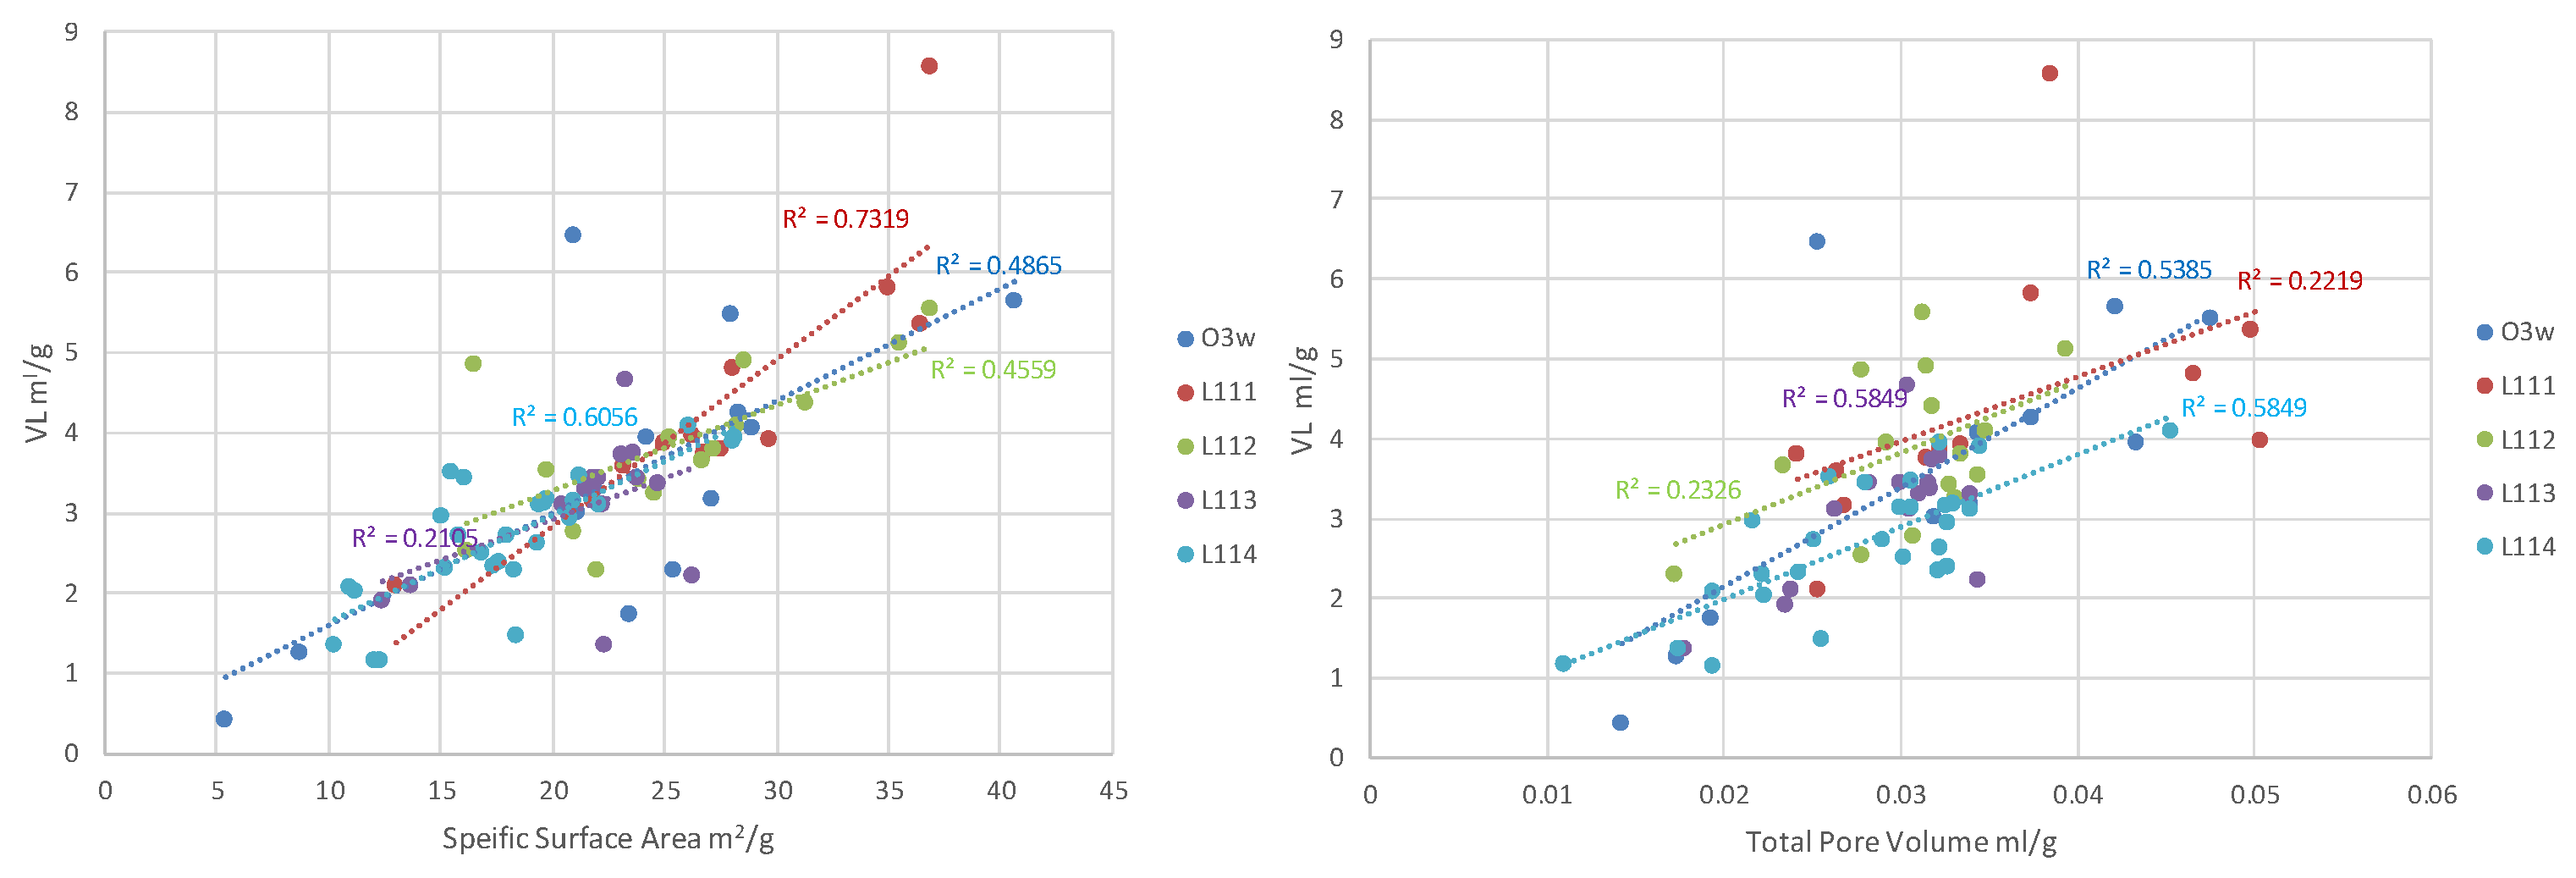
As shown in Figure 8, an analysis of the correlation between specific surface area and total pore volume with Langmuir volume (VL) in various layers of the Longmaxi and Wufeng Formations reveals a strong linear relationship. With increasing SSA and TPV values, VL also demonstrates an increasing trend, suggesting a potential association between greater specific surface area and higher unit mass adsorption. Among these layers, as shown in Table 1, the layer with the strongest correlation between SSA and VL is the Q3w layer, with a Pearson R value of 0.856 and an R-squared value of 0.732. For TPV and VL, the layer with the strongest correlation is the L111 layer, with a Pearson R value of 0.850 and an R-squared value of 0.722.
As shown in Figure 9, an analysis of the correlation between specific surface area, total pore volume, and Langmuir pressure (PL) in various layers of the Longmaxi and Wufeng Formations reveals interesting findings. It can be observed that the SSA and TPV values exhibit some degree of correlation with VL in certain layers, but overall, they show a negative correlation. As indicated in Table 2, the layer with the strongest correlation between TPV and PL is the L114 layer, with a Pearson R value of 0.841 and an R-squared (R2) value of −0.707. The layer with the strongest correlation between SSA and PL is the L111 layer, with a Pearson R value of −0.605 and an R2 value of 0.366. However, in most layers, the compatibility between SSA and TPV with VL and PL is relatively poor.

3.2. The Impact of Mineral Composition on Gas Content

As shown in Figure 10, an analysis of the correlation between total organic carbon (TOC) and Langmuir volume (VL), as well as Langmuir pressure (PL), in various layers of the Longmaxi and Wufeng Formations reveals significant insights. It can be observed that the TOC values exhibit a certain degree of linear correlation with VL in all layers, and as TOC values increase, there is a corresponding increase in VL. As indicated in Table 3, the average R-squared (R2) value for the correlation between TOC and VL across all layers is around 0.4.
However, the correlation between the TOC values and the PL values in all layers is notably weak, with most layers having an R2 value of less than 0.03.
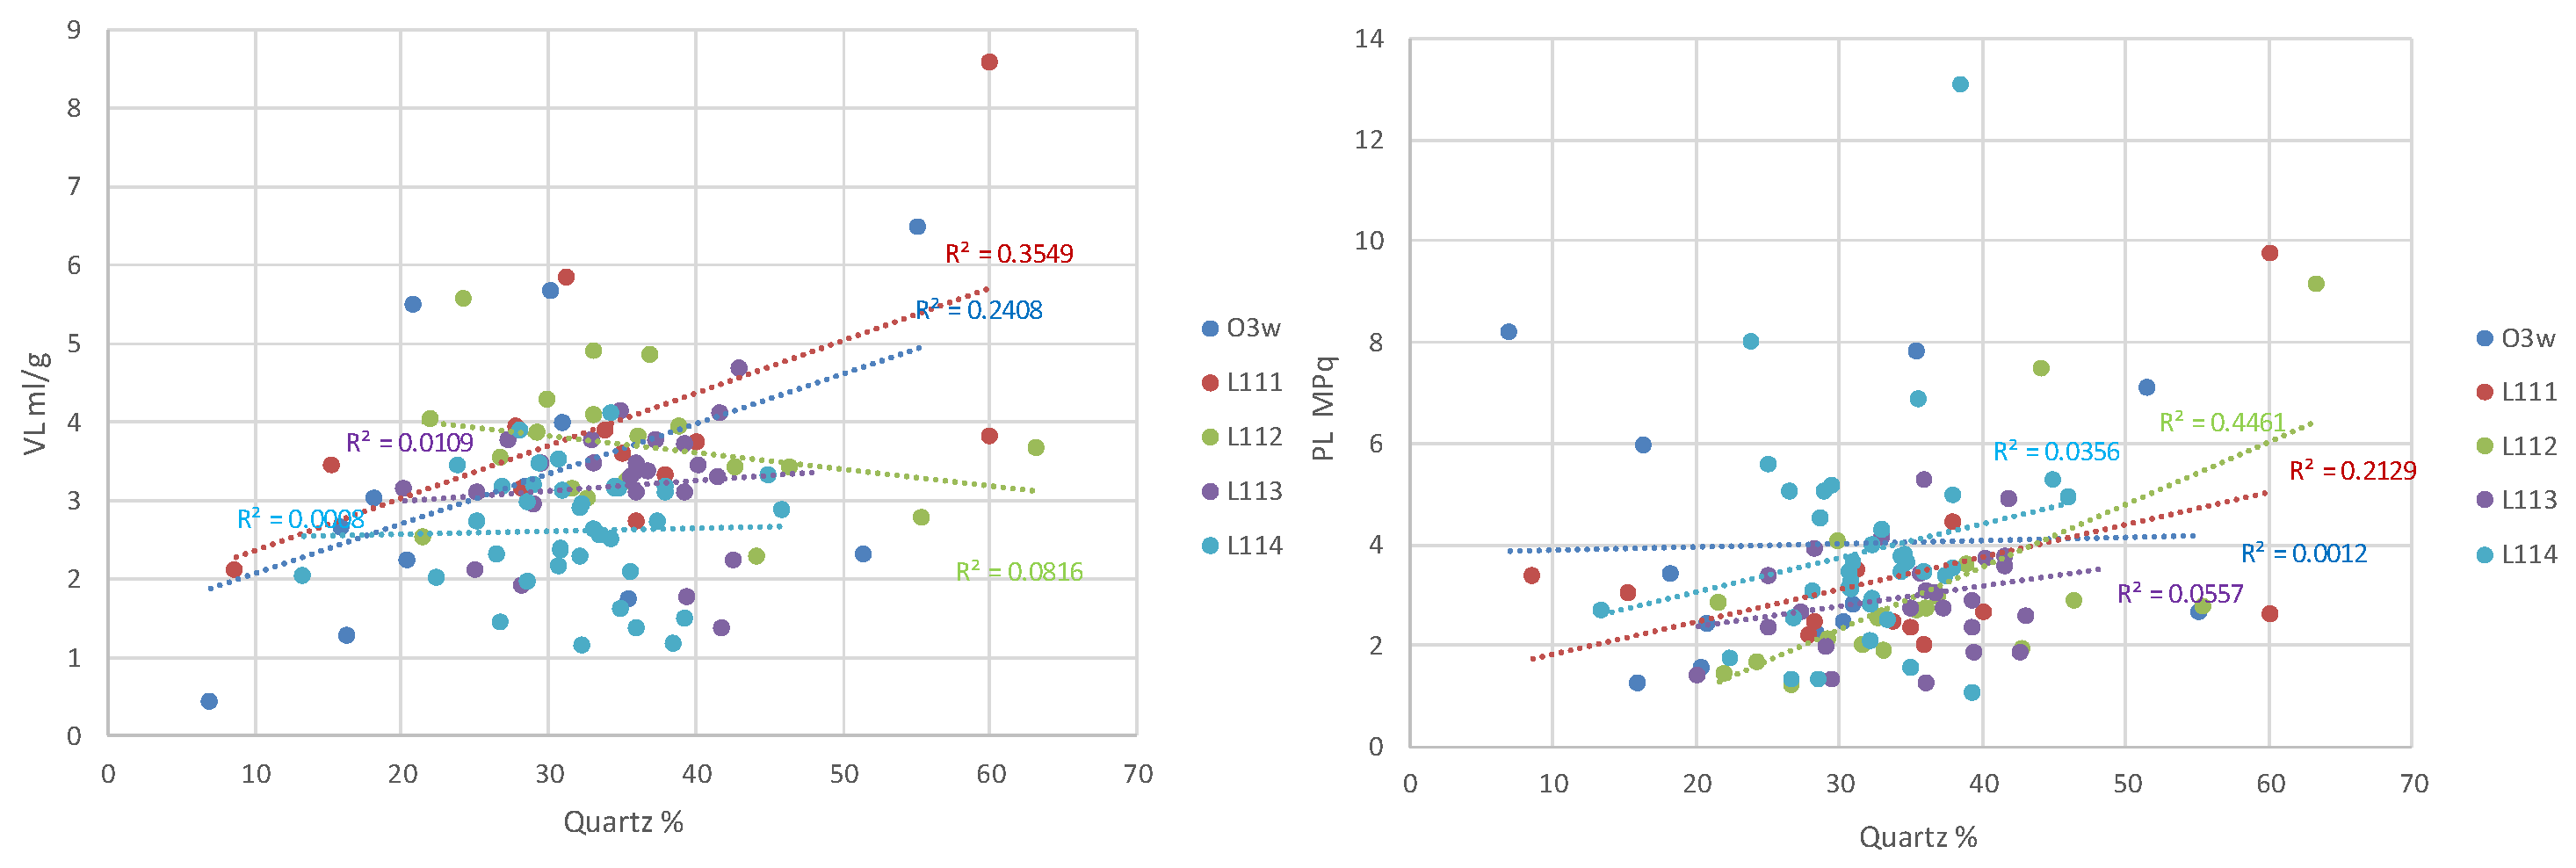
As shown in Figure 11 and Figure 12 and Table 4 and Table 5, the analysis of the correlation between quartz mineral content, clay mineral content, and Langmuir volume (VL), as well as Langmuir pressure (PL), in various layers of the Longmaxi and Wufeng Formations revealed that there is no significant correlation between mineral content and VL or PL in most layers.

3.3. The Gas Content Prediction Model

Previous studies have attempted to augment the parameters VL and PL with related parameters such as kerogen and clay content, comparing them to the sha and le isotherms [37,38,39]. Previous studies have attempted to augment the parameters VL, PL, and ρads with related parameters such as kerogen and clay content, comparing them to the shale isotherms [40]. Additionally, there are doubts about whether clay minerals, kerogen, and other substances extracted from specific samples truly represent the inorganic or organic components of shale.
In this study, we conducted a data analysis of shale micropore characteristics (SSA and TPV), geochemistry (TOC), mineralogy (XRD analysis of quartz and clay content), and methane adsorption (VL; PL) data from 218 samples collected from 31 wells in the study area. This analysis aimed to elucidate the complex relationship between shale gas content and various attribute parameters. Through the correlation analysis of these parameters at different layers, we found that the three parameters VL, PL, and ρads of the Langmuir equation (Equation (2)) exhibited the highest correlation with TOC content, SSA, and TPV values. Consequently, we proposed a component-based model that involves weighting the equivalent unit content of organic matter (TOC) and pore size distribution (SSA and TPV) to estimate excess adsorption isotherm content (Equation (3)).
V e x = T O C V L o r g p p L o r g + p 1 ρ f r e e ρ a d s o r g + T P V V L T P V p p L T P V + p 1 ρ f r e e ρ a d s T P V + S S A V L S S A p p L S S A + p 1 ρ f r e e ρ a d s S S A
In this model, VLorg, PLorg, and ρadsorg are the three characteristic parameters of the adsorption isotherm for unit organic matter methane (1% TOC), while VLPTV, PLPTV, and ρadsTPV are the corresponding parameters for unit pore volume (mL/g), and VLSSA, PLSSA, and ρadsSSA are the corresponding parameters for unit specific surface area (m2/g).
During the measurement of adsorption isotherms, each sample typically includes 10 to 14 data points (pressure, p, and excess adsorption, Vex). In this study, there are a total of 53 shale samples with complete data, resulting in a total of 720 data points. These nine unknown parameters can be determined through the nonlinear fitting of the 720 p-Vex data points. The initial values for each parameter are set within the experimentally obtained minimum and maximum ranges.
Table 6 presents the optimal fitting results, with R2 ranging up to 0.98. Using Equation (2) and the best-fit parameters, predictions were made for the 720 data points. The predicted values exhibit a strong linear correlation with the experimental results, with an R2 of 0.968. The average error and standard deviation of the error are 0.0017 and 0.0048 mL/g, respectively (as shown in Figure 13a). The error is distributed within a range of −0.12 mL/g to 0.15 mL/g for 95% of the data (as seen in Figure 13b). Therefore, this model based on shale composition and pore structure characteristics is fully suitable for engineering applications and meets production requirements.

4. Conclusions

(1)
This research employed methods such as scanning electron microscopy imaging, analysis of shale rock mineral components, and methane adsorption experiments to study 106 shale samples from the Wufeng–Longmaxi Formations in the Sichuan Basin. The findings revealed the potential impact of shale’s mineralogy and its microporous structures on methane adsorption characteristics.
(2)
This study analyzed the correlation between experimental data—like microporous structures (specific surface area and total pore volume), geochemical properties (e.g., total organic carbon TOC content), and mineral composition (e.g., clay and quartz content)—and the volume of adsorbed methane. A gas content model, developed based on nonlinear regression analysis, enhanced prediction accuracy, thereby providing a reliable computational tool for reserve estimation.
(3)
This research further elaborated on the variability in contributions to methane adsorption, offering new insights into the evaluation and development of shale gas reservoirs. The proposed component-based adsorption model successfully described shale’s excess adsorption isotherms, reflecting the weighted average effect of organic matter and clay composition in adsorption.
(4)
The outcomes not only improved the accuracy of shale gas reserve estimates under limited core sampling conditions but also advanced our understanding of methane adsorption mechanisms within shale. These findings have substantial implications for guiding exploration and production activities in the Sichuan Basin and other shale gas regions globally, providing a scientific basis and technical support for the effective development of future shale gas resources.

Author Contributions

Conceptualization, Y.L., C.X. and X.H.; Formal analysis, X.H.; Investigation, C.X. All authors have read and agreed to the published version of the manuscript.

Funding

This work was supported by the National Key R&D Program of China (2020YFA0710604).

Data Availability Statement

The original contributions presented in the study are included in the article, further inquiries can be directed to the corresponding author.

Conflicts of Interest

Author Xiaoqing Huang was employed by PetroChina Zhejiang Oilfield Company. The remaining authors declare that the research was conducted in the absence of any commercial or financial relationships that could be construed as a potential conflict of interest.

References

  1. Hill, R.J.; Zhang, E.; Katz, B.J.; Tang, Y. Modeling of gas generation from the Barnett shale, Fort Worth Basin, Texas. AAPG Bull. 2007, 91, 501–521. [Google Scholar] [CrossRef]
  2. Loucks, R.G.; Reed, R.M.; Ruppel, S.C.; Jarvie, D.M. Morphology, genesis, and distribution of nanometer-scale pores in siliceous mudstones of the Mississippian Barnett Shale. J. Sediment. Res. 2009, 79, 848–861. [Google Scholar] [CrossRef]
  3. Chen, S.; Yao, S.; Wang, Y.; Liu, S.; Wang, X.; Zhang, Y.; Wang, H. Investigation of pore evolution and variation with magma intrusion on Permian Gufeng shale formation and their implications on gas enrichment. J. Nat. Gas Sci. Eng. 2021, 96, 104277. [Google Scholar] [CrossRef]
  4. Wang, K.; Qiao, P.; Wang, Z.; Liu, X.; Li, Y. Multiple scale pore size characterization of coal based on carbon dioxide and liquid nitrogen adsorption, high-pressure mercury intrusion and low field nuclear magnetic resonance. China Min. Mag. 2017, 26, 146–152. [Google Scholar]
  5. Li, X.; Wang, M.; Zhang, S.; Yan, W.; Xu, D.; Li, Y.; Fu, Y.; Yang, C.; Xie, L.; Lu, W. Study on nanopore structure of soil and quantitative characterization based on mercury intrusion, liquid nitrogen adsorption, CO2 adsorption, and SEM. Arab. J. Geosci. 2022, 15, 210. [Google Scholar] [CrossRef]
  6. Lu, F.; Zhou, Y.; Wang, P.; Jia, K.; Han, G. Pore Characteristics of Oil Shales in Jilin Province, Northeast China: Investigations Using Gas Adsorption, Mercury Intrusion, and NMR Cryoporometry. Energy Fuels 2023, 37, 11914–11927. [Google Scholar] [CrossRef]
  7. Xi, Z.; Tang, S.; Wang, J.; Yang, G.; Li, L. Formation and development of pore structure in marine-continental transitional shale from northern China across a maturation gradient: Insights from gas adsorption and mercury intrusion. Int. J. Coal Geol. 2018, 200, 87–102. [Google Scholar] [CrossRef]
  8. Mi, H.; Guo, Y.; Yu, X. Study on Pore Structure of Shale Reservoir by Low Temperature Nitrogen Adsorption Method. Geofluids 2022, 2022, 9355020. [Google Scholar] [CrossRef]
  9. Ma, R.; Yao, Y.; Wang, M.; Dai, X.; Li, A. CH4 and CO2 adsorption characteristics of low-rank coals containing water: An experimental and comparative study. Nat. Resour. Res. 2022, 31, 993–1009. [Google Scholar] [CrossRef]
  10. Han, H.; Dai, J.; Guo, C.; Zhong, N.; Pang, P.; Ding, Z.; Chen, J.; Huang, Z.; Gao, Y.; Luo, J.; et al. Pore Characteristics and Factors Controlling Lacustrine Shales from the Upper Cretaceous Qingshankou Formation of the Songliao Basin, Northeast China: A Study Combining SEM, Low-temperature Gas Adsorption and MICP Experiments. Acta Geol. Sin. Engl. Ed. 2021, 95, 585–601. [Google Scholar] [CrossRef]
  11. Wang, Z.; Cheng, Y.; Wang, G.; Ni, G.; Wang, L. Comparative analysis of pore structure parameters of coal by using low pressure argon and nitrogen adsorption. Fuel 2022, 309, 122120. [Google Scholar] [CrossRef]
  12. Cao, T.; Song, Z.; Wang, S.; Xia, J. Characterization of pore structure and fractal dimension of Paleozoic shales from the northeastern Sichuan Basin, China. J. Nat. Gas Sci. Eng. 2016, 35, 882–895. [Google Scholar] [CrossRef]
  13. Zhu, W.; Zhang, X.; Zhou, D.; Fang, C.; Li, J.; Huang, Z. New cognition on pore structure characteristics of Permian marine shale in the Lower Yangtze region and its implications for shale gas exploration. Nat. Gas Ind. B 2021, 8, 562–575. [Google Scholar] [CrossRef]
  14. Zou, X.; Li, X.; Zhang, J.; Li, H.; Guo, M.; Zhao, P. Characteristics of Pore Structure and Gas Content of the Lower Paleozoic Shale from the Upper Yangtze Plate, South China. Energies 2021, 14, 7603. [Google Scholar] [CrossRef]
  15. Kelly, S.; El-Sobky, H.; Torres-Verdín, C.; Balhoff, M.T. Assessing the utility of FIB-SEM images for shale digital rock physics. Adv. Water Resour. 2016, 95, 302–316. [Google Scholar] [CrossRef]
  16. Ma, R.; Wang, M.; Xie, W.; Wang, H. Micro-pore reservoir spaces and gas-bearing characteristics of the shale reservoirs of the coal measure strata in the Qinshui Basin. J. Nanosci. Nanotechnol. 2021, 21, 371–381. [Google Scholar] [CrossRef] [PubMed]
  17. Aji, A.Q.M.; Mohshim, D.F.; Maulianda, B.; Elraeis, K.A. Supercritical methane adsorption measurement on shale using the isotherm modelling aspect. RSC Adv. 2022, 12, 20530–20543. [Google Scholar]
  18. Fu, Y.; Zhang, R.; Jiang, Y.; Fan, X.; Gu, Y. Experimental Studies on Pore Structure and the Gas Content Evolution Mechanisms of Shale Gas Reservoirs at Different Burial Depths in the Longmaxi Formation, Southern Sichuan Basin. Appl. Sci. 2023, 13, 13194. [Google Scholar] [CrossRef]
  19. Harlow, F.J.; Willows, R.S. A simple method of deriving the Gibbs adsorption formula. Trans. Faraday Soc. 1915, 11, 53–54. [Google Scholar] [CrossRef]
  20. Langmuir, I. The Adsorption of Gases on Plane Surfaces of Glass, Mica and Platinum. J. Am. Chem. Soc. 1918, 40, 1361–1403. [Google Scholar] [CrossRef]
  21. Boudaizt, M.; Mikhail, I. Temkin, 1908–1991. In Advances in Catalysis; Elsevier: New York, NY, USA, 1993; Volume xiii–xv. [Google Scholar]
  22. Brunauer, S.; Emmett, P.H.; Teller, E. Adsorption of gases in multimolecular layers. J. Am. Chem. Soc. 1938, 60, 309–319. [Google Scholar] [CrossRef]
  23. Pursell, C.J.; Chandler, B.D.; Manzoli, M.; Boccuzzi, F. CO adsorption on supported gold nanoparticle catalysts: Application of the Temkin model. J. Phys. Chem. C 2012, 116, 11117–11125. [Google Scholar] [CrossRef]
  24. Yang, F.; Ning, Z.F.; Kong, D.T.; Peng, P.; Zhao, H.W. Comparison analysis on model of methane adsorption isotherms in shales. Coal Sci. Technol. 2013, 41, 86–89. [Google Scholar]
  25. Tianyi, Z.; Zhengfu, N.; Yan, Z. Comparative analysis of isothermal adsorption models for shales and coals. Xinjiang Pet. Geol. 2014, 35, 1. [Google Scholar]
  26. Sandoval, D.; Yan, W.; Michelsen, M.; Stenby, E. Model Comparison for High-pressure Adsorption in Shale and its Influence on Phase Equilibria. In Proceedings of the ECMOR XV—15th European Conference on the Mathematics of Oil Recovery, Amsterdam, The Netherlands, 29 August–1 September 2016. [Google Scholar]
  27. Bashir, H. Methane Adsorption into Sandstones and Its Role in Gas Recovery from Depleted Reservoirs. University of Salford, Salford, UK, 2018. [Google Scholar]
  28. Gurin, O.V.; Degtyarev, A.V.; Dubinin, M.M.; Maslov, V.A. Focusing of modes for metallic resonator of a terahertz laser with nonuniform spatial polarization. In Proceedings of the 2018 IEEE 17th International Conference on Mathematical Methods in Electromagnetic Theory (MMET), Kyiv, Ukraine, 2–5 July 2018. [Google Scholar]
  29. Wang, S.; Feng, Q.; Javadpour, F.; Zha, M.; Cui, R. Multiscale modeling of gas transport in shale matrix: An integrated study of molecular dynamics and rigid-pore-network model. SPE J. 2020, 25, 1416–1442. [Google Scholar] [CrossRef]
  30. Xing, X.; Fu, D.; Wang, Z.; Tian, Y.; Sun, L. Influence of Organic-Inorganic Composition on the Adsorption of Niutitang Formation Shale in Huijunba Syncline. Geofluids 2022, 2022, 3292399. [Google Scholar] [CrossRef]
  31. Zhang, C.; Cheng, S.; Zhou, W. Considering the Modified BET Adsorption, the Material Balance Calculation Method for Abnormally High-Pressure Shale Gas Reservoirs. Spec. Oil Gas Reserv. 2022, 29, 77–82. [Google Scholar]
  32. Acevedo-Reyes, D.; Perez, M.; Verdu, C.; Bogner, A.; Epicier, T. Characterisation of precipitates size distribution: A comparative study of SEM and TEM potentialities. J. Microsc. 2008, 232, 112–122. [Google Scholar] [PubMed]
  33. Joos, J.; Carraro, T.; Weber, A.; Ivers-Tiffée, E. Reconstruction of porous electrodes by FIB/SEM for detailed microstructure modeling. J. Power Sources 2011, 196, 7302–7307. [Google Scholar] [CrossRef]
  34. Jiang, W.; Lin, M. Molecular dynamics investigation of conversion methods for excess adsorption amount of shale gas. J. Nat. Gas Sci. Eng. 2018, 49, 241–249. [Google Scholar] [CrossRef]
  35. Thomas, K.M. Perspectives of gas adsorption and storage in kerogens and shales. Energy Fuels 2023, 37, 2569–2585. [Google Scholar] [CrossRef]
  36. Qian, C.; Li, X.; Zhang, Q.; Shen, W.; Guo, W.; Lin, W.; Han, L.; Cui, Y.; Huang, Y.; Pei, X.; et al. Reservoir characteristics of different shale lithofacies and their effects on the gas content of Wufeng-Longmaxi Formation, southern Sichuan Basin, China. Geoenergy Sci. Eng. 2023, 225, 211701. [Google Scholar] [CrossRef]
  37. Guo, H.; Jia, W.; Lei, Y.; Luo, X.; Cheng, M.; Wang, X.; Zhang, L.; Jiang, C. The composition and its impact on the methane sorption of lacustrine shales from the Upper Triassic Yanchang Formation, Ordos Basin China. Mar. Pet. Geol. 2014, 57, 509–520. [Google Scholar] [CrossRef]
  38. Jiang, W.; Cao, G.; Luo, C.; Lin, M.; Ji, L.; Zhou, J. A composition-based model for methane adsorption of overmature shales in Wufeng and Longmaxi Formation, Sichuan Basin. Chem. Eng. J. 2022, 429, 130766. [Google Scholar] [CrossRef]
  39. Rexer, T.F.; Mathia, E.J.; Aplin, A.C.; Thomas, K.M. High-pressure methane adsorption and characterization of pores in Posidonia shales and isolated kerogens. Energy Fuels 2014, 28, 2886–2901. [Google Scholar] [CrossRef]
  40. Gasparik, M.; Ghanizadeh, A.; Bertier, P.; Gensterblum, Y.; Bouw, S.; Krooss, B.M. High-pressure methane sorption isotherms of black shales from the Netherlands. Energy Fuels 2012, 26, 4995–5004. [Google Scholar] [CrossRef]
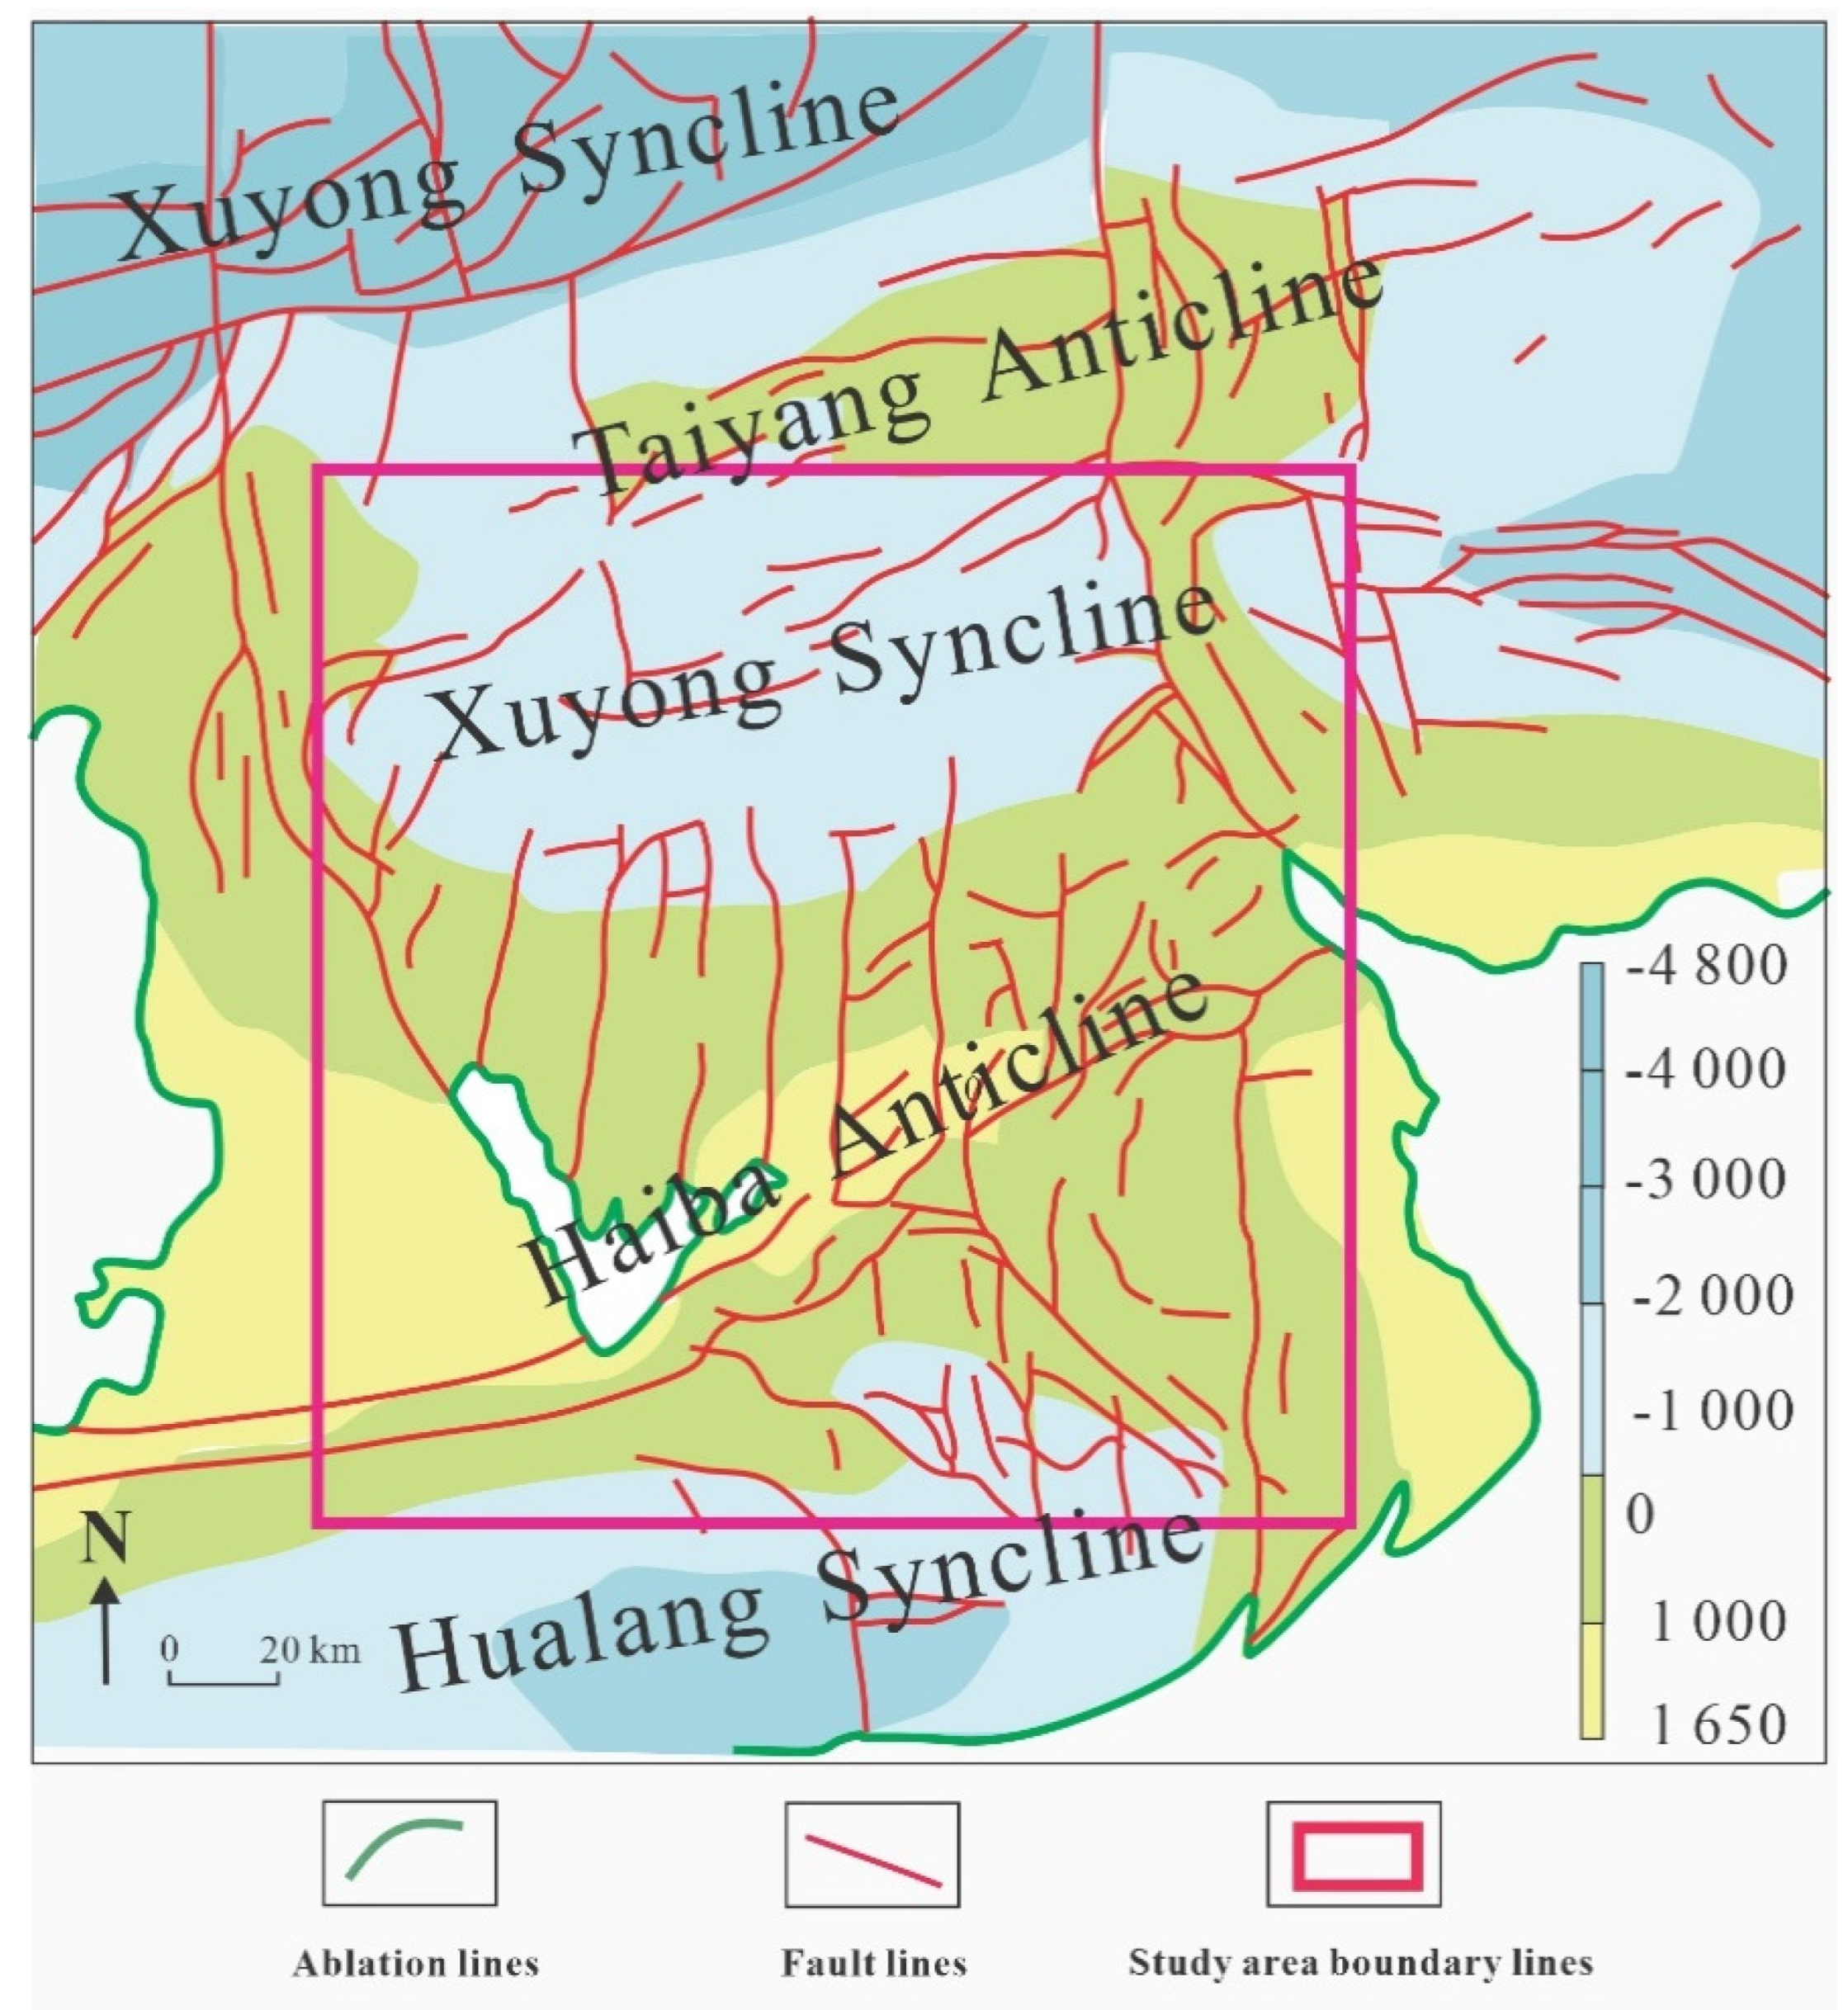
Figure 1. Research area location map. The green line indicates the extent of erosion of the target layer; the red line represents the fault line; the color scale denotes the elevation depth, ranging from −4800 m to 1650 m.
Energies 17 01682 g001
Figure 2. Examples of SEM images of shale micropores and microfractures: (a) organic pores accompanied by elongated clay; (b) organic pores accompanied by strawberry-shaped pyrite; (c) in situ authigenic bubble-like organic pores; (d) intercrystalline pores developed between strawberry-shaped pyrite crystals exhibiting rhombus-like shapes; (e) slit-like intergranular pores; (f) microfractures.
Energies 17 01682 g002aEnergies 17 01682 g002b
Figure 3. The histogram summarizes the experimental results for total organic carbon (TOC) measurements and part of the X-ray diffraction experimental outcomes for samples from the study area. Specifically, (a) represents the histogram for the statistical distribution of the TOC percentage content; (b) shows the histogram for the statistical distribution of TClay mineral content; and (c) illustrates the histogram for the statistical distribution of quartz mineral content. These histograms visually represent the variation and distribution of TOC, clay minerals (TClays), and quartz minerals within the samples, highlighting the range, average values, and variability of each parameter across the collected samples.
Energies 17 01682 g003
Figure 4. Rock component triangular composition diagram. The mineralogical characteristics of shale constituents in the stratigraphic units of the research area are illustrated through a ternary composition diagram. Within this diagram, from the L12 sub-unit to the O3w sub-unit, the burial depth of shale successively increases, whereas the content of clay and quartz minerals successively decreases, and the content of carbonate rocks successively increases.
Energies 17 01682 g004
Figure 5. The isothermal adsorption–desorption curves for some experimental samples are presented. The X-axis represents the ratio of the gas pressure during adsorption to the saturated vapor pressure of the gas; the Y-axis denotes the amount of gas adsorbed, with solid lines indicating the calculated adsorption curve and dashed lines representing the calculated desorption curve.
Energies 17 01682 g005
Figure 6. The distribution histograms for specific surface area (a), total pore volume (b), and average pore diameter are as follows (c).
Energies 17 01682 g006
Figure 7. The distributions of the maximum adsorption capacity, VL (a); Langmuir pressure, PL (b); and ρads (c).
Energies 17 01682 g007
Figure 8. Correlations between VL vs. SSA and VL vs. TPV.
Energies 17 01682 g008
Figure 9. Correlations between PL vs. SSA and PL vs. TPV.
Energies 17 01682 g009
Figure 10. Correlations between TOC and VL and PL.
Energies 17 01682 g010
Figure 11. Correlations between quartz and VL and PL.
Energies 17 01682 g011
Figure 12. Correlations between TClay and VL and PL.
Energies 17 01682 g012
Figure 13. Correlations between predicted and measured amount (a) and error distribution (b).
Energies 17 01682 g013
Table 1. The R-squared values (R2) for the correlation between VL, SSA, and TPV.
R2SSA vs. VLTPV vs. VL
Q3w0.7320.524
L1110.4860.855
L1120.6060.624
L1130.2630.233
L1140.4540.722
Table 2. The R2 values for the correlation between PL, SSA, and TPV.
R2SSA vs. PLTPV vs. PL
Q3w0.174 0.562
L1110.366 0.337
L1120.054 0.202
L1130.003 0.027
L1140.339 0.707
Table 3. R2 values for the correlation between TOC and VL and PL.
R2TOC vs. VLTOC vs. PL
Q3w0.486 0.008
L1110.123 0.030
L1120.405 0.001
L1130.525 0.003
L1140.438 0.053
Table 4. R2 values for the correlation between quartz and VL and PL.
R2Quartz vs. VLQuartz vs. PL
Q3w0.011 0.446
L1110.241 0.036
L1120.011 0.001
L1130.031 0.006
L1140.355 0.122
Table 5. R2 values for the correlation between TClay and VL and PL.
R2TClay vs. VLTClay vs. PL
Q3w 0.216 0.006
L111 0.045 0.133
L112 0.030 0.000
L113 0.049 0.011
L114 0.034 0.325
Table 6. Best-fitting parameters for each layer.
ParameterVLorgPLorgρadsorgVLTPVPLTPVΡadsTPVVLSSAPLSSAΡadsSSAR2
Value16.5470.3710.0870.0084.7330.080.1415.11420.10.98
Disclaimer/Publisher’s Note: The statements, opinions and data contained in all publications are solely those of the individual author(s) and contributor(s) and not of MDPI and/or the editor(s). MDPI and/or the editor(s) disclaim responsibility for any injury to people or property resulting from any ideas, methods, instructions or products referred to in the content.