Abstract
This article introduces a new approach for validating directional overcurrent protection schemes in ring-topology electrical distribution systems with distributed energy resources (DERs). The proposed protection scheme incorporates overcurrent and directional functions and addresses DER-induced challenges such as variable short circuit levels. This study employs real-time and offline simulations to evaluate the performance of the protection coordination scheme using a digital twin under DER-supplied loads. The utilization of digital twins offers the possibility to simulate different scenarios, providing real-time responses to dynamic changes and allowing for informed decision-making in response to disturbances or faults. This study aims to present a new approach to validate the performance of the proposed protection scheme when the load is entirely supplied by DERs, highlighting issues such as false trips and protection system blindness resulting from changes in short circuit currents. The results show a breakdown in the coordination of the protection scheme during the fault conditions, demonstrating the effectiveness of digital twins in validating the protection scheme’s performance. Performing an analysis in the electromagnetic transient (EMT) domain improves the validation and refines the results.
1. Introduction
The world is going through an energy transition. Centralized electrical power systems (EPS) with power flows from centralized generation plants to consumption centers are giving way to decentralized electrical systems with the integration of distributed energy resources (DERs) in distribution networks, including fuel cells, small wind turbines, photovoltaic systems, gas turbines, and fuel cells [1,2]. Electrical networks become more active and dynamic because of consumers being able to produce energy for either self-consumption or grid injection [3,4]. There are less transmission line losses and a decreased need to expand the electrical network because of the entry of DERs into the EPS, which results in a more environmentally friendly, reliable, and efficient system. However, there are major challenges to the protection system in the actual electrical networks when integrating these DERs [5,6,7]. Different short circuit levels and bidirectional power flows are produced when multiple DERs are connected to various grid nodes. These variations depend on the DER’s type, size, location, and operation mode [8,9,10]. In addition, selectivity losses, false tripping, or blinding protection are caused by coordination problems and compromised protection schemes adjust settings in the distribution grid [11,12].
There are a considerable number of research articles in the literature that assess the effects of DER on the overcurrent protection schemes of radial electrical distribution systems [13,14]. Among the primary devices prevalent in electrical grids, overcurrent relays (OCR) are extensively employed, utilizing measured currents to identify faults when surpassing predetermined thresholds. They are typically categorized into instantaneous (50), triggering a tripping signal to the circuit breakers if the current surpasses a predetermined threshold, and temporized (51), where the time–current operation characteristic is specified, and the relay operates after a specific time delay once the current exceeds the set threshold. When DER is integrated into the distribution network, bidirectional power flows are produced [15]. It is important to utilize a device capable of identifying this bidirectional power flow and preventing false tripping of a circuit breaker. This type of function is known as directional (67) and is useful in ring-network designs with multiple DERs. However, there are few studies [16,17] that validate the performance of this type of device during the integration of DERs in ring-networks and assist the industrial sector in this protection coordination analysis due to their complexity.
In reference [16], the authors present the coordination of protection devices in distribution systems in the context of distributed generation (DG). In this approach, an optimal protective coordination is achieved by using a fault current limiter (FCL) in the presence of DG. There is also an overview of the protective devices and their synchronization for a ring distribution network. This technique was validated in an IEEE 30 bus ring network, demonstrating the FCL’s ability to offer appropriate protection coordination.
The authors in reference [17] present an optimal coordination of a directional overcurrent protection mechanism in interconnected networks utilizing a fuzzy logic-based genetic algorithm (GA) method. This approach addressed miscoordination concerns and the relays’ long operation times. Furthermore, it was validated on three separate networks’ 6-bus, 8-bus, and IEEE 30-bus test systems, demonstrating the usefulness and accuracy of the proposed technique, which still must be evaluated with additional DERs.
Thus, this article’s goal is to present a study that enables us to understand how DERs affect distribution networks in a ring topology with overcurrent protection strategies by using a digital twin (DT) approach. This approach is implemented as software in the loop (SIL), suitable for validating complex systems, and to obtain accurate results [18]. The use of a DT allows for trained decision-making in reaction to failures, while the SIL allows us to use the electromagnetic transient (EMT) simulation domain to obtain more precise data to analyze the behavior of the ring-distribution system. Using this approach, it is possible to accelerate studies on protection coordination and define the configuration of the protection scheme using directional overcurrent protection systems. The protection coordination goal and the challenges presented by DER integration are also addressed in this research.
The contributions of the work are the following:
- A novel approach for validating a protection coordination scheme in a ring-distribution network architecture with DER.
- Digital twins are designed as a novel way to monitor and manage short circuit current and provide real-time protection coordination.
- The analyses are performed in the EMT domain rather than the RMS domain, allowing for more precise results.
The remainder of this document is organized as follows: Section 2 discusses the application of SIL for DT, as well as the benefits of using DT. Section 3 discusses the challenges that arise when integrating DERs into the distribution network, as well as the concept of protection coordination. In Section 4, the test bed used for validation is explained. Section 5 covers the protection coordination plan. Section 6 presents the results and discussion, while Section 7 contains the conclusions.
2. Application of Digital Twins in Power Grids
DTs have long been used as a tool in a broad range of engineering fields, and they have spread rapidly [19]. In their early stages, DTs were used for spatial modeling before evolving into information duplication models and establishing themselves as we know them today, where they are defined as a set of virtual data describing a physical element from which data are taken on a defined periodicity to display a database that allows for real-time monitoring of its behavior.
For this reason, it is critical to understand that DTs require a physical product in a real space, a virtual product that has all the characteristics of the real one, and a connection between the real and the virtual products that allows for data and information interactions.
It is essential to approach the implementation of a DT from several perspectives, such as physical, virtual, connection, data, and services, as illustrated in Figure 1.
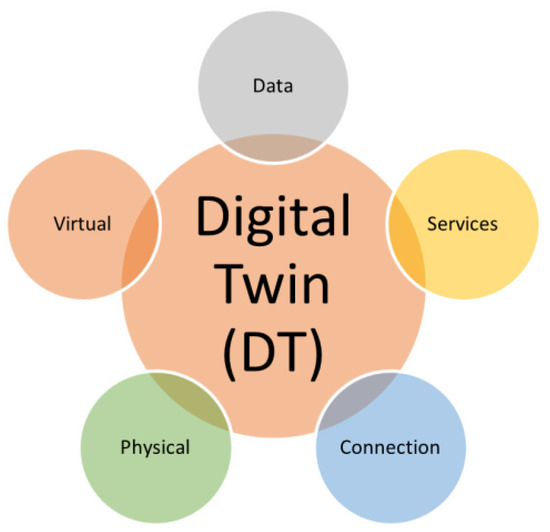
Figure 1.
Digital twin perspectives.
At the point of applying a digital twin to electrical networks with real-time simulations, we might consider four concepts (Figure 2): SIL, rapid control prototyping (RCP), hardware in the loop (HIL) and power hardware in the loop (PHIL). Reference [18] provides a broad explanation of each concept.
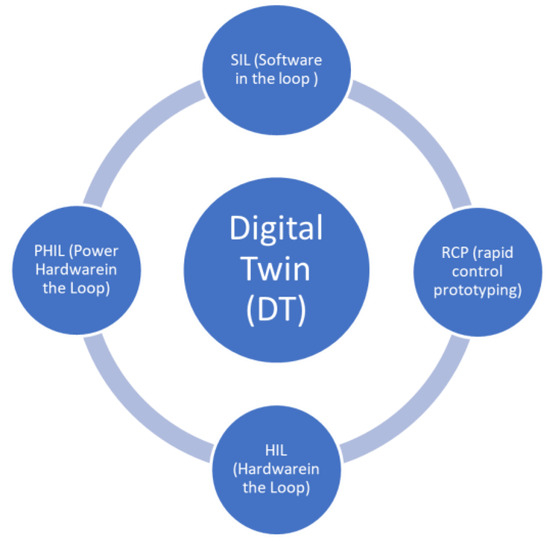
Figure 2.
DT with real-time simulation.
In our approach, the SIL model was utilized. A SIL model simulates both the controller (algorithm) and the physical system (distribution grid) in real time. This concept of real-time simulation is used to validate and test concepts. The advantage of this method over offline simulations is its lower response time due to the simulator’s computational power and parallel processing, which optimizes the execution time and speeds up early fault identification [20]. Figure 3 shows the implementation of SIL scheme for a DT to validate the performance of the protection scheme.
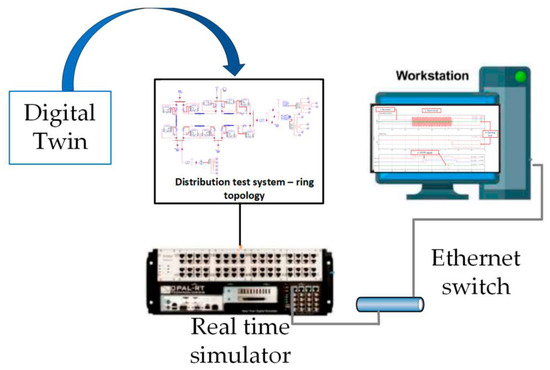
Figure 3.
DTs designed for the protection scheme.
The increasing complexity of electrical networks forces the different network operators to create strategies that allow them to adapt to changes in infrastructure and adapt quickly. One of these strategies is the adoption of DTs in the planning of modern electrical networks, which has benefits in areas such as asset management [21], energy and operation management [19], and control and protection [22].
Asset management refers to the largest resources in the sector, which includes the electrical network, infrastructure, measurement, control, and maneuvering elements, as well as inputs such as electrical wires. The utilization of DTs offers benefits such as:
- Increasing the useful life of facilities and equipment.
- Assisting with preventive maintenance to minimize maintenance expenses.
- Sensor validation prior to implementation and mass buying.
- Saving time and money on materials.
In energy management and operation and control, DTs offer benefits by:
- Minimizing the time and cost associated with manual coordination [19].
- Remote monitoring and real-time data connection [19]
- Detecting critical operational conditions, evaluating system performance, and making rapid decisions in reaction to system changes [19].
- Controlling and identifying scenarios in which the selectivity of the overcurrent protection method is compromised while introducing new DERs into the distribution network.
Because these new technologies have not been extensively explored, this generates a challenge of adaptation and appropriation. DTs are used for real-time simulations, depending on the precision required and each service provider’s particular market. Figure 4 shows a schematic for understanding the operation of a digital twin in an electrical network, which could be through software in the loop (SIL) or hardware (HIL).
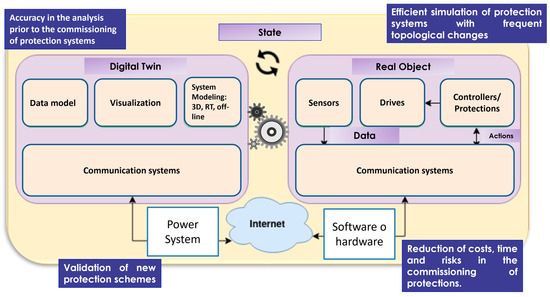
Figure 4.
Digital twin applications.
3. Protection Schemes in the Distribution System
A protection system (PS) is a set of interconnected components that work together to protect single or multiple components of the equipment [23]. In addition to ensuring maximal protection at the lowest feasible cost, each PS must provide selectivity, speed, and reliability in its operation [24,25]. Conventional distribution networks’ protection systems are typically based on the principle of coordination of time and current, with time considered to be important for the protection equipment’s rapid response, and current being important for the significant increase in current that takes place when short circuits occur [25,26]. Electrical distribution networks are protected by basic components like fuses, switches, reclosers, and overcurrent relays. Typically, these components work together to ensure that the distribution network’s transformers, feeders, and lines remain safe [27].
3.1. Protection Coordination
To ensure the reliability, safety, and quality of the energy supply as well as to preserve human life, protection coordination is essential. The goal of protection coordination is to arrange protection relays so that, in the event of a short circuit or other failure, only the faulty sections of the electrical system are isolated [28]. To prevent malfunction and consequently avoid unnecessarily interrupting of a functional portion of the system, the relays must be correctly coordinated. Conventionally, distribution networks are radial in their structure, which means that power flows unidirectionally, or in a single direction, enabling straightforward and effective protection schemes. Although radial networks are simple to set up and operate, they have issues with the energy supply’s reliability [29]. In contrast, ring network structures allow for power to flow in both directions, allowing the load to obtain power from two separate sources if one feeder fails. This ensures that the load, or a portion of it, is still supplied with power [30]. Due to the constant running of industrial processes, distribution networks in these locations frequently use ring networks, which can result in significant financial losses in the event of a system outage.
According to reference [28], ring distribution networks enhance the system’s reliability. Additionally, this type of network allows for greater adaptability to load fluctuations, an improved voltage distribution, and a decrease in losses. But unlike radial networks, ring network applications come with their own set of challenges. These include more intricate design and operation, which raises investment costs, increases short circuit currents, and results in issues coordinating protections.
The protection coordination of non-directional relay (OCR) 50/51 and directional overcurrent relay (DOCR) 67 is standardized in ring topologies where the network is powered by a single source [31]. Figure 5a shows a ring network for a single power supply, with DOCR in locations 2, 3, 4, and 5 and OCR in sites 1 and 6. The procedure is to open the ring at one end and coordinate as if it were a radial network. In other words, relays 2, 4, and 6 are coordinated by opening the ring at 1, and relays 5, 3, and 1 are coordinated by opening the ring at 6. Coordination between the relays may become a little more difficult if many sources provide the electrical system for ring distribution (Figure 5b). This is because numerous operational variables need to be considered. When there are two sources, the classification process is carried out by assuming the other source is a single-source system. The ring opens at one end, typically at one of the sources. Another approach is to use differential protection for the portion connecting the sources, but selectivity cannot be achieved for every configuration [30,31].
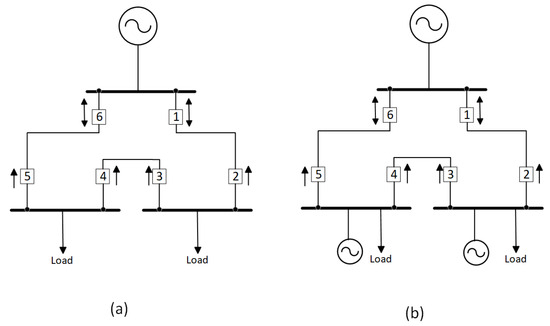
Figure 5.
Ring configuration [31] (a) with one source; (b) with multiple sources. Numbers are the relays, and the arrow is the power flow direction.
Because there are so many different scenarios in a ring network with various sources, designing and coordinating the protection system can become very challenging. However, it is possible to design solutions, and studies and research initiatives have led to the development of appropriate protection measures that have been published in the literature. The authors of references [32,33] provide an overview of the literature on the coordination of directional overcurrent relays and outline many developed methodologies. They describe the coordination of protections as an optimization issue and identify the optimal settings for the directional relays using a variety of methodologies, including differential evolution, linear programming, and genetic algorithms.
3.2. Challenges in the Protection Schemes Due to the DER Integration
The incorporation of DER into distribution networks presents new difficulties, especially in the protection coordinating solutions. Conventional overcurrent protection is designed for radial distribution systems where there is only one direction of fault current flow. However, when DER is connected to distribution networks, radial networks become multi-source networks, and fault current flow shifts from unidirectional to bidirectional [34]. Because the fault current flow is bidirectional, directional relays are necessary for coordination. The challenge is caused by the distribution network’s operating modes, the high penetration of DER, and the intermittent nature of DER fault current levels [34,35]. This leads to coordination issues with current protection devices including fuses, relays, and reclosers. Furthermore, the incorporation of a large number of distributed generators may degrade the voltage profile and result in severe overvoltage within the system [3]. It can be said that these ring structures may be more compatible with the integration of microgrids; therefore, protection from directional relays could protect the network to a certain limit. However, reliability is not guaranteed.
4. Distribution System in Ring Topology and Protection Coordination
The literature has a variety of test networks, including the models provided by the Institute of Electrical and Electronics Engineers’ Power & Energy Society (PES) (IEEE). The goal is to offer distribution system models that accurately capture the significant range of design variations and associated analytical difficulties [36]. A prototype ring test network with six nodes was designed at a voltage level of 34.5 kV, and in accordance with CREG resolution 097 of 2008 [37], this network represents a local electrical distribution system. Most IEEE models are systems with radial topologies, and there are not many different types of ring networks. In Figure 6, the network is displayed.
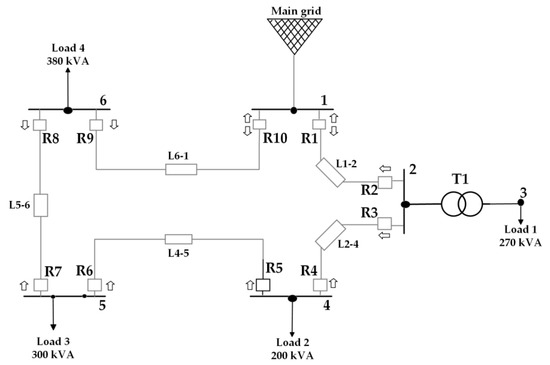
Figure 6.
Distribution system—ring topology. R = relay, T = transformer.
The distribution system consist of five nodes with nominal voltages of 34.5 kV and one at 0.48 kV, five distribution lines varying in length from 2 to 6 km, four three-phase loads with nominal voltages between 200 and 380 kVA, a transformer in the node 3 Dy5 connection, and a transformation ratio of 34.5 kV to 0.48 kV constitute the network. Table 1 describes the key parameters of the electrical system.

Table 1.
Key parameters of the electrical system.
Protection Coordination
For the ring network, a DOCR scheme was developed. The system consists of two non-directional and eight directional relays (see Figure 6). The network was modeled in off-line simulation software for the protection coordination analysis. Data on the nominal and short circuit currents of the ring network were gathered through load flow and short circuit analyses of various operating situations. With the use of these data, coordination was performed using the single-source ring network standard approach. The IEEE Std 242-2001 standard [38], as well as the book “Protection of Electricity Distribution Networks” by Juan Manuel Gers and Edward Holmes [25], served as the foundation for the selection and adjustment criteria. The applied settings are shown in Table 2.

Table 2.
Directional overcurrent protection scheme adjustment.
5. Real-Time (RT) Simulation
Due to the dynamic behavior that would arise in electrical distribution networks when DER integration is implemented, simulation tools that enable very precise study execution and are in sync with the electrical phenomenon under analysis are essential. This is accomplished by using real-time simulation software, which is distinguished by accurately simulating a physical system or process with sample times that match the real phenomena exactly; that is, one simulation second corresponds to precisely one real phenomenon second. This feature makes it feasible for physical components or devices to directly interact with the simulated networks [20,39]. This is not possible with offline simulation tools, since in that scenario, the sample time differs from the actual phenomena. As a result, up to one hour of compilation would be required to mimic a 10 s event [20]. Furthermore, this approach uses real-time simulation in the EMT domain to provide more exact data regarding the fault condition.
According to references [20,40,41], the necessity, application, and complexity of the system under study, as well as the degree of approximation required to accurately represent the phenomenon in real time, can determine the many types or real-time simulation techniques that are typically employed. The SIL system, which simulates both the controller (protection devices) and the plant (electrical network), served as the framework for this research.
5.1. Modelling the Test Bed Network in Real Time
Real-time simulation software was used to model the ring test network. The modeling was verified by studies of short circuits and load flow. These were compared with the outcomes from offline simulation programs. The study results are shown in Table 3 and Table 4. The time domain was used to obtain the simulations. For comparison, the root mean square (RMS) value of the short circuit data from the fault oscillographs was determined. According to Table 3, there is less than a 5.5% inaccuracy in the symmetrical short circuit current (Icc).

Table 3.
Results of the short circuit study.

Table 4.
Results of the load flow study for RT and offline simulation software.
However, there were no discernible changes in the load flow study comparison. The voltage and power numbers’ percentage inaccuracy were less than 2.32%, as Table 4 shows. These errors are acceptable for the simulation to be used in real time when one considers that two distinct calculation methods are being employed, that the element models are fundamentally different, and that each software has different purposes.
5.2. Modelling Test Bed Network with DER
Three different DER types were chosen based on the real-time simulation software models. A brief explanation of each component is given below.
- Photovoltaic generation system (PVGS): the system is made up of an array of solar panels and an electronic converter with a phase-locked loop (PLL) controller, with an operating frequency of 60 Hz and a nominal power of 750 kW.
- Storage system (BESS): The BESS battery bank has a capacity of 250 kW, an electronic converter and a PLL controller, and an operating frequency of 60 Hz.
- Thermal generation system (CHP): this thermal generation model is a combined heat and power system. It uses a gas turbine, a steam turbine, and a recovery boiler, and it has a capacity of 1 MW at 2.4 kV.
Technical factors including enhancing voltage profiles, cutting energy losses, and increasing power transfer capacity must be ensured while placing DERs. According to IEEE Std 1547-2018 [42], it is also required to identify the EPS region to which the DER is linked to ensure that the source does not energize during a short circuit and trips. Furthermore, the resource’s availability for generating devices must also be considered, as it is dependent on the surrounding environment [43]. The voltage profile of the test network in steady state served as the requirement for DER placement. Nodes 3 and 5 are the ones chosen to integrate the DERs since they have the biggest voltage drops based on the power flow findings (see Table 4). After the DERs are incorporated into the ring network, it can be viewed as a multi-source, decentralized, dynamic distribution system. Note that the DERs’ input and output controls will be implemented in accordance with the intended operational situations that are to be emulated. Figure 7 displays the microgrid schematic.
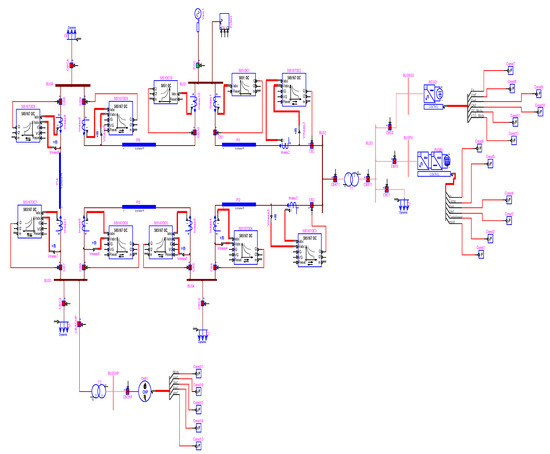
Figure 7.
Model using RT simulation software: ring distribution system with integration of DERs.
5.3. Validation of the Overcurrent Protection Scheme in Ring Topology with the Integration of DERs
We used the SIL simulation to verify the ring network overcurrent protection scheme. To confirm that the system was operating correctly in a stable state, we started by integrating the DERs at various power levels. Later, failures were conducted to determine changes in the short circuit current that the distribution network experienced because of the integrated DERs operating in various modes.
Following parameterization of the same short circuit currents acquired from the off-line simulation program, the DER integration levels were adjusted, and the DERs were linked to the ring network to determine the magnitude of the change in short circuit current. Initially, the PVGS and BESS were connected. Subsequently, the CHP alone was connected, then, all the DERs were coupled simultaneously. Finally the testing was conducted in island mode—that is, with all DERs connected—while the main grid was disconnected. The results of the operating modes taken into consideration are shown in Table 5.

Table 5.
Three-phase short circuit currents in various scenarios of distribution system operation.
The operating modes where the Icc varies the most must be considered to see an effect on the relays’ operating times, since it is intended to validate the effectiveness of the suggested protection scheme. The ring network with all the eDERs integrated and in island mode are the operating modes that enabled the most significant changes in the Icc to be seen.
Case Studies and Operation Scenarios
Figure 8 shows several of the proposed three-phase short circuit fault locations, which were suggested in accordance with the modifications to the short circuit current and to validate the suggested protection strategy. There were two scenarios used for the simulations or operating modes, namely island mode and grid-connected mode.
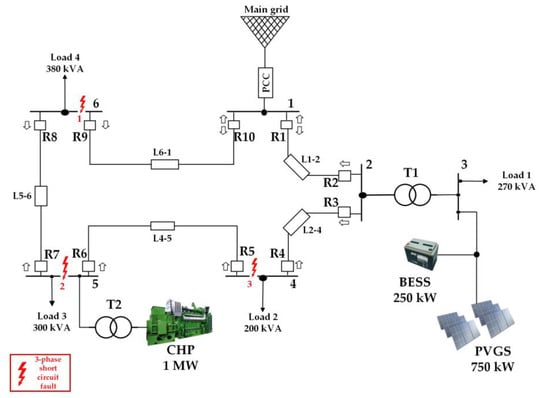
Figure 8.
Three-phase short circuit fault location. R = relay; T = Transform.
Three case studies—3-phase faults in nodes 6, 5, 4—were chosen. The faults were set up to begin and end at 0.5 and 1.5 s, respectively, representing the typical operating time of the protection scheme. No openings were made in the network to clear the faults so that the operation sequence and all potential trips could be seen.
6. Analysis Results
As the number of DERs in the electrical network advances, it is critical to conduct comprehensive research on protection, control, and communication conditions. The increasing complexity necessitates demanding and extensive studies. Addressing these difficulties demands advanced methodologies, and the use of DT and RT simulations appears to be a potential solution. In the following section, we will provide the results of RT simulation. These simulations are focused on the ring network’s operating scenarios, specifically its grid-connected performance with all DERs integrated and the island mode. These results illuminate the effectiveness of our approach in monitoring and enhancing network behavior under a variety of scenarios, offering valuable insights for improved system resilience and performance.
6.1. Grid-Connected Mode Scenario with DER in a Ring Topology
The three-phase fault results for each of the three case studies are displayed below.
6.1.1. Case Study 1—Three-Phase Fault in Node 6
The results for a three-phase fault in node 6 are shown in Figure 9. The oscillographs allow one to examine the transition from the nominal current to Icc. Furthermore, the trigger signals originating from the relays they operated in are given.
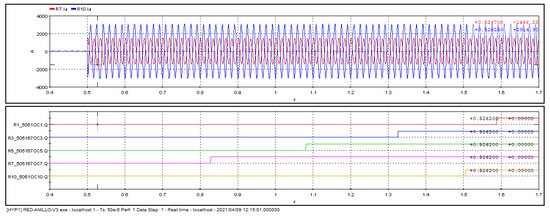
Figure 9.
Operational sequence and Icc oscillographs for a fault in node 6 with all sources in ring topology.
The backup relays are relays 5, 3, and 1, with relay 7 being the first to clear the fault. Relay 10 operates on the other branch that feeds the fault. The operating duration of R7 is the same as the reference case without DER, but there is a significant difference in the Icc’s associated CT measurement for this case, since it represents the total of all the sources that contribute to the short circuit. The reason for this is because of the properties of inverse curves: the fault current is inversely proportional to the operation time, meaning that at low currents, operation times are very high, and at higher fault currents, operation times decrease. However, there comes a point at which the operating times do not significantly vary, even though the Icc increases. The operating times are constant for relay 7 and, by extension, for all relays for Icc > 500 A.
6.1.2. Case Study 2—Three-Phase Fault in Node 5
The results for a three-phase fault in node 5 are shown in Figure 10. The oscillographs of the short circuit currents that feed the fault and the trip signals of the relays are shown.
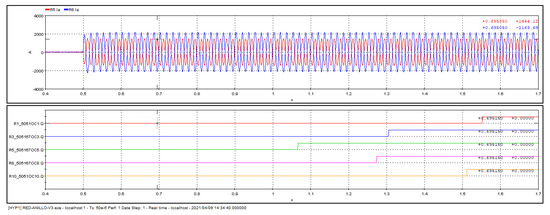
Figure 10.
Operational sequence and Icc oscillographs for a fault in node 5 with all sources in ring topology.
The fault is cleared by relay 5 initially, with support from relays 3 and 1. Relay 8 and relay 10, which are its backups, are operational on the other branch that feeds the fault. Even while the BESS and PVGS contributed to the failure, it was not a substantial amount in comparison to the main grid’s contribution, which is measured by the relays. The relays measure almost the same current as in the reference example; however, since the failure is in the CHP feeder bus, it prevents the Icc of this source from directly interacting with the protection scheme. However, to isolate the failure at node 5, the CHP protection system must ensure that this DER is isolated from the system at the time of failure. If not, this source would continue to feed the issue continuously.
6.1.3. Case Study 3—Three-Phase Fault in Node 4
The results for a three-phase fault in node 4 are shown in Figure 11. The oscillographs of the short circuit currents that feed the fault and the trip signals of the relays are shown.
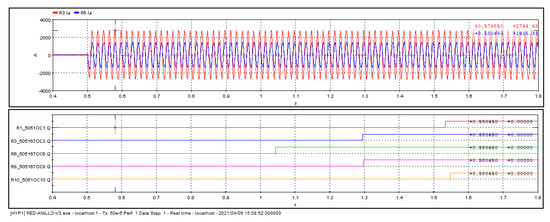
Figure 11.
Operational sequence and Icc oscillographs for a fault in node 4 with all sources in ring topology.
Relays 6 clears the fault first, with relays 8 and 10 serving as its backups. On the other branch that feeds the fault, relay 3 operates, with relay 1 acting as its backup. Based on the order of operations, the relay trips are happening in an organized and selective manner. In terms of operation timing, it is noted that the margin time between the primary and secondary protection trips stays at roughly 0.25 s, in line with the coordinated elements of the proposed protection scheme. A similar behavior was obtained in the simulations carried out for the failures in nodes 5 and 6 for this operation scenario.
In general, we can conclude that the increase in the short circuit current generated by the DERs does not represent a significant change in the operation of the proposed protection scheme under the operation scenario selected. This is due to the characteristics of inverse curves, where the fault current is inversely proportional to the operation time; that is, for low currents there have very high operation times. As the fault current increases, the operation times decrease, but a point is reached where, despite the Icc increasing, the operating time does not vary appreciably.
6.2. Island Mode Scenario with DER
The RT simulation findings for the operating scenario in which the ring network is not connected to the main grid and all DERs are connected—also known as island mode—are shown below. The RT simulation results for node 6, 5, and 4 failures, respectively, with the ring network running in island mode are shown in Figure 12, Figure 13 and Figure 14. The oscillographs of the short circuit currents that feed the fault and the trip signals of the relays are shown.
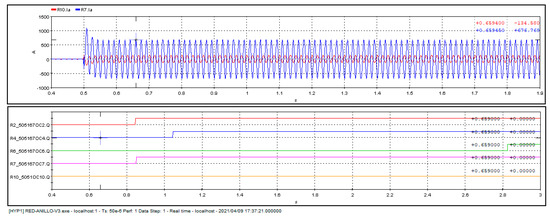
Figure 12.
Operational sequence and Icc oscillographs for a node 6 ring network failure in island mode.
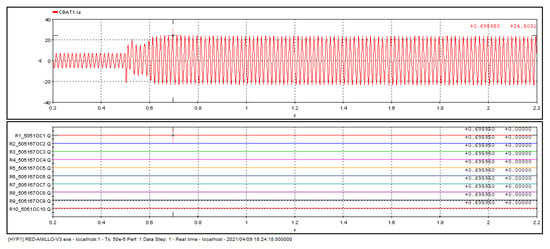
Figure 13.
Operational sequence and Icc oscillographs for a node 5 ring network failure in island mode.
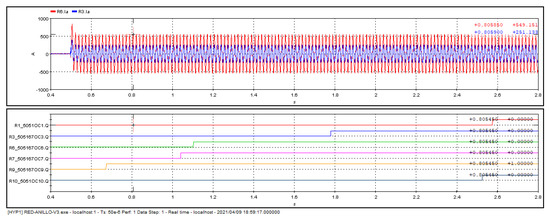
Figure 14.
Operational sequence and Icc oscillographs for a node 4 ring network failure in island mode.
There is a significant decrease in the fault current as the fault mode switches to island mode. Figure 12 illustrates that, in contrast to the reference situation, where , we currently have . However, upon examination of the operating sequence, relays 2 and 7 function as the primary protection, with relays 4 and 6 serving as relay 2’s backup. The only R7 common operation that takes place is in comparison with the reference case. We can infer that there is a change in the fault current’s direction because this mode primarily involves the operation of even relays.
In terms of operating time, R6’s trigger signal is delayed after R4 and R2, acting as a backup. In fact, to fully appreciate R6’s shot, the failure time must be extended to 2.5 s. The offset requirements provided in IEEE Std 242-2001 [38] enable the definition of the margin time. This period is typically in the range of 0.25 to 0.4 s to achieve proper sequential activation of the switches. The trigger signals of R4 and R6 have a margin time of 1.8 s in this instance, which deviates from the standard’s advised behavior. This case study also includes the non-operation of relay R10, which is categorized as blinding the protection.
The RT simulation results show that the entire protection scheme is blinded for a fault in node 5 in island mode because there is not a trigger signal from any of the relays in the MR. This results from a significant decrease in the fault current, as only the DER contributes to the fault current in the island mode.
The CHP and the BESS set with the PVGS are the sources that are contributing to the failure. However, the relays are only measuring the Icc that comes from the BESS and the PVGS through their CTs, and the protection scheme fails to recognize the Icc supplied by the CHP because the fault is in the node where the CHP is connected. The relays detect a current that is very near to the nominal one, and DERs that rely on inverters and power electronics contribute relatively little to the fault current. Since the fault current is roughly twice the nominal current, as shown by the oscillography in Figure 13, the EP does not categorize it as a fault.
In Figure 14, there is a significant decrease in the fault current as the fault mode switches to island mode. moves to in island mode for a fault in node 4. The relays require a longer time to transmit the trigger signal because of this decrease in the fault current. According to Figure 6, R9 and R7 operate first, then R6 and R3, and lastly R10 and R1. To be able detect the trip signal in the latter, it was essential to increase the failure duration to 2.5 s. As per the proposed protection scheme, in the event of a failure at node 4, R6 and R3 are supposed to operate as the primary protection, followed by their backups, R8 and R1, respectively.
Nevertheless, in this scenario, R9 and R7 also operate, indicating a change in the direction of the Icc through that branch. Furthermore, there is a notable delay in R3’s operation, starting at 1.28 s from the start of the failure, and its backup, R1, operating 0.75 s later. The offset requirements provided in IEEE Std 242-2001 [38] allow for the definition of the margin time—the interval of time that the relays need to maintain between curves. This period is typically in the range of 0.25 to 0.4 s to achieve correct sequential activation of the switches. Therefore, the criterion is being broken in this instance. In general, the suggested protection scheme was significantly impacted and made inoperable by the change from the connected mode to the island mode in the ring distribution network, where the demand is fed only by DER.
7. Conclusions
Through RT simulations, the suggested directional overcurrent protection strategy for the ring network was validated, and its response to the integration of DERs was explained. We illustrated the dynamic behavior of the protection scheme, Icc, and fault events using the SIL simulation scheme in the EMT domain. This method provided a thorough comprehension of the topic under study. The effectiveness of the suggested protective plan was demonstrated in the studied cases in which the ring network operated in connection with the main grid. The integration of DERs resulted in an increase in short circuit current, while the protection scheme speed and selectivity stayed in line with the scenario used as a reference.
Notably, appropriate protection methods are required for DERs to guarantee their disconnection in the event of a system breakdown, hence enabling appropriate fault clearance. On the other hand, the suggested protection plan, which depended only on DERs for the load supply, was ineffective during island operation. There were reported cases of false trips and a reduced protection operation range because of a large short circuit current drop. The selectivity and reliability of the suggested EP were jeopardized by the longer relay response times that followed this reduction.
In contrast to conventional networks, the incorporation of DERs into electrical systems presents new issues in electrical protections. In comparison to offline simulation tools, real-time simulation proves to be an indispensable tool, providing faster and more accurate results. In addition, it makes it easier to interact with real systems and real objects. This allows for the examination and experimentation of various situations to assess how system components behave when disrupted, producing outcomes that are highly compatible with practical applications.
Future work might include evaluating overcurrent protections in microgrids with ring topologies or interconnection topologies using real-time simulations under the power hardware in the loop simulation scheme with different type of faults, as well as implementing an adaptive protection scheme for the ring microgrid using the various configuration profiles that the relays have to evaluate their performance and the current transformer saturation when the DERs are inserted into the grid.
Author Contributions
Conceptualization, writing, review and editing, E.G.-L. and J.D.L.C.; review and editing, E.G.-L., J.D.L.C. and J.C.V. All authors have read and agreed to the published version of the manuscript.
Funding
This research received no external funding.
Data Availability Statement
The data supporting the conclusions of this article are contained within the manuscript.
Acknowledgments
The authors express their gratitude to the GRALTA Research Group from the school of electrical and electronic engineering of the Universidad del Valle and to the Center for Research on Microgrids (CROM) for their discussions and contributions during the development of this paper.
Conflicts of Interest
The authors declare no conflicts of interest.
Abbreviations
| BESS | Battery energy storage system |
| CHP | Thermal generation system |
| DER | Distribute energy resources |
| DG | Distributed generation |
| DOCR | Directional overcurrent relay |
| DT | Digital twin |
| EPS | Electrical power system |
| EMT | Electromagnetic transient |
| FCL | Fault current limiter |
| GA | Genetic algorithm |
| HIL | Hardware in the loop |
| MGs | Microgrids |
| MIL | Model in the loop |
| OCR | Overcurrent relay |
| PCC | Point of common coupling |
| PDD | Power protection devices |
| PHIL | Power hardware in the loop |
| PnP | Plug-and-play |
| PS | Protection systems |
| PVGS | Photovoltaic generation system |
| RCP | Rapid control prototype |
| RT | Real time |
| SIL | Software in the loop |
References
- Mina Casaran, J.D.; Caicedo Bravo, E.F.; Lozano Moncada, C.A. Una propuesta de integración de arquitecturas de generación descentralizada en ambientes de micro-redes. Entre Cienc. E Ing. 2017, 11, 9–17. [Google Scholar] [CrossRef]
- REN21. Advancing the Global Renewable Energy Transition. 2017. Available online: https://www.ren21.net/reports/ren21-reports/ (accessed on 27 March 2024).
- Celli, G.; Pilo, F.; Pisano, G.; Cicoria, R.; Iaria, A. Meshed vs. radial MV distribution network in presence of large amount of DG. In Proceedings of the IEEE PES Power Systems Conference and Exposition, New York, NY, USA, 10–13 October 2004; IEEE: Piscataway, NJ, USA, 2005; pp. 1357–1362. [Google Scholar] [CrossRef]
- Memon, A.A.; Kauhaniemi, K. A critical review of AC Microgrid protection issues and available solutions. Electr. Power Syst. Res. 2015, 129, 23–31. [Google Scholar] [CrossRef]
- Mumtaz, F.; Bayram, I.S. Planning, Operation, and Protection of Microgrids: An Overview. Energy Procedia 2017, 107, 94–100. [Google Scholar] [CrossRef]
- Chris, M.; Chatzivasileiadis, S.; Abbey, C.; Joos, G.; Lombardi, P.; Mancarella, P. Microgrid Evolution Roadmap Engineering, Economics, and Experience. In Proceedings of the 2015 International Symposium on Smart Electric Distribution Systems and Technologies (EDST15), Vienna, Austria, 7–11 September 2015. [Google Scholar]
- Patnaik, B.; Mishra, M.; Bansal, R.C.; Jena, R.K. AC microgrid protection—A review: Current and future prospective. Appl. Energy 2020, 271, 115210. [Google Scholar] [CrossRef]
- Shiles, J.; Wong, E.; Rao, S.; Sanden, C.; Zamani, M.A.; Davari, M.; Katiraei, F. Microgrid protection: An overview of protection strategies in North American microgrid projects. In Proceedings of the 2017 IEEE Power & Energy Society General Meeting, Chicago, IL, USA, 16–20 July 2017; IEEE: Piscataway, NJ, USA, 2017; pp. 1–5. [Google Scholar] [CrossRef]
- Kumar, N.; Jain, D.K. An Adaptive Inverse-Time Overcurrent Protection Method for Low Voltage Microgrid. In Proceedings of the 2020 IEEE 9th Power India International Conference (PIICON), Sonepat, India, 28 February–1 March 2020; IEEE: Piscataway, NJ, USA, 2020; pp. 1–5. [Google Scholar] [CrossRef]
- De La Cruz, J.; Gómez-Luna, E.; Ali, M.; Vasquez, J.C.; Guerrero, J.M. Fault Location for Distribution Smart Grids: Literature Overview, Challenges, Solutions, and Future Trends. Energies 2023, 16, 2280. [Google Scholar] [CrossRef]
- Gómez-Luna, E.; Candelo, J.E.; Marlés, E.; de la Cruz, J. Impact of adaptive protections in electric microgrids, challenges and future trends. J. Eng. Sci. Technol. Rev. 2019, 12, 60–69. [Google Scholar] [CrossRef]
- Kai-Hui, Z.; Ming-Chao, X. Impacts of microgrid on protection of distribution networks and protection strategy of microgrid. In Proceedings of the 2011 IEEE International Conference on Advanced Power System Automation and Protection, Beijing, China, 16–20 October 2011; IEEE: Piscataway, NJ, USA, 2011; pp. 356–359. [Google Scholar] [CrossRef]
- Majeed, A.A.; Altaie, A.S.; Abderrahim, M.; Alkhazraji, A. A Review of Protection Schemes for Electrical Distribution Networks with Green Distributed Generation. Energies 2023, 16, 7587. [Google Scholar] [CrossRef]
- Meskin, M.; Domijan, A.; Grinberg, I. Impact of distributed generation on the protection systems of distribution networks: Analysis and remedies–review paper. IET Gener. Transm. Distrib. 2020, 14, 5944–5960. [Google Scholar] [CrossRef]
- Gao, K.; Wang, T.; Han, C.; Xie, J.; Ma, Y.; Peng, R. A Review of Optimization of Microgrid Operation. Energies 2021, 14, 2842. [Google Scholar] [CrossRef]
- Abdi, B.; Abroshan, M.; Aslinezhad, M.; Alimardani, A. Coordination Return of Protective Devices in Distribution Systems in Presence of Distributed Generation. Energy Procedia 2011, 12, 263–270. [Google Scholar] [CrossRef]
- Alkaran, D.S.; Vatani, M.R.; Sanjari, M.J.; Gharehpetian, G.B.; Naderi, M.S. Optimal Overcurrent Relay Coordination in Interconnected Networks by Using Fuzzy-Based GA Method. IEEE Trans. Smart Grid 2018, 9, 3091–3101. [Google Scholar] [CrossRef]
- Gómez-Luna, E.; Becerra, J.E.C.; Sáenz, E.M. Current Status and Future Trends in Protection, Control and Communications Testing in Electrical Grids using Real-time Simulation. J. Eng. Sci. Technol. Rev. 2018, 11, 204–214. [Google Scholar] [CrossRef]
- Bazmohammadi, N.; Madary, A.; Vasquez, J.C.; Mohammadi, H.B.; Khan, B.; Wu, Y.; Guerrero, J.M. Microgrid Digital Twins: Concepts, Applications, and Future Trends. IEEE Access 2022, 10, 2284–2302. [Google Scholar] [CrossRef]
- Gómez-Luna, E.J.; Palacios-Bocanegra, L.; Candelo-Becerra, J. Real-time simulation with OPAL-RT technologies and applications for control and protection schemes in electrical networks. J. Eng. Sci. Technol. Rev. 2019, 12, 136–144. [Google Scholar]
- Rüth, C.; Diagnostics in the Digital Twin. SIEMENS. Available online: https://www.siemens.com/global/en/company/stories/research-technologies/digitaltwin/error-diagnosis-digital-twin.html (accessed on 27 February 2024).
- Gómez-Luna, E.; Candelo-Becerra, J.E.; Vasquez, J.C. A New Digital Twins-Based Overcurrent Protection Scheme for Distributed Energy Resources Integrated Distribution Networks. Energies 2023, 16, 5545. [Google Scholar] [CrossRef]
- Booth, C.; Bell, K. Protection of transmission and distribution (T&D) networks. In Electricity Transmission, Distribution and Storage Systems; Elsevier: Amsterdam, The Netherlands, 2013; pp. 75–107. [Google Scholar] [CrossRef]
- Atwa, O.S.E. Protection Relays. In Practical Power System and Protective Relays Commissioning; Elsevier: Amsterdam, The Netherlands, 2019; pp. 189–280. [Google Scholar] [CrossRef]
- Gers, J.M.; Holmes, E.J. Protection of Electricity Distribution Networks; Institution of Engineering and Technology: Stevenage, UK, 2011. [Google Scholar] [CrossRef]
- Singh, M. Protection coordination in distribution systems with and without distributed energy resources-a review. Prot. Control Mod. Power Syst. 2017, 2, 27. [Google Scholar] [CrossRef]
- Srivastava, I.; Bhat, S.; Vardhan, B.V.S.; Bokde, N.D. Fault Detection, Isolation and Service Restoration in Modern Power Distribution Systems: A Review. Energies 2022, 15, 7264. [Google Scholar] [CrossRef]
- Shobole, A.; Baysal, M.; Wadi, M.; Tur, M.R. Protection Coordination Practices for Industrial Ring Distribution Network Case Study of Organized Industrial Zone (GEBZE, Turkey). In Proceedings of the 2018 7th International Conference on Renewable Energy Research and Applications (ICRERA), Paris, France, 14–17 October 2018; IEEE: Piscataway, NJ, USA, 2018; pp. 1027–1031. [Google Scholar] [CrossRef]
- Reno, M.J.; Brahma, S.; Bidram, A.; Ropp, M.E. Influence of Inverter-Based Resources on Microgrid Protection: Part 1: Microgrids in Radial Distribution Systems. IEEE Power Energy Mag. 2021, 19, 36–46. [Google Scholar] [CrossRef]
- Ramamoorty, M.; Venkata Naga Lakshmi Lalitha, S. Microgrid Protection Systems. In Micro-Grids-Applications, Operation, Control and Protection; IntechOpen: London, UK, 2019. [Google Scholar] [CrossRef]
- Sorrentino, E.; Gupta, N. Summary of useful concepts about the coordination of directional overcurrent protections. CSEE J. Power Energy Syst. 2019, 5, 382–390. [Google Scholar] [CrossRef]
- Hussain, M.; Rahim, S.; Musirin, I. Optimal Overcurrent Relay Coordination: A Review. Procedia Eng. 2013, 53, 332–336. [Google Scholar] [CrossRef]
- Rajput, V.N.; Pandya, K.S. Coordination of directional overcurrent relays in the interconnected power systems using effective tuning of harmony search algorithm. Sustain. Comput. Inform. Syst. 2017, 15, 1–15. [Google Scholar] [CrossRef]
- Haron, A.R.; Mohamed, A.; Shareef, H. Coordination of Overcurrent, Directional and Differential Relays for the Protection of Microgrid System. Procedia Technol. 2013, 11, 366–373. [Google Scholar] [CrossRef]
- Telukunta, V.; Central Power Research Institute; Pradhan, J.; Agrawal, A.; Singh, M.; Srivani, S.G. R V College of Engineering Protection challenges under bulk penetration of renewable energy resources in power systems: A review. CSEE J. Power Energy Syst. 2017, 3, 365–379. [Google Scholar] [CrossRef]
- Schneider, K.P.; Mather, B.A.; Pal, B.C.; Ten, C.-W.; Shirek, G.J.; Zhu, H.; Fuller, J.C.; Pereira, J.L.R.; Ochoa, L.F.; de Araujo, L.R.; et al. Analytic Considerations and Design Basis for the IEEE Distribution Test Feeders. IEEE Trans. Power Syst. 2018, 33, 3181–3188. [Google Scholar] [CrossRef]
- Comision de Regulación de Energía y Gas (CREG). Resolución creg_097_de_2008. 2008. Available online: https://www.enel.com.co/content/dam/enel-co/espa%C3%B1ol/2-empresas/marco-regulatorio/creg_097_de_2008.pdf (accessed on 27 March 2024).
- IEEE Std 242-2001; (Revision of IEEE Std 242-1986) [IEEE Buff Book], IEEE Recommended Practice for Protection and Coordination of Industrial and Commercial Power Systems (IEEE Buff Book). IEEE: Piscataway, NJ, USA, 2001.
- von Jouanne, A.; Agamloh, E.; Yokochi, A. Power Hardware-in-the-Loop (PHIL): A Review to Advance Smart Inverter-Based Grid-Edge Solutions. Energies 2023, 16, 916. [Google Scholar] [CrossRef]
- Strasser, T. Real-Time Simulation Technologies for Power Real-Time Simulation Technologies for Power System Design, Testing, and Analysis. IEEE Power Energy Technol. Syst. J. 2015, 2, 63–73. [Google Scholar] [CrossRef]
- Belanger, J.; Venne, P.; Paquin, J.-N. The What, Where and Why of Real-Time Simulation. Planet RT 2010, 1, 37–49. [Google Scholar]
- IEEE Std 1547-2018; IEEE Standard for Interconnection and Interoperability of Distributed Energy Resources with Associated Electric Power Systems Interfaces. IEEE: Piscataway, NJ, USA, 2018; (Revision of IEEE Std 1547-2003, Apr. 2018).
- Magadum, R.B.; Kulkarni, D. Optimal Location and Sizing of Multiple DG for Efficient Operation of Power System. In Proceedings of the 2018 4th International Conference on Electrical Energy Systems (ICEES), Chennai, India, 7–9 February 2018; IEEE: Piscataway, NJ, USA, 2018; pp. 696–699. [Google Scholar] [CrossRef]
Disclaimer/Publisher’s Note: The statements, opinions and data contained in all publications are solely those of the individual author(s) and contributor(s) and not of MDPI and/or the editor(s). MDPI and/or the editor(s) disclaim responsibility for any injury to people or property resulting from any ideas, methods, instructions or products referred to in the content. |
© 2024 by the authors. Licensee MDPI, Basel, Switzerland. This article is an open access article distributed under the terms and conditions of the Creative Commons Attribution (CC BY) license (https://creativecommons.org/licenses/by/4.0/).