Article

A Novel 1D Approach for Modelling Gas Bladder Suppressors on the Delivery Line of Positive Displacement Pumps

by
Paolo Casoli
1,*,
Carlo Maria Vescovini
1,
Hatami Garousi Masoud
1 and
Massimo Rundo
2
1
Department of Engineering and Architecture, University of Parma, 43124 Parma, Italy
2
Department of Energy, Politecnico di Torino, C.so Duca degli Abruzzi 24, 10129 Turin, Italy
*
Author to whom correspondence should be addressed.
Energies 2024, 17(7), 1610; https://doi.org/10.3390/en17071610
Submission received: 27 February 2024 / Revised: 19 March 2024 / Accepted: 26 March 2024 / Published: 28 March 2024

Abstract

:
This paper concerns the utilisation of a gas bladder hydraulic suppressor to mitigate oscillations in the delivery flow rate of positive displacement machines. The research focuses on two primary objectives: first, the experimental validation of the potential of this solution and second, the formulation of a one-dimensional fluid dynamic model for the suppressor. The foundational framework of the fluid dynamic model is based on the equations governing fluid motion with a one-dimensional approach. To accurately depict the fluid dynamics within the suppressor, a unique approach for determining the speed of sound was incorporated, and it implemented the instantaneous cross-sectional area and the inertial effect of the bladder. This paper is a development of a previous work to also investigate the positioning along the delivery pipe of the suppressor with respect to the pump. The study presents the performance of the suppressor and points out the effects of its relative position with respect to the pump that becomes particularly relevant at high speeds.

1. Introduction

Positive displacement pumps, due to their intrinsic way of functioning, exhibit fluctuations in their flow rate resulting in undesirable pressure oscillations and noise. Consequently, the mitigation of pressure ripples can only be achieved by diminishing the flow irregularity in the delivery line. Extensive literature offers a plethora of remedies to counteract the flow and pressure fluctuations induced by positive displacement pumps. A substantial portion of these remedies revolves around optimising the pump’s geometry. In the context of axial piston pumps, considerable interest has been devoted to design port plates for a smoother transition between the suction and delivery phases, as well as vice versa [1,2]. As for gear pumps, a widely used type of pump, engineers have ingeniously incorporated specialised grooves into the side bushings to enhance the machine performance in this regard [3,4]. This research is concentrated on external devices that can be strategically positioned in the pump delivery volume or the connected pipeline. These solutions can be broadly categorised into two groups: active and passive systems. Active techniques require the utilisation of controlled and externally powered devices. A noteworthy approach, as elucidated in work [5], entails the high-frequency modulation of the oscillating plate angle within an axial piston pump via a switching valve to improve the flow characteristics. Additionally, various researchers are endeavouring to implement piezo-stack actuators to control pistons, effectively counteracting flow irregularities by generating an out-of-phase flow signal [6,7,8]. Active techniques offer the advantage of obtaining effective results not dependent on the pressure and frequency parameters under various working conditions, but it is important to note that these methods often entail complexities and substantial costs. Passive techniques stand out for their simplicity, as they come with lower costs compared to their active counterparts and require no external control or power sources. These passive approaches exploit elastic components that interact with the flow to mitigate ripple effects. However, the effectiveness of these systems can be optimised only in a specific range of working conditions, outside of them, their efficacy diminishes. An exemplary case illustrating this limitation is presented in Shang’s research [9] where a spring accumulator is employed to attenuate the primary harmonic flow ripple produced by an axial piston pump. This mechanism exploits the pressure ripple characteristics of suction and discharge to enhance performance. Alternatively, ref. [10] introduces a different approach that optimises the length and stiffness of pipes within a hydraulic circuit to achieve ripple reduction. The present paper delves into the potential of gas bladder suppressors as passive devices for mitigating flow and pressure ripples. The practice of incorporating gas-charged bladder accumulators into hydraulic systems to relieve fluid-borne noise enjoys widespread acceptance [11,12,13,14]. By serving as a low-pass filter within a fluid-filled line, an accumulator can offset both negative and positive flow peaks by accumulating or supplying excess or deficient fluid, respectively. In greater detail, this paper focuses on a specific variant of a gas accumulator, namely the in-line bladder noise suppressor. Extensive studies have scrutinised this device, encompassing modelling approaches for predicting its performance. Earlier works [12,15] have proposed and validated various linear multimodal models through experimental procedures. Furthermore, another study [16,17] has introduced a methodology grounded in acoustic finite element analysis and plane wave theory, with results cross-referenced against experimental data. Finally, from the literature cited, emerges, on the one hand, limited research activity on bladder-style suppressors, and, on the other hand, many papers address the study developing a linear model with a transfer function. The study presented in this paper is a development of the model already presented in [18], and it is based on the simulation of both the suppressor and the line where the suppressor is installed.
Unlike previous models that focused only on the hydraulic suppressor neglecting the effect of the pipe between the pump and the suppressor, this model is able to assess how the positioning of the suppressor with respect to the pump influences its performance. A relevant parameter affecting the suppressor performance and its positioning is the pump speed; this parameter has gained significance in light of the recent electrification trend towards electro-hydraulic actuators that can avoid throttling losses and enable four-quadrant operation [19]. Solutions with fixed displacement pumps, like external gear pumps, are becoming more relevant [20]; in these solutions, the pump speed varies over a wide range, reaching also high values. This paper presents the relevance of the pressure ripple amplitude upstream of the damper that in some cases can become more relevant with respect to the case without a suppressor; this aspect, normally neglected, should be considered in any application. The first part of this paper concerns the model description and its validation, while the second part analyses the importance of a correct installation of the suppressor at the pump outlet.

2. In-Line Bladder Suppressor Description and Experimental Activity

The suppressor employed in this study is a model from Wilkes and McLean’s renowned 5000 series. A simplified representation of the suppressor configuration is depicted in Figure 1. In this setup, nitrogen gas is strategically positioned in a circumferential arrangement, effectively separated from the liquid by a resilient rubber membrane.
In scenarios where the gas precharge pressure surpasses that of the liquid, particularly during periods when the suppressor is idle, a perforated pipe assumes the crucial role of supporting the bladder. This perforated pipe must be designed to limit the influence on the exchange of fluid mass between the internal pipe and the bladder. In Figure 1, the distance L is in evidence as being the distance between the pump and the suppressor investigated in the following sections.
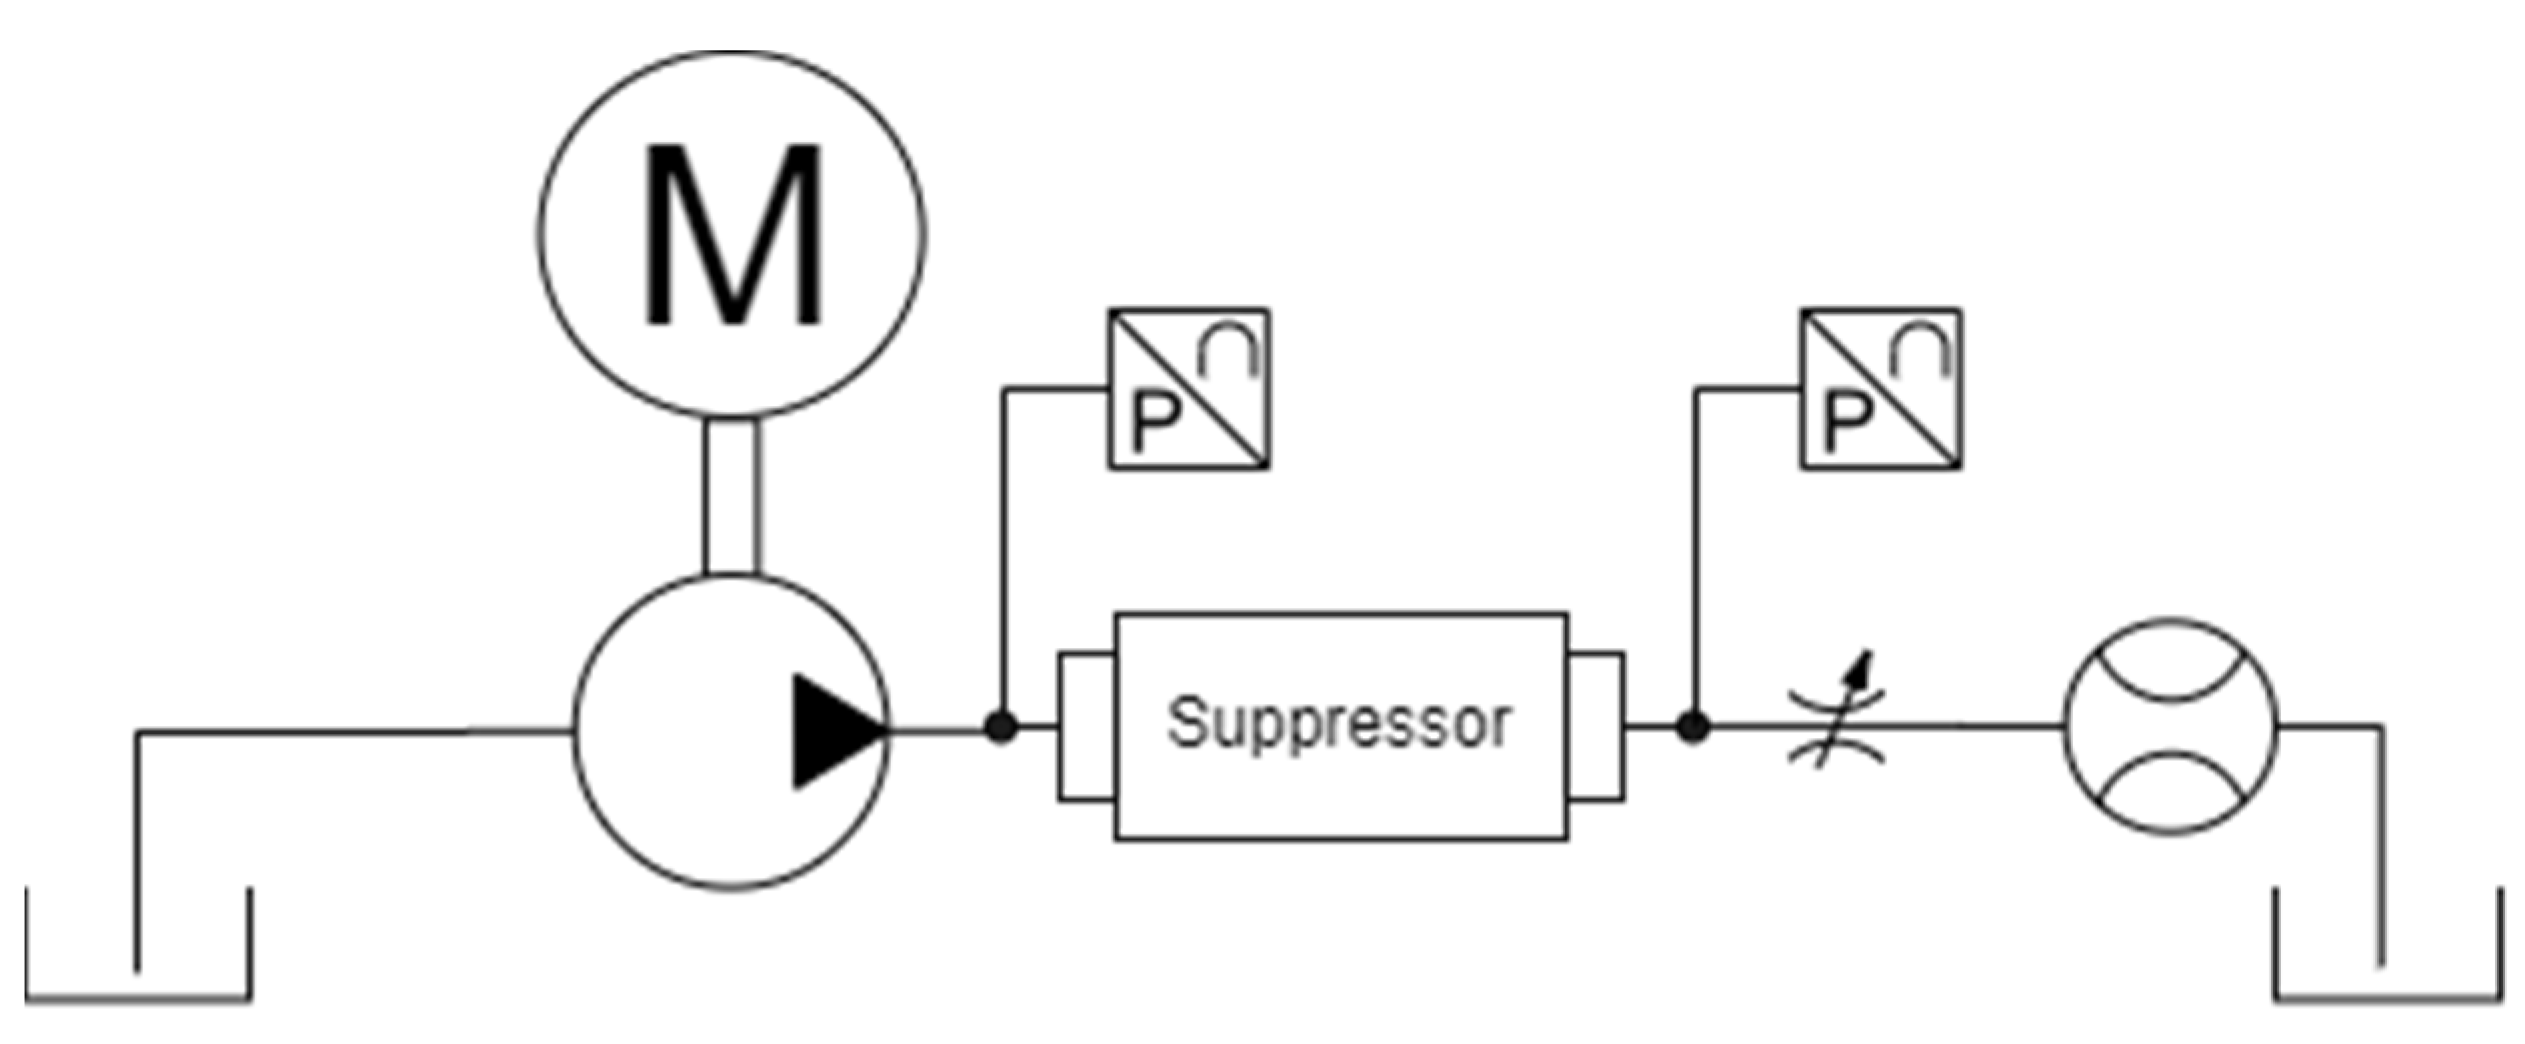
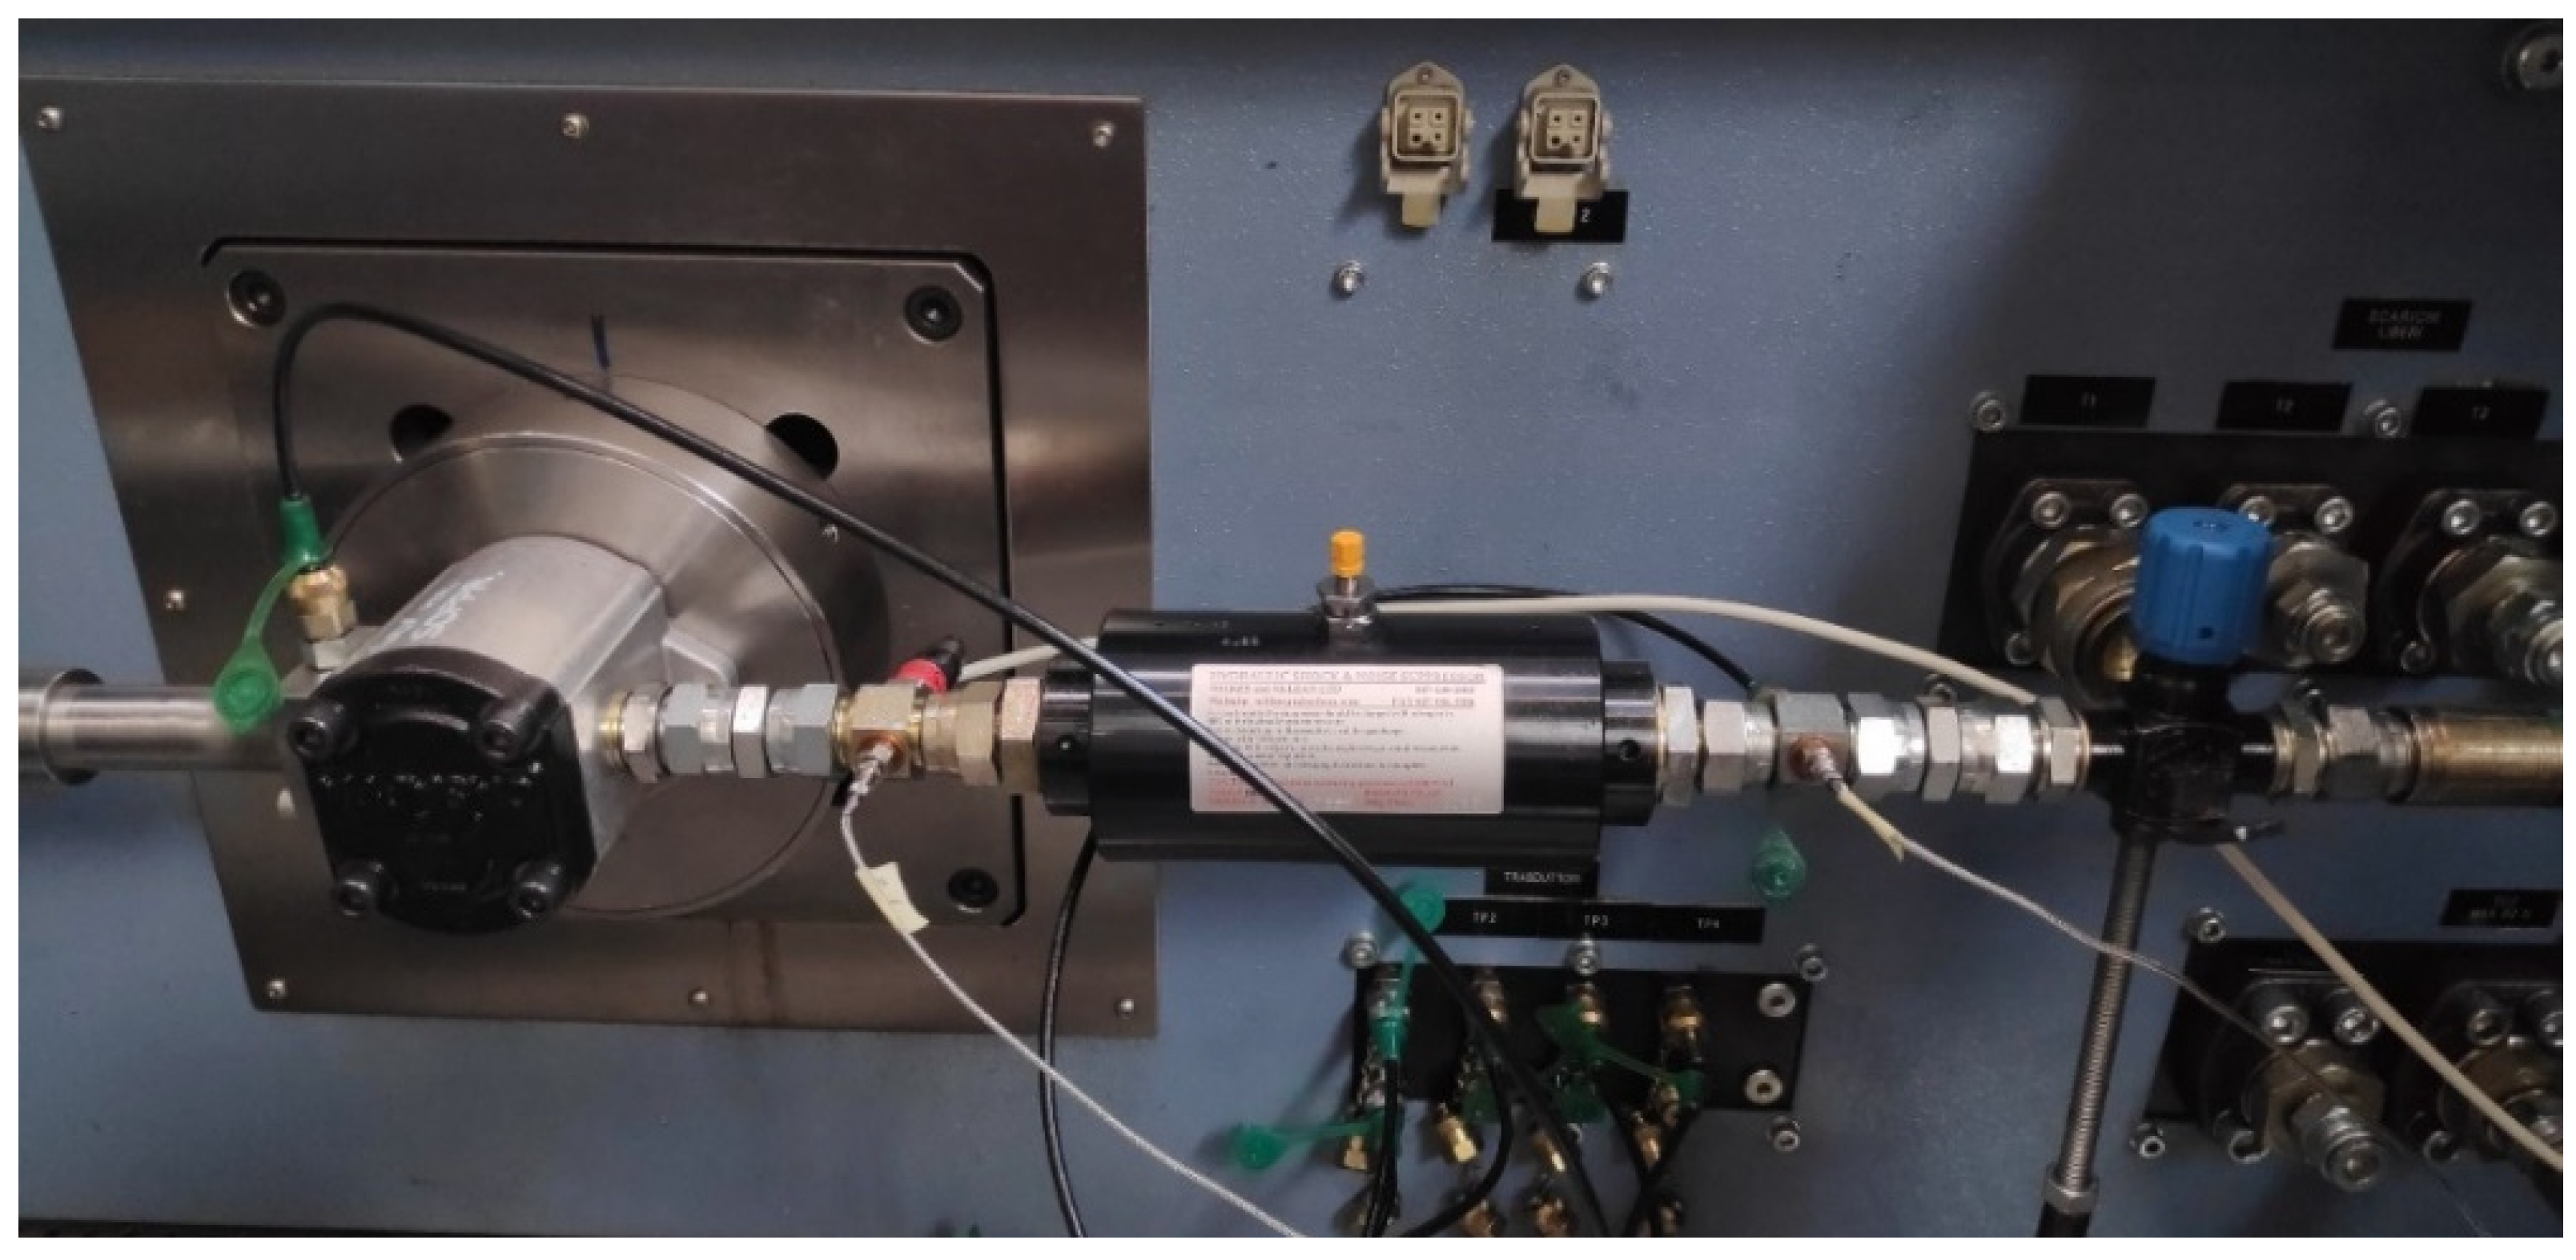
An extensive experimental investigation was conducted at the testing facility of the University of Parma to analyse the performance of the suppressor. The suppressor was installed on the delivery side of an external gear pump powered by a variable speed electric motor, as illustrated in Figure 2. To precisely assess the suppressor impact, a variable orifice was strategically positioned on the outlet side to regulate the delivery pressure. The data collection process involved the installation of two high-frequency piezo-electric pressure transducers, placed upstream and downstream of the suppressor (Kistler 6005, 0–1000 bar, bandwidth 140 kHz), as visible in Figure 3. Throughout the experimental campaign, the suppressor underwent testing under diverse pump operating conditions, encompassing variations in rotation speed and delivery pressure, as outlined in Table 1. In order to explore the influence of gas precharge pressure on the suppressor performance, a series of tests were executed with gas pressure values of 150 and 100 bar. It is important to note that the oil temperature was maintained constant at 50 °C throughout the tests, thanks to the facilities (heater and cooler) installed in the test bench. Although the temperature of the suppressor gas was not directly measured, it was assumed to equate the oil temperature. The utilisation of high-frequency piezo-electric pressure transducers enabled data sampling at a rapid rate of 20 kHz. To extract valuable insights from the collected measurements, a fast fourier transform (FFT) analysis was applied.

3. Mathematical Model

3.1. Mono-Dimensional Fluid Dynamic Model

The mathematical model implements the momentum equation and the mass conservation equation.
The momentum equation for a horizontal pipe, x, takes the following form:
p x 1 ρ + u u x + u t + λ = 0
where u and p are the fluid velocity and pressure, respectively. While the mass conservation equation is:
u x + 1 A D A D t + 1 ρ D ρ D t = 0
In Equation (2), the term pertinent to the variable section area A was not neglected for the reasons explained below. In order to highlight the pressure variable, the state equation of the fluid is introduced:
1 ρ   D ρ D t = 1 K D p D t
Then, the conservation equation is:
u x + 1 A D A D t + 1 K D p D t = 0
The second term could be written as:
D A D t = d A d p D p D t
Substituting:
u x + 1 A d A d p D p D t + 1 K D p D t = 0
u x + 1 K D p D t ( 1 + d A A K d p ) = 0
This equation can be written to emphasise the speed of sound:
a 2 = K / ρ 1 + K A d A d p
K ρ 1 a 2 = 1 + K A d A d p
The final form of Equation (7) is:
u x + 1 ρ D p D t 1 a 2 = 0
Exploiting the total derivative:
ρ a 2 u x + u p x + p t = 0
In Equation (11), the speed of sound, a, was computed as reported in Equations (17) and (18). The effective bulk modulus is:
1 K e f = 1 K l i q + 1 K c
The pipe container elasticity depends on the presence or lack thereof of the bladder, this model being implemented to simulate both the suppressor and the pipe at its inlet and outlet. Therefore, the mathematical model is focused on modelling the fluid transient motion in a pipe that can be identified in three parts:
  • a pipe segment between the pump and the suppressor;
  • a pipe segment that is the suppressor;
  • a pipe segment between the suppressor and the user.
For the segments where the suppressor is not present, Equation (12) can be simplified focusing only on the bulk modulus of the fluid:
1 K e f = 1 K l i q
When considering the fluid inside the suppressor, the pipe container becomes the bladder that separates the liquid from the gas and its effect depends on the gas pressure value. Assuming a polytropic transformation of the gas:
p V γ = c o s t .
differentiating Equation (14), the compressibility effects can be derived:
d p d V V = γ p
and:
K c = γ p
Because the gas transformations occur very fast, they can be assumed to be adiabatic; therefore, the coefficient γ was assumed to be equal to 1.65 (nitrogen). In this case, the value of Kef is strongly affected by the term Kc and Equation (12) must be adopted. The effective bulk modulus affects the speed of sound, as introduced in Equation (8). Two conditions must be considered, the first one being inside the suppressor following Equation (8):
a 2 = K e f / ρ 1 + K e f A d A d p
While in the pipe segment at the inlet and outlet of the suppressor, the speed of sound is calculated with:
a 2 = K l i q / ρ
Although the model incorporating the elasticity of the fluid container inside the suppressor as a function of gas pressure can yield valuable insights into pressure attenuation, it is not adequate enough to capture the architecture of the suppressor and the fluid dynamics within it. Within the suppressor itself, the liquid undergoes radial motion as it transitions from the pipe to the bladder, a phenomenon that requires the complexity of a two-dimensional model for accurate representation. The primary objective of this research endeavour is to develop a model capable of comprehensively accounting for the main geometric suppressor features avoiding the need of a two-dimensional computational fluid dynamics (CFD) approach; moreover, the target of this paper is to define the effects of the positioning of the suppressor along the delivery pipe. For this analysis, a CFD approach focusing on internal details of the suppressor is not the suitable solution. In the context of fluid flow within the pipe, the dominant velocity component is axial. As elucidated earlier, the pipe is endowed with a perforated wall that establishes a connection between the fluid within the pipe and the bladder, as depicted in Figure 1. At a time when oil pressure is higher than gas pressure, the oil flows through these openings, exerting force on the bladder. This process leads to a reduction in gas volume and a corresponding increase in gas pressure. Conversely, when the instantaneous liquid pressure falls below the instantaneous gas pressure, the reverse sequence occurs. To reproduce the operational dynamics of the suppressor, the authors introduced an innovative application of a one-dimensional fluid dynamics model [18]. This one-dimensional modelling approach focuses on assessing the temporal and spatial evolution of liquid pressure within the pipe, while treating gas pressure as a solely time-dependent variable. Consequently, gas pressure is presumed to remain uniform within the chamber, with its fluctuations dictated solely by time. A further hypothesis is that the bladder was assumed not to be deformed during the functioning, but only moved. This hypothesis implies that the bladder does not interact with the fluid. Upon analysing the disassembled suppressor, it was observed that the bladder is quite thin and should be installed to limit its deformation also to increase its durability over time.
Imagine the entry of a liquid particle into the suppressor characterised by its axial trajectory. For the sake of clarity, let us consider an instance when the liquid pressure exceeds the gas pressure. At this juncture, the oil also exhibits radial movement, traversing the perforations in the wall. This phenomenon can be effectively modelled within a one-dimensional framework by recognising that the section available for fluid passage, along the axis, is not static but varies with time. Essentially, the sectional area created by the bladder movements acts as an incremental addition to the pipe’s cross-sectional area. Conversely, the scenario reverses when the oil pressure is lower than the gas pressure.
In this paper, the calculation of the term dA/dt differs from the approach followed in the previous work [18]. In the first version, the term dA/dt was calculated starting from the computed volumetric flow rate through the wall holes and, with a strong assumption that the fluid velocity through the wall holes is equal to the axial fluid velocity at the previous time step, a passage area could be determined, defining the term dA/dt. In this work, to model the term dA/dt, a correlation was assumed between the bladder movement and the section area. In other words, assuming, for example, a liquid pressure increment, the bladder moves in order to compress the gas, and this movement thereby enlarges the cross-sectional area available for the main fluid. Therefore, the incremental volume available for the liquid was computed as an incremental sectional area, being the length constant. In this way, the calculated term dA/dt is strictly correlated with the term dVg/dt, where the latter depends on the initial volume and on the precharge pressure. The instantaneous gas volume could be easily calculated by means of the polytropic equation:
V g n = V 0 g   ( p 0 g p g n ) 1 / γ
Following the numerical approach, the term dVg/dt is:
( d V g d t ) n = V g n V g n 1 d t
Finally, the term dA/dt:
( d A d t ) n = ( d V g d t ) n L b
This approach neglects the effect of the edges; i.e., the radius increases uniformly along the suppressor. This approximation is acceptable with the ratio between the length and diameter about equal to 3. It is relevant to point out that the calculation was carried out for each spatial grid, and Lb is the length of the bladder with reference to the spatial grid adopted.
A drawback compared to the previous version is that this model is no longer sensitive to the size of the pipe holes (see the dashed line in Figure 1), but these effects could be investigated in a rigorous manner only by means of a CFD analysis. On the other hand, the advantage is that the sectional area available for the fluid was calculated in a manner closer to reality and with a more stable numerical analysis.
The model permits the computation of the effects of the bladder mass, even though the bladder mass of the suppressor is very small. The computation of this aspect is as follows: the change in gas volume and of the liquid sectional area is associated with a movement of the bladder; moreover, the bladder is subject to inertial effects that can be correlated with an inertial pressure differential term, assuming Ω as the surface of the bladder:
Δ p i n n = m n   a ¯ n Ω
The bladder acceleration is computed starting from the term dA/dt analysing the change in the radius R of the sectional area that coincides with the radius of the membrane:
d R d t = d A d t 1 2   π   R c
where R is the instantaneous radius of the bladder and Rc is the initial value.
Therefore, the term bladder mass acceleration can be computed as:
a ¯ n = ( d R n d t ) ( d R n 1 d t ) d t
The superscript n is referred to as the temporal step.
The differential pressure Δ p i n n is used to correct the instantaneous pressure of the gas that is not assumed to be equal to the instantaneous liquid pressure but computed as:
( p g n ) = ( p l * n ) ± Δ p i n n
The instantaneous pressure of the gas is used to compute the instantaneous gas volume, Equation (23), and as reported above the term dA/dt.

3.2. Frequency-Dependent Friction Losses

Equation (1) compares the friction loss term λ that was computed as frequency-dependent friction losses using the Brunone model [21]:
λ ( a ) = λ S t e a d y + λ U n s t e a d y = λ S t e a d y + k D u | u | ( u t a u x )
The friction loss term depends on many variables, such as the local speed of sound, a, considering the particular pipe segment studied; the velocity gradient (local inertia) ∂u/∂t, and the convective term ∂u/∂x, while k (Brunone coefficient) is calculated by means of the Vardy coefficient (C*) as shown:
k = C * 2
where for laminar flow it becomes a constant value C* = 0.00476, while for turbulent flow:
C * = 7.41 R e log (   14.3 / R e 0.05 )

3.3. Numerical Scheme

An explicit first-order numerical scheme, known as flux vector splitting [22], was implemented to numerically integrate the equations. The explicit method involved is conditionally stable, so that the Courant number, C, should be <1, but close to 1:
C = ( a ± u ) Δ t Δ x
The Courant number condition depends on the variations in the speed of sound that is affected by the variations in both the pipe container elasticity and the term dA/dp, as reported in Equation (8); however, the latter is less relevant for this scope.
The strong difference in the speed of sound between the pipe segments with or without the suppressor generates different values of the Courant number when the spatial and temporal grid are defined. The procedure adopted was to set the spatial grid and, on the basis of both the Courant number and the speed of sound, calculate the temporal grid.
The temporal grid was calculated by adopting the highest speed of sound that occurs in the pipe segments before and after the suppressor, obtaining the lowest temporal grid. In this way, the temporal grid results are smaller inside the suppressor compared to the Courant condition requirements in the damper. Then, the simulation of the flow inside the suppressor was carried out with a lower Courant number of about 0.25. Given that the numerical procedure adopted an explicit method, the low Courant number introduces numerical diffusion [22]. This aspect was investigated simulating only a single pipe segment with the suppressor and with Courant number equal to either 0.95 or 0.25. As expected, the numerical diffusion introduces a little damping and the reduction in the first harmonic amplitude spans from 1% to 5% and from 0% to 9% for the second harmonic as the pump speed changes from 500 to 6000 r/min. When simulating all the pipe segments, these differences are nonetheless mitigated by the presence of the segment without a suppressor with a Courant number equal to 0.95.
A possible solution is to introduce a complex numerical algorithm with a different temporal grid between the pipe segments, but this also involves the definition of the boundary condition averaged between the pipe segments. Focusing on the target of this research, it could be assumed that the occurrence of a known slight numerical diffusion does not affect the conclusions reported in this paper.
The numerical scheme that was effectively implemented inside the pipes without suppressor is:
u i n + 1 = u i n Δ t p 2 Δ x ( u i n + a p ) ( u i n u i 1 n + p i n p i 1 n ρ a p ) Δ t p 2 Δ x ( u i n a p ) ( u i + 1 n u i n + p i n p i + 1 n ρ a p ) Δ t p λ ( a p ) i n
p i n + 1 = p i n Δ t p 2 Δ x ( u i n + a p ) [ p i n p i 1 n + ρ a p ( u i n u i 1 n ) ] Δ t p ( u i n a p ) [ p i + 1 n p i n + ρ a p ( u i n u i + 1 n ) ]
Inside the suppressor, the equation presents few changes due to the sound speed, while the temporal and spatial grids remain the same:
u i n + 1 = u i n Δ t p 2 Δ x ( u i n + a s ) ( u i n u i 1 n + p i n p i 1 n ρ a p ) Δ t p 2 Δ x ( u i n a s ) ( u i + 1 n u i n + p i n p i + 1 n ρ a s ) Δ t λ ( a s ) i n
p i n + 1 = p i n Δ t p 2 Δ x ( u i n + a s ) [ p i n p i 1 n + ρ a s ( u i n u i 1 n ) ] Δ t p 2 Δ x ( u i n a s ) [ p i + 1 n p i n + ρ a s ( u i n u i + 1 n ) ]
In Equations (30)–(33), the superscript n is referred to as the temporal step, while the subscript i is referred to as the spatial step; subscript p refers to the pipe without suppressor and s refers to the suppressor. It is important to point out that, to avoid numerical instability, the change in the sound speed entering and exiting the suppressor was made gradually. In a few spatial grids at the inlet and outlet of the suppressor, the above equations were integrated with a variable sound speed that changes linearly between ap and as at the damper inlet and between as and ap at the damper outlet.

4. Model Validation

The reported experimental data were divided by a proper coefficient for confidential reasons.
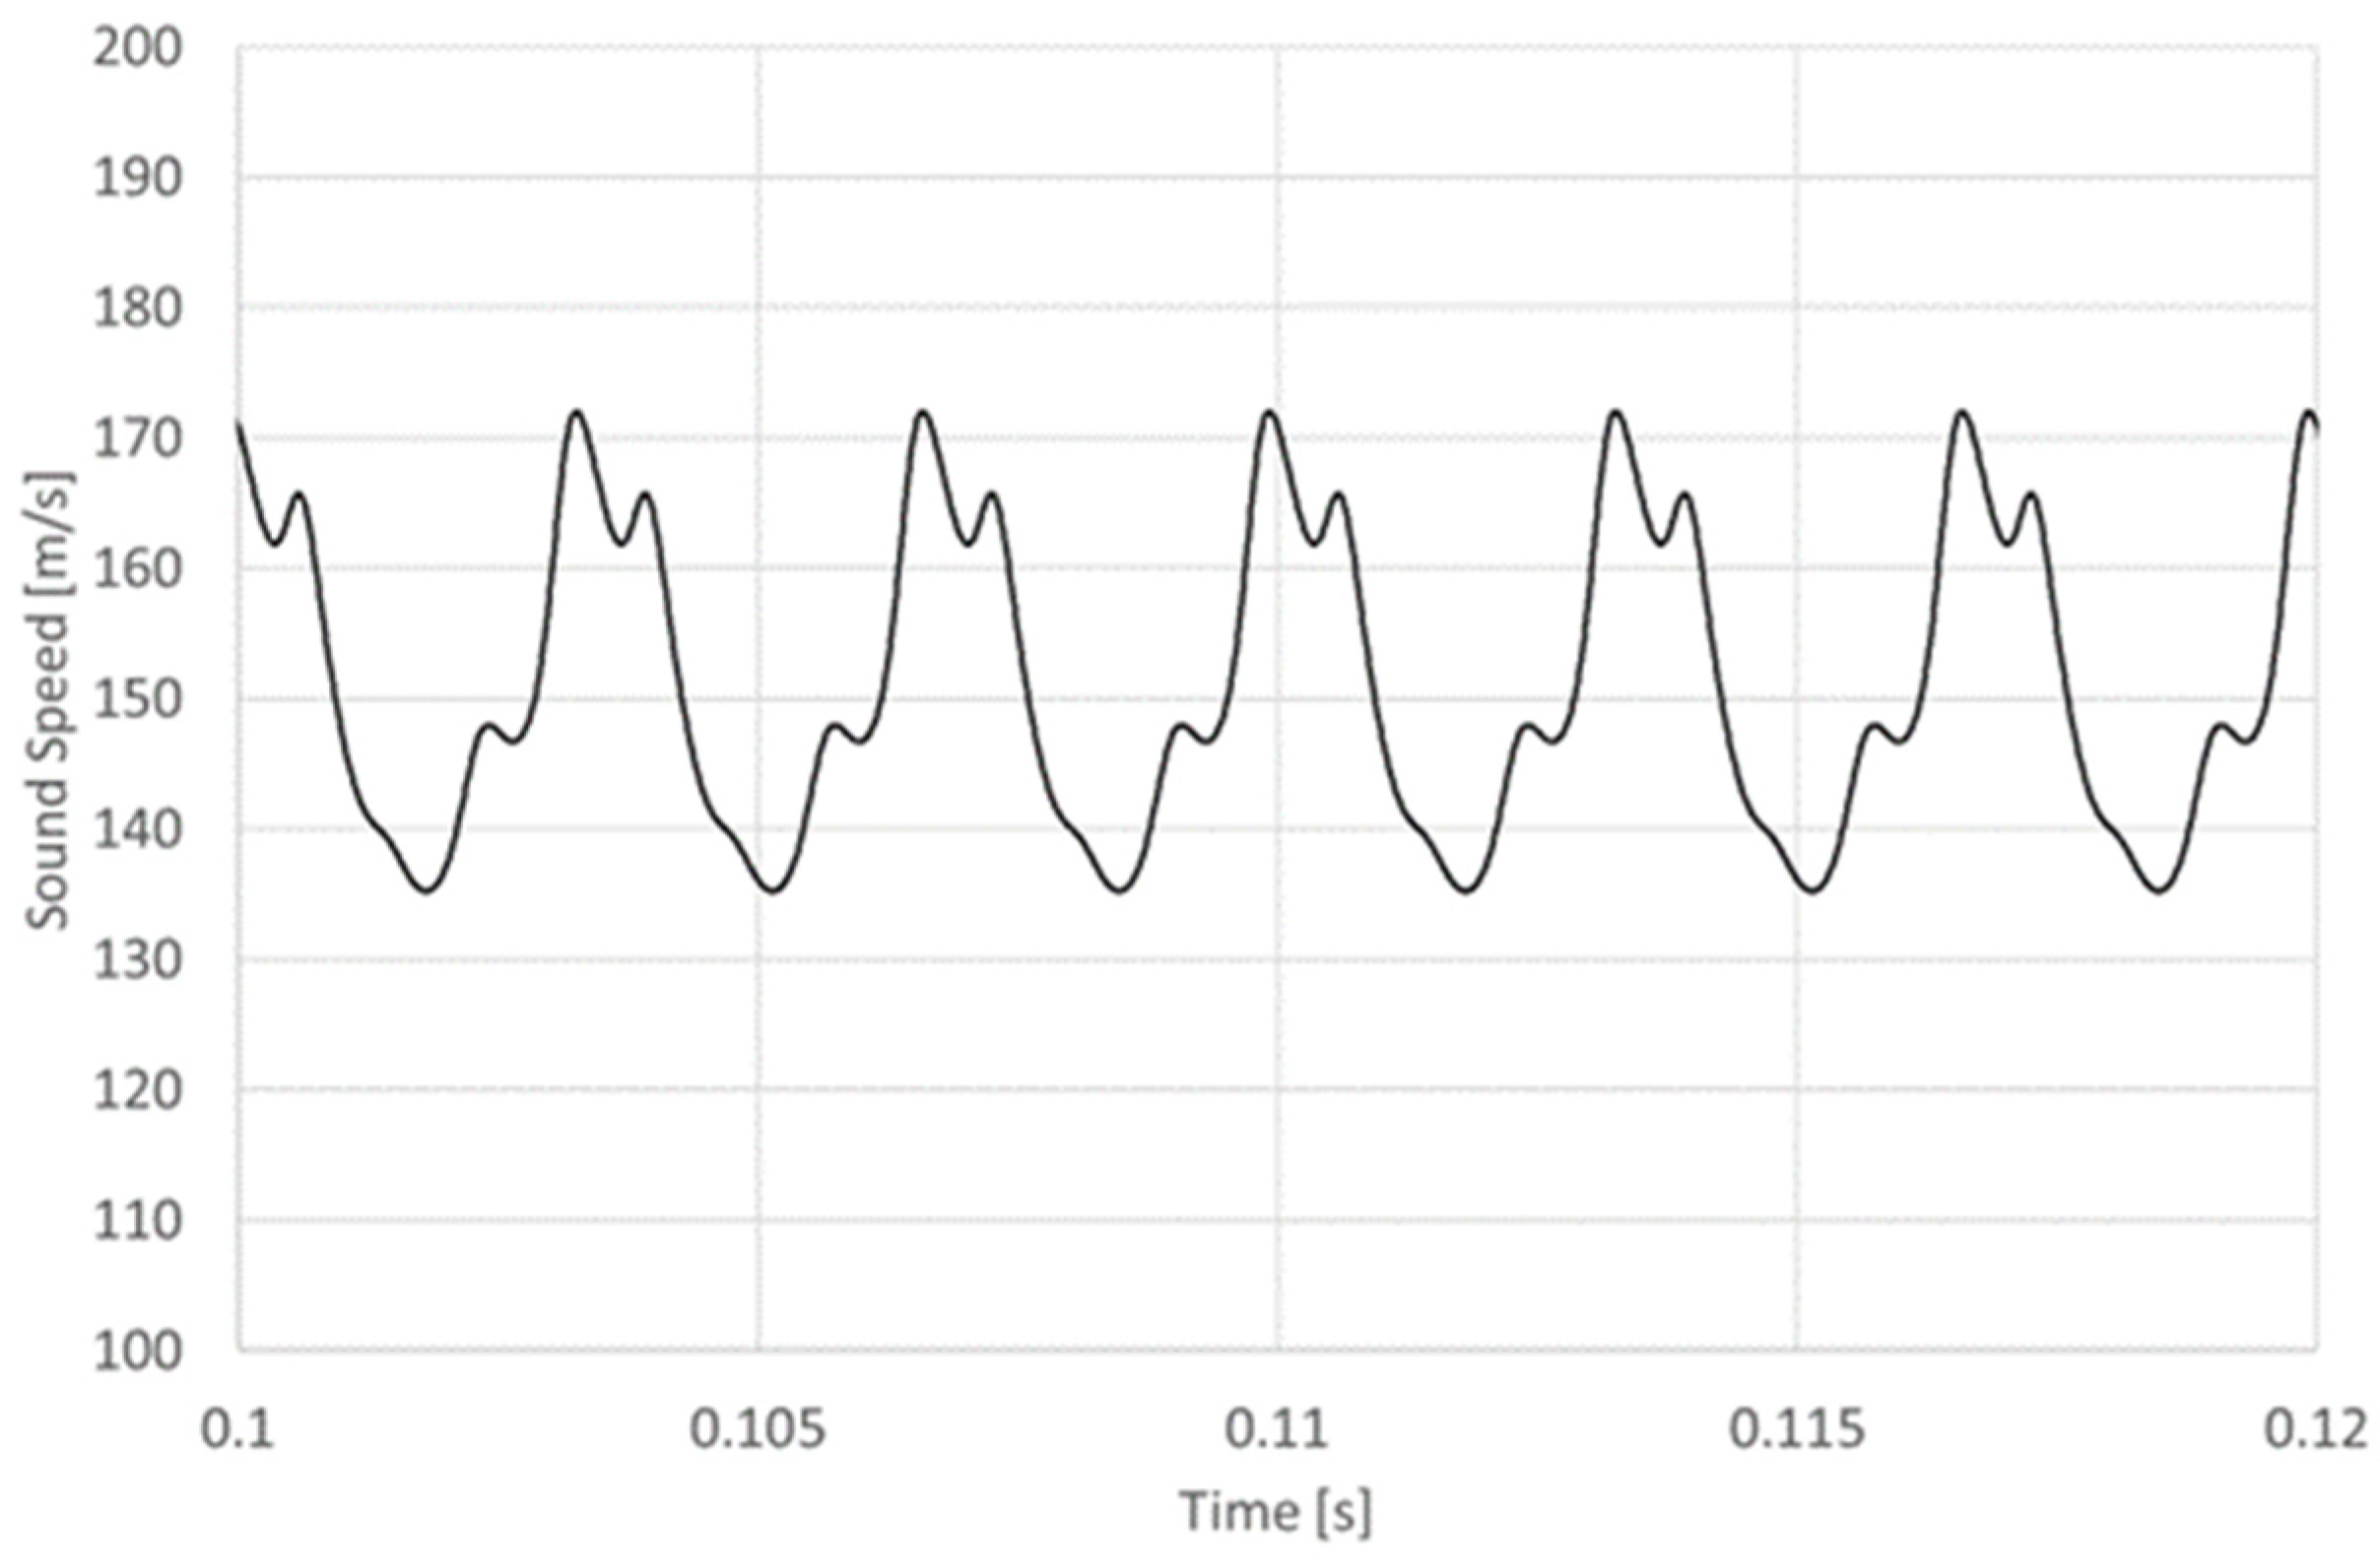
The model required to set the boundary condition at the inlet in terms of fluid velocity profile. These profiles were computed using a pump model, which, for the sake of brevity, is not expounded in this paper [5]. The sound speed in the pipe segments upstream and downstream of the suppressor is about 1300 m/s depending on the instantaneous pressure. Thanks to the implemented equations, this model reproduces the pressure damping as a consequence of a strong reduction in the sound speed due to the change in the effective bulk modulus caused by the presence of the bladder acting against the pressurised gas. For the cases considered, the effective sound speed drops to about 150 m/s. The course of sound speed vs. time, Figure 4, presents oscillations that are mainly caused by the instantaneous pressure on the term dA/dp, Equation (17).
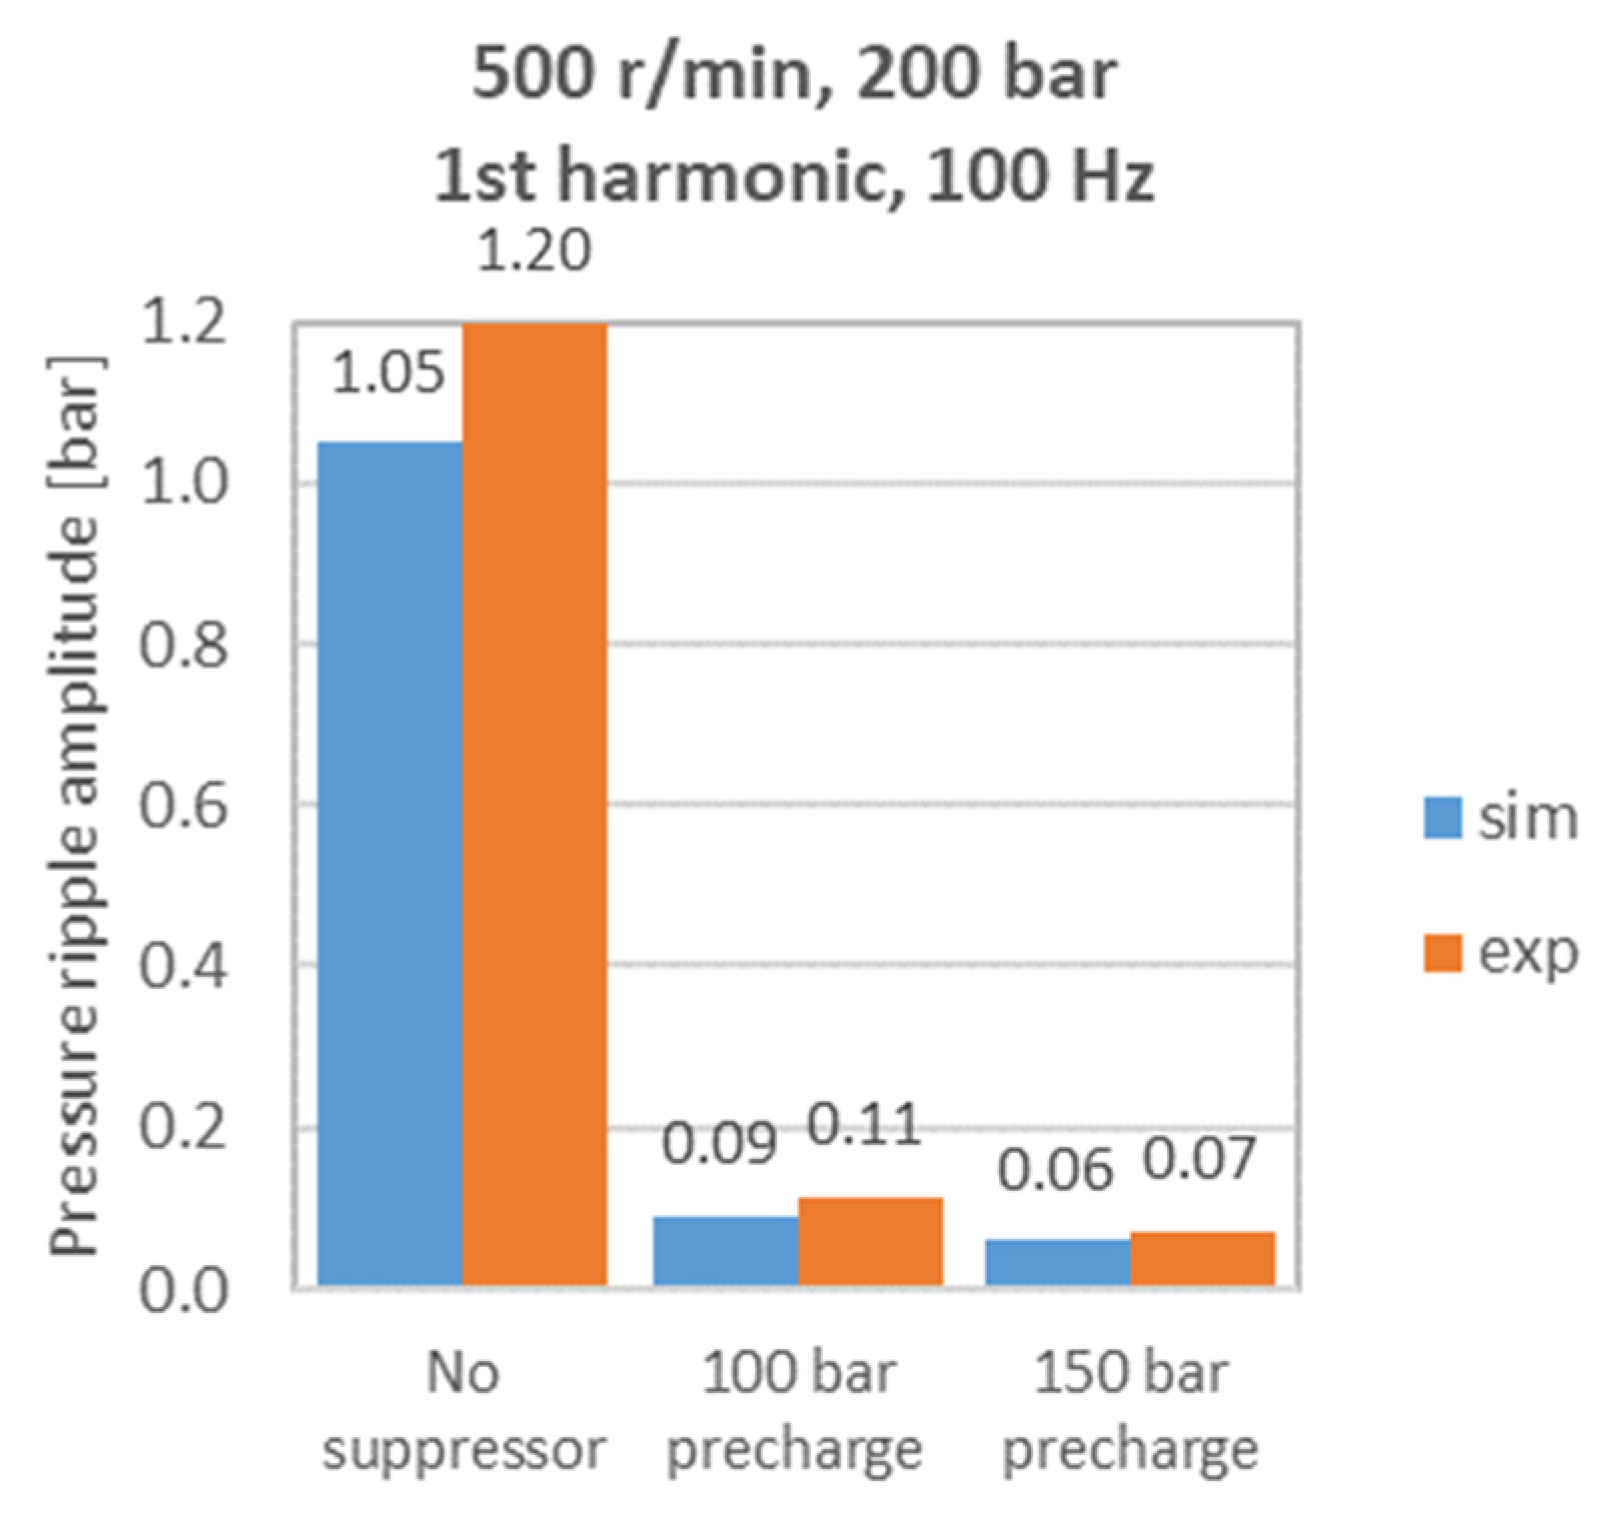
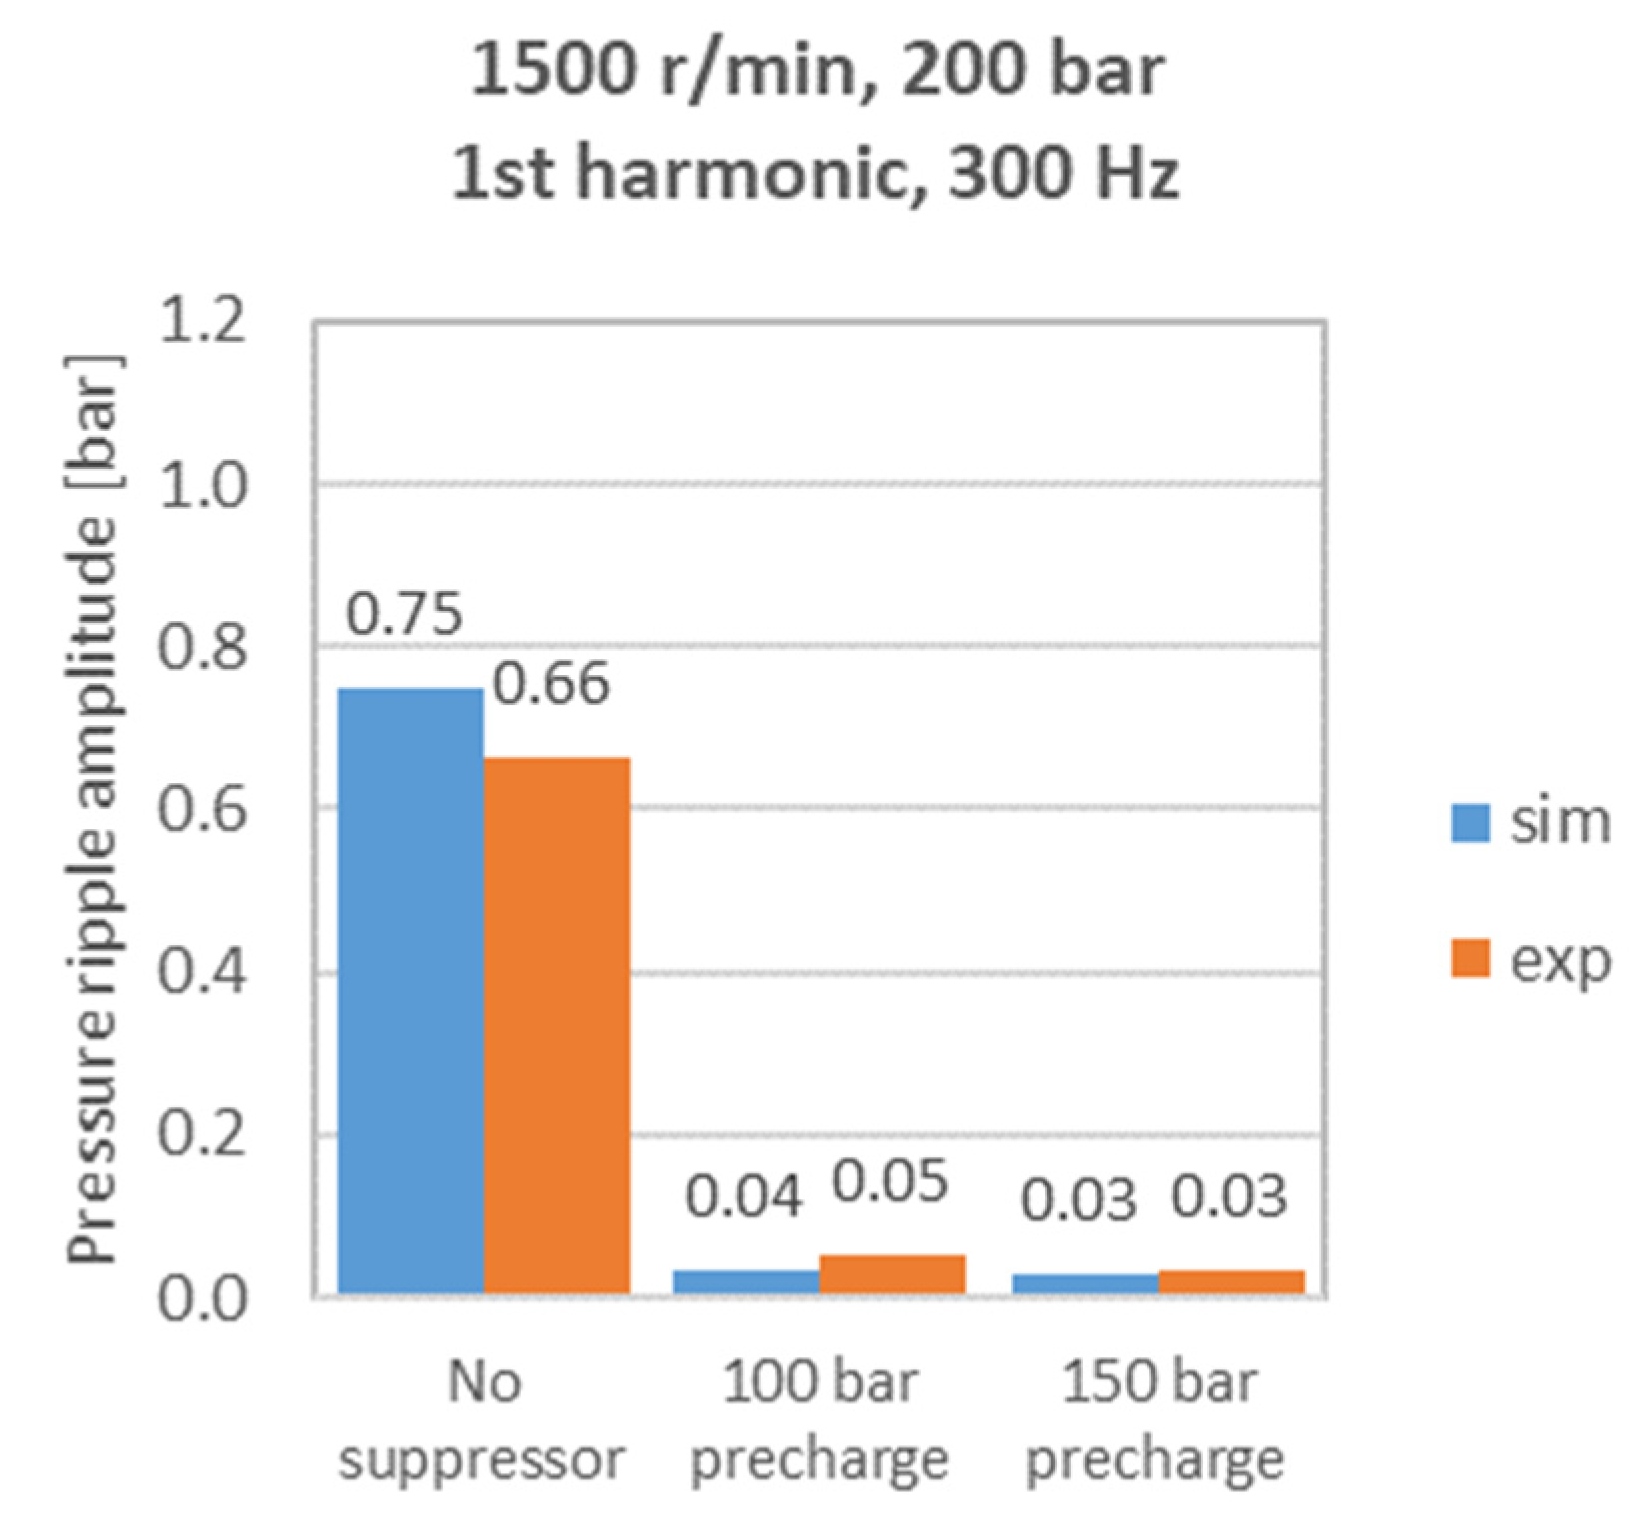
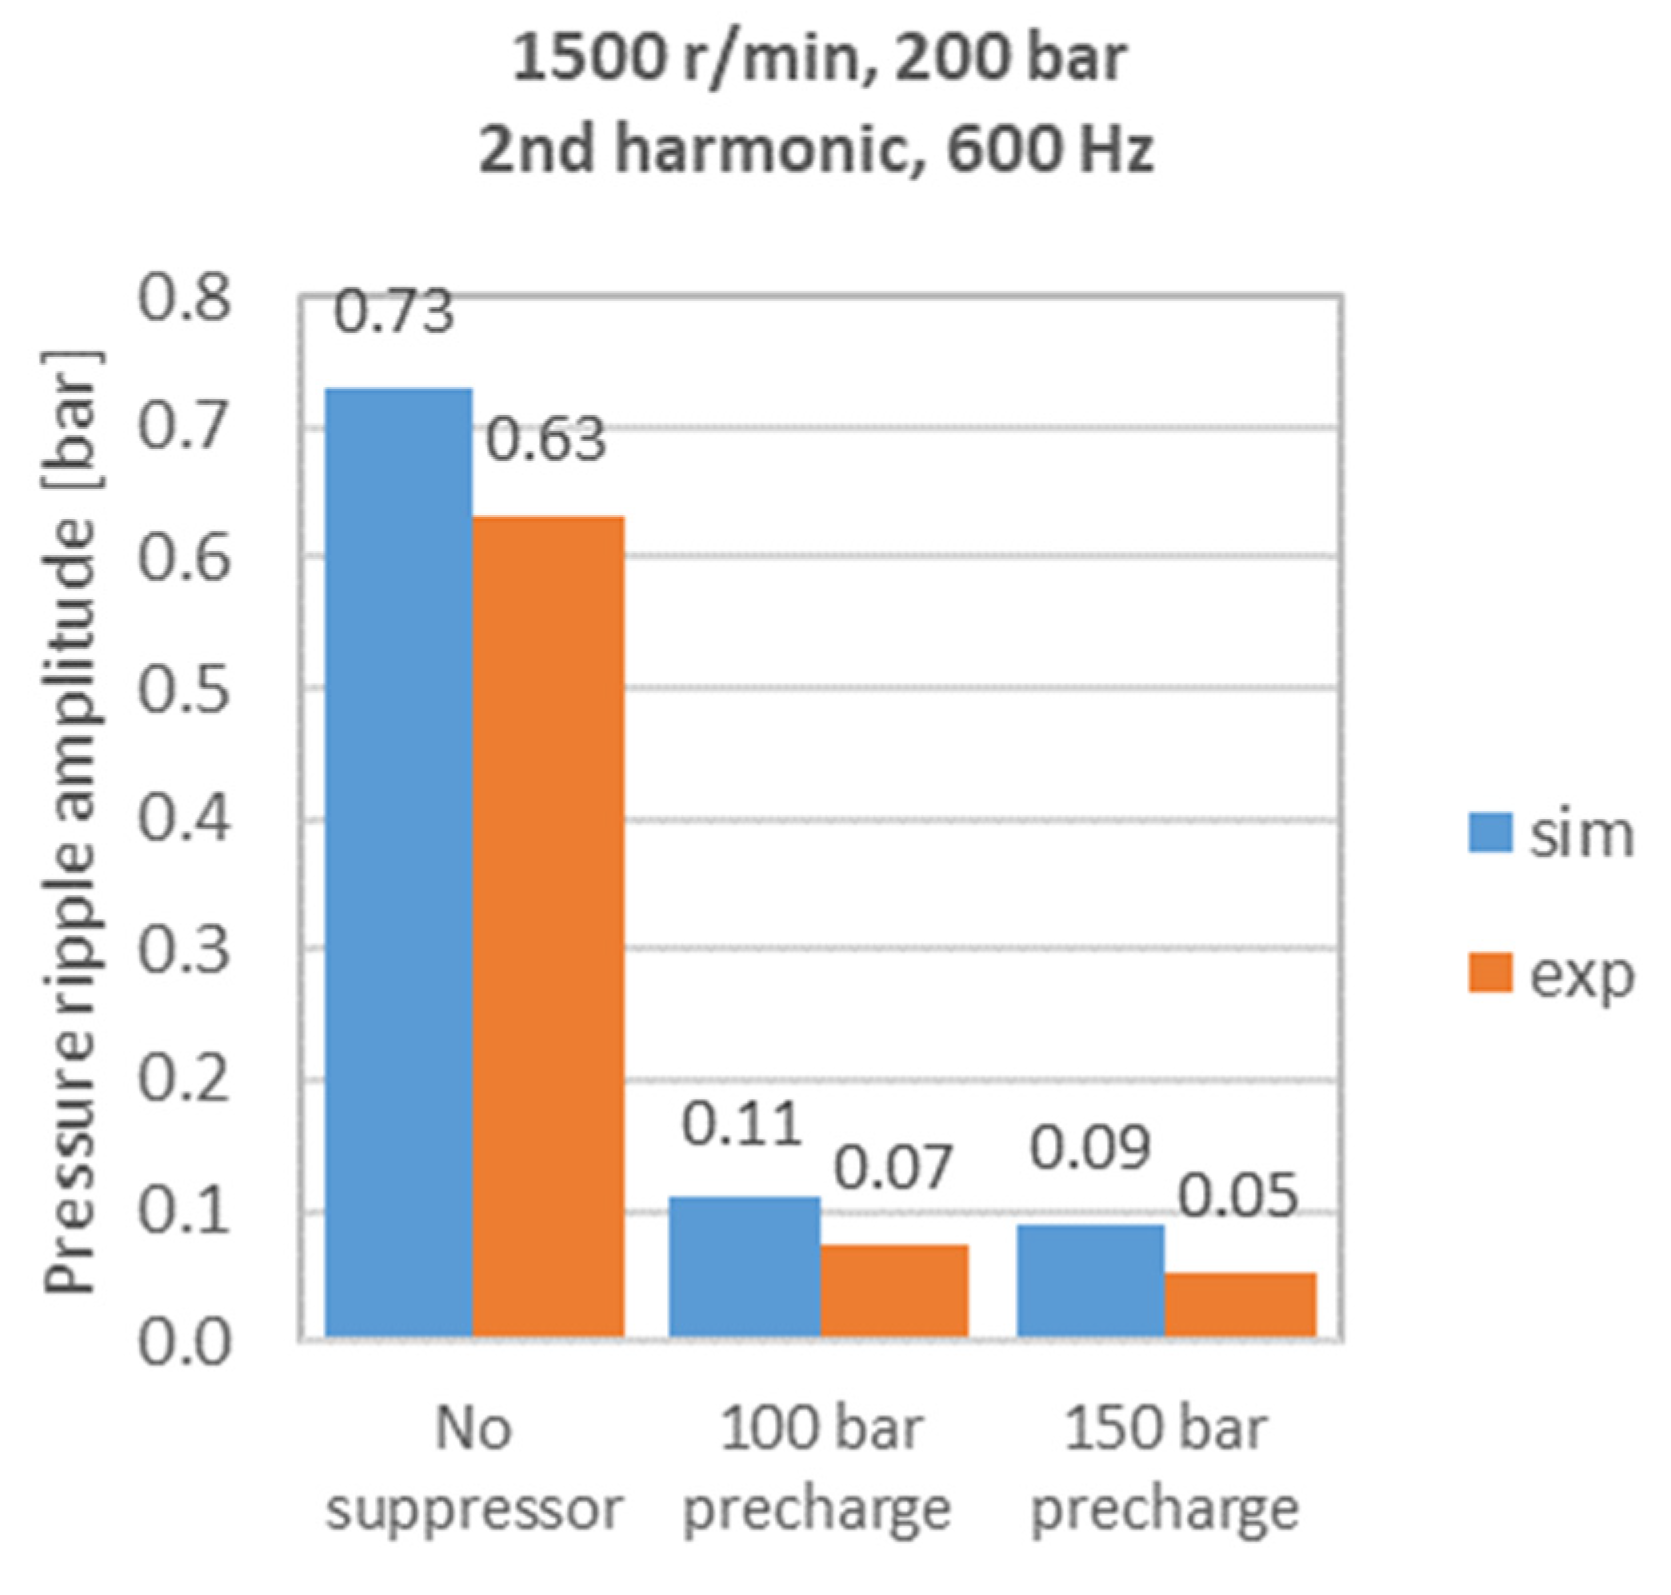
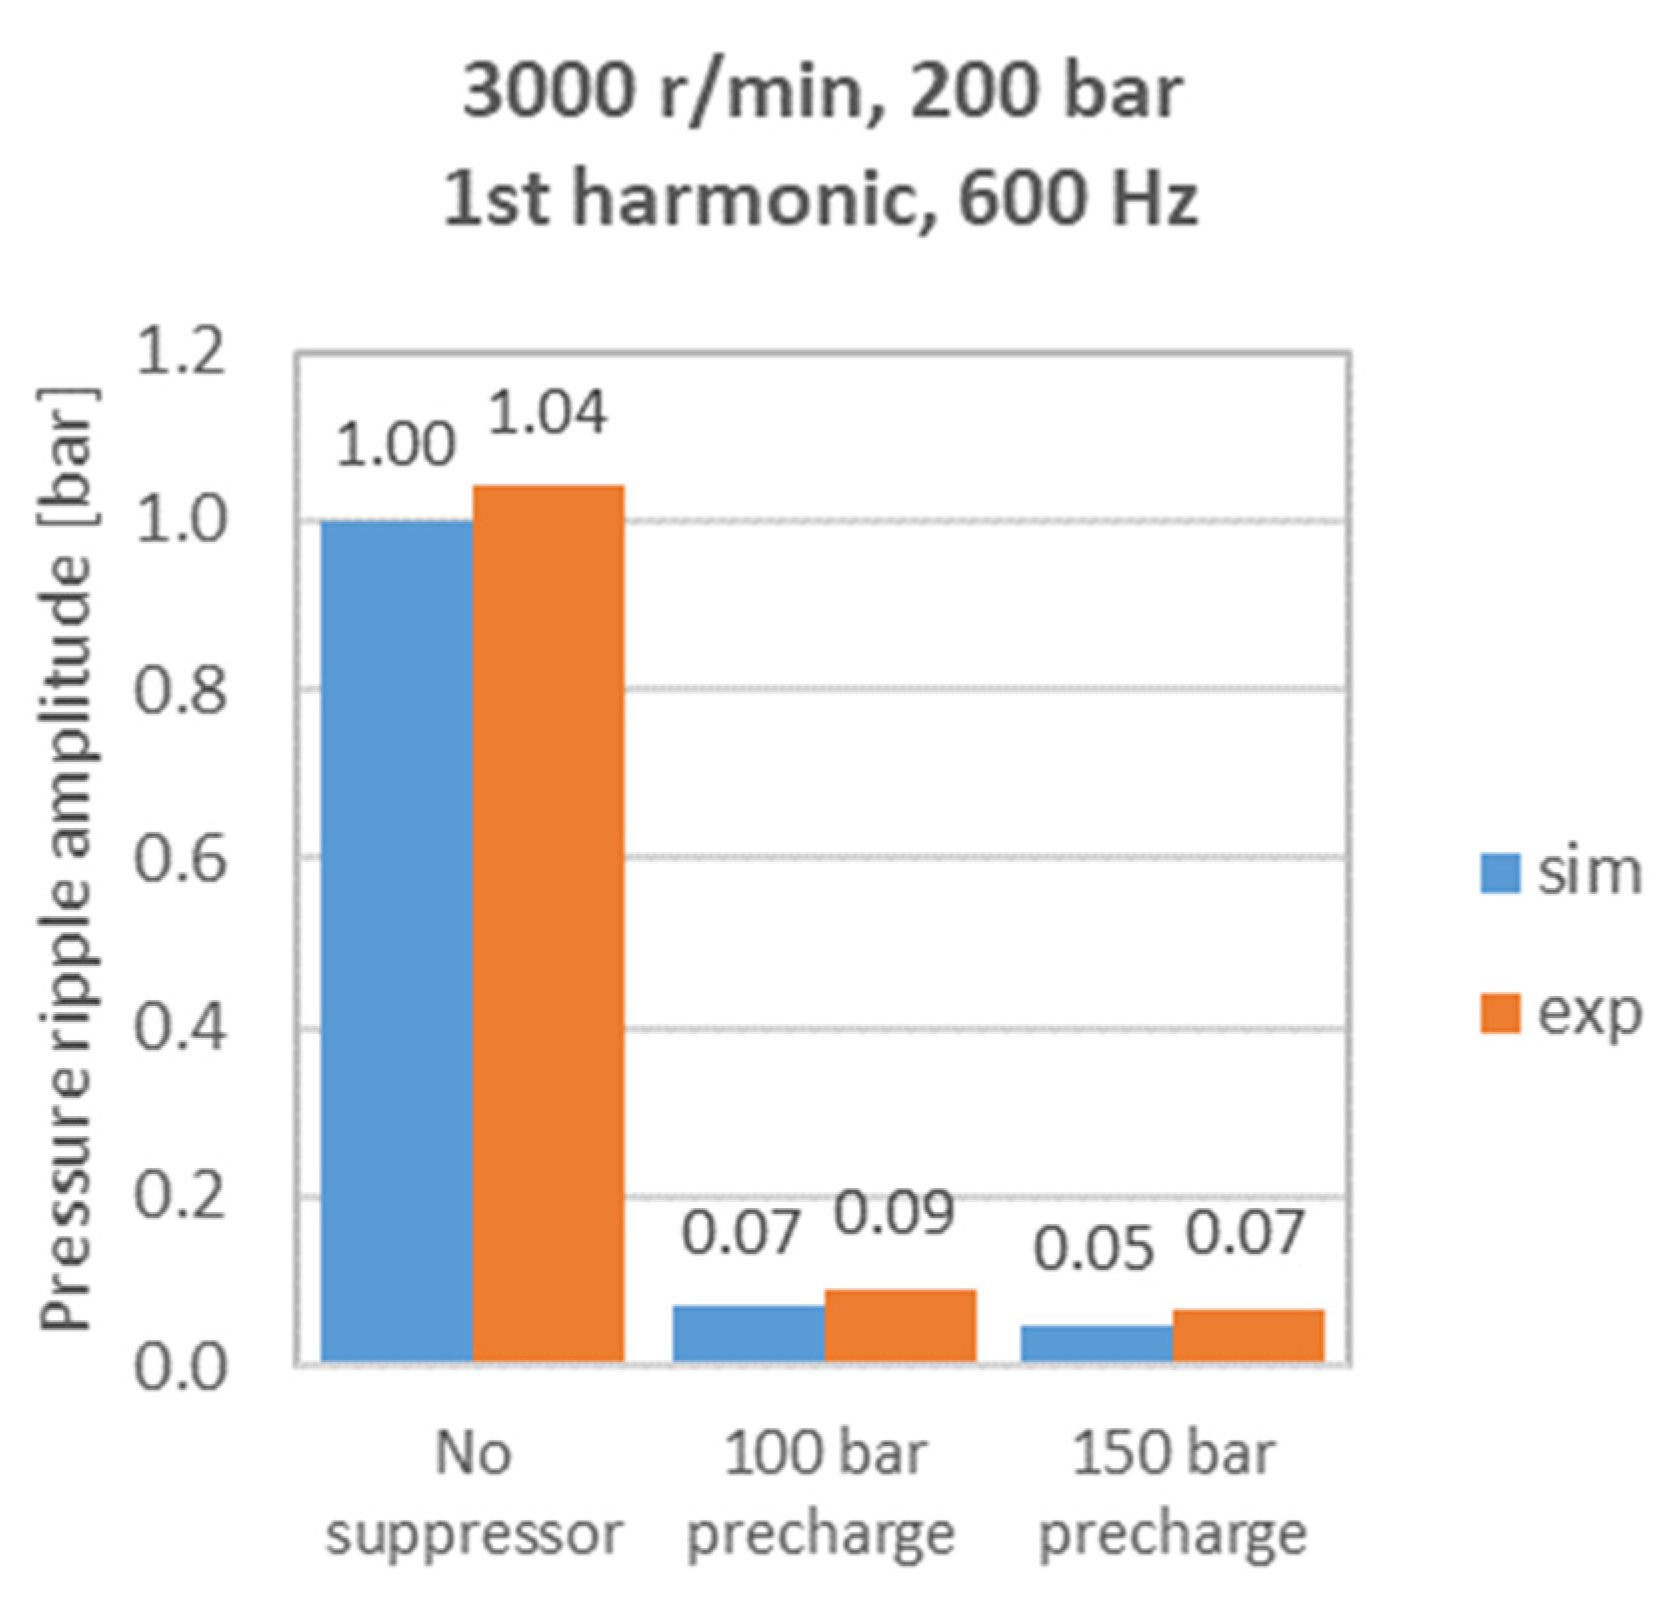
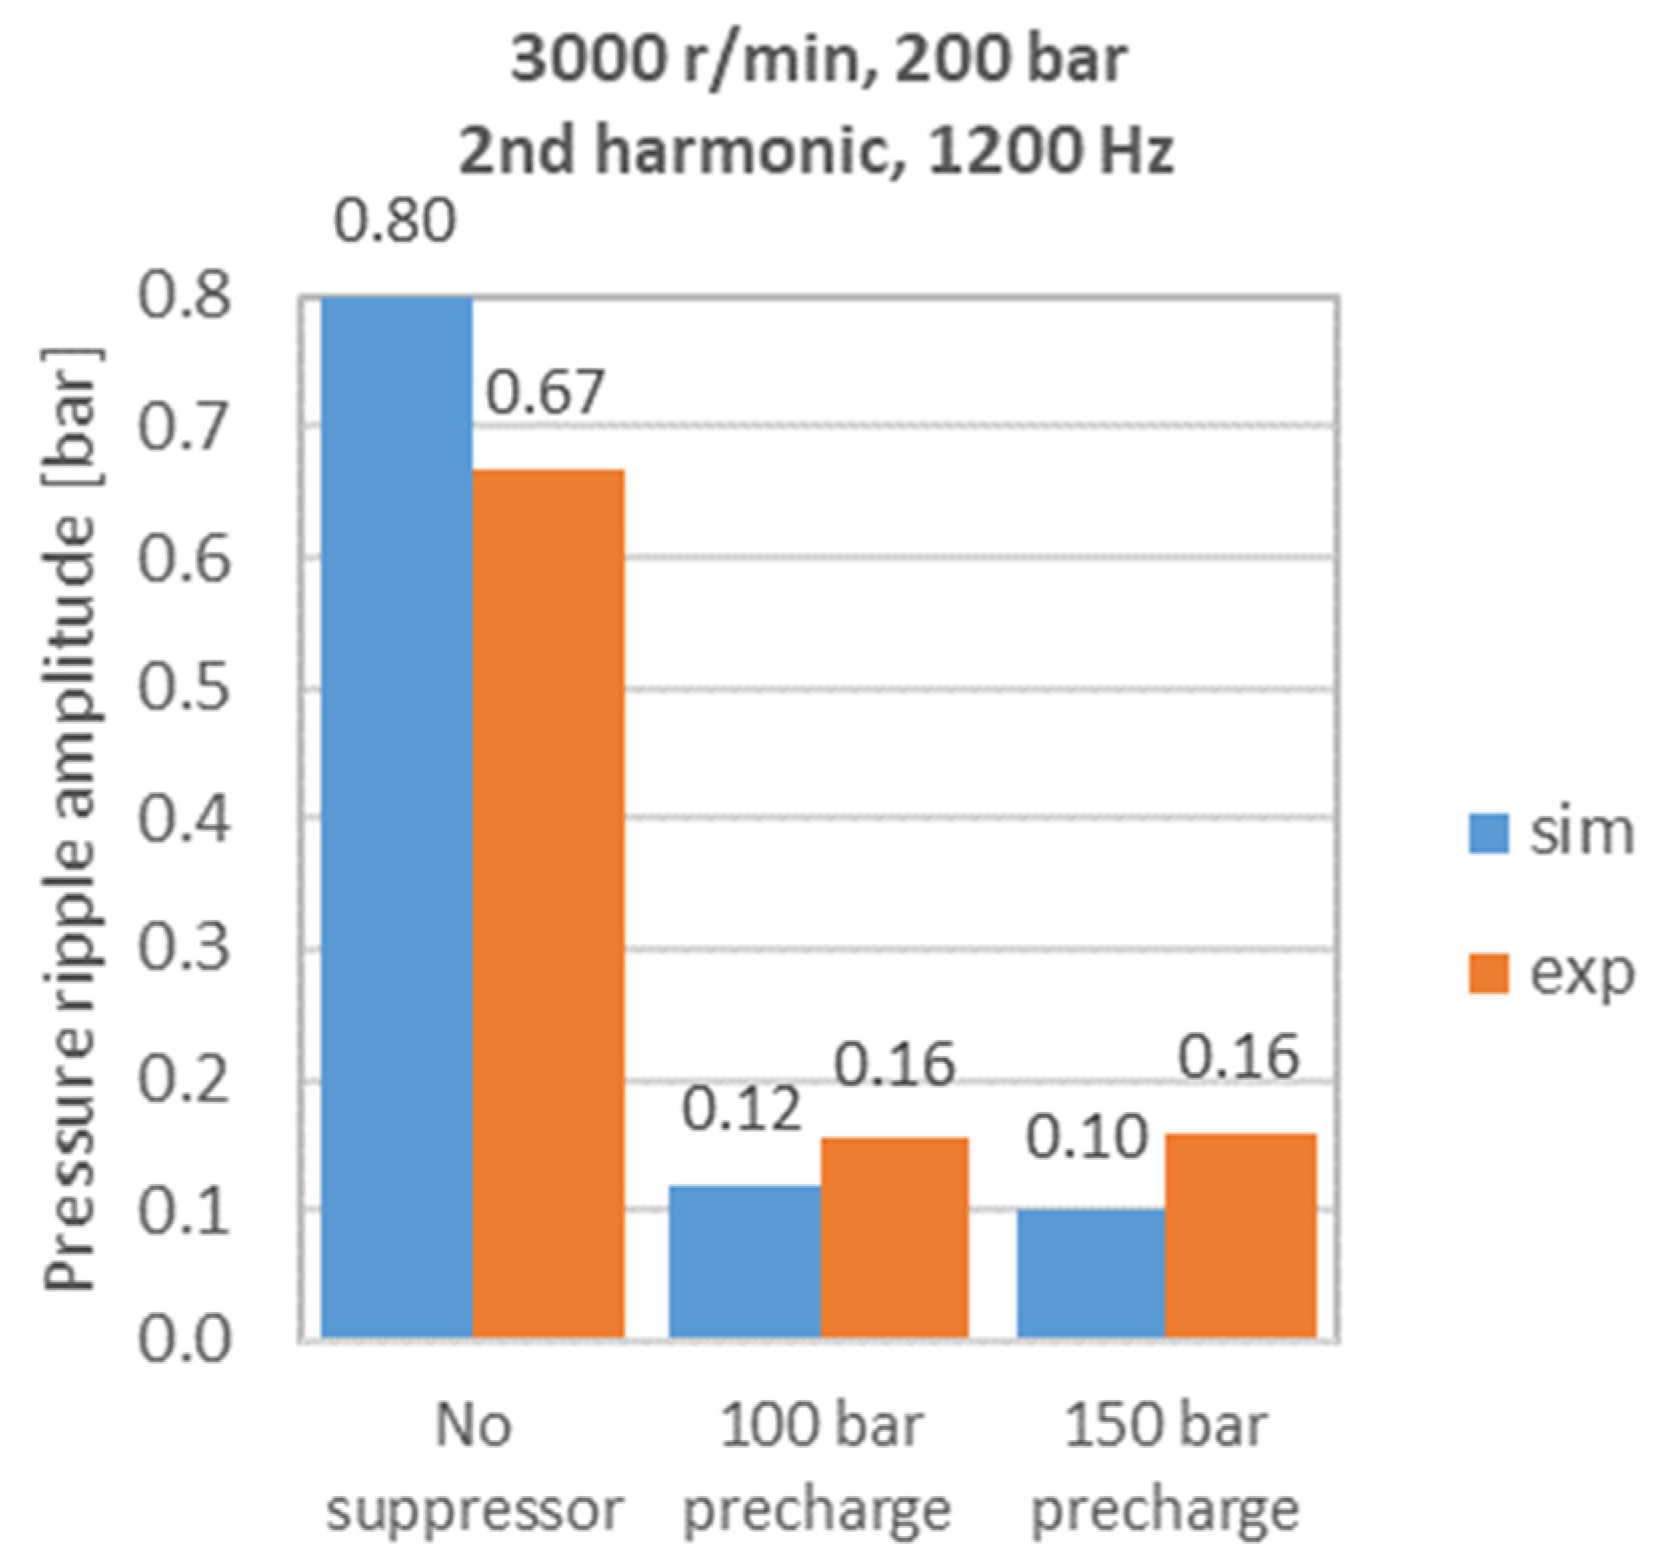
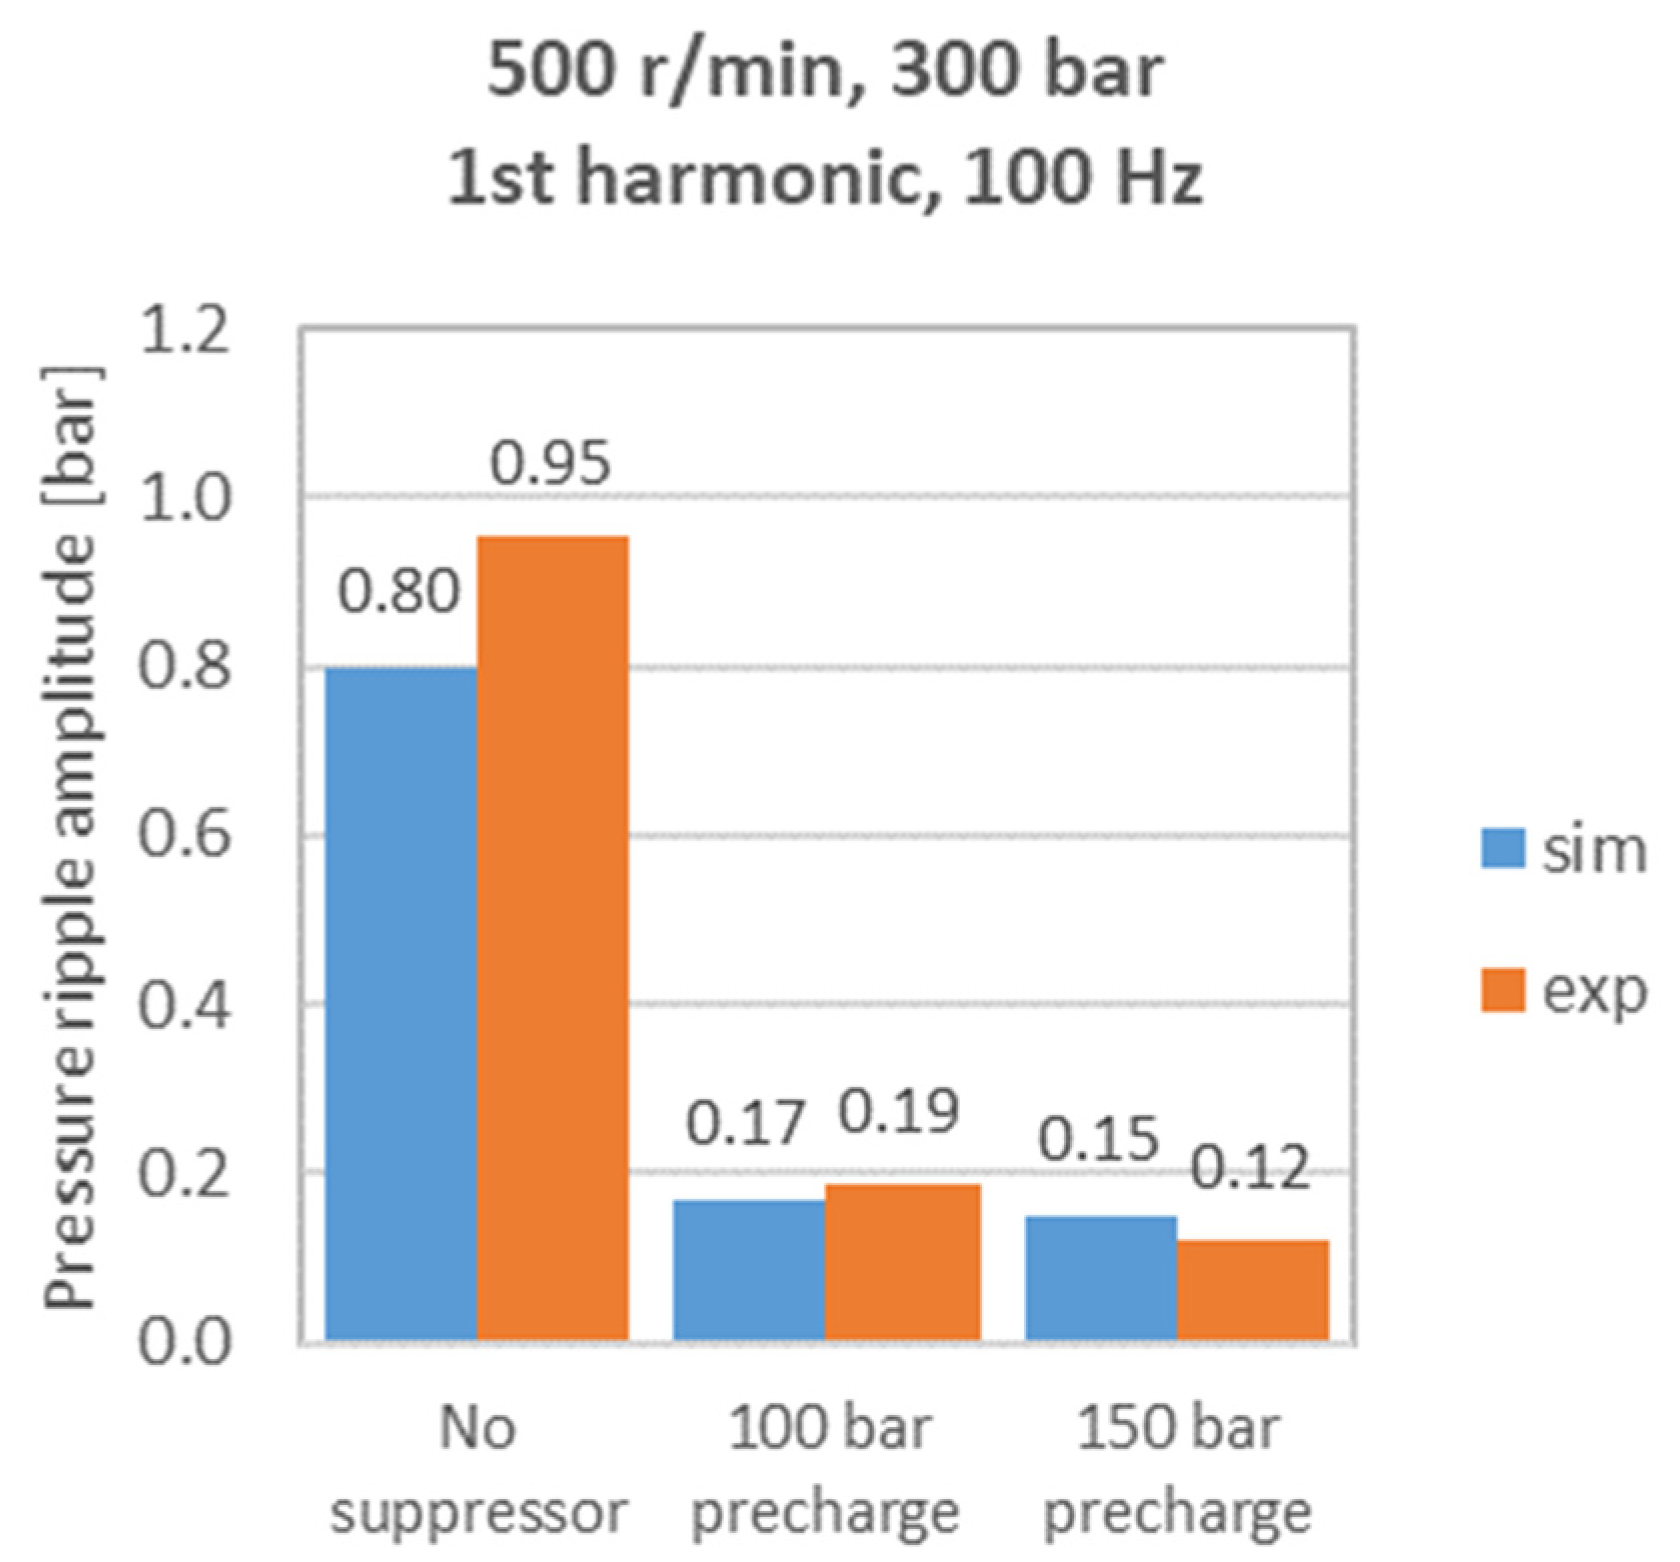
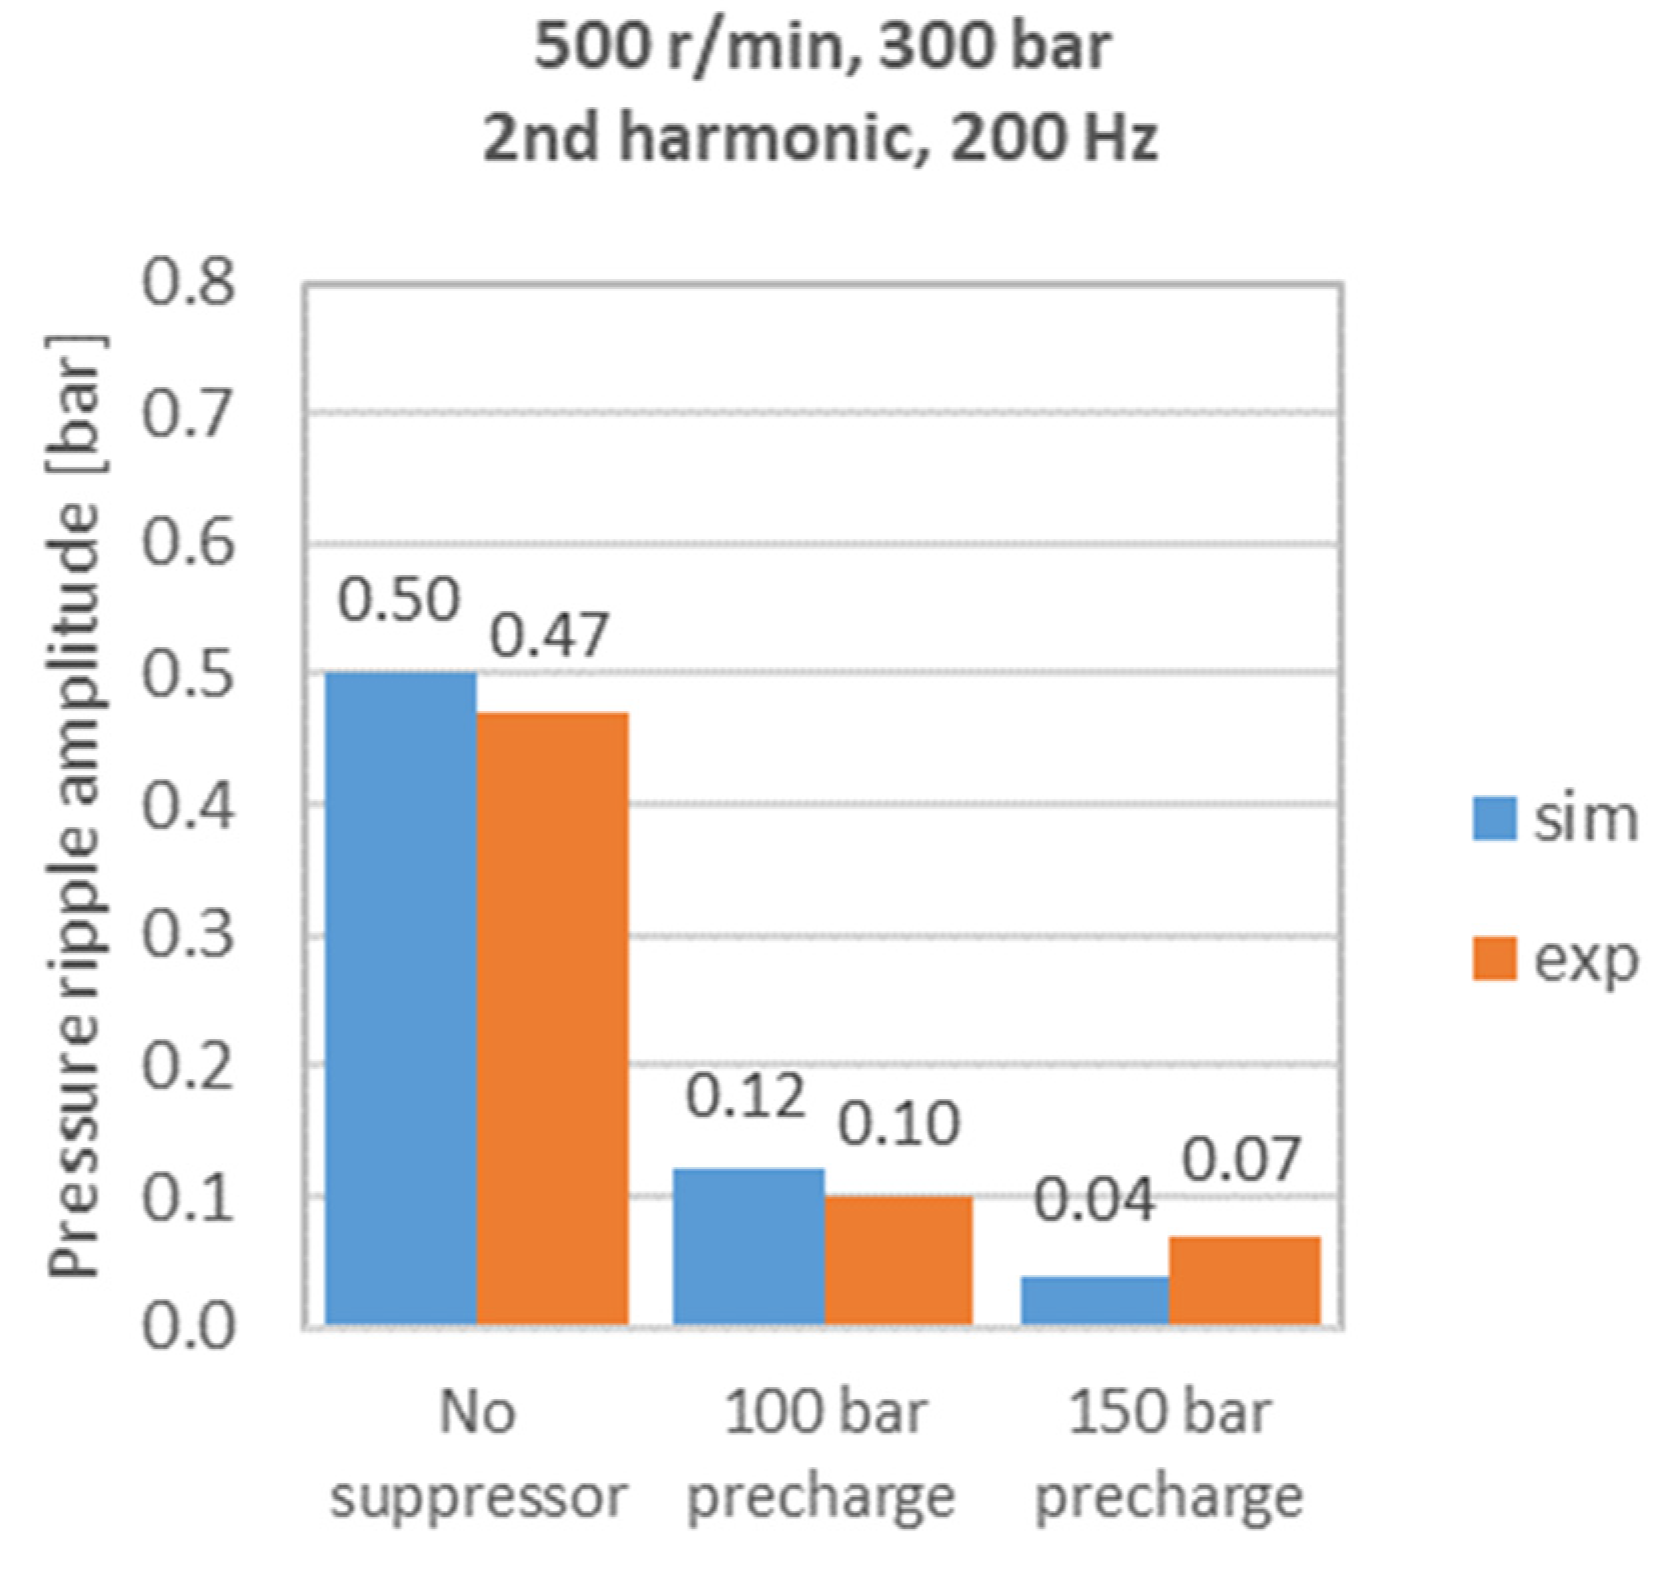
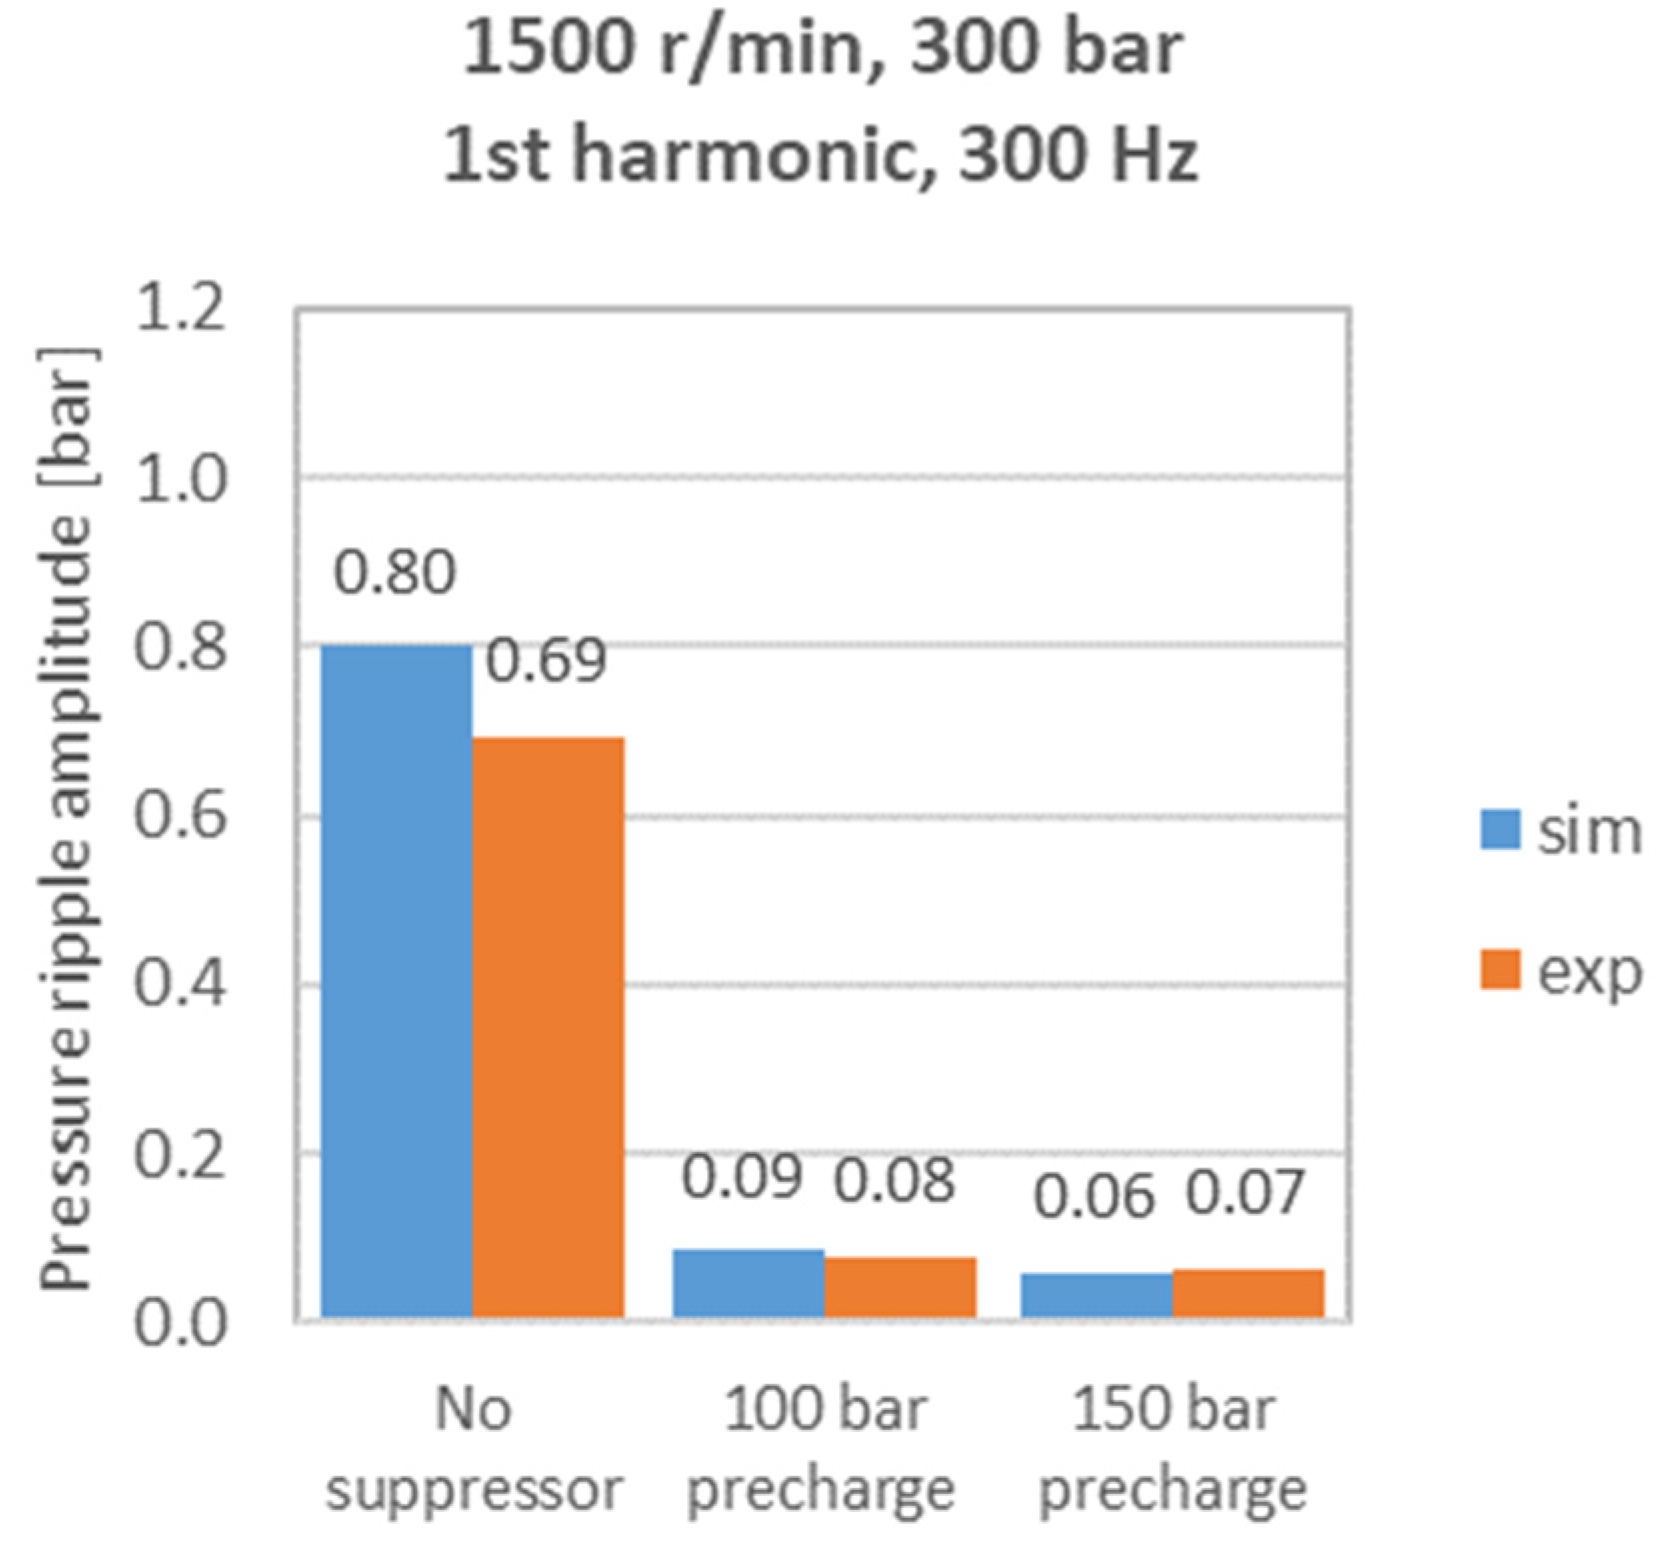
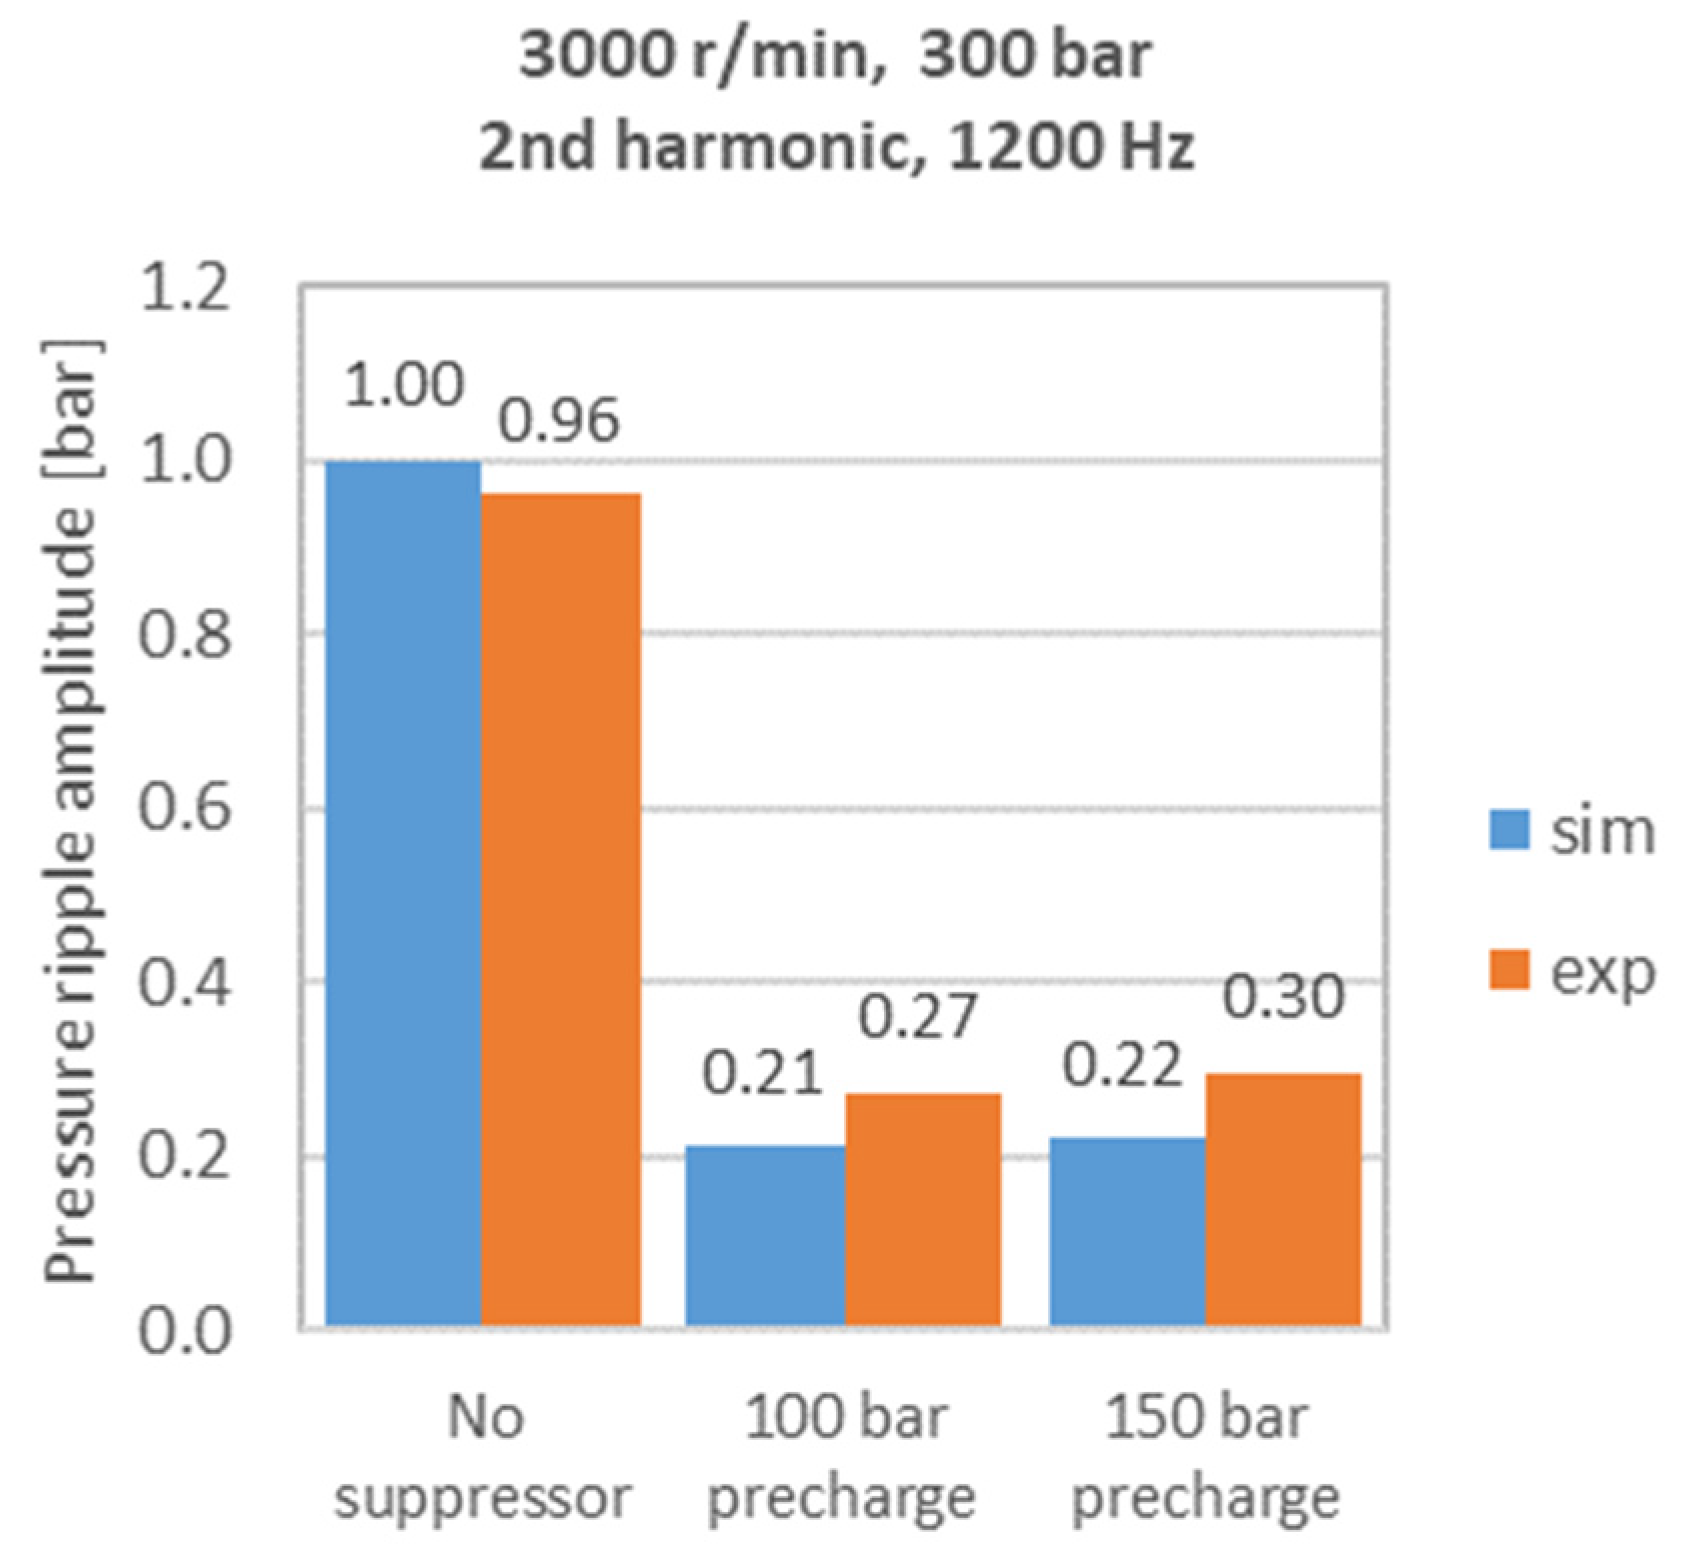
To validate the model, a comparative analysis between experimental and numerical data is reported. Specifically, these graphs encompass the fast fourier transform (FFT) analysis of pressure ripples, incorporating both experimental and numerical datasets. To provide a baseline for evaluation, cases without the suppressor were included, facilitating a straightforward assessment of its performance. The experimental data without the suppressor exhibit no significant disparities between the corresponding upstream and downstream sections; hence, a single value referencing the downstream section was reported. To evaluate the suppressor performance and to verify the model predictivity, the data reported in Figure 5, Figure 6, Figure 7, Figure 8, Figure 9, Figure 10, Figure 11, Figure 12, Figure 13, Figure 14, Figure 15 and Figure 16 are referred to as the downstream pressure. In the previous paper [18], a comparison between the numerical and experimental data of the upstream pressure was also presented. The analysis was carried out by setting the gas precharge pressure at 100 and 150 bar, while the pump speed spans from 500 to 3000 r/min. For brevity, only the cases with oil pressure of 200 bar and 300 bar are reported.
Figure 5, Figure 6, Figure 7, Figure 8, Figure 9 and Figure 10 report the FFT analysis of the pressure ripples focusing on the first and second harmonics amplitudes. A significant pressure ripple reduction is evident, with a good alignment between the experimental data and the numerical results. Similar comments apply to Figure 11, Figure 12, Figure 13, Figure 14, Figure 15 and Figure 16 referring to the oil pressure of 300 bar. A general consideration could be made about the effects of the gas precharge pressure. The pressure amplitude reduction is more significant when the gas pressure is higher, but obviously always below the oil pressure. The reason can be deduced from Equation (15) focusing on the term dp. Setting a lower gas pressure makes it possible for the suppressor to work with a lower gas volume, V, at equal oil pressure and this effects the gas compressibility (which increases) and the damping effects (which decrease). The obvious drawback is that a higher gas precharge pressure reduces the working pressure range of the damper.

5. Discussion and Parametric Analysis

The developed model presents a significant improvement with respect to the previous version [18], with all pipe segments simulated from the pump to the user. This code permits the evaluation of the effects of the relative positioning of the suppressor at the pump delivery side. In other words, the distance L in Figure 1 was investigated in order to define its effect on the pressure evolution in both the pipe before the suppressor (upstream section) and after the suppressor (downstream section). The distance between the suppressor and the user was kept constant, being a parameter that depends on the application and, as a consequence, is not relevant to be investigated.
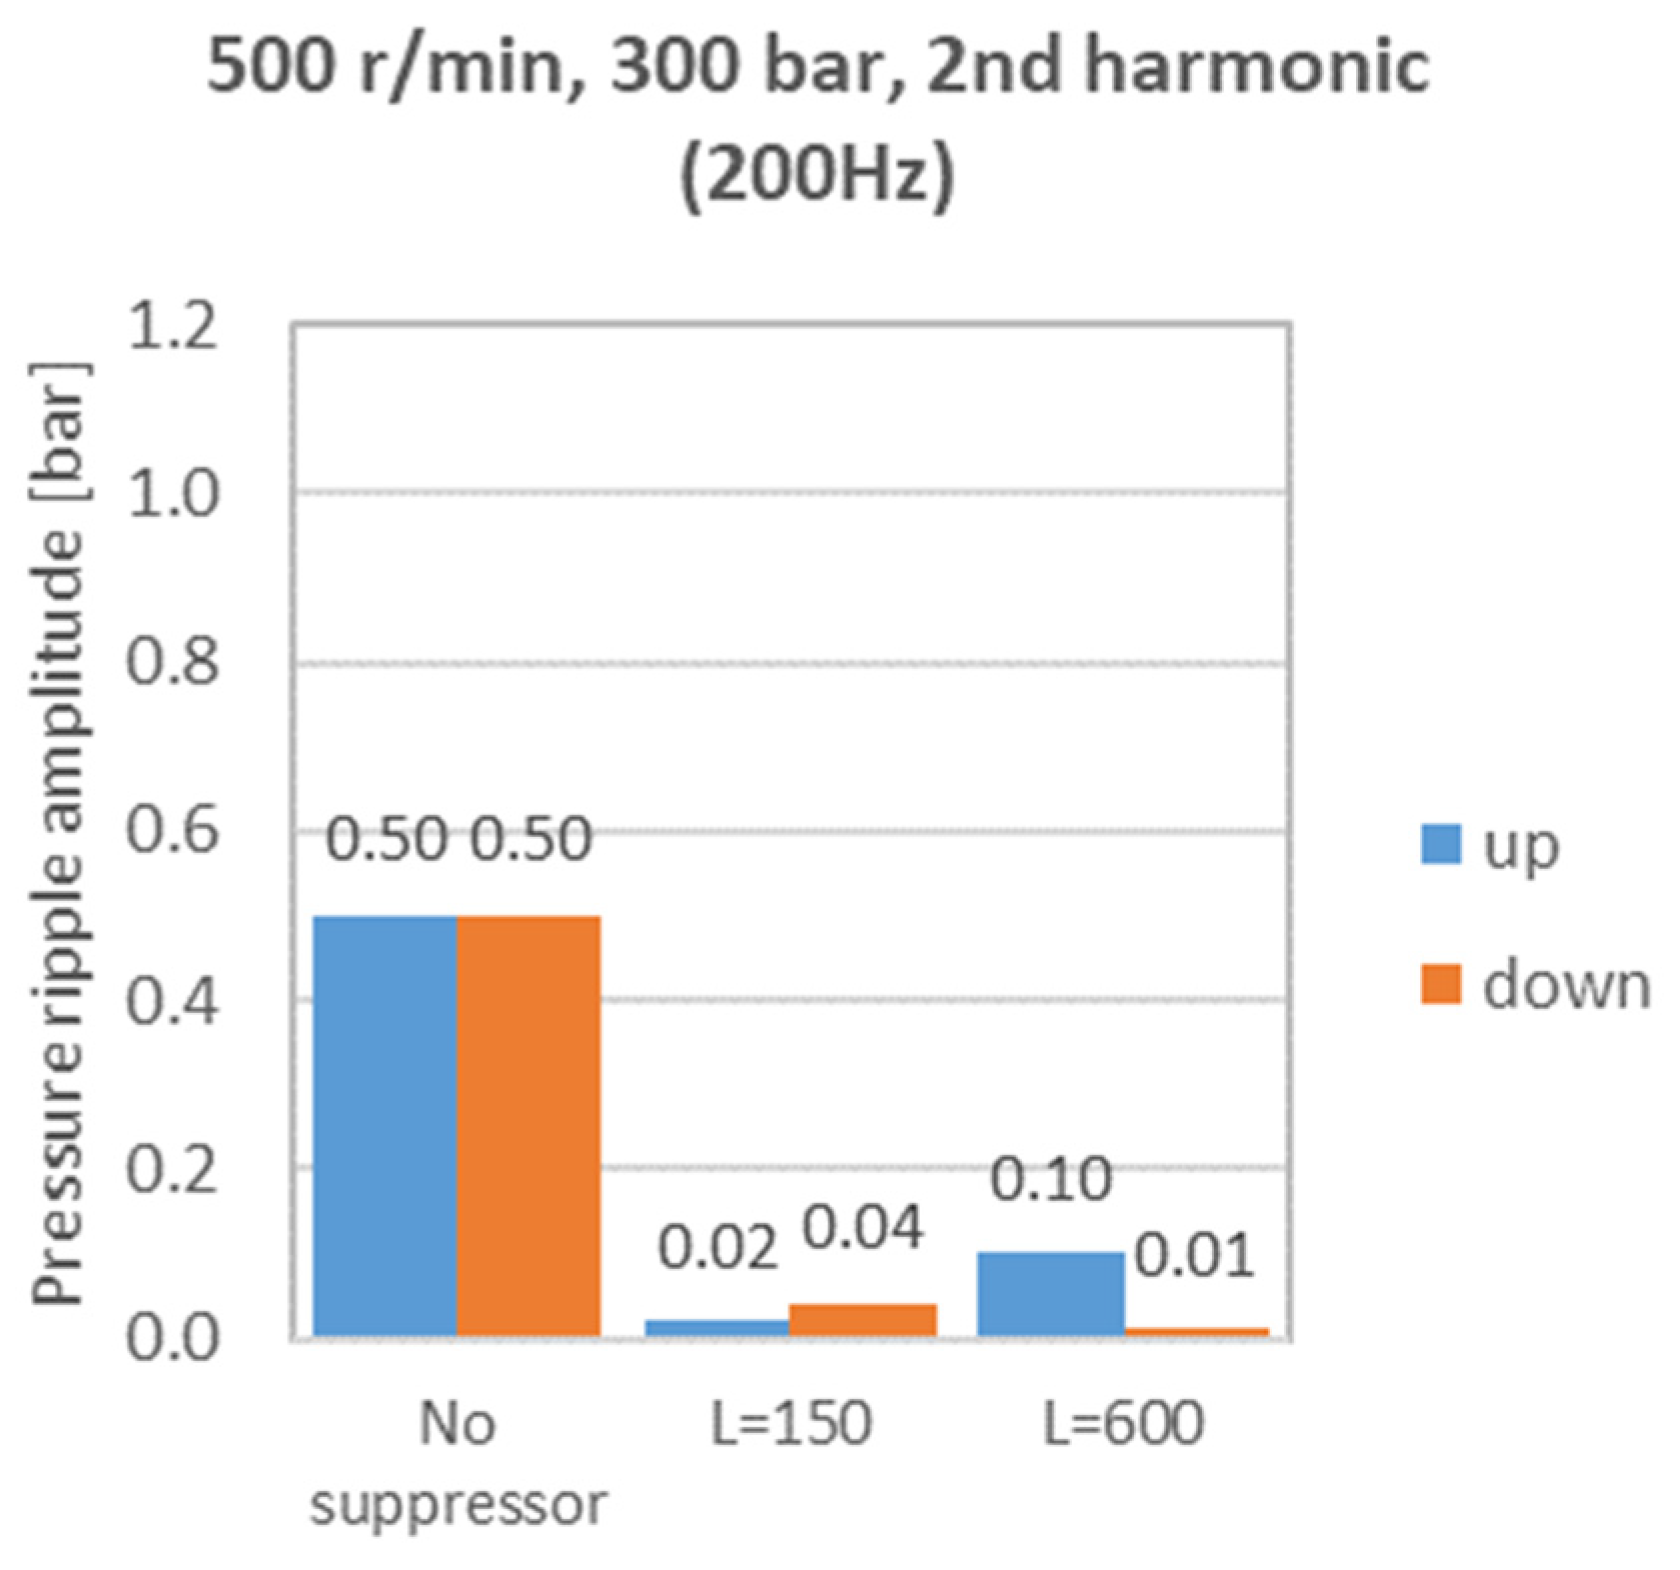
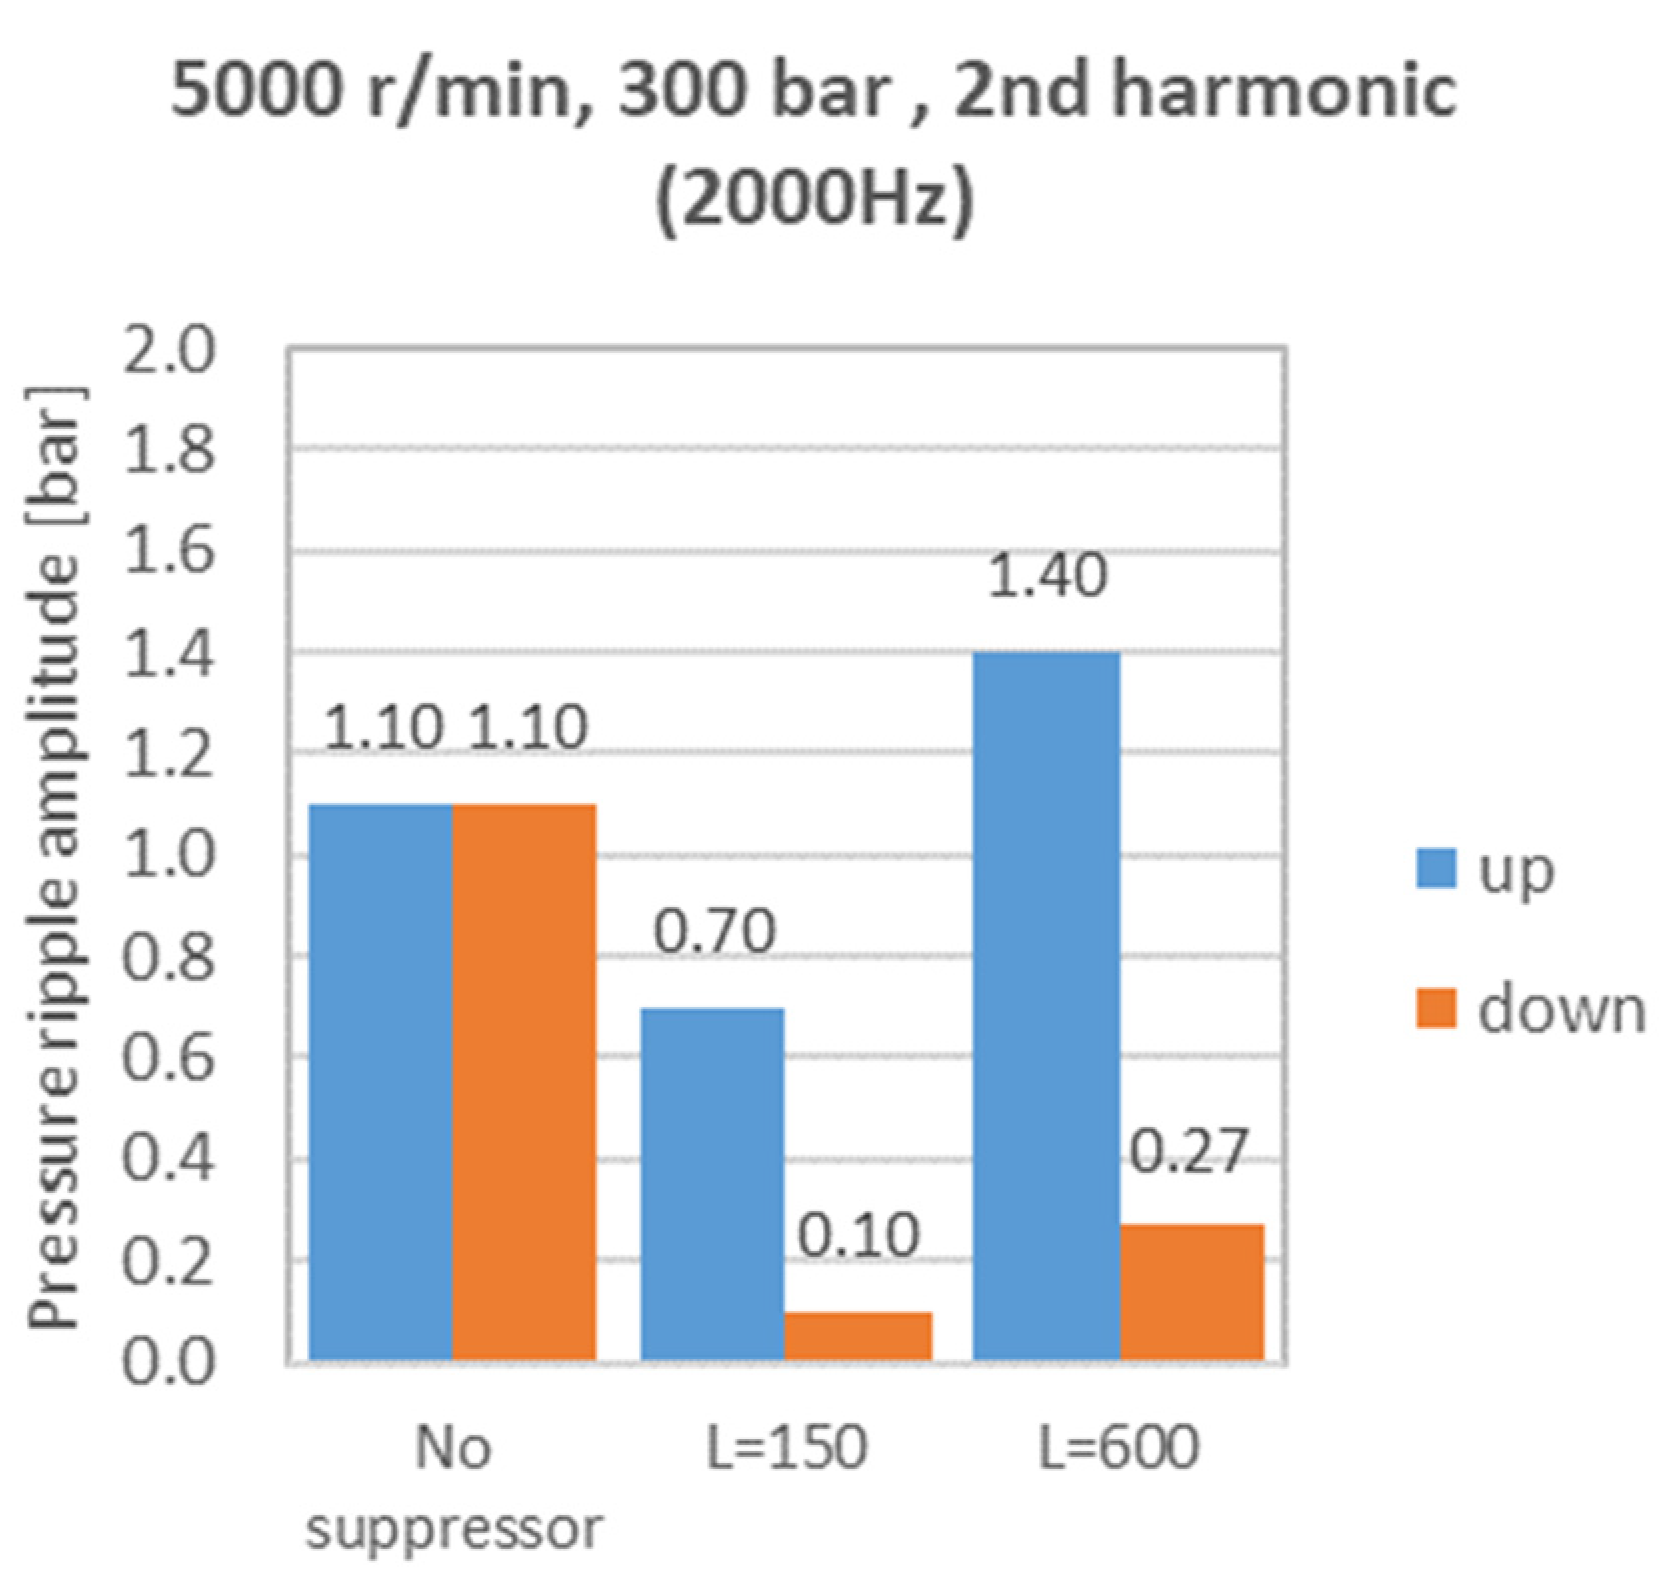
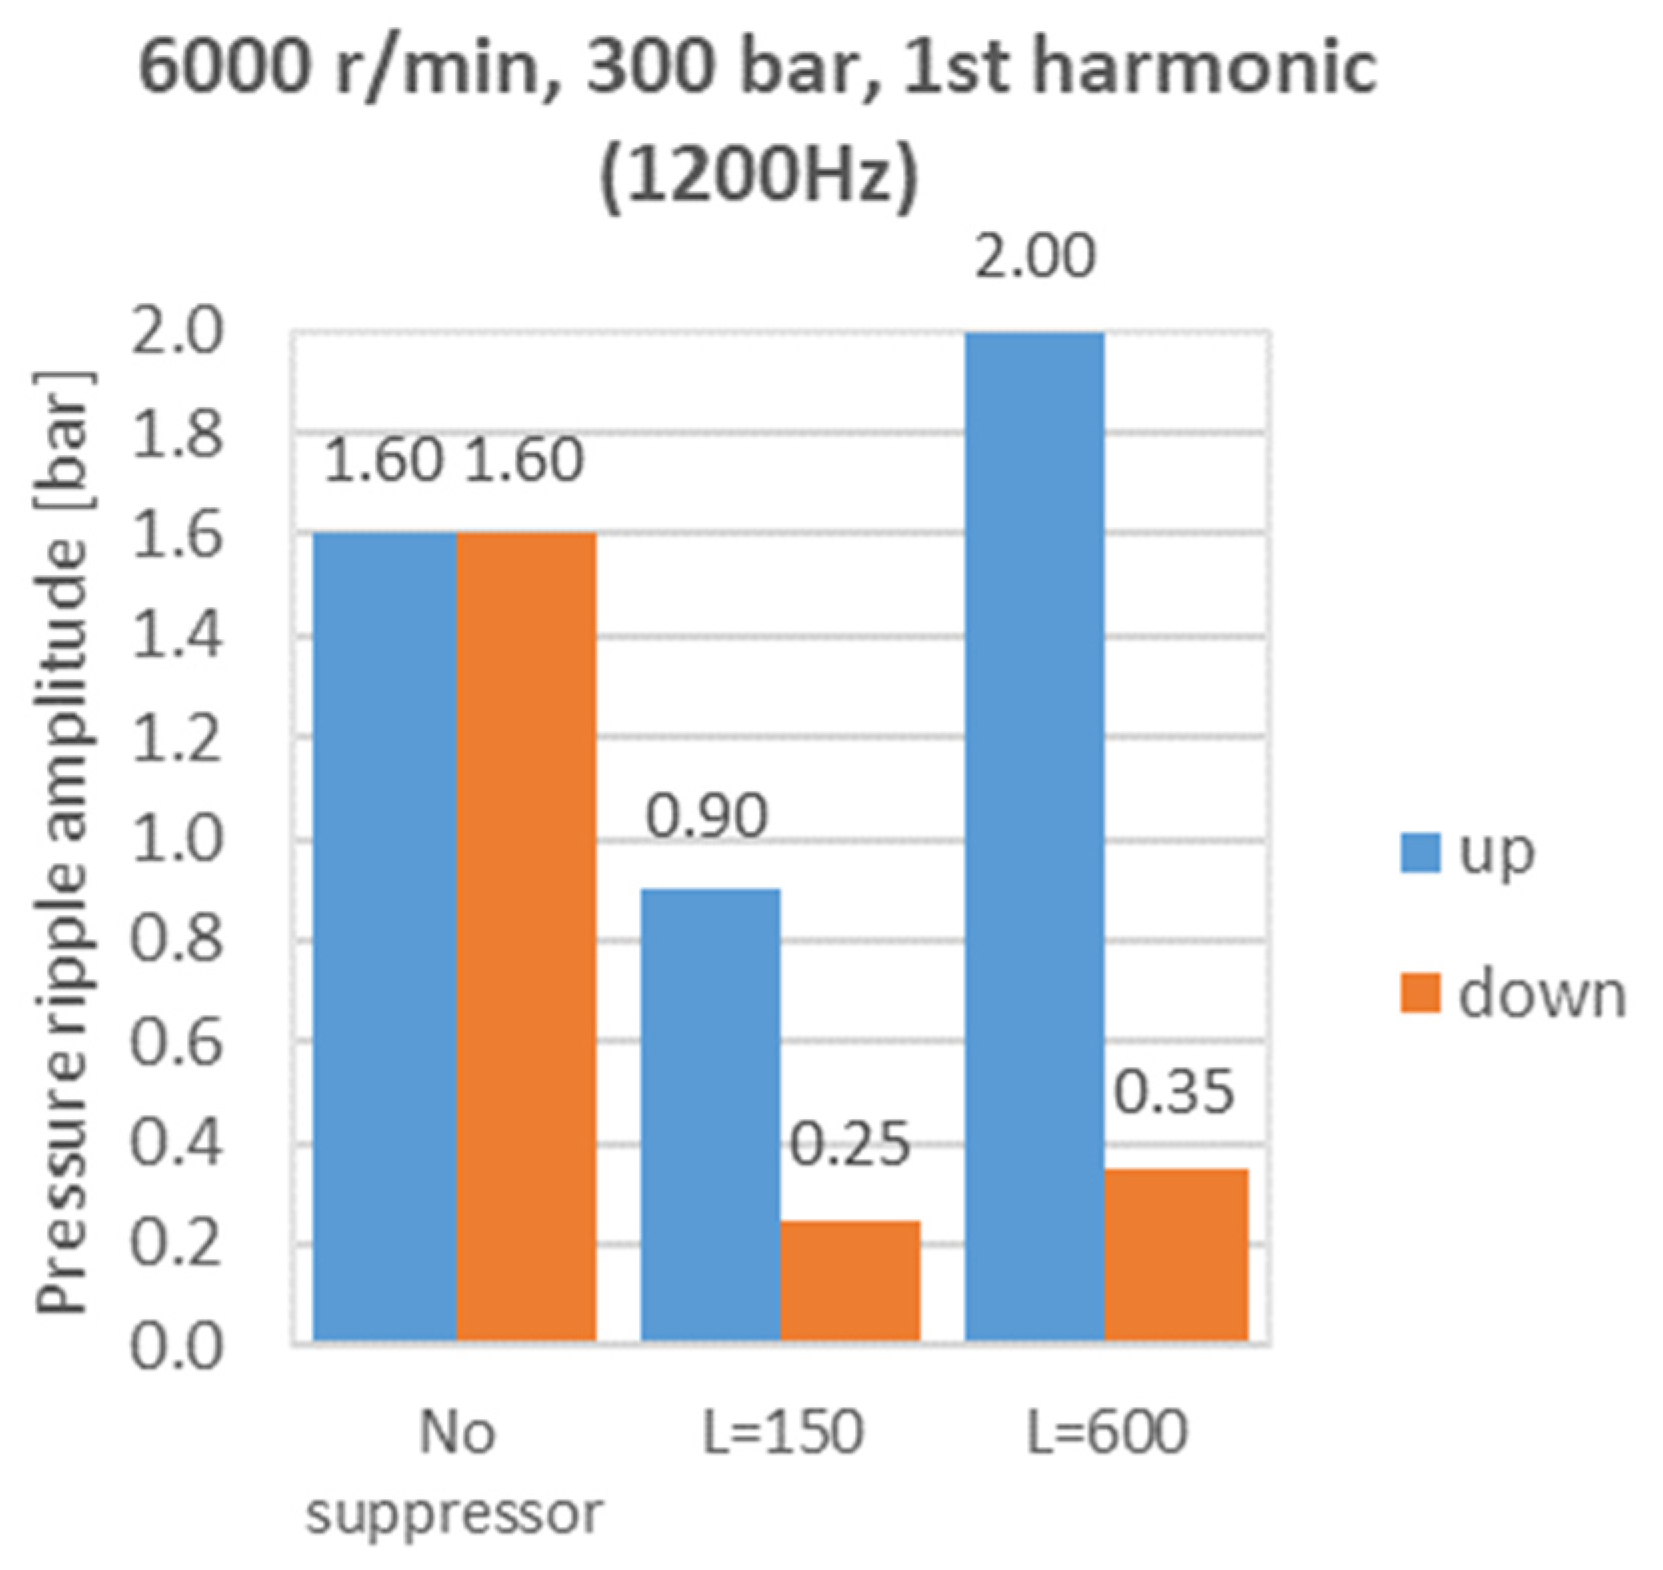
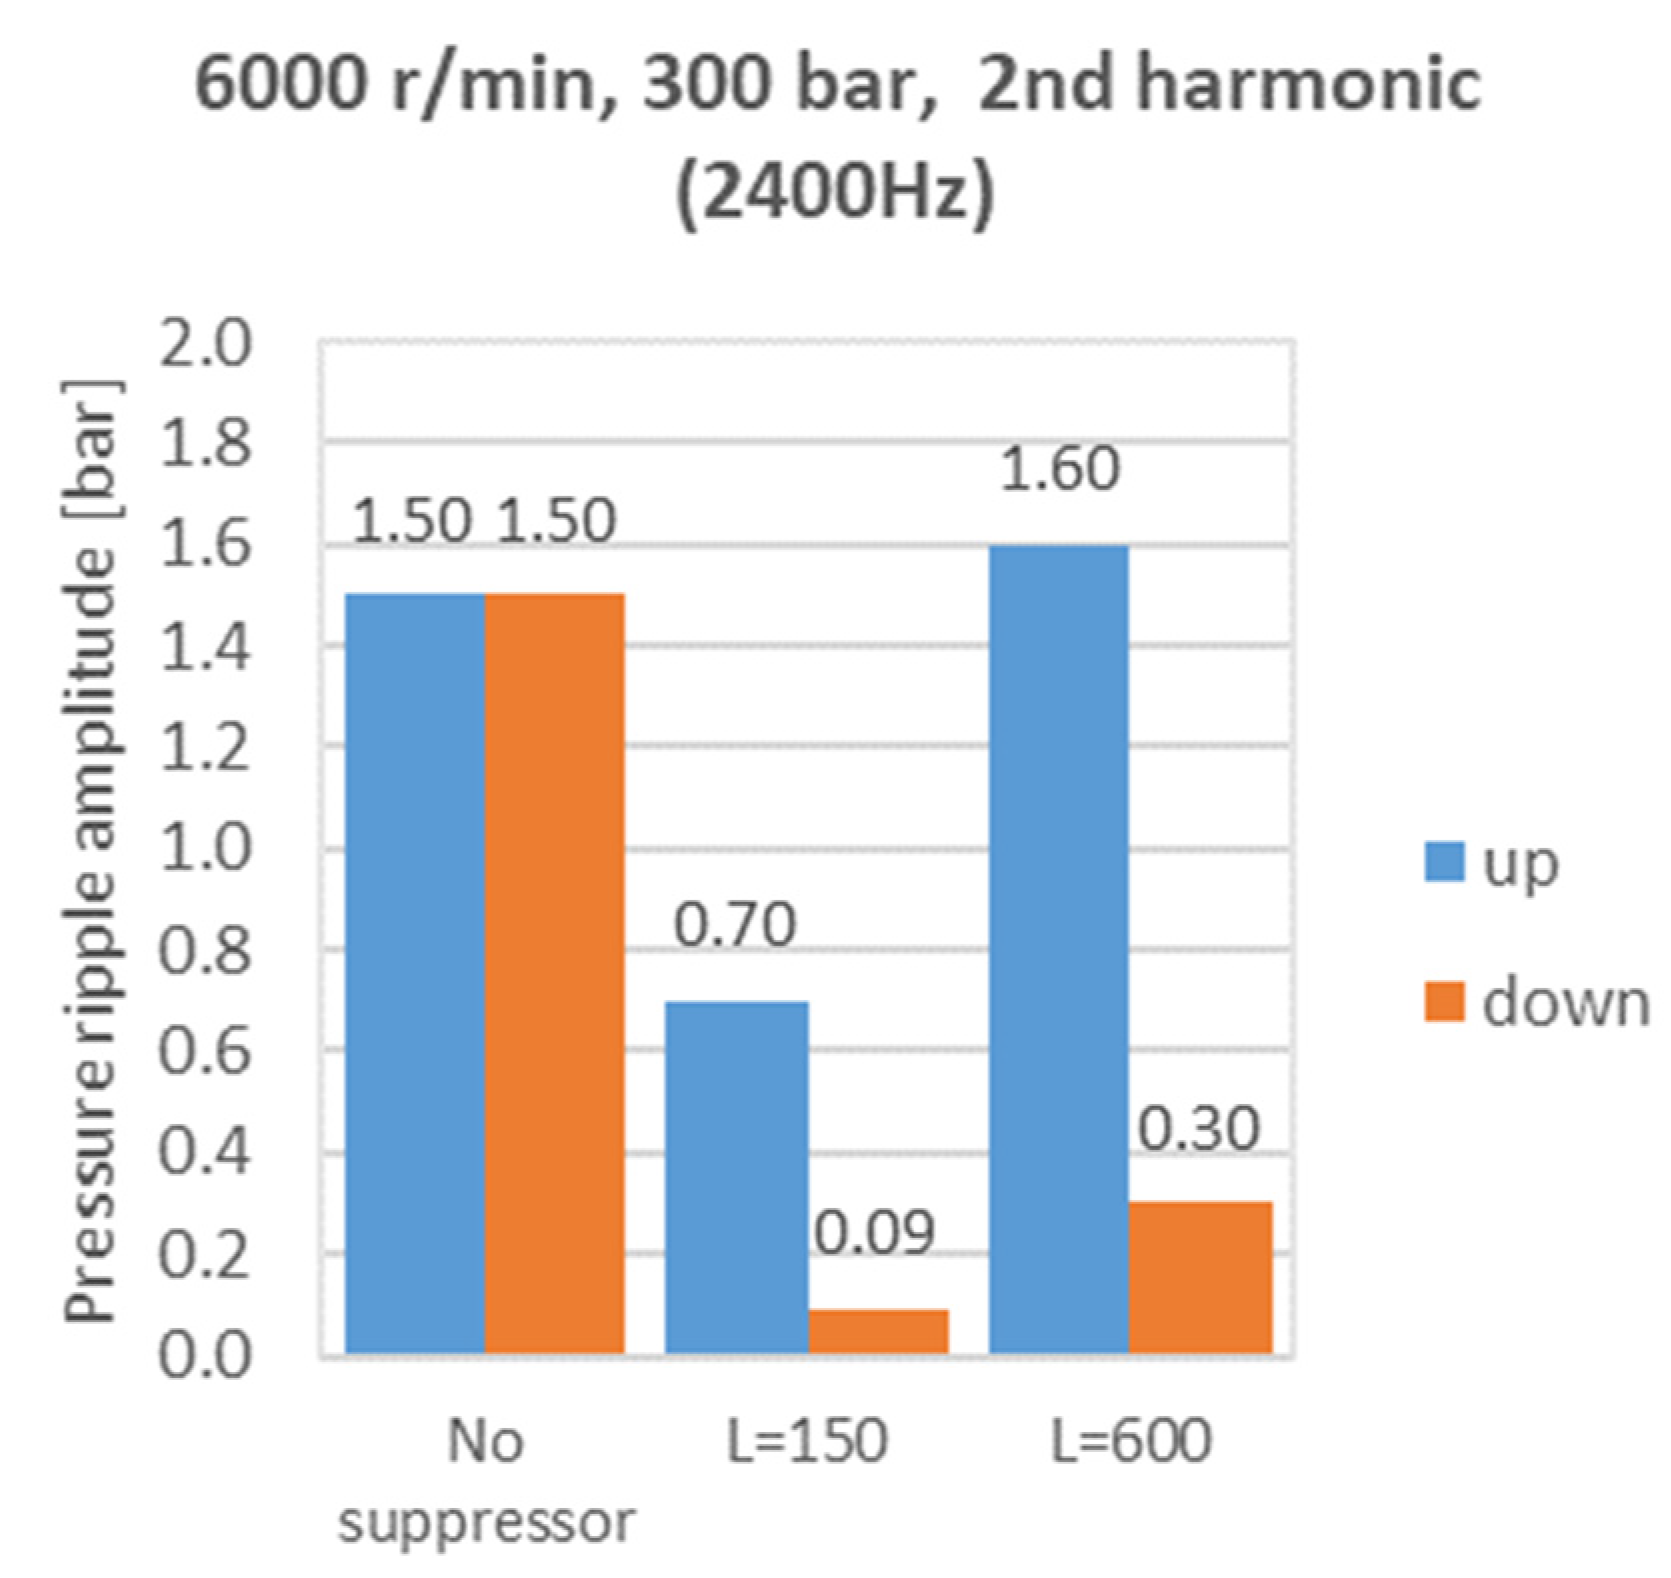
After the model validation, presented in the previous section, in this section, the results obtained from numerical activity were also used to explore very high rotational speeds of the pump. The course of the pressure amplitude in terms of the first and second harmonics of the pressure ripples were investigated both upstream (up) and downstream (down) of the suppressor with different values of the pipe length L. Two parameters were investigated: the length L (distance between the pump and damper, Figure 1) and the pump rotational speed; to limit the plots, only the case with the oil pressure set to 300 bar and the gas precharge pressure equal to 150 bar are reported.
The pump speed spans from 500 r/min to 6000 r/min, because, as cited in the introduction, in current and future applications, fixed displacement pumps can be driven by means of variable speed electric motors in a very wide speed range.
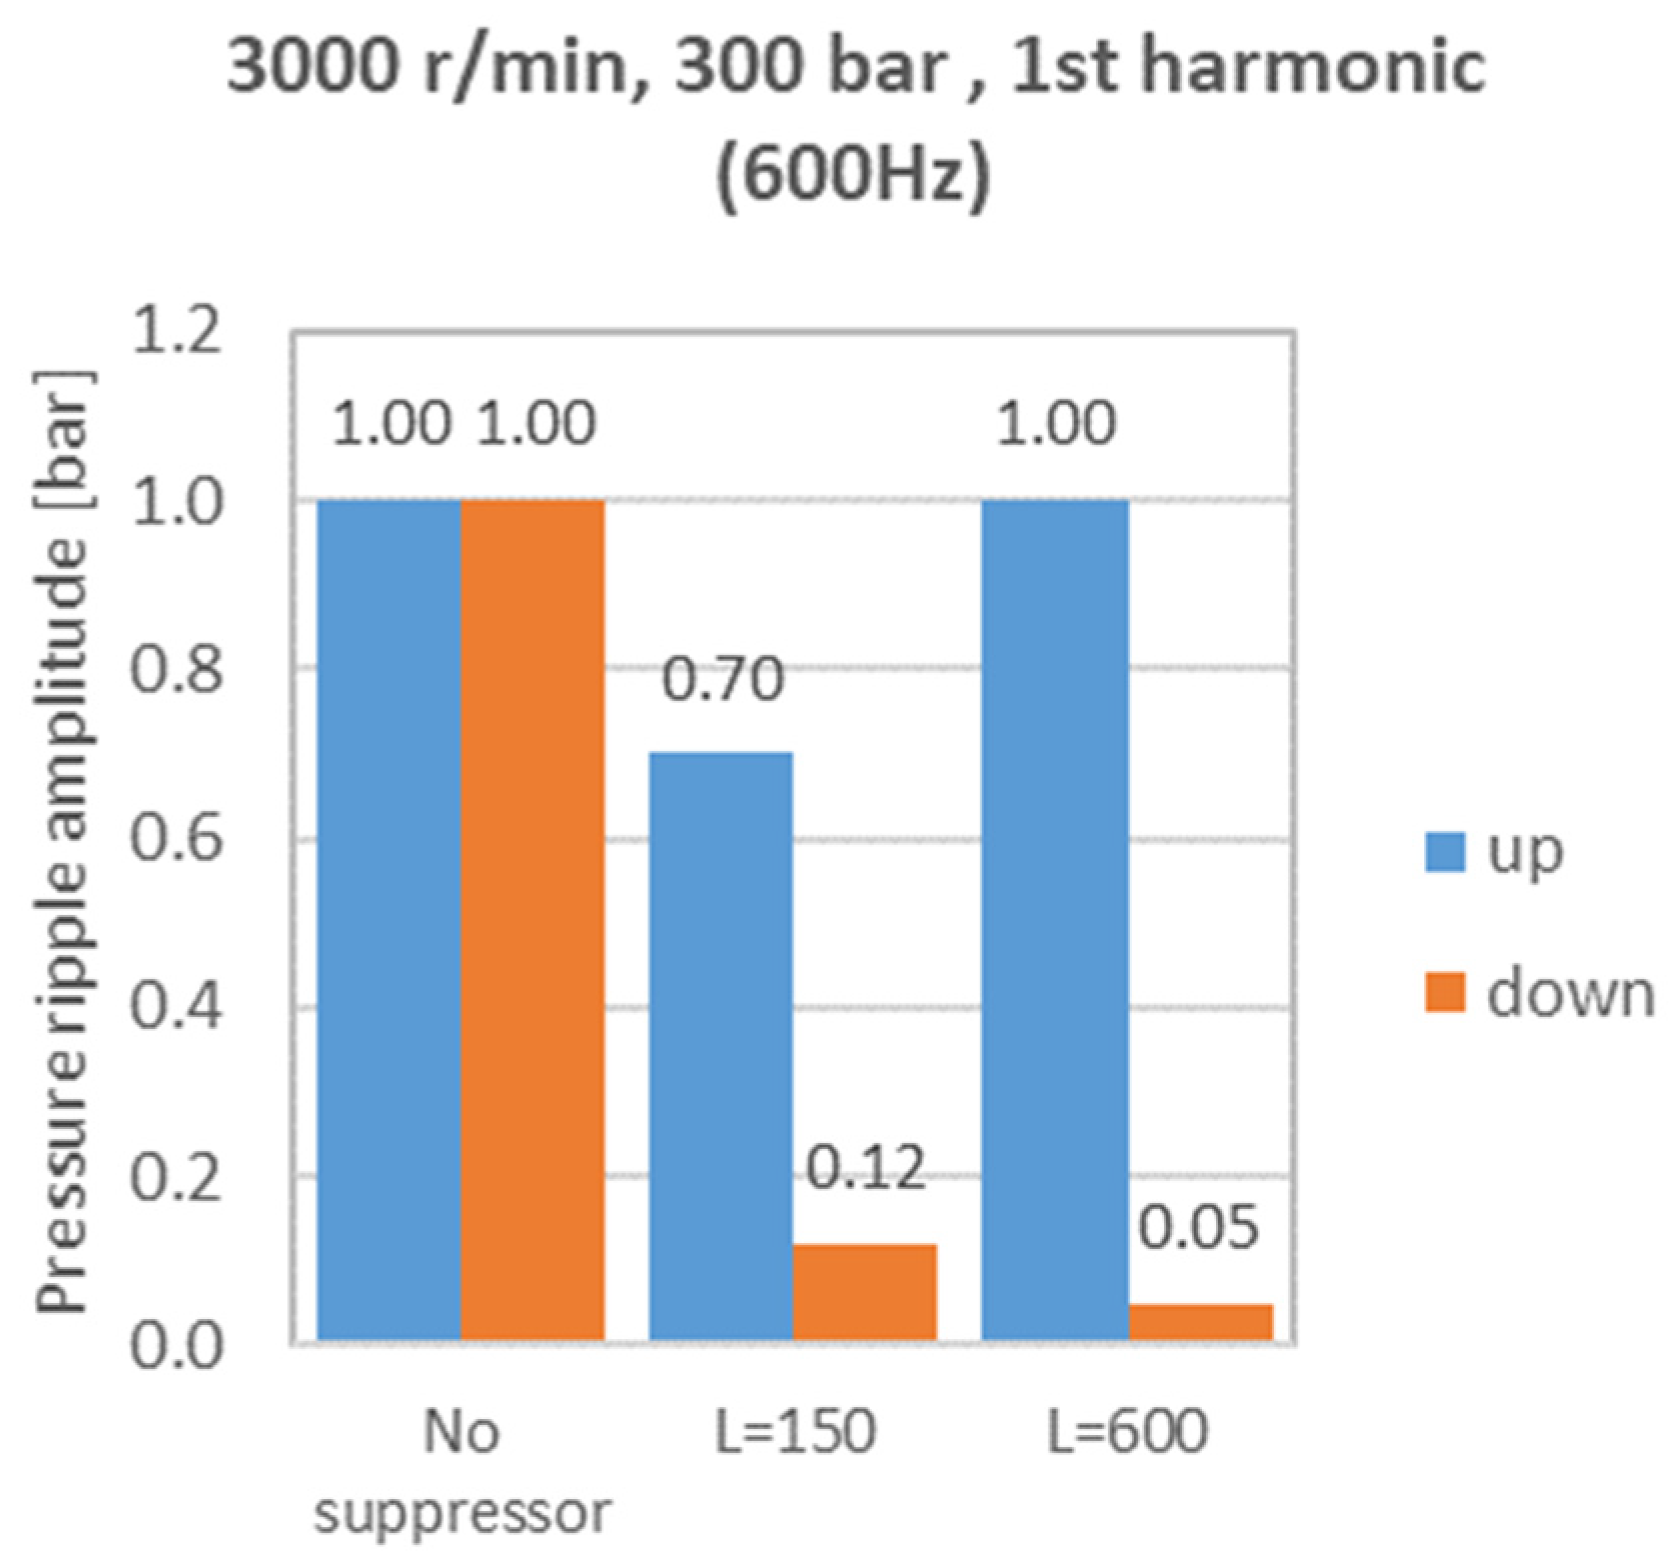
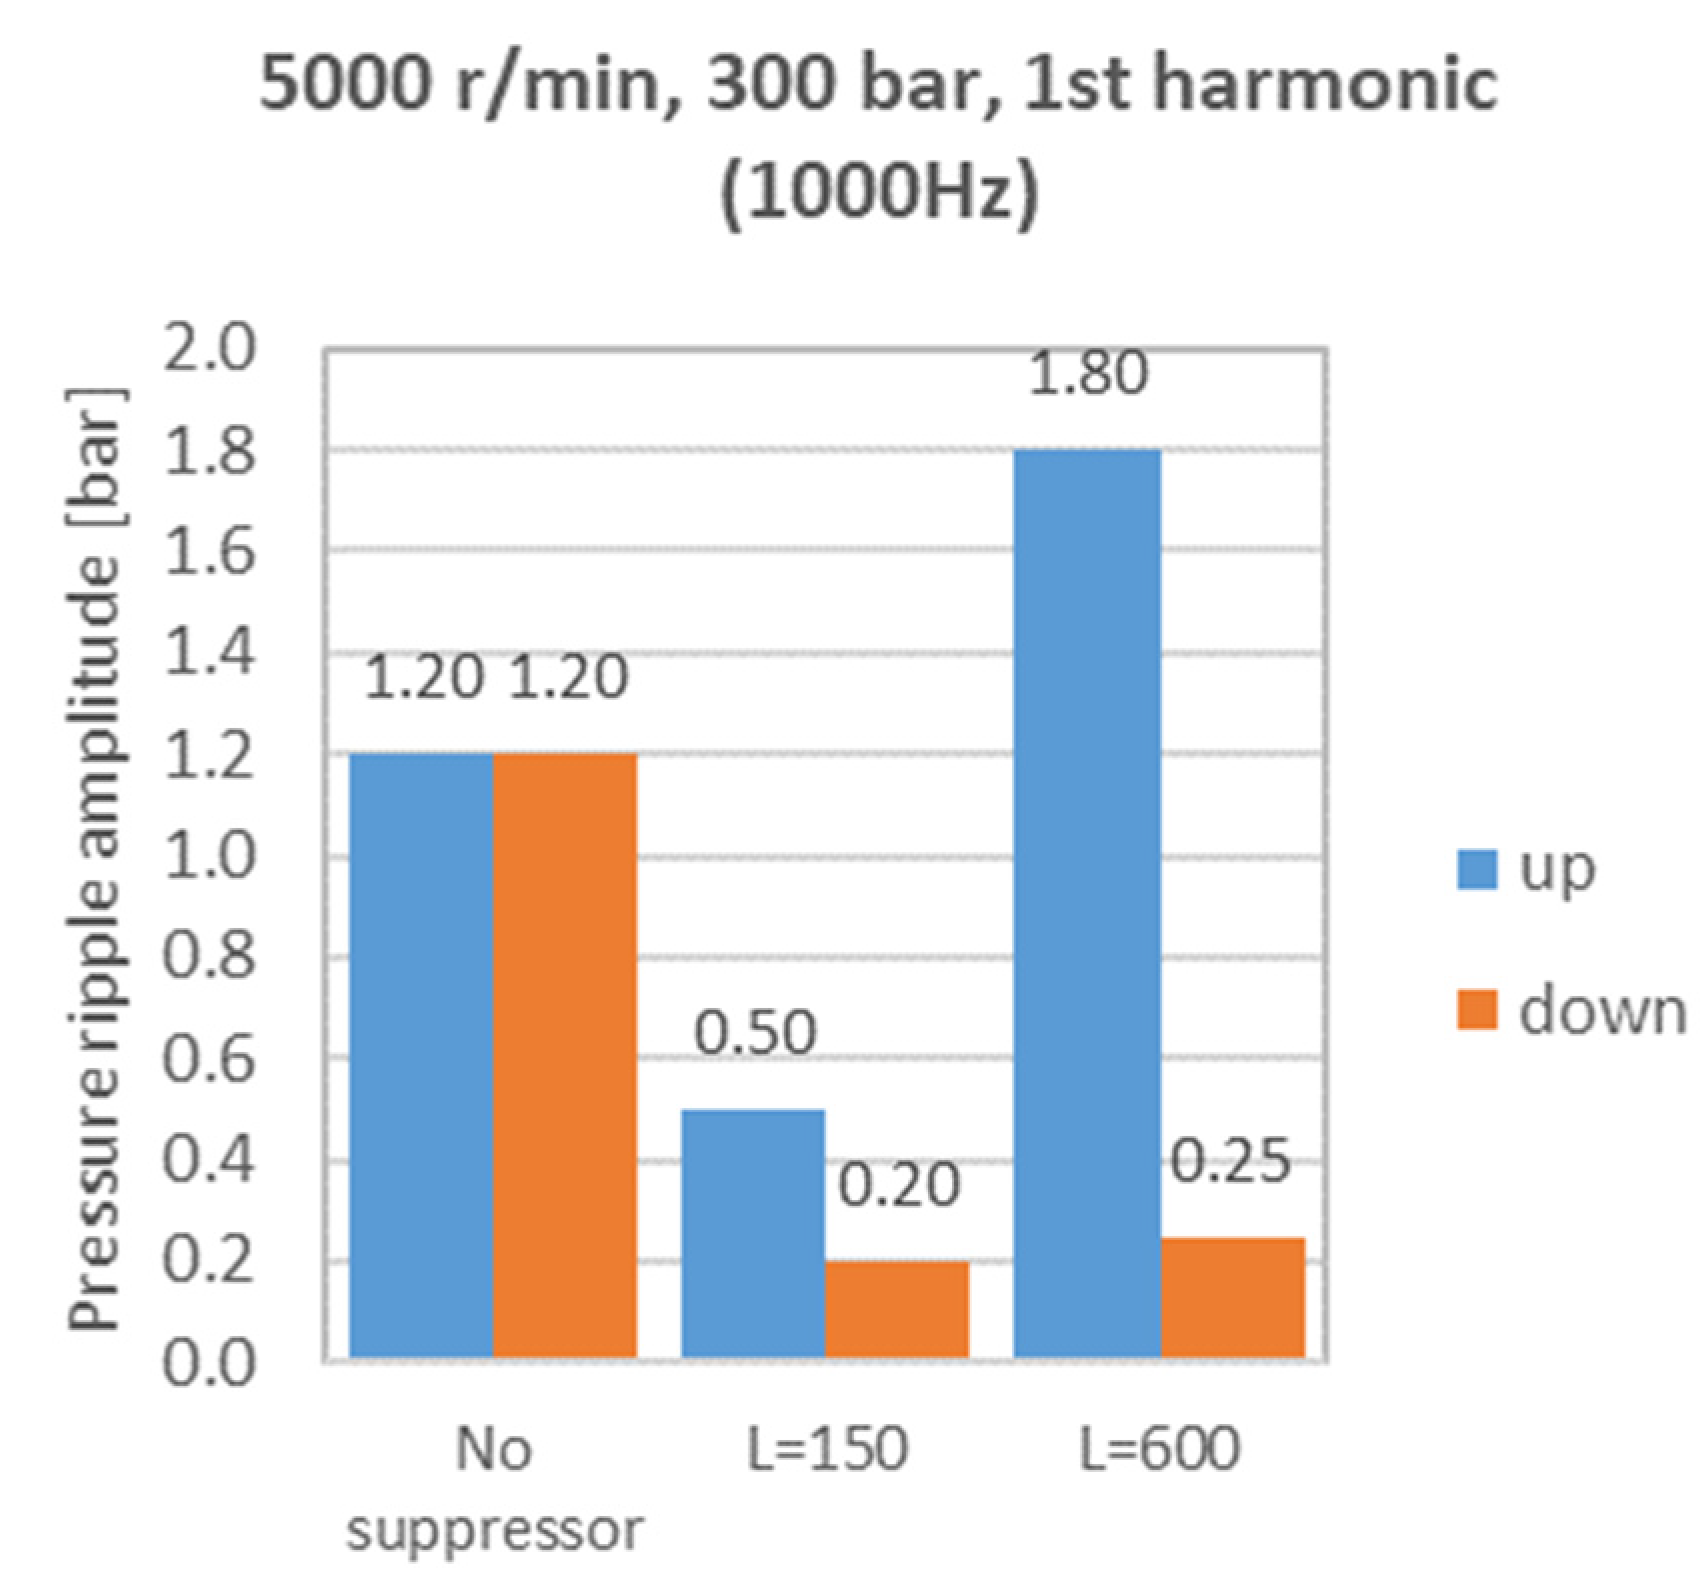
By the analysis of Figure 17, Figure 18, Figure 19, Figure 20, Figure 21, Figure 22, Figure 23, Figure 24, Figure 25 and Figure 26, it is clear that the damper is always useful at the downstream section, because there is a significative reduction in the pressure ripple amplitude in all the cases considered.
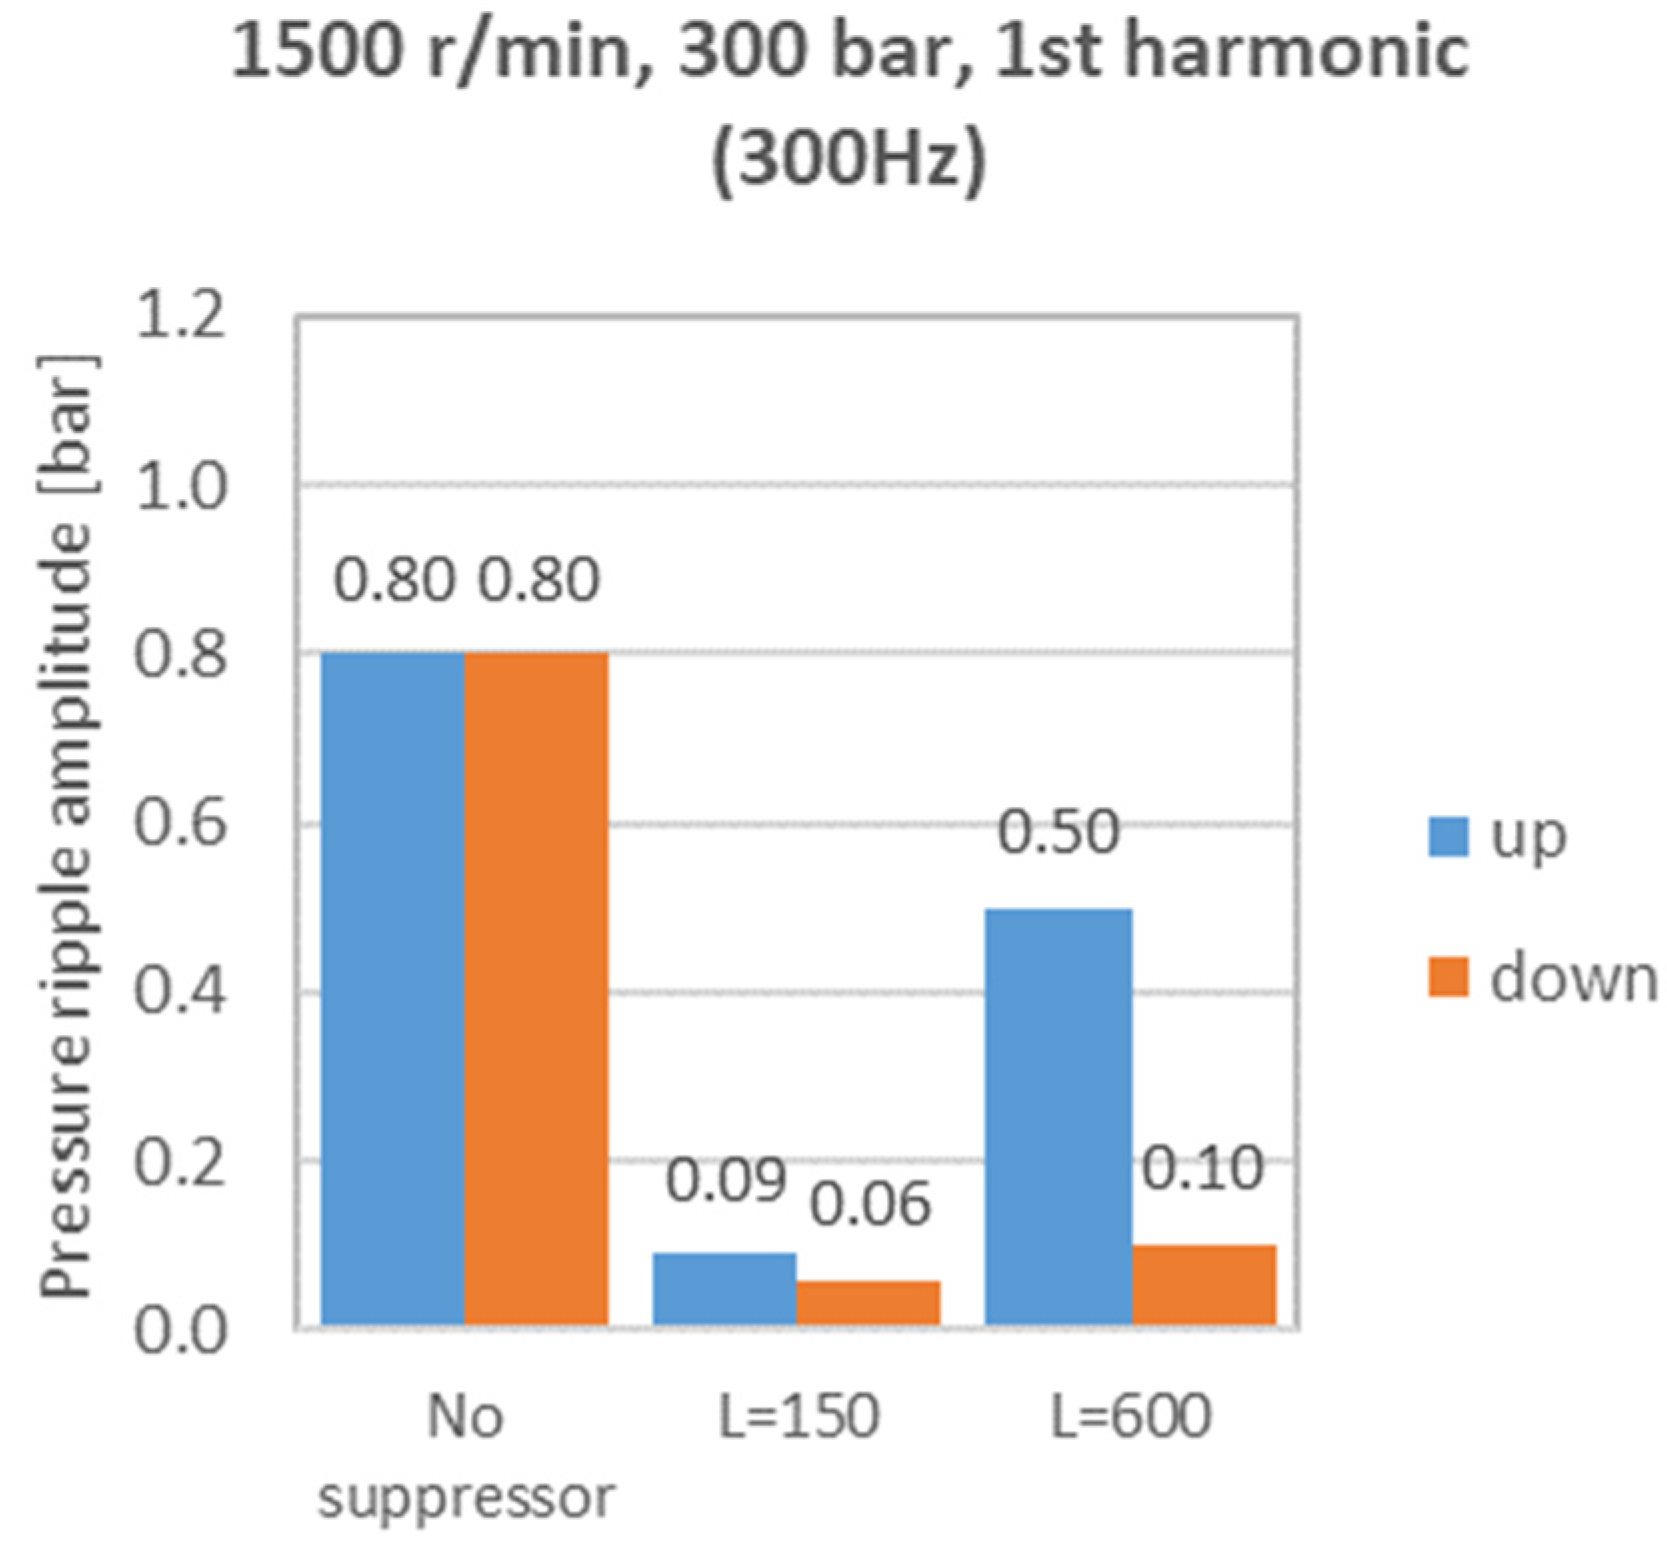
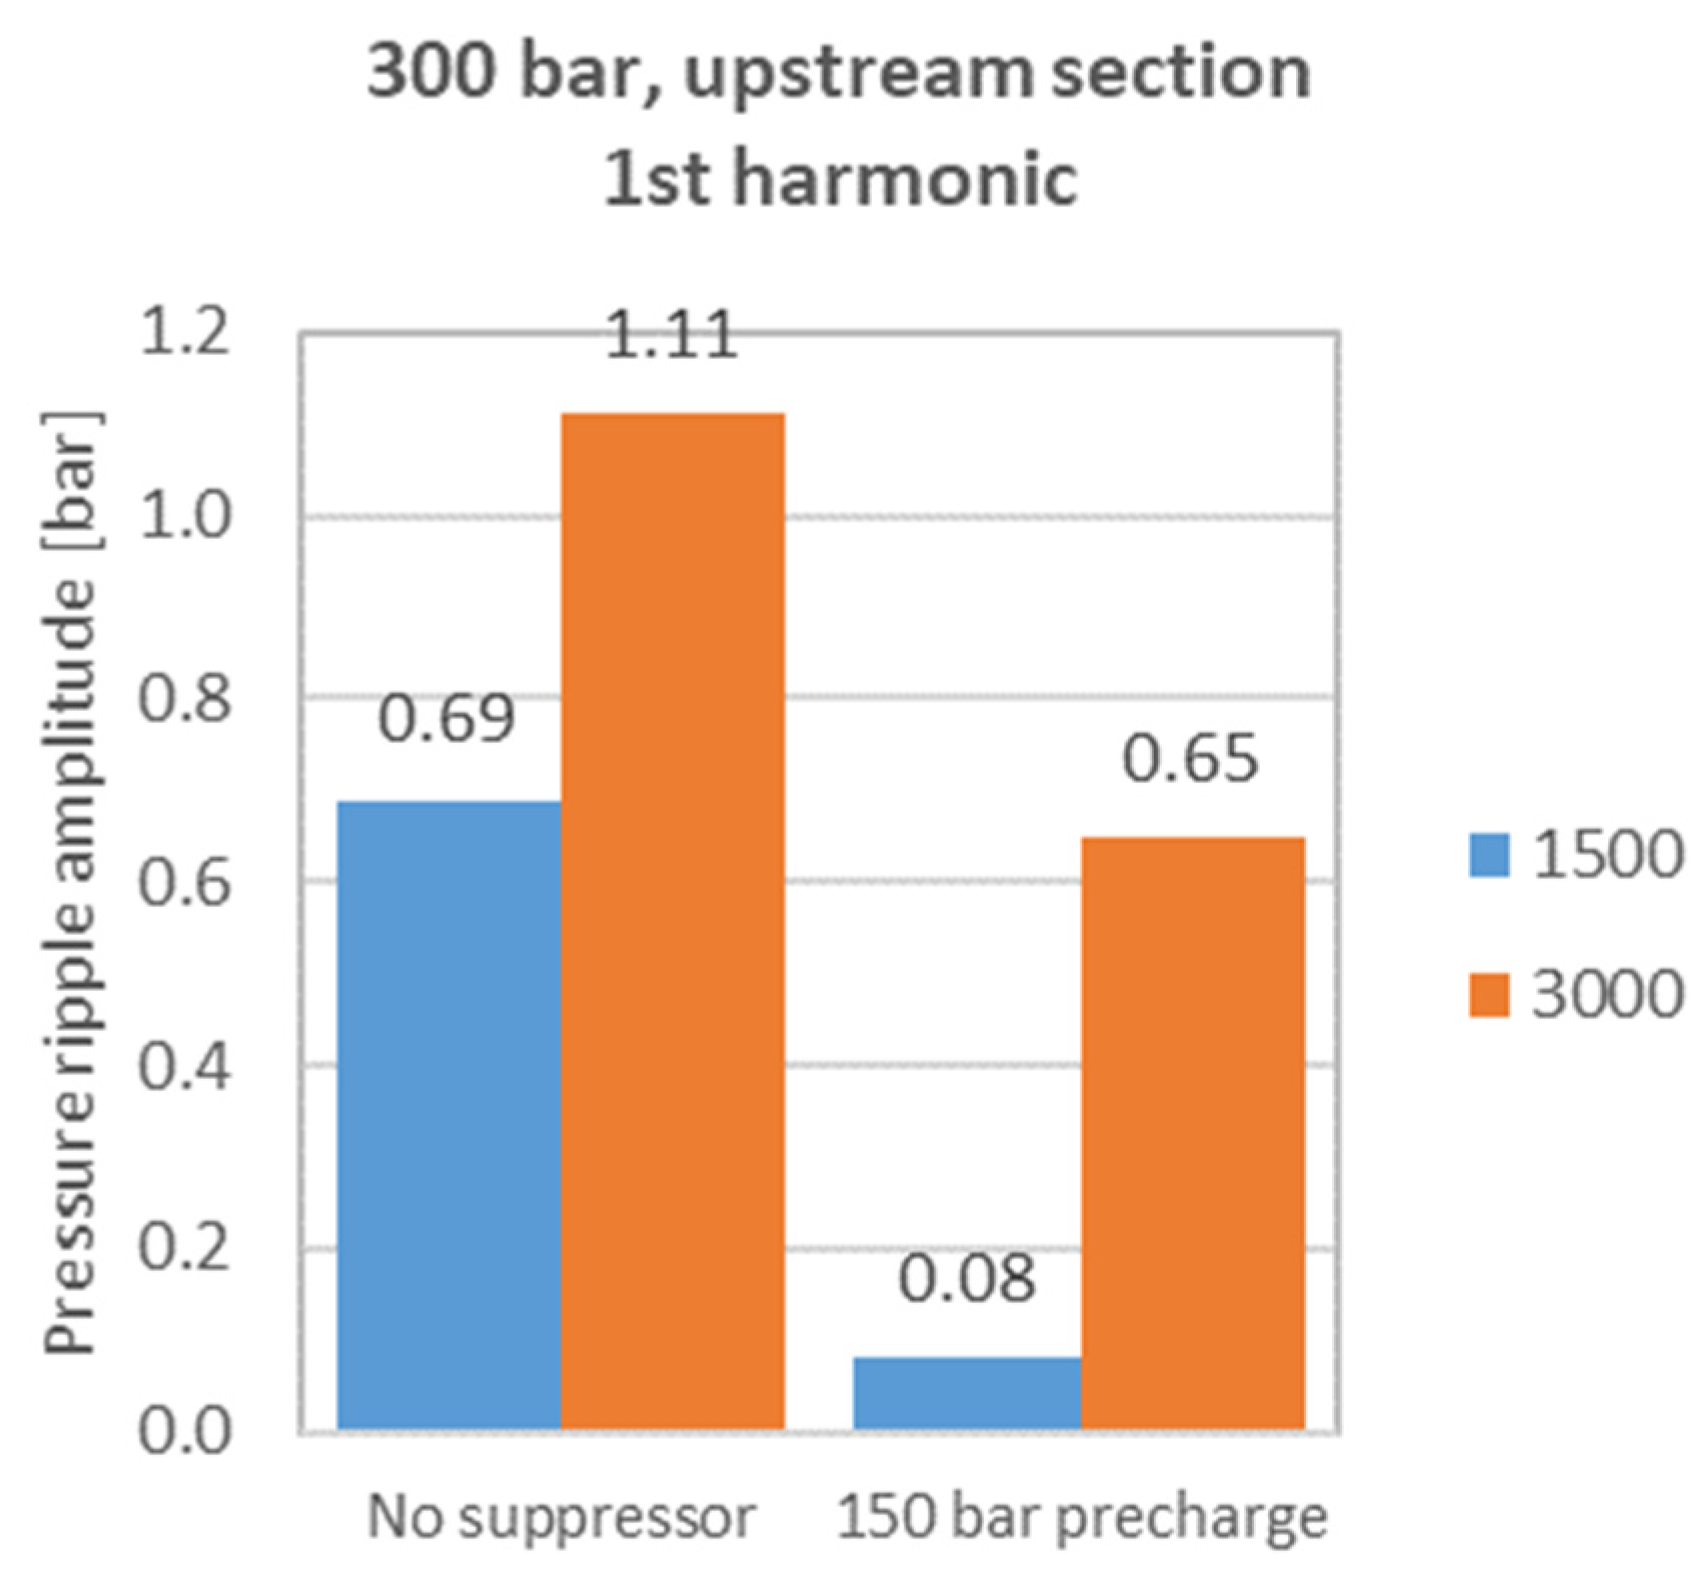
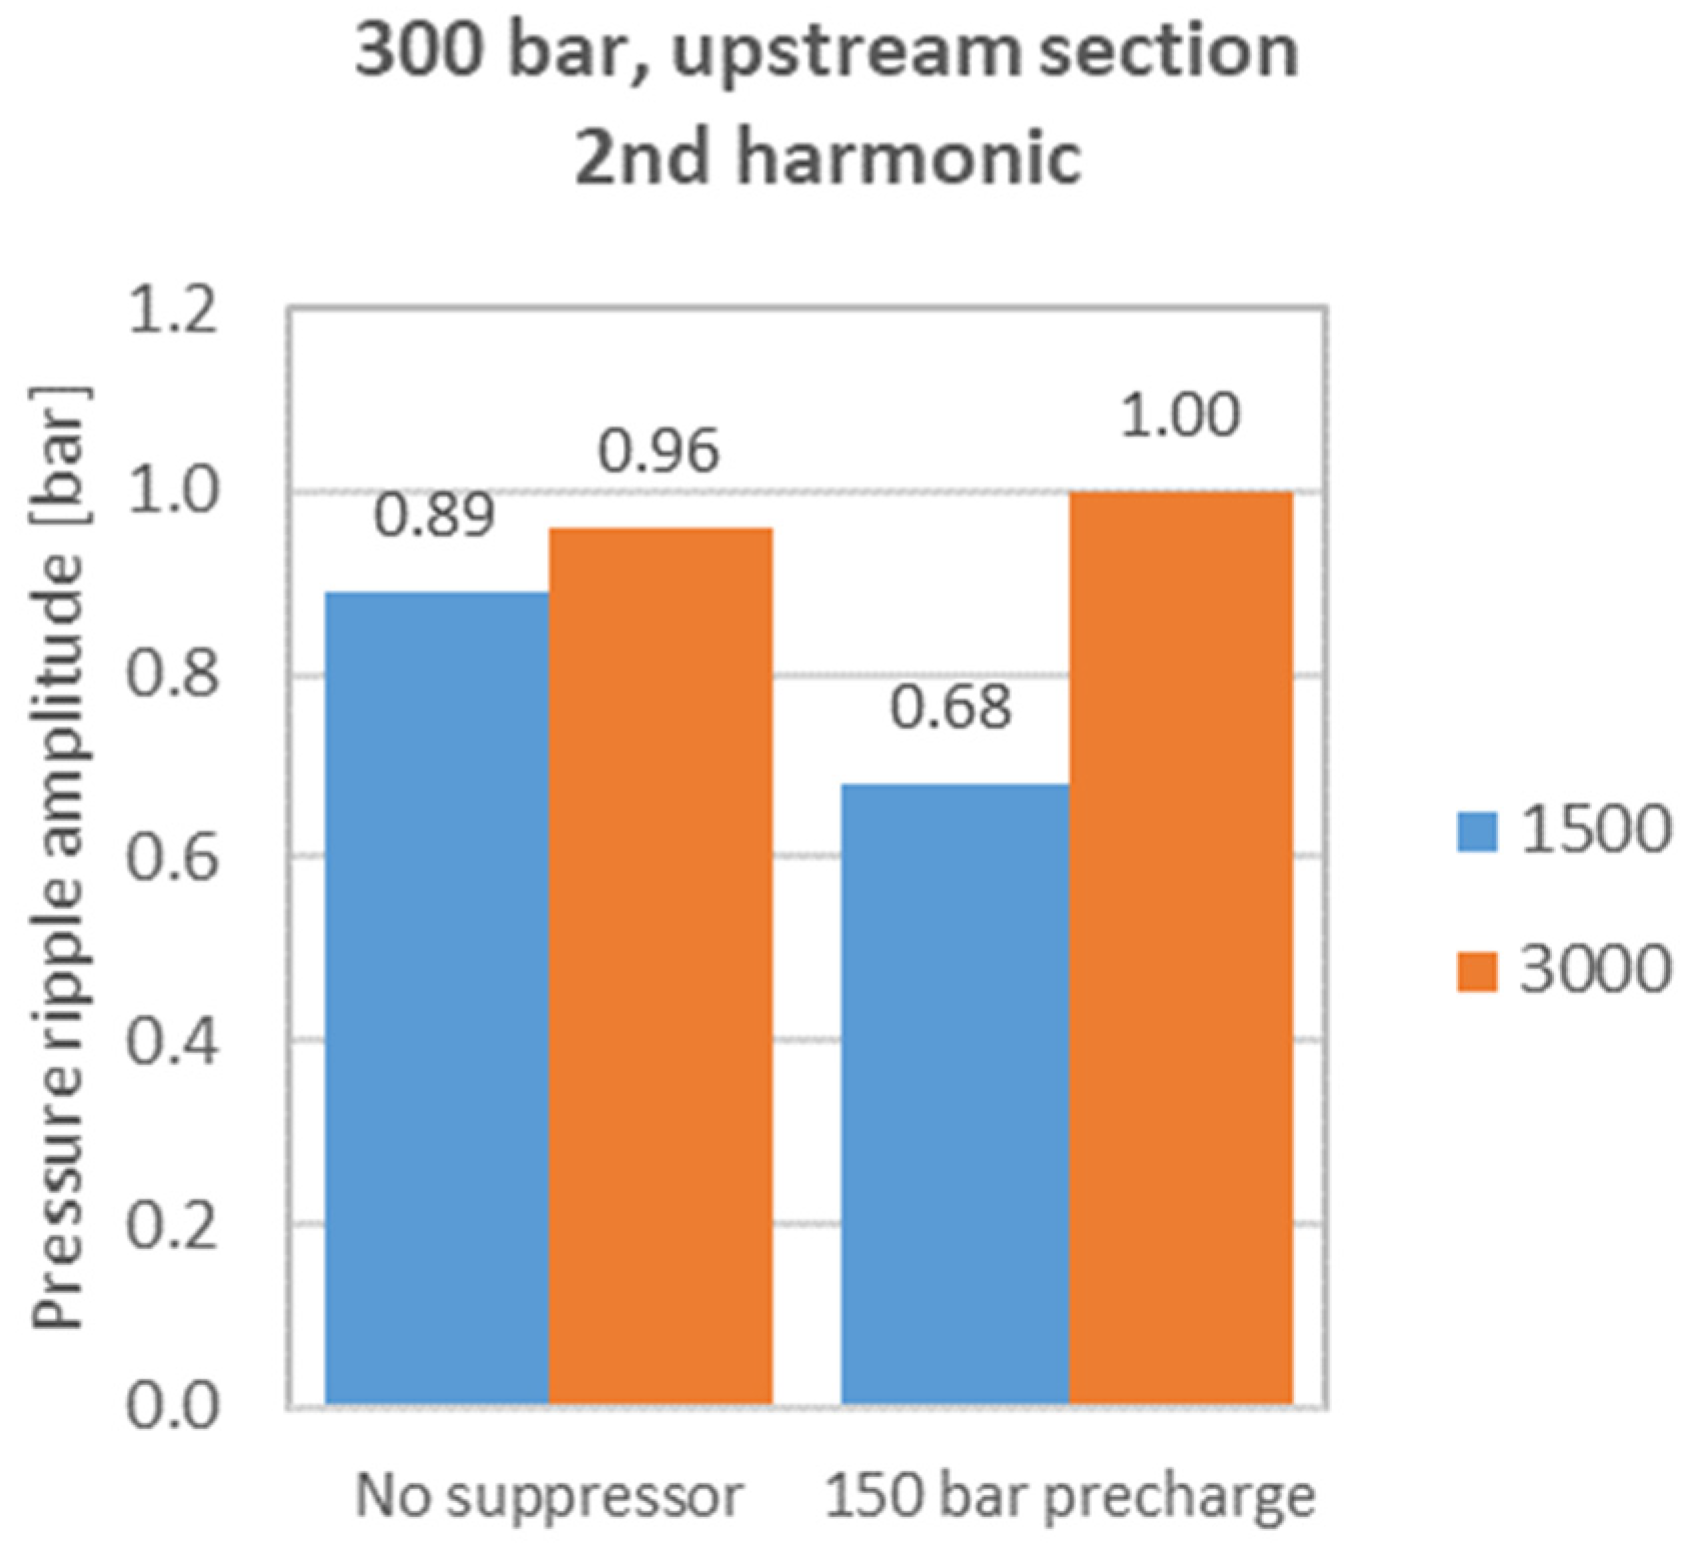
Focusing on the upstream pressure, which represents the pressure between the pump and the damper, the situation is different and needs to be investigated. The first harmonic of the pressure ripple amplitude increases with the speed (spanning from 500 r/min to 6000 r/min), changing the value from 0.08 to 0.9 (Figure 17 and Figure 25), when the damper is placed close to the pump at L = 150 mm; at the same conditions, the second harmonic value changes from 0.02 to 0.7 (Figure 18 and Figure 26). These values are increased more than tenfold, but they remain lower with respect to the case without the suppressor. The situation becomes critical when the damper is placed further from the pump, but at a reasonable distance equal to 600 mm; in this case, the first harmonic presents higher values from 0.5 to 2.0 and the second harmonic presents values from 0.10 to 1.6. It is relevant to point out that at higher speeds, from 3000 to 6000 r/min, the pressure ripple at the inlet of the damper is more relevant with respect to the pressure ripple inside the pipe without a suppressor (see Figure 21, Figure 22, Figure 23, Figure 24, Figure 25 and Figure 26). These figures report values of the amplitude for both the first and second harmonics that are higher than the corresponding amplitudes without a suppressor. This trend could be partially verified by the experimental data that were collected at the maximum speed of 3000 r/min, L ≅ 150 mm. By the analysis of Figure 27 and Figure 28 limited to the case at 300 bar, 150 bar gas precharge and two different speeds of 1500 and 3000 r/min, it is evident that the pressure ripple amplitude of the 2nd harmonic tends to increase with the rotational speed, reaching values similar to those without a suppressor; the 1st harmonic shows a strong reduction at 1500 r/min of about one-tenth with respect to the case without a suppressor, while the reduction is less than half at 3000 r/min.
The increment of the pressure amplitude at the inlet of the damper can be explained considering that the pipe is subject to the wave propagation phenomenon. In fact, inside the suppressor, the sound speed is reduced, and this involves the fact that the approaching wave, travelling at a higher speed, is reflected with the same sign, because the damper acts as a section restriction with respect to the flow direction. The reflected wave moves with the same sign, adding a contribution to the incident wave. This phenomenon is correlated with the pressure wavelength and can be affected by the length of the pipe and the frequency of the incident wave, the latter depending on the pump speed.

6. Conclusions

This paper explores the hydraulic bladder suppressor performance extended to its positioning along the delivery pipe. A comprehensive series of experiments was conducted, entailing the installation of the suppressor within the delivery pipe of a gear pump. Notably, the suppressor exhibits a remarkable capacity for mitigating flow ripple, primarily achieved through a pronounced reduction in the harmonic components of the experimental pressure ripple in a section downstream of the suppressor. Particularly, this reduction is notable on both the first and second harmonics, which constitute the primary signal content within the pressure ripple. The model presented in this paper is an improvement of a previous model with the aim to replicate the suppressor behaviour also considering its position in the delivery pipe relative to the pump. The developed model employs a one-dimensional framework, where fluid motion equations are integrated across both space and time to recreate the instantaneous pressure and velocity profiles of the flow at each spatial increment within the suppressor, as well as in the pipe before and after the suppressor. Inside the suppressor, the interactions with the bladder were reproduced by modelling a variable section area for fluid passage that influences the speed of sound and wave propagation within the suppressor. The developed and validated one-dimensional model of the entire pipe permitted the investigation of the effect of the position of the damper with respect to the pump at different pump speeds, an aspect often neglected in the literature.

Author Contributions

Conceptualisation, P.C. and M.R.; methodology, P.C. and C.M.V.; software, P.C.; validation, P.C. and C.M.V.; writing—original draft preparation, P.C., H.G.M. and C.M.V.; writing—review and editing, P.C., H.G.M. and M.R.; supervision, P.C.; project administration, P.C. All authors have read and agreed to the published version of the manuscript.

Funding

This research received no external funding.

Data Availability Statement

The original contributions presented in the study are included in the article, further inquiries can be directed to the corresponding author.

Acknowledgments

The authors would like to acknowledge the active support of this research by Casappa S.p.A., Parma, Italy.

Conflicts of Interest

The authors declare no conflicts of interest.

References

  1. Harrison, A.M.; Edge, K. Reduction of axial piston pump pressure ripple. Proc. Inst. Mech. Eng. Part I J. Syst. Control Eng. 2000, 214, 53–64. [Google Scholar] [CrossRef]
  2. Johansson, A.; Olvander, J.; Palmberg, J.-O. Experimental verification of cross-angle for noise reduction in hydraulic piston pumps. Proc. Inst. Mech. Eng. Part I J. Syst. Control Eng. 2007, 221, 321–330. [Google Scholar] [CrossRef]
  3. Corvaglia, A.; Rundo, M.; Casoli, P.; Lettini, A. Evaluation of tooth space pressure and incomplete filling in external gear pumps by means of three-dimensional CFD simulations. Energies 2021, 14, 342. [Google Scholar] [CrossRef]
  4. Corvaglia, A.; Ferrari, A.; Rundo, M.; Vento, O. Three-dimensional model of an external gear pump with an experimental evaluation of the flow ripple. Proc. Inst. Mech. Eng. Part C J. Mech. Eng. Sci. 2021, 235, 1097–1105. [Google Scholar] [CrossRef]
  5. Casoli, P.; Pastori, M.; Scolari, F.; Rundo, M. Active pressure ripple control in axial piston pumps through high-frequency swash plate oscillations—A theoretical analysis. Energies 2019, 12, 1377. [Google Scholar] [CrossRef]
  6. Hagstrom, N.; Harens, M.; Chatterjee, A.; Creswick, M. Piezoelectric actuation to reduce pump flow ripple. In Proceedings of the ASME/BATH 2019 Symposium on Fluid Power and Motion Control 2019 FPMC, Sarasota, FL, USA, 7–9 October 2019. [Google Scholar]
  7. Casoli, P.; Vescovini, C.M.; Scolari, F.; Rundo, M. Theoretical Analysis of Active Flow Ripple Control in Positive Displacement Pumps. Energies 2022, 15, 4703. [Google Scholar] [CrossRef]
  8. Pan, M.; Ding, B.; Yuan, C.; Zou, J.; Yang, H. Novel Integrated Control of Fluid-Borne Noise in Hydraulic Systems. In Proceedings of the BATH/ASME 2018 Symposium on Fluid Power and Motion Control FPMC 2018, Bath, UK, 12–14 September 2018. [Google Scholar]
  9. Shang, Y.; Tang, H.; Sun, H.; Guan, C.; Wu, S.; Xu, Y.; Jiao, Z. A novel hydraulic pulsation reduction component based on discharge and suction self-oscillation: Principle, design and experiment. Proc. Inst. Mech. Eng. Part I J. Syst. Control Eng. 2020, 234, 433–445. [Google Scholar] [CrossRef]
  10. Rabie, M.G. On the application of oleopneumatic accumulators for the protection of hydraulic transmission lines against water hammer—A theoretical study. Int. J. Fluid Power 2007, 8, 39–49. [Google Scholar] [CrossRef]
  11. Yokota, S.; Somada, H.; Yamaguchi, H. Study on an active accumulator. JSME Int. J. 1996, 39, 119–124. [Google Scholar] [CrossRef]
  12. Marek, A.K.; Gruber, E.R.; Cunefare, K.A. Linear multimodal model for a pressurized gas bladder style hydraulic noise suppressor. Int. J. Fluid Power 2013, 14, 5–16. [Google Scholar] [CrossRef]
  13. Gao, P.; Yu, T.; Zhang, Y.; Wang, J.; Zhai, J. Vibration analysis and control technologies of hydraulic pipeline system in aircraft: A review. Chin. J. Aeronaut. 2021, 34, 83–114. [Google Scholar] [CrossRef]
  14. He, S.; Zi, Y.; Wang, W. Research of resonators based on elastic sheet/membrane elements for hydraulic system. J. Sound Vib. 2015, 355, 54–65. [Google Scholar] [CrossRef]
  15. Gruber, E.R.; Cunefare, K.A.; Danzl, P.W.; Marek, K.A.; Beyer, M.A. Optimization of Single and Dual Suppressors Under Varying Load and Pressure Conditions. Int. J. Fluid Power 2013, 14, 27–34. [Google Scholar] [CrossRef]
  16. Xi, Y.; Li, B.R.; Gao, L.L.; Tang, T.F.; Liao, H.L. Acoustic attenuation performance prediction and analysis of bladder style hydraulic noise suppressors. Appl. Acoust. 2018, 134, 131–137. [Google Scholar] [CrossRef]
  17. Hoppen, H.; Langfeldt, F.; Gleine, W.; Von Estorff, O. Helmholtz resonator with two resonance frequencies by coupling with a mechanical resonator. J. Sound Vib. 2023, 559, 117747. [Google Scholar] [CrossRef]
  18. Casoli, P.; Vescovini, C.M.; Rundo, M. One-Dimensional fluid dynamic modelling of a gas bladder hydraulic damper for pump flow pulsation. Energies 2023, 16, 3368. [Google Scholar] [CrossRef]
  19. Guo, T.; Han, X.; Minav, T.; Fu, Y. A Preliminary Design Method of High-Power Electro-Hydrostatic Actuators Considering Design Robustness. Actuators 2022, 11, 308. [Google Scholar] [CrossRef]
  20. Qu, S.; Zappaterra, F.; Vacca, A.; Busquets, E. An electrified boom actuation system with energy regeneration capability driven by a novel electro-hydraulic unit. Energy Convers. Manag. 2023, 293, 117443. [Google Scholar] [CrossRef]
  21. Zielke, W. Frequency-dependent friction in transient pipe flow. J. Basic Eng. 1968, 90, 109–115. [Google Scholar] [CrossRef]
  22. Hoffman, J.D. Numerical Methods for Engineers and Scientists; Mc Graw Hill: New York, NY, USA, 1992. [Google Scholar]
Figure 1. Suppressor on the pump delivery line.
Energies 17 01610 g001
Figure 2. ISO scheme of the circuit layout.
Energies 17 01610 g002
Figure 3. Pump and suppressor at the test bench.
Energies 17 01610 g003
Figure 4. Sound speed vs. time in an intermediate section of the suppressor.
Energies 17 01610 g004
Figure 5. First harmonic, 200 bar, n = 500 r/min.
Energies 17 01610 g005
Figure 6. Second harmonic, 200 bar, n = 500 r/min.
Energies 17 01610 g006
Figure 7. First harmonic, 200 bar, n = 1500 r/min.
Energies 17 01610 g007
Figure 8. Second harmonic, 200 bar, n = 1500 r/min.
Energies 17 01610 g008
Figure 9. First harmonic, 200 bar, n = 3000 r/min.
Energies 17 01610 g009
Figure 10. Second harmonic, 200 bar, n = 3000 r/min.
Energies 17 01610 g010
Figure 11. First harmonic, 300 bar, n = 500 r/min.
Energies 17 01610 g011
Figure 12. Second harmonic, 300 bar, n = 500 r/min.
Energies 17 01610 g012
Figure 13. First harmonic, 300 bar, n = 1500 r/min.
Energies 17 01610 g013
Figure 14. Second harmonic, 300 bar, n = 1500 r/min.
Energies 17 01610 g014
Figure 15. First harmonic, 300 bar, n = 3000 r/min.
Energies 17 01610 g015
Figure 16. Second harmonic, 3000 bar, n = 3000 r/min.
Energies 17 01610 g016
Figure 17. Pressure amplitude at different pipe lengths, First harmonic, 500 r/min.
Energies 17 01610 g017
Figure 18. Pressure amplitude at different pipe lengths, Second harmonic, 500 r/min.
Energies 17 01610 g018
Figure 19. Pressure amplitude at different pipe lengths, First harmonic, 1500 r/min.
Energies 17 01610 g019
Figure 20. Pressure amplitude at different pipe lengths, Second harmonic, 1500 r/min.
Energies 17 01610 g020
Figure 21. Pressure amplitude at different pipe lengths, First harmonic, 3000 r/min.
Energies 17 01610 g021
Figure 22. Pressure amplitude at different pipe lengths, Second harmonic, 3000 r/min.
Energies 17 01610 g022
Figure 23. Pressure amplitude at different pipe lengths, First harmonic, 5000 r/min.
Energies 17 01610 g023
Figure 24. Pressure amplitude at different pipe lengths, Second harmonic, 5000 r/min.
Energies 17 01610 g024
Figure 25. Pressure amplitude at different pipe lengths, First harmonic, 6000 r/min.
Energies 17 01610 g025
Figure 26. Pressure amplitude at different pipe lengths, Second harmonic, 6000 r/min.
Energies 17 01610 g026
Figure 27. Experimental pressure amplitude at different pump speeds—First harmonic.
Energies 17 01610 g027
Figure 28. Experimental pressure amplitude at different pump speeds—Second harmonic.
Energies 17 01610 g028
Table 1. Pump delivery pressure [bar] at different conditions.
Pump speed [r/min]500 1500 3000
Gas pressure precharge 100 bar200 200 200
300 300 300
Gas pressure precharge 150 bar200 200 200
300 300 300
Disclaimer/Publisher’s Note: The statements, opinions and data contained in all publications are solely those of the individual author(s) and contributor(s) and not of MDPI and/or the editor(s). MDPI and/or the editor(s) disclaim responsibility for any injury to people or property resulting from any ideas, methods, instructions or products referred to in the content.