Article

Renewable Energy Proliferation and the New Local Energy Community Paradigm: Analysis of a Case Study in Italy

1
CREAT, Università degli Studi e-Campus, Via Isimbardi 10, 22060 Novedrate, Italy
2
DIISM, Università Politecnica delle Marche, Via Brecce Biance 12, 60110 Ancona, Italy
*
Author to whom correspondence should be addressed.
Energies 2024, 17(7), 1599; https://doi.org/10.3390/en17071599
Submission received: 26 February 2024 / Revised: 12 March 2024 / Accepted: 19 March 2024 / Published: 27 March 2024
(This article belongs to the Section F2: Distributed Energy System)

Abstract

:
Renewable energy communities (RECs) have been gaining momentum around the world, as a way to promote sustainable development and combat climate change. These communities are typically composed of individuals, businesses, and organizations that come together to invest in and promote the use of renewable energy sources, such as solar, wind, and hydraulic power. This article focuses on the benefits that renewable energy communities bring to a territory through the diffusion of renewable energy systems, tackling different issues like local depopulation, increasing energy prices, and a lack of jobs, while reducing greenhouse gas emissions and improving air quality. The novelty of this article lies in the results from the first-of-its-kind national call within the Next Appennino program, part of the National Complementary plan, aimed at the formation and proliferation of RECs in the area severed by the 2009 and 2016 earthquakes in Italy, as a way to add social, environmental, and sustainable value to the reconstruction of this territory. The data refer to the municipality of Castelraimondo and Unione Montana dei Monti Azzurri (a consortium of mountain municipalities), both located in the Marche region. Analysis of the consumer and prosumer energy needs, as well as the quantification of the exploitable production from the new renewable generators installed, showed that a total of 6.134 GWh/year can be shared by the community.

1. Introduction

It is undeniable that one of the most concerning issues that links research, industry, authorities, and citizens is climate change. In order to avoid the undesired warming scenarios foreseen in the IPCC report [1], mitigations such as renewable and sustainable energy production systems are increasingly being adopted around the world. The European Union has set the ambitious goal of becoming the first climate-neutral continent by 2050 and, to achieve this, it has undertaken several initiatives in favor of the transition toward a distributed generation and renewable energy-based system. However, the smart grid paradigm has raised more interest in the proliferation and control of small renewable power systems compared to centralized production plants. In this way, it is possible to take direct action at a closer level to the energy consumers. Further, demand-side management solutions can be used as well, enabling the former to be an active and dynamic participant in the energy market. In this context, the role of the citizen is also evolving, as they are being called upon to transition from being passive consumers to active participants in the energy transition. Thus, load shifting, peak shaving, and energy storage can strengthen all renewable assets and aid the development of a reliable and flexible energy network. In this context, the formation of RECs is a concept that is developing on a global level at different paces. Similar to the Citizen Energy Community (CEC), defined through Directives 2018/2001 and 2019/944 that are included in the “Clean Energy for all Europeans” package (CEP) [2], an REC is a cluster of different actors that can be either energy producers or simple consumers, without distinctions between citizens, companies, or public authorities. Members can engage in activities such as the production, distribution, supply, sharing, storage, and sale of the energy produced, effectively participating in the energy market. In practice, an REC refers to a system consisting of small or medium-scale energy production facilities, coupled with short-term storage systems, associated with smart grids and demand management technologies. The role of the citizen can positively affect the balance either by generating energy (active support) and/or by modifying their load profile (passive support) for the most optimal energy consumption [3,4,5]. Since it is strictly connected to renewable energy proliferation, RECs cannot be considered as a novel concept at the European level, but many countries have experienced different paces of development in regard to the technical and regulatory background. Until 2018, the fate of RECs depended on the national sensibilities of EU member states, in relation to their history and culture. The work of the European Commission, through two directives in the CEP package, aimed at innovating the electricity market, seeks to establish a common legislative framework for the entire Union [6]. After the publication of the Renewable Energy Directive 2018/2001/EU, alias RED II [7], a formal definition of RECs has been given as a legal entity based on open and voluntary participation and effectively controlled by shareholders or members (individuals, small and medium-sized enterprises, and local authorities), but that is autonomous from its members, located near renewable energy production facilities, and owned by the community. The goal of an REC is not limited to the economic benefits, such as a mere reduction in electricity costs, but also aims to increase environmental protection due to the capillary diffusion of renewable systems [8]. Furthermore, RECs can have social benefits, when there are areas with energy deficits or poorness [9]. Despite the important step taken by the EU, there are still major concerns related to the national law framework of the member states (MS). The progression in relation to RECs is still slow from a regulatory point of view. As reported in a study by Lowitzsch et al. [6], an incubating framework must be set to aid prosumer mechanisms and innovative governance models. The authors showed that existing design best practices can be used to develop REC projects, but more support from national stakeholders is required if the complete distribution of such communities is sought. The architecture of this new grid was also discussed by Wu et al. [10], who explained the importance of the security, flexibility, and reliability required to reach the full potential of RECs. In this context, member states have started to work on the regulatory aspects that will support REC proliferation. The Italian Energy Authority (ARERA) has provided a new temporary definition for economic support for projects based on renewable energy sharing. As an evolution of net metering [11], Law Decree n. 162/2019 Milleproroghe [12], defined the premium incentive as 110 EUR/MWh, plus 8.22 EUR/MWh for grid reimbursement, guaranteed for 20 years, and taking into account the shared energy quota. The former refers to the minimum value, measured on an hourly basis, of the difference between the energy injected into the power grid and the energy consumed by the recipients in the REC system. During the initial design phase, specific restrictions were imposed on the size of renewable plants (limited to 200 kW) and the perimeter of the REC system, limited to MV/LV substations. However, with the introduction of the more recent Law Decree n. 199/2021, these limitations have been expanded to allow for a maximum plant size of 1 MW per installation, and the actors can now be located within the wider range of primary electricity substations (HV/MV). This regulatory change enabled greater flexibility and scalability in regard to renewable energy generation and distribution within the REC framework, but despite the relative simplicity of the regulations, the practical aspects remained unsolved. Just recently, the Italian energy provider worked on a map of the primary cabins available to the public, according to the recent ARERA Resolution n. 727/2022/R/EEL [13], but a detailed discussion of the incentives in light of state funding or related to renewable thermal energy, and general guidelines for appropriate revenue splitting between REC actors, are still ongoing practical aspects that need addressing. The Decree by the Minister of Environment and Energy Security of 7 December 2023, No. 414 (also known as the CACER Decree), in force since 24 January 2024, defined the criteria and modalities for the granting of PNRR contributions. The latest ARERA Resolution n. 15/2024/R/EEL [14] included amendments to the integrated text on diffuse self-consumption and verification of the technical rules. The CACER Decree has been positively endorsed. Therefore, two methods to promote the national development of energy communities are reported. The first is a non-repayable contribution (up to 40% of eligible costs) for RECs, financed by the PNRR, for energy communities whose plants are built in municipalities with less than 5000 inhabitants (to support the development of an additional installation of renewable systems up to 2 GW). The second is an incentive tariff on renewable energy produced and shared throughout the national territory (national grid). The possibility to take advantage of both contributions seems to be allowed. The endorsement of the contributions for small municipalities emphasizes the importance of the social aspects of the proposed act. Indeed, the development of energy communities in small towns and villages could help to support the local economy. A higher level of energy independence and reliability for the local energy grid, coupled with the potentially lower price of the energy, could boost the renaissance of small municipalities that are notably suffering from depopulation [15]. It is worth noting that, from a research-based point of view, there are several studies investigating both the technical and management sides in different scenarios. For instance, Raimondi and Spazzafumo [16] investigated the integration of hydrogen as a power-to-power energy vector in an REC, fed with hybrid photovoltaic and wind systems. The autarchy (degree of independence from the energy grid) of the community can be increased by more than 20% with hydrogen, but the subsidies are not enough to cover the costs needed to build and run the systems. A simpler configuration involving photovoltaics and electrochemical energy storage was analyzed by Cielo et al. [12], with a multicriteria optimization methodology aimed at maximizing the consumption of the renewable energy produced. By using the mixed integer linear programming (MILP) scheme, the test case REC can achieve an internal rate of return (IRR) of 11–14% and a total carbon emissions reduction of up to 45% under different business models. Another set of REC configurations was designed and optimized by [17], always using the MILP algorithm to pursue the best environmental and economic performance. The study included storage units, photovoltaic (PV) systems, combined heat and power plants (CHPs), thermal solar collectors (TCPs), and a heterogeneous composition of residential and commercial consumers. The authors deduced that the total cost of electricity (TCOE) can be significantly reduced if demand-side management (DSM) policies are pursued that follow the daily PV production trend. As provided by Mäkivierikko et al. [4], simple mobile applications with in-time monitoring devices can increase the awareness of consumers, which reflects the whole community. Also, Fioriti et al. [18] clarified that an optimized REC design must provide a fair revenue for each user, and that appropriate exit clauses should be defined to guarantee community resilience. The analyses of 10 REC users showed that the presence of an aggregator or an energy service company (ESCO) can provide a cost reduction of 16% and improve self-consumption by 35–51%, as highlighted by a reference case. It is not an easy task, the definition of a methodology for the fair allocation of revenue between REC users. For instance, Fina et al. [19] proposed two different approaches for assessing the financial benefits of RECs, showing that the dynamic allocation of revenues is preferable to static allocation, even if the former can sustain the community. Volpato et al. [20] discussed that prosumer demand is also a crucial complementarity factor for economic performance, beyond the other general guidelines reported by other studies. Other sophisticated methodologies, such as game theory models [21], have been used to prioritize the individual benefits and avoid REC destabilization. Other studies have investigated the link between RECs and domestic hot water (DH) demand. The work by Masip et al. [22] was centered upon a community of 150 residential buildings connected to a PV system and heat pumps. Again, it was shown that consistent emissions savings (up to 85% for thermal demand and 23% related to electricity) can be achieved. Moreover, some papers have addressed the impact of RECs on the power grid from a broader perspective. Backe et al. [23] answered the question of how the European electricity and heating system would be affected by medium-scale RECs. These communities can aid the rate of development of the green transition by decreasing the cost, but the handling of RECs could be different if European objectives are prioritized contrary to self-consumption. However, the outcome of a social media study conducted by Caratù et al. [24] demonstrated that there is a distinct dearth of interest and awareness among practitioners regarding fundamental components of the energy system or DSM actions. Furthermore, the engagement by ordinary citizens on the subject remains largely unaddressed. This, in unison with the delayed promulgation of a definitive legislative framework for RECs, forms the basis of the continued research on REC proliferation.
Many areas in the center of Italy, especially the Marche and Abruzzo regions, were severely destroyed by two earthquakes, in 2009 in “L’Aquila” and in 2016 in “Amatrice”. More than 600 casualties were registered overall. An extraordinary commissioner was nominated to pursue the fastest and most sustainable reconstruction possible, which is still ongoing. The interaction with state and local authorities, who wanted to enhance the territory with the triple benefits from RECs, has led to the publication of a call for municipalities to come forward as an aggregator and promote the formation of RECs among citizens and small businesses. Under the Next Appennino program, established by the National Complementary plan, a call, described in detail in the Methodology Section, covers almost every cost envisaged for the power plant’s construction and legal requirements, up to EUR 68 M in total. With the lack of the final REC regulation, the call had the objective of incubating and initializing an REC, in a way similar to the enabling framework proposed by [6]. Different municipalities took part in the tender and proposed an REC project based upon renewable electrical energy from PV and hydropower systems, to be used at the point of delivery (POD) for self-consumption and to be used by the citizens that expressed interest in the REC project.
The scope of the present paper is to report on the benefits brought by the call, in terms of the combined response by the municipalities and their citizens, alone or aggregated into a cluster of municipalities. Then, the methodology of the life cycle assessment (LCA) is applied to address the environmental benefits and burdens of RECs. In fact, there are a few studies in the literature [25] that characterize the intrinsic environmental footprint of RECs, or novel REC design approaches based on the LCA [11]. The LCA is a systematic approach for evaluating the environmental impacts of a product, process, or activity throughout its various stages throughout the entire life cycle, from raw material extraction to disposal [26,27]. The methodology quantifies the input and output of resources, energy, and emissions associated with each stage. The LCA has resulted in valuable insights for sustainable decision-making and can be used for comparisons between different products or processes [28], or to identify areas for improvement for the potential stakeholders of a system or product studied. The implementation of bi-facial photovoltaic (BPV) systems, where possible, is included in the study. BPV systems represent an innovative approach to maximizing the efficiency of solar energy conversion and are a promising technology for advancing renewable energy production. A BPV system generates electricity from direct sunlight radiation and reflected light on the rear side [29]. In this way, increased energy production throughout the year is expected compared to standard mono-facial photovoltaic (MPV) modules [30,31]. The efficiency benefits make them increasingly popular in solar installations, particularly in locations have high-reflective albedo surfaces [32]. A screening, among the total RECs’ MPV systems, is conducted for their substitution with BPV systems, like photovoltaic car shelters (PVS) and flat rooftop PV installations.
In conclusion, the novelties in this paper rely upon the following:
(i)
A description of the first-of-its-kind public call for REC formation in an area where social revitalization is the focal point;
(ii)
A description of the REC project presented to the evaluating commission, based upon the requirements and indications of the proposal;
(iii)
The characterization of the environmental impact of RECs using the LCA methodology, including BPV system installation where possible.
The structure of the paper is as follows: in the Materials and Methods Section, a description of the public call structure, the ranking system, and the mechanisms of the community power generation allowed, are reported. Then, a description of the municipality is given in terms of the most important data. The methodology for the PV system power estimation is given as well, in the same section. In the Results and Discussion Section, the project presented by the municipality, the list of renewable energy plants designed according to the response by citizens, and the total cost foreseen by the project, are reported. Finally, the outcome of the LCA is presented and discussed.

2. Materials and Methods

2.1. Public Call

As aforementioned, the call was granted by the “Piano Nazionale Complementare” (PNC), which put forward EUR 68 M aimed at renewable projects proposed by the 140 municipalities involved in the two earthquakes. In addition to the “Piano Nazionale di Ripresa e Resilienza” (PNRR), this set of investments aids the sustainable energy transition in Italy for the next few years and enables the revitalization of the area. The awarded renewable energy systems can only be owned by the municipality, to cover most of their energy consumption. Since a consistent consumption load is represented by public lighting, it is difficult to cover with simple PV systems; any costs related to battery energy storage (BES) are covered, as well as those related to engineering, procurement, safety, and REC management.
Regarding the balance between production and consumption, a simple methodology was set as a preliminary design phase. For any entity in the REC, an estimation of the energy consumption based on a one-year time frame for the relevant POD was required. Then, the nominal power production should be calculated accordingly to avoid significant variations. Even if this methodology is easier than the one discussed in the literature, an iterative design method was still required for balancing.

2.1.1. Allowable Entities and Community Formation

The minimum number of entities required for an REC start-up is two. If more entities are involved, then a higher score is obtained. The call encouraged all of municipality citizenship, either as an active producer or passive consumers. Moreover, seldom are the available surfaces owned by the municipality enough to cover the energy demand from PV systems, or they are subjected to different urbanistic constraints, limiting the power installation. It was then possible to use private properties, with appropriate public–private partnership contracts, to go beyond these limits. The ownership is still given to the municipality. Figure 1 summarizes the former concepts. Another interesting aspect is that the association of more than two public entities is allowed under specific circumstances. In this way, the limit of the HV/MV primary cabins can be further extended, resulting in bigger RECs.

2.1.2. Ranking System

The call was designed to maximize the participation of the local community, together with their municipality. For this reason, the score criterion was focused on the total number of power plants instead of the total power capacity installed. For instance, the same points were given if one hydropower plant or one PV system was presented. A reduction in the plant size is counterbalanced by the better capillary distribution of small plants among the municipality’s territory. This is coherent with the economic and social benefits that an REC should bring to a territory. Despite centralized systems offering lower overall installation and management costs, the revenues will not be shared among the community stakeholders. Producers, prosumers, and consumers will be entitled to obtain the benefits from REC subsidies, as well as REC partners, who could obtain revenue from renting their rooftops for PV system installation. Moreover, a penalization score is given if the REC does not achieve an energy balance, especially if the annual demand is lower than 15% of the total energy production. This malus represents the willingness to design a balanced REC, so that the shared energy will be optimized during the operational stage. For the above reasons, it is very important to address the usage behavior among different participants in the REC; this difference is, in fact, a factor that can help the community in reaching the highest rate of shared energy and maximize the amount of incentives. A fundamental aspect in optimizing the use of energy by a renewable energy community is the differential use in terms of time slots during which energy is required by its members. Indeed, private individuals primarily use energy during non-working hours, while businesses use it during working hours. This difference helps balance consumption with production, allowing for the maximization of shared energy (defined as the minimum difference, hour by hour, between the energy produced and the energy consumed by the energy community) and, consequently, the economic income of the community.

2.2. Participating Municipality

2.2.1. Single Municipality

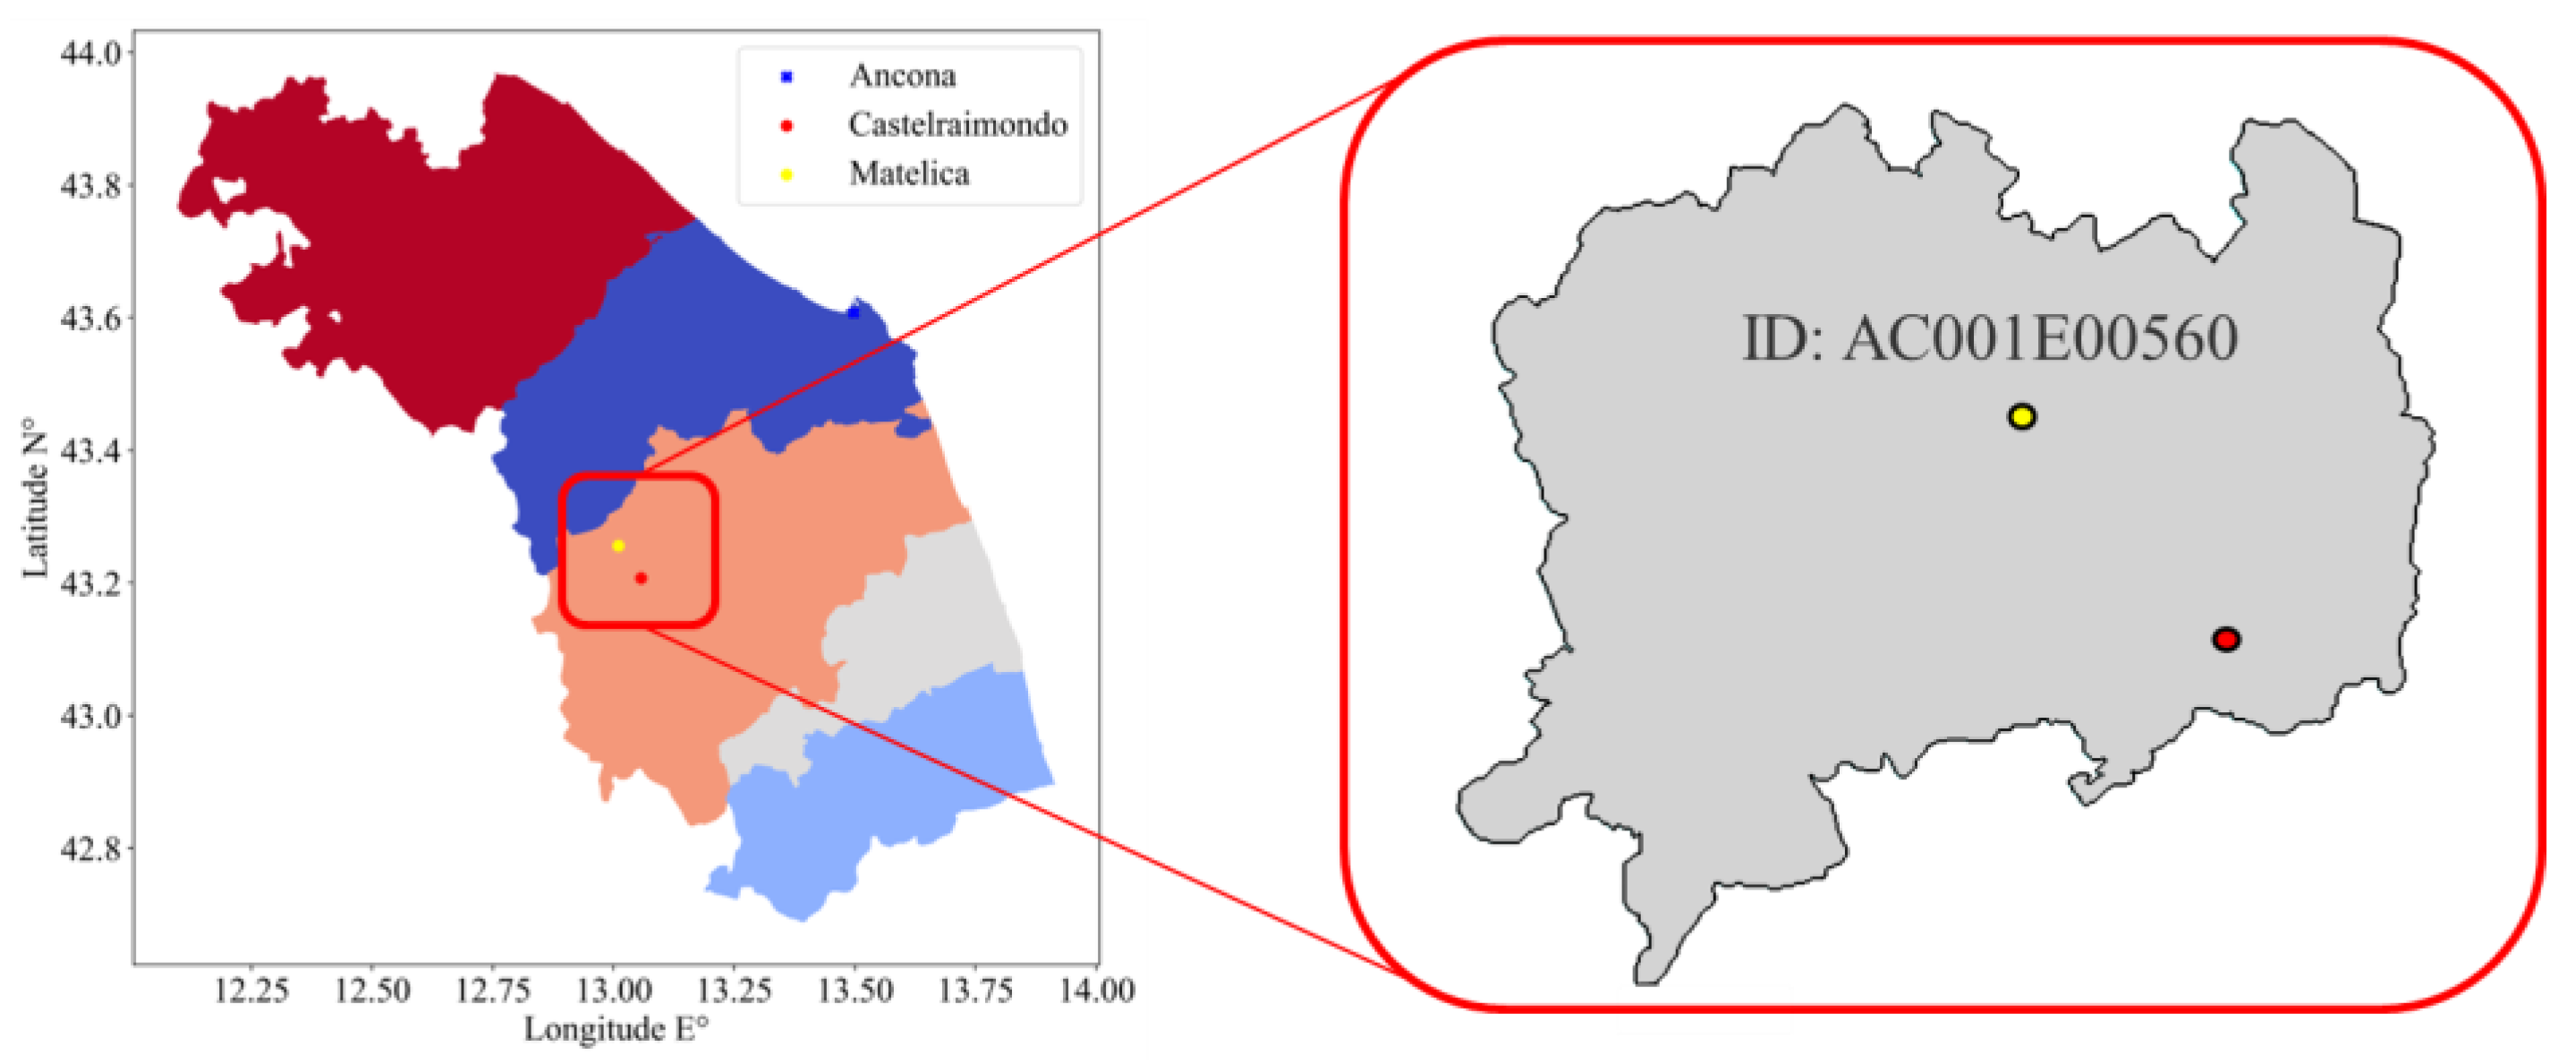
The first REC is based on a single municipality (SM). Castelraimondo has almost 5000 inhabitants and 390 small enterprises. It is located in the Marche region, i.e., in the center of Italy, and the northernmost area was affected by the two earthquakes. The municipality is under primary cabin AC001E00560 (from TIAD [13]), which refers to the main town of Matelica, depicted in yellow in Figure 2. The municipality joined the main town and the surrounding areas to increase the size of the REC and cover the majority of the cabin’s territory.
The energy consumption was assessed by analyzing the invoices from 2014 until 2022. Since several buildings were damaged, a complete history on consumption at every POD was missing. In the end, 58 POD in the municipality were counted. The sum of the average energy consumption is about 443,700 kWh/year, but there is significant variation each year, due to external factors. For the sake of the call, the total energy consumption in 2021 has been used, which was equal to 192,800 kWh. In the same year, the public illumination consumption was around 373,100 kWh; leading to a total energy demand of 565,900 kWh. The survey of the available surfaces owned by the municipality resulted in14 rooftops being deemed suitable for the installation of as many PV systems.
The involvement of the citizens was ensured through different public meetings and discussions. Starting from mere curiosity, the search for REC stakeholders ended in a significant increase in the awareness of citizens about the community. This factor increased the number of PV systems, in addition to the ones envisaged on the municipality-owned rooftop surfaces. The results of the public interactions are reported in Section 3. The design of the PV systems was based on the available surface at each location, the building orientation, the rooftop tilt angle, panel dimension, and local irradiance. The JRC PVGIS tool was used [35], and the PV module data (420 W peak power module type) were taken from current commercial catalogues [36]. Due to practical limitations, the shadow incidence from nearby objects was not assessed in this phase. The measurements were conducted in Google Earth/Google Earth Pro. The costs were assessed according to a specific price list table that accounted for the price inflation due to COVID-19 and the Russia–Ukraine war. In addition to PV systems, the municipality has ownership of the project involving a hydraulic turbine (Ossberger type), which has not yet been realized. Since the adoption of the EU directives that allow the use of all renewable systems, this one has been accounted for in the project. The most relevant data about the hydraulic configuration are reported in Table 1.
The cost includes the expenses related to machinery, generators, transportation, as well as the construction and excavation works necessary to facilitate the installation and integration of the turbine in the watershed.

2.2.2. Cluster of Municipalities

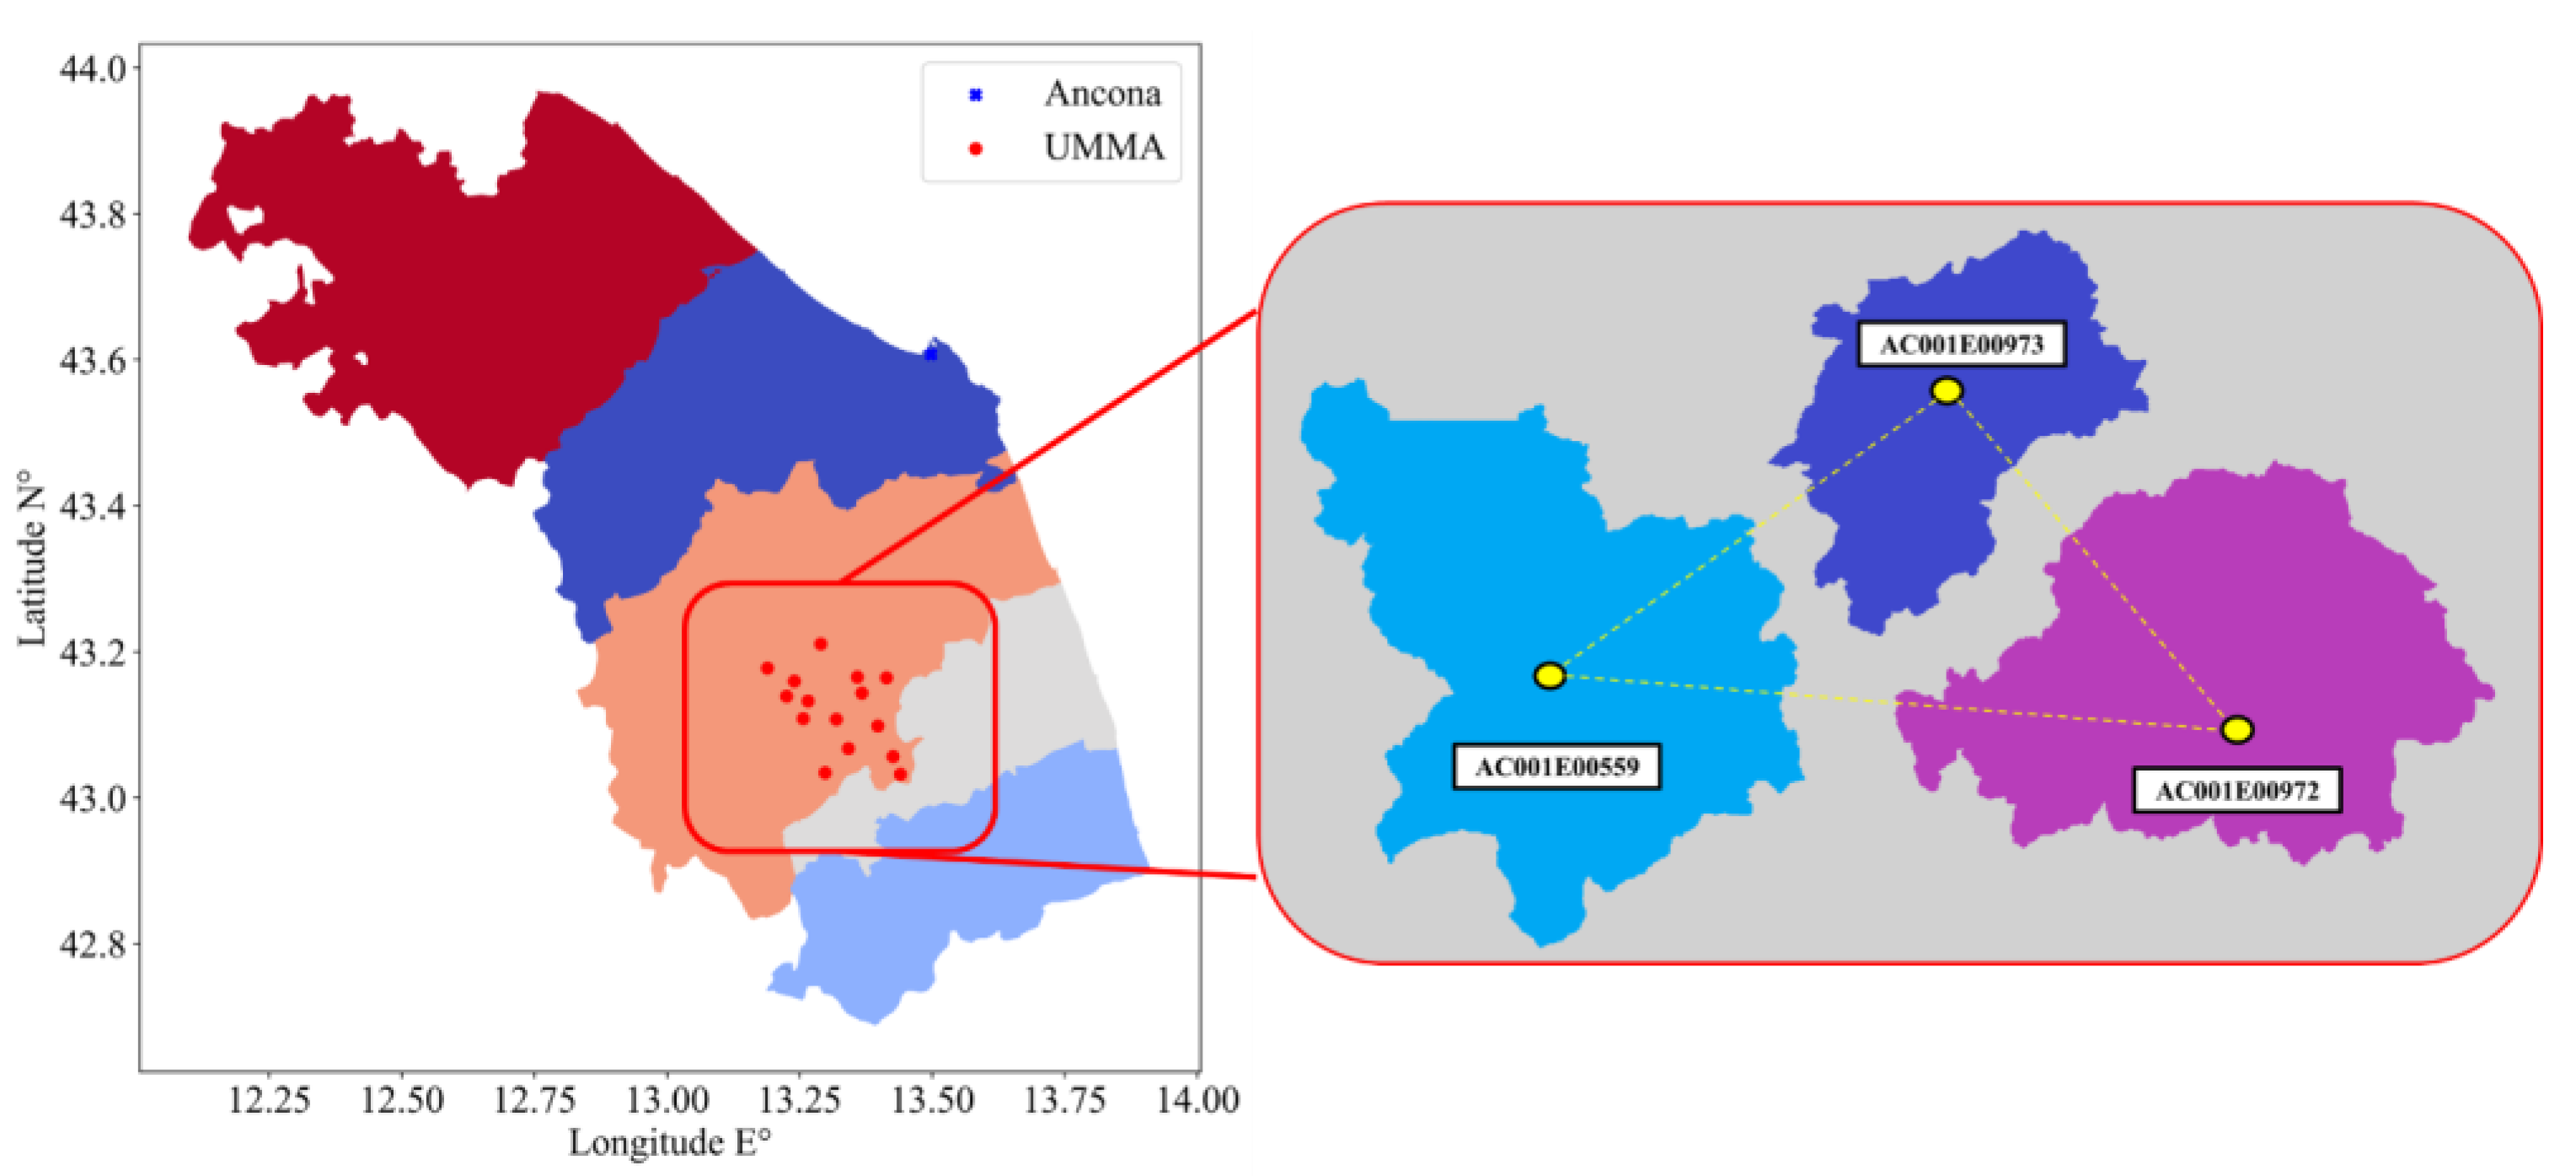
The second REC is composed of a cluster of municipalities (CMs) that represent three different RECs, according to the local distribution of primary cabins. The cluster, named “Unione Montana dei Monti Azzurri” (UMMA), has fifteen municipalities, spread across an area of 500 km2, with almost 40,000 inhabitants. The cluster is located in the southern part of Marche region, and it falls under the primary cabins of AC001E00559, AC001E00972, and AC001E00973, as depicted in Figure 3.
The aggregated average electricity consumption for the CMs was 2,803,000 kWh in 2021, a value that cannot be covered with the resources of the municipalities only. In fact, the authorities of the cluster have put major effort into encouraging the involvement of the citizens. In fact, similar to the SM, both private citizens and local enterprises were asked to join the municipalities in the project and presented three distinct ideas. Unlike the SM, the project considers PV plants, designed with a smaller peak power (375 W) for conservative assumptions and limited available space. However, PV car shelters (PVCSs) were found to be the best renewable power solution in open, shadow-free, and flat locations. One battery energy storage (BES) system and one fast charging station were envisaged, too. The general data on the former are reported in Table 2. The cost covers security, VAT, construction, and installation. The JRC PVGIS tool was used like the SM.

2.3. Public Call

The LCA analysis is divided into four steps: the goal and scope, i.e., why the study is being conducted and what is the target; the inventory stage, where the known and modelled data are incorporated within the boundary of the system under investigation; the impact assessment, where the environmental load is quantified according to specific methods; and, finally, the interpretation of the results. Sensitivity and uncertainty analyses can be performed as well, to improve the outcome of the study. The LCA must be supported by coherent and consistent data to model the system. A complete definition of the foreground and background system is related to the goodness of the primary and secondary data. In the present study, secondary data from the EcoInvent 3.6 [37,38,39] library implemented using SimaPro v. 9.1.1.8 [40] is used, which is the software chosen for the present analysis. No primary data are available at this stage.

2.3.1. Goal and Scope

The goal of the LCA analysis is to assess and evaluate the benefits apported by the installation of the renewable energy systems. The functional unit assumed for the LCA is “1 kWh” of energy produced, which is used to compare it with respect to “1 kWh” of energy dispatched by the Italian grid. The latter accounts for different energy sources, according to the Italian energy mix. This comparison is set for the SM only.

2.3.2. Inventory

The inventory of the life cycle is essential in the quantification of the material and energy streams required and generated in the examined system/process/product. It follows that it is strongly dependent upon the definition of time and spatial boundaries, according to which any flow is ascribed. In the present study, the approach “from the cradle to the grave” is considered, which implies that the impact of the material and energy used in the system is accounted for. The materials involved in capital goods assembly are not included, since their impact is negligible compared to the utility usage during operation time [41,42]. The materials used for BPV system manufacturing are considered according to Li et al. [31]. Transportation is not included.

2.3.3. Impact Assessment

The environmental footprint (EF) 3.0 method is adopted for the impact assessment concerning the scenarios. Fifteen midpoint indicators are intrinsic to the method: acidification [mol H+ eq], climate change [kg CO2eq], freshwater ecotoxicity [CTUe], freshwater eutrophication [kg Peq], marine water eutrophication [kg Neq], terrestrial eutrophication [mol N eq], human toxicity [CTUh], ionizing radiation [kBq U-235 eq], land use [-], ozone layer depletion [kg CFC11 eq], particulate matter [-], photochemical ozone formation [kg NMVOCeq], fossil resource use [MJ], mineral–metal resource use [kg Sbeq], and water use [m3]. The normalization and weighting factors are recalled from the method and have not been modified.

3. Results and Discussion

3.1. SM Citizenship Response

Despite the different encounters organized by the municipality for the citizens, only a few requests have been received to join the preliminary stage of the REC project. Table 3 summarizes the consent received, divided between consumers and prosumers, for Castelraimondo.
A total of thirteen consumers expressed a willingness to join the community, where five were families and six were small companies. Besides CONS1, which had a significantly low level of consumption, the other companies have higher energy demands, up to 1,031,700 kWh/year in total, almost twice the municipality consumption. In addition, the aggregated consumption of the five families is 16,000 kWh/year. Regarding prosumers, regarding all companies, a distinction between pure prosumers and partners must be made. The first ones, three in total, wanted to join the REC with their own PV systems already installed, with a peak power of 137 kW for PROS1, 348 kW for PROS2, and 280 kW for PROS3. Furthermore, PROS1 and PROS4 expressed approval for installing a new PV system (with a dedicated POD) on their rooftops, next to the ones already installed. Similarly, the others are mainly partners that want to join the community to provide further rooftop surfaces to increase the number of PV systems and, hence, the total score. The aggregated consumption of prosumers and partners is 2,020,300 kWh/year. The total consumption is, then, 3,670,600 kWh/year for the total community. No further data are available for characterizing the energy production from the existing PV systems. It is assumed that the consumption expressed in Table 3 refers to the energy taken from the grid when the PV systems do not satisfy the needs of the prosumers. As previously reported, the energy production by the REC is provided by a hydraulic turbine, fourteen PV systems located on different rooftops in the municipality, and another seven on private rooftops. A list of the renewable energy systems is reported in Table 4.
The cumulative energy production from the various renewable systems is determined to be 3,256,400 kWh, which is observed to be marginally lower than the prescribed demand of 3,670,600 kWh required by the actors in the REC. This disparity, amounting to approximately 11.3% between the actual supply and the targeted demand, is not subjected to any form of penalization in the overall scoring process related to the call. In relation to the PV systems, the conceptualization of the design is methodically aimed at optimizing the utilization of the available rooftop surfaces as identified and designated by both the local municipality and the prosumers, even if the exposition is not particularly optimal in some locations. Particularly noteworthy are certain buildings that exhibit the potential for accommodating medium-scale PV systems, exemplified by PROS1 (with a capacity of 215.88 kW) and PROS3 (capable of generating 145.32 kW), both conveniently situated atop flat and expansive rooftops. As expected, the presence of a hydraulic turbine significantly contributes to approximately 63% of the total energy production; nonetheless, this alone does not suffice to comprehensively meet the prescribed REC requirements. Consequently, within the remaining 37% of the energy deficit, an equal allocation is observed between the share attributable to the municipality’s PV installations (comprising 51% of the shortfall) and that of the prosumers’ PV installations (constituting the remaining 49%). This latter percentage exclusively represents the distinct involvement of the local community in the REC initiative, highlighting their active participation in fostering sustainable energy practices.

3.2. CM Citizenship Response

The extension of the cluster resulted in a wider citizenship response compared to the CM. A total of 114 citizens applied to the call as consumers, producers, or prosumers, together with the fifteen municipalities. The total private consumption increases the energy demand of the RECs, i.e., 534,000 kWh/year for REC1, 362,000 kWh/year for REC2, and 287,000 kWh/year for REC3. Thus, the total energy consumption of the cluster is almost 4 GWh/year. The most important data of the cluster are reported in Table 5.
The cluster is more unbalanced than the SM. In fact, the total energy output from the 179 PV systems is 2.874 GWh/year, i.e., the difference between consumption and generation is −28.15%. The lack of centralized renewable production systems is the first reason ascribable to the imbalance. The margin could be even bigger if the citizens had not been involved in the call. While smaller PV systems are associated with the REC cluster (3 kWe to 6 kWe), 96 additional PV systems can be installed together with the ones on the properties in the municipalities. In this case, the energy output would be 2.265 GWh/year, with a difference of −43.38%. The contribution by the citizens is quantifiable as 0.609 GWh/year, or 15.23% of the total demand. The BPV system can be used in 22 PV plants. While the fraction in regard to the total number of PV systems is small (12%), their incidence is significant because of the size of the peak power. In fact, the total expected power output is 0.874 GWh/year, i.e., 30.21% of the total production. As evinced from different studies [30,31,32], the annual yield can increase up to 20% in the most favorable scenario. Thus, an additional 0.175 GWh/year can be obtained with their installation, bringing the initial difference of −28.15% to −23.03%. The net benefit of the BPV system is characterized in 4.38% of the total demand.

3.3. LCA of SM

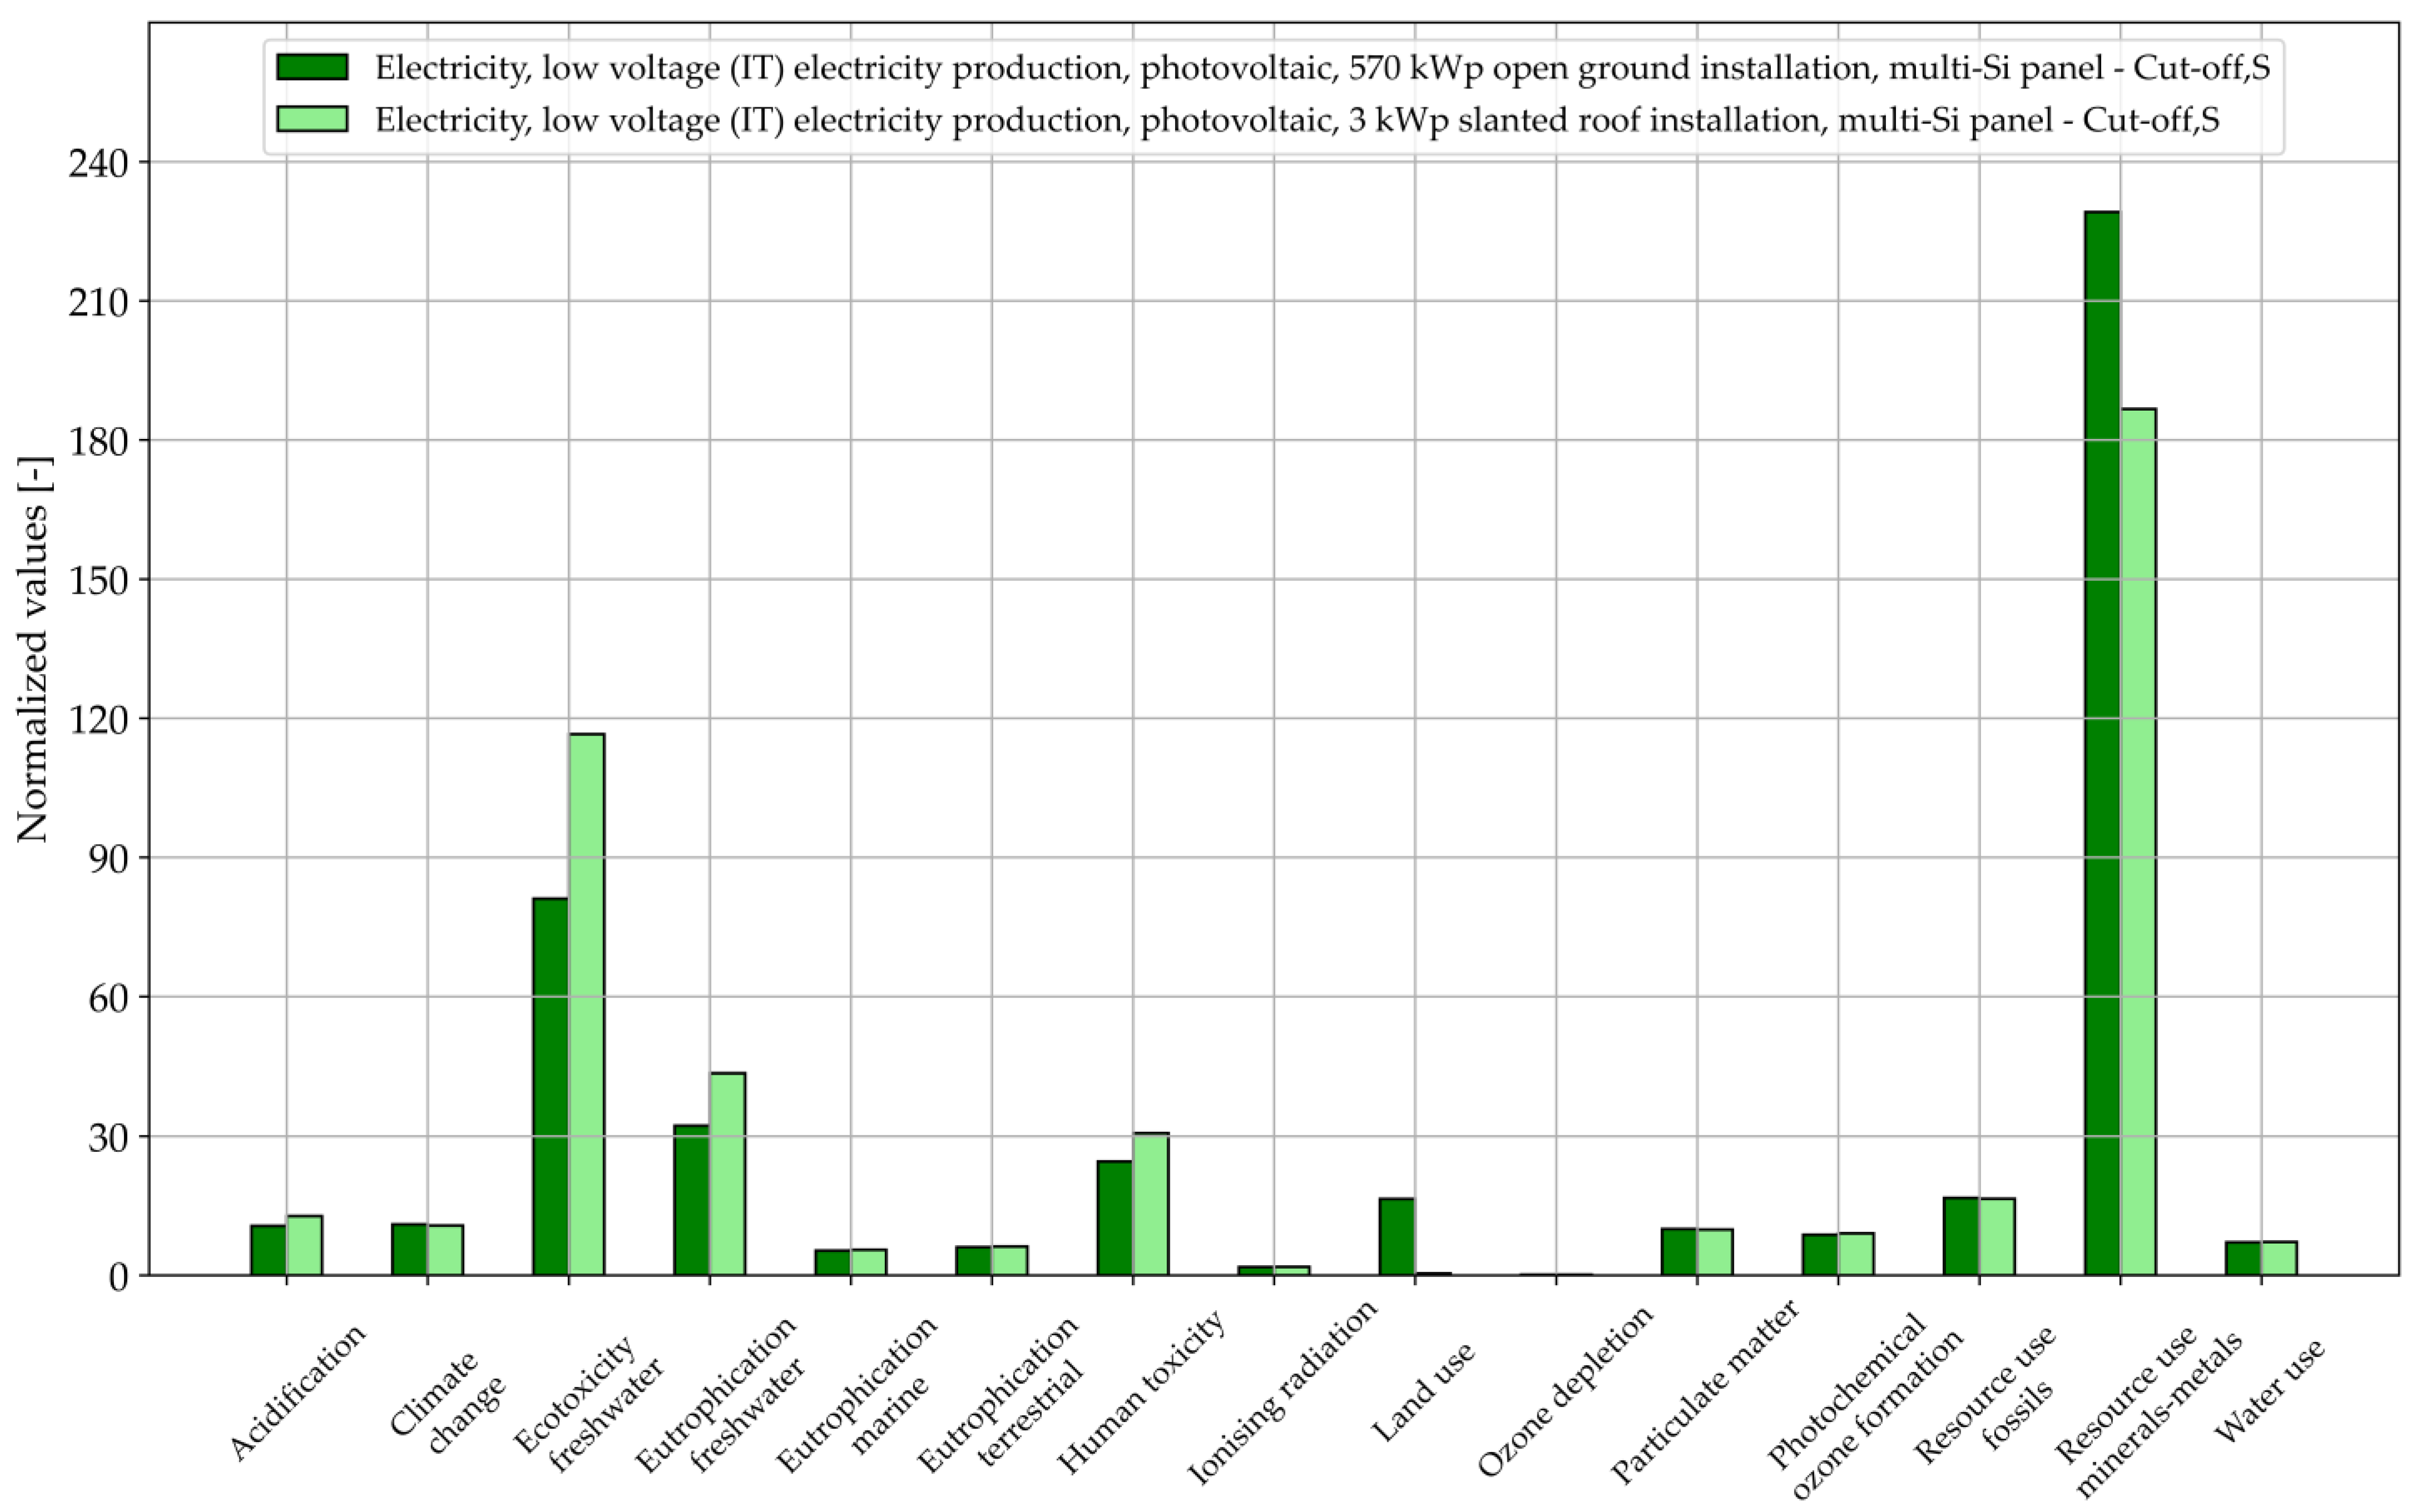
The first issue dealt with by the LCA is the fact that the construction of different decentralized systems can be more impactful than a single centralized one. This “environmental” cost is a trade-off that needs to be made in favor of the proliferation of small-sized power plants. In order to check this, and with respect to PV systems only, Table 6 reports on the characterization of the impact categories of the EF method, whereas Figure 4 reports on their normalization according to the EF method’s normalizing factors. The reference flow is set to the total energy production expected for the SM in a year.
In terms of characterization, the governing impact category is mineral resource use, with a value of 11.88 kg Sbeq. However, the value is lower compared to centralized construction of −22.7%. This is due to the fact that that more metallic materials are required for the supporting structures of PV systems, while a lower quantity is envisaged for rooftop installations. This impact category is the governing one in terms of normalized values (186.7 decentralized, 229.2 centralized), as shown in Figure 4. On the contrary, the other impact categories are worse, as expected, besides climate change and human toxicity (cancer) with minor decreases of 2.7% and 5.8%, respectively. The advantage of decentralized construction is also visualized in terms of the single score, as shown in Figure 5.
The aggregated score for a centralized system is 28.2, while for decentralized ones is 25. This difference is mainly due to the lower impact of the mineral resource use. Then, a comparison of the REC with respect to the Italian energy mix is provided in Figure 6. The reference flow considers the energy from the PV systems and the energy from the hydraulic turbine featured in Table 1.
As expected, the energy from renewable sources provides consistent environmental benefits. In numbers, the total score for the Italian energy mix is 102.55, while the total score for the SM REC is 26.30. A major reduction in climate change is expected: 36.94 down to 2.84. In terms of characterization, the reduction in this impact category is quantifiable as 92.30%.

4. Conclusions

This paper presented the technical results in terms of the installation of renewable energy systems, energy sharing, and environmental impact reduction, due to the exploitation of special funds dedicated to the reconstruction of an area of central Italy severely hit by earthquakes in 2009 and 2016.
The analysis of a public call, aimed at the valorization and reconstruction of sensitive areas, has shown an initial synergy between citizenship and the municipalities. While the absolute number of participating actors does not show a complete awareness of the benefits that renewable energy communities can provide, some remarkable energy-related and environmental aspects can be remarked upon. The inclusion of citizenship can increase the renewable transition, especially concerning photovoltaic panels. In particular, for the municipality cluster, almost 100 PV systems can be installed to balance the REC. For the single municipality, it is possible to realize one hydraulic turbine system that guarantees a good balance for the REC. In total, 6.134 GWh/year can be produced from renewable sources, but the consumption is greater than the production. Therefore, the installation of bi-facial systems can be foreseen for specific locations and, hence, can increase the energy output by 4.38%.
The active participation of citizens can be increased if more dissemination actions are carried out in a more personalized way, based on their role in the energy community (consumers, prosumers, producers) and the entity that they represent (private citizens, small or medium-sized companies, public bodies, religious associations, etc.).
The life cycle assessment methodology has been used to quantify the environmental benefits. While the comparison between centralized and decentralized PV systems can favor the latter due to less materials being required for their construction, it is undeniable that RECs lower the impact of the energy grid, especially in terms of climate change.
The approach used in this study is limited to the outcome of the mentioned public call only, from an engineering point of view, and does not take into account the social and cultural aspects that are an important part of the successful proliferation of renewable and energy sharing mechanisms.
Another limitation of the study is related to the fact that the project is still in the design phase and that it is the first public call implemented in Italy to incentivize the creation of RECs. A future study will include a detailed analysis of actual production and consumption data, followed by an analysis of the reduction in environmental impact based on the actual share of renewable energy produced. Moreover, the geographical and social context linked to the policy on renewable energy in Italy will be addressed.

Author Contributions

Conceptualization, G.B., M.V. and B.M.; methodology, G.B., M.V. and B.M.; software, G.B.; investigation, G.B. and M.V.; resources, B.M.; writing—original draft preparation, G.B.; writing—review and editing, G.B., M.V. and B.M.; visualization, G.B.; supervision, B.M.; project administration, B.M.; funding acquisition, B.M. All authors have read and agreed to the published version of the manuscript.

Funding

This research was established by the Municipality of Castelraimondo and the Unione Montana Monti Azzurri.

Data Availability Statement

The data presented in this study are available on request from the corresponding author. The data are not publicly available due to privacy.

Acknowledgments

The authors wish to acknowledge the Municipality of Castelraimondo and the Unione Montana Monti Azzurri, which provided access to the data and helped in the definition of the energy resources available.

Conflicts of Interest

The authors declare no conflicts of interest.

References

  1. Bednar-Friedl, B.; Biesbroek, R.; Schmidt, D.N.; Alexander, P.; Børsheim, K.Y.; Carnicer, J.; Georgopoulou, E.; Haasnoot, M.; Le Cozannet, G.; Lionello, P.; et al. Europe. In Climate Change 2022: Impacts, Adaptation and Vulnerability. Contribution of Working Group II to the Sixth Assessment Report of the Intergovernmental Panel on Climate Change; Cambridge University Press: Cambridge, UK; New York, NY, USA, 2022; pp. 1817–1927. [Google Scholar] [CrossRef]
  2. Clean Energy for All Europeans Package. Available online: https://energy.ec.europa.eu/topics/energy-strategy/clean-energy-all-europeans-package_en (accessed on 28 July 2023).
  3. Gržanić, M.; Capuder, T.; Zhang, N.; Huang, W. Prosumers as active market participants: A systematic review of evolution of opportunities, models and challenges. Renew. Sustain. Energy Rev. 2022, 154, 111859. [Google Scholar] [CrossRef]
  4. Mäkivierikko, A.; Siepelmeyer, H.; Shahrokni, H.; Enarsson, D.; Kordas, O. Reducing electricity peak loads through “pause hours”—A community-based behavioural demand response approach. J. Clean. Prod. 2023, 408, 137064. [Google Scholar] [CrossRef]
  5. Luttenberger Marić, L.; Keko, H.; Delimar, M. The Role of Local Aggregator in Delivering Energy Savings to Household Consumers. Energies 2022, 15, 2793. [Google Scholar] [CrossRef]
  6. Lowitzsch, J.; Hoicka, C.E.; Van Tulder, F.J. Renewable energy communities under the 2019 European Clean Energy Package—Governance model for the energy clusters of the future? Renew. Sustain. Energy Rev. 2020, 122, 109489. [Google Scholar] [CrossRef]
  7. DIRECTIVE (EU) 2018/2001 of the European Parliament and of the Council of 11 December 2018—On the Promotion of the Use of Energy from Renewable Sources. Available online: https://eur-lex.europa.eu/eli/dir/2018/2001/oj (accessed on 25 February 2024).
  8. Gjorgievski, V.Z.; Cundeva, S.; Georghiou, G.E. Social arrangements, technical designs and impacts of energy communities: A review. Renew. Energy 2021, 169, 1138–1156. [Google Scholar] [CrossRef]
  9. Brummer, V. Community energy—Benefits and barriers: A comparative literature review of Community Energy in the UK, Germany and the USA, the benefits it provides for society and the barriers it faces. Renew. Sustain. Energy Rev. 2018, 94, 187–196. [Google Scholar] [CrossRef]
  10. Wu, Y.; Wu, Y.; Cimen, H.; Vasquez, J.C.; Guerrero, J.M. Towards collective energy Community: Potential roles of microgrid and blockchain to go beyond P2P energy trading. Appl. Energy 2022, 314, 119003. [Google Scholar] [CrossRef]
  11. Rossi, F.; Heleno, M.; Basosi, R.; Sinicropi, A. LCA driven solar compensation mechanism for Renewable Energy Communities: The Italian case. Energy 2021, 235, 121374. [Google Scholar] [CrossRef]
  12. Cielo, A.; Margiaria, P.; Lazzeroni, P.; Mariuzzo, I.; Repetto, M. Renewable Energy Communities business models under the 2020 Italian regulation. J. Clean. Prod. 2021, 316, 128217. [Google Scholar] [CrossRef]
  13. ARERA—Definizione, ai Sensi del Decreto Legislativo 199/21 e del Decreto Legislativo 210/21, della Regolazione Dell’autoconsumo Diffuso. Approvazione del Testo Integrato Autoconsumo Diffuso. Available online: https://www.arera.it/it/docs/22/727-22.htm (accessed on 28 July 2023).
  14. Modifiche al Testo Integrato Autoconsumo Diffuso e Verifica delle Regole Tecniche per il Servizio per L’autoconsumo Diffuso Predisposte dal Gestore dei Servizi Energetici S.p.A. Available online: https://www.arera.it/atti-e-provvedimenti/dettaglio/24/15-24 (accessed on 18 February 2024).
  15. Reynaud, C.; Miccoli, S. Depopulation and the Aging Population: The Relationship in Italian Municipalities. Sustainability 2018, 10, 1004. [Google Scholar] [CrossRef]
  16. Raimondi, G.; Spazzafumo, G. Exploring Renewable Energy Communities integration through a hydrogen Power-to-Power system in Italy. Renew. Energy 2023, 206, 710–721. [Google Scholar] [CrossRef]
  17. Dal Cin, E.; Carraro, G.; Volpato, G.; Lazzaretto, A.; Danieli, P. A multi-criteria approach to optimize the design-operation of Energy Communities considering economic-environmental objectives and demand side management. Energy Convers. Manag. 2022, 263, 115677. [Google Scholar] [CrossRef]
  18. Fioriti, D.; Frangioni, A.; Poli, D. Optimal sizing of energy communities with fair revenue sharing and exit clauses: Value, role and business model of aggregators and users. Appl. Energy 2021, 299, 117328. [Google Scholar] [CrossRef]
  19. Fina, B.; Monsberger, C.; Auer, H. Simulation or estimation?—Two approaches to calculate financial benefits of energy communities. J. Clean. Prod. 2022, 330, 129733. [Google Scholar] [CrossRef]
  20. Volpato, G.; Carraro, G.; Cont, M.; Danieli, P.; Rech, S.; Lazzaretto, A. General guidelines for the optimal economic aggregation of prosumers in energy communities. Energy 2022, 258, 124800. [Google Scholar] [CrossRef]
  21. Moncecchi, M.; Meneghello, S.; Merlo, M. A Game Theoretic Approach for Energy Sharing in the Italian Renewable Energy Communities. Appl. Sci. 2020, 10, 8166. [Google Scholar] [CrossRef]
  22. Masip, X.; Fuster-Palop, E.; Prades-Gil, C.; Viana-Fons, J.D.; Payá, J.; Navarro-Peris, E. Case study of electric and DHW energy communities in a Mediterranean district. Renew. Sustain. Energy Rev. 2023, 178, 113234. [Google Scholar] [CrossRef]
  23. Backe, S.; Zwickl-Bernhard, S.; Schwabeneder, D.; Auer, H.; Korpås, M.; Tomasgard, A. Impact of energy communities on the European electricity and heating system decarbonization pathway: Comparing local and global flexibility responses. Appl. Energy 2022, 323, 119470. [Google Scholar] [CrossRef]
  24. Caratù, M.; Brescia, V.; Pigliautile, I.; Biancone, P. Assessing Energy Communities’ Awareness on Social Media with a Content and Sentiment Analysis. Sustainability 2023, 15, 6976. [Google Scholar] [CrossRef]
  25. Guarino, F.; Longo, S.; Vermette, C.H.; Cellura, M.; La Rocca, V. Life cycle assessment of solar communities. Sol. Energy 2020, 207, 209–217. [Google Scholar] [CrossRef]
  26. European Commission; Joint Research Centre; Institute for Environment and Sustainability. International Reference Life Cycle Data System (ILCD) Handbook: General Guide for Life Cycle Assessment: Detailed Guidance; Publications Office: Luxembourg, 2010; Available online: https://data.europa.eu/doi/10.2788/38479 (accessed on 24 July 2022).
  27. ISO 14040; Environmental Management—Life Cycle Assessment Principles and Framework. International Organization for Standardization: Geneva, Switzerland, 2006.
  28. Biancini, G.; Marchetti, B.; Cioccolanti, L.; Moglie, M. Comprehensive Life Cycle Assessment Analysis of an Italian Composting Facility concerning Environmental Footprint Minimization and Renewable Energy Integration. Sustainability 2022, 14, 14961. [Google Scholar] [CrossRef]
  29. Maniscalco, M.; Longo, S.; Miccichè, G.; Cellura, M.; Ferraro, M. A Critical Review of the Environmental Performance of Bifacial Photovoltaic Panels. Energies 2023, 17, 226. [Google Scholar] [CrossRef]
  30. Deline, C.; Ayala, S.; Marion, B.; Sekulic, B.; Woodhouse, M.; Stein, J. Bifacial PV System Performance: Separating Fact from Fiction; National Renewable Energy Lab. (NREL): Golden, CO, USA, 2019. [Google Scholar]
  31. Li, Z.; Zhang, W.; He, B.; Xie, L.; Chen, M.; Li, J.; Zhao, O.; Wu, X. A Comprehensive Life Cycle Assessment Study of Innovative Bifacial Photovoltaic Applied on Building. Energy 2022, 245, 123212. [Google Scholar] [CrossRef]
  32. Fontani, D.; Jafrancesco, D.; Sansoni, P.; Nicolini, A.; Di Giuseppe, A.; Pazzaglia, A.; Castellani, B.; Rossi, F.; Mercatelli, L. Field optimization for bifacial modules. Opt. Mater. 2023, 138, 113715. [Google Scholar] [CrossRef]
  33. Jordahl, K.; Van den Bossche, J.; Fleischmann, M.; Wasserman, J.; McBride, J.; Gerard, J.; Tratner, J.; Perry, M.; Badaracco, A.G.; Farmer, C.; et al. Geopandas/Geopandas: v0.8.1. Zenodo. July 2020. Available online: https://zenodo.org/records/3946761 (accessed on 25 February 2024).
  34. Mappa Interattiva delle Cabine Primarie. Available online: https://www.gse.it/servizi-per-te/autoconsumo/mappa-interattiva-delle-cabine-primarie (accessed on 21 February 2024).
  35. JRC. Photovoltaic Geographical Information System (PVGIS)—European Commission. Available online: https://re.jrc.ec.europa.eu/pvg_tools/en/ (accessed on 16 July 2023).
  36. Azioni Longi-Hi-MO 4m. Longi. Available online: https://www.longi.com/it/products/modules/hi-mo-4m/ (accessed on 16 July 2023).
  37. Frischknecht, R.; Jungbluth, N.; Althaus, H.J.; Doka, G.; Dones, R.; Heck, T.; Hellweg, S.; Hischier, R.; Nemecek, T.; Rebitzer, G.; et al. The ecoinvent Database: Overview and Methodological Framework. Int. J. Life Cycle Assess. 2005, 10, 3–9. [Google Scholar] [CrossRef]
  38. Wernet, G.; Bauer, C.; Steubing, B.; Reinhard, J.; Moreno-Ruiz, E.; Weidema, B. The ecoinvent database version 3 (part I): Overview and methodology. Int. J. Life Cycle Assess. 2016, 21, 1218–1230. [Google Scholar] [CrossRef]
  39. Ecoinvent Database. Ecoinvent. Available online: https://ecoinvent.org/the-ecoinvent-database/ (accessed on 14 July 2022).
  40. SimaPro|LCA Software for Informed-Change Makers. SimaPro. Available online: https://simapro.com/ (accessed on 3 February 2023).
  41. Pérez-López, P.; De Vree, J.H.; Feijoo, G.; Bosma, R.; Barbosa, M.J.; Moreira, M.T.; Wijffels, R.H.; Van Boxtel, A.J.; Kleinegris, D.M. Comparative life cycle assessment of real pilot reactors for microalgae cultivation in different seasons. Appl. Energy 2017, 205, 1151–1164. [Google Scholar] [CrossRef]
  42. Maiolo, S.; Parisi, G.; Biondi, N.; Lunelli, F.; Tibaldi, E.; Pastres, R. Fishmeal partial substitution within aquafeed formulations: Life cycle assessment of four alternative protein sources. Int. J. Life Cycle Assess. 2020, 25, 1455–1471. [Google Scholar] [CrossRef]
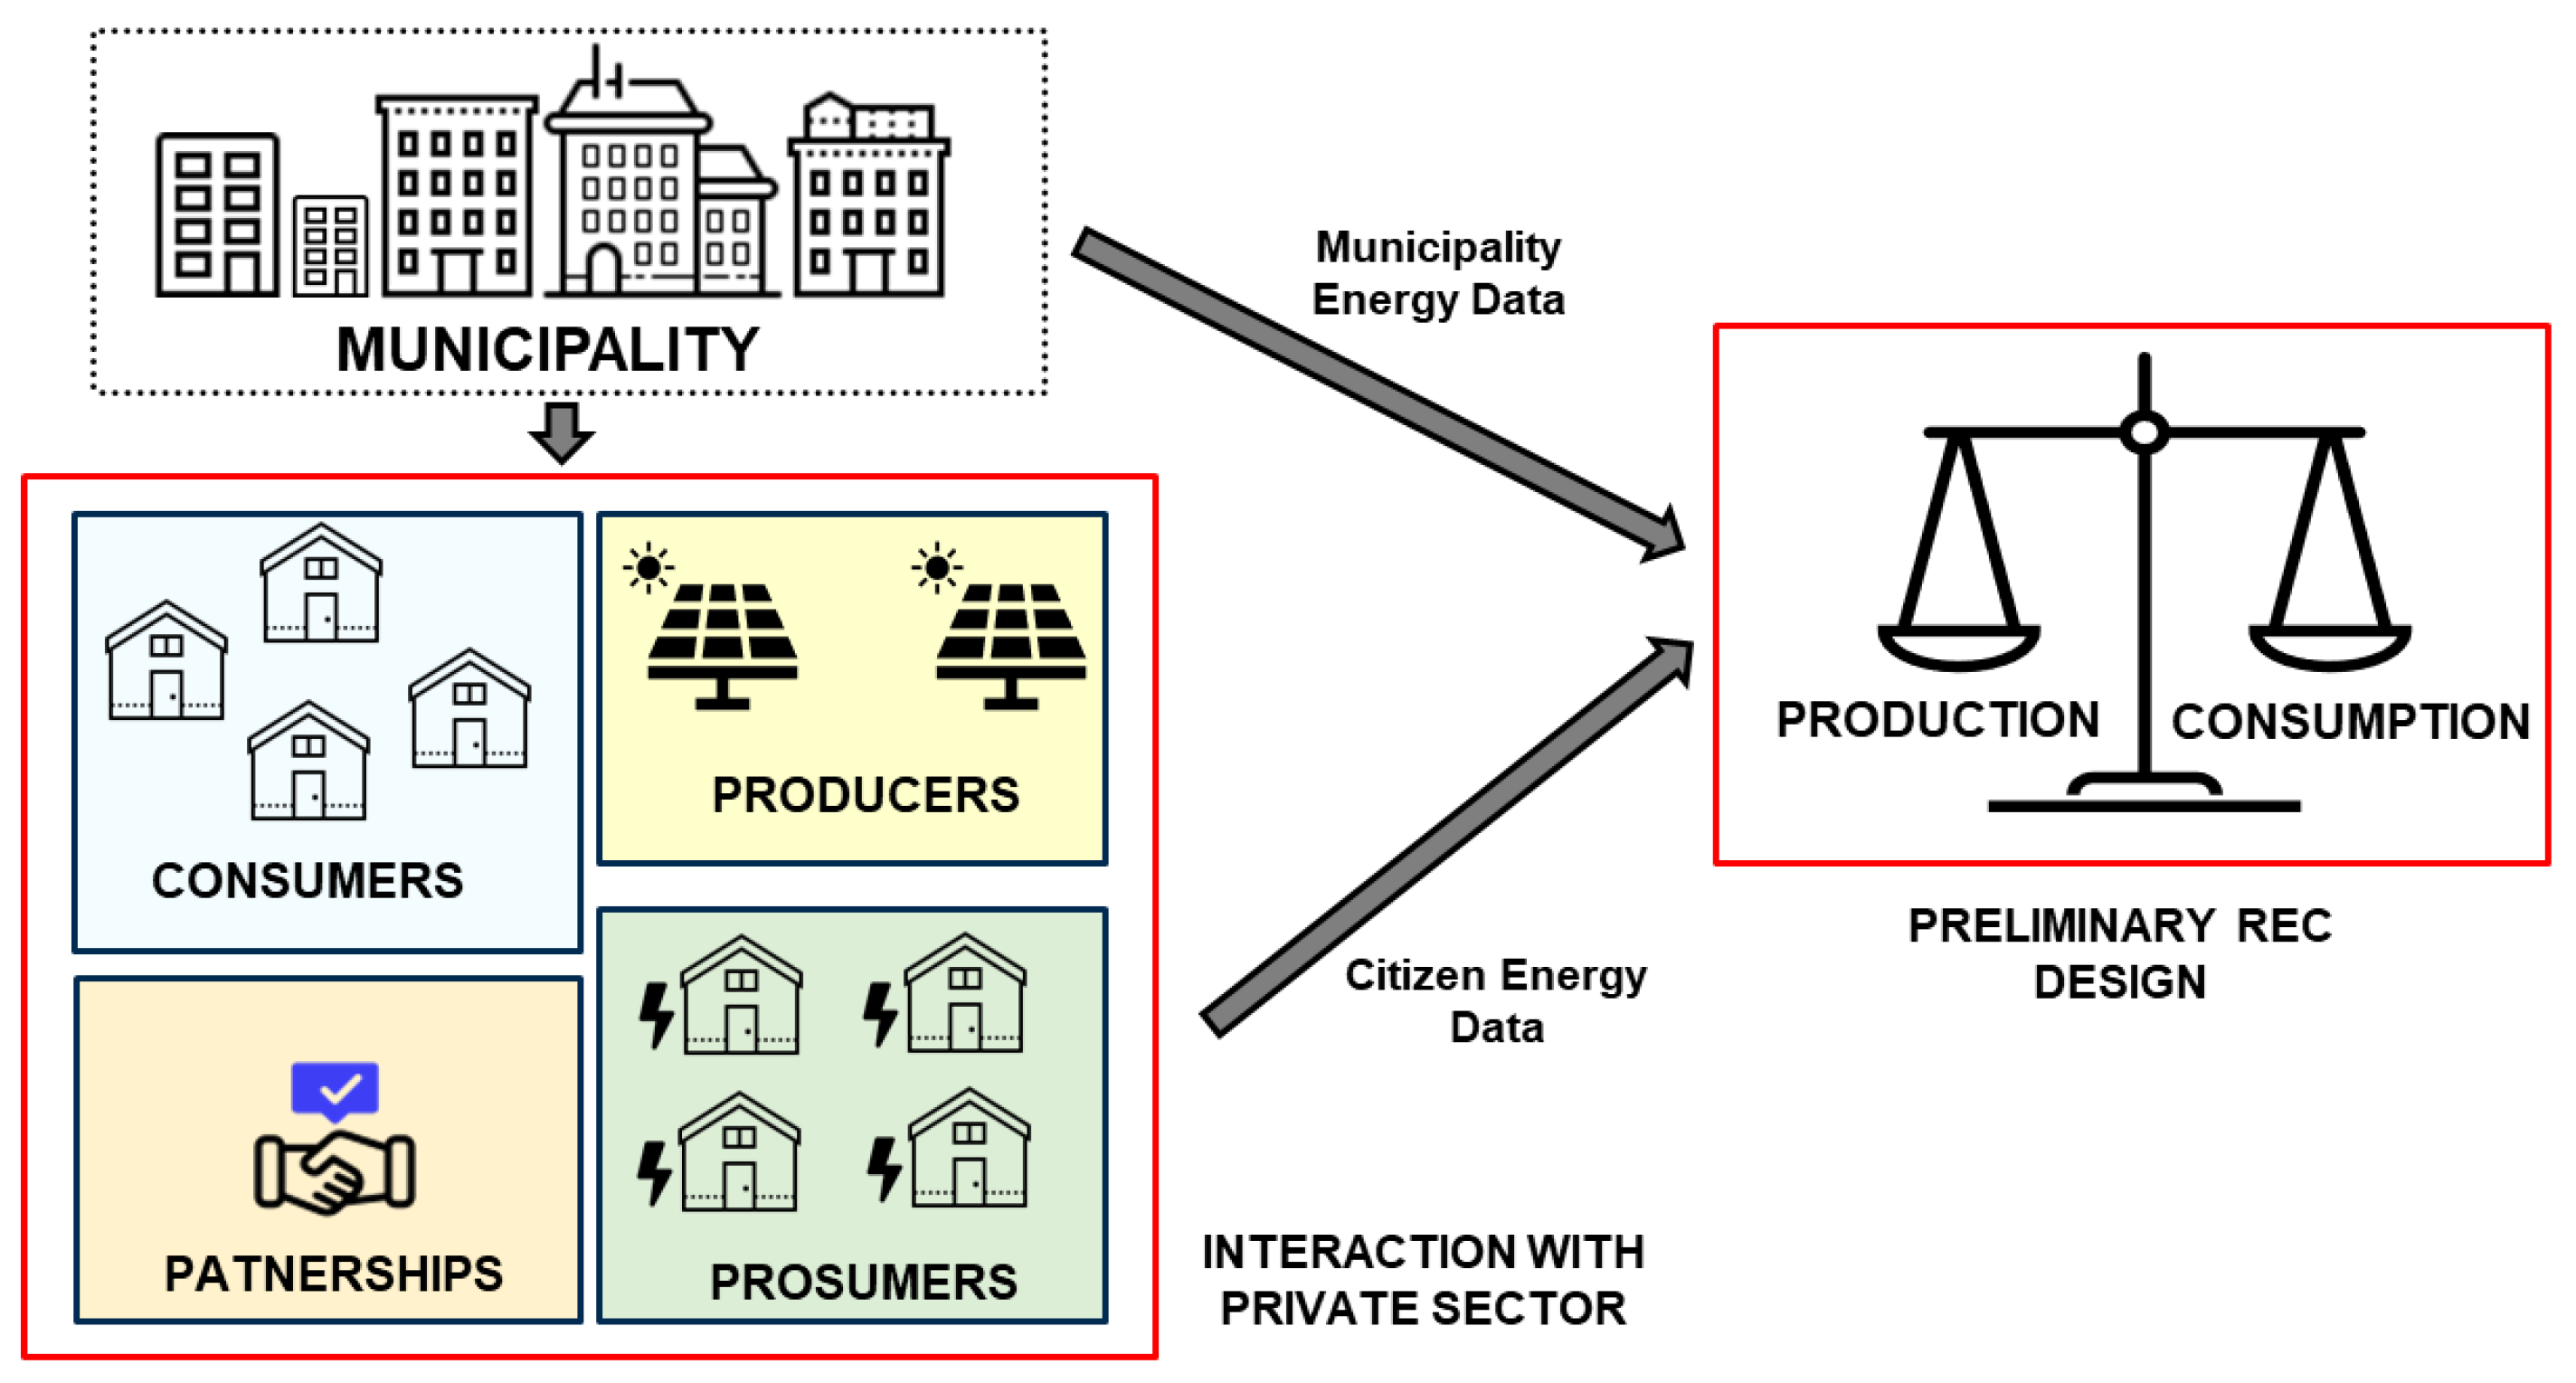
Figure 1. Schematic representation of the interactions between municipalities and citizens at the preliminary design stage of the REC.
Energies 17 01599 g001
Figure 2. Ubication of Castelraimondo municipality and visualization of the primary cabin extensions. The map was generated with the GeoPandas Python package [33], whereas the location and extension of the primary cabin are listed on the website of the Italian government institution in charge of the management of electrical services (GSE) [34]. Different colors depict the various districts of Marche region.
Energies 17 01599 g002
Figure 3. Ubication of UMMA cluster and visualization of the three primary cabin extensions. The map is generated with the GeoPandas Python package [33], whereas the location and extension of the primary cabin are listed on the website of the Italian government institution in charge of the management of electrical services (GSE) [34]. Different colors depict the various districts of Marche region and the three different primary cabins.
Energies 17 01599 g003
Figure 4. Normalization of the impacts reported in Table 6.
Energies 17 01599 g004
Figure 5. Single score of the EF method for the comparison between centralized and decentralized systems.
Energies 17 01599 g005
Figure 6. Comparison (EF single score) of the Italian energy mix with respect to the SM REC.
Energies 17 01599 g006
Table 1. Characteristics of the Ossberger turbine.
Ossberger Turbine Characteristics
Hydraulic jump [m]9.93
Flow rate [m3/s]4.62
Power [kW]450
Energy production [MWh/year]2041
Cost [k/EUR]5600
Table 2. Characteristics of the PV car shelter.
PVCS Characteristics
Number of car slots per PVCS [-]4
Number of panels [-]30
Power [kW]11.25
Number of fast charging stations [-]1
Area [m2]60
Shed slope [°]15
Number of BES systems (9.8 kWh) [-]1
Cost [k/EUR]90
Table 3. SM citizens that expressed consent to join the REC.
ConsumersProsumers and Partners
IDTypeConsumption [kWh] *IDConsumption [kWh] *Existing Plant [kW]
CONS1Company100PROS11,386,600137
CONS2Family3800PROS1 **-Partner
CONS3Family4000PROS2492,400348
CONS4Company205,000PROS318,900Partner
CONS5Company175,700PROS454,800280
CONS6Company21,600PROS4 **-Partner
CONS7Company263,300PROS5-Partner
CONS8Company112,600PROS617,200Partner
CONS9Company15,000PROS713,900Partner
CONS10Family3400PROS836,500Partner
CONS11Family2800
CONS12Family2000
CONS13Company275,100
(*) Consumption data for consumers and prosumers for year 2021. (**) Prosumers that provided availability for installing a new PV system on their property, in addition to those already installed.
Table 4. Energy systems present in the REC project.
Renewable Energy Systems
IDLocationPeak Power [kW]Yearly Energy Production [kWh]Incidence on the Total [%]Incidence on the Total, Only PV [%]
PV1Municipality45.3649,4001.524.06
PV2Municipality70.5668,4002.105.63
PV3Municipality26.4626,0000.802.14
PV4Municipality46.2040,0001.233.29
PV5Municipality40.3242,3001.303.48
PV6Municipality21.0023,9000.731.97
PV7Municipality12.6013,7000.421.13
PV8Municipality7.5688000.270.72
PV9Municipality23.9427,3000.842.25
PV10Municipality69.7276,0002.336.25
PV11Municipality88.2097,5002.998.02
PV12Municipality20.1621,0000.641.73
PV13Municipality71.8282,0002.526.75
PV14Municipality40.3240,8001.253.36
PV15PROS1215.88213,8006.5717.59
PV16PROS3145.32165,2005.0713.59
PV17PROS46.3069000.210.57
PV18PROS542.0048,0001.473.95
PV19PROS616.8017,3000.531.42
PV20PROS767.2076,8002.366.32
PV21PROS861.7470,3002.165.78
HT1Municipality450.002,041,00062.68-
Table 5. Summary of the CM citizens that expressed consent to join the REC.
REC Cluster Summary
REC IDNumber of Private CitizensTotal Consumption
[kWh/year]
Total PV SystemsNumber of Plant Locations Suitable for BPV System InstallationNumber of Public PV Systems on Private RooftopsEnergy Yield
[kWh/year]
REC1622,110,00011410691,504,000
REC2361,286,00041518935,000
REC316590,0002479435,000
Table 6. Characterization of the impact of centralized vs. decentralized PV renewable energy systems. The relative variation is not assigned (n.a.) for “land use” impact category.
Impact CategoryU.M.Centralized SystemsDecentralized SystemsVariation [%]
Acidificationmol H+eq593.81711.16−16.5%
Climate changekg CO2eq89,270.5686,892.022.7%
Ecotoxicity, freshwaterCTUe3,462,232.744,974,901.34−30.4%
Eutrophication, freshwaterkg Peq51.8570.0052−25.9%
Eutrophication, marinekg Neq104.30108.31−3.7%
Eutrophication, terrestrialmol Neq1073.541100.40−2.4%
Human toxicity, cancerCTUh0.000120.000125.8%
Human toxicity, non-cancerCTUh0.00400.0055−27.3%
Ionizing radiationkBq U-235 eq7564.7247795.51−3.0%
Land usePt13,504,877.66351,924.06n.a.
Ozone depletionkg CFC11 eq0.008790.00870.7%
Particulate matterdisease inc.0.00590.00591.1%
Photochemical ozone formationkg NMVOC eq355.47368.31−3.5%
Resource use, fossilsMJ1,086,134.611,074,625.631.1%
Resource use, minerals and metalskg Sb eq14.5911.8822.7%
Water usem3 depriv.81,664.9882,474.29−1.0%
Disclaimer/Publisher’s Note: The statements, opinions and data contained in all publications are solely those of the individual author(s) and contributor(s) and not of MDPI and/or the editor(s). MDPI and/or the editor(s) disclaim responsibility for any injury to people or property resulting from any ideas, methods, instructions or products referred to in the content.