Article

Evaluation of a Database of the Spanish Wind Energy Resources Derived from a Regional Reanalysis

by
Antonio Jiménez-Garrote
1,
Francisco J. Santos-Alamillos
2,
Guadalupe Sánchez-Hernández
1,
Miguel López-Cuesta
1,
José A. Ruiz-Arias
2 and
David Pozo-Vázquez
1,*
1
Andalusian Institute for Earth System Research IISTA-CEAMA, Department of Physics, University of Jaen, 23071 Jaen, Spain
2
Department of Applied Physics I, University of Malaga, 29071 Malaga, Spain
*
Author to whom correspondence should be addressed.
Energies 2024, 17(7), 1523; https://doi.org/10.3390/en17071523
Submission received: 24 February 2024 / Revised: 15 March 2024 / Accepted: 18 March 2024 / Published: 22 March 2024

Abstract

:
An enhanced database (RetroDB) of the Spanish wind energy resources, derived from a high spatial resolution integration with the WRF model, is proposed and evaluated. RetroDB provides hourly capacity factor (CF) values for the Spanish regions, along the period of 2007–2020, with an unprecedented spatial resolution. RetroDB estimates were benchmarked based on the ERA5 global reanalysis. A comprehensive evaluation study of both RetroDB and ERA5 estimates was conducted using surface and tall mast measurements, along with actual CF values. The extent to which RetroDB and ERA5 reproduced the CF spatial variability, distribution, and ramp distribution were specifically addressed. The results showed no differences between the global and regional reanalysis performance regarding nationally aggregated wind energy estimates. Nevertheless, RetroDB clearly shows a superior performance reproducing the wind speeds’ and CFs’ spatial and temporal distributions. This was found to be related to the higher reliability of RetroDB reproducing the aloft winds in complex topographic areas. Overall, the results clearly indicate that, in areas such as the study region, where the wind resources are mostly associated with topographic enhancements, high spatial resolution regional reanalyses are preferable over relative coarse reanalyses (e.g., ERA5), particularly for wind energy integration studies. RetroDB database is made publicly available.

1. Introduction

Solar and wind energies are playing a central role in the plans to decarbonise power systems worldwide, fostered by their unprecedented technical and economic competitiveness compared to traditional energy sources [1,2]. The European Union has set a 32% target for electricity consumption from renewable energy sources (RESs) by 2030 [3]. To fulfil that aim, Spain will promote the installation of additional solar PV (about 25 GW) and wind power (about 20 GW) throughout the present decade [4]. However, the plans to accomplish such targets, which imply a remarkable increase in the grid share of RES, combined with the known intermittency of solar and wind resources (arguably, the most important RES drawback), poses a threat to the reliability of the power supply system [5]. A way to face this issue is to simulate the grid operation sensitivity to RES fluctuations as a function of their share in the grid and the spatial distribution of the RES plants. This approach features a virtual laboratory to explore electricity grid design mechanisms that may improve its resilience under RES fluctuations, ranging from hours to decades [6,7]. Multi-decadal RES databases, with enhanced reliability, are necessary to attain this goal.
Atmospheric reanalyses offer a unique framework for the development of such databases, as they can describe the wind and solar resources over extensive areas and multi-decadal time spans [8]. To this end, the meteorological information derived from such reanalyses is plugged into power models to compute solar PV and wind power potentials [9,10] or to assess the viability of low-carbon power systems [11]. The performance of these simulations depends on both the quality of the atmospheric inputs and the performance of the RES-to-power models used to transform these quantities into energy estimates [12]. Indeed, recent years have seen a boost of methods devoted to develop, validate and enhance reanalysis-based RES databases (e.g., by removing biases [9]) and to devise improved RES-to-power models [13,14]. This work, in particular, focuses on the development of a high-performance database of wind resources tailored for wind power assessment in the Spanish grid, as detailed below.
The overall consensus from multiple evaluation studies of wind speed and wind energy estimates derived from global atmospheric reanalyses (hereinafter referred to as GAR) is that, over flat and homogeneous regions, the GAR-based wind speed agrees reasonably well with surface and tall tower measurements [15,16], whereas, in areas with complex topography, they tend to underestimate the wind speed observations and to overestimate the probability of low wind speed [17,18]. These results justify the need for wind speed bias correction methods [19]. With regard to wind power, GAR wind speeds were found to be appropriate for evaluate country-wide generation [20,21], although extreme generation values are typically underestimated [9].
A downside of GAR-based datasets is their limited spatial and temporal resolution (tens of km, and hourly, or coarser, time steps), which might explain, at least partially, the disagreements with observations in regions with complex topography. In this respect, the higher spatial and temporal resolutions of regional atmospheric reanalyses (hereinafter referred to as RAR) (a few km and hourly, or finer, time steps) represent an added value with respect to GAR datasets that have been evaluated in recent years. In particular, the enhanced horizontal resolution of RAR datasets allows for a better representation of the land–surface interactions, including topographical effects, resulting in enhanced wind speed estimates [15,22]. Indeed, wind speed from GAR and RAR datasets have demonstrated similar accuracy in flat and homogeneous areas [16,18], while RAR-based wind speed outperforms GAR-based predictions in areas with complex topography [23,24]. Nonetheless, most of the previous RAR-based evaluation studies were conducted in central and northern European regions, characterised by a low topographic complexity, and whose wind resources are mainly driven by favourable atmospheric planetary circulations. Conversely, the wind resource in Mediterranean countries, which is mainly associated with local topographic features and thermal contrasts, has barely been assessed [25].
In addition, most of the evaluation studies of GAR and RAR are focused on spatial (country) aggregated statistics (wind power) or point validation (wind speed). Nevertheless, little attention has been paid to the ability of these reanalyses to reproduce the spatial and temporal patterns of variability in wind energy resources, which are key for the design of reliable and cost-effective low-carbon power systems. Wind power intermittency can be reduced by making use of the spatial correlation of wind energy resources [26,27], while reliable estimates of the wind power generation probability distribution and their ramp distributions play a central role in wind energy integration [18]. GARs have been found to provide anomalously strong spatial correlations as a consequence of their relatively low spatial resolution [16]. Pryor et al. [18] found that, in complex topographic areas, GARs tend to underestimate wind power generation as a consequence of the negative wind speed bias. On the contrary, RARs have been shown to provide an enhanced representation of the marginal distribution of wind power and ramp rates [24,28]. However, it has been reported that the daily cycle of wind power generation is hardly reproduced by GARs and even RARs [16,29]. It should be highlighted that both the spatial and temporal variability of wind energy resources are highly dependent on the topographic and climatological characteristics of the study area [30,31].
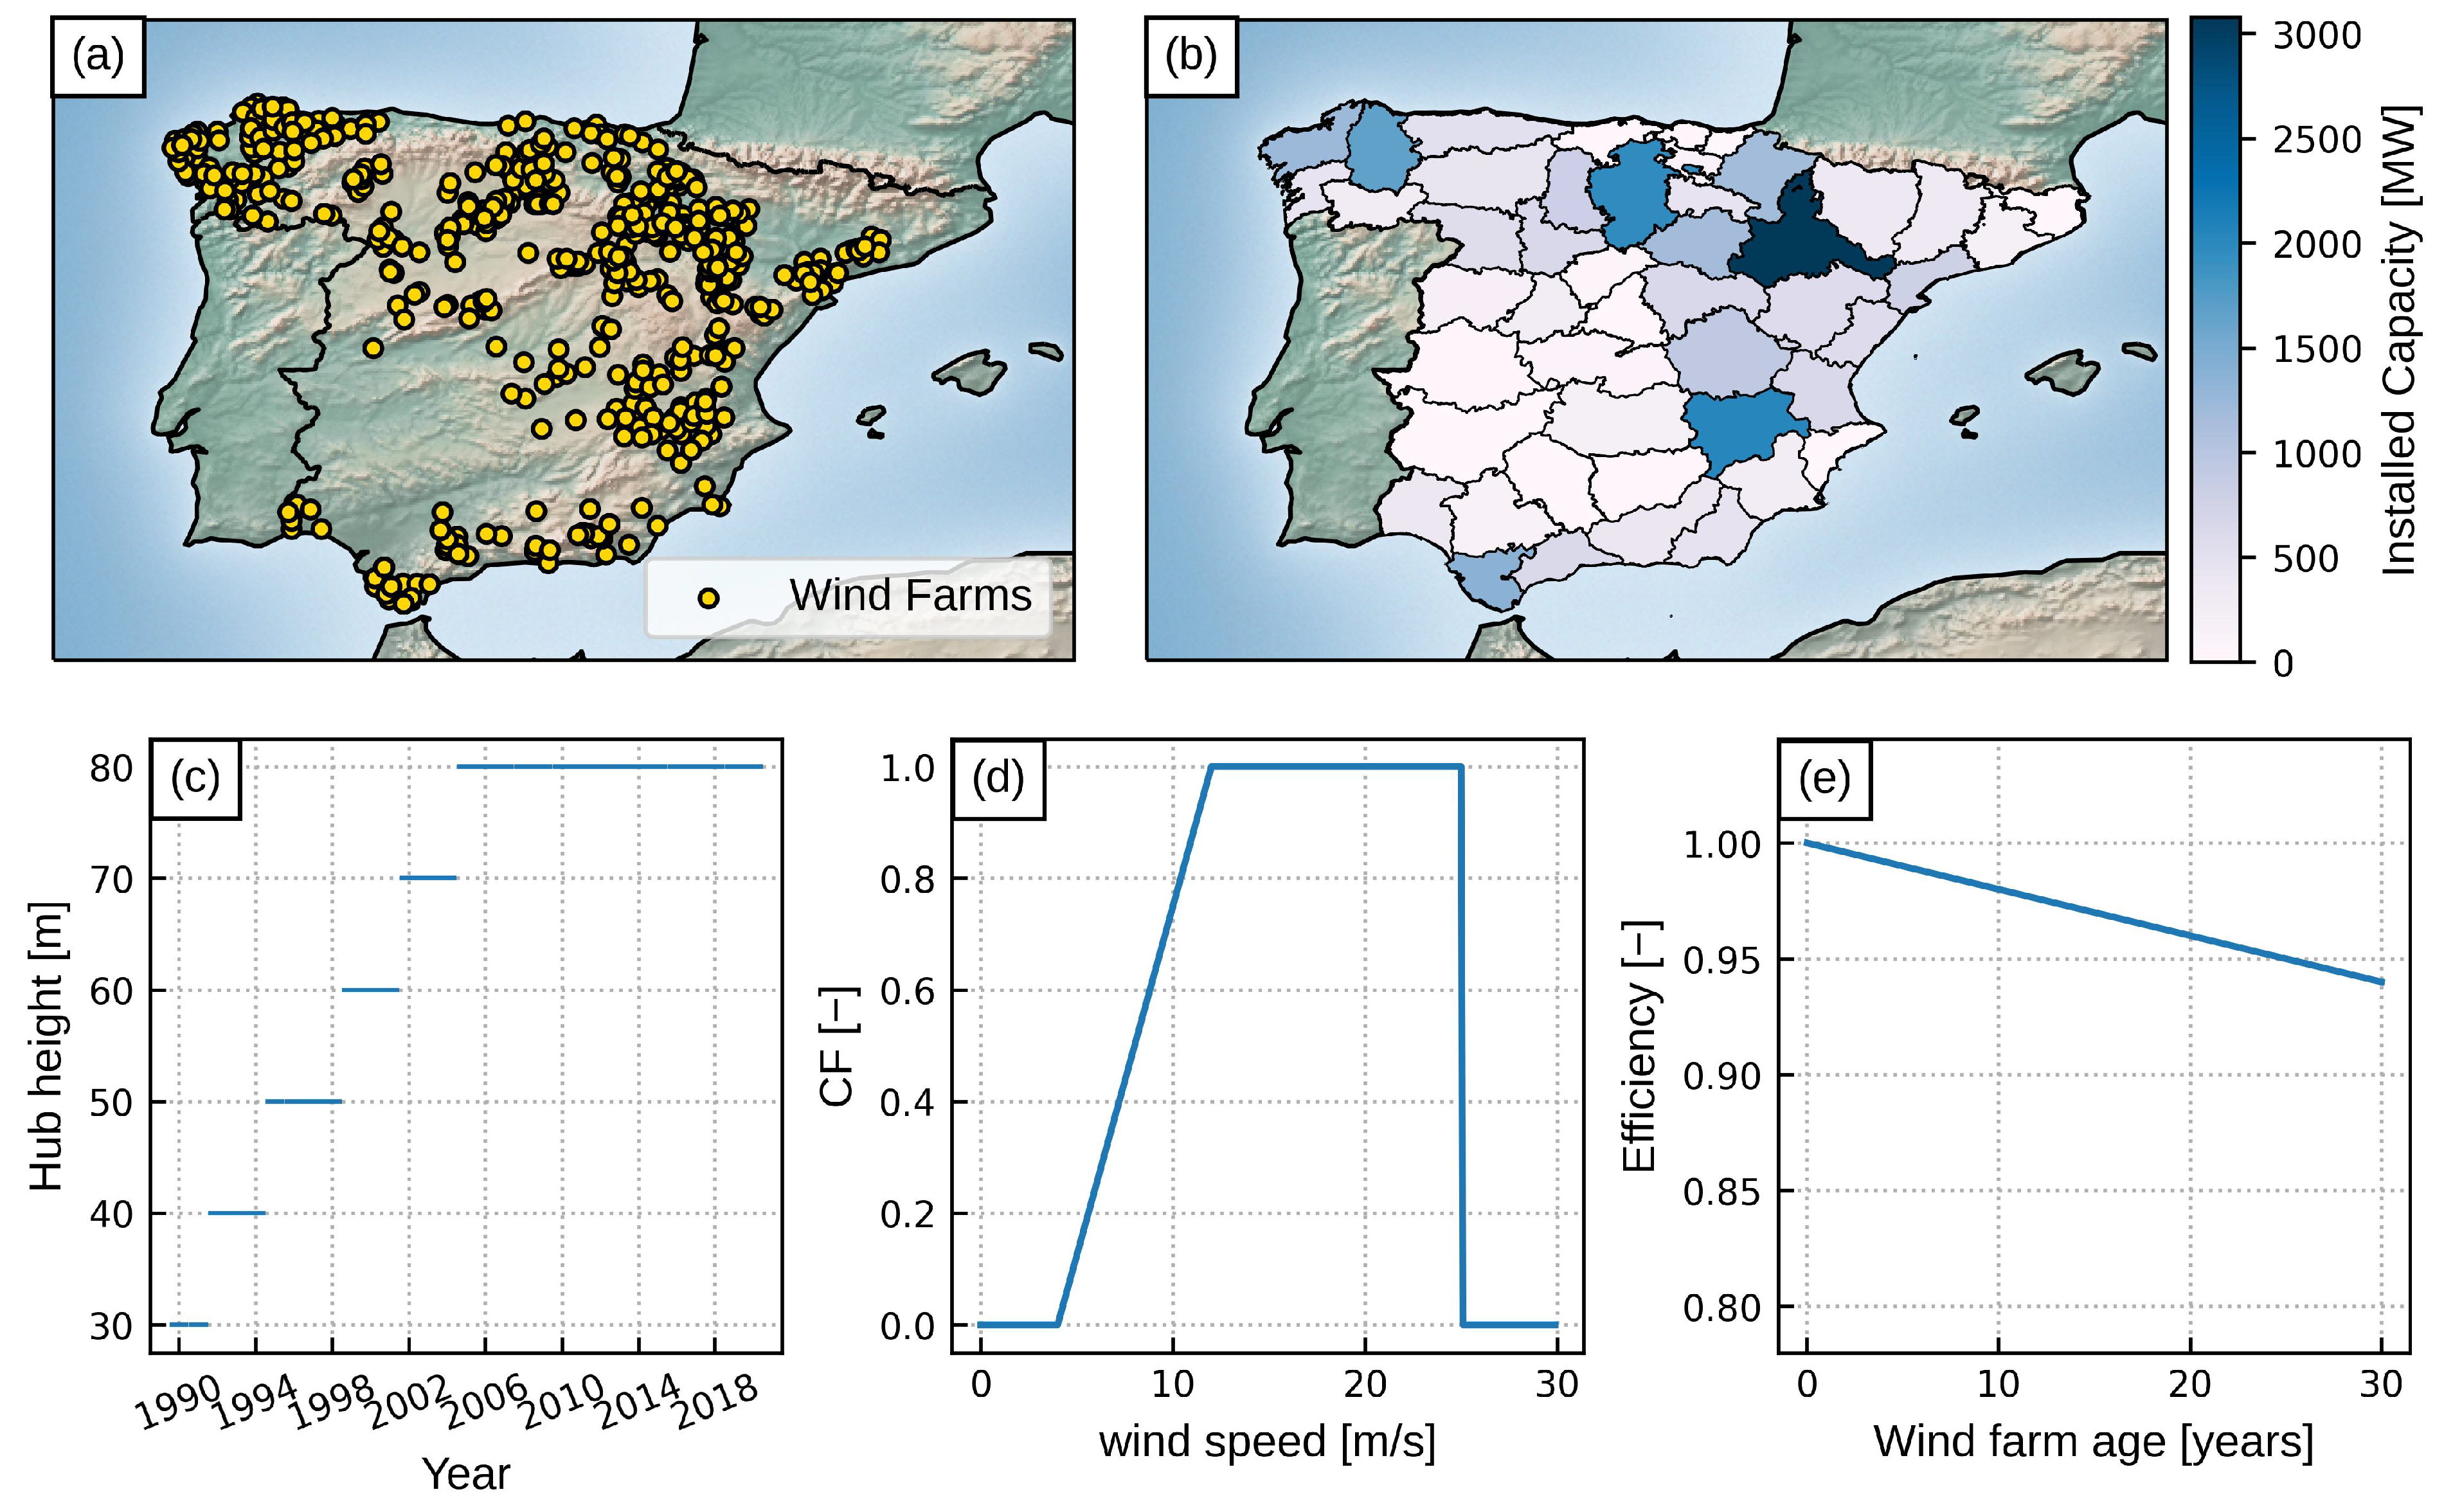
The main objective of this work is to provide an open access database (hereinafter referred to as RetroDB) of the wind energy resources of Spain, to be used in energy system analyses and wind energy integration studies in general. The database consists of two parts. The first part contains hourly wind speed estimates at different heights, at 5 km spatial resolution, for the study region, covering the period of 1996–2020. The second part consists of hourly capacity factor (CF) estimates (i.e., wind energy generation values normalised to the installed capacity) for the Spanish NUTS 3 regions [32] (about 10,000 km
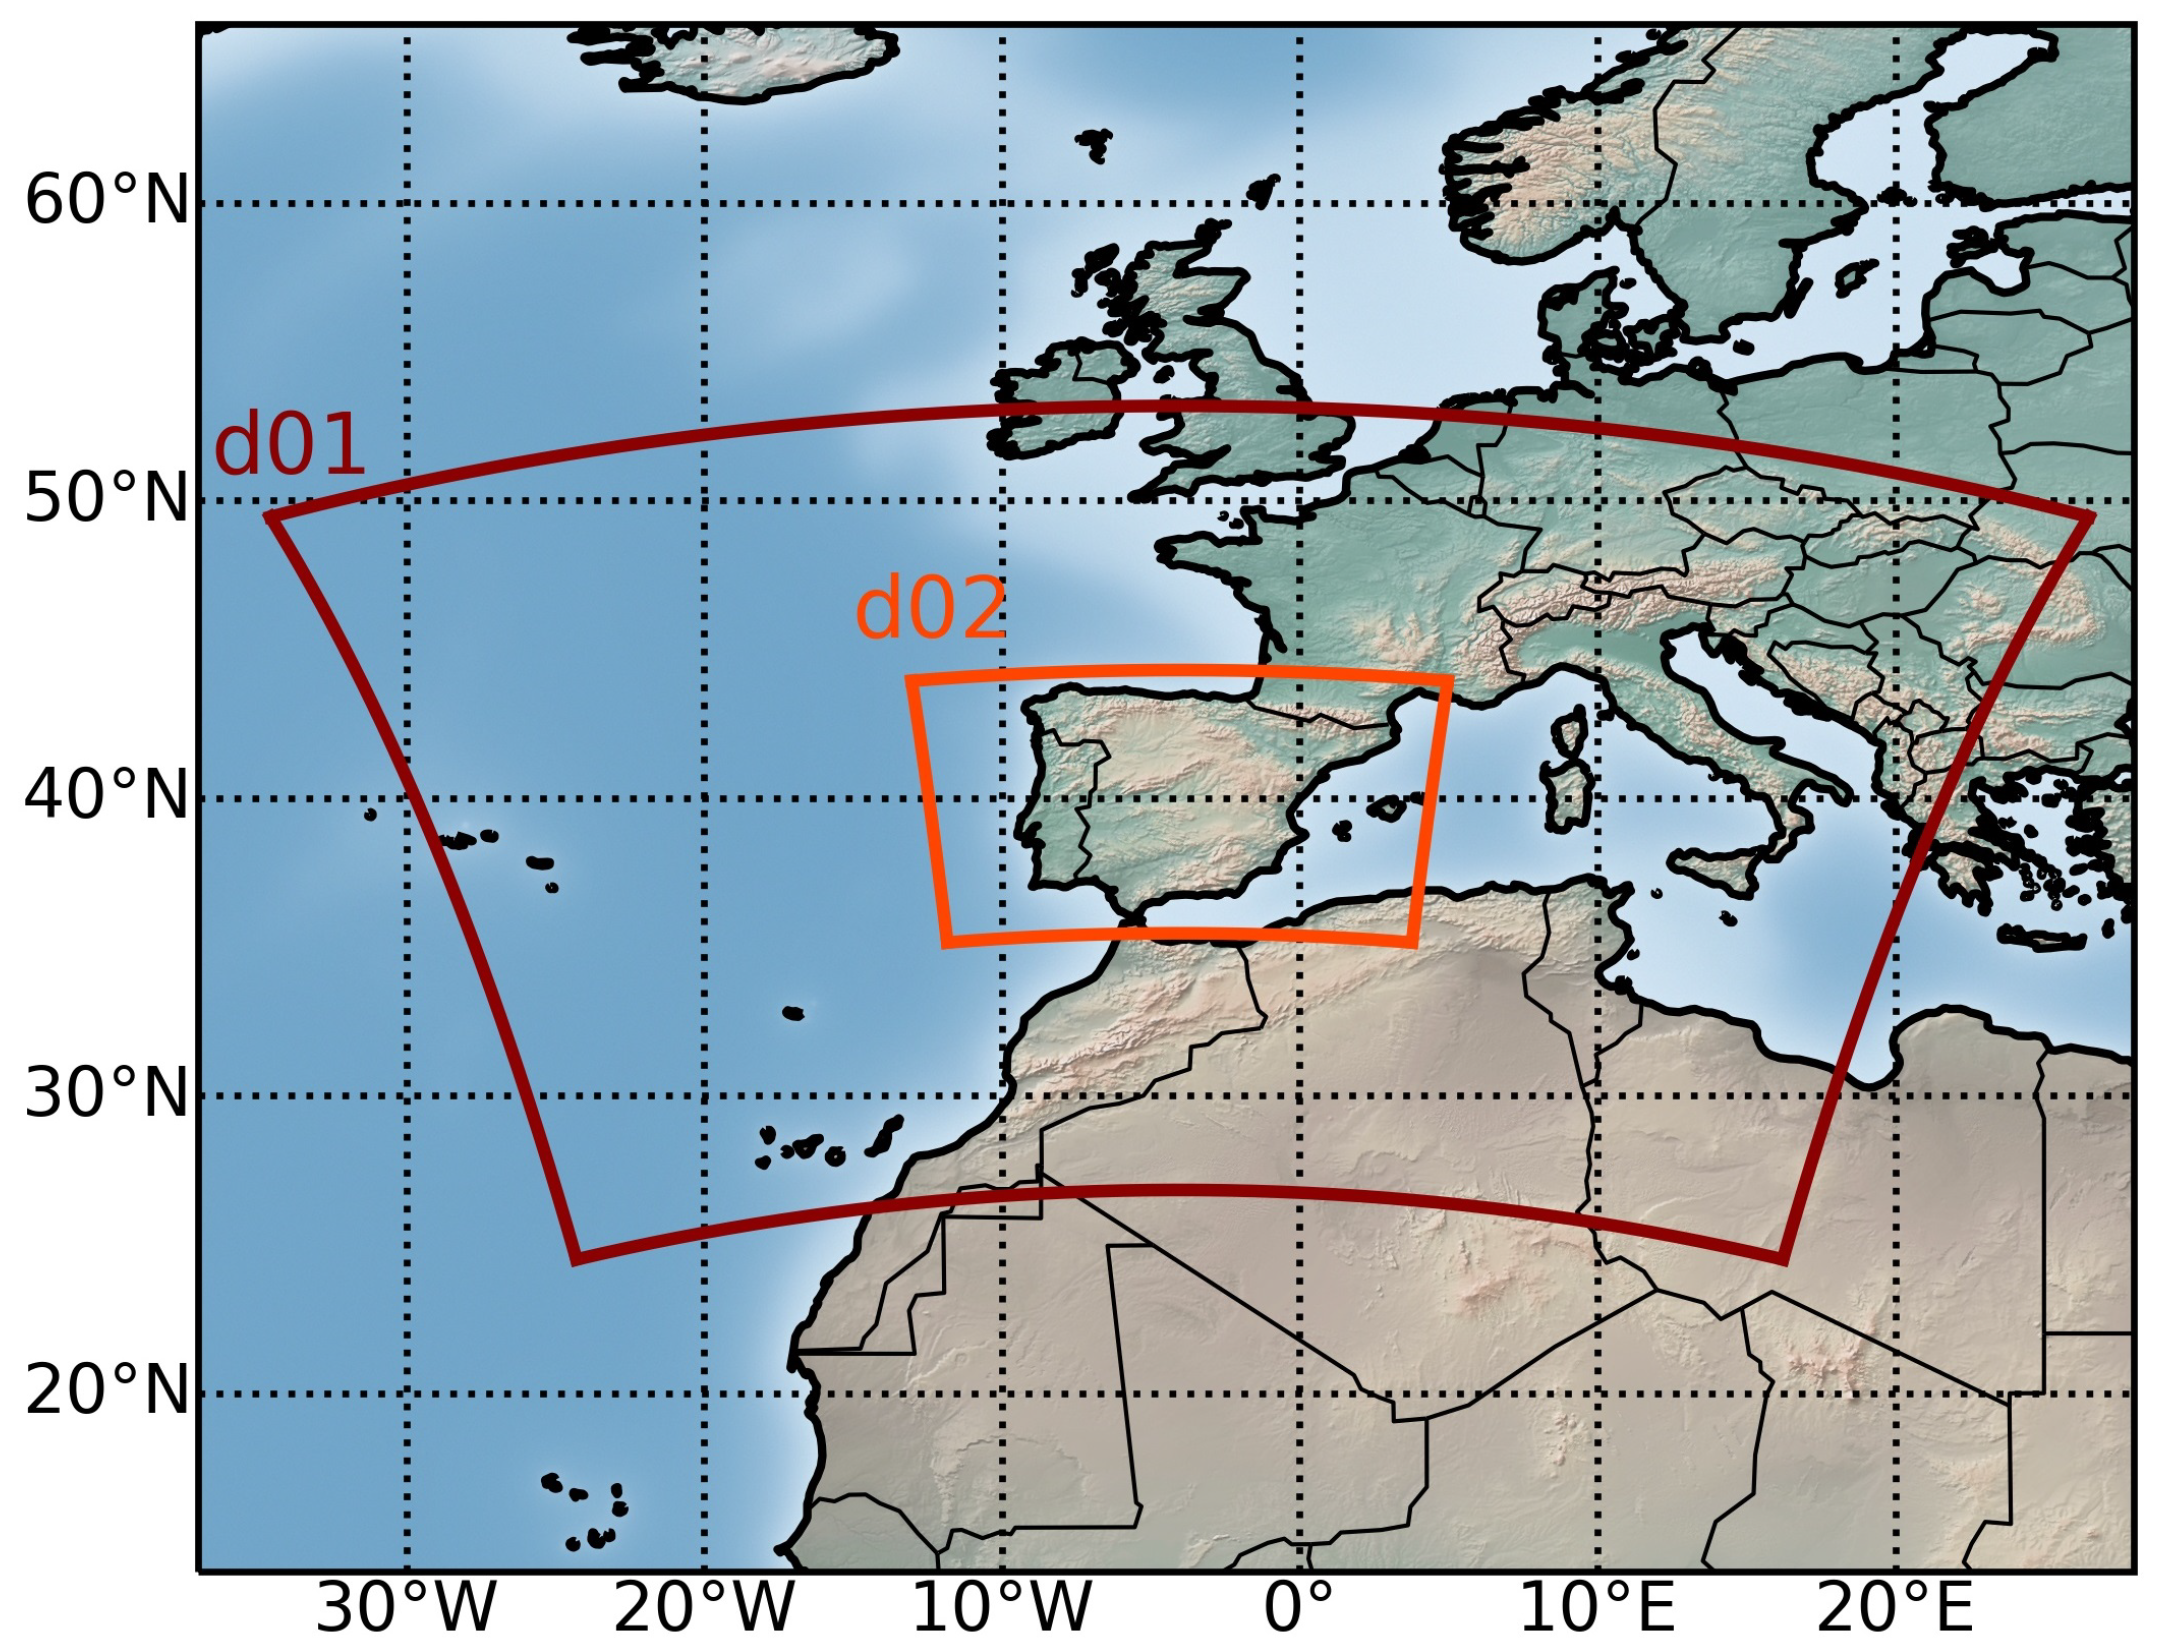
2 average area) along the period of 2007–2020. The RetroDB database was derived from a high spatial resolution integration with the WRF-Solar suite [33]. The CF values were derived using a physical-based model that makes use of the wind estimates and an upgraded version of the SOWISP dataset [34]. For the sake of benchmarking, wind and CF estimates were also derived from the ERA5 global reanalysis (hereinafter ERA5 database) following the same procedure. A comprehensive evaluation study of both RetroDB and ERA5 estimates was conducted.
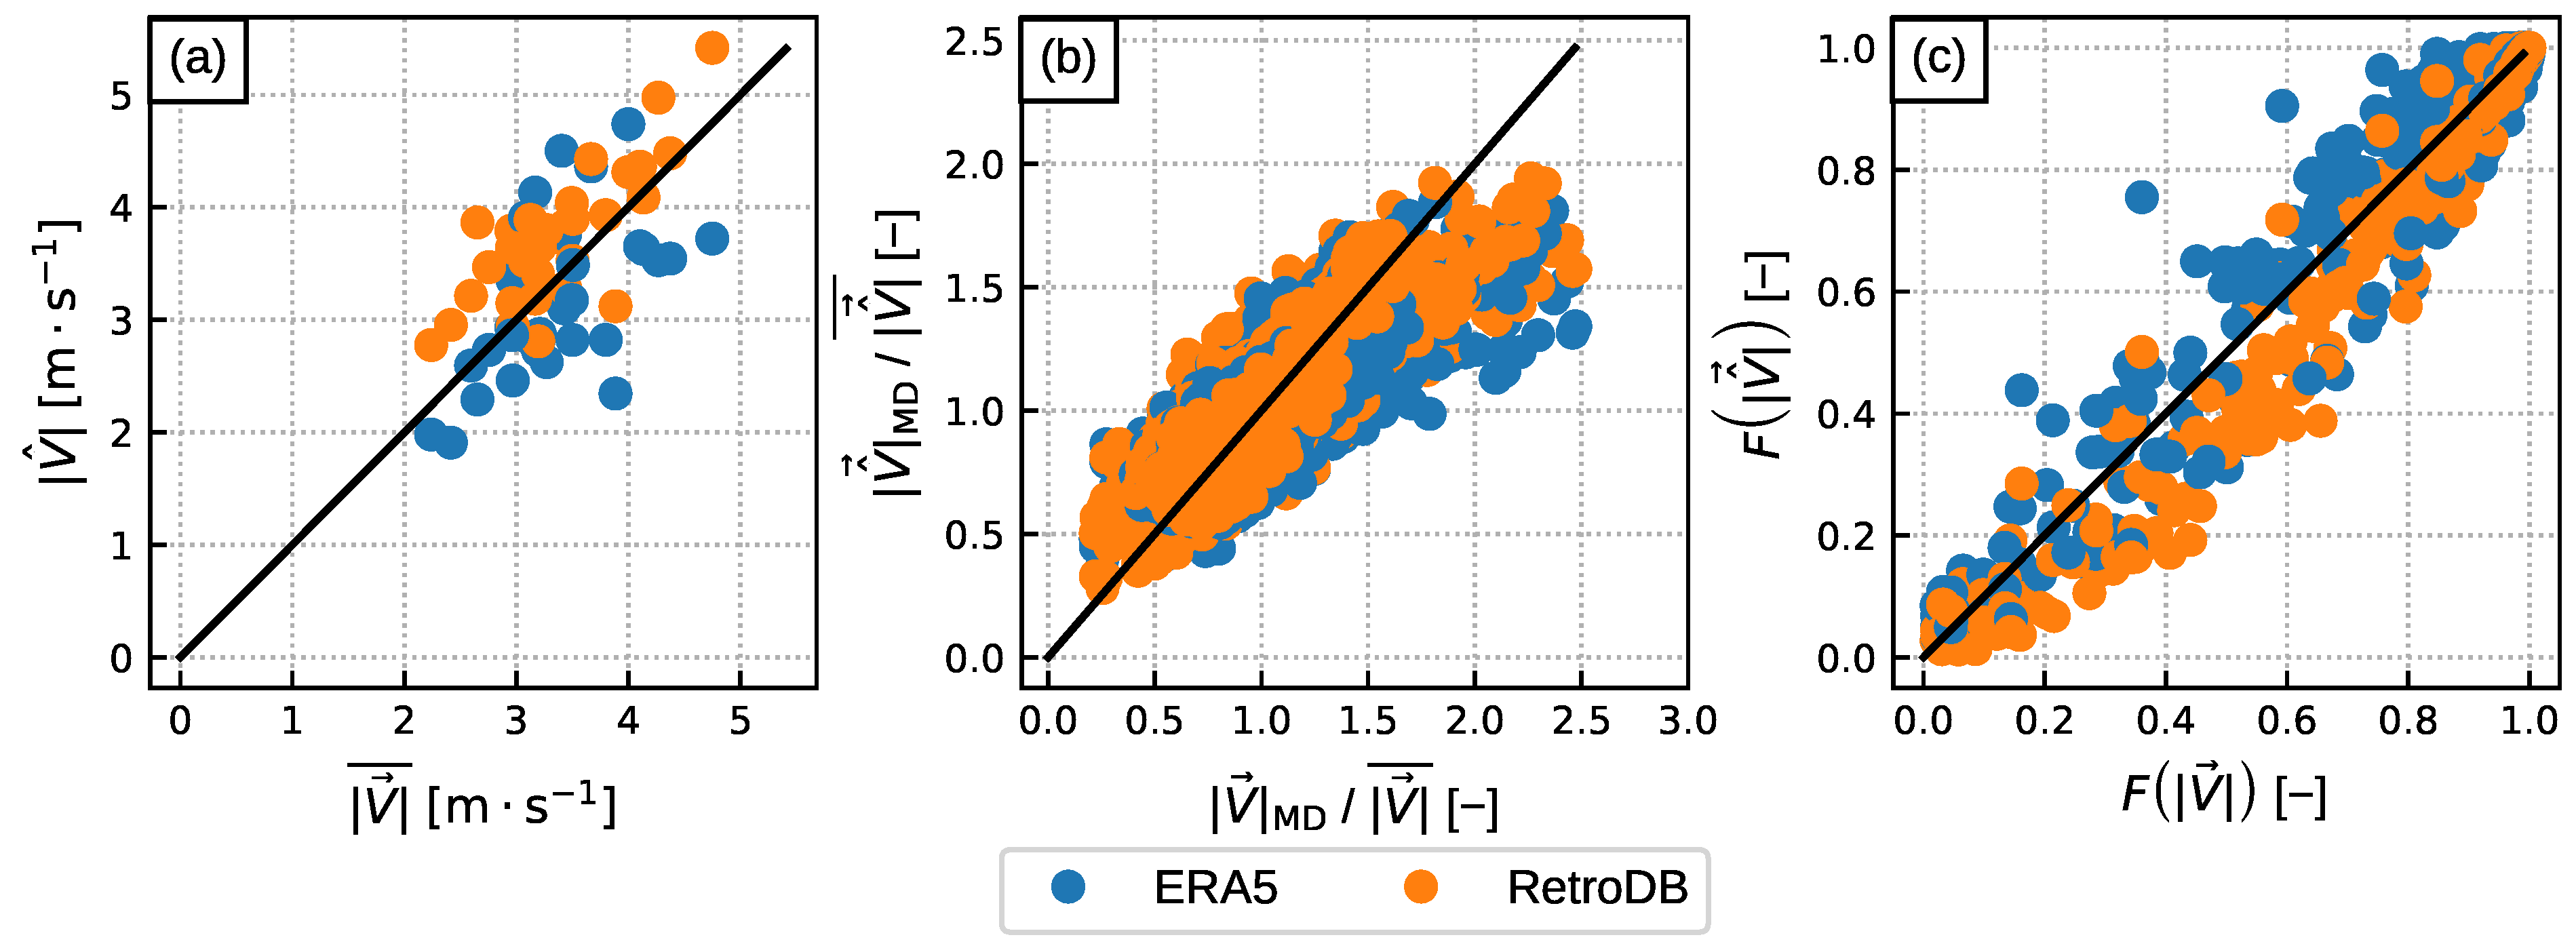
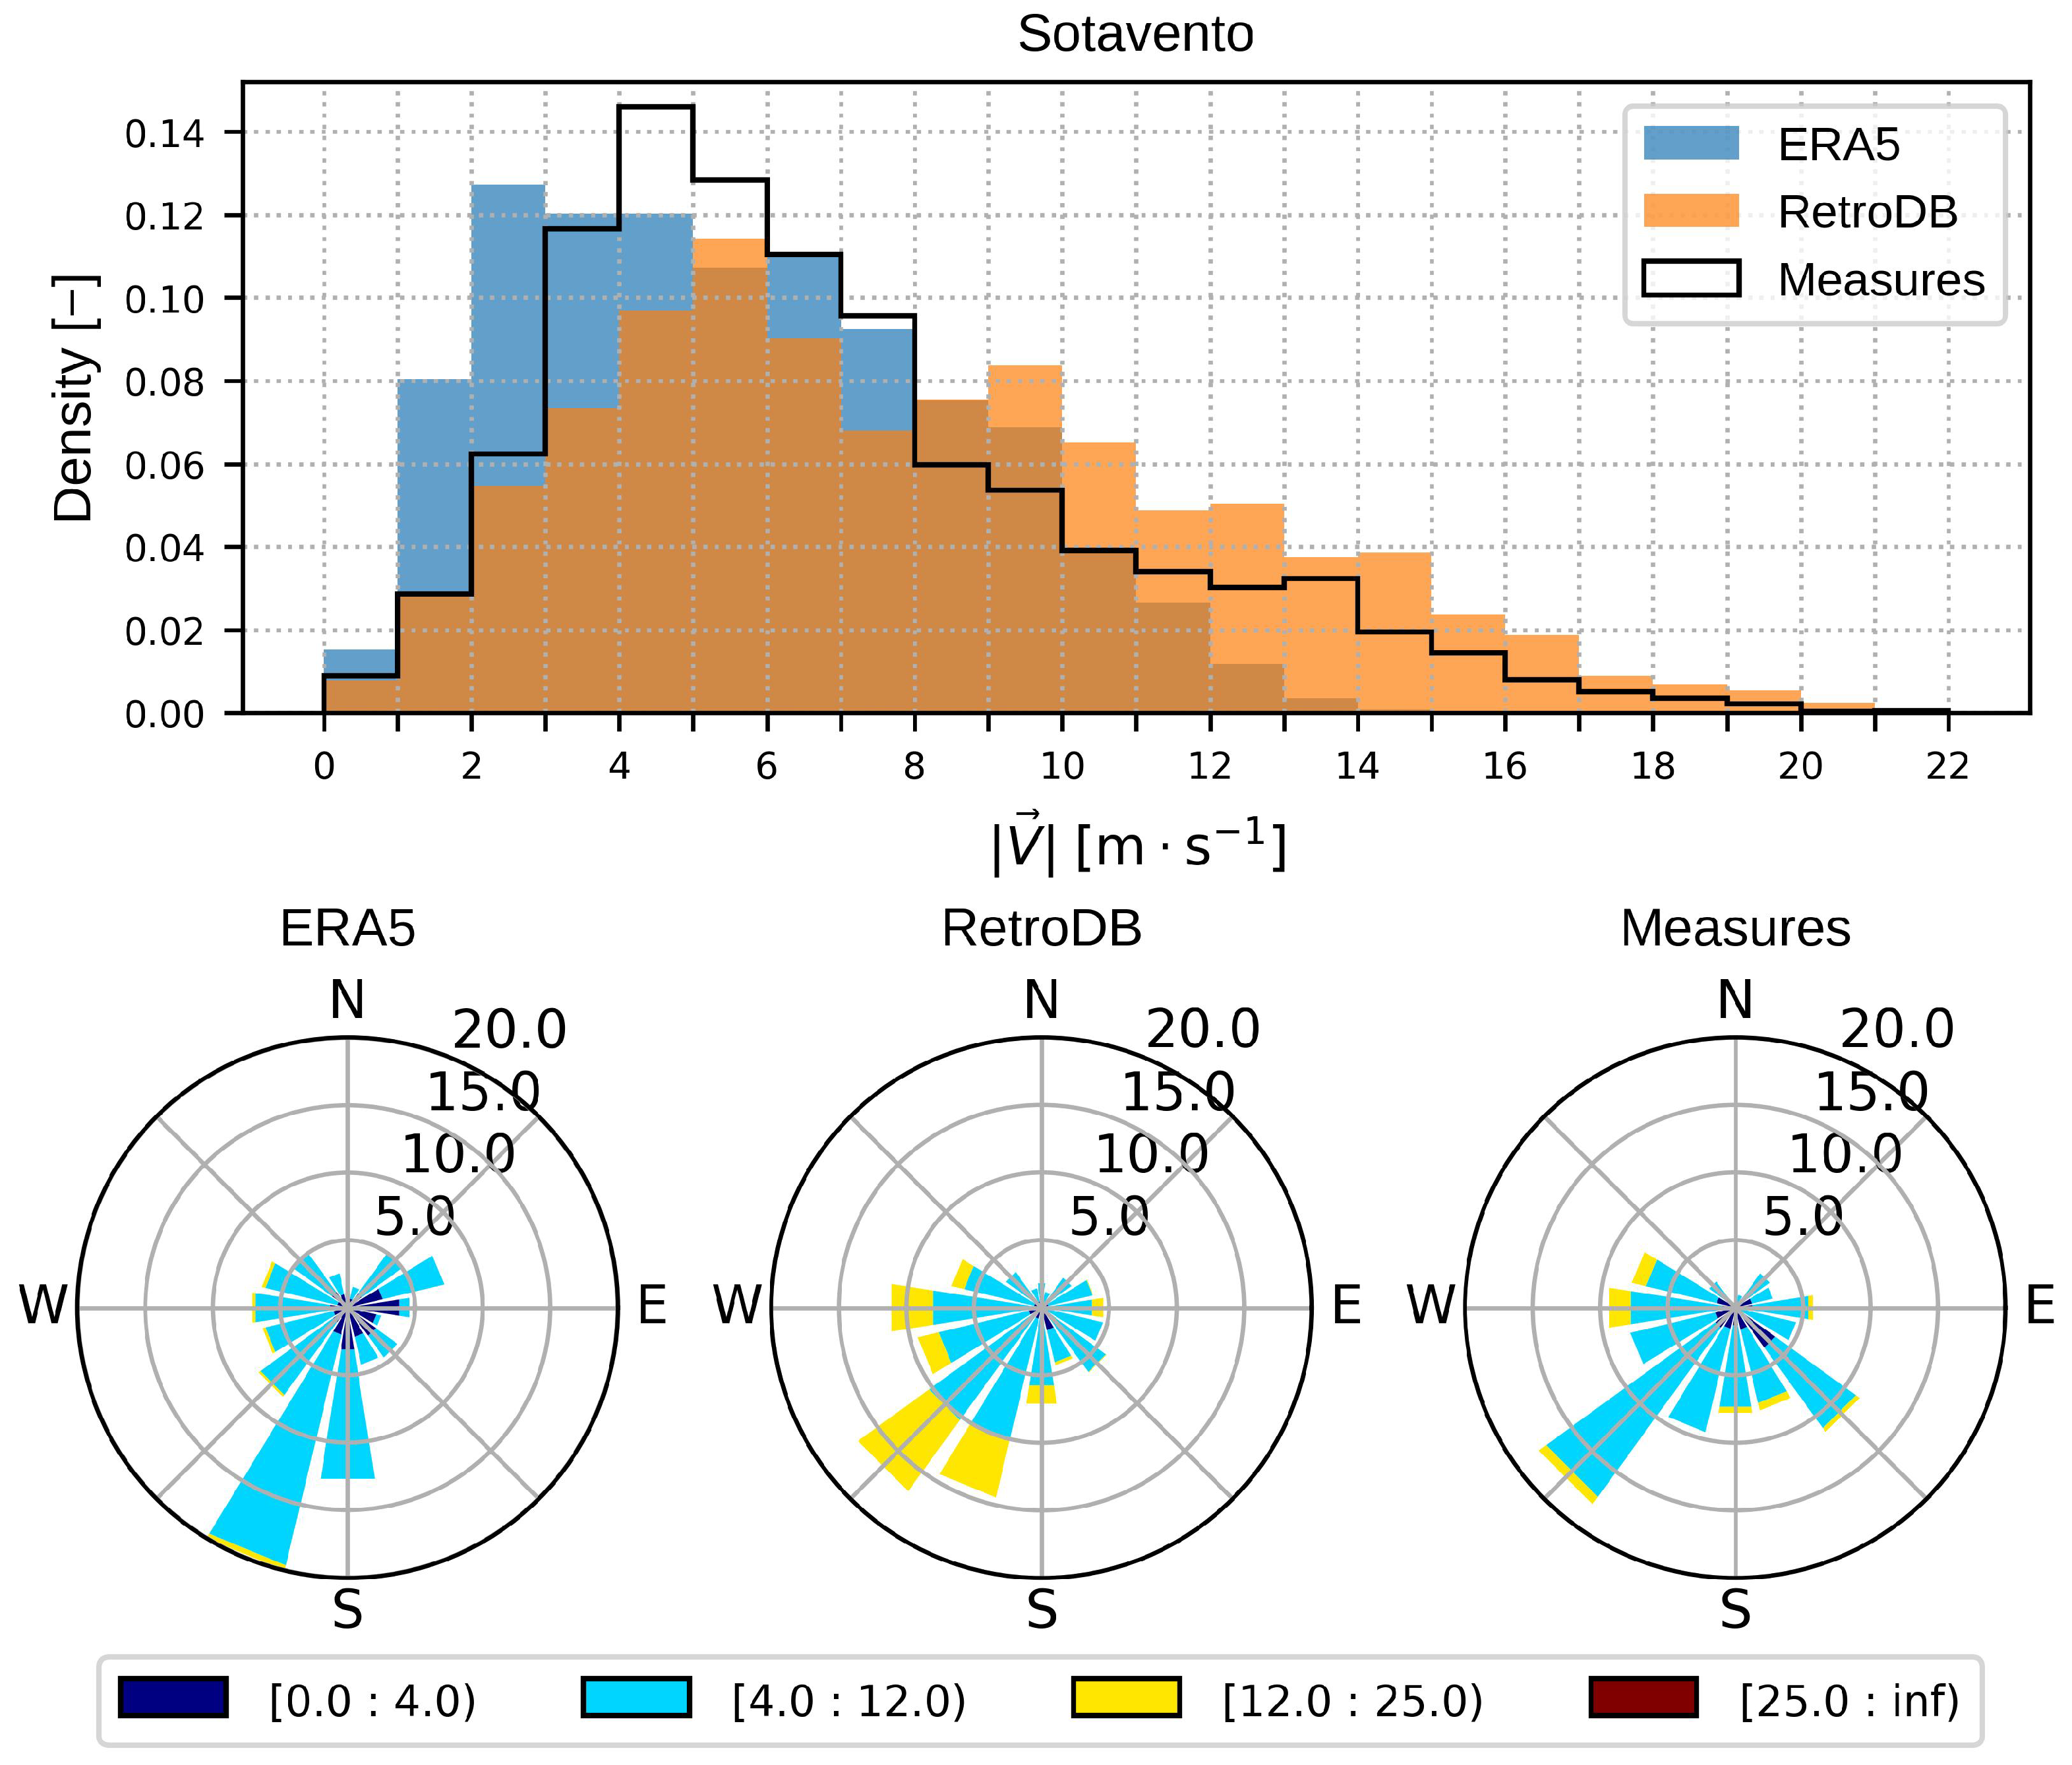
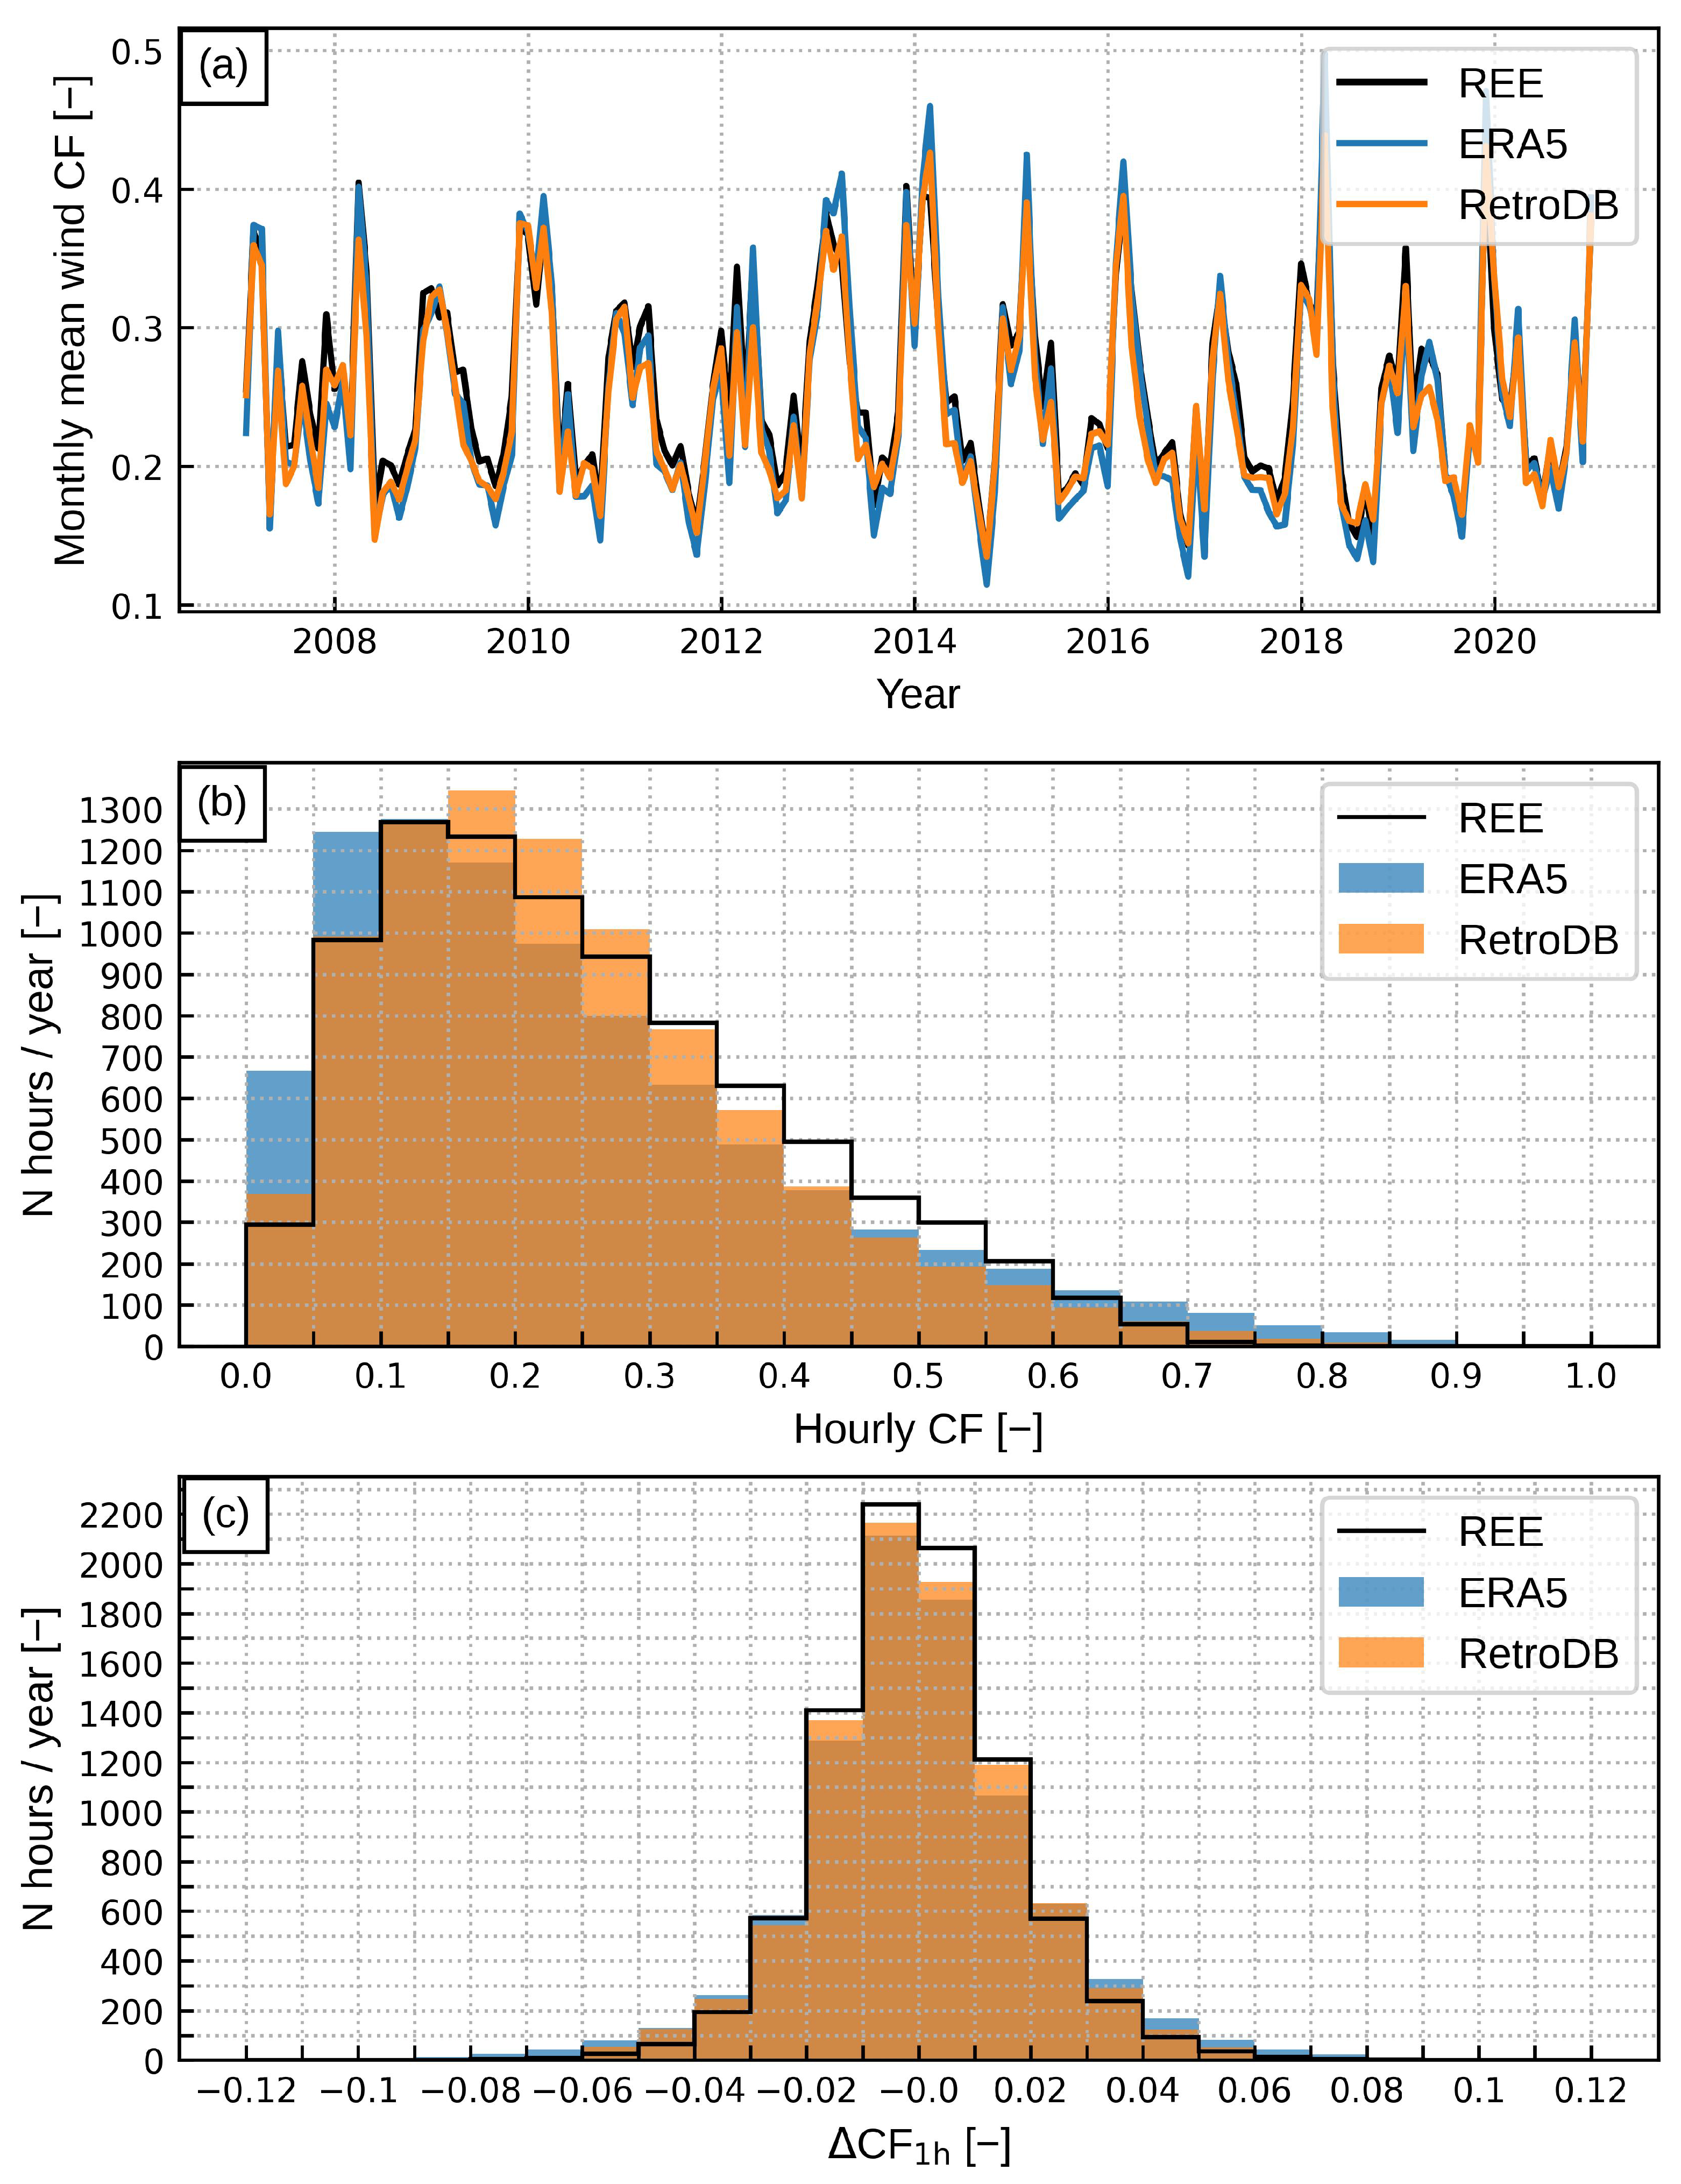
Firstly, wind estimates are evaluated against surface and tall mast measurements. Secondly, upon the wind estimates, regional and national CF estimates were obtained for Spain using a physical model. The extent to which RetroDB and ERA5 reproduced the CF spatial variability, CF distribution, and CF ramp distribution was specifically addressed. The evaluation study allowed addressing the two following scientific questions:
1.
To what extent are state-of-the-art global and regional reanalyses able to reproduce the temporal and spatial variability of wind speed and wind energy resources in a country with a Mediterranean climate and whose wind energy resources are tied to topographic features?
2.
What is the added value, if any, of high-resolution regional reanalysis in this context?
Several characteristics of the study area make the study worth attempting. Firstly, the study area is located in the Mediterranean area, where wind power estimates derived from global reanalyses have shown a particularly poor performance [9], and validation studies are scarce [16,25]. Secondly, wind resources in the study area are mainly associated with topographic features and local thermal contrast. The topographic effects, particularly, have been shown to account for around 50% of the wind speed in mountainous regions of Spain [35]. Therefore, the spatial resolution of the databases plays a fundamental role. In addition, Spain has ambitious objectives regarding the wind energy share in their near-future power system.
To the best of the authors’ knowledge, RetroDB is the wind energy CF database of an entire country with the highest spatial resolution released to date. Most databases provide country-aggregated CF values or, at most, for European NUTS 2 regions [36]. The high spatial resolution of RetroDB allows for a proper analysis of the spatial variability and facilitates the use of the database in wind energy integration studies.
This work is organised as follows. Section 2 describes the climate of the study region, the WRF model integration and the evaluation datasets. Section 3 addresses the methods used in this work. The section is divided into two parts. In the first part, the model used to derive the wind power estimates are presented. A procedure for the correction of the CF estimates is also discussed. Secondly, the evaluation statistics and procedures are presented. Section 4 presents and discusses the evaluation results, firstly for wind speed and secondly for wind energy estimates. Finally, in Section 5, a summary and some overall conclusions are provided.

2. Data

In this section, the WRF model integration and the different evaluation datasets used in this study are described. The study region, the Iberian Peninsula, is located in a transition zone between temperate and subtropical climates. The atmospheric circulation is dominated by a semi-permanent high pressure centre located over the Azores Islands. Although the entire region is under the influence of this centre, the region has a wide range of climatic conditions, related to the variation in the location of the centre throughout the year, the influence of the Mediterranean Sea and the varied topographical characteristics [37]. It should be noted that the eastern part is less influenced by the Azores High and more affected by the Mediterranean Sea, while the western and northern parts are more influenced by the atmospheric flow controlled by the Azores High. Annual precipitation varies from 200 mm in the southeast to more than 2000 mm in the northwest.

2.1. Regional Reanalysis and ERA5 Data

Previous studies [22,31] have reported a very high spatial variability of the wind energy resources in the Iberian Peninsula, with wind resources mostly being associated with topographic features. Consequently, a high spatial resolution integration with the WRF-Solar suite [33] numerical weather prediction model was conducted to derive the RetroDB database. The WRF-Solar suite is based on the WRF model v.4.2.2 and was used here to provide physically coherent wind and solar resource estimates for the study area. Model integration was configured with 45 vertical levels and two one-way nested domains of 15 and 5 km spatial resolution (Figure 1).
Integration covered the period of 1996–2020, and the data from the inner domains were used in this work. ERA5 [38] reanalyses were taken as initial and boundary conditions. The physical configuration (Table 1) was based on the reference guide of WRF-Solar [33] and the results from previous works [22,39]. Thus, radiation is parameterised with the Rapid Radiative Transfer Model for Global Climate Models (RRTMG) updated every 10 min, both for short and long wave radiation, and the cloud effect to the optical depth in radiation has been activated. Moreover, aerosols have been included using Tegen climatology. The Kain–Fritsch scheme has been chosen to parameterise the cumulus physics in the coarse domain D01. For D02, no cumulus parameterisation is used, considering its resolutions to be within the convection permitting zone. The boundary layer is parameterised with the Nakanishi and Niino [40] scheme, while the graupel scheme developed by Thompson was selected for the microphysical representation. The simulations were conducted with a spin-up of 24 h, outputs were saved every 10 min and, then, horizontal wind components were averaged by hour. Wind estimates from the model output were interpolated using a cubic spline method to derive the wind estimates at heights of 40, 50, 60, 70, and 80 m above ground level, which are used in the wind energy model (see Section 3.1).
Table 1. Schemes used in the WRF integration for the Planetary Boundary Layer (PBL), the Micro Physics (MPH), Cumulus Formation (CMS), Short- (SWR), and Long-Wave Radiation (LWR) parameterisations.
ParameterisationSchemes
PBLMYNN3 [41]
MPHThompson [42]
CMSKain–Fritsch [43]
SWRRRTMG [40]
LWRRRTMG [40]
Wind speed values derived from the ERA5 global reanalysis [38] were also used in this work for benchmarking purposes. ERA5 data are widely used for the evaluation of wind energy resources and have been found to provide enhanced performance in this regard compared to other GARs [21]. Hourly horizontal wind speed values at 10 and 100 m above ground level were used as inputs for an interpolation model to derive wind speed estimates.

2.2. Wind Measurements

Wind estimates derived from the RetroDB and ERA5 databases were evaluated using wind measurements collected at 31 ground stations throughout the study area and 2 tall masts. The use of the surface stations allowed assessing the reliability of the RetroDB and ERA5 databases, reproducing the spatial variability of the wind speed.
The surface stations (Figure 2) are part of the NOAA’s Integrated Surface Database [44], which consists of a compilation of hourly surface wind records from more than 35,000 stations distributed worldwide. The stations were selected to account for most of the continental Spanish climatic regions characteristics and are mainly located in open areas (airports) with little topographic complexity. The hourly data of the years 2019 and 2020 were used in this work. A quality control based on Ref. [45] was applied. After this procedure, only 4.06% of records were considered as suspicious and removed.
The wind mast dataset consists of wind speed and direction measurements, recorded at 40 m above ground level, located in two areas with distinctive climatological and topographic characteristics (red crosses in Figure 2). The first area is located at the Sotavento experimental wind farm [46], in the northwest of the Iberian Peninsula. This mast is located in an area of relatively low topographic complexity, with elevations below 600 m, at about 30 km from the coast. The wind resources in this area are mainly associated with the predominant mesoscale atmospheric circulation, while topographic (hill/valley) effects only play a secondary role. The second mast is located at the Sierra del Trigo (hereinafter SierraTrigo) wind farm, in the southeast of the Iberian Peninsula. In opposition to Sotavento, the SierraTrigo mast is located at the top of a hill, in a mountainous area with height values ranging from 700 to 1650 m. Wind resources in this area are related to topographic enhancements. Wind speed and direction, recorded at the two masts every 10 min for the year 2020, were used. A quality control procedure, based on Ref. [45] was conducted to discard unrealistic values. The 10-minute measurements were then averaged to derive hourly values. In order to perform this temporal aggregation for the wind direction, the circular property of this variable was considered [47].

2.3. Wind Energy Data

A physical model (described in Section 3.1) was used to derive wind power estimates (in CF units) from RetroDB and ERA5 wind estimates. Obtaining observed wind power estimates for model validation purposes is a challenge [48]. Due to owner restrictions, observed values are hardly ever available at a windmill or even wind farm levels; only country aggregate values are usually available, which limits the scope of the models.
In this work, an alternative approach was used, in order to obtain and validate wind power models with relatively high spatial resolution. The approach makes a synergetic use of two datasets. The first dataset is an upgrade of the SOWISP dataset [34], which provides the wind power installed capacity at each of the Spanish towns. In the present study, this SOWISP methodology was improved to: (i) extend back in time the period of the installed capacity database up to 2007 (originally 2015); (ii) increase the time resolution to hourly values; and (iii) obtain the commissioning dates of each wind farm.
Figure 3a shows the locations of the wind farms in the study area, as of December 2020. Most of the wind farms are located in mountainous areas, making use of the topographic enhancement of the wind, as in the SierraTrigo wind farm. The only exception is the great concentration of wind farms observed in the northwestern area of the Iberian Peninsula. As for the Sotavento wind farms, the wind resources in this area can be explained based on a favourable mesoscale atmospheric circulation. The second dataset is composed of actual wind energy generation data, and is provided by the Spanish Transmission System Operator (TSO) REE [49]. The data are available, at hourly resolution, for each of the Spanish NUTS 3 regions (Figure 3b). The proposed physical model makes use of the upgraded SOWISP dataset and the ERA5/RetroDB wind speed estimates to derive hourly CFs aggregated for each of these regions. Model validation was conducted using the REE data, with the average size of the regions (40) being about 10,000 km2. This approach allowed deriving and validating, for the first time, a wind energy database with a high spatial resolution for an entire country.
For the sake of summary, Table 2 shows the main characteristics of the different datasets used in this work, and which were presented in Section 2.

3. Methods

3.1. Wind Energy Generation Model

A physically based model was used to estimate the hourly wind energy CF values based on: (1) the RetroDB/ERA5 wind speed estimates; (2) the upgraded SOWISP database; and (3) data from the Spanish TSO. Similar models have been widely employed in previous studies (see Ref. [8] for a review). The model applied in this study is composed of the following steps (Figure 3c–e).
1.
Firstly, the active wind farms located within the boundaries of the selected region (in this work, the Spanish NUTS 3 and the whole of Spain, Figure 3) were retrieved from the upgraded SOWISP database. As described in Section 2.3, this database provides the location of the wind farm, its installed capacity and the de/commissioning dates at hourly time resolution.
2.
In a second step, for each wind farm, the grid cell closest to the location was selected, and the corresponding horizontal wind speed at the hub height was obtained from ERA5 and RetroDB, following the methods described in Section 2.1. The approximate hub height of each wind turbine was established based on the wind farm commissioning date following Ref. [8]. This approach aims to account for the wind turbine technology development throughout the last two decades, making use of the temporal distribution of hub heights shown in Figure 3c.
3.
Then, the corresponding hourly CF values for each wind farm was obtained based on the power curve represented in Figure 3d. This power curve was built after the analysis of the most common power curves installed in Spain during the study period [50]. In order to derive the CF values, the curve was normalised by the corresponding nominal power.
4.
The power curve applied in the previous step represents an ideal behaviour of a wind turbine/farm. However, different sources of losses can affect the turbine efficiency, moving it away from this ideal behaviour. Some of these losses, such as wake losses and electric losses, can be computed as a percentage of the gross annual energy production, resulting in a bias [51,52]. However, other sources of loss show a strong dependence on the selected region and period of time, and thus should be corrected individually on each wind farm. This is the case of the reduction in wind turbine performance with time, usually known as “ageing”. In order to correct this effect, in this study, an accumulative reduction of 0.2%/year (Figure 3e), as proposed by Ref. [53], was applied on the CF values obtained in the previous step, taking into account the commissioning date of each wind farm.
5.
Next, the corresponding wind farms’ corrected CF values were aggregated at each time step to derive the CF values at the selected region. In the aggregation process, the relative contribution of each wind farm to the corresponding total installed power in the region was used as a weight factor.
6.
Previous studies have reported that wind energy estimates from GARs tend to be biased by a positive or negative magnitude, which depends on the study region and GARs dataset [9,12,17]. Therefore, a post-processing correction is necessary to obtain accurate wind energy estimates. In this study, the correction model proposed by Ref. [9] was applied to correct the bias in the CF values. This method observed CFs for the correction of the ERA5 and RetroDB CF estimates. The approach relies on fitting a linear equation, which depends on the ratio of observed to simulated CFs, to correct the wind speed estimates (see Appendix A for details). Then, the corrected wind speeds are used to derive enhanced CFs. It should be noted that this method assumes the same wind speed correction equation for all the wind farm locations and for all the wind turbine hub heights. In addition, the method assumes that the energy model estimate errors can be attributed to the reanalysis of wind speed estimates, rather than to the model used for converting them to energy output.

3.2. Validation Statistics

Different statistics were used to evaluate the surface and aloft wind speed, as well as CF estimates. Firstly, some common statistics were used:
  • Bias:
    1 n i = 1 n ( y i ^ y i )
  • RMSE:
    1 n i = 1 n ( y i ^ y i ) 2
  • Correlation coefficient:
    i = 1 n ( y i ^ y ^ ¯ ) ( y i y ¯ ) i = 1 n ( y i ^ y i ^ ¯ ) 2 i = 1 n ( y i y ¯ ) 2
where y i / y i ^ stand for the actual/modelled values of wind speed and CFs.
Secondly, two statistics proposed by Ref. [16] were used. The first one evaluates the extent to which the modelled wind speed and CFs diurnal and annual cycles are reproduced:
e MD = y ^ M D ¯ y ^ ¯ y M D ¯ y ¯
where y M D ¯ is the mean wind speed/CF value at each hour of each month and y ¯ is the mean wind speed/CF. The second index evaluates the difference between the modelled and measured wind speed/CFs distribution:
e F = 0 | F ( y ^ ) F ( y ) | d y
where F ( y ^ ) is the modelled cumulative distribution function and F ( y ) is the observed one.
For the mast wind speed estimates, the reliability of the modelled wind direction estimates is evaluated using the Direction Accuracy statistics (DACC), defined as:
DACC = 1 N i 1 if 0 Δ θ 30 0 else
where
Δ θ ( α , β ) = min [ α β , 360 ( α β ) ]
is the circular distance between two angles [47].
As was highlighted in the introduction, RetroDB is designed to be useful for energy system analysis and wind energy integration studies in general. To this end, it is important to evaluate the extent to which this database reproduces the spatial variability of wind speed/CFs, as well as CF distribution and their ramp distribution. Ramps are here defined as the difference between two consecutive hourly CF values. The spatial variability can be assessed based on the analysis of the spatial correlations of wind speeds/CFs. In general, this correlation decreases with distance, following an exponential function, although the exact form of the curve depends on the main meteorological regimes and the topographic features of the study region [23,54]. From the analysis of this curve, parameters such as the decorrelation length scale (i.e., the separation distance at which those time series become minimally correlated or uncorrelated) and the length scale (i.e., the distance at which the spatial correlation decreases by an e factor), can be derived. These parameters have important implications for the wind energy integration [18,55]. In this work, the observed and modelled length scale [16] for the surface wind and CFs were computed. To this end, firstly, the correlation of surface wind speed/CFs as a function of distance was computed. Then, an exponential model was adjusted to derive the length scale parameters.
Finally, the ability of the ERA5 and RetroDB to reproduce the observed CFs distribution and the CFs ramp distribution was evaluated by comparing the modelled and observed distribution.

4. Results and Discussion

4.1. Meteorological Validation

4.1.1. Surface Wind Speed Analysis

This study evaluates the performance of RetroDB and ERA5 surface hourly wind speed estimates. The results are summarised in Table 3 and Figure 4 and Figure 5, along with in Figure A1 of Appendix B.
Table 3 shows low mean bias values across stations, with the ERA5 value being lower ( 0.20 vs. 0.35 m/s). As can be observed in Figure 4a, the low values of ERA5 are related to a compensation effect across stations, while the RetroDB values show less dispersion. This effect is reflected in the lower standard deviations of the bias values reported in Table 3 for RetroDB (0.60 vs. 0.39 m/s). Figure A1 of Appendix B shows that ERA5 tends to underestimate/overestimate the wind speed at inland/coastal stations. RetroDB, on the other hand, shows considerably lower spatial variability of the bias values. ERA5 provides slightly better mean correlation (0.75 vs. 0.71) and RMSE (1.60 vs. 1.69 m/s) across station values (Table 3). The standard deviation of both statistics are relatively low, and their spatial distributions are fairly homogenous (Figure A1).
RetroDB estimates provide a slightly lower error when reproducing the diurnal cycle (0.006 vs. 0.005 Figure 4b and Table 3). Nevertheless, the magnitude of the errors for both analyses are low, indicating that RetroDB and ERA5 are able to fairly reproduce the diurnal wind speed cycle along the year. As for the diurnal cycle, RetroDB shows lower errors when reproducing the wind speed distribution across all the validation stations (0.62 vs. 0.52 in Table 3 and Figure 4c). ERA5, as can be observed in Figure 4c, shows a clear tendency to overestimate low speed values at some stations, resulting in the higher distribution mean error displayed in Table 3.
Figure 5 shows the observed and estimated spatial correlation values of the surface wind speed. To this end, the correlation of the surface wind speed as a function of the distance between stations was computed. In addition, an exponential fitting for each dataset was built in order to compare the observed length scale and that estimated by RetroDB and ERA5. The spatial variability is clearly better represented by RetroDB, whose estimates provide a fair representation of this variability for distances greater than 400 km (approx.). At lower distances, RetroDB provides a slight overestimation. The length scale is fairly reproduced (315 vs. 254 km). On the other hand, ERA5 clearly overestimates the spatial correlation along the entire window of analysis (from 0 to 1000 km approx.), showing a considerable length scale estimation error (481 vs. 254 km).
Overall, across stations, statistics (Table 3) show a similar performance in terms of ERA5 and RetroDB, reproducing surface wind speed values at hourly time scales. The coarser spatial resolution of ERA5 seems not to penalise the estimates reliability, probably due to the fact that the surface stations used in this study are located in relatively flat areas (mostly airports), where the wind speed estimates derived from this reanalysis are sufficiently reliable [56]. However, a more detailed analysis showed a superior performance of the RetroDB database, firstly, since the standard deviation of all the statistics were lower and their spatial distributions were more homogeneous. This indicates that ERA5 good results are, at least partially, caused by compensation effects between stations. Secondly, wind speed distributions are better reproduced by RetroDB. This is important regarding wind power, as this means that low/high wind events are better reproduced. Finally, spatial variability is considerably better represented by RetroDB, probably due to its higher spatial resolution.
This is an important result since the analysis of spatial variability involves the use of all the databases altogether, constituting a powerful synthetic measure of the ability of a model to reproduce the observed wind speed values over a specific region. Secondly, spatial variability is a key factor regarding the wind energy integration. To date, very few works have evaluated the surface wind speed derived from reanalyses at hourly time scales, and most of them have conducted analyses at coarser time scales. For instance, Kaiser-Weiss et al. [15] evaluated the performance of regional and global reanalyses in reproducing the surface wind speed in Germany. They found that, on both daily and monthly time scales, both types of databases provided strong correlation values, with the regional reanalyses performing slightly better than the global reanalyses. Molina et al. [57] evaluated ERA5 surface wind speed estimates for different European countries. At an hourly resolution, the reported correlation ranged from 0.6 to 0.85, with the values at the study region being similar to those reported in the present study. In addition, based on several statistical analyses, they concluded that ERA5 hourly wind speed estimates are valuable in wind energy applications.

4.1.2. Wind Mast Data Analysis

This section presents and discusses the results of the validation study of ERA5 and RetroDB hourly wind speed and direction estimates at the two meteorological mast locations described in Section 2.2. For the Sotavento mast, the correlation (0.84 vs. 0.82) and RMSE (2.37 vs. 2.67 m/s) values derived from both databases are similar (Table 4). Nevertheless, the bias results differ significantly; while ERA5 provides a negative value ( 1.27 m/s), the RetroDB derived value is positive (1.20 m/s). Figure 6 shows the negative bias of ERA5 to be caused, mostly, by an overestimation of the probability of wind speed below 4 m/s and an underestimation of the probability of wind speed above 10 m/s (approximately). On the contrary, the positive bias of RetroDB estimates is mostly associated with an overestimation of the probability of wind speed above 8 m/s. Both databases are able to accurately reproduce the diurnal and seasonal cycle ( e M D value 0.01 vs. 0.01; Table 4). The performance reproducing the wind distribution is also similar ( e F 1.27 vs. 1.20; Table 4), although substantially higher than that for the surface wind speed (Table 3). Finally, the predominant (south-westerly) wind directions are reasonably well reproduced by both ERA5 and RetroDB (Figure 6), although ERA5 estimates are slightly shifted toward the south. This results in a higher DACC value for RetroDB (74% vs. 81%). Figure 6 also shows that high wind speed values (above 12 m/s), which are observed for several wind directions, are fairly reproduced by RetroDB, although their probability is slightly overestimated.
Unlike in the Sotavento case, for the SierraTrigo mast, RetroDB clearly outperforms ERA5 based on all the evaluation statistics values (Table 5 and Figure 7). For instance, while RetroDB estimates are practically unbiased, ERA5 bias is considerably high and negative ( 0.02 vs. 3.32 m/s). Similarly, the RMSE value of ERA5 is almost twice as high as that of RetroDB (4.28 vs. 2.25 m/s). As derived from Figure 7, the poor performance of the ERA5 database is associated with a very high overestimation (underestimation) of the low (high) wind speed. On the contrary, RetroDB accurately reproduces the wind speed distribution over the whole range. This results in a considerably lower error when reproducing the wind speed distribution ( e F value 0.22 vs. 3.31; Table 5). Regarding the wind direction (Figure 7), ERA5 is unable to account for the prevailing wind directions (northwestern and eastern). RetrodDB provides a fair estimation of both the direction and intensity of the wind, although the northwestern wind estimates are shifted southward and the DACC value is relatively low (52%, Table 5).
As discussed in Section 2.2, the two masts evaluated in this study account for different wind resource characteristics. On the one hand, the Sotavento mast is located in a region of relatively low topographic complexity (Figure 2), at the very north of the Iberian Peninsula. Wind resources in this area are mainly explained by the mesoscale atmospheric circulation characteristics, with other factors (topographic enhancement, coastal thermal contrast) playing a minor role. The characteristics of wind resources in this location are similar to those of Central and Northern Europe, and the results reported in this study for this station are in line with the results of similar studies conducted in these areas. On the other hand, the area of SierraTrigo and its wind resources are representative of most wind farms in Spain. These are located in areas of complex topography, making use of the wind speed enhancement caused by topographic features (Figure 3a). At the SierraTrigo location (right panels in Figure 2), there is a valley and hill effect that acts, firstly, by channelling the wind and, then, increasing the wind speed. This is a common characteristic of the wind farm locations in Spain [22,31]. As a result, the highest wind speed values at this location are associated with Northwestern winds (valley orientation in Figure 2), which are, at the same time, the prevailing wind direction. The relatively coarse spatial resolution of ERA5 cannot properly account for these effects, resulting in highly biased estimates, regarding both wind speed and direction. The RetroDB spatial resolution is able to reasonably account for this type of enhancements, fairly reproducing the wind speed distribution and, to a lower extent, the wind direction distribution.
Different works in recent years have compared regional against global reanalysis using mast measurement. In these studies, it is generally concluded that ERA5 can provide fair estimates that, although biased, are competitive with high-resolution regional reanalysis in many cases [16,58]. Nevertheless, high spatial resolution regional reanalysis has been proven to provide improved estimates, for instance, regarding marginal wind distribution [24], which have important consequences regarding wind energy. Moreover, in areas of complex topography, regional reanalyses have been reported to have important advantages [17]. In these areas, ERA5, for instance, tends to underestimate the wind speeds, which may lead to an underestimation of the wind energy production, if not corrected. Gualtieri [56] evaluated wind energy and speed estimates derived from ERA5 by comparing them with observations from tall towers. The results showed, as in this work, that ERA5 was able to provide reliable estimates in homogeneous sites, in terms of orography, while large errors were found in sites with complex topography. Carvalho et al. [59] evaluated the wind estimates derived from the WRF model using mast measurements in Portugal. Results for the coastal stations evaluated in this work are similar to the results of Sotavento stations. Dörenkämper et al. [25] evaluated ERA5 and the new European Wind Atlas (NEWA), derived from a high-resolution integration with the WRF model, using mast measurements. They reported ERA5 to underestimate the mean wind speed across Europe, with the largest underestimations found in the south (Italy, Greece, and Turkey, in particular). In general, it was found that NEWA has lower bias values than ERA5, and the negative wind speed bias of both ERA5 and NEWA become more negative when increasing the topographic complexity. The results of our analysis clearly show that RAR reanalysis provides enhanced estimates at areas of complex topography, considerably reducing the bias and, to a lesser extent, the RMSE compared to GAR.

4.2. Wind Capacity Factor Validation

In this section, an assessment of the wind capacity factor estimates derived from the RetroDB and ERA5 databases was carried out. This evaluation consists of two parts. Firstly, the nationally aggregated wind capacity factors are assessed in Section 4.2.1. Secondly, the regional NUTS 3 capacity factors are evaluated in Section 4.2.2. The analyses span a different period depending on the data availability: 14 years (2007–2020) for the national analysis and 7 years (2014–2020) for the regional analysis.

4.2.1. Analysis of National Wind Capacity Factor Estimates

This section presents the results of the evaluation of the nationally aggregated wind capacity factors derived from the RetroDB and ERA5 databases. Table 6 shows values for some representative evaluation statistics. For the sake of comparison, values are presented both for raw (uncorrected) and corrected estimates, according to the method presented in Section 3.1. The results displayed in Table 6 show a notable improvement in the model performance, both for ERA5 and RetroDB, particularly regarding the bias and RMSE. RetroDB undergoes an outstanding increment in the performance parameters, although both databases show similar values after the correction procedure. Values reported in Table 6, particularly regarding the relative improvement attained by correcting the CFs, are in accordance with the results of similar studies conducted in the study region [9,12,16].
Figure 8a shows the estimated (using the correction procedure) and observed monthly mean nationally aggregated values of the CFs during the period of 2007–2020. In general, a fair agreement between the observed and modelled (RetroDB and ERA5) values is observed. Most significant differences are observed for extreme low/high values, which are overestimated by ERA5 and, in general, fairly reproduced by RetroDB. Additional analyses were conducted to further explore this issue.
Figure 8b presents the observed and estimated hourly CF value distributions, whereas Table 7 shows the values of some summary statistics. Although the summary statistics in Table 7 indicate a similar performance of ERA5 and RetroDB, Figure 8b evidences clear differences among them. Notably, ERA5 overestimates the probability of CF values below 0.1 (approximately) and underestimates values between 0.2 and 0.6 (approximately). Moreover, ERA5 also overestimates the probability of extreme CF values, resulting in the unrealistic maximum value (0.98) in Table 7. A better performance is observed for RetroDB. Figure 8b reveals that RetroDB shows a tendency to overestimate the probability of CFs in the range of 0.15–0.30 and to underestimate the probability in the range of 0.4–0.6 (approximately), although extreme values (low and high) and variability (stand. dev.) are fairly reproduced (Table 7).
Finally, the consequences of the different reliability of the RetroDB and ERA5 CFs database distributions may have in wind energy integration studies were further investigated. Notably, Figure 8c shows the ramp distributions of the estimated and observed CFs. Both databases provide a reasonable estimation of the ramp distribution. Nevertheless, RetroDB shows a better performance compared to ERA5, firstly, since the ramp probabilities ranging between 0.02 and 0.02 are better reproduced; secondly, and more importantly, RetroDB is better at reproducing the probability of extreme ramp events (lower than 0.05 and higher than 0.05). ERA5 clearly overestimates the occurrence of extreme ramp events.

4.2.2. Analysis of Regional Wind Capacity Factor Estimates

This section presents the results of the evaluation of the wind CF estimates for each of the Spanish NUTS 3 regions as derived from the RetroDB and ERA5 databases. Figure 9 and Table 8 summarise the results of the assessment. For the sake of comparison, results are displayed for both corrected and uncorrected CFs.
Figure 9 clearly shows that the improvement obtained by applying the correction method at the national scale is translated at the regional scale. Bias and dispersion (Figure 9a,d) are clearly reduced for the corrected estimates. Moreover, by comparing Figure 9b,e and Figure 9c,f, it is clear that the correction procedure provides better estimates regarding both the reproduction of the daily cycle and the distribution of the CF values. This enhancement is particularly outstanding for the ERA5 estimates, but also noticeable for the RetroDB ones. The reported values in Table 8 also confirm that the use of the correction method considerably enhances the reliability of the modelled data at the regional scale. The improvement is observed for all the evaluation statistics and for both databases, although, as in the case of the national aggregated study, the results are particularly remarkable for the RetroDB bias (0.14 vs. 0.01 ) and RMSE (0.23 vs. 0.14) values. As a result of the correction procedure, the correlation, bias, and RMSE values of RetroDB and ERA5 are similar (Table 8). However, RetroDB provides an improved representation of the CF diurnal cycle and distributions at the regional level, as derived from the values (0.00022 vs. 0.00042) and values (0.26 vs. 0.42) for RetroDB and ERA5, respectively.
In order to provide additional insight into the regional performance of the RetroDB and ERA5 databases, Figure 10 shows representative evaluation statistics for each of the NUTS 3 regions, for the corrected estimates. Figure A2 in the appendix shows the corresponding figure for uncorrected estimates. The comparison between Figure 10 and Figure A2 clearly shows that the correction procedure provides enhanced estimates across all the regions, particularly regarding the bias and RMSE. In addition (Figure 10), the RetroDB corrected estimates clearly outperform those of ERA5 for all the evaluated statistics, particularly for the bias and RMSE, in most of the regions (see points in Figure 10b,c,e,f). In fact, ERA5 estimates still show a relatively high negative bias and RMSE values for some specific regions (Figure 10b,c), mostly characterised by a very complex topography (Figure 3a). In contrast, the RetroDB estimates for most of the regions and, particularly, for these specific regions, are considerably more accurate (Figure 10e,f).
Finally, the extent to which the corrected databases are able to reproduce the observed spatial variability of the CFs was further analysed. Figure 11 shows the correlation between the observed and modelled (RetroDB and ERA5) wind capacity factors against the distance among regions. The Euclidean distances among the centroids of the NUTS 3 regions were used. As in the case of wind speed (Figure 5), an exponential model was fitted to compute the length scale. As can be observed, both databases provide similar correlation values at distances of up to 200 km, overestimating the observed values. This may be related to the poor sampling at distances between 0 and 200 km, since distances between regional centres are rarely below 100 km. At distances greater than 200 km, the spatial variability of the wind power generation is slightly better represented by the RetroDB, as was found for the surface wind speeds. This results in a considerably better estimation of the length scale distance (Figure 11 top right).

5. Summary and Concluding Remarks

This study proposed and evaluated an improved database (RetroDB) of the Spanish wind energy resources, which was derived from a high spatial resolution regional reanalysis performed with the WRF model. Wind energy (CF) estimates were obtained from the wind speed estimates using a state-of-the-art physical model. RetroDB, which provides high spatial and temporal estimates of both wind speed and wind energy CFs, spanning several decades, is made publicly available.
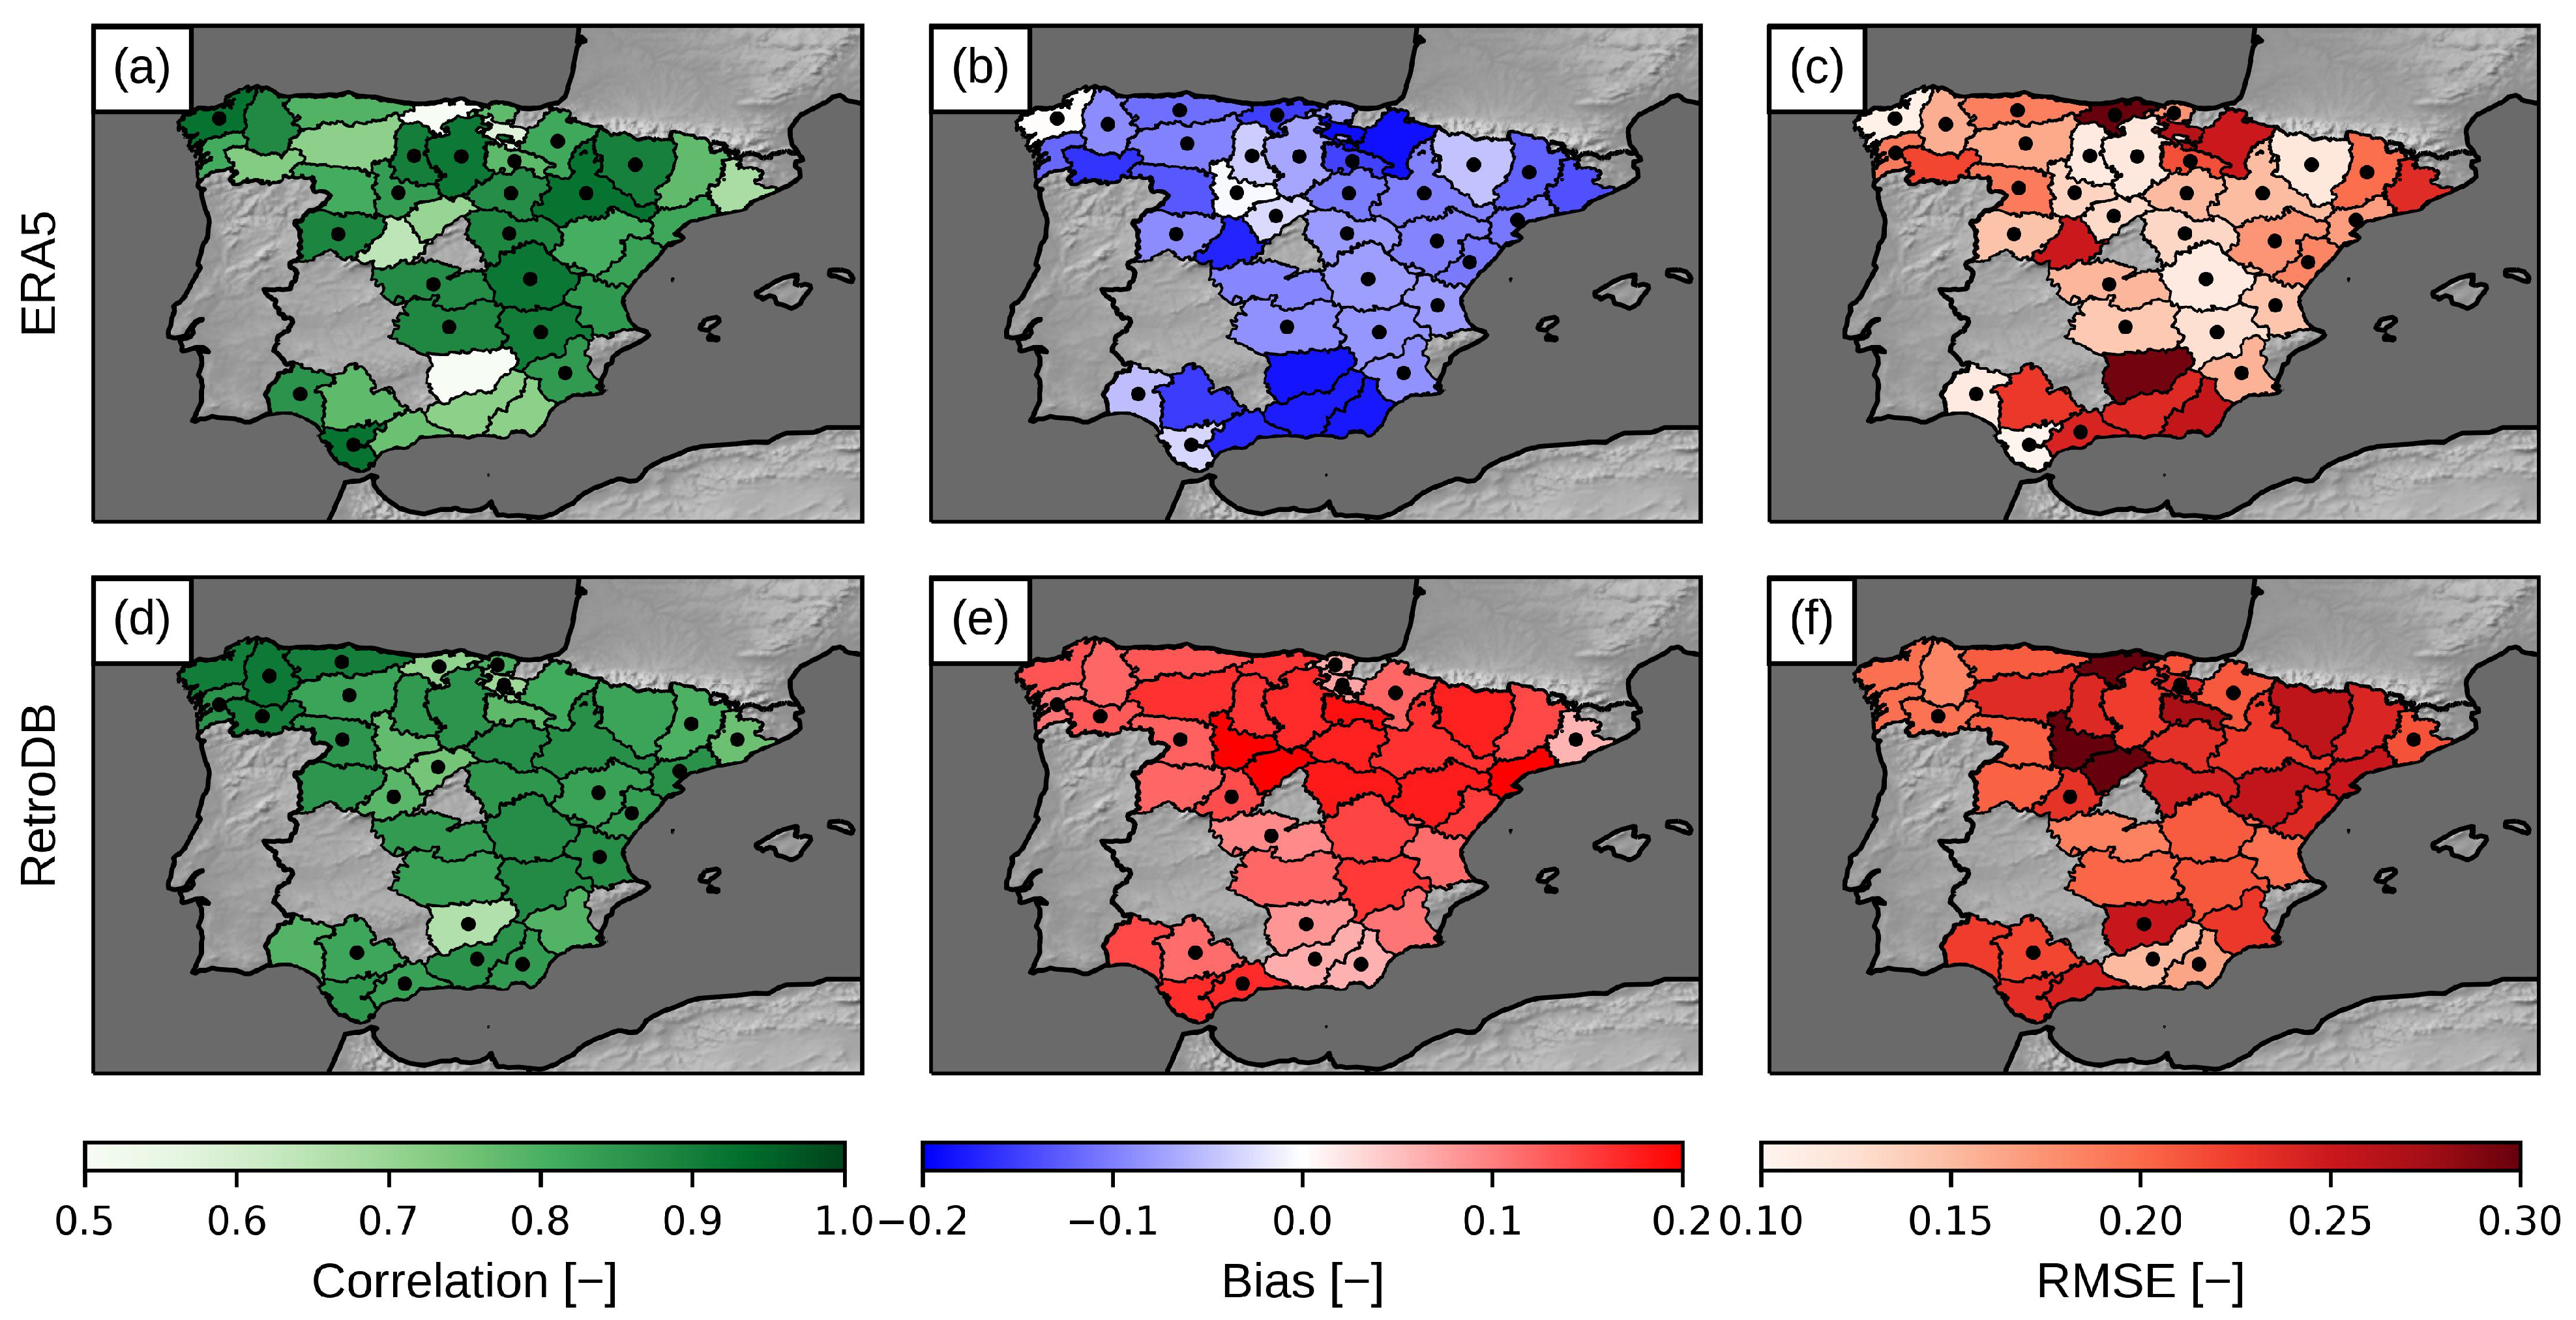
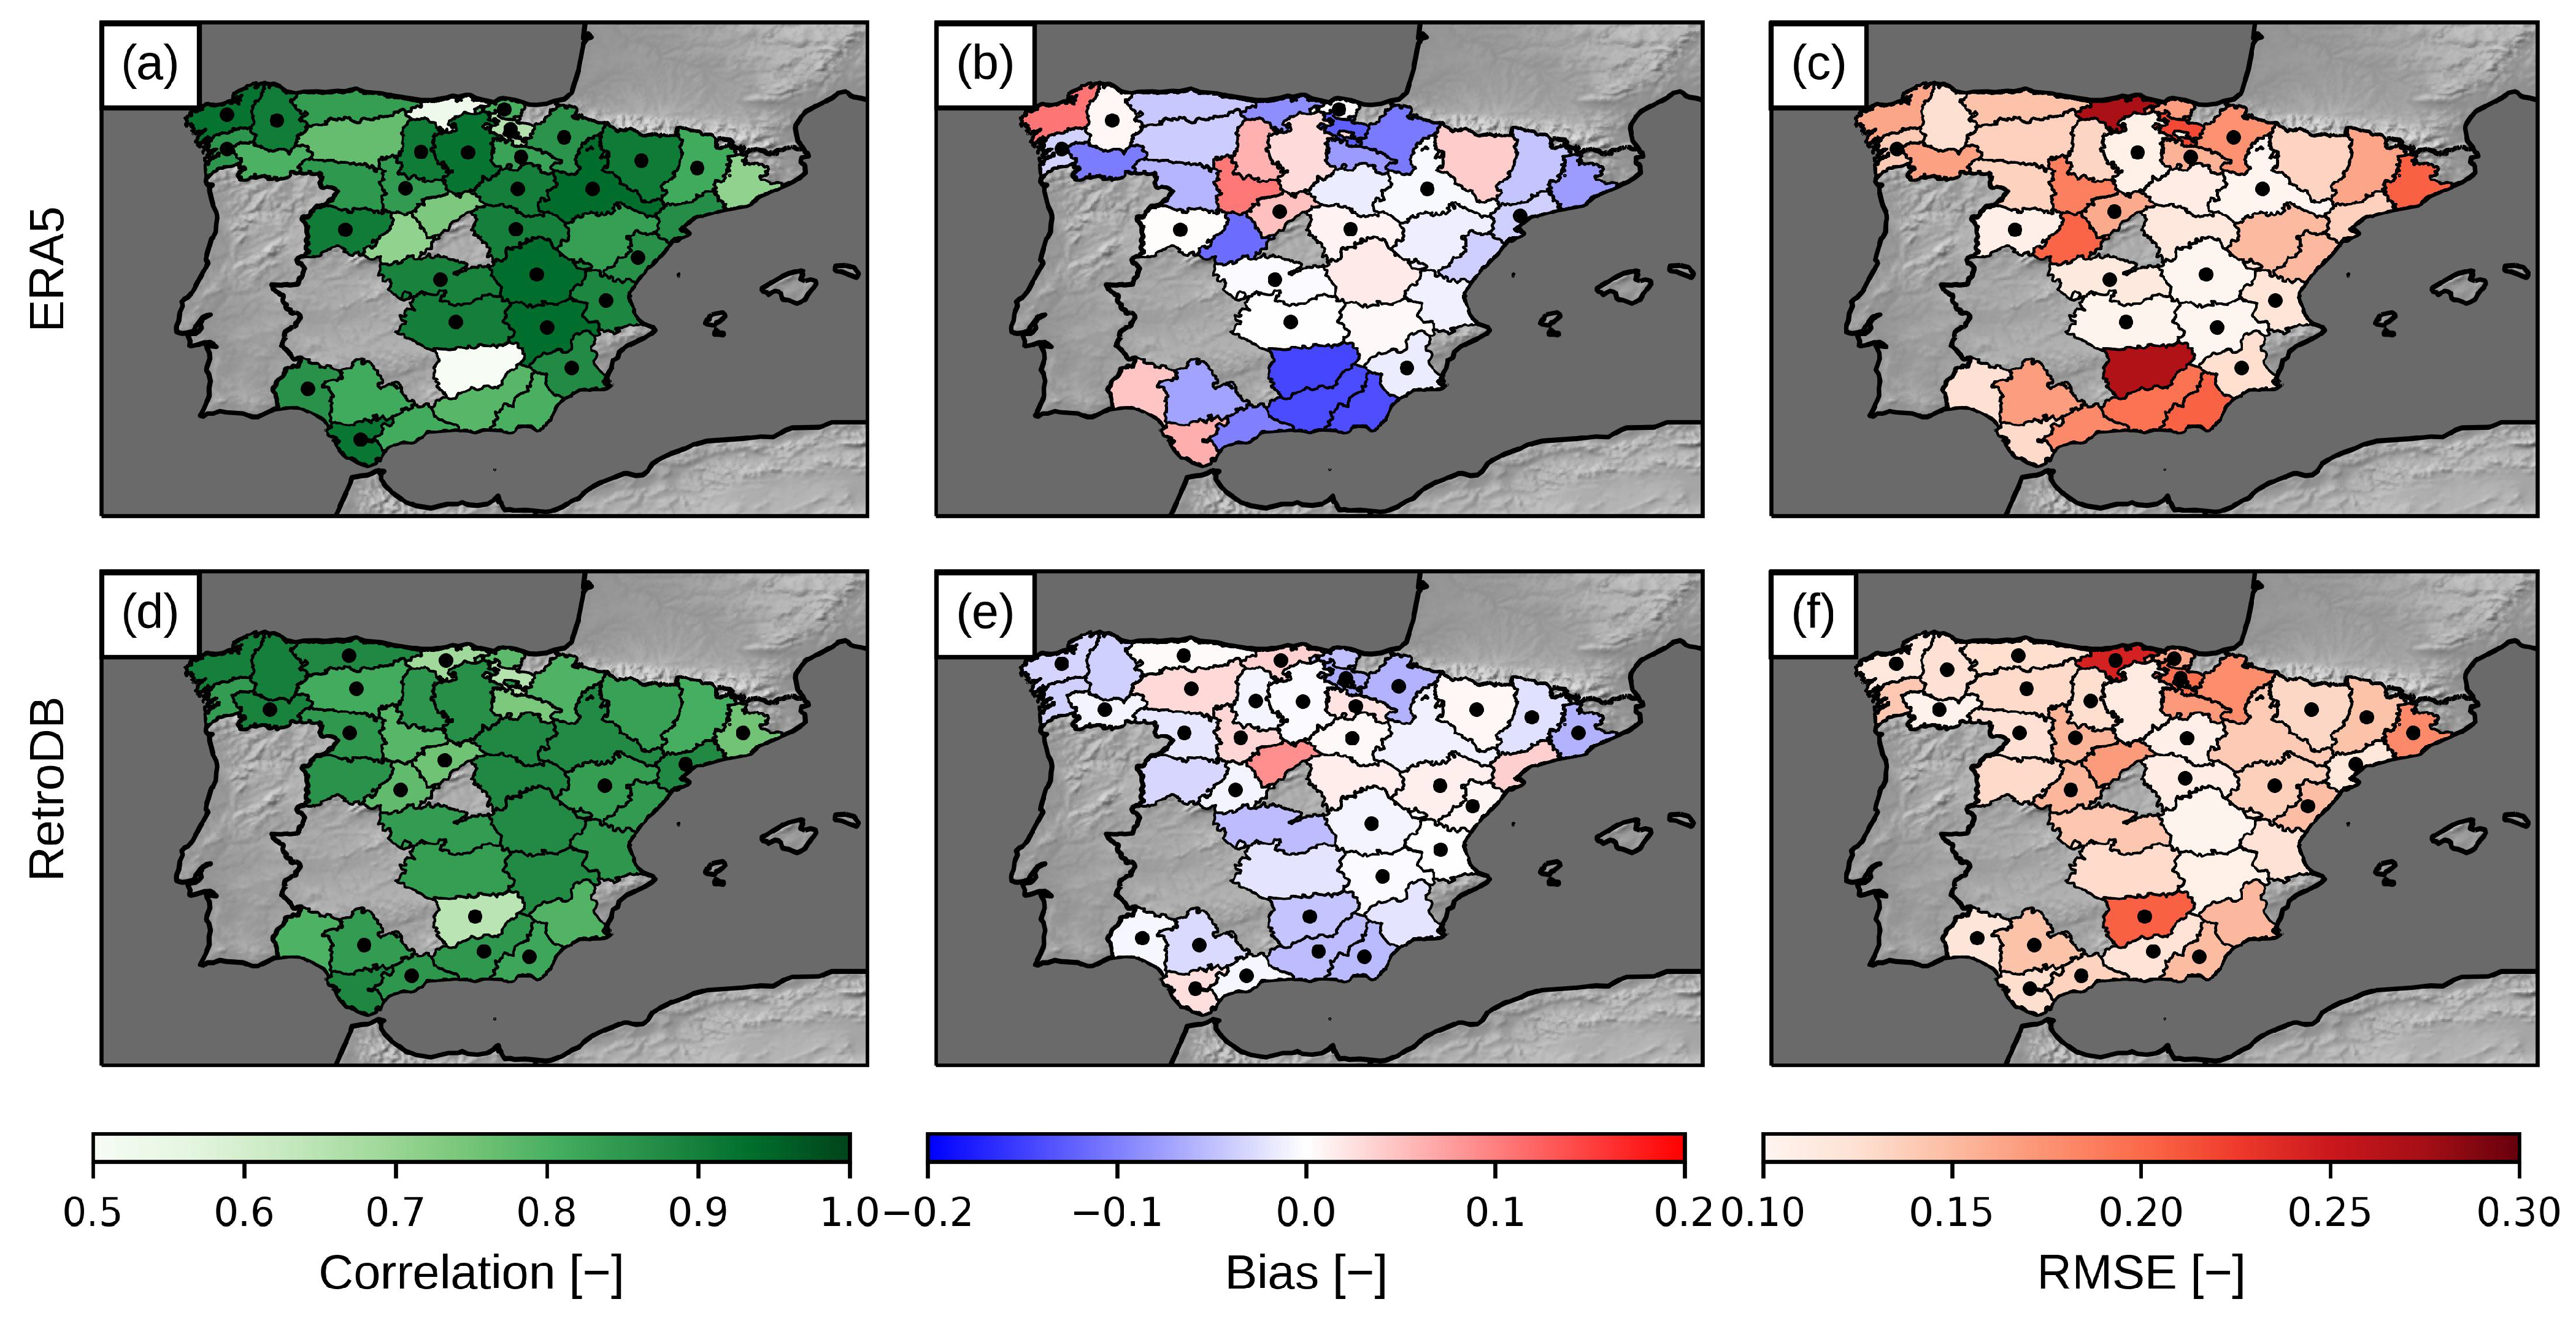
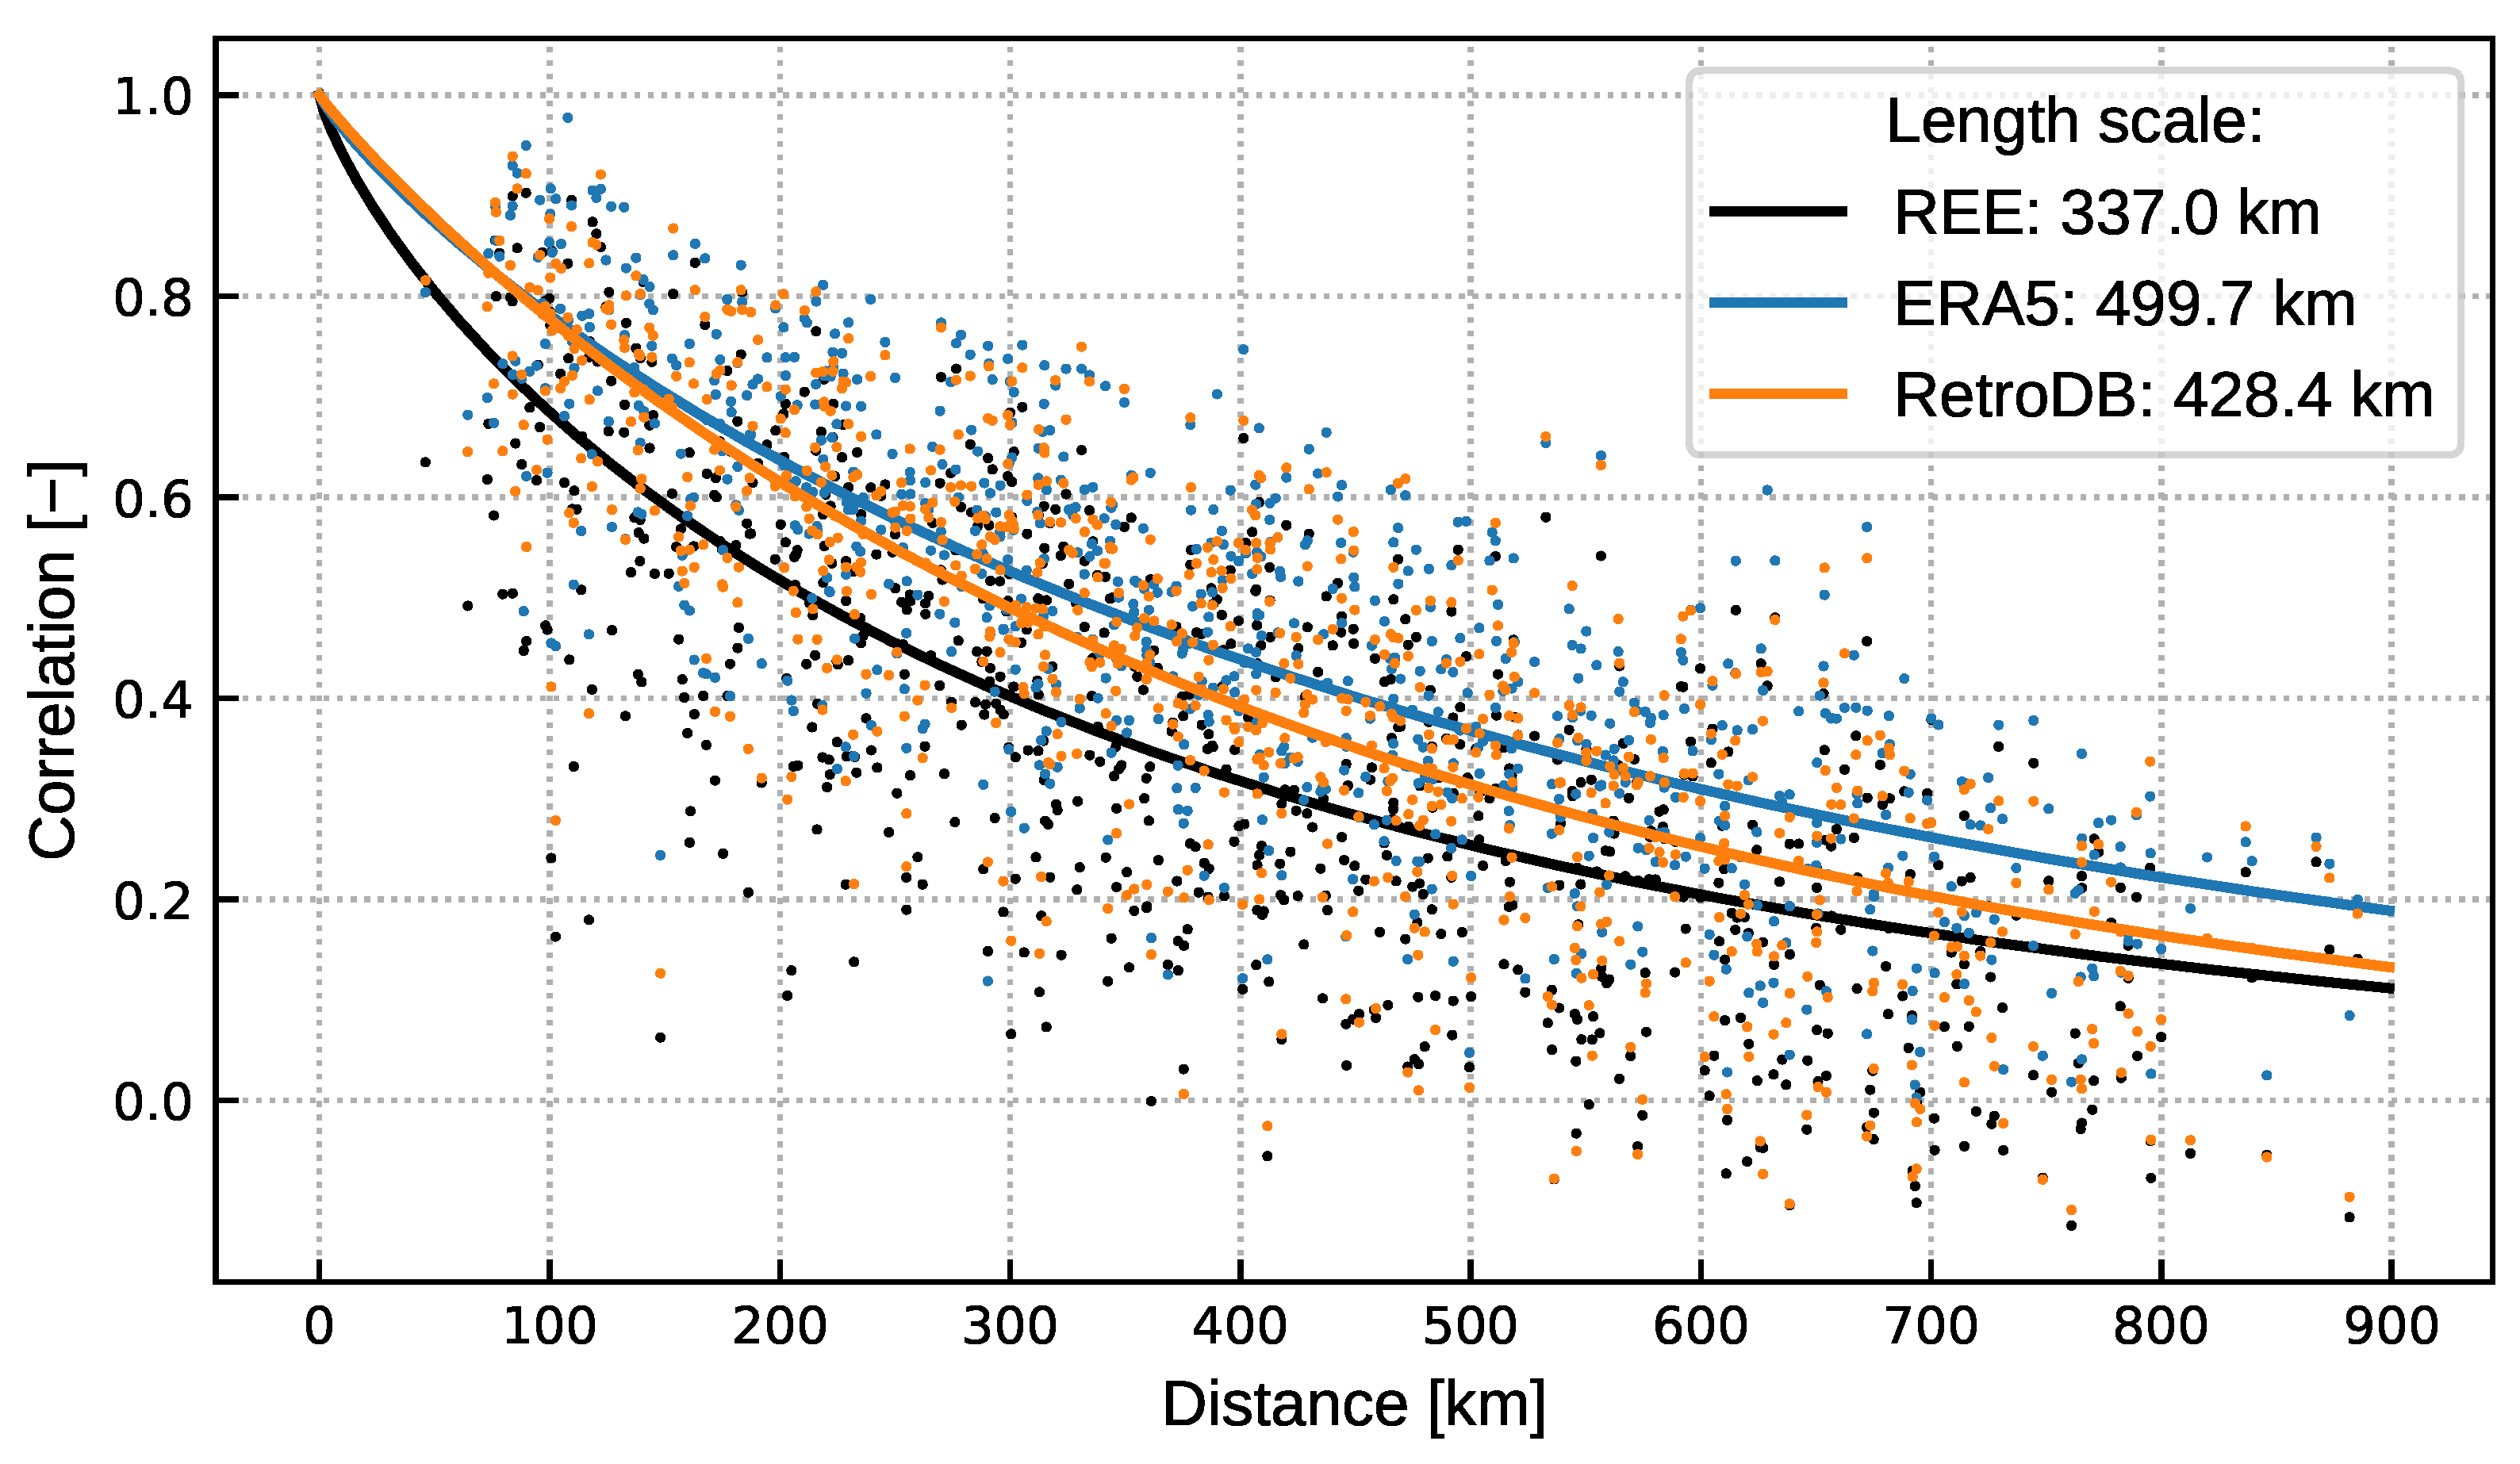
Wind speed and wind energy estimates from RetroDB were benchmarked based on the ERA5 global reanalysis. To do this, first, a set of measurements, derived from surface and tall wind masts, were used to evaluate the wind estimates from both RetroDB and ERA5. Secondly, wind energy estimates, derived from the RetroDB and ERA5 wind databases, were evaluated using the observed values provided by the Spanish TSO. The study area is characterised by a Mediterranean climate and, more importantly, by wind energy resources tied to topographic features. Therefore, and as a by-product, this work evaluates the added value of high-resolution regional reanalysis, compared to global reanalysis, with respect to wind energy studies in areas of complex topography. To this end, the extent to which RetroDB and ERA5 reproduced the spatial variability of CFs, the distribution of CFs, and the ramp distribution of CFs was specifically addressed.
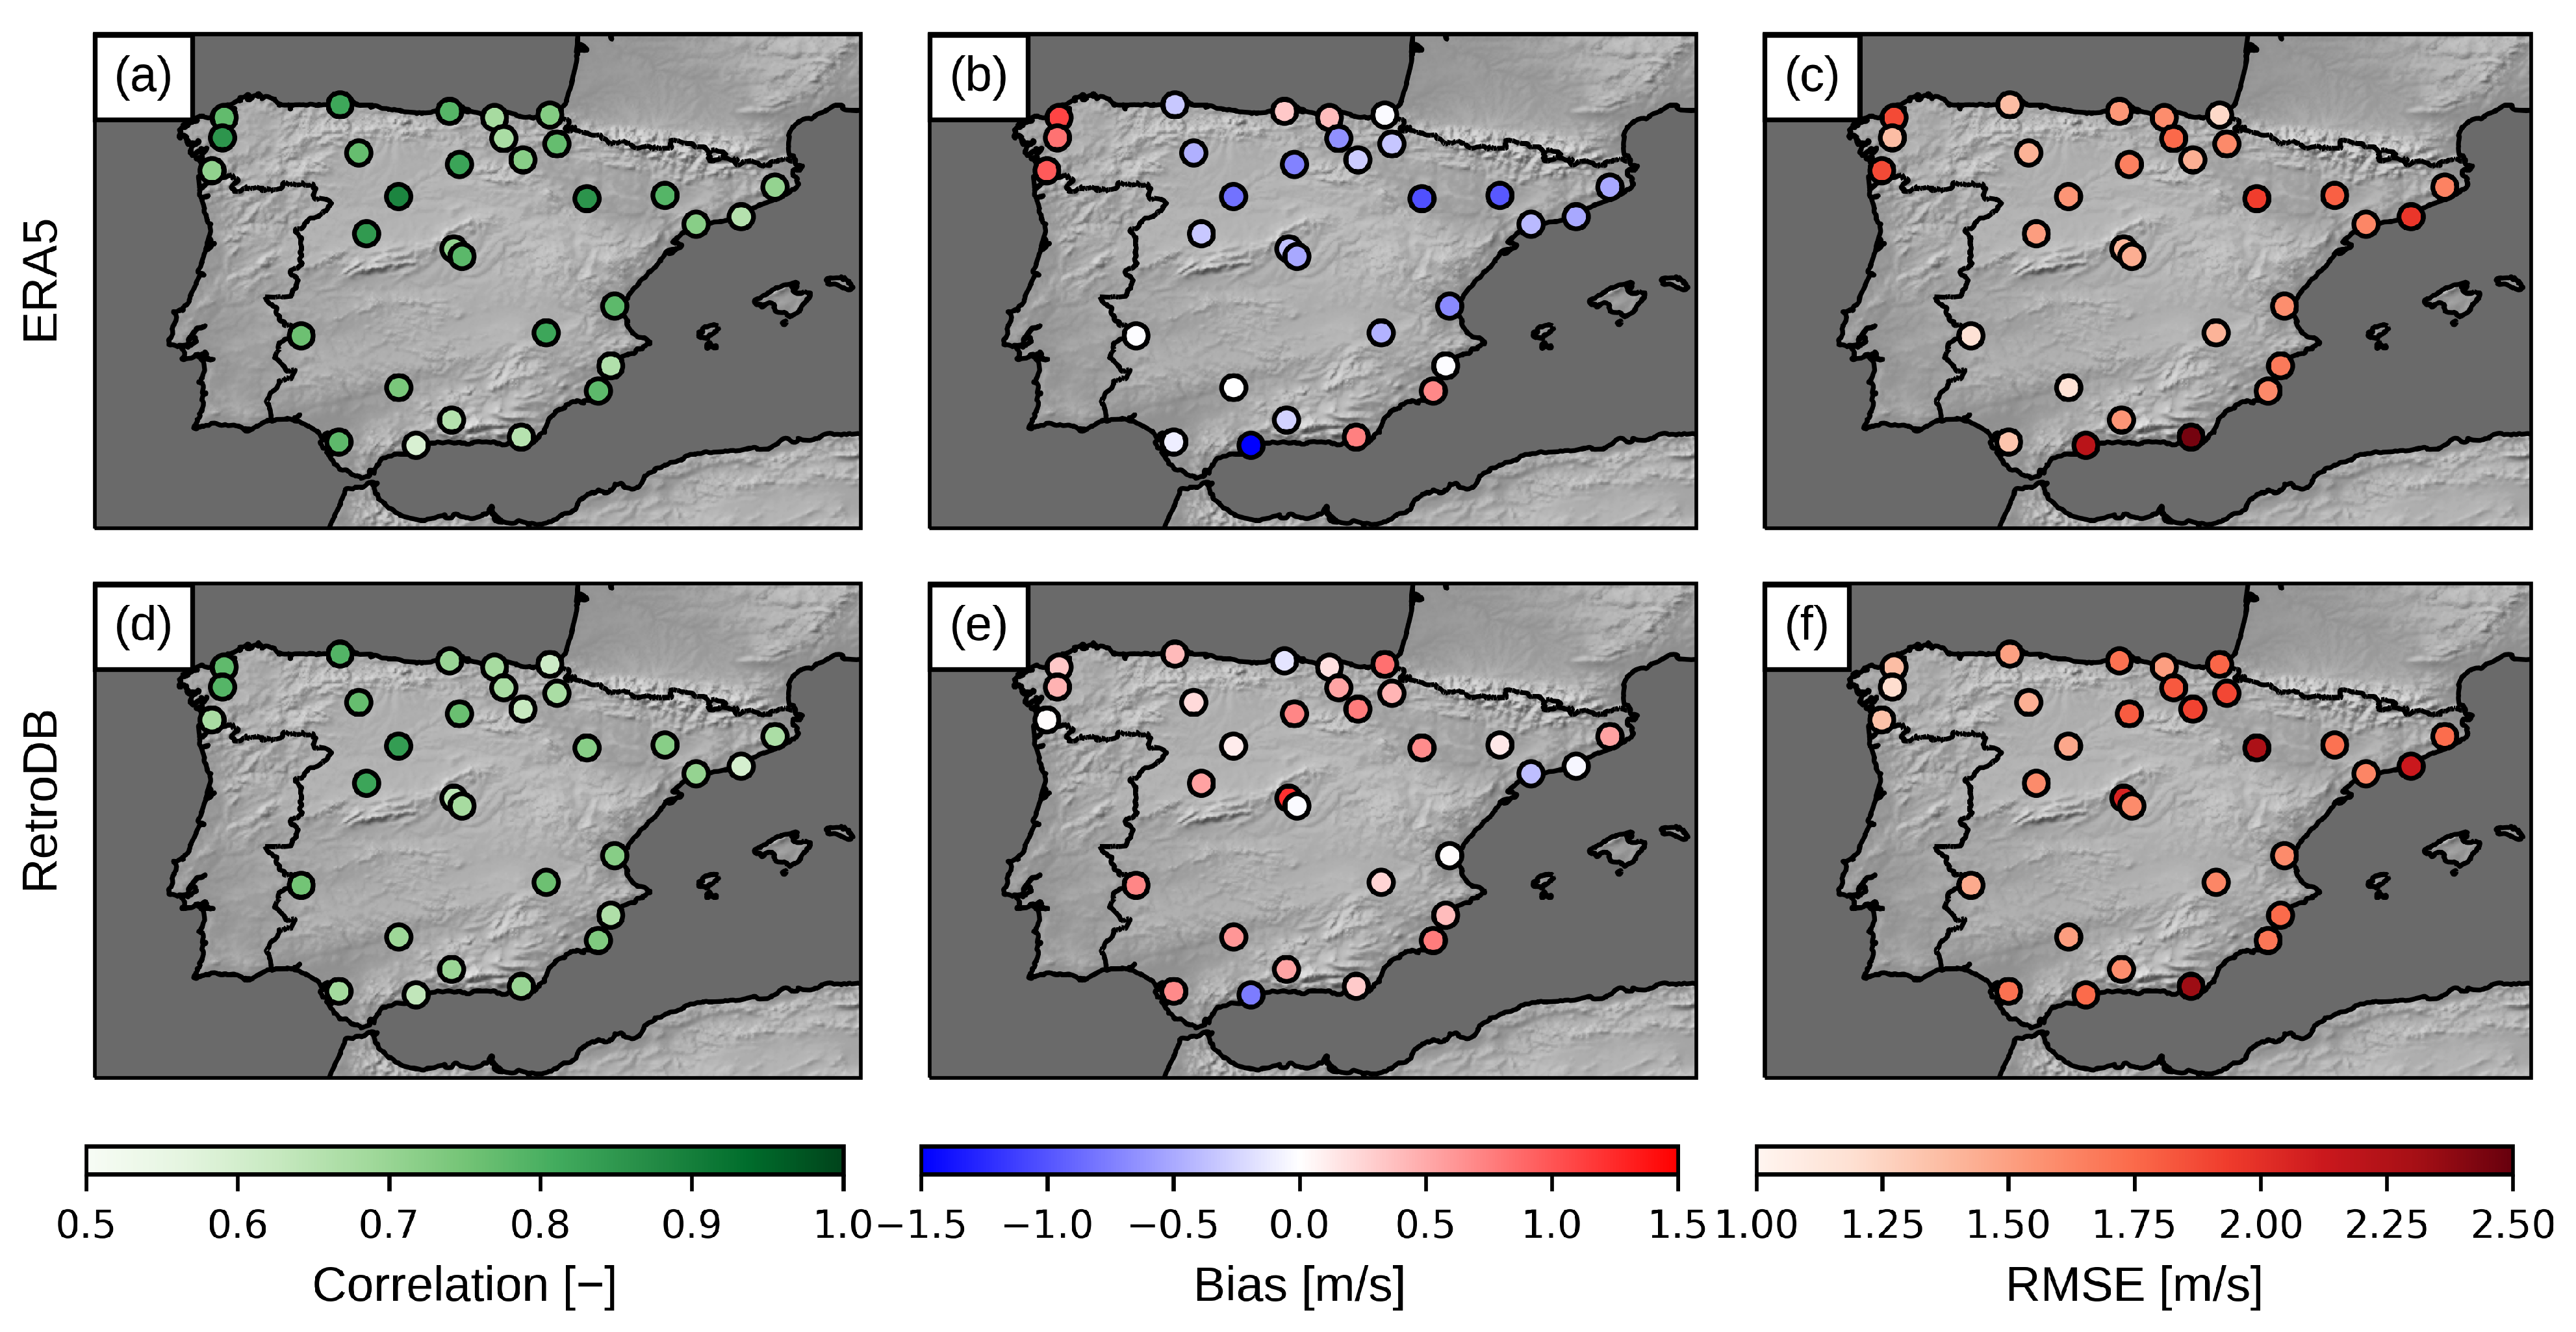
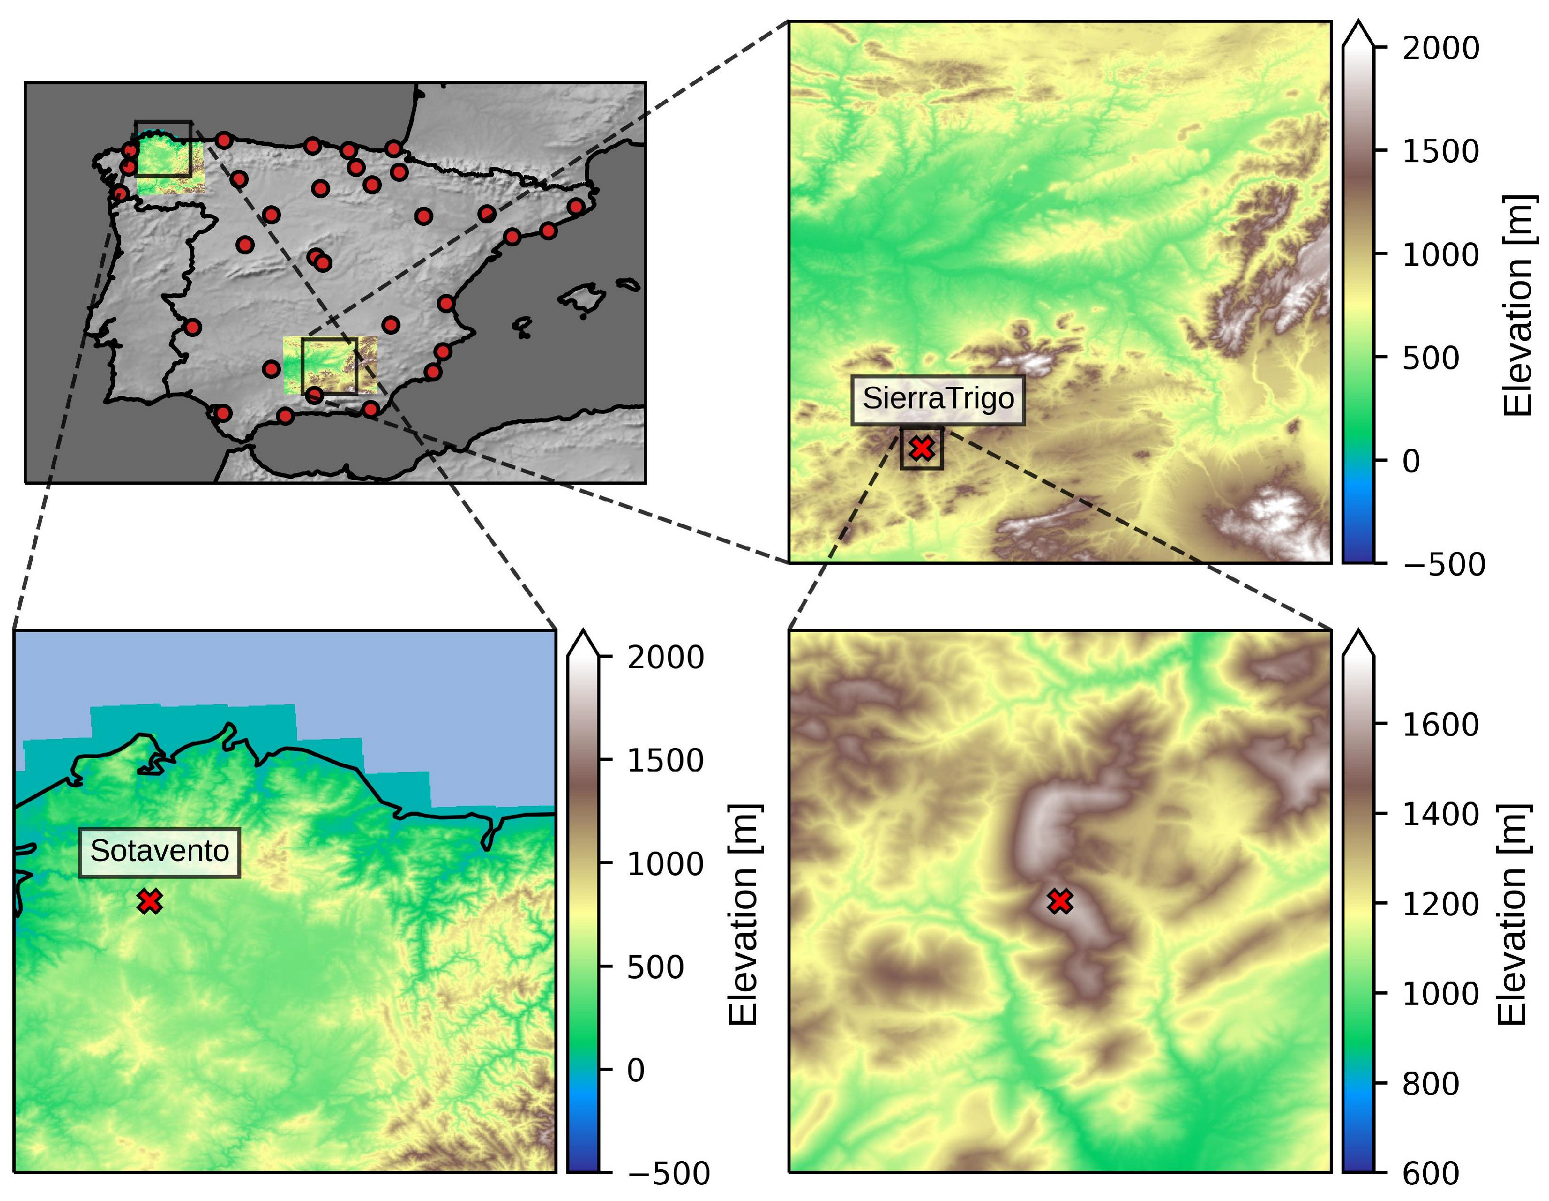
Regarding surface wind estimates, the results showed that ERA5 provides valuable estimates. Nevertheless, RetroDB showed a superior performance at reproducing the spatial variability of wind speed, which has important implications for wind energy integration. Regarding wind aloft, the results clearly showed that the use of the high-resolution regional reanalysis RetroDB instead of ERA5 is advisable. RetroDB’s improved spatial resolution allows for a better representation of the topographic features that account for the majority of wind energy resources in the study region. The advantage is particularly relevant regarding the accurate reproduction of the marginal distribution of the wind speed. These conclusions are constrained by the limited number of evaluation masts (only two), although the location of the towers represents the wind characteristics of most wind farm locations in Spain.
As far as wind energy estimates are concerned, and although a state-of-the-art physical model was used to derive the CFs, the application of a correction procedure was found to be necessary in order to derive reliable estimates. Once corrected, ERA5 and RetroDB showed a similar performance in terms of providing long-term national aggregated CF values. However, when the analysis focused on the ability to reproduce wind CF distributions and ramp distributions, RetroDB clearly outperformed ERA5. As for the surface wind speed, the performance of RetroDB was considerably superior in reproducing the spatial variability of CFs. In summary, the temporal and spatial distribution of the CFs was considerably better reproduced by the high-resolution regional RetroDB reanalysis. A similar conclusion was reported by Frank et al. [24], who demonstrated that the use of regional reanalysis provides a better estimation of wind energy marginal CF values and ramps distribution. Other previous studies in the scientific literature showed a valuable performance of ERA5 [16]. Nevertheless, most of these studies were conducted in areas with a relatively low topographic complexity, characterised by wind resources related to regional atmospheric circulation patterns.
The improved performance of the RetroDB in reproducing the wind energy resources in the study area seems to be related to a better representation of the surface wind speed spatial variability and the winds aloft in areas of complex topography. An evaluation of the wind estimates using a tall mast showed that RetroDB, as opposed to ERA5, was able to accurately reproduce marginal wind speed distributions in these areas, where most of the wind farms of the study region are located. The higher spatial resolution of RetroDB allows it to properly represent the wind speed enhancement caused by topographic features. This translates into a better representation of the marginal wind speed temporal and wind speed spatial variability. Ultimately, this leads to an improved representation of the temporal and spatial variability of the CFs in the RetroDB database. An appropriate representation of the extreme CF values have important implications for wind energy integration, since low CF situations may endanger the security of supply, while a high CF may end in curtailment. Similarly, an accurate representation of ramp events has important consequences regarding power system balancing reserves estimation. Lastly, an accurate representation of spatial variability is crucial, for instance, for the proper deployment of wind energy.
Overall, the results obtained in this study clearly indicate that, in areas such as the study region, with wind resources associated primarily with topographic enhancements, the high spatial resolution regional reanalysis shows a clear advantage over relatively coarse reanalysis, such as ERA5, particularly regarding wind energy integration studies. Future studies will attempt to quantify this advantage for reliable energy system modelling.

Author Contributions

Conceptualisation: D.P.-V., F.J.S.-A., and J.A.R.-A.; Methodology: D.P.-V., A.J.-G., and G.S.-H.; Software: A.J.-G., G.S.-H., and M.L.-C.; Formal Analysis: D.P.-V. and A.J.-G.; Investigation: D.P.-V., A.J.-G., and G.S.-H.; Resources: D.P.-V., F.J.S.-A., and J.A.R.-A.; Data Curation: A.J.-G., G.S.-H., and M.L.-C.; Writing: D.P.-V., A.J.-G., and G.S.-H. All authors have read and agreed to the published version of the manuscript.

Funding

This study has been carried out in the framework of the project MET4LOWCAR (reference PID2019-107455RB-C21/AEI/ 92 10.13039/501100011033), financed by the Spanish National Research Agency. Guadalupe Sánchez-Hernández also thanks the support from UE-Junta de Andalucía co-funded postdoctoral fellowship PAIDI2020-DOC_01110.

Data Availability Statement

The data used in this study may be accessed at the following URLs. ERA5 reanalysis data can be freely downloaded at: https://cds.climate.copernicus.eu/cdsapp#!/dataset/reanalysis-era5-single-levels?tab=form (accessed on 10 June 2022). Surface wind data can be accessed at website https://www.ncei.noaa.gov/products/land-based-station/integrated-surface-database (accessed on 11 June 2021). Sotavento tall tower dataset may be accessed at: https://www.sotaventogalicia.com/en/technical-area/real-time-data/historical/ (accessed on 11 June 2022). The authors do not have permission to share the data for the SierraTrigo tall tower. The wind speed and wind CF estimates evaluated herein are available upon request. The hourly corrected NUTS 3 CF time series presented in this study are openly available in https://github.com/matrasujaen/RetroDB (accessed on 20 March 2024). Due to the size of hourly wind speed field at 5 km resolution (RetroDB), an example file is located on the same website while more data become available upon request from the corresponding author.

Acknowledgments

The authors acknowledge the Sotavento and Sierra de Trigo wind farms operators for yielding the wind data, the NOAA for giving wind surface data, and the Spanish TSO Red Eléctrica for yielding actual wind generation data. The authors also appreciate the support of the Supercomputing Centre of the University of Málaga (Picasso-RES) for providing computational facilities in order to conduct the WRF simulations.

Conflicts of Interest

The authors declare no conflicts of interest.

Appendix A. CFs Correction Procedure

Capacity factor estimates derived from both ERA5 and RetroDB databases were corrected following Ref. [9]. The approach relies on fitting a linear equation, which depends on the ratio of observed-to-simulated CFs, to correct the wind speeds estimates. To this end, in a first step, the average ratio between the observed and modelled CF are computed for a given period ( ϵ value in Equations (A1) and (A2)):
α = 0.6 · ϵ + 0.2 ,
where
ϵ = CF ¯ CF ^ ¯ .
Observed Spanish national aggregated CF values are available from REE; modelled values were derived following the procedure outlined in Section 3.1. In a second step, wind speed estimates from ERA5 and RetroDB were corrected using Equation (A3):
V corrected = α · V raw + β .
Parameter β is selected using a recursive method in such a way that the mean value of the corrected CFs approximately equals the mean observed value (zero bias). Finally, the new wind speed corrected values are used to estimate the CF values following steps 1–5 of the procedure described in Section 3.1.
Table A1 shows the parameters finally used in this work to correct the CFs.
Table A1. Capacity factor bias value ( ϵ ), defined as the ratio of the observed to estimate the capacity factor and the bias correction parameters ( α , β )
Model ϵ α β
ERA51.541.120.5
RetroDB0.620.571.6

Appendix B. Surface Wind Speed Evaluation Statistics

Figure A1. Evaluation statistics for each evaluation station, calculated by comparing the estimated and observed surface wind speed values. Panels (ac) show, respectively, the correlation, bias and RMSE values derived from the ERA5 database. Panels (df) are the corresponding values, but derived from the RetroDB database.
Energies 17 01523 g0a1

Appendix C. Regional CF Evaluation Statistics

Figure A2. Evaluation statistics for each of the Spanish NUTS 3 regions, calculated by comparing the estimated and observed CF values. Panels (ac) show, respectively, the correlation, bias and RMSE values derived from the ERA5 database. Panels (df) are the corresponding values, but derived from the RetroDB database. Values are computed for the period 2007–2020 using the uncorrected CF values. The points indicate, for each statistic and region, the best performing database (ERA5 or RetroDB).
Energies 17 01523 g0a2

References

  1. IRENA. Renewable Power Generation Costs in 2019; International Renewable Energy Agency: Abu Dhabi, United Arab Emirates, 2020. [Google Scholar]
  2. IEA. Renewable Energy Policies in a Time of Transition: Heating and Cooling; IEA: Paris, France, 2020. [Google Scholar]
  3. European Comission. Annual Activity Report 2018—Climate Action. 2018. Available online: https://commission.europa.eu/publications/annual-activity-report-2018-climate-action_en (accessed on 24 January 2022).
  4. MITECO. Plan Nacional Integrado de Energía y Clima (PNIEC) 2021–2030. 2019. Available online: https://www.miteco.gob.es/content/dam/miteco/images/es/pnieccompleto_tcm30-508410.pdf (accessed on 4 February 2021).
  5. Engeland, K.; Borga, M.; Creutin, J.D.; François, B.; Ramos, M.H.; Vidal, J.P. Space-time variability of climate variables and intermittent renewable electricity production—A review. Renew. Sustain. Energy Rev. 2017, 79, 600–617. [Google Scholar] [CrossRef]
  6. Henckes, P.; Knaut, A.; Obermüller, F.; Frank, C. The benefit of long-term high resolution wind data for electricity system analysis. Energy 2018, 143, 934–942. [Google Scholar] [CrossRef]
  7. Pearre, N.S.; Swan, L.G. Adding wind power to a wind-rich grid: Evaluating secondary suitability metrics. Wind Energy 2023, 26, 446–457. [Google Scholar] [CrossRef]
  8. McKenna, R.; Pfenninger, S.; Heinrichs, H.; Schmidt, J.; Staffell, I.; Bauer, C.; Gruber, K.; Hahmann, A.N.; Jansen, M.; Klingler, M.; et al. High-resolution large-scale onshore wind energy assessments: A review of potential definitions, methodologies and future research needs. Renew. Energy 2022, 182, 659–684. [Google Scholar] [CrossRef]
  9. Staffell, I.; Pfenninger, S. Using bias-corrected reanalysis to simulate current and future wind power output. Energy 2016, 114, 1224–1239. [Google Scholar] [CrossRef]
  10. Ryberg, D.S.; Caglayan, D.G.; Schmitt, S.; Linßen, J.; Stolten, D.; Robinius, M. The future of European onshore wind energy potential: Detailed distribution and simulation of advanced turbine designs. Energy 2019, 182, 1222–1238. [Google Scholar] [CrossRef]
  11. Lombardi, F.; Pickering, B.; Colombo, E.; Pfenninger, S. Policy Decision Support for Renewables Deployment through Spatially Explicit Practically Optimal Alternatives. Joule 2020, 4, 2185–2207. [Google Scholar] [CrossRef]
  12. Monforti, F.; Gonzalez-Aparicio, I. Comparing the impact of uncertainties on technical and meteorological parameters in wind power time series modelling in the European Union. Appl. Energy 2017, 206, 439–450. [Google Scholar] [CrossRef]
  13. Saint-Drenan, Y.M.; Besseau, R.; Jansen, M.; Staffell, I.; Troccoli, A.; Dubus, L.; Schmidt, J.; Gruber, K.; Simões, S.G.; Heier, S. A parametric model for wind turbine power curves incorporating environmental conditions. Renew. Energy 2020, 157, 754–768. [Google Scholar] [CrossRef]
  14. Pierro, M.; Gentili, D.; Liolli, F.R.; Cornaro, C.; Moser, D.; Betti, A.; Moschella, M.; Collino, E.; Ronzio, D.; van der Meer, D. Progress in regional PV power forecasting: A sensitivity analysis on the Italian case study. Renew. Energy 2022, 189, 983–996. [Google Scholar] [CrossRef]
  15. Kaiser-Weiss, A.K.; Kaspar, F.; Heene, V.; Borsche, M.; Tan, D.G.H.; Poli, P.; Obregon, A.; Gregow, H. Comparison of regional and global reanalysis near-surface winds with station observations over Germany. Adv. Sci. Res. 2015, 12, 187–198. [Google Scholar] [CrossRef]
  16. Murcia, J.P.; Koivisto, M.J.; Luzia, G.; Olsen, B.T.; Hahmann, A.N.; Sørensen, P.E.; Als, M. Validation of European-scale simulated wind speed and wind generation time series. Appl. Energy 2022, 305, 117794. [Google Scholar] [CrossRef]
  17. Jourdier, B. Evaluation of ERA5, MERRA-2, COSMO-REA6, NEWA and AROME to simulate wind power production over France. Adv. Sci. Res. 2020, 17, 63–77. [Google Scholar] [CrossRef]
  18. Pryor, S.C.; Letson, F.; Barthelmie, R.J. Variability in Wind Energy Generation across the Contiguous United States. J. Appl. Meteorol. Climatol. 2020, 59, 2021–2039. [Google Scholar] [CrossRef]
  19. Gruber, K.; Regner, P.; Wehrle, S.; Zeyringer, M.; Schmidt, J. Towards global validation of wind power simulations: A multi-country assessment of wind power simulation from MERRA-2 and ERA-5 reanalyses bias-corrected with the global wind atlas. Energy 2022, 238, 121520. [Google Scholar] [CrossRef]
  20. Andresen, G.B.; Søndergaard, A.A.; Greiner, M. Validation of Danish wind time series from a new global renewable energy atlas for energy system analysis. Energy 2015, 93, 1074–1088. [Google Scholar] [CrossRef]
  21. Olauson, J. ERA5: The new champion of wind power modelling? Renew. Energy 2018, 126, 322–331. [Google Scholar] [CrossRef]
  22. Santos-Alamillos, F.J.; Pozo-Vázquez, D.; Ruiz-Arias, J.A.; Lara-Fanego, V.; Tovar-Pescador, J. Analysis of WRF Model Wind Estimate Sensitivity to Physics Parameterization Choice and Terrain Representation in Andalusia (Southern Spain). J. Appl. Meteorol. Climatol. 2013, 52, 1592–1609. [Google Scholar] [CrossRef]
  23. Pickering, B.; Grams, C.M.; Pfenninger, S. Sub-national variability of wind power generation in complex terrain and its correlation with large-scale meteorology. Environ. Res. Lett. 2020, 15, 044025. [Google Scholar] [CrossRef]
  24. Frank, C.W.; Pospichal, B.; Wahl, S.; Keller, J.D.; Hense, A.; Crewell, S. The added value of high resolution regional reanalyses for wind power applications. Renew. Energy 2020, 148, 1094–1109. [Google Scholar] [CrossRef]
  25. Dörenkämper, M.; Olsen, B.T.; Witha, B.; Hahmann, A.N.; Davis, N.N.; Barcons, J.; Ezber, Y.; García-Bustamante, E.; González-Rouco, J.F.; Navarro, J.; et al. The Making of the New European Wind Atlas–Part 2: Production and evaluation. Geosci. Model Dev. 2020, 13, 5079–5102. [Google Scholar] [CrossRef]
  26. Santos-Alamillos, F.; Pozo-Vázquez, D.; Ruiz-Arias, J.; Lara-Fanego, V.; Tovar-Pescador, J. A methodology for evaluating the spatial variability of wind energy resources: Application to assess the potential contribution of wind energy to baseload power. Renew. Energy 2014, 69, 147–156. [Google Scholar] [CrossRef]
  27. Jurasz, J.; Canales, F.; Kies, A.; Guezgouz, M.; Beluco, A. A review on the complementarity of renewable energy sources: Concept, metrics, application and future research directions. Sol. Energy 2020, 195, 703–724. [Google Scholar] [CrossRef]
  28. Okada, M.; Yamaguchi, K.; Kodama, R.; Ogasawara, N.; Kato, H.; Doan, V.Q.; Ishizaki, N.N.; Kusaka, H. Development of a wind power ramp forecasting system via meteorological pattern analysis. Wind Energy 2022, 25, 1900–1916. [Google Scholar] [CrossRef]
  29. Davidson, M.R.; Millstein, D. Limitations of reanalysis data for wind power applications. Wind Energy 2022, 25, 1646–1653. [Google Scholar] [CrossRef]
  30. van der Wiel, K.; Bloomfield, H.C.; Lee, R.W.; Stoop, L.P.; Blackport, R.; Screen, J.A.; Selten, F.M. The influence of weather regimes on European renewable energy production and demand. Environ. Res. Lett. 2019, 14, 094010. [Google Scholar] [CrossRef]
  31. Santos-Alamillos, F.J.; Jiménez-Garrote, A.; Pozo-Vázquez, D. Chapter 10—Meteorological assessment of coupled wind-solar power generation regimes in Spain. In Complementarity of Variable Renewable Energy Sources; Jurasz, J., Beluco, A., Eds.; Academic Press: Cambridge, MA, USA, 2022; pp. 215–243. [Google Scholar] [CrossRef]
  32. European Parliament. Common Classification of Territorial Units for Statistics (NUTS). 2024. Available online: https://www.europarl.europa.eu/factsheets/en/sheet/99/common-classification-of-territorial-units-for-statistics-nuts- (accessed on 2 March 2024).
  33. Jimenez, P.A.; Hacker, J.P.; Dudhia, J.; Haupt, S.E.; Ruiz-Arias, J.A.; Gueymard, C.A.; Thompson, G.; Eidhammer, T.; Deng, A. WRF-Solar: Description and Clear-Sky Assessment of an Augmented NWP Model for Solar Power Prediction. Bull. Am. Meteorol. Soc. 2016, 97, 1249–1264. [Google Scholar] [CrossRef]
  34. Jiménez-Garrote, A.; Sánchez-Hernández, G.; López-Cuesta, M.; Pozo-Vázquez, D. SOWISP—A retrospective high spatial and temporal resolution database of the installed wind and solar PV power in Spain. Sol. Energy 2023, 256, 44–54. [Google Scholar] [CrossRef]
  35. DTU. DTU Wind Energy. Global Wind Atlas. 2016. Available online: https://globalwindatlas.info/en/ (accessed on 25 August 2023).
  36. Gonzalez-Aparicio, I.; Zucker, A.; Careri, F.; Monforti-Ferrario, F.; Huld, T.; Badger, J. EMHIRES Dataset Part I: Wind Power Generation; Scientific Analysis or Review LD-NA-28171-EN-N Joint Research Centre; European Commission: Luxembourg, 2016. [Google Scholar] [CrossRef]
  37. Pozo-Vázquez, D.; Esteban-Parra, M.J.; Rodrigo, F.S.; Castro-Díez, Y. A study of NAO variability and its possible non-linear influences on European surface temperature. Clim. Dyn. 2001, 17, 701–715. [Google Scholar] [CrossRef]
  38. Hersbach, H.; Bell, B.; Berrisford, P.; Biavati, G.; Horányi, A.; Muñoz Sabater, J.; Nicolas, J.; Peubey, C.; Radu, R.; Rozum, I.; et al. ERA5 Hourly Data on Single Levels from 1979 to Present; ECMWF: Reading, UK, 2018; Volume 10, p. 24381. [Google Scholar]
  39. Ruiz-Arias, J.A.; Arbizu-Barrena, C.; Santos-Alamillos, F.J.; Tovar-Pescador, J.; Pozo-Vázquez, D. Assessing the Surface Solar Radiation Budget in the WRF Model: A Spatiotemporal Analysis of the Bias and Its Causes. Mon. Weather. Rev. 2016, 144, 703–711. [Google Scholar] [CrossRef]
  40. Iacono, M.J.; Delamere, J.S.; Mlawer, E.J.; Shephard, M.W.; Clough, S.A.; Collins, W.D. Radiative forcing by long-lived greenhouse gases: Calculations with the AER radiative transfer models. J. Geophys. Res. Atmos. 2008, 113. [Google Scholar] [CrossRef]
  41. Nakanishi, M.; Niino, H. An Improved Mellor–Yamada Level-3 Model: Its Numerical Stability and Application to a Regional Prediction of Advection Fog. Bound. Layer Meteorol. 2006, 119, 397–407. [Google Scholar] [CrossRef]
  42. Thompson, G.; Field, P.R.; Rasmussen, R.M.; Hall, W.D. Explicit Forecasts of Winter Precipitation Using an Improved Bulk Microphysics Scheme. Part II: Implementation of a New Snow Parameterization. Mon. Weather. Rev. 2008, 136, 5095–5115. [Google Scholar] [CrossRef]
  43. Kain, J.S. The Kain–Fritsch Convective Parameterization: An Update. J. Appl. Meteorol. 2004, 43, 170–181. [Google Scholar] [CrossRef]
  44. NOAA. Global Hourly—Integrated Surface Database (ISD). 2024. Available online: https://www.ncei.noaa.gov/products/land-based-station/integrated-surface-database (accessed on 4 June 2021).
  45. Ramon, J.; Lledó, L.; Pérez-Zanón, N.; Soret, A.; Doblas-Reyes, F.J. The Tall Tower Dataset: A unique initiative to boost wind energy research. Earth Syst. Sci. Data 2020, 12, 429–439. [Google Scholar] [CrossRef]
  46. Sotavento. Parque Eólico Experimental Sotavento. 2023. Available online: https://www.sotaventogalicia.com/en/technical-area/real-time-data/historical/ (accessed on 15 September 2023).
  47. Jammalamadaka, S.R.; Sengupta, A. Topics in Circular Statistics; World Scientific: Singapore, 2001; Volume 5. [Google Scholar]
  48. Effenberger, N.; Ludwig, N. A collection and categorization of open-source wind and wind power datasets. Wind Energy 2022, 25, 1659–1683. [Google Scholar] [CrossRef]
  49. REE-ESIOS. Transparency Data—Measured Onshore Wind Generation. 2024. Available online: https://www.esios.ree.es/en/analysis/1159?vis=1&start_date=01-01-2024T00%3A00&end_date=14-03-2024T23%3A55&geoids=&compare_start_date=31-12-2023T00%3A00&groupby=hour# (accessed on 10 June 2021).
  50. The Wind Power. The Wind Power. Wind Energy Market Intelligence. 2023. Available online: https://https://www.thewindpower.net/index.php (accessed on 16 September 2023).
  51. Smart, G.; Smith, A.; Warner, E.; Sperstad, I.B.; Prinsen, B.; Lacal-Arantegui, R. IEA Wind Task 26: Offshore Wind Farm Baseline Documentation; Office of Scientific and Technical Information: Golden, CO, USA, 2016. [Google Scholar] [CrossRef]
  52. Lundquist, J.K.; DuVivier, K.K.; Kaffine, D.; Tomaszewski, J.M. Costs and consequences of wind turbine wake effects arising from uncoordinated wind energy development. Nat. Energy 2019, 4, 26–34. [Google Scholar] [CrossRef]
  53. Astolfi, D.; Castellani, F.; Lombardi, A.; Terzi, L. Data-driven wind turbine aging models. Electr. Power Syst. Res. 2021, 201, 107495. [Google Scholar] [CrossRef]
  54. Pryor, S.C.; Conrick, R.; Miller, C.; Tytell, J.; Barthelmie, R.J. Intense and Extreme Wind Speeds Observed by Anemometer and Seismic Networks: An Eastern U.S. Case Study. J. Appl. Meteorol. Climatol. 2014, 53, 2417–2429. [Google Scholar] [CrossRef]
  55. Martin, C.M.S.; Lundquist, J.K.; Handschy, M.A. Variability of interconnected wind plants: Correlation length and its dependence on variability time scale. Environ. Res. Lett. 2015, 10, 044004. [Google Scholar] [CrossRef]
  56. Gualtieri, G. Analysing the uncertainties of reanalysis data used for wind resource assessment: A critical review. Renew. Sustain. Energy Rev. 2022, 167, 112741. [Google Scholar] [CrossRef]
  57. Molina, M.O.; Gutiérrez, C.; Sánchez, E. Comparison of ERA5 surface wind speed climatologies over Europe with observations from the HadISD dataset. Int. J. Climatol. 2021, 41, 4864–4878. [Google Scholar] [CrossRef]
  58. Kaspar, F.; Niermann, D.; Borsche, M.; Fiedler, S.; Keller, J.; Potthast, R.; Rösch, T.; Spangehl, T.; Tinz, B. Regional atmospheric reanalysis activities at Deutscher Wetterdienst: Review of evaluation results and application examples with a focus on renewable energy. Adv. Sci. Res. 2020, 17, 115–128. [Google Scholar] [CrossRef]
  59. Carvalho, D.; Rocha, A.; Gómez-Gesteira, M.; Silva Santos, C. Sensitivity of the WRF model wind simulation and wind energy production estimates to planetary boundary layer parameterizations for onshore and offshore areas in the Iberian Peninsula. Appl. Energy 2014, 135, 234–246. [Google Scholar] [CrossRef]
Figure 1. The spatial configuration of the domains used for the WRF model numerical simulations. The coarser domain (D01) has a spatial resolution of 15 km, whereas the inner domain (D02) has a spatial resolution of 5 km. Both domains are centred in the Iberian Peninsula.
Energies 17 01523 g001
Figure 2. Location of the NOAA surface wind speed validation stations (red points) and principal topographic and geographic characteristics of the areas around the two validation wind masts (inner small figures). The elevation above the sea level (in metres) for the surrounding areas of the Sotavento and Sierra Trigo masts are also presented in the top-right and bottom left subplots. These maps were composed using a 200 m spatial resolution Digital Elevation Model (DEM) for two masts. In addition, for the sake of clarity, a more detailed elevation map was also presented for the Sierra Trigo mast based on a 5 m spatial resolution DEM (bottom-right subplot).
Energies 17 01523 g002
Figure 3. (a) Locations of the wind farms. (b) Wind power installed at each of the continental Spanish NUTS 3 regions, as of December 2020. Outline of the methodology to derive wind power capacity factors (bottom panel): (c) Value of the wind turbine hub height, as a function of the commissioning year, used in the model; (d) Wind power capacity curve, which converts wind speed into capacity values; and (e) Cumulative efficiency factor, as a function of the commission year.
Energies 17 01523 g003
Figure 4. Modelled vs. observed scatterplots of the surface wind speed (a), mean wind speed at hour per month divided by the mean wind speed (b) and cumulative distribution of the wind speed for values ranging from 0 to 25 m/s with steps of 1 m/s (c). Values are computed for each evaluation station.
Energies 17 01523 g004
Figure 5. Measured and estimated (based on ERA5 and RetroDB) correlation of the surface wind speed values as a function of the distance between stations. An exponential model is adjusted to derive the scale lengths as derived from the observed and estimated surface wind speed (top right).
Energies 17 01523 g005
Figure 6. Results of the evaluation of the wind field for the Sotavento mast. The uppermost panel shows the observed and estimated (using ERA5 and RetroDB databases) histograms of the hourly wind speed at 40 m above ground level. The bottom subplots present the observed and modelled (using ERA5 and RetrodB dabases) wind roses at 40 m above ground level.
Energies 17 01523 g006
Figure 7. Results of the evaluation of the wind field for the SierraTrigo mast. The uppermost panel shows the observed and estimated (using ERA5 and RetroDB databases) histograms of the hourly wind speed at 40 m above ground level. The bottom subplots present the observed and modelled (using ERA5 and RetrodB dabases) wind roses at 40 m above ground level.
Energies 17 01523 g007
Figure 8. Results of the validation of the national aggregated CF estimates. (a) Observed and estimated (corrected) monthly mean Spanish national aggregated CFs time series. (b) Observed and estimated histograms of the Spanish national aggregated hourly CFs. (c) Observed and estimated histogram of the Spanish national aggregated hourly CFs ramps. Estimated values are displayed for both ERA5 and RetroDB databases. Only corrected estimates are displayed. The period of analysis is 2007–2020.
Energies 17 01523 g008
Figure 9. Modelled (corrected values) vs. observed scatter plots of the mean hourly CFs (a), mean CF value at hour per month divided by the mean value (b), and the cumulative distribution of the CFs (c). (df) as (ac), but for the modelled uncorrected values. Values are computed for the year 2020 for each Spanish NUTS 3 region. Only regions with a significant wind power installed capacity were assessed and displayed. The upper/bottom row figures were obtained based on the corrected/uncorrected CF estimates.
Energies 17 01523 g009
Figure 10. Evaluation statistics for each of the Spanish NUTS 3 regions, calculated by comparing the estimated and observed CF values. Panels (ac) show, respectively, the correlation, bias and RMSE values derived from the ERA5 database. Panels (df) are the corresponding values, but derived from the RetroDB database. Values are computed for the period 2007–2020 using the corrected CF values. The points indicate, for each statistic and region, the best performing database (ERA5 or RetroDB).
Energies 17 01523 g010
Figure 11. Measured and estimated (based on ERA5 and RetroDB) correlation of the CFs for each of the Spanish NUTS 3 regions as a function of distance. An exponential model was adjusted to derive the scale lengths as derived from the observed and estimated CFs (top right). Values were computed using the corrected CF hourly estimates over the year 2020.
Energies 17 01523 g011
Table 2. Summary of the different datasets, and their main characteristics, used in this study.
NameTypeDataSpatial ResolutionTemporal Coverage
RetroDB (wind)Model estimatesSurface and aloft wind speed5 km2007–2020
ERA5 (wind)Model estimatesSurface and aloft wind speed 30 km2007–2020
NOAAValidation measurementsSurface wind speedPoint2019–2020
Wind mastsValidation measurementsAloft wind speedPoint2020
SOWISPValidation measurementsInstalled capacityPoint2007–2020
REEValidation measurementsWind energyRegional2007–2020
RetroDB (energy)Model estimatesWind energyRegional2007–2020
ERA5 (energy)Model estimatesWind energyRegional2007–2020
Table 3. Surface wind speed evaluation statistics values for the ERA5 and RetroDB estimates. Values are computed across all the validation stations, the standard deviation of the statistics across the validation station is indicated at right. Bias and RMSE values in m/s.
ModelCorrelationBiasRMSE e MD · 10 2 e F
ERA50.75 ± 0.07 0.20 ± 0.601.60 ± 0.280.59 ± 0.930.62 ± 0.30
RetroDB0.71 ± 0.060.35 ± 0.391.69 ± 0.250.49 ± 1.000.52 ± 0.21
Table 4. Wind speed (at 40 m a.g.l.) evaluation statistics values for the ERA5 and RetroDB estimates at the Sotavento wind mast. Bias and RMSE values are in m/s.
ModelCorrelationBiasRMSEeMD · 102eFDACC
ERA50.84 1.27 2.370.701.2774.79
RetroDB0.821.202.670.901.2080.42
Table 5. Wind speed (at 40 m a.g.l.) evaluation statistics values for the ERA5 and RetroDB estimates at the SierraTrigo wind mast. Bias and RMSE values are in m/s.
ModelCorrelationBiasRMSEeMD · 102eFDACC
ERA50.65 3.32 4.28 0.70 3.3138.59
RetroDB0.76 0.02 2.25 0.20 0.2252.39
Table 6. National aggregated hourly capacity factors estimate the evaluation statistics values for the ERA5 and RetroDB. Statistics were computed for both corrected and uncorrected (in bracket at right) estimates during the period 2007–2020.
ModelCorrelationBiasRMSE
ERA50.95 (0.93) 0.01 ( 0.10 ) 0.06 (0.11)
RetroDB0.92 (0.92) 0.01 ( 0.14 ) 0.06 (0.17)
Table 7. Mean, maximum, minimum, and standard deviation values for observed and estimated hourly national aggregated CFs values during the period 2007–2020. Statistics values for both ERA5 and REtroDB are computed based on the corrected estimates.
DatabaseMeanMaxMinStd
REE0.250.790.000.15
ERA50.240.980.000.17
RetroDB0.240.940.000.15
Table 8. The NUTS 3 region capacity factor evaluation statistics values for the ERA5 and RetroDB estimates. Values are computed across all the regions, the standard deviation of the statistics across the regions are indicated on the right. The bottom/top tables show the statistics of the uncorrected/corrected estimates.
ModelCorrelationBiasRMSEeMD · 103eF
ERA50.83 ± 0.10 0.03 ± 0.060.15 ± 0.040.42 ± 5.520.42 ± 0.27
RetroDB0.82 ± 0.06 0.01 ± 0.030.14 ± 0.030.22 ± 1.670.26 ± 0.13
ERA5uncorr.0.80 ± 0.11 0.10 ± 0.050.18 ± 0.050.74 ± 4.660.70 ± 0.33
RetroDBuncorr.0.83 ± 0.060.14 ± 0.040.23 ± 0.04 0.72 ± 1.711.08 ± 0.32
Disclaimer/Publisher’s Note: The statements, opinions and data contained in all publications are solely those of the individual author(s) and contributor(s) and not of MDPI and/or the editor(s). MDPI and/or the editor(s) disclaim responsibility for any injury to people or property resulting from any ideas, methods, instructions or products referred to in the content.

