1. Introduction
Climate change is drawing increasing attention to measures that mitigate negative environmental impacts [
1]. One significant action to address climate issues is improving energy efficiency, as by 2030, it is necessary to increase its efficiency by at least 32.5% [
2,
3]. Excessive energy consumption, particularly noticeable in households, contributes to this challenge. In 2022, the global electricity sector recorded a consumption of over 13000 TWh in households, increasing by approximately 3000 TWh every five years [
4,
5]. Renewable energy sources (RESs), i.e., solar, wind, water, biomass, etc., are vital for addressing this issue [
6,
7]. However, variable weather conditions and high investment costs for RES installations hinder their widespread adoption, especially among customers (mainly households) [
8]. Additionally, storing excess energy during surplus hours, redistributing during shortage hours, and potentially minimizing differences in the annual cycle (due to seasons) pose challenges. Therefore, it is crucial to develop green energy production devices that meet customer expectations about price and quality while minimizing the environmental impact throughout their life cycle. Hence, the proper planning and implementation of actions are essential [
9], including analyzing and developing energy consumption patterns in households, considering customer needs [
10], cost analysis, and environmental protection. These aspects play a key role in shaping demand-related policies and sustainable development initiatives [
11].
Photovoltaic panels (PVps) are a popular source of renewable energy [
12]. These panels do not produce greenhouse gases during operation and use, utilizing energy flow from the environment [
13]. Recognized for their key role in improving electrical energy consumption efficiency, PV panels (PVps) can cover approximately 70% (even up to 100% in summer months) of the demand for domestic hot water [
14]. The total PV capacity at the end of 2022 was 1.2 TW worldwide [
15], with a geometric growth of +228 MW annually from 2000 to 2023 (+24% in 2022). Another advantage is their relatively high reliability [
16]. However, adapting PVps to customer expectations remains challenging, mainly because the efficiency of PV systems becomes noticeable to the customer only after a longer period of use [
13]. Moreover, the increased production of PVps negatively impacts their environmental footprint throughout their life cycle, mainly in the recycling phase [
17,
18,
19]. Consequently, simultaneously ensuring the adequate quality of PVps while achieving minimal environmental impact throughout their life cycle remains an ongoing challenge [
20,
21].
For example, in [
22], a full life cycle analysis of photovoltaic power plant materials and components was conducted. Ref. [
23] focused on recycling silicon photovoltaic waste in the final life cycle assessment (LCA) phase. Ref. [
24] compared micromorph photovoltaic panels throughout their life cycle, showing significant efficiency improvements. Ref. [
25] analyzed PV performance based on installation methods, highlighting the relevance of agrivoltaic systems. Ref. [
26] applied sustainable development criteria to assess various PVps’ performance and production costs. Ref. [
27] conducted an initial LCA of green energy products, including PVps. Ref. [
28] demonstrated the usefulness of electricity turnover analyses for accurate LCA result interpretation. Other studies linked the quality of PVps with customers. Ref. [
29] proposed an integrated AHP and Quality Function Deployment (QFD) approach for selecting PVps based on customer satisfaction. Ref. [
30] linked the producer and the customer when designing PVps that were both cost-efficient and of sufficient quality. Customer satisfaction with the quality of various PVps was assessed in [
31,
32,
33], which incorporated customer expectations into the LCA design phase.
The direct result of this research is our own proposal of an integrated Quality–Cost–Environmental (QCE) indicator for the selection of high-quality, cost-efficient, eco-friendly PVps.
The literature review reveals that manufacturers prioritize PV quality to ensure customer satisfaction, leading to increased prices and a diminished focus on environmental considerations. Simultaneously, there is a growing ecological awareness regarding the environmental impact of discarded PVps. In the realm of sustainable development, a competitive edge can be gained by addressing PV panels’ quality, cost, and ecological impact. In an environmentally conscious society, PV manufacturers must take this into account. While previous research has individually explored these aspects of competitive advantage, a comprehensive approach, encompassing a nuanced analysis of PVps for quality (customer satisfaction), cost-effectiveness, and environmental impact throughout their life cycle, remains uncharted. This article addresses this research gap.
The aim of this paper is to develop an integrated QCE indicator for selecting a PVp offered to customers by the producers, considering their (i) quality (user satisfaction); (ii) cost-effectiveness; and (iii) environmental impact throughout the life cycle. The QCE indicator represents the final outcome of our original model proposal.
The model’s uniqueness lies in integrating various supporting analyses into a cohesive framework to estimate a product’s quality, cost-effectiveness, and environmental impact throughout its life cycle. The model yields a new Quality–Cost–Environmental indicator (QCE), enabling the selection of a product that is not only advantageous for customers in terms of quality and cost-effectiveness but also environmentally friendly, considering its impact throughout the product’s life cycle.
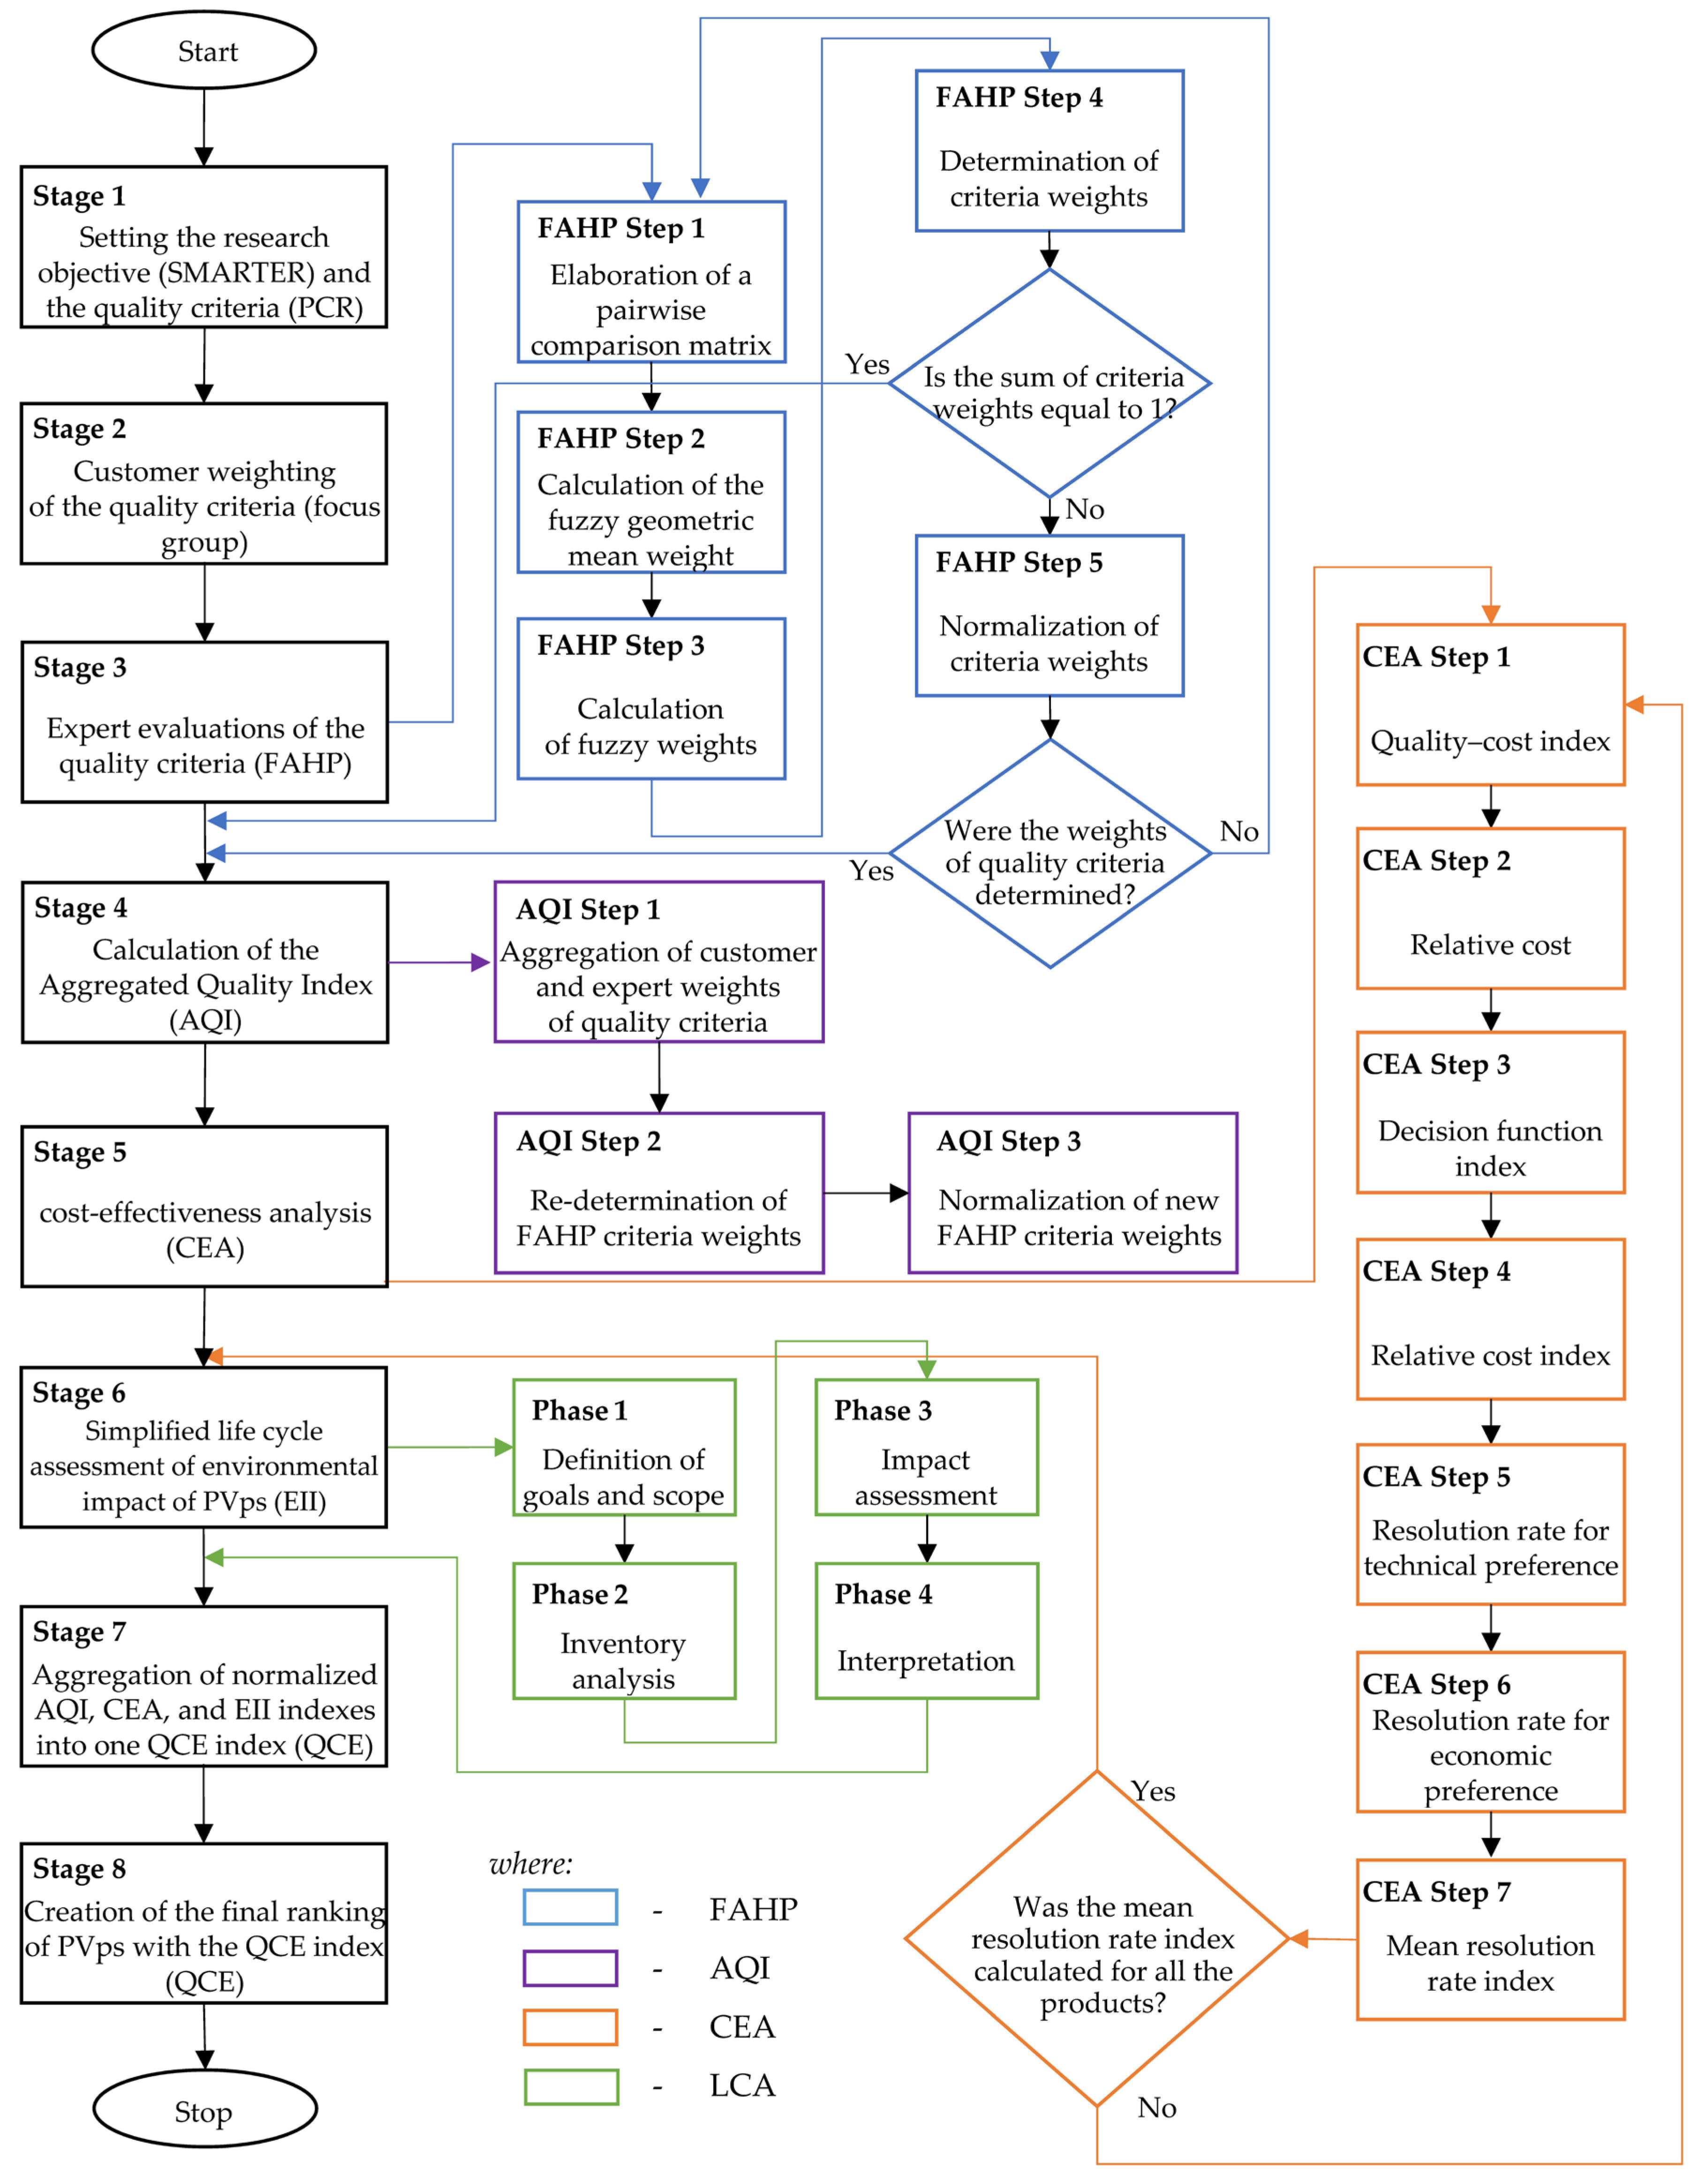
2. Model Design
We have developed a multicriteria decision-making (MCDM) model where the manufacturer selects which of the PV panel types to produce for the customers. The model, useful for all types of production entities, is based on our proposal of the QCE indicator, which facilitates offering environmentally friendly PVps that align with customers’ quality expectations at a reasonable cost-effectiveness ratio.
The PV panel selection model covers three aspects: (I) quality—Stages 1–4; (II) cost-effectiveness from the manufacturer’s perspective—Stage 5; (III) environment—Stage 6. Stages 7–8 cover culminative calculations. The model’s application involves (1) setting the research objective and quality criteria using the SMARTER [
34] and Preliminary Criteria Reduction (PCR) [
35] methods (model assumptions from the manufacturer); (2) customer weighting the quality criteria on an ordinal scale of preference—with the use of the focus group (clients’ preferences); (3) expert evaluations of the quality criteria within the Fuzzy Analytic Hierarchy Process (FAHP) [
36,
37] (experts’ evaluations); (4) the calculation of the Aggregated Quality Index (AQI, model operator); (5) cost-effectiveness analysis (CEA) (experts’ calculations); (6) life cycle assessment (LCA) of environmental impact of PV panel types (experts); (7) the aggregation of the normalized AQI, CEA, and LCA into one QCE indicator (model operator); and (8) the creation of a ranking of PVps, which enables the selection of the possibly most efficient (quality), affordable (cost) and environmentally friendly (sustainability) product for manufacturing (model software—resulting data for the manufacturer).
Figure 1 represents the algorithm flowchart of our model, with its consecutive stages described below.
The aim of this paper is to develop an integrated QCE indicator for selecting PVps considering their (i) quality, (ii) cost-effectiveness, and (iii) environmental impact throughout the life cycle. This involves sequentially estimating three indicators: the product quality level (customer satisfaction with the use of the product), the negative environmental impact in the LCA (environmental impact), and the purchase cost index, which is subsequently integrated as part of a simultaneous Quality–Environment–Cost analysis. This includes determining the product that will have the highest quality index, the lowest negative environmental impact, and the lowest purchase cost. The research objective can be determined using the SMART (specific, measurable, achievable, relevant, time-bound) method [
34]. The SMART method can be employed to structure the objectives and aims of the end user of our model by aligning the purpose with the key criteria of the SMART method. This involves ensuring that the purpose is specific, measurable, achievable, relevant, and time-bound. The specificity of the purpose should be based on the requirements of the expert utilizing the model. The producer chooses a maximum of 10 [
38] PV panel types for consideration, e.g., as in [
39].
The literature review revealed the following PVp characteristics (quality criteria):
Nominal power (Wp)—estimated panel performance under standardized test conditions (temperature: 25 °C; solar irradiance: 1000 W/m2);
Short-circuit current (A)—current flowing through the panel cell during a short circuit;
Maximum current (A)—maximum panel power;
Open-circuit voltage (V)—maximum voltage generated by the panel when not connected to a load;
Maximum voltage (V)—maximum voltage generated by the panel when connected to a load;
Efficiency (%)—the percentage of solar energy converted by a single panel into electrical energy;
Warranty period (years)—expected panel efficiency over time;
Temperature coefficient of current, voltage, or power (%/˚C)—indicates panel power at a specific temperature;
Performance (%)—usability level, determining the energy coefficient produced by the panel under specific sunlight conditions, within a specified time and under certain operating conditions;
Number and type of cells;
Weight (kg)—weight of the entire photovoltaic panel;
Dimensions (cm)—length, width, and thickness of the photovoltaic panel;
Mounting type—integrated, non-integrated, or providing independent installation;
Visibility—measured through Geographic Information Systems (GIS) or as a percentage of the surface area in relation to the total visible area;
Degree of integration—the connection of photovoltaic panels with their environment, whether fully integrated, partially integrated, or non-integrated;
Colour of the photovoltaic panel—hue, saturation, and brightness;
Light reflection—the reflection of natural or artificial light, which is uncontrolled and may affect customer satisfaction, including visibility reduction and discomfort [
30,
31,
32,
40].
The producer draws the final set of quality criteria for their products by limiting the criteria number using the PCR (or other) method [
35] and observing the 7 ± 2 principle [
38].
The primary experts will be the manufacturer’s employees. However, this group can potentially be supplemented with individuals from the industry. In practice, this may be challenging, as most producers will be reluctant to reveal the direction of their product development to external parties. Therefore, it is assumed that competent employees of PV-producing companies will serve as experts in the proposed methodology. The customer is defined as the individual or group for whom the analyzed product is intended.
A focus group methodology [
41,
42] is utilized to elicit the weights of the quality criteria. Customers and experts in their respective focus groups assign weights, which are then normalized according to Formula (4). The values in the numerator could be, for instance, the arithmetic mean of the weights assigned by the experts for the ith criterion, or they could be a jointly agreed-upon value. The criteria should be clearly and precisely explained, and their weights should be assigned using an ordinal scale of preference, preferably represented graphically. The resulting hierarchy of preferences should be quantified, e.g., as in [
43], and the sum of all the consumers’ weights should be equal to 1. Otherwise, the data should be normalized, as in Equation (4). As a result, we obtain normalized customer weights of the quality criteria for PVps (
).
The satisfactory number of customer respondents is denoted in [
44]. The resulting weights of customer preferences towards quality will be later used for the calculation of the Aggregated Quality Index (AQI).
The product-specific quality criteria can be ranked using the FAHP method, incorporating expert evaluations [
36,
45,
46,
47]. The FAHP proves advantageous in addressing inconsistencies and imprecisions in criterion assessments, particularly when the number of experts is limited [
6,
48,
49,
50]. The methodology involves assigning quality assessments on a 1–9 fuzzy scale of pairwise comparisons—the Saaty scale [
51,
52]. The consecutive steps of the FAHP application are as follows:
The FAHP with the geometric mean will be used [
36]. Initially, a fuzzy pairwise comparison matrix,
is developed, which contains triangular expert evaluations, where l, m, and u are defined by Equation (1). The values on the main diagonal of the matrix are always equivalent, i.e., 1 (1,1,1). The inverse of the determined fuzzy number is its reciprocal, i.e.,
. Next, the fuzzy geometric mean,
is calculated, as shown in Equation (1) [
45,
46]:
where l is the leftmost evaluation among the fuzzy triangular numbers; m is the middle evaluation among the fuzzy triangular numbers; u is the rightmost evaluation among the fuzzy triangular numbers;
represents evaluations on a triangular fuzzy scale for the first criterion; and
represents evaluations on a triangular fuzzy scale for the second criterion; hence, 1 and 2 are the evaluations assigned to the first and second criterion, respectively.
Next, the fuzzy weight,
is calculated, as shown in Equation (2) [
45,
47]:
where
is the fuzzy geometric mean [
45,
46] of the ith criterion and 1,2, and n are the criteria.
Next, the weights of the criteria can be determined (
) following the Center of Area (COA) principle, as given in Equation (3) [
36,
45,
47]:
where l is the leftmost evaluation among the fuzzy triangular numbers; m is the middle evaluation among the fuzzy triangular numbers; u is the rightmost evaluation among the fuzzy triangular numbers; and I is the criterion number.
The sum of all the experts’ weights should be equal to 1. Otherwise, the data should be normalized, as shown in Equation (4) [
36,
46]:
where
is the experts’ weight of the ith criterion, and
is the customers’ weight of the ith criterion.
As a result of calculating the FAHP steps above, we obtain normalized expert weights of the weight criteria of PVps
Afterwards, the team of experts repeats the FAHP procedure to assess the quality level of the PVps based on their parameters. As a result, a normalized quality level for each criterion () is obtained.
Based on the quality level of the PV panel criteria (
) and their relevance according to customers (
) and experts (
), the Aggregated Quality Index (AQI) for PVps is calculated as follows (5):
where
represents the normalized weights of the ith criterion obtained from customers;
represents the normalized weights of the ith criterion obtained from experts;
is the normalized quality level of the ith criterion of the jth PV panel; and n is the total number of customers and experts assigning weights to the PV criteria.
The AQI is applied to create a ranking of PVps regarding customer satisfaction with their quality. The top position represents the maximum value and corresponds to the most favorable PV panel for customers in terms of quality while also considering the evaluated relevance of their quality criteria.
To bring the purchase cost of PVps into the scope, a cost analysis is conducted [
31,
53]. This reflects the quality level of the key criteria of PVps that are seen as most significant by the customers and experts. The selection of key criteria follows the Pareto–Lorenz principle (20/80) from all the analyzed criteria, as in [
31]. If multiple key criteria exist, their quality levels should be averaged and incorporated with the actual PV panel purchase cost into the cost analysis, as depicted in Equation (6) [
31,
53]:
where c
k is the cost–quality index; K is the purchase cost; Q is the quality level of the key criterion (%); q is the quality level of the key criterion; k is the relativized cost; K
a is the highest cost among all those analyzed; K
b is the lowest cost among all those analyzed; d is the decision function indicator; E is the cost–quality proportionality; c is the relativized cost index; c
pa is the maximum cost–quality index among all those analyzed; c
pb is the minimum cost-quality index among all those analyzed; R
t is the resolution rate for technical preference; R
e is the resolution rate for economic preference; and R
d is the averaged decision resolution rate—the CEA index.
With the use of the CEA index, a cost-based ranking of PVps is established. Higher CEA values represent more favorable PVps for customers, considering both the purchase cost and the quality level of the key criterion.
The total electric energy production obtained from a PVp exposed to sunlight can be estimated using Equation (7) [
54]:
where G is the total electric energy production of the PVp; n is the efficiency of the PVp (%); PR is the performance of the PVp (%); and SI is the solar insolation (kWH/m
2/year).
Knowing a PVp’s lifespan, it is possible to calculate its environmental impact throughout its entire life cycle with the use of the LCA methodology, i.e., Equation (8) [
37,
54]:
where G
T is the total environmental impact of the PVp; G is the total electric energy production of the PVp; and LT is the lifespan of the PVp.
G
T represents the total environmental impact of a PVp (in kWh). For the needs of our model, G
T values are normalized with the use of Equation (9) to facilitate their integration with AQI and CEA indexes:
where EEI
i is the Environmental Impact Index (EII) for the ith PVp;
is the total environmental impact of the PVp; and i is the PVp number.
Normalized EEI values are used to create a ranking of the environmental impact of the analyzed PVp. The first position of the ranking represents the minimum normalized EEI value, indicating the smallest environmental impact of this PVp throughout its entire life cycle. The higher the EEI value, the greater the environmental impact of this PVp.
The methodology we propose is a simplified version of an LCA of PVps and is applicable for a general assessment of their environmental impact. For a more precise estimation of the environmental impact of PVps throughout their entire life cycle, a traditional assessment can be conducted under ISO 14040 guidelines [
53]. The assessment process can also be supported by computer programs, e.g., OpenLCA, SimaPro, and Gabi.
This model aims to help customers choose the most favorable PVp by considering quality, purchase cost, and environmental impact. To integrate these factors, an aggregated Quality–Cost–Environment (QCE) indicator has been developed, allowing for a consideration of the relevance of these aspects to overall customer satisfaction—Equation (10):
where EEI
i is the Environmental Impact Index for the ith PVp; AQI
i is the Aggregated Quality Index for the ith PVp; CEA
i is the cost-effectiveness analysis index for the ith PVp; z, x, and y represent the relevance of the qualitative (z), environmental (x), and cost aspects (y)—all of which are determined according to the preferences of the customer or manufacturer; and I is the PVp number.
QCE values should be arranged in a single ranking. The maximum value indicates that the PVp is possibly most satisfying for customers in terms of quality and purchase cost and has the smallest possible environmental impact throughout its lifecycle.
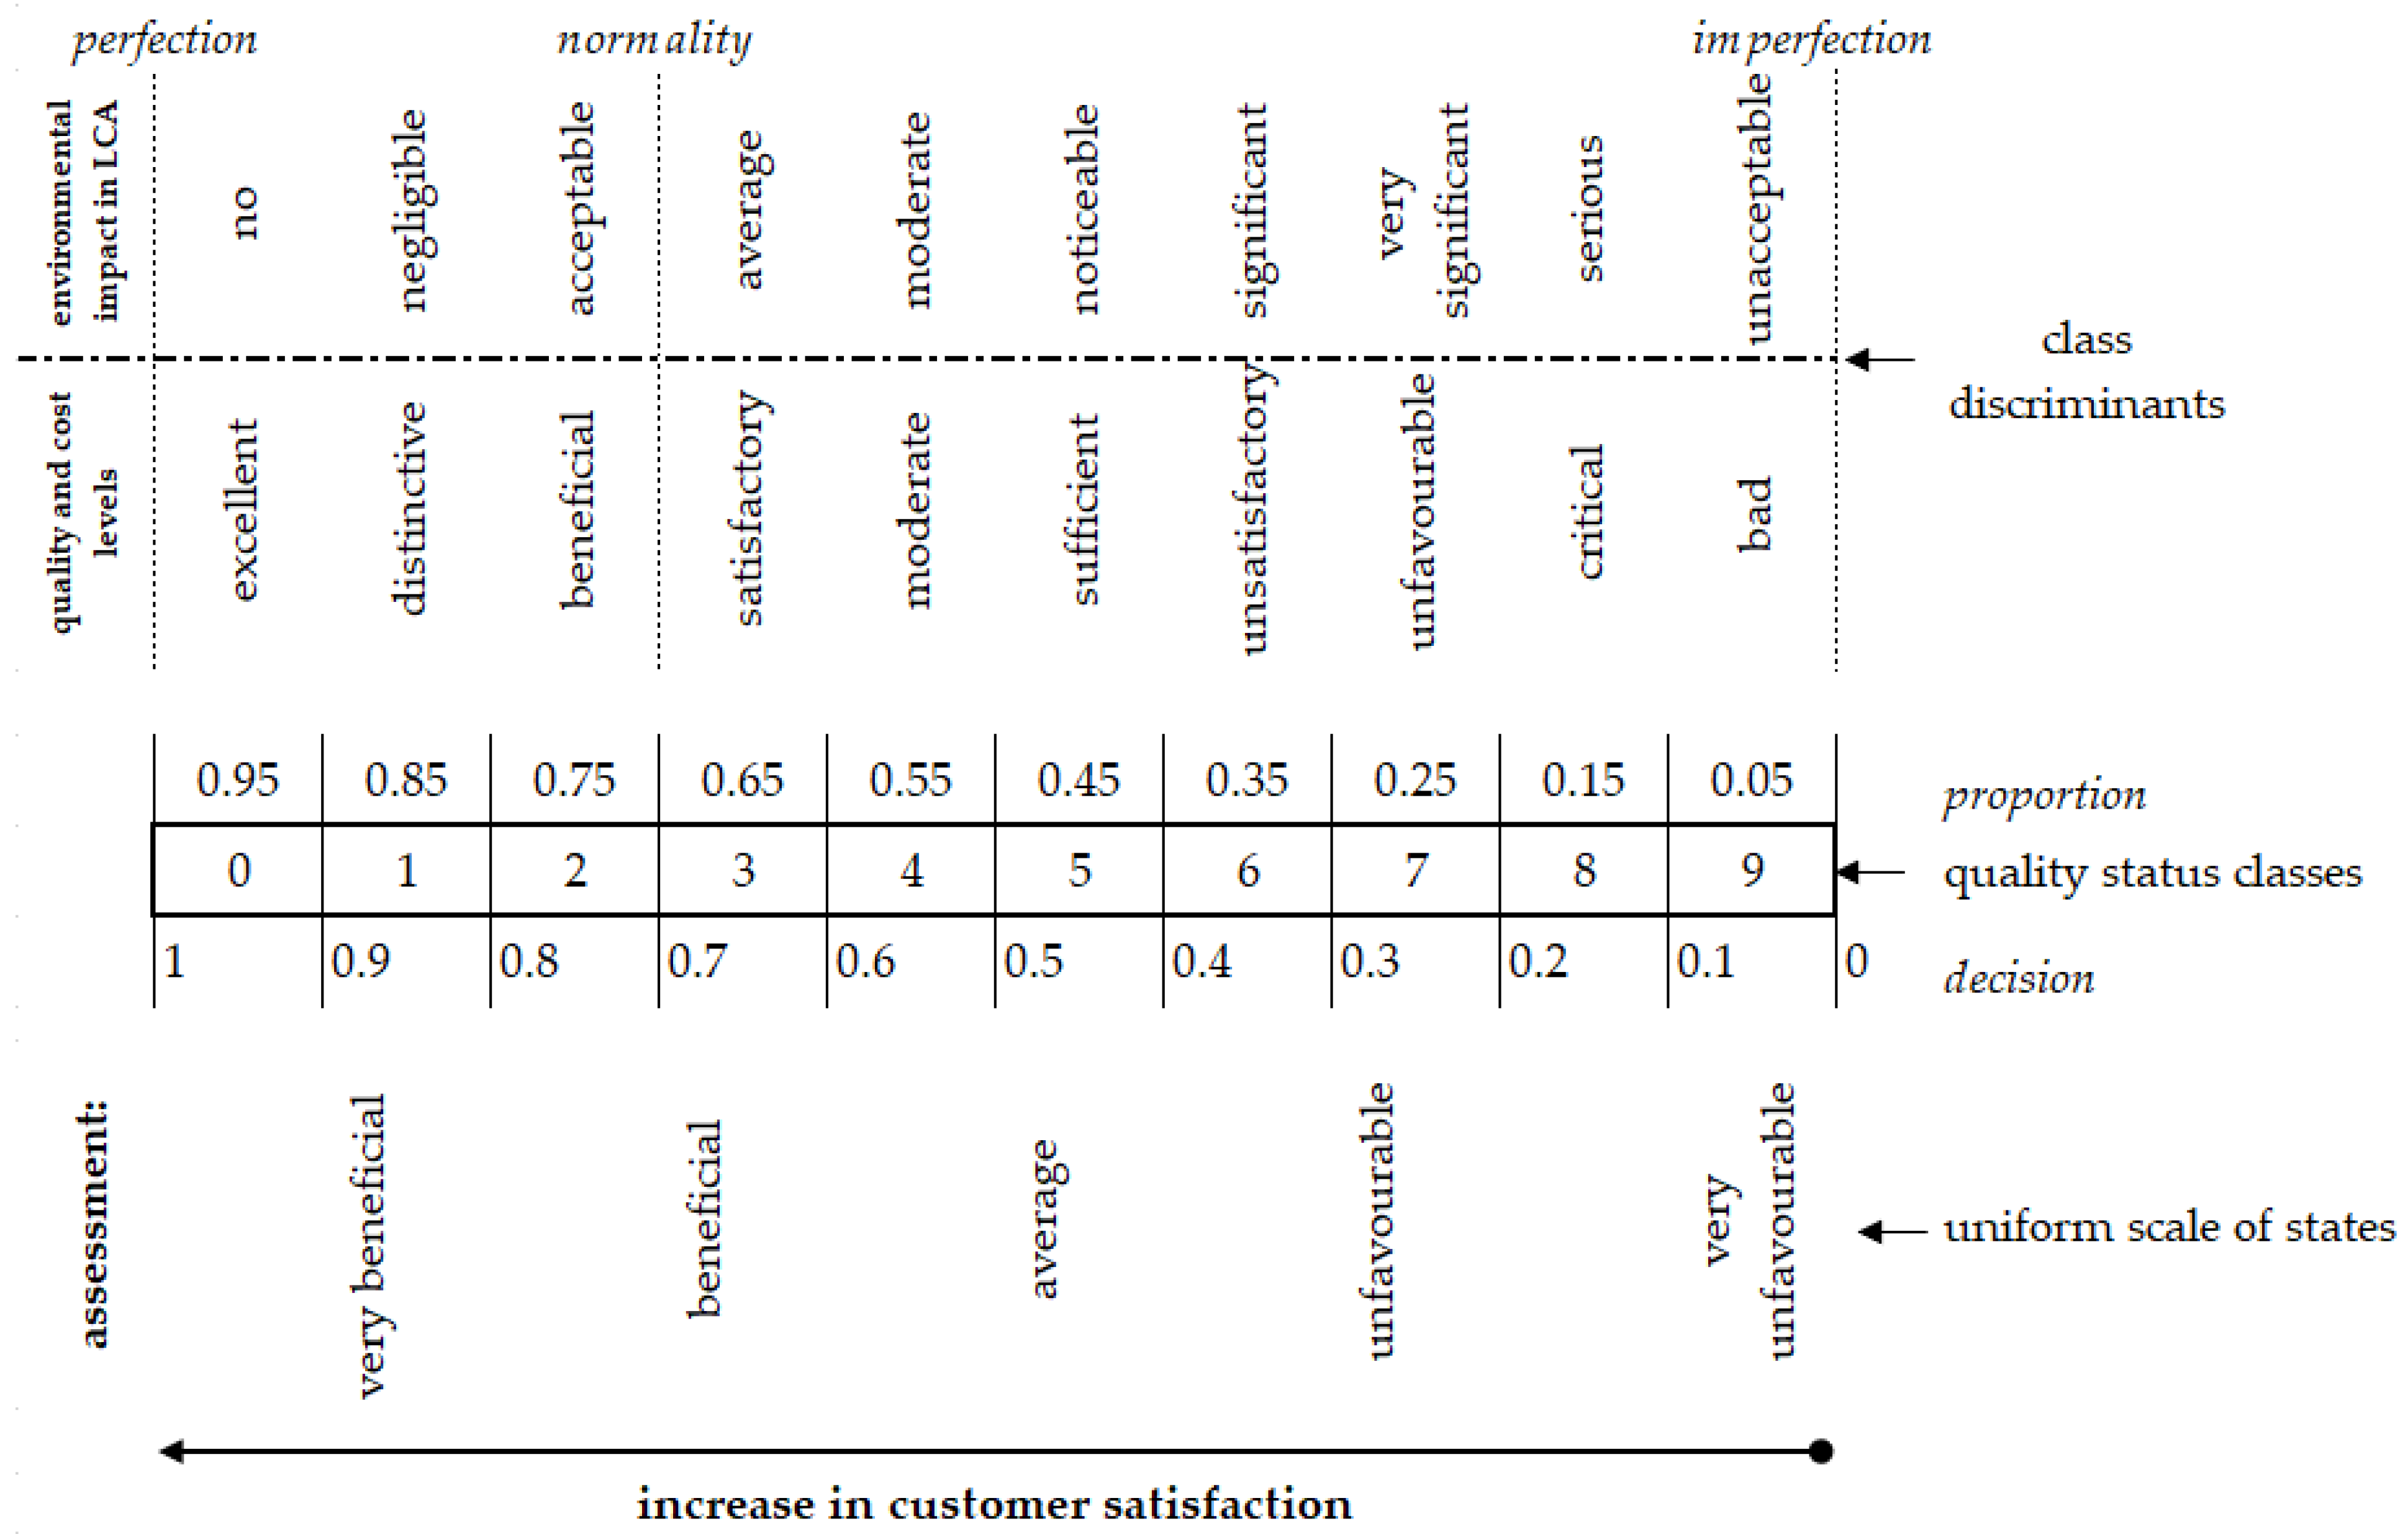
Figure 2 presents a proposal for a scale for QCE interpretation.
The interpretation is based on the proportion values. A value falling within a specific range of the quality–environmental proportion is verbally interpreted according to class discriminants.
The proposed QCE indicator allows for ranking PVps. The top-ranked PVp exhibits the highest possible quality, the lowest purchase price, and minimal environmental impact throughout their lifecycle. This PVp should be proposed to consumers as the one fulfilling their expectations best when assessing all their choice criteria simultaneously.
3. Results
The following presents an illustration of the model’s application procedure (MAP). In Stage 1, the research objective was defined using the SMART criteria, aiming to offer customers the most satisfying photovoltaic panel (PVp) in terms of quality, purchase cost, and environmental impact. PVp types were selected for analysis, and the initial set of quality criteria was identified, with the number limited using the PCR method. As a result, six PVps from key European manufacturers (PVp1–PVp6), including three monocrystalline and three polycrystalline panels, were analyzed. This choice was made by an expert based on his own experience, PVp availability, and customer expectations. However, the number and type of PVps may vary depending on the specific use of the model.
The final set of PVp quality criteria included nominal power, efficiency, weight, dimensions, maximum voltage, degree of integration, and color (
Table 1).
In Stage 2, the customers assessed the relevance of the PVp quality criteria (
) using the focus group methodology [
41,
42]. The resulting hierarchy of preferences was quantified, as in [
43], and the sum of all the consumers’ weights equaled 1, as these weights were normalized using Equation (4). As a result, we obtained normalized customer weights for the quality criteria of PVps (
). In Stage 3, the experts ranked the same set of quality criteria with the FAHP (
). The expert and customer weights were then aggregated, leading to the re-prioritization of FAHP criteria and sub-criteria. Finally, a ranking of decision alternatives (PVp types) was obtained (
Table 2).
Efficiency emerged as the crucial quality criterion for PVps, with the highest weight attributed by both the customers and experts. Subsequently, the expert team employed the FAHP method to determine the quality level of the PV criteria (
Table 3).
The estimation of the aggregated quality level utilized the combined weights of the PVp quality criteria defined by both customers and experts. As a result, the first component indicator of our model was obtained—the AQI (
Table 4).
The assessments of quality level proved that the PV panel labeled PVp6 ranked the highest, with AQI = 0.23.
Subsequently, a cost-effectiveness analysis was performed for the pivotal criterion, marked earlier as most important by both customers and experts—here, PVp efficiency. The quality level from Stage 3 was linked with the real PVp purchase cost (in EUR). Equation (6) served to calculate the CEA index (
Table 5).
The CEA indicator values show that PVp5 is the most favorable PVp for the customers, securing the top position in the ranking with a maximum CEA value of 0.66. At this stage of the model, considering both the purchase cost and the quality level of the pivotal criterion, PVp5 proves to be the most advantageous. Next, the environmental impact of photovoltaic panels throughout their life cycle was assessed with the use of a simplified LCA.
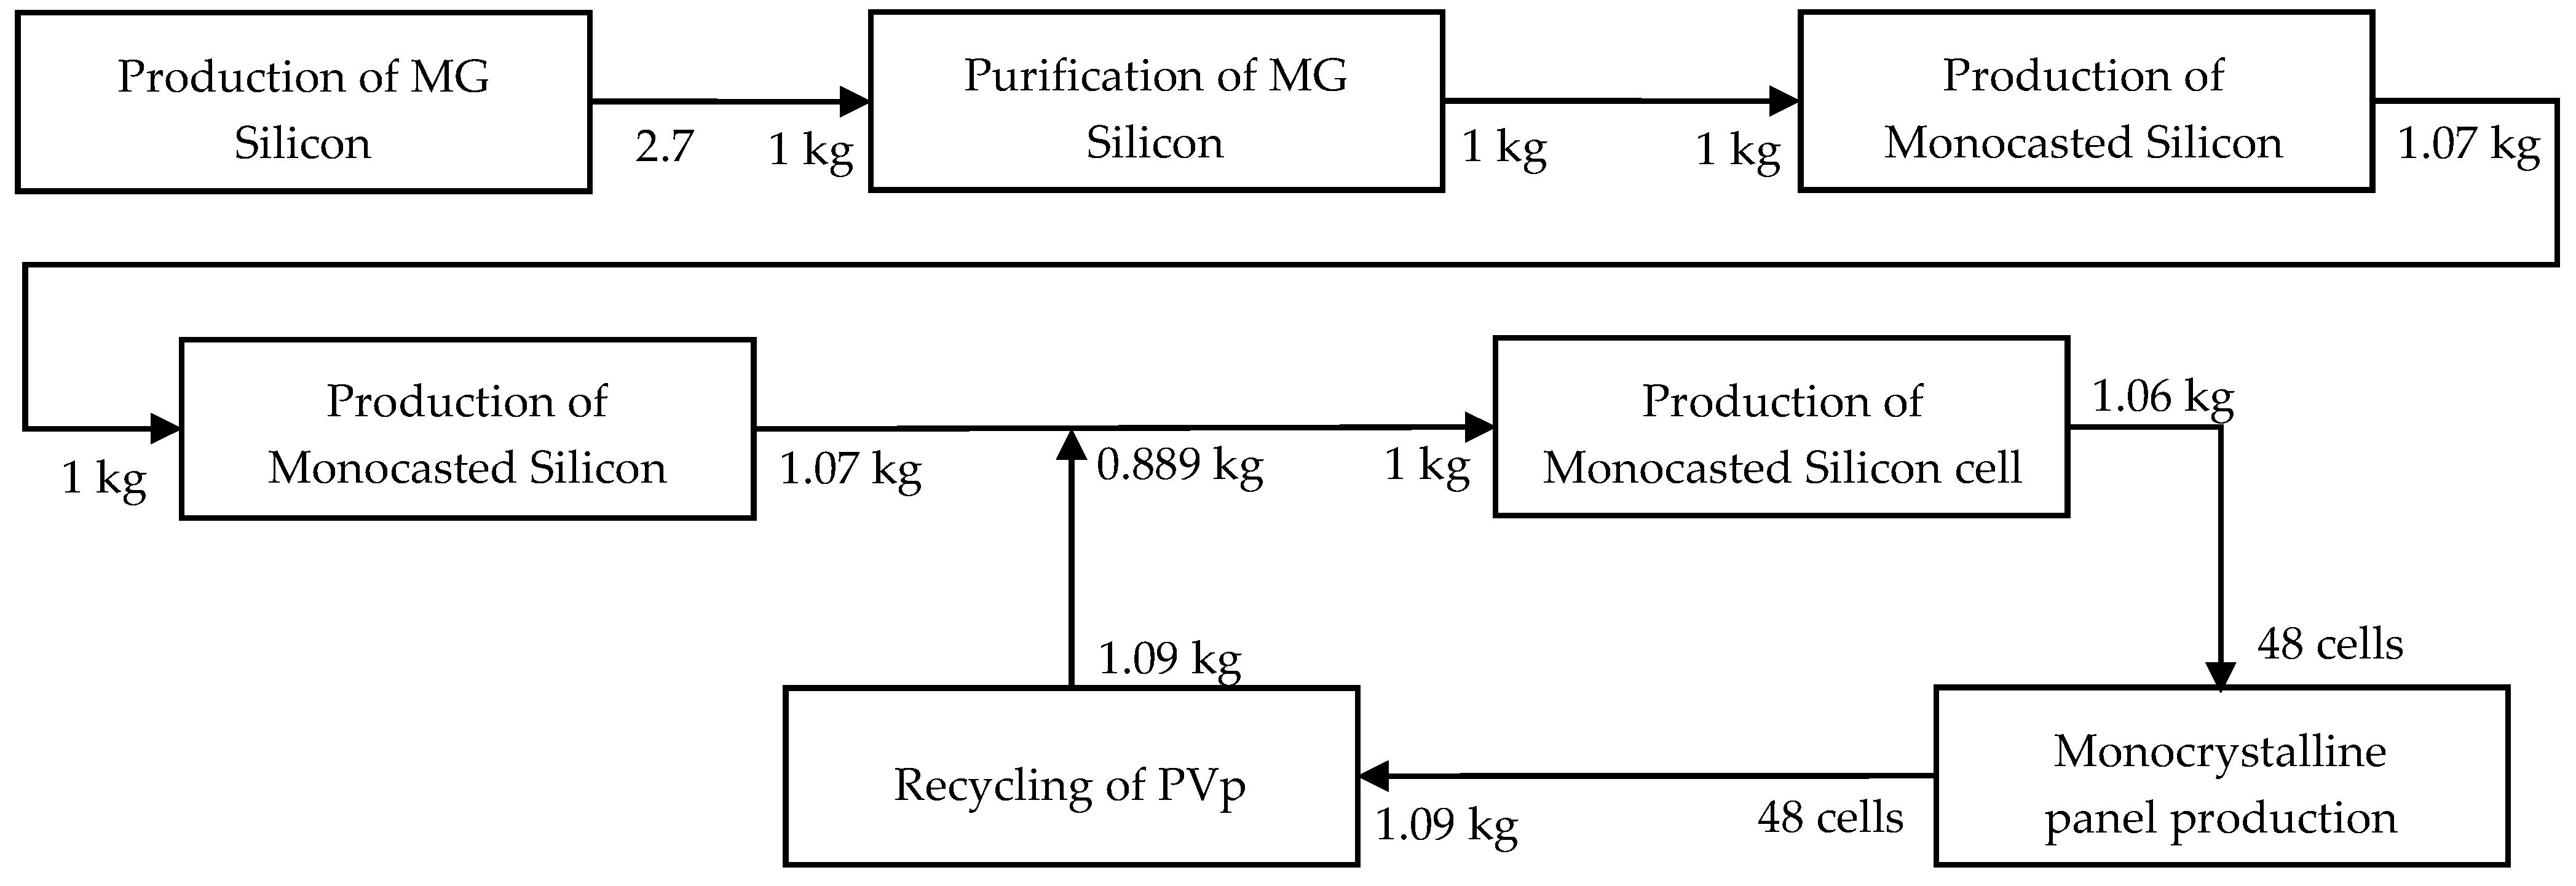
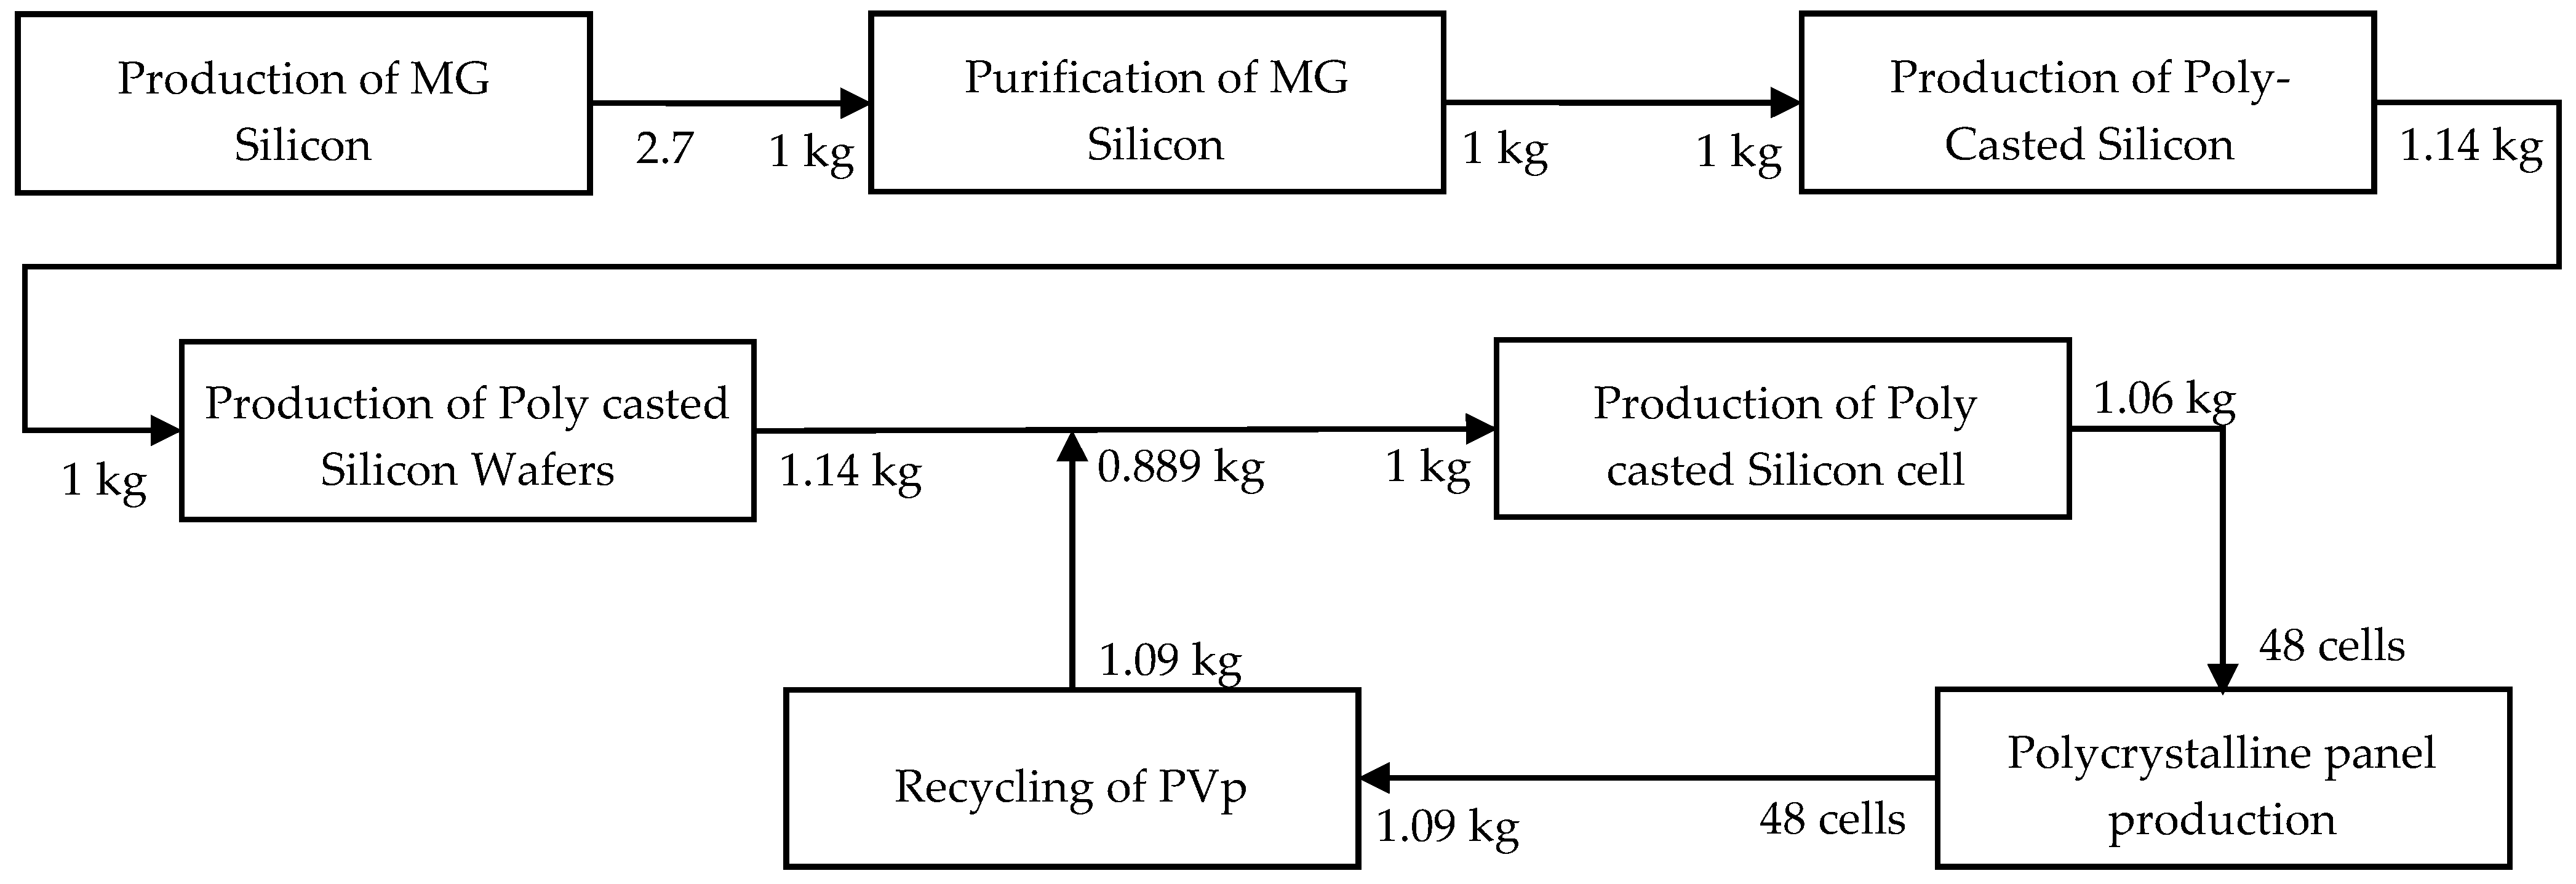
The literature review revealed input and output data in the production process of the analyzed PVps (
Table 6, source: own study based on [
54]): (1) the production of metallurgical-grade silicon (MG-Si); (2) the purification of MG-Si; (3) the production of casted silicon (monocasted (MC) and polycasted (PC)); (4) the production of casted silicon wafers; (5) the production of a casted silicon cell; (6) PVp production; and (7) the recycling of the PVp. Depending on the PVp type (mono or polycrystalline), the input and output resource values vary slightly.
Figure 3 illustrates the flow diagram of the input and output data in the production and recycling processes of monocrystalline panels.
A flow diagram of the input and output data in the production and recycling processes of polycrystalline panels is shown on
Figure 4.
Under the adopted assumptions and available data, the total electrical energy from the production of monocrystalline and polycrystalline PVps was estimated using Equation (7). Then, assuming a panel lifespan of 25 years [
24], the overall environmental impact over the life cycle was assessed according to Equation (8). In our model, EEI values are linked with the quality level of the analyzed PVps. Therefore,
had to be normalized with Equation (9). The result is presented in
Table 7.
It was observed that monocrystalline PVps have a greater environmental impact throughout their life cycle (5363.67 kWh), which is 631.02 kWh more compared to polycrystalline panels.
Subsequently, the integrated Quality–Cost–Environmental (QCE) indicator was calculated using Equation (10), assuming equal importance for all three aspects (
Table 8).
The QCE values were organized into a ranking, with the maximum value attributed to PVp6, which achieves an excellent level of Quality–Cost–Environment satisfaction for the consumer. PVp3 and PVp5 offer similar levels of satisfaction.
4. Discussion
PVps are highly popular products utilized in households, business, and public institutions [
9,
57]. Nevertheless, consumers sometimes question their quality [
58,
59,
60], especially as it may only become apparent over a longer period of use. Increased PVp production generates environmental losses [
61].
The aim of this research was to develop an integrated QCE indicator for the selection of photovoltaic panels offered to customers, simultaneously considering their quality (consumer satisfaction), purchase cost, and environmental impact throughout their life cycle. The QCE indicator was developed within an original decision-making model supporting PVp selection. A summary of the results of the model application is shown in
Table 9.
The observations revealed that different product rankings were obtained depending on the analyzed aspects (quality, cost, life cycle environmental impact). When comparing the quality level ranking (QCE indicator) with the cost ranking (CEA indicator), it was inferred that cost influences customer satisfaction and product ranking (which did not occur as surprising). The results for the environmental impact indicator (EEI) were remarkably similar, placing products in the first and second positions. We believe this is the outcome of the simplified nature of the employed LCA method.
The model illustration procedure confirmed its applicability. Based on the obtained results, it is possible to create a ranking of PVps, allowing the recommendation of a product to a customer that meets their expectations in terms of both quality and purchase cost while also being environmentally friendly throughout its life cycle.
The results of applying the model demonstrate coherence with the adopted research methodology. The research objective meets the SMART method criteria, as it is specific, achievable, relevant to producers, consumers, and society, and attainable within a relatively short timeframe. The desired level of quality is attained by incorporating customer and expert weightings, derived from focus groups and the FAHP, into the AQI. Economic viability is ensured through the CEA, while environmental concerns are addressed by the EEI. The resulting QCE indicator successfully achieves the primary research goal by providing decision-makers with a ranking of PVps based on their alignment with the model assumptions.
The novelty of our model lies in integrating various supporting analyses, i.e., customer preferences and expert evaluations, into a cohesive framework to estimate product quality, cost-effectiveness, and environmental impact throughout a product’s life cycle. It differs from other industrial decision-making models, which are usually manufacturer-oriented, whereas our proposal also involves consumers in the decision-making process—as early as in the product design phase. The model should be widely deployed in the PV industry because, by guiding decision-making processes towards sustainable choices in the energy sector, it contributes to addressing climate change challenges and promoting environmentally responsible practices in society.
A notable limitation of the model is the exclusion of customer evaluations in Stages 5 (cost) and 6 (environment), as these stages are carried out without their participation. Another limitation is that the environmental analysis is limited to existing LCA databases only.
5. Conclusions
Sustainable product development is a challenging task, particularly as products are primarily tailored to meet customer expectations, with design efforts predominantly centered on price and product quality. The challenge lies in adeptly undertaking actions that ensure both customer satisfaction and mitigate the negative environmental impact of these products throughout their life cycle. Our research addressed this issue by developing a decision-making model supporting the selection of the most advantageous PVp for customers, considering both quality, cost, and environmental impact throughout its entire life cycle, with the use of our QCE indicator.
The model was illustrated with six types of PVps and seven quality criteria: nominal power, efficiency, weight, dimensions, maximum voltage, degree of integration, and color. The model’s application resulted in obtaining values for three sub-indexes, i.e., the AQI, CEA, and EEI. The resulting QCE indicator allowed us to create a ranking of PVps to facilitate a producer offering consumers a PVp with the highest possible quality, the lowest cost, and the lowest degree of environmental impact throughout its entire life cycle. The model can be utilized by any entity (customer, producer, public institution) to enhance and refine PVp selection within any type or model (mono- or polycrystalline).
Future research will focus on expanding customer engagement in other stages of the model. We will also test the model’s applicability for other types of products.
Despite the imperfection of the proposed solution, sustainable energy production from renewable energy sources, when simultaneously considering the determinants of product quality and customer preferences towards its cost and other characteristics, remains an interesting, promising, and, most of all, indispensable field of research in the scientific disciplines of management, economy, mechanical engineering, and public policy.


