Article

Techno-Economic Performance and Sensitivity Analysis of an Off-Grid Renewable Energy-Based Hybrid System: A Case Study of Kuakata, Bangladesh

by
Sheikh Md. Nahid Hasan
1,
Shameem Ahmad
1,*,
Abrar Fahim Liaf
1,
A. G. M. B. Mustayen
2,
M. M. Hasan
3,*,
Tofael Ahmed
4,*,
Sujan Howlader
1,
Mahamudul Hassan
5 and
Mohammad Rafiqul Alam
4
1
Department of Electrical and Electronics Engineering, Faculty of Engineering, American International University–Bangladesh, Dhaka 1229, Bangladesh
2
Institute of Power Engineering, Universiti Tenaga Nasional Putrajaya, Jalan-IKRAM-UNITEN, Kajang 43000, Selangor, Malaysia
3
School of Engineering and Technology, Central Queensland University, Rockhampton, QLD 4701, Australia
4
Department of Electrical and Electronic Engineering, Chittagong University of Engineering & Technology, Chattogram 4349, Bangladesh
5
Department of Industrial and Production Engineering, Faculty of Engineering, American International University–Bangladesh, Dhaka 1229, Bangladesh
*
Authors to whom correspondence should be addressed.
Energies 2024, 17(6), 1476; https://doi.org/10.3390/en17061476
Submission received: 14 November 2023 / Revised: 10 December 2023 / Accepted: 13 February 2024 / Published: 19 March 2024

Abstract

:
Hybrid renewable energy sources (HRES) are increasingly being utilized to meet global energy demands, particularly in rural areas that rely on diesel generators and are disconnected from the utility grid, due to their environmental and human health benefits. This study investigates the performance of an off-grid, hybrid PV/diesel generator/battery system for a decentralized power plant in Kuakata, Bangladesh, meeting a load demand of 3000 kWh/day with a 501.61 kW peak load demand. HOMER Pro (hybrid optimization model for electric renewable) software (version 3.11) was used to simulate and optimize system operations utilizing real-time solar radiation and load profile data from that location. This study also includes a sensitivity analysis of the off-grid HRES system under different electrical load demands, project longevity, and derating variables. The results reveal that CO2 emissions have potentially decreased by more than 30% and over 10 tons per year, respectively, when compared to traditional power plants. The optimized system’s net present cost (NPC) was determined to be around USD 5.19 million, with a cost of energy (COE) of USD 0.367 per kWh per unit with a 100% renewable component. Furthermore, the current study’s findings are compared to previous research that has resulted in an economical hybrid renewable energy system with an affordable COE. The hybrid energy system under consideration might also be applicable to other parts of the world with comparable climate conditions.

1. Introduction

Solar energy has the most varied uses in the production of electricity of all possible renewable energy (RE) technologies employed in dispersed applications. When used in remote places, it offers dependable energy at a minimal cost [1]. Additionally, it promotes local development through generating new employment and educational opportunities. Additionally, the environmental sensitivity of the product increased its usefulness [2,3]. For buildup nations, where a sizable portion of the population is spread out among several areas with no or limited access to energy, this technology has considerable potential. In such areas, RE sources are regarded as an appropriate rural electrification solution [4]. Energy provision may be significantly impacted by this kind of energy generation. There is a significant connection between national energy consumption and the gross domestic product (GDP) in regions where access to electrical energy has a positive impact on the human development index (HDI). This is because electricity is essential for a society’s progress in the areas of economic, educational, and health development [5]. For instance, in Bangladesh, where the poverty rate is 77.12%, a significant section of the population primarily resides in distant areas of Kuakata [
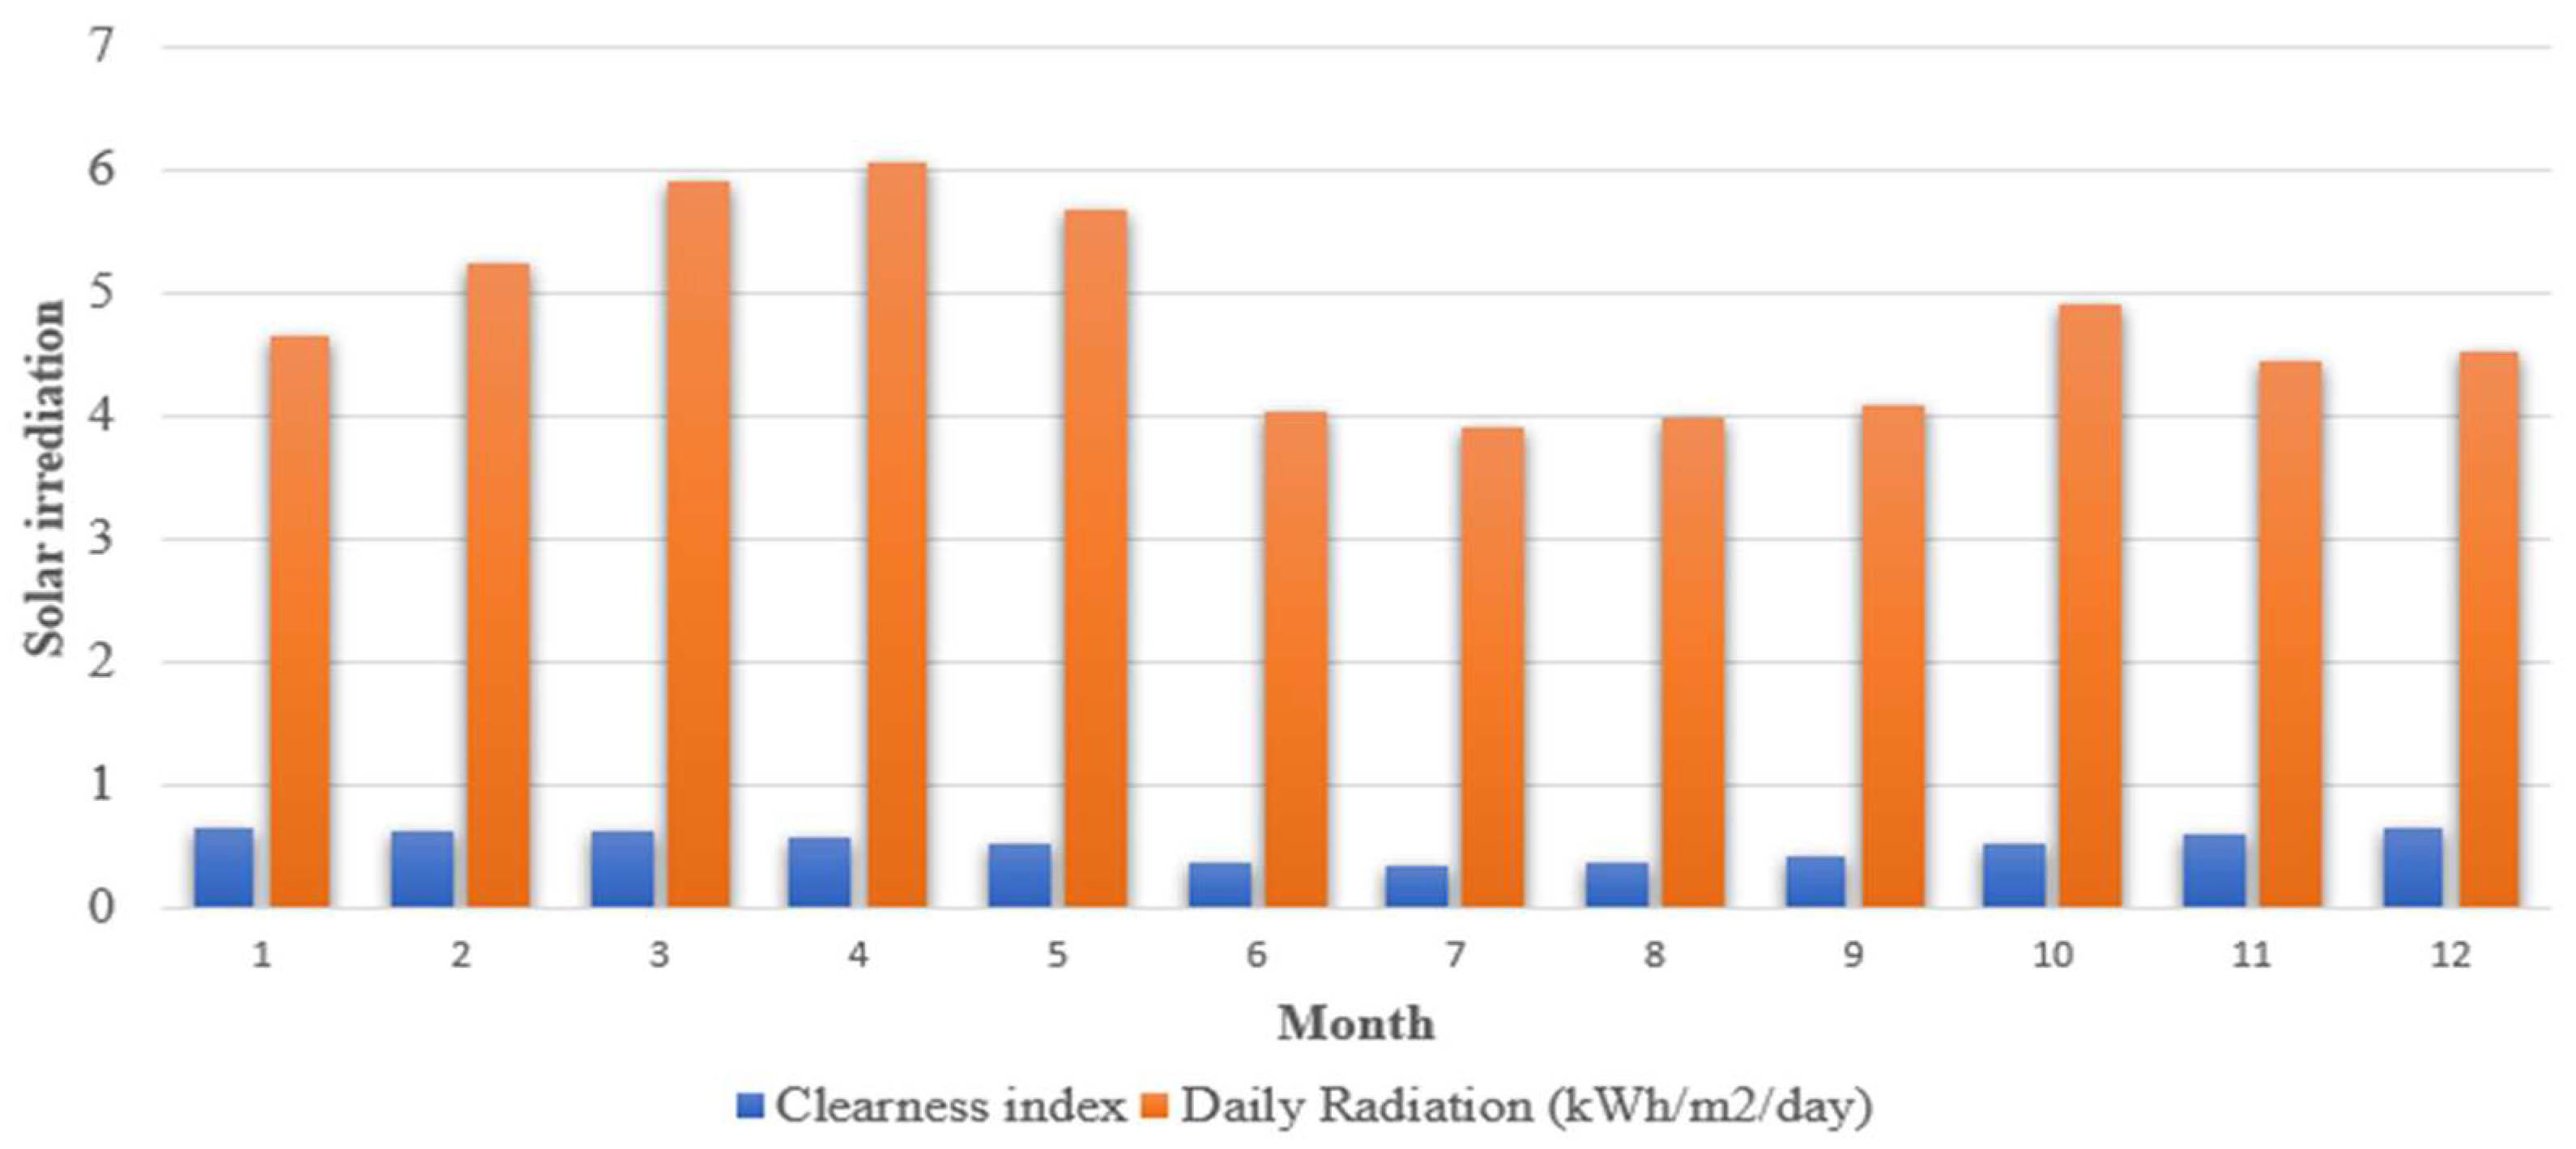
6]. Bangladesh has a good solar energy potential thanks to the high levels of solar radiation, which is an average of 4.36 kWh/m2/day. As a result, Bangladesh has long seen solar energy as a practical solution for obtaining sustainable green energy [7,8]. Bangladesh is home to many isolated regions that are cut off from the primary grid and encircled by rocky terrain and thick jungle. An extension of the grid through these periphery areas is not currently thought to be possible or cost effective. These places frequently have electricity provided by standalone diesel generators (DGs). A study that looked at the advantages of integrated RE systems in several rural Bangladeshi areas revealed a strong potential for RE (solar energy and small-scale hydropower sources) in the production of electricity [9].
The long-term effects of climate change will be devastating for Bangladesh, especially because of rising sea levels and storm surges which cause flooding in coastal regions. The present heat waves and floods are signs of worsening climate conditions [10]. The nation intends to take corrective action by reducing the emissions of greenhouse gases to 15% by 2030. However, there is much room for improvement in the switch to RE. Recent global energy crises may have accelerated the need for RE, which currently appears to be the only viable option [
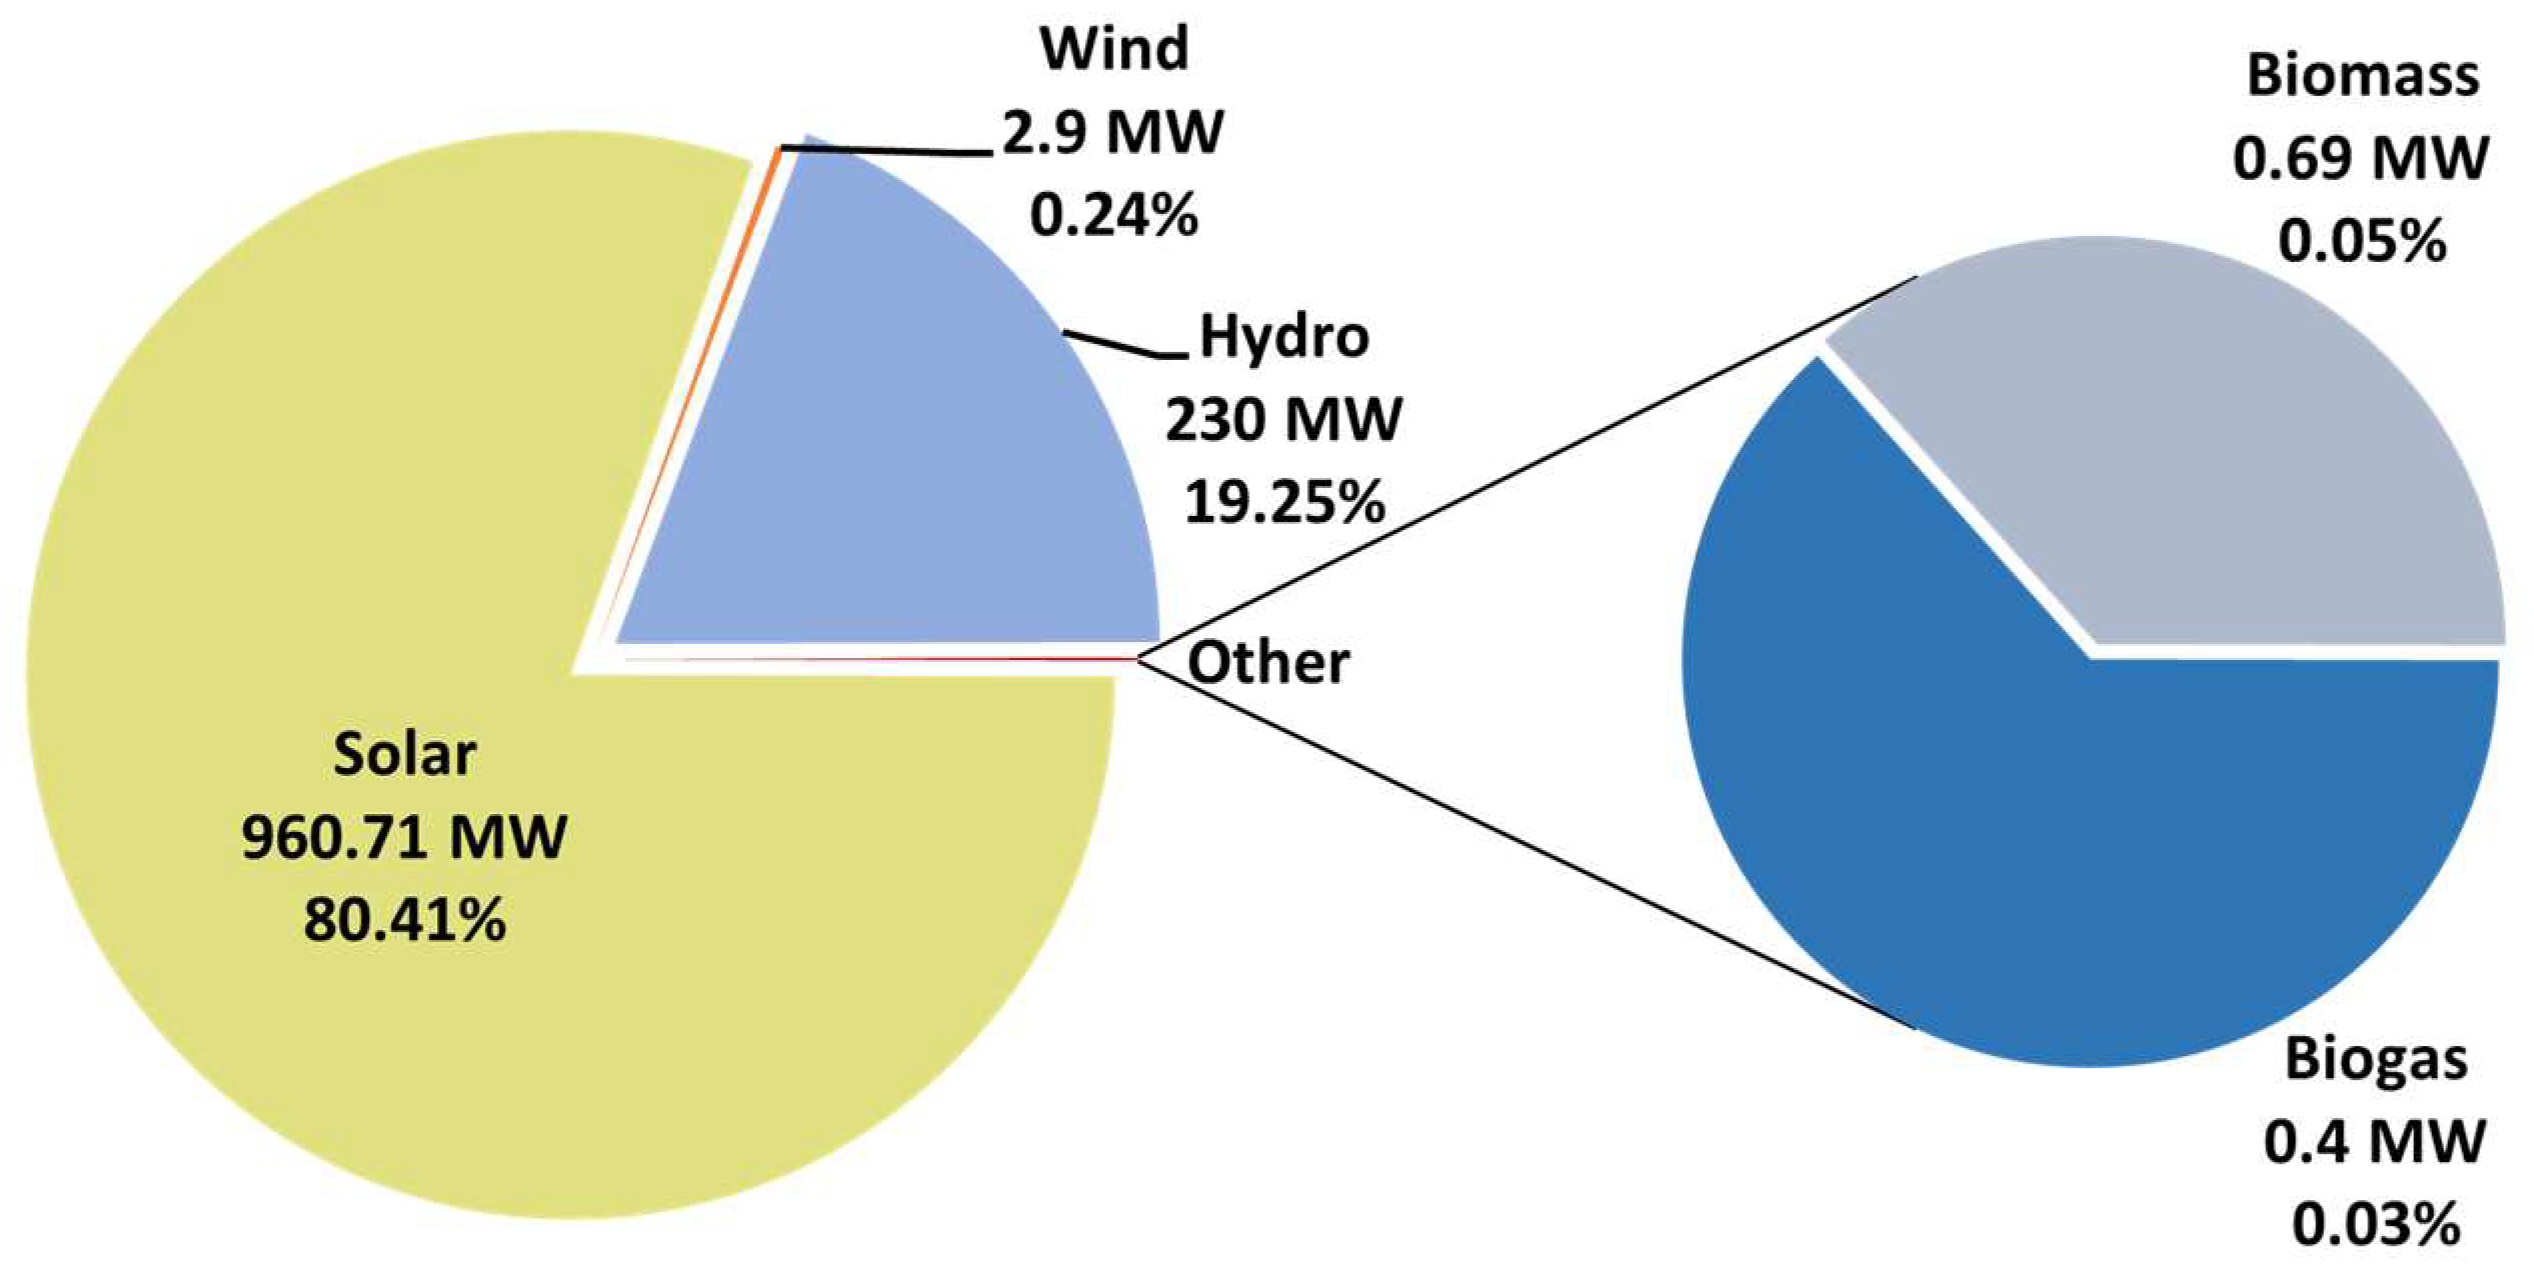
11]. In Bangladesh, the amount of energy produced via renewable resources is relatively low. According to a World Bank report, only 1.2% of all electricity generated in 2015 was produced using RE, which was 11.4% in 1990. The most common RE sources in Bangladesh at the moment are hydroelectric power, biogas, solar, and wind energy [12]. The only power plant in the nation that produces 230 MW of electrical energy is the Karnaphuli Hydro Power Station [13]. Wind energy is mostly obtained in coastal areas where wind is dominant. Currently, 2.9 MW of tested wind energy-producing turbines are located in two regions of the nation: Feni and Kutubdia. Parky Beach is now developing an additional 50–200 MW of wind power. Furthermore, the nation is capable of building 30 GW of onshore and offshore wind energy. Additional RE sources exist in the nation; among them, biogas offers considerable promise and is mostly produced from municipal and animal waste as part of sustainable waste management [14]. Another very promising source is solar energy. According to a recent Sustainable and Renewable Energy Development Authority (SREDA) estimation, the nation may produce 30 GW of solar energy by 2041 [15]. As a result, the nation’s RE industry could be a potential energy sector. According to the World Bank, Bangladesh is among the top 20 economies in terms of GDP growth, which necessitates a rising energy consumption. Figure 1 shows Bangladesh’s proportion of various RE sources. The nation’s primary energy sources as of now (2022) are natural gas, other fossil fuels, and biofuels. The Russia–Ukraine war has made the current shortage and inadequacy of fossil fuel energy resources worse, necessitating a search for cutting-edge and modern energy sources [16].
Due to the uncertain nature of the RE supply, it is currently not viable to replace conventional DGs entirely in rural locations [17,18]. Systems that combine conventional and RE sources could be a good way to combine the best features of each [19]. To get the intended results, however, a variety of social, institutional, and technical elements must be considered when developing a hybrid RE system; otherwise, the system will be unreliable and ineffective. Numerous studies have documented the best hybrid system configurations, including PV, DG, and wind battery systems [20,21]. In the meantime, PV systems have proven to be less expensive and more practical than wind turbines. Most research supports rural hybrid PV/DG systems to produce electricity. According to several studies, hybrid systems can be designed more efficiently by employing HOMER and a variety of other optimization software and algorithms, such as artificial neural networks (ANN), differential evolution (DE), and particle swarm optimization (PSO) [22,23].
A battery-powered, PV/DG hybrid power system study backup for a community in Saudi Arabia was presented by Rehman and Al-Hadhrami [24]. Particularly when the price of fossil fuels increased, the suggested hybrid solution seemed to be very efficient and advantageous. In the study [25], a novel method for evaluating the generation reliability of a hybrid mini-grid system (HMS) based on the best design outcome from the HOMER Pro (version 3.11) program is presented. The capacity outage probability table (COPT) was also used in this study to validate the accuracy of the HOMER software’s conclusions for the best system combination. A hybrid microgrid discussed in [26], which comprises a PV power system and an energy storage unit, is meant to deliver electricity to a segment of the hospital complex. The major goal of the paper is to lower the total electricity costs, incorporate renewables into the system, and have a DG and battery backup for emergencies. In several studies, the potential and techno-economic viability of using various hybrid system configurations at far-off locations have also been assessed [27,28]. The study [29] compares three hybrid systems that are made up of a DG, which can be used to power the village in the event that RE sources are not enough, solar photovoltaic (PV) system, wind turbine, and batteries. Using PV arrays, wind turbines (WTs), and battery storage (HPV/WT/BA), an optimized, stand-alone hybrid energy system is presented, with the goal of minimizing the total net present cost (NPC) while considering the likelihood of energy loss (LOEP) and the impact of interest rate (IR) changes [30]. The primary objective of the optimization is to size the hybrid system’s components, such as the number of PV cells, WTs, batteries, and the amount of power that is delivered to the load by the inverter, while minimizing the TNPC and meeting the LOEP. Another study employed HOMER and MATLAB tools to assess the Saudi Arabian potential of a hybrid solar and wind energy system [31]. According to the findings, PV systems provide more electricity for less money than comparable-sized wind turbines. In addition, they demonstrated that the price would increase if a more reliable system was needed. The fundamental goal of [32] is to deliver a cost-effective solution by lowering the NPC in the optimized system design. The report also compared the two-system designs on the basis of two critical issues: cost and environmental impact. Chong Li et al. [33] present the technical and economic viabilities of a hybrid wind/DG/battery power system using several types of batteries for a modest residential area. The paper’s optimization findings demonstrate the viability and dependability of the proposed hybrid energy system’s energy delivery to the workshop. In order to enhance the performance of the original IWO and BSA methods by integrating their benefits into one algorithm, Yahiaoui et al. [34] introduced a hybrid optimization algorithm named IWO/BSA. An independent hybrid microgrid system’s best economic design has been achieved using the suggested method.
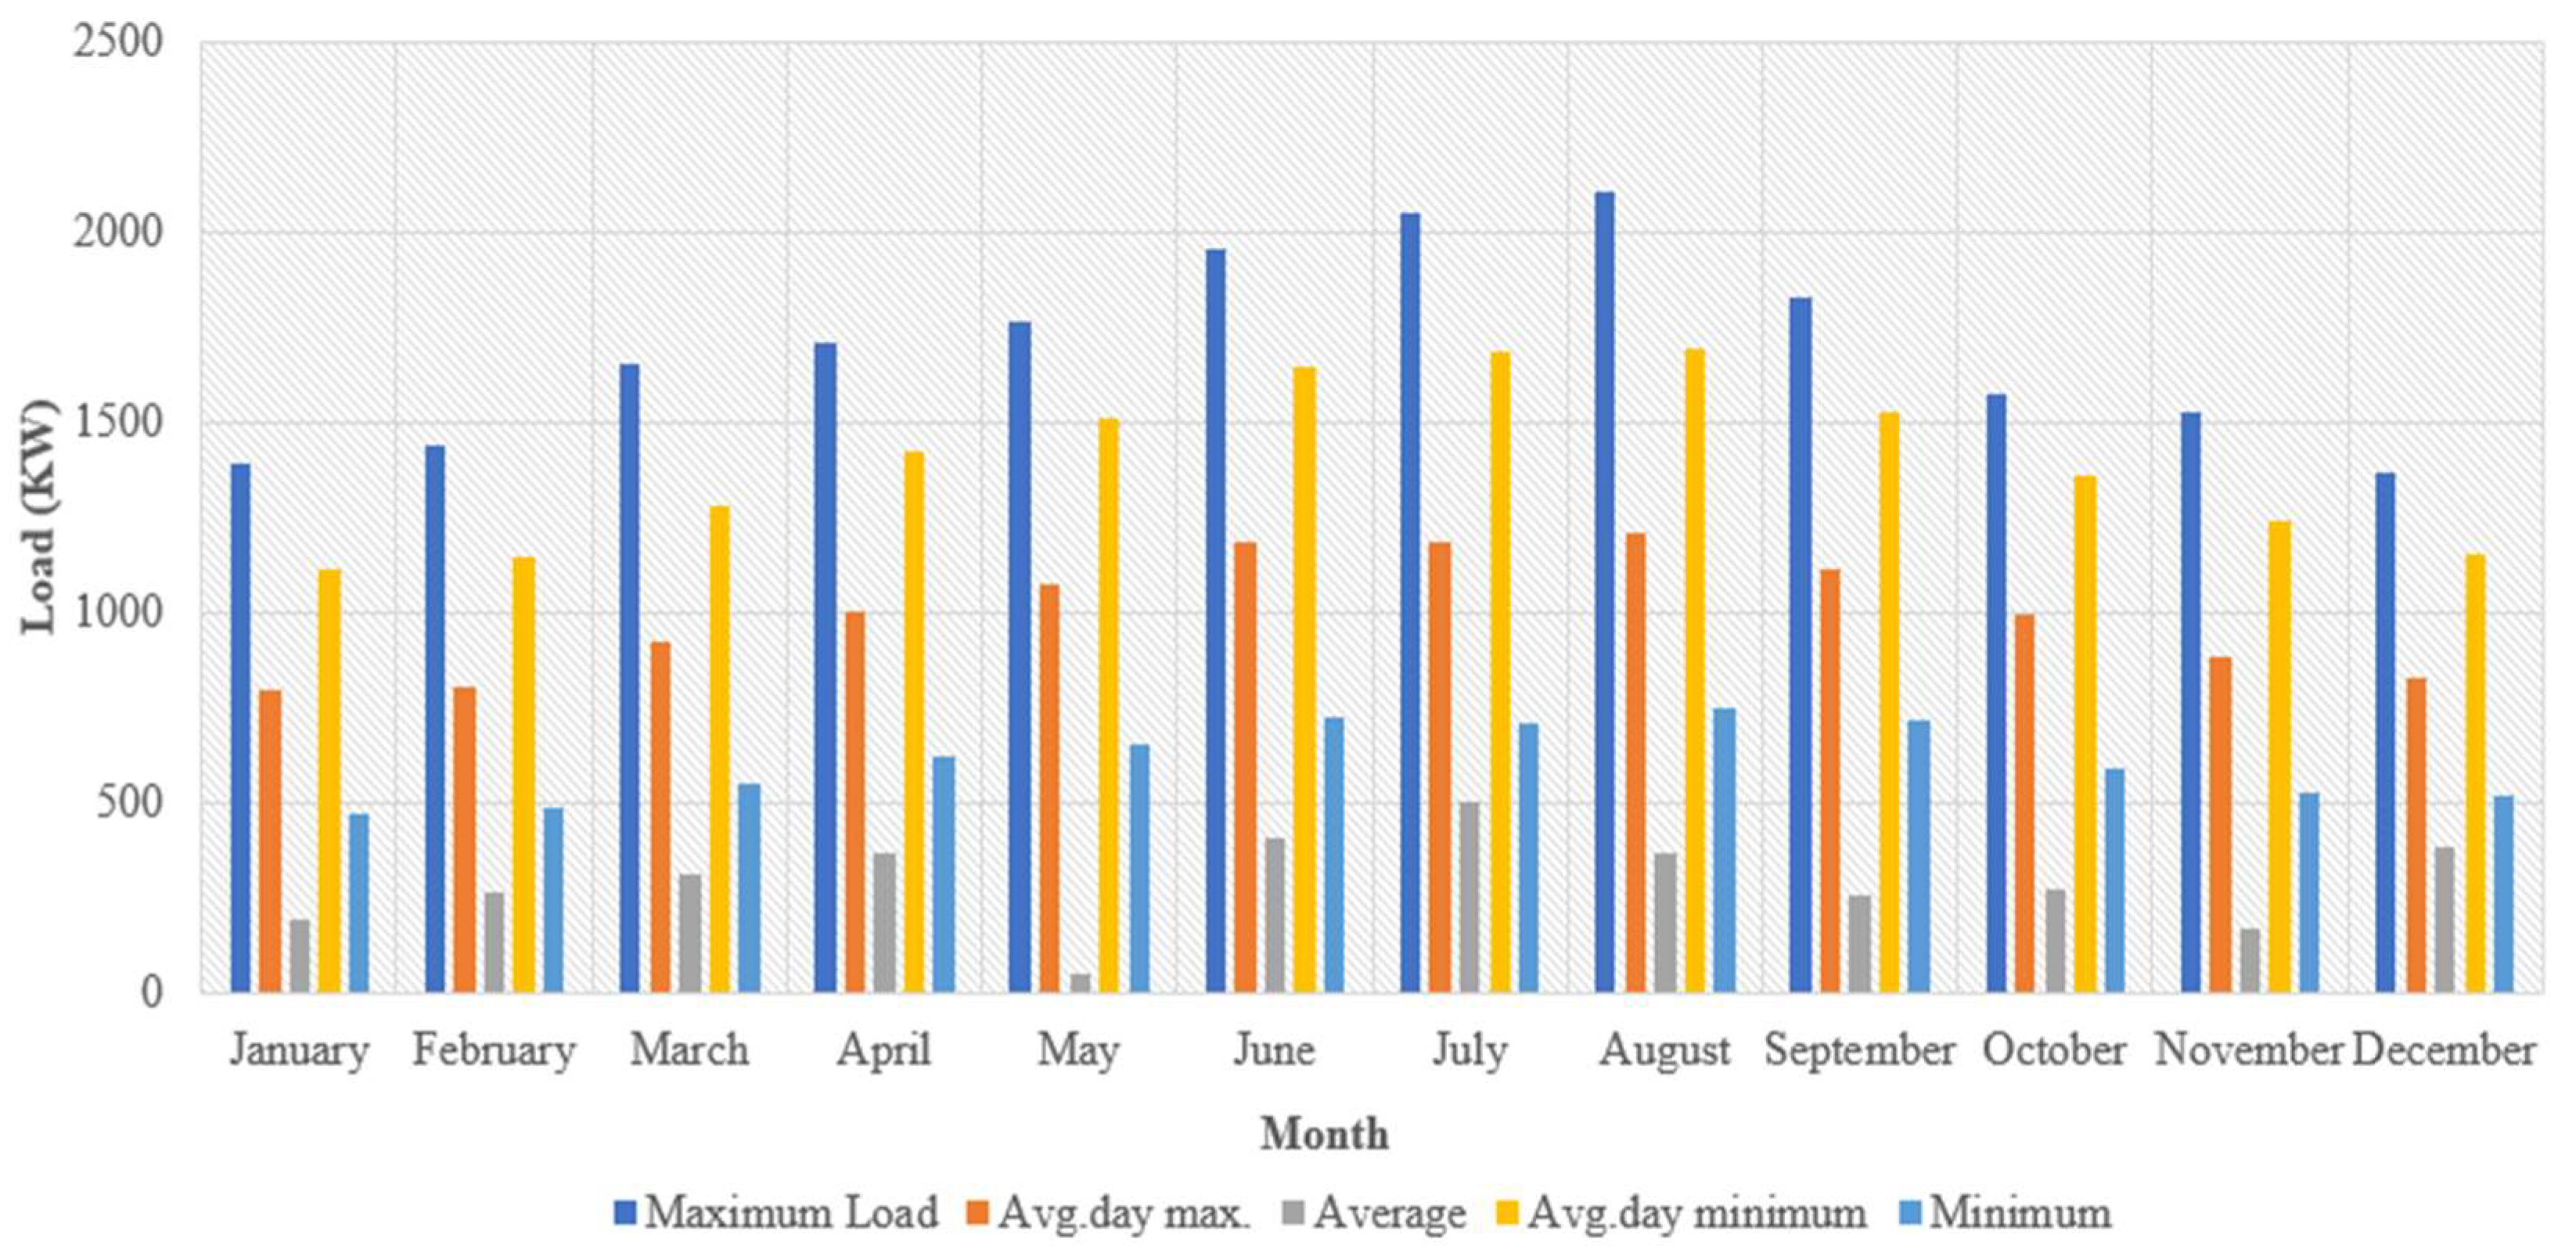
Considering the aforementioned literature, it is clear that the majority of the research has been conducted in this field with the goal of determining the ideal design and assessing and examining the possibility or the techno-economic viability for hybrid systems. These studies generally found that hybrid systems have greater levels of reliability and a lower LCOE than single-source electricity. Despite the significant priority attached to such a practical evaluation, earlier studies did not consider hybrid systems’ operational behaviors once they were developed and put into service. Furthermore, in the southern region of Bangladesh, there were no studies conducted to combine PV technology with a storage system as a substitute source of energy production. The current systems solely integrate DG and PV generators, which have higher NPC and LCOE values. When inclement weather strikes or the sun does not rise, the current system is unable to supply energy due to a shortage of storage (battery). Therefore, for the first time in this study, the PV/battery/DG hybrid system’s performance metrics at Kuakata, Bangladesh, are studied and analyzed. This study assessed the effectiveness of an off-grid, hybrid, solar PV/DG/storage system in Kuakata, Bangladesh, in terms of its capacity to satisfy the demand and other operational needs. Moreover, there are no studies conducted considering the real load demand collected from the location where the hybrid system will be installed. In this regard, an integrated demand–supply management approach has been implemented in this study. For identifying an optimal hybrid system, it is important to conduct a sensitivity analysis to check how the hybrid system performs with parameter (cost, fuel price, etc.) changes to investigate its long-term implications. Hence, a sensitivity analysis in HOMER Pro is conducted utilizing variable load demands, fuel costs, discount rates, solar irradiation, temperatures, lifetimes of PV and DG systems, efficiencies of PV systems, and inflation rates to evaluate the system’s resilience. In addition, it is also important to assess the reliability of any hybrid RE system to ensure both the utility and customer satisfaction. To the best of authors’ knowledge, to date, no studies have conducted the reliability analysis of any hybrid RE system in Bangladesh. Therefore, for the first time, the technologically affordable design and system reliability have been examined in the study for the Kuakata region. The contributions to the paper are as follows:
  • The assessment of the RE based off-grid hybrid system’s optimal capacity to meet Kuakata’s actual load demand;
  • The proper sizing of the off-grid, RE-based hybrid system’s components are determined to meet the actual demand of Kuakata;
  • A sensitivity analysis is conducted to investigate the influence of uncertainty in key factors for the best off-grid, RE-based hybrid system configuration, which is clearly a major problem for HRES design;
  • A reliability assessment of the off-grid, RE-based hybrid system is conducted to ensure the system’s long-term sustainability and to help the policymakers make policies.
The paper is structured as follows: The details of the paper’s design, including the sampling strategy, data collection, and analysis methods, are presented in Section 2. The mathematical expressions of hybrid components are given in 
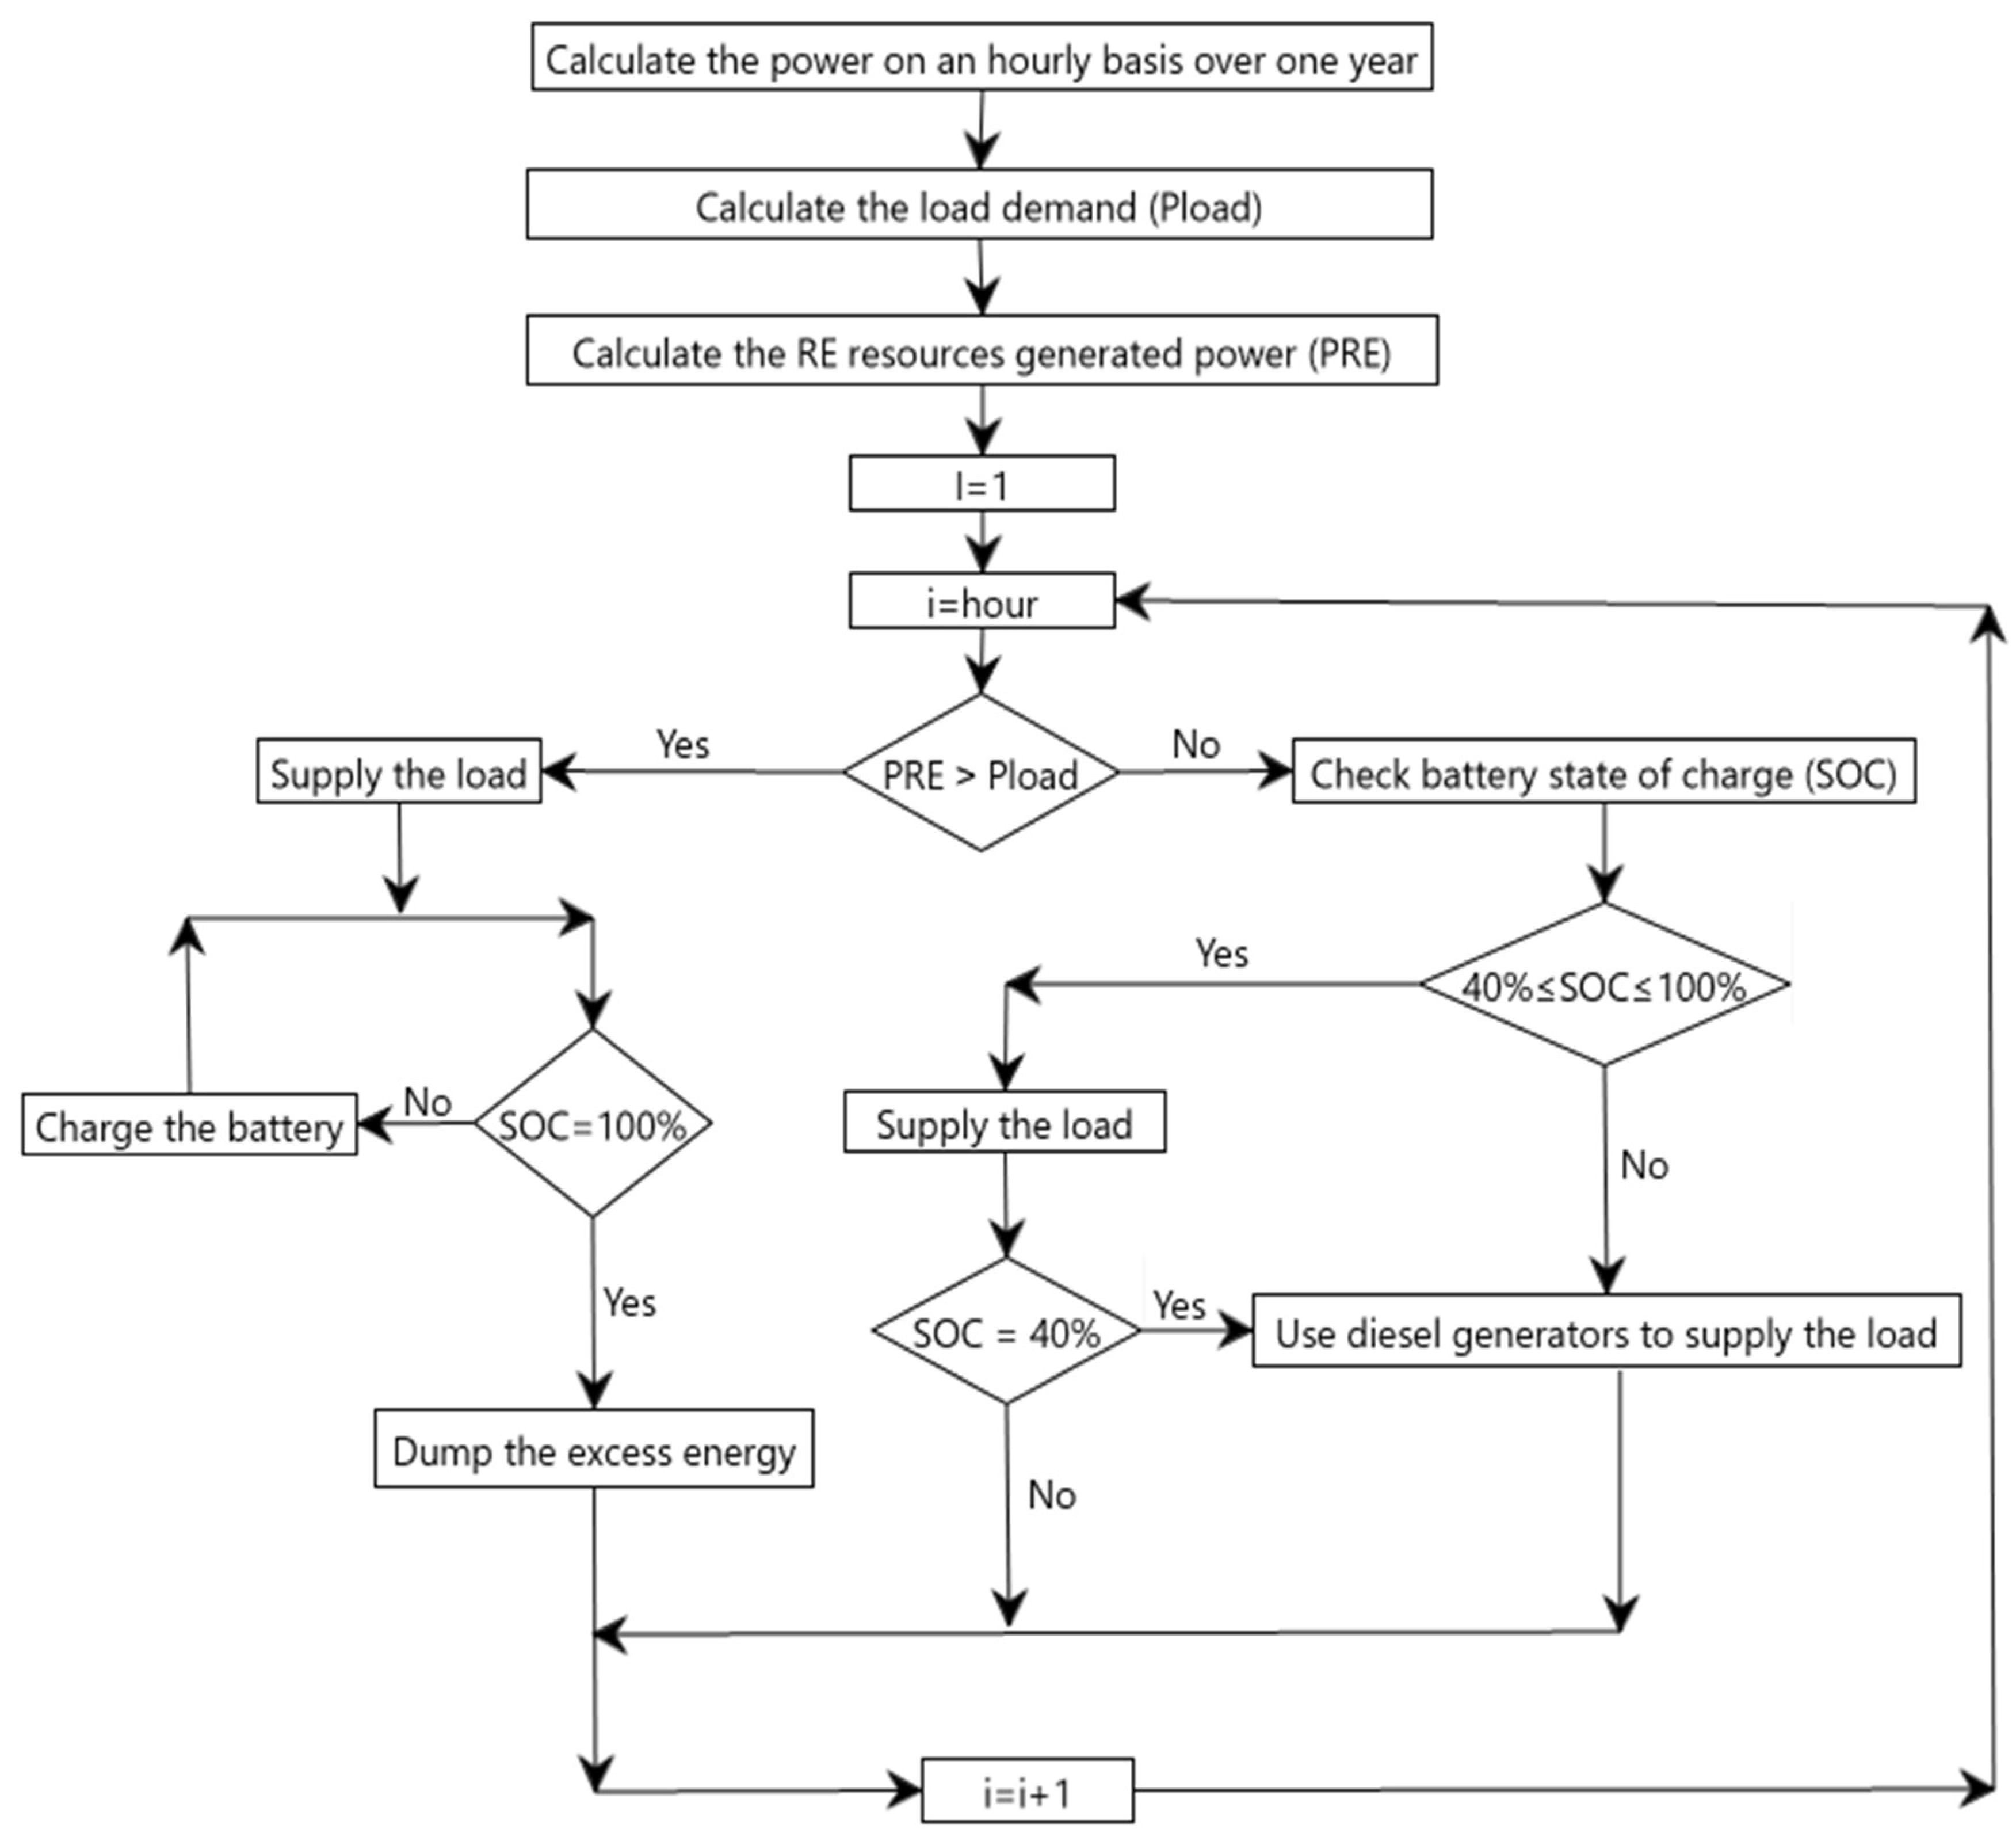
Section 3. The operational strategies are covered in Section 4, which also includes a flowchart of how the system operates. The performances of four different scenarios are briefly discussed in the Results (Section 5), along with the comparative cost, sensitivity analysis, storage system, economy analysis, etc. The impacts of technological, economic, and environmental factors are illustrated in Section 6. After that, Section 7 presents a comparison summary with earlier research, Section 8 illustrates the limitations of the study, and finally, Section 9 describes the conclusion and future research proposal of the study.

2. Methodology

To thoroughly investigate the behavior of operations in all probable scenarios in RE projects, proper criteria must be applied to the site data. In this investigation, the following analytical framework was used:
  • Site description;
  • Data sets that have been modeled and are derived and verified;
  • Solar energy;
  • Temperature;
  • Power demand;
  • Evaluation of the operations impact on the system’s performance.
These criteria were used to show and analyze the data that had been gathered from the site. In order to describe the overall system, these criteria were studied and analyzed.

2.1. Site Specifications

In southern Bangladesh, Kuakata is a town with a roughly 3000 km2 area. Typically, Kuakata consists of a seashore and deep forests that are home to a wide variety of plants and animals. Furthermore, the region is surrounded by a vast network of river valleys. This study considered stations at some particular districts of Kuakata. The location lies on the southern shore of Bangladesh’s second-largest island at a latitude of 21°39.4′ N/90°7.3′ E. Agriculture, fishing, and tourism are its three main industries.

2.2. Modeled Data Set Generation and Validation

Surveys of the location were conducted, and the necessary measurable data were gathered [35]. Data on sun radiation, the surrounding temperature, and load profiles are included. Sun irradiance and ambient temperature data must be measured in real time in order to evaluate the system’s performance. Unfortunately, poor sensors and measuring equipment resulted in limited measurement data. The next sections demonstrate how data from the National Aeronautics and Space Administration (NASA) [32] was used to solve these difficulties.

2.2.1. Solar Energy Sources

Information on solar radiation taken from the NASA website [36] is given in Figure 2. According to the literature, satellite-based information, for example, the data acquired from NASA, can be used if sufficient measured data are not available in the required location [37]. The location’s monthly solar radiation data range from 3.90 to 6.06 kWh/m2/day, with an annual average of 5.00 kWh/m2/day.

2.2.2. Temperature

This study also made use of NASA temperature data, which are shown in Figure 3. The acquired data for the location are in the (22.00–28.21) °C range, with an annual average of 25.11 °C. However, it has been demonstrated in certain publications that employing synthetic intelligence to anticipate prevailing temperatures by utilizing the relationship between temperature and sun exposure is achievable and can be used as a suitable result for further studies [38].

2.2.3. Load Requirement

The majority of rural dwellers spend the majority of their time outside their houses for employment. Loads usually increase after midday, when family members return home for meals or to do some activities. Peak demand, on the other hand, occurs at night, when everyone in the family is present at their home. Demand profiles were created utilizing data sets from the loads that were gathered during the site visits in the year 2022. It was discovered that service disruptions and continuing load increases are common. These fresh energy access locations are a result of measurement equipment communication errors. To provide an improved simulation of community demand for the projected time period, the data sets had to be modified. First, there were several data points that were inaccurate; these might be due to the SCADA system connectivity and errors in computation; inaccurate equipment calibration could also be another reason for inaccurate data points. In Figure 4, the load profile is depicted. The peak months for traffic at the location are June and August. This study’s assessment was based on previously created case studies and reports on rural electrification in several countries [39,40,41]. In this article, electricity consumers are classified into several groups. The consumption figure for each kind of load is calculated using the DESCO load calculator [42].
The primary goal is to deliver green energy to rural and semiurban communities where grid access is accessible. The presumptions, such as the amount of distinct building types, are derived from an examination of prior case studies [43]. In addition, we visited the rural electrification board headquarters [44] and several regions in Kuakata, Bangladesh to determine the load assumptions and the number of building types. As input data, these load values are sent into the HOMER program. Furthermore, hour to hour and day to day random fluctuations have been employed to better accurately estimate the load requirements. Though the true load demand may differ from the assumption, the approximate assumption is simply used for analysis reasons.
For the load estimation, 280 families (60 high class, 80 medium class and 140 low class), 50 shops, 50 battery-run auto-rickshaws, 220 streetlights (80 W/light), etc., have been considered for the Kuakata region. Detailed load consumption scenarios (estimated) are shown in Table 1, Table 2 and Table 3.

2.3. System Components

The station was built in a single phase which comprises a number of constituents like PV arrays, DGs, converters, and storage systems. All the parts of each system along with their specifications are listed in Table 4 and Table 5. The system currently employed is shown in Figure 5.

2.3.1. PV Module

When there is sunshine from 6:30 a.m. to 6:30 p.m., the PV system is used to provide electricity; if not, DGs or battery banks are used to meet the demand. Table 5 lists all of the study’s specifications, where it is estimated that the PV system will cost USD 900 per kWp to purchase. The repair and maintenance costs are 10 USD/year.

2.3.2. Diesel Generators

When PV panels are not producing any energy, DGs are typically accustomed to fulfill the peak demand. In this study, the cost of the capital and replacement were estimated to be USD 700 and 650 per kilowatt, respectively. Furthermore, the cost of maintenance was USD 0.030 per hour. All parameters are provided in Table 5. Diesel costs 130 BDT/L and is dependent on the site’s location. Due to the high costs of gasoline storage and transportation issues, fuel prices in certain rural places may be more than 1.5 times the typical price. However, at the current currency rate of USD 1 = BDT 102.49, the cost of gasoline in the area is equal to 0.8 USD/L.

2.3.3. Converter

To ensure a complete supply of PV power, converters must be compatible with the size of the PV arrays. The converter’s capital and replacement costs are USD 600 and 550 per kW, respectively, while maintenance is budgeted at USD 10 per year. The estimated operational lifetime of the converter is 15 years.

2.3.4. Energy Storage Using Batteries

Zinc-flow idealized batteries are used at the site. Each cell has 2 volts, and there are six strings, each of which has a 500 A capacity and six units. Prices for the batteries were determined based on the local market at USD 400 per kW for capital costs and replacement costs, with all characteristics listed in Table 5.
To model the RE-based, off-grid hybrid system, HOMER Pro software (version 3.11) considers the capital cost, replacement cost, operation and maintenance (O and M) cost, and lifetime. Table 6 displays the parameters associated with each component.

3. Modeling of the Hybrid RE System’s Components

This section contains a mathematical description of each of the components utilized in the simulation to create the hybrid energy system. It is made up of a solar panel, a DG, a converter, and a battery system.

3.1. Model of Solar PV System

The solar PV panel is made up of solar cells that are linked in series and parallel to provide the required electricity. The incident solar energy is transformed directly to electricity. Equation (1) is used to calculate the supplied power of PV panels while considering temperature changes [48].
P P V = Y P V , R × f P V × H T H T , S T C × 1 + α p T C T C , S T C
Here, fPV is the derating factor, αp is the temperature coefficient of power in (%/°C), HT is the solar radiation incidence in actual circumstances, and STC is the standard testing condition. YPV,R is the rated capacity or the energy output of the PV array under typical testing circumstances in kW. In contrast, the STC would be in normal testing conditions, and TC represents the PV cell temperature in real time in °C. Each panel’s temperature is determined in a time step using the following formula, Equation (2) [49]:
  T C = T A + T C , N O C T + T A , N O C T G T G T , N O C T 1 η m p , S T C   ( 1 α P   T C , S T C τ α 1 + T C , N O C T T A , N O C T G T G T , N O C T α P η m p , S T C τ α
The PV panel temperature (K) is represented as TC, the normal operating cell temperature is TC,NOCT, the panel temperature during standard testing circumstances is TC,STC, and so on. The amount of sunshine striking the PV panel in kW/m2 is denoted by GT, and the amount present on the panel at a nominal operating cell temperature (0.8 kW/m2) is denoted by GT,NOCT. TA is the ambient temperature (K), and TA,NOCT would be the ambient temperature under nominal operating conditions. The PV array’s efficiency at its maximum power point (%) is represented by ηmp,STC, whereas the efficiency under normal testing circumstances is represented by ηmp,STC and τα, or the panel’s temperature coefficient of power is considered to be 0.9 in percentage terms.

3.2. Storage (Battery) System

The integration of battery storage systems with RE generating systems helps maintain a steady voltage during power imbalances. To achieve a larger energy capacity and backups, it is recommended to link batteries with similar ratings in series and parallel. Selecting a system with a watt-hour and ampere-hour capacity is crucial for addressing potential low RE issues. The batteries under consideration have their storage capacities determined using Equation (3) [50].
C S T O R A G E = E L × A D × η C O N V × η B A T × D O D
Here, CSTORAGE represents the capacity of storage, AD is daily autonomy, DOD is the battery’s depth of discharge, and ηCONV and ηBAT are the converter and storage efficiencies, respectively. EL is the total energy required by the load (kWh/day).

3.3. Fuel Consumption of Diesel Generators

The DG’s fuel consumption is contingent upon both the engine’s rated power and its actual output power. The most accurate method to determine the fuel consumption for any load produced by the DG is to use the fuel consumption curve that the manufacturer provides. Equation (4) illustrates how the diesel fuel consumption is mostly determined by the power output of the DG [49].
F D G , C = C D G × P D G , R × P D G , G × E D G
Here, PDG,R and PDG,G represent the rated power and supplied power of the DG (kW), FDG,C is the fuel consumption rate (L/h), and CDG (0.0140 L/kW/h) and EGD (0.2440 L/kWh/h) represent the coefficients of the diesel fuel expenditure curve.

3.4. Economic and Emission Assessment

This study considers the environmental impact and economic viability to determine the best hybrid off-grid option. An economic analysis is also conducted using HOMER software to ascertain the optimal result. The NPC of a project is the sum of all operational, replacement, maintenance, and energy expenses, including fuel prices. The NPC may be found using Equation (5).
N P C = n = 1 N C n 1 + r n
Here, N and C represent the total number of time periods and the time period, and Cn and r represent the net cash flow at time period and the internal rate of return, respectively. The entire annualized cost is calculated using Equation (6). The LCOE value, which is a critical component of a hybrid microgrid, can be calculated using Equation (7) [51].
T o t a l   a n n u a l i z e d   c o s t = c a p i t a l   c o s t + r e p l a c e m e n t   c o s t + o p e r a t i o n   a n d   m a i n t e n a n c e   c o s t s + f u e l   c o s t s + s a l v a g e   c o s t s
L C O E = s u m   o f   c o s t s   o v e r   l i f e t i m e s u m   o f   e l e c t r i c a l   e n e r g y   p r o d u c e d   o v e r   l i f e t i m e = t = 1 n I t + M t + F t 1 + r t t = 1 n E t 1 + r t
Here, It, Mt, and Ft represent the year’s investment expenditures and operations, maintenance, and fuel expenses, and Et, r, and n represent the year’s electrical energy output, discount rate, and estimated lifetime of the system or power station. To determine the emissions produced by the hybrid system, a life cycle emissions (LCE) study is used. The life cycle emissions are calculated in Equation (8):
L C E = i = 1 x B i × E l
where x is the number of components used in the system, El is the energy generated that is stored in every unit or component, and Bi (kg CO2-eq/kWh) is the lifetime of the CO2 emissions.

3.5. Carbon Emission Tax (CET)

The CET can be defined as the amount that is penalized for producing CO2 from the system. In the present system, the DGs produce greenhouse gasses during its operation. Hence, it is penalized for producing CO2, which is given by Equation (9) [52]:
C E T = Ebg   ×   CEF   ×   cos t   per   ton   of   CO 2     emission   ×   n 1000 × C R F
where CEF is the carbon emission factor (in kg of CO2), which is given by Equation (10):
CEF = ( % CH 4   ×   ρ C H 4   ×   2.75 + ρ C O 2   ( 1 % C H 4 ) )
where 2.75 is the amount of CO2 generated when one kilogram of methane is completely burned, ρ C H 4   is the density of methane (0.65 kg/m3), ρCO2 is the density of carbon dioxide (1.80 kg/m3), and %CH4 is the proportion of methane content by volume in the DGs (60%). It is estimated that the carbon tax will be USD 0.015/kg of CO2.

3.6. Analysis of System Reliability

The present investigation employs a multi-objective optimization methodology with the aim of reducing the chance of power supply loss (LPSP). The probability function known as the LPSP is represented by a value between 0 and 1. An LPSP of 1 denotes a complete loss of the power supply, which means that the system is unable to handle the load. An LPSP of zero, on the other hand, denotes a 0% loss of power supply and suggests that the system always satisfies the load. The ratio of the entire unmet load to the total electric load demand is the LPSP. It may be explained by Equation (11) [52,53].
L P S P = h = 1 8760 E u n f i l f i l l e d h E r e q u i s i t e  
Here, h is the number of hours in a year, Eunfulfilled is the unfulfilled load demand expressed in hours, and Erequisite is the total electrical demand for a whole year. The system must meet the following requirements in order to be deemed reliable as shown by Equation (12):
LPSPLPSPrequired
where LPSPrequired, the intended value of LPSP, is user defined. In the present investigation, it is set at 0.01 (1%) (or 3.65 days in a year) in accordance with the findings of [53].

4. Operating Methods

The evaluation of an optimized system is carried out on the basis of technological, economic, and environmental variables, along with all conceivable scenarios that could comprise various combinations. To determine if the PV systems’ dimensions were ideally determined prior to installations in the locations, a comparison analysis using the best design was carried out as part of the study. Additionally, a fictitious situation with 100% RE generation was investigated. Freestanding DGs and current hybrid PV/DG/storage systems were compared to the results of PV injection into the mini-grid in order to assess the effects of PV systems in the understudied communities. An overview of the findings and the benefits and drawbacks of such systems is presented here. This research is expected to be quite helpful in making decisions in any situation with comparable circumstances. All technical tasks for this investigation were completed using HOMER software.
The hybrid RE systems use two basic operational methods: cycle charging (CC) and load following (LF) dispatch systems. In the LF method, DGs are set up to only serve loads in the case that the output of PV power is unavailable. The PV arrays provide loads and charge batteries in the event that there is an excess of electricity. On the other hand, with the CC method, DGs are used to generate power to load and charge the batteries. The LF method is considered in this study, since it appears to be the best option for reducing extra energy and the overall NPC. The flowchart in Figure 6, on the other hand, demonstrates the system’s operating behavior in a number of scenarios for delivering loads utilizing PV system, storages, and DGs along with batteries charging the cycles. Figure 6 illustrates the necessity for a comprehensive energy management system that may function in various modes depending on the atmospheric conditions in the area. The command-and-control system prioritizes the PV arrays to serve the loads when everything is working normally and there is sun available. Meanwhile, the system will utilize any extra energy to charge the battery till it is completely full (100% SOC), at which point the extra energy can be utilized by dumping loads. In the event that the PV system is unable to provide enough energy, the batteries power up until they reache a minimum charge percentage (40% SOC), at which point conventional DGs will take over. Every hour, the command-and-control system decides whether to use any of the available energy sources and whether to charge or drain the battery according to the results of the energy balance calculation. According to HOMER, the operating reserve is the consistent amount of power that would be available in the event that either the RE supply or the load demand unexpectedly changed. The operating reserve levels in this study were established at 10 percent of the hourly demands and 25 percent of the solar output. The RE component denotes the percentage of energy given to the load that is generated by RE sources.
The renewable percentage is determined by HOMER as shown in Equation (13):
R E = 1 E n o n r e n + H n o n r e n E s e r v e d + H s e r v e d × 100 %
where the whole serviced thermal loads and electrical loads (kWh/yr) are denoted by E s e r v e d and H s e r v e d , and E n o n r e n and H n o n r e n are nonrenewable energy sources’ electrical and thermal energies, respectively (in kWh/yr). RE generation, on the opposite hand, is the annual electrical energy generated by the system’s RE sources.

5. Results

This section provides and addresses the technological, economic, environmental aspects and findings for several system settings. These include freestanding DGs, existing hybrid PV/DG system, optimizing PV/DG/storage systems, and a fictitious, solitary RE scenario (100% PV/storage) system. The software known as HOMER Pro, or hybrid optimization model for electric renewables, was used for the simulation. The reliabilities of the various systems according to the LPSP are also presented in this section. This section also includes a conclusion to the sensitivity analysis conducted to investigate the long-term implications of fuel price fluctuations, solar irradiation and temperature variations, inflation rates, and increasing demands and discount rates. The initial step in this procedure is to create a reference case, following which it is necessary to determine the operational behaviors of real and hypothetical systems in light of monetary, technological, and environmental constraints.

5.1. Configuration 1: Freestanding Diesel Generators (Baseline Model)

Table 7 displays the primary operational aspects of this situation. For the system to produce 77.30% of all energy production, two generators (each 320 kW) are necessary. The second generator serves as a backup and operates normally during periods of a low load. According to Table 8, this system’s LCOE is 0.675 USD/kWh and NPC is USD 9.56 M, which is the lowest cost based on comparable operating conditions considering all other scenarios. Over the course of the project’s 25-year lifespan, the system capital, replacement, fuel, operation and maintenance, and salvage expenses total USD 193,200, USD 135,790.70, USD 9,245,680.80, USD 8724.52, and USD 21,513.36, respectively, which are shown in Table 9 The sources of RE represent 0% of the total energy production, although a tiny amount of extra energy was found.

5.2. Configuration 2: Existing Hybrid PV/Diesel Generator System without Storage

Table 7 displays the key qualities of the systems. In this instance, the larger generator (320 kW) contributed 27.1% of the overall energy output, while the smaller generator (200 kW) provided 26.40%. PV arrays created 46.50% of the total energy production. As seen from Table 8, the LCOE of this system is lower than a standalone DG system at USD 0.50 per kWh, and the NPC is USD 7.13 million. Over the course of the project, the systems will cost a total of USD 1,869,423.31, USD 167,149.94, USD 5,063,322.71, USD 5977.72, and USD 38,318.13 in capital, replacement, fuel, operation and maintenance, and salvage, respectively, as per the results shown in Table 9.

5.3. Configuration 3: Optimized Hybrid PV/Diesel/Storage

Table 7 displays the system’s outcome that has been optimized for this site. The best choices for PV arrays, generators (diesel), and energy storage banks are determined in lower-scoring values, where the LCOE is 0.367 USD/kWh and the NPC is USD 5.19 M, which are shown in Table 8. These are less costly than the present system by 0.133 USD/kWh and USD 1.49 M, respectively. As per Table 9, the capital, replacement, fuel, operation and maintenance, and salvage expenditures for the systems, with a 61.79% renewable portion, are, however, USD 1,771,571.97, USD 143,796.23, USD 3,302,834.65, USD 3967.32, and USD 31,510.20 throughout the course of the project. It is obvious that the ideal system has significantly lower overall costs and is more reliable than the current hybrid system, which was made possible by smaller batteries, solar panels, and DGs.

5.4. Configuration 4: 100% PV and Storage System (Speculative Model)

This scenario was created to investigate the benefits and drawbacks of considering a 100% RE system with varying RE percentages. The existing rated capacity of the PV arrays at Kuakata is 350 kW. The optimum 100% renewable fraction system, according to HOMER Pro, requires an increase in the rated 400 kW PV arrays and five strings accompanying the batteries and a delivery of 3209 kWh, which is shown in Table 7. The LCOE of the system is USD 0.575 kWh and the NPC is USD 8.14 M, which is higher than the present hybrid PV/DG system and the optimized hybrid PV/DG/battery system, as shown in Table 8. Over the project term, the capital, replacement, operation and maintenance, fuel, and salvage expenses for the systems are USD 7,010,370.68, USD 1,579,344.67, USD 1147.96, USD 0.00, and USD 428,718.11, respectively, which are depicted in Table 9.
In hybrid RE systems, the role of the batteries needs to be highlighted, because they are typically charged during the day and discharged at the start of the night due to significant increases in the loads. Without the storage system, there would be a significant amount of extra energy required. Hence, storage systems are crucial to ensure system stability. When PV is not available, in a 100% PV/battery system, all power generation is reliant on the battery banks. According to Figure 7, the state of charge performance shows a larger selection of charging cycles.

5.5. Technical Evaluation of Each System

This section presents the technical performance of every configuration that was simulated for this study, with the annual average global solar radiation being 5.00 kWh/m2/day and the annual average temperature of the PV system being 25.11 °C. Based on the modeling findings, configuration 3 (ideal system) would generate 1,095,000 kWh of power annually, compared to configuration 2 (existing system) that produces 855,925 kWh, which is approximately 22% less. With a yearly total of 949,000 kWh, the standalone DG plant in configuration 1 produced 86.5% of the electricity compared to configuration 3 over the course of the year. Configuration 4 (100% PV/battery) produced 76,285 kWh of excess power annually as opposed to 1,171,285 kWh/yr, which is 6.5% more electricity than the optimal system. Following a technical review of all the systems, it is evident that configuration 3 (optimized system) generates more power, and as well, can fulfill annual load demands better than the other systems. Therefore, it is recommended that while deciding on the best demand management strategy for the project in question, policymakers should carefully analyze the technical parameters.

5.6. Economic Analysis

The NPC, operating cost, and LCOE for each scenario are listed in Table 8. From Table 8, it can be observed that the stand-alone DG, existing hybrid, and 100% RE systems all have higher a NPC and LCOE than the optimized hybrid PV/DG/battery system, standing at USD 5.19 M and 0.367 USD/KWh, respectively. The existing system has an operating cost of USD 3967.32 and an LCOE of 0.575 USD/kWh, failing to meet Bangladesh’s current energy price structure of 0.389 USD/kWh [54]. Due to high capital expenditures accounting for USD 7,010,370.68, the 100% PV/battery system has the highest NPC (USD 8.14 M). This system is entirely fuel free (100% RE). However, despite using DGs less frequently than freestanding DG systems, optimized and existing hybrid systems still exhibit a higher LCOE than freestanding DG systems. The hybrid system is more frequently used in the system when loads and fuel prices grow, which offers a strong indication that the system is available for use in future projects. According to the analysis of sensitivity regarding the present technology in Section 5.8, it is anticipated that PV array and battery prices will decline further, supporting the concept of deploying entirely RE projects.

5.7. Reliability Analysis

Based on the values of the LPSP, the reliabilities of the four system configurations mentioned above are presented in Table 8. From the obtained values, it can be said that the systems are all reliable and satisfy the requirement of Equation (12). However, it has been observed that the systems (configurations 3 and 4) consisting of a storage system (battery) have a better reliability compared to the systems without a storage system (configurations 1 and 2). The reason is that the higher electricity production is dependent on the higher discharges of the batteries, which is aligned with the statement stated in [52]. Here, the batteries in configuration 4 (PV/battery) discharged 96,711 kWh electricity per year, which is higher than compared to the electricity discharge (68,165 kWh/yr) by configuration 3 (PV/DG/battery). As a result, configuration 4 (PV/battery) has a better reliability than configuration 3 (PV/DG/battery). On the other hand, the remaining two systems (configurations 1 and 2) are less reliable, as these two systems do not have any storage systems.

5.8. Sensitivity Analysis

RE sources, like solar energy or PV panels, are sporadic in nature. Variations in temperature and sun irradiation are therefore regarded as sensitive factors that unquestionably aid in the selection of the ideal system configuration. The temperature was adjusted between 20 °C and 30 °C for the sensitivity study, while the solar irradiance ranged from 3 to 5.5 kWh/m2/day. The modification of the system design with an unknown value of RE resources is depicted in Figure 8, which illustrates how three distinct types of optimal system configurations are established in relation to variations in RE resources. The system operates at its best when the temperature is at 22.52 °C and the sun irradiance is 5 kWh/m2/day.
Further increasing the value of the inflation rate from 2% to 10%, as shown in Figure 9, also has a significant effect on the bankability of the project. It has a decreasing effect on the LCOE. The NPC, however, increases with the increasing inflation, obviously due to the increased costs of operation. According to inflation predictions, average consumer price inflations in 2023 and 2024 should be 4.1% and 4.0%, respectively, compared to 9.59% in 2022 and 2.44% in 2021 [49].
This analysis was also integrated to see whether the nominal discount rate, price of the fuel. and load demand are considered some of the most important uncertain variables. The system’s fuel usage is correlated with the DG’s operating hours. The price of the fuel rise in this study varies from 1.30 USD/L to 3.30 USD/L, and the nominal discount rate ranges from 8% to 12%. A greater discount rate lowers the project’s NPC. In contrast, the LCOE rises as the discount rate rises. The power usage increased by between 3000 kWh/d and 19,660 kWh/d, while the expense of the PV system and storage was set at a percentage of the total initial cost, ranging from the current price to 60%. Therefore, it is urged that policymakers give careful consideration to this criterion when deciding what kind of financing structure to use for the proposed project. Figure 10 illustrates how the operational behavior is impacted by rising fuel prices and load demands. This increase makes the hybrid system more dependent. The reliance on stand-alone DGs is also decreasing due to declining PV array and battery prices. When the nominal discount rate is 10%, the PV lifespan is 25 years, the price of diesel fuel is 1.8 USD/L, and the average load is 4800 KWh/d, the system performs optimally.
Assessments have also been conducted on the impacts of PV system, efficiency and the lifetime of DGs and PVs. PV arrays have a lifespan of around 20 to 30 years, with an efficiency range of roughly 13% to 17%. As the project progressed, the DG system needed to be changed due to its high cost and limited lifespan. DG lifespans range from 40,000 to 60,000 h. Figure 11 and Figure 12 show the simultaneous variations in the three sensitivity variables mentioned above. When the PV system efficiency is 15.01% during a 24.98-year lifespan, the system performs best. Moreover, the system is optimum when the first generator lasts for 49,855.61 h, while the second and third generators last for 49,938.80 and 60,000 h, respectively.

5.9. Estimating the Decrease in Fuel Use and Hours of Generator Operation

The data analysis gives a precise picture of the fuel usage and associated expenditures. The amount of fuel saved utilizing the hybrid system was less, while using a PV/storage system exclusively resulted in 100% fuel savings. The integrated scenario seems to be more prevalent in the system, as illustrated in Figure 8, Figure 9, Figure 10, Figure 11 and Figure 12, where according to the sensitivity analysis, the fuel prices and power growth increase and the component values decreases. As a result, a complete PV/storage system was found to be more useful in the events of rising fuel prices and power demands and falling PV array and battery costs.
Additionally, the simulation has demonstrated that cutting back on the generators’ operational hours could minimize the reliance on medium-sized generators, reduce wear and tear, and boost the overall efficiency. Lowering the generator’s load is typically seen to be advantageous for decreasing its fuel usage and wear and tear. However, this is only possible up to the manufacturer-specified limit, and beyond this limit, the system will not operate efficiently. The majority of generator manufacturers suggested using their equipment at at least 30 to 40% of the rated power. Similar to this, as seen in Figure 13, the generator’s running time was significantly decreased. In conclusion, it should be noted that the generators are not only operating at reduced loads, but also working less often.

5.10. Environmental Effect Analysis Based on the Emissions of Pollutants

The deployment of a PV system would significantly reduce the harmful carbon emissions produced by standalone power systems. According to the results which have been shown in Table 10, this decrease does not fully stop the use of DGs. Utilizing PV system and storages allowed the system to further reduce its carbon emissions by 46%. This illustrates how the addition of solar energy and batteries to mini-grids with standalone diesel generation units reduced the fuel consumption and hazardous emissions. A freestanding DG system is considered to be the worst because it creates the most damaging pollutants. However, a 100% PV/storage system has no emissions and is deemed to be the best system in terms of the environment. This analysis did not take penalties for CO2 emissions into account.

6. Discussion on the Operational Analysis

The key findings are addressed and described in this section. The data are combined to demonstrate the relationships between various system elements as well as the impact of changing the primary system parameter on the system performance. An analysis of each scenario’s comparative costs and environmental impact was also a major focus of this study.
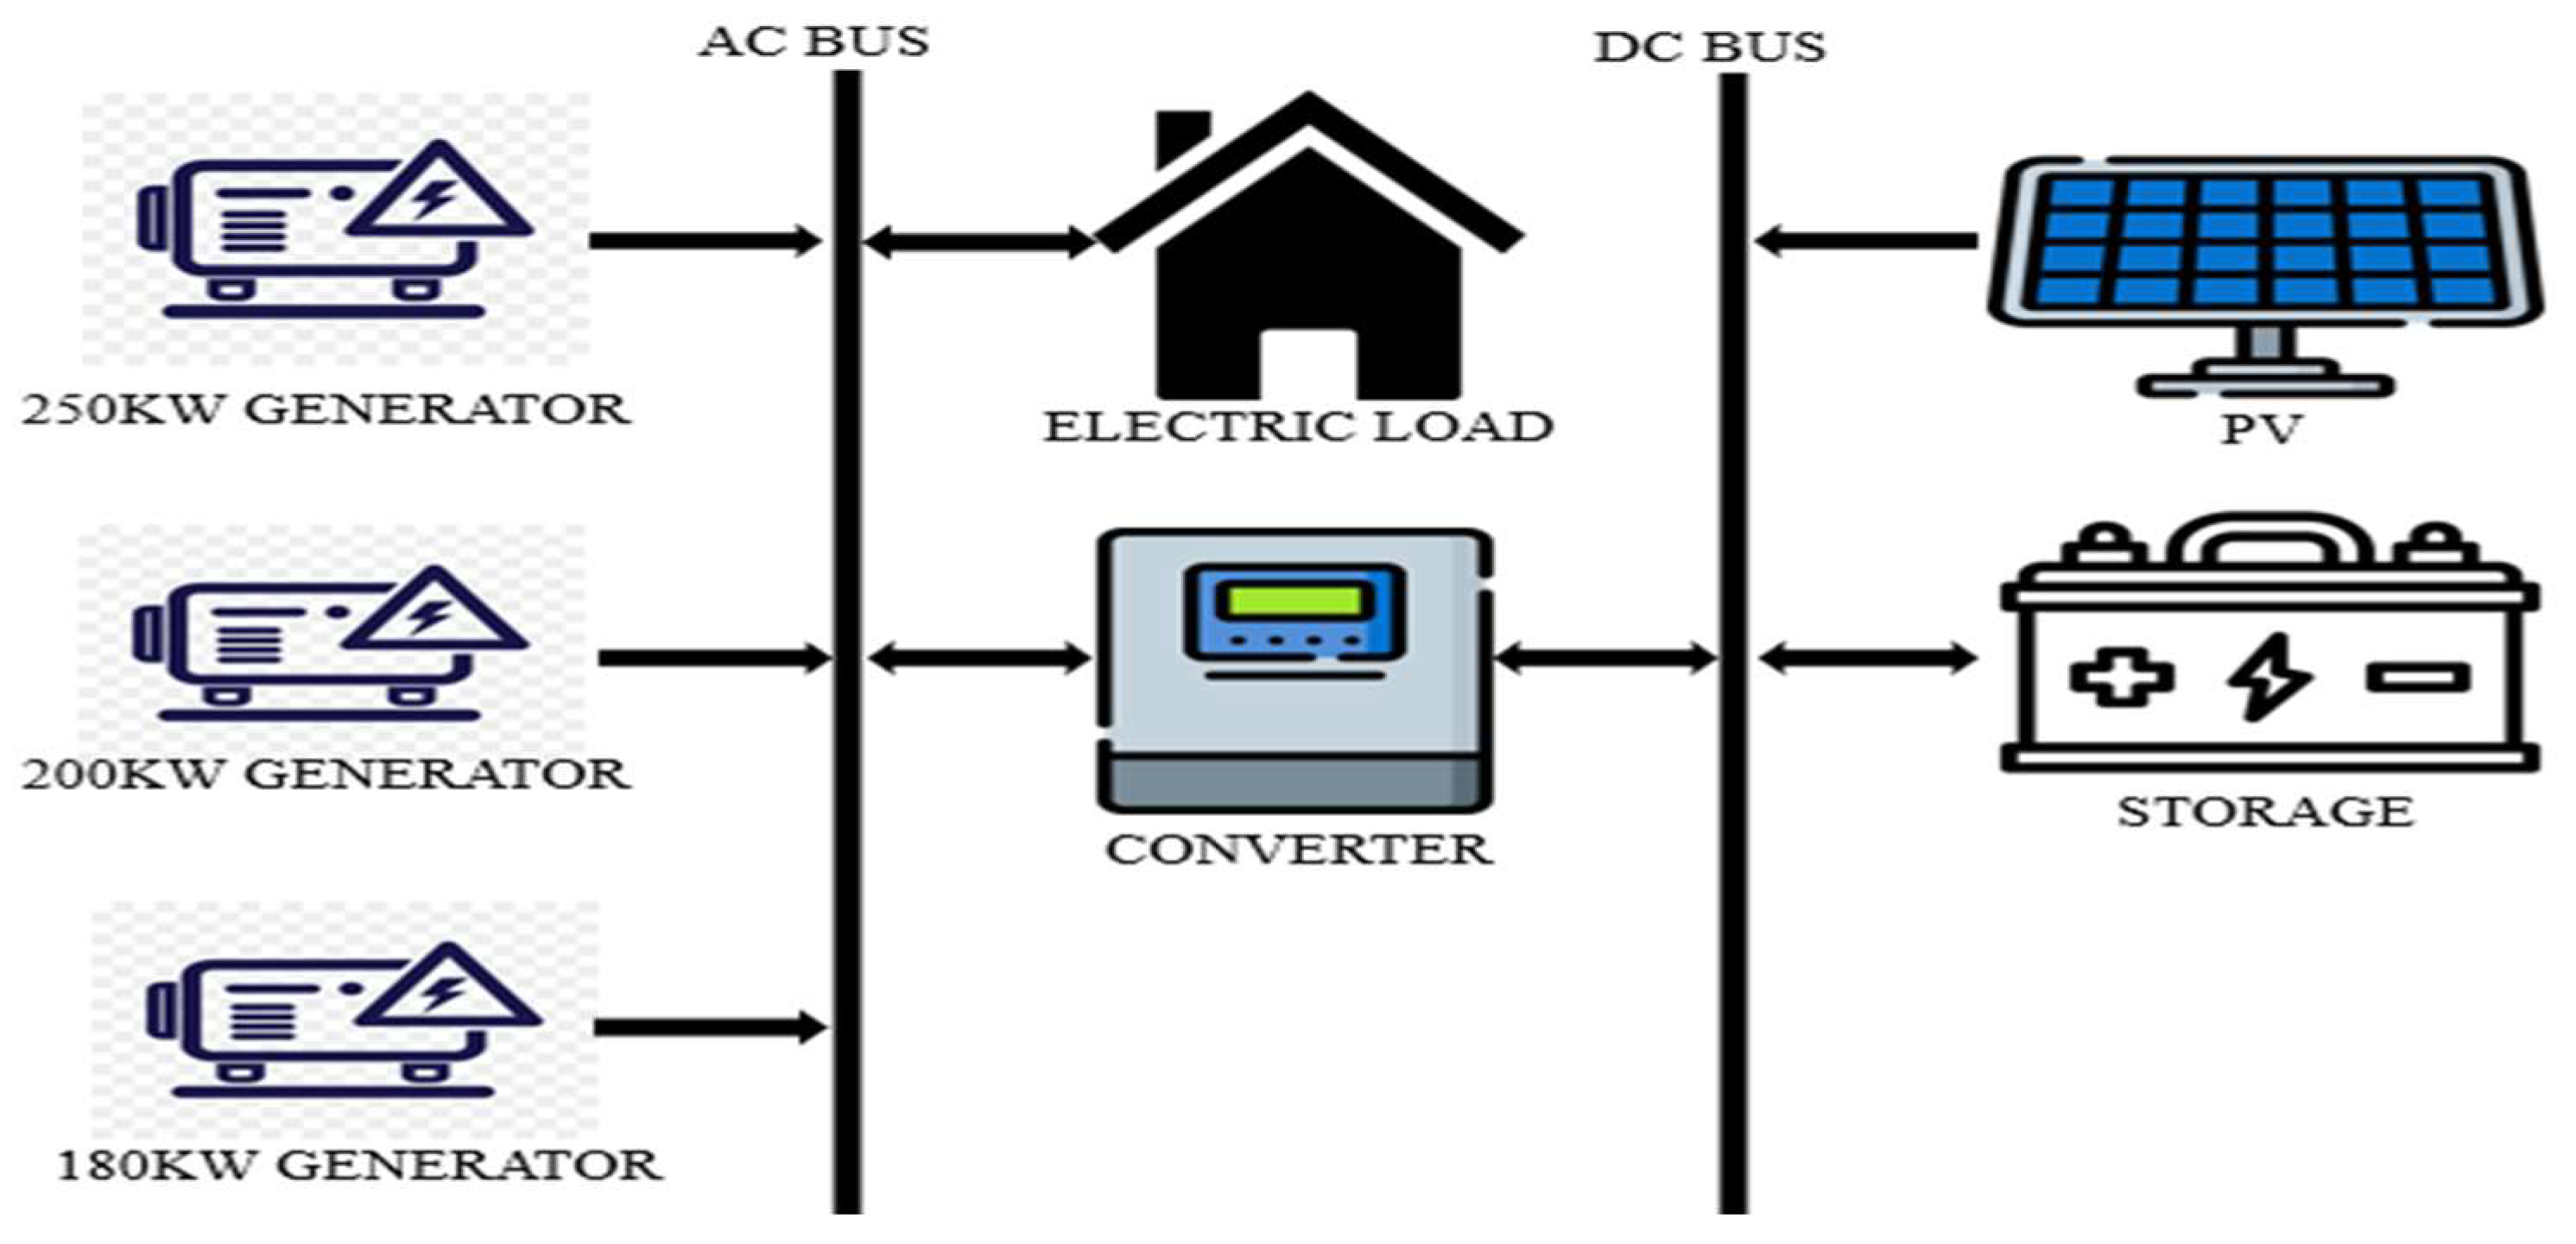
Four various possibilities were examined. These include existing hybrid PV/DG systems, freestanding DGs, 100% PV/battery systems, and best-case scenarios (PV/DG/battery system). Each example illustrates and exemplifies the impacts of PV power injection on the NPC, power penetration, LCOE, surplus energy, fuel usage, operating hours, and other features.

6.1. Techno-Economic Effects

In contrast to the 100% PV/storage system, which has the maximum cost, the findings collected revealed that the optimized hybrid PV/DG/storage system provides the project’s finest economic characteristics. On the basis of the whole cost of the system, the hybrid PV/DG/storage system has good technical and extremely good economic qualities. 
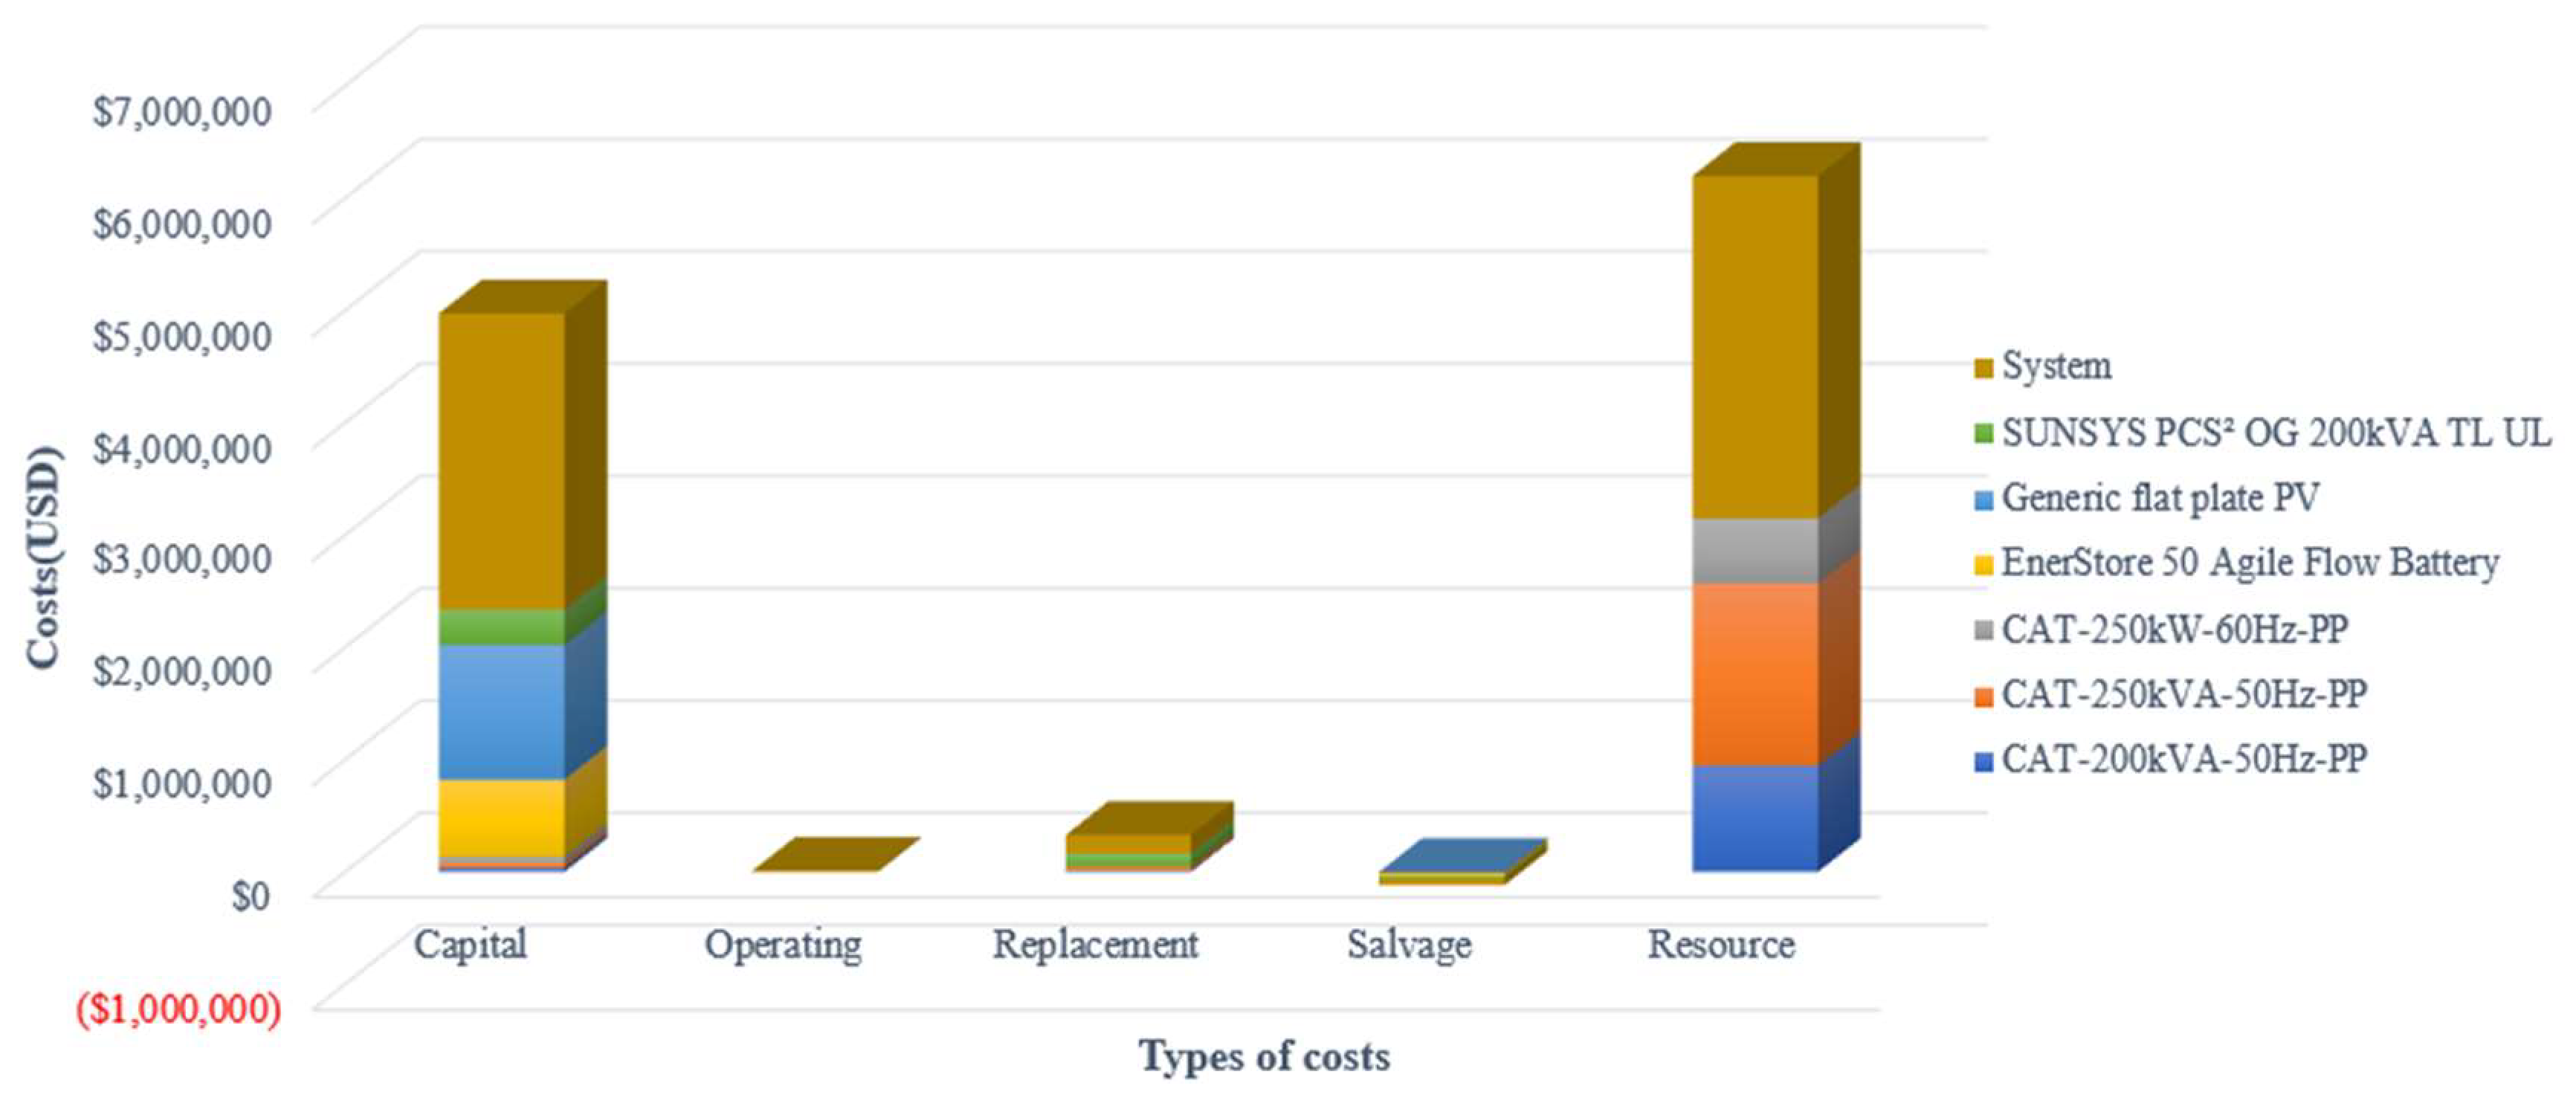
Figure 14 shows the optimized cost summary. The solo DG system is more expensive in terms of the capital, replacement, fuel, operation and maintenance, and salvage expenses than the integrated PV/DG/storage system. A hybrid PV/DG system is less expensive than a 100% PV/battery system. The findings from both sites show that employing a 100% PV/storage would be expensive due to significant startup costs and storage replacement costs. However, it would be a workable approach if the costs of these components were reduced.
The currently installed PV systems were not chosen for their identical demand profiles, solar irradiation data, and temperature data prior to installation, as shown by contrasting them with the optimal possibilities. The creators of these initiatives desire to rely more on solar energy and storage than on DGs for the existing systems because of how remote both of these locations are. The ideal systems, where the share of RE in the total production is 46.5%, exhibit lower PV penetration levels. In addition, there are now just two strings of batteries at each site. This contrasts with the present hybrid systems’ RE sharing rate of 61.79%.
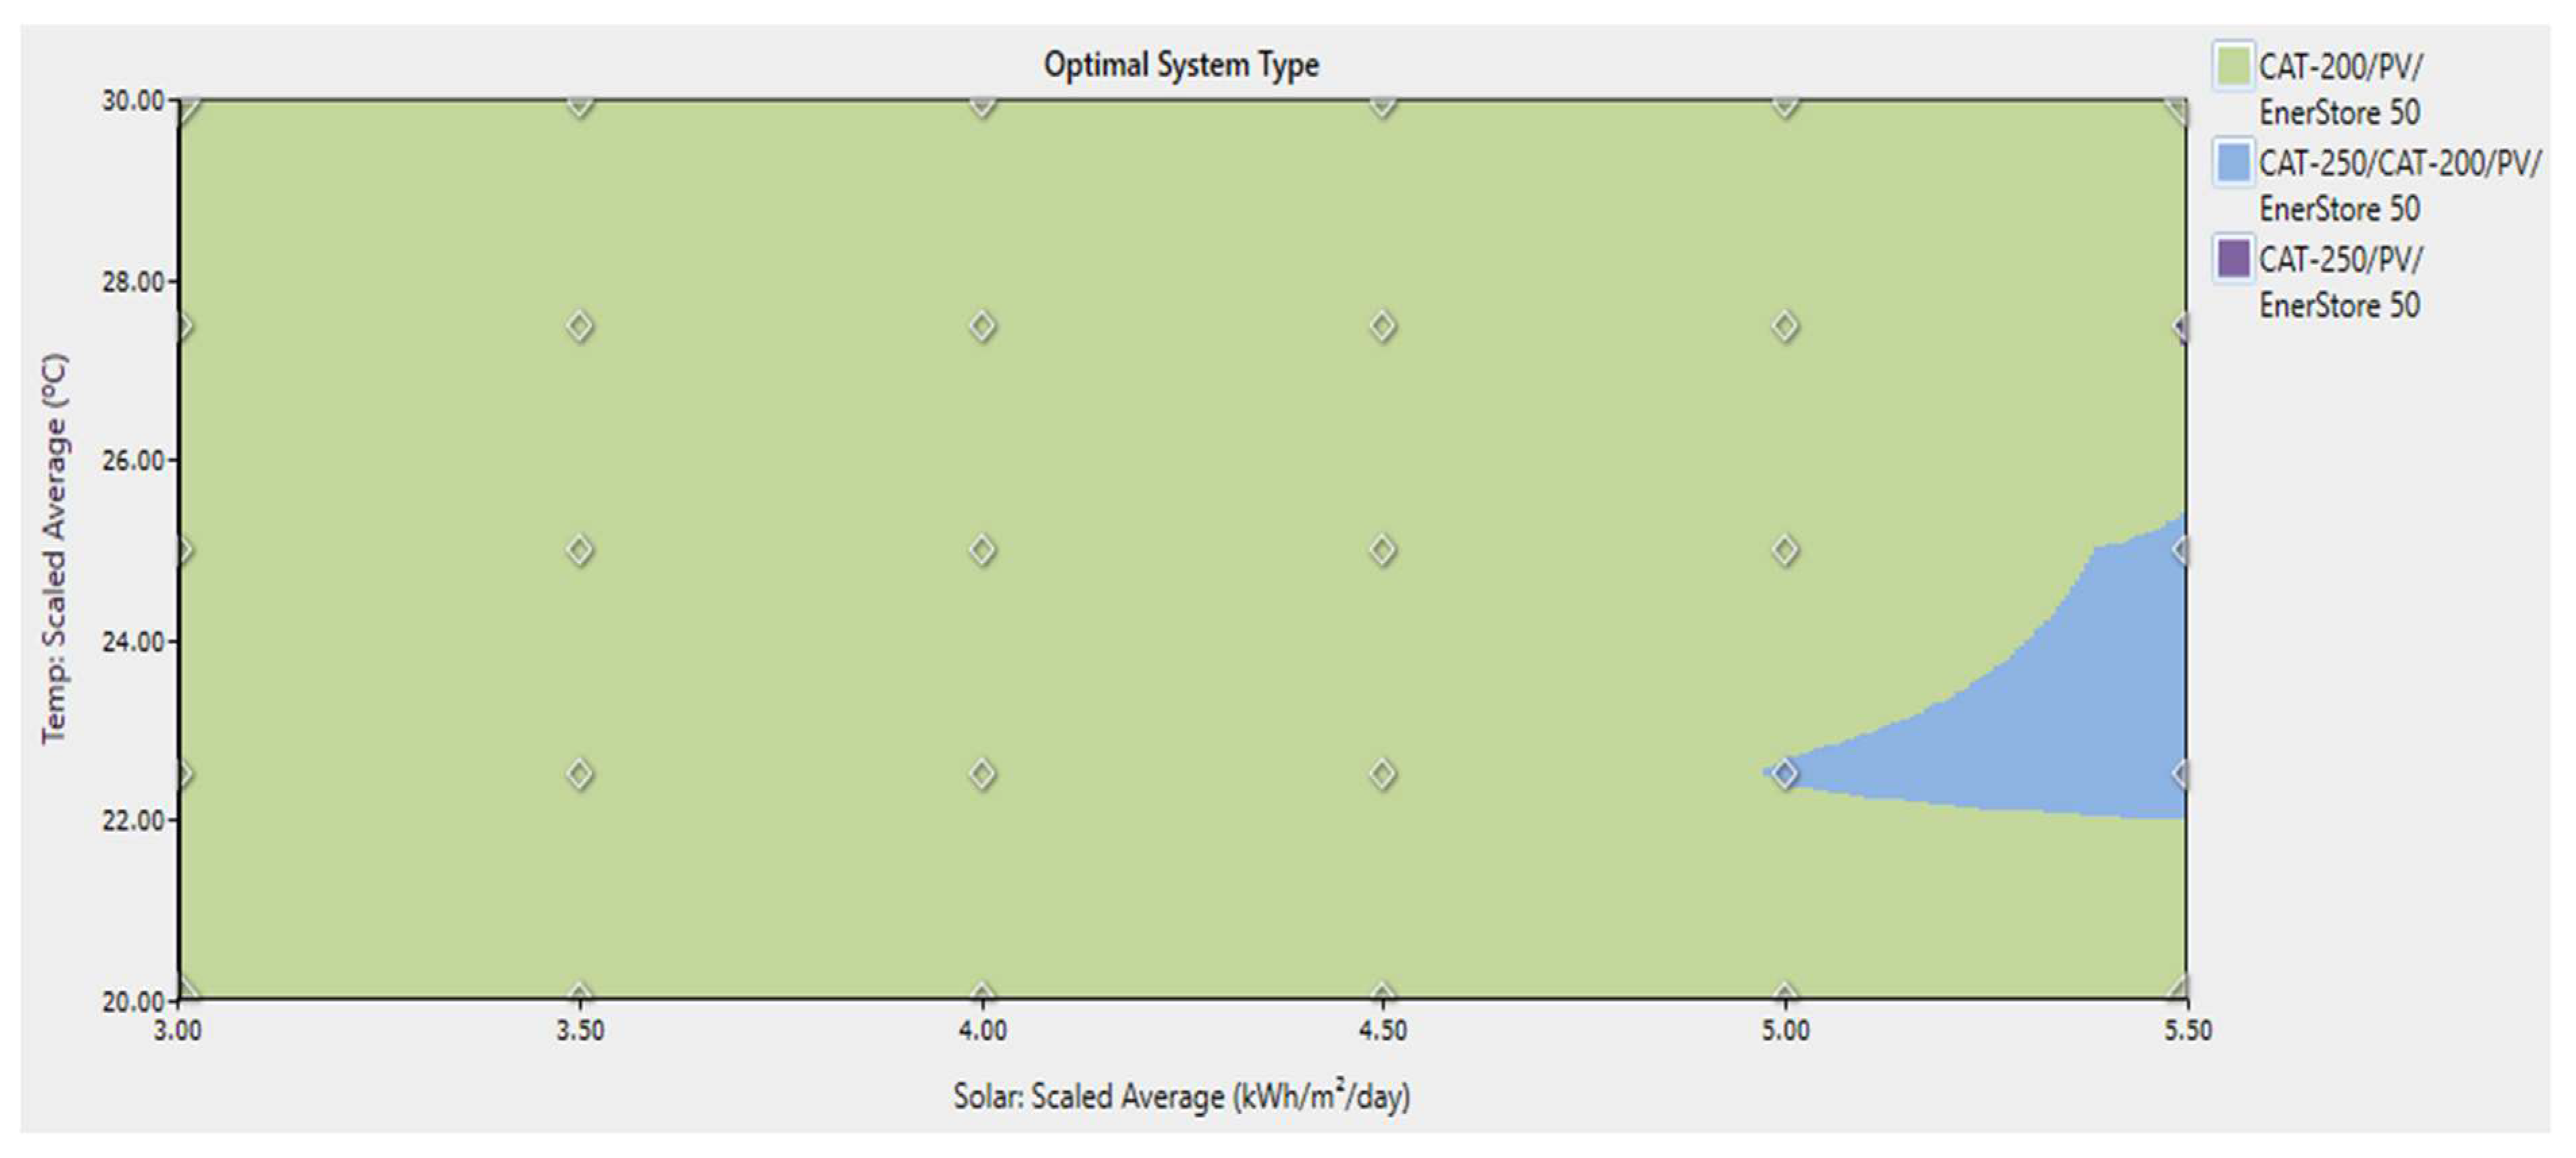
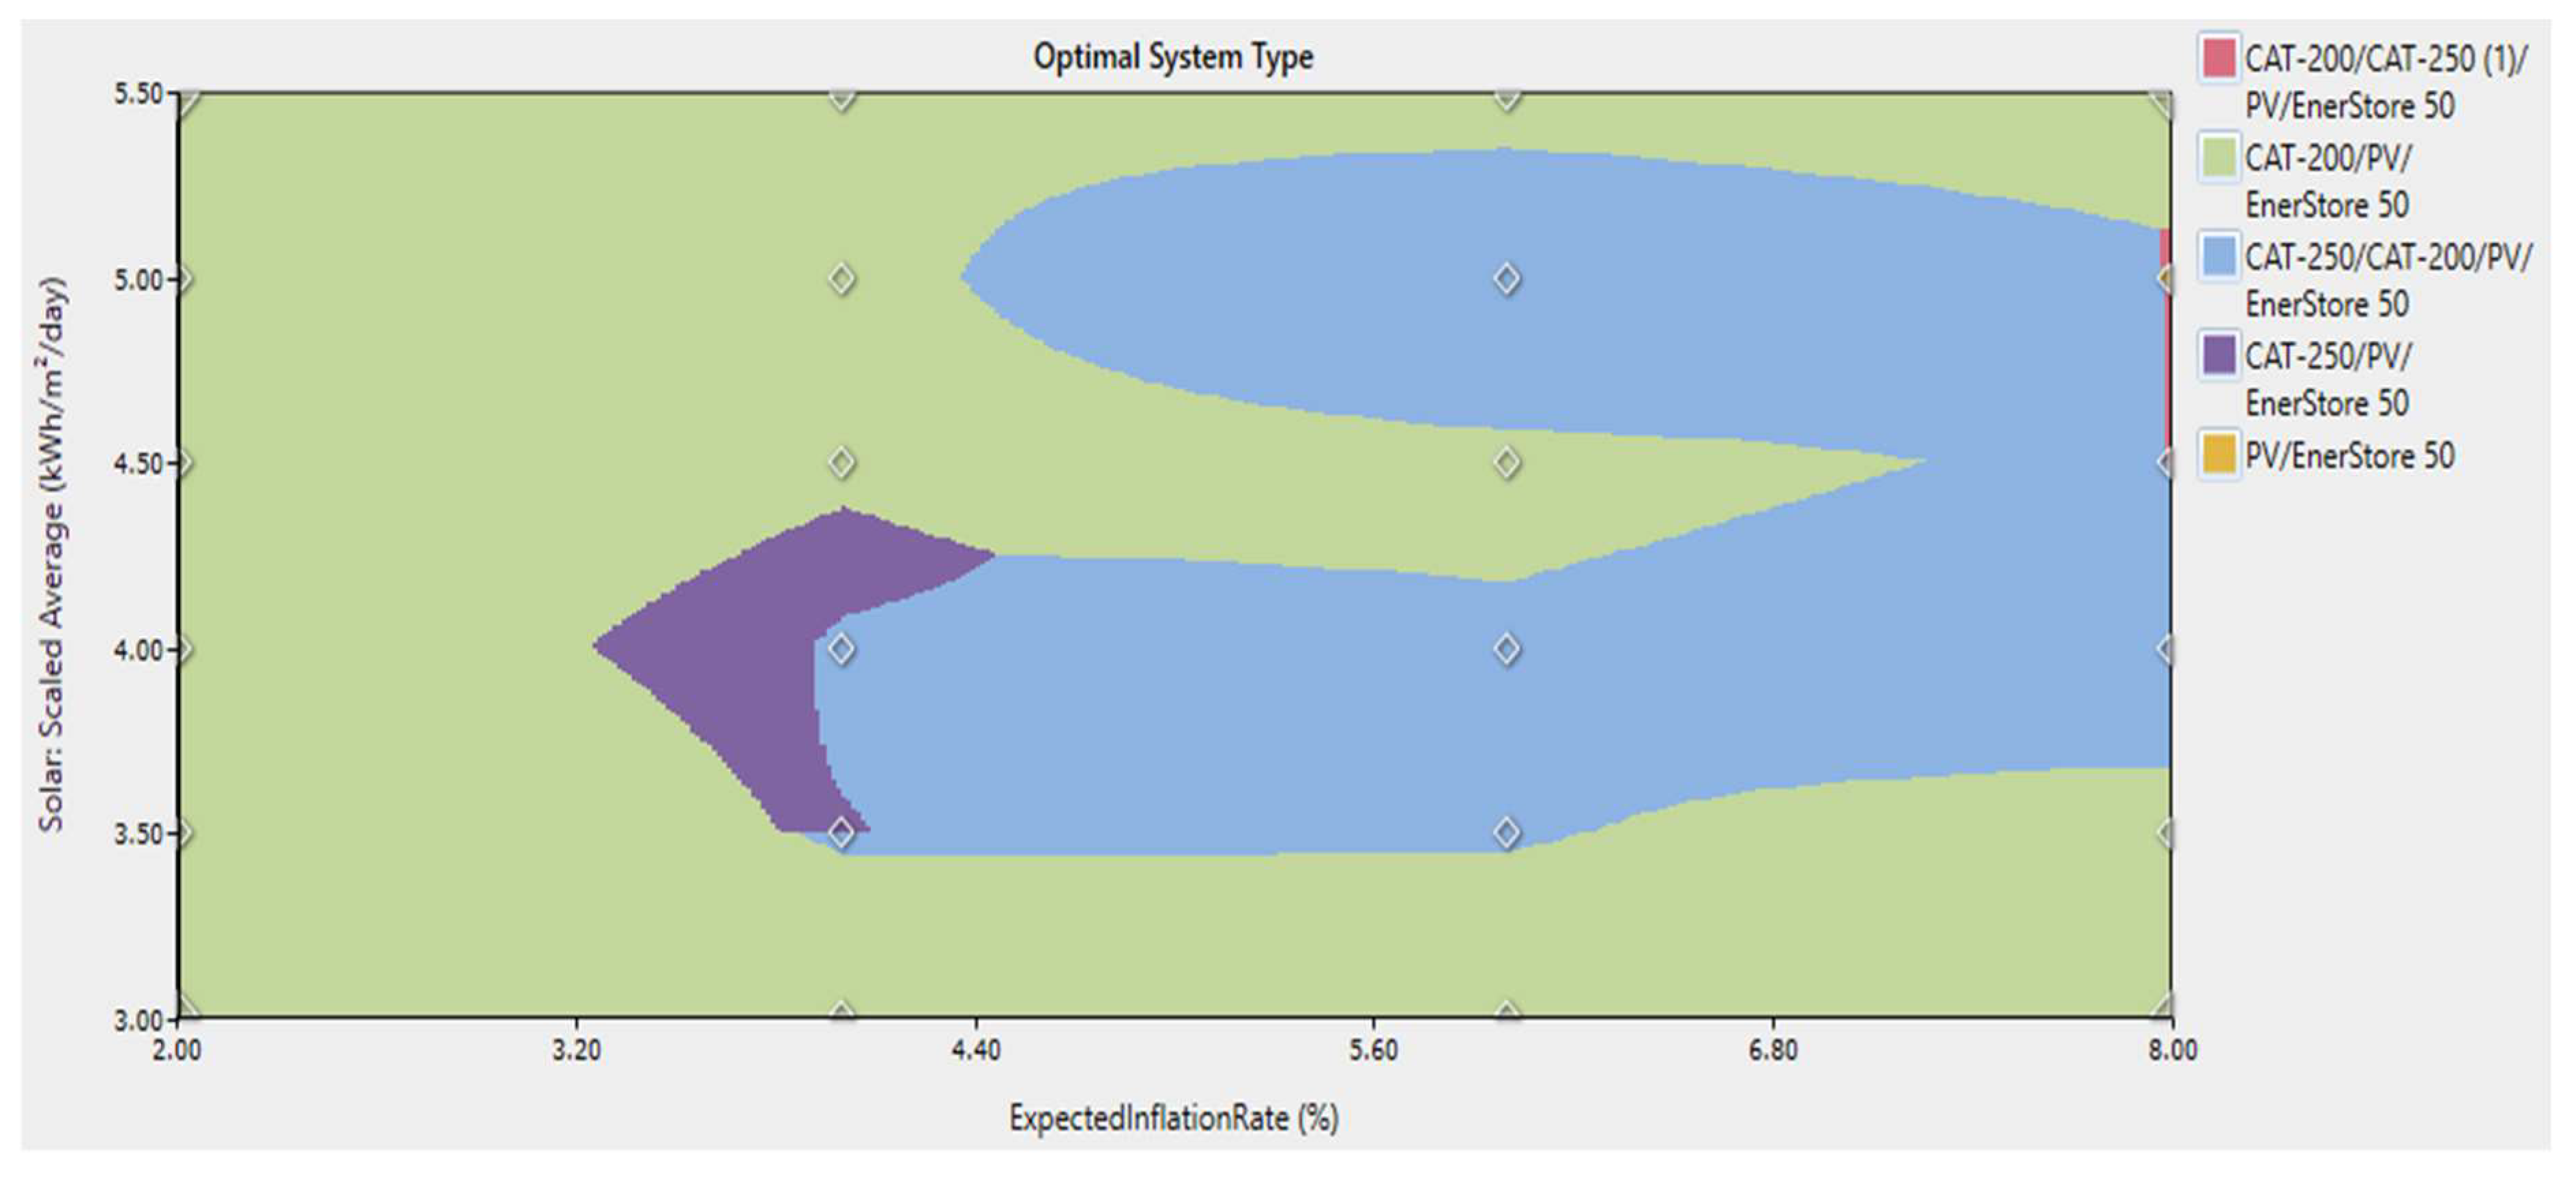
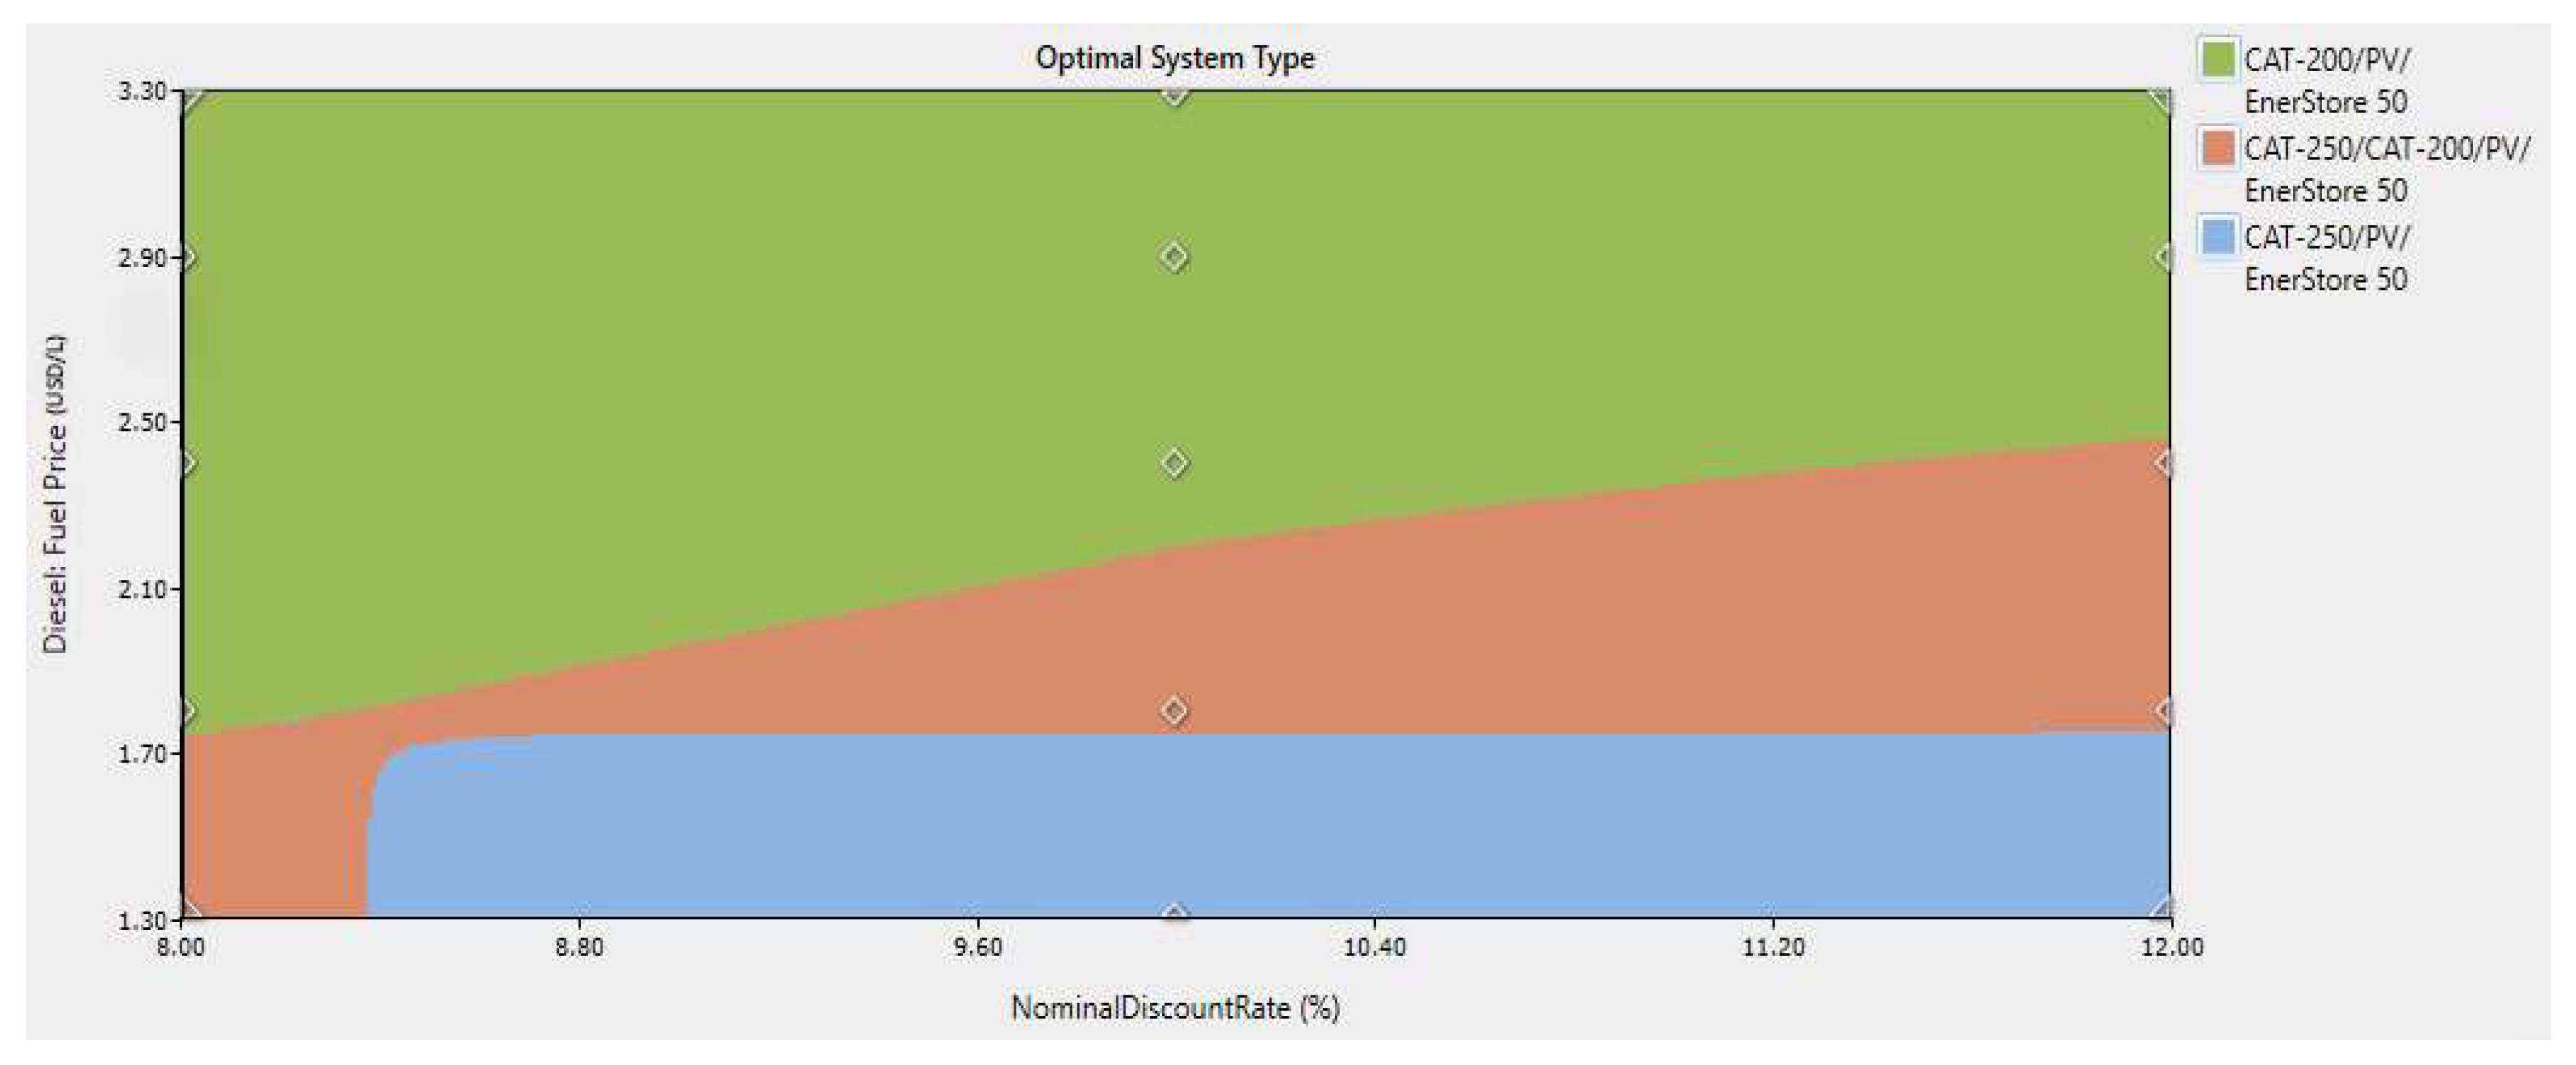
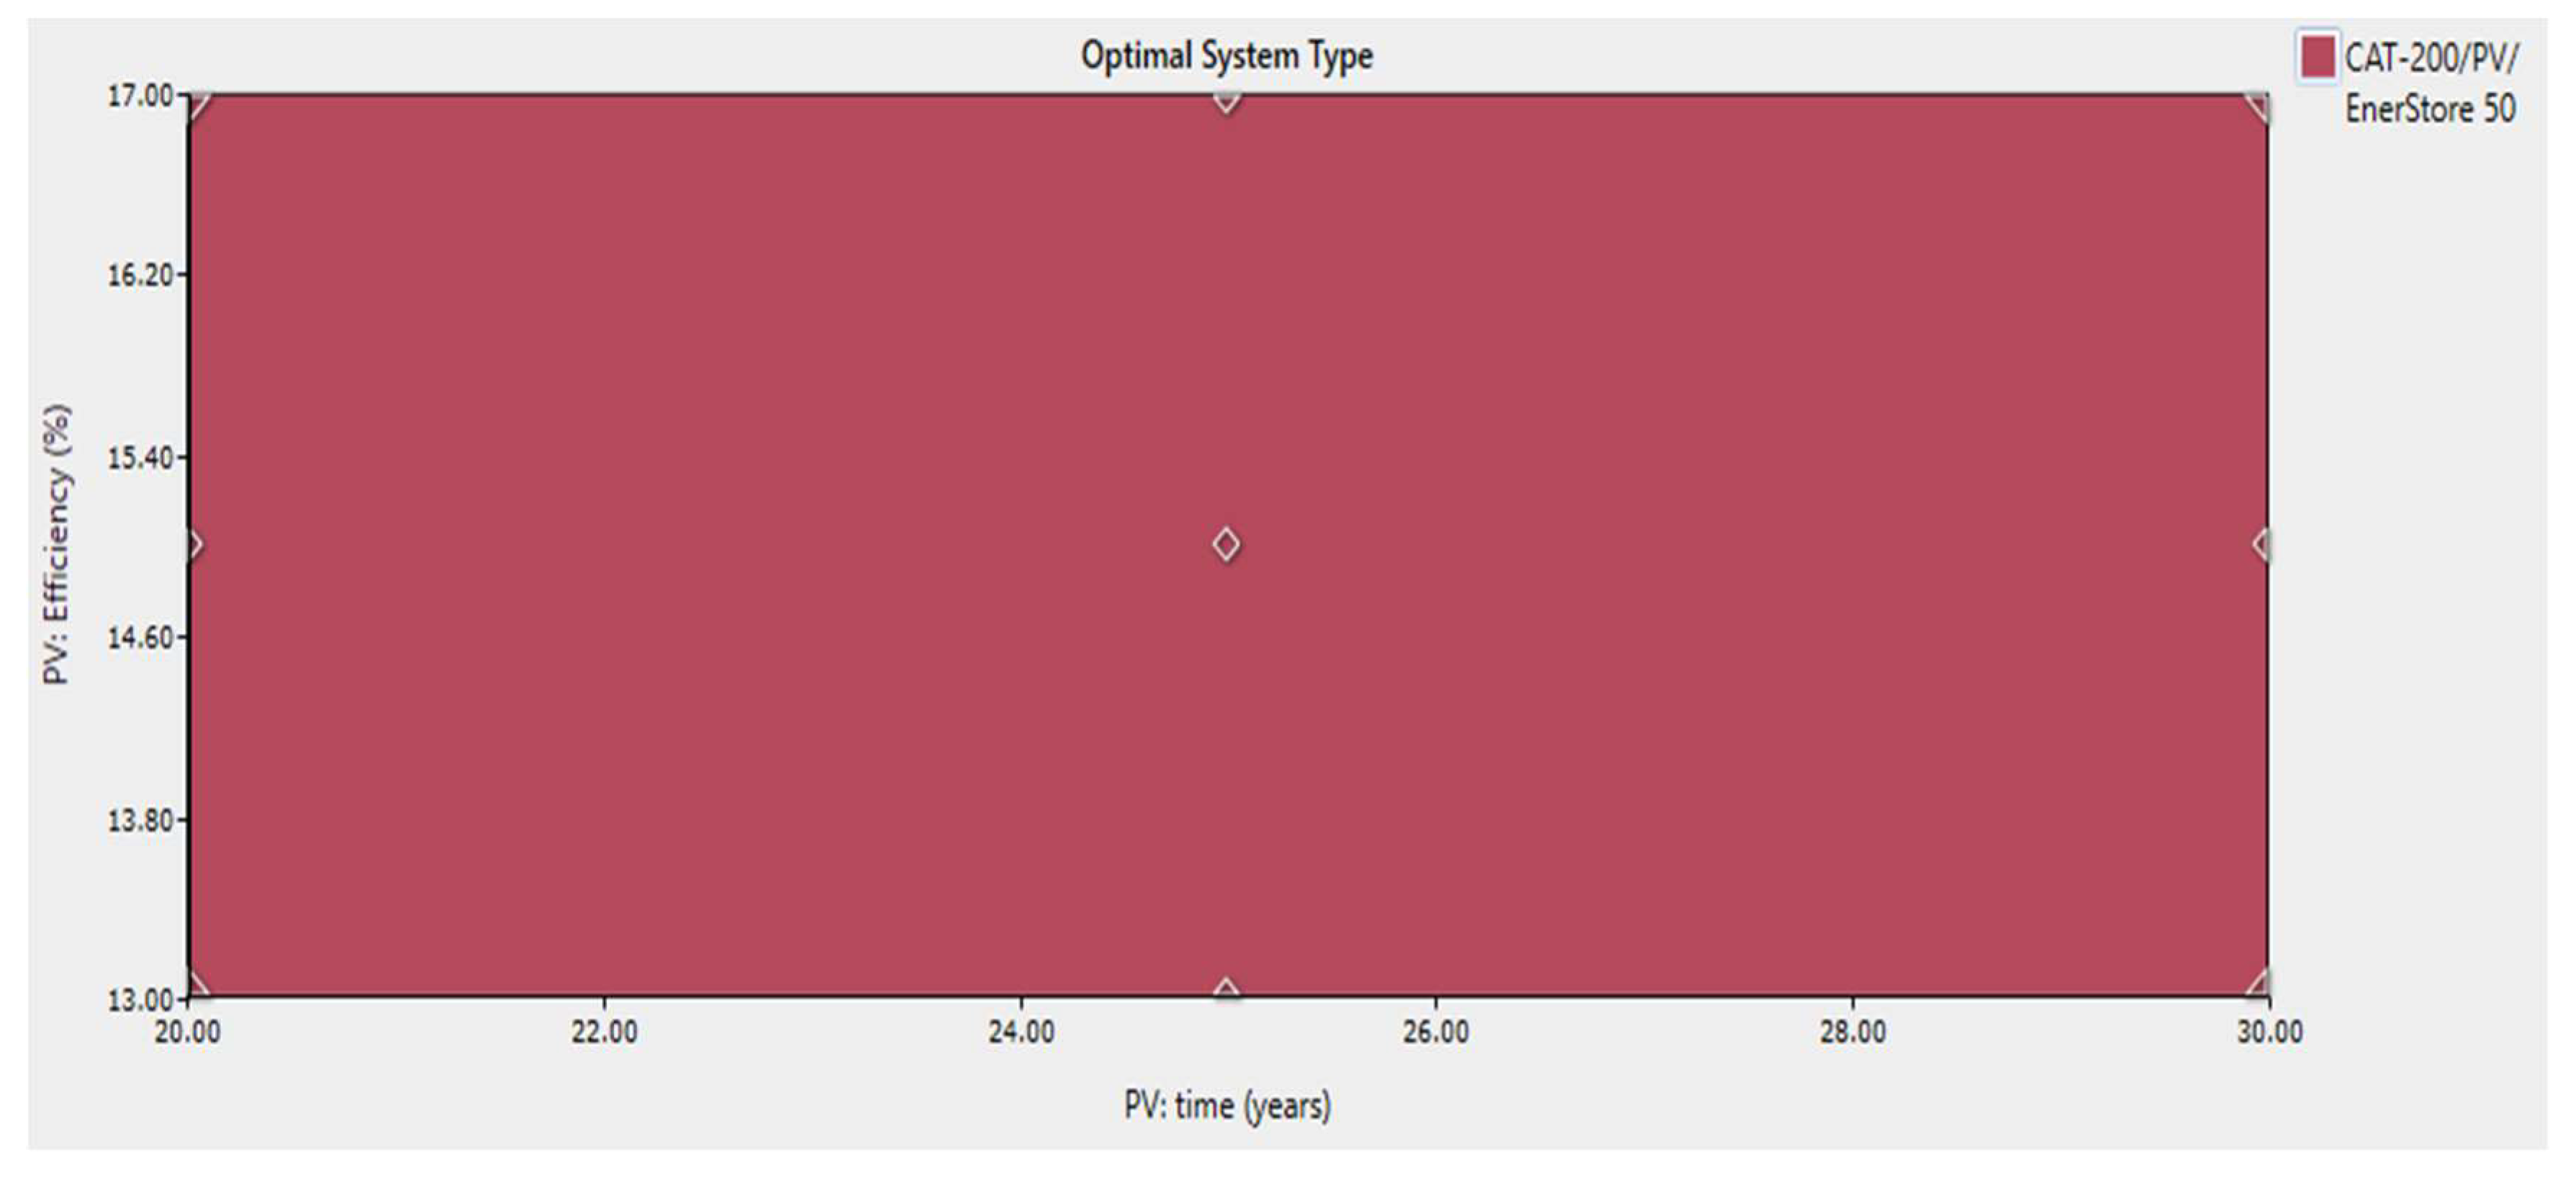
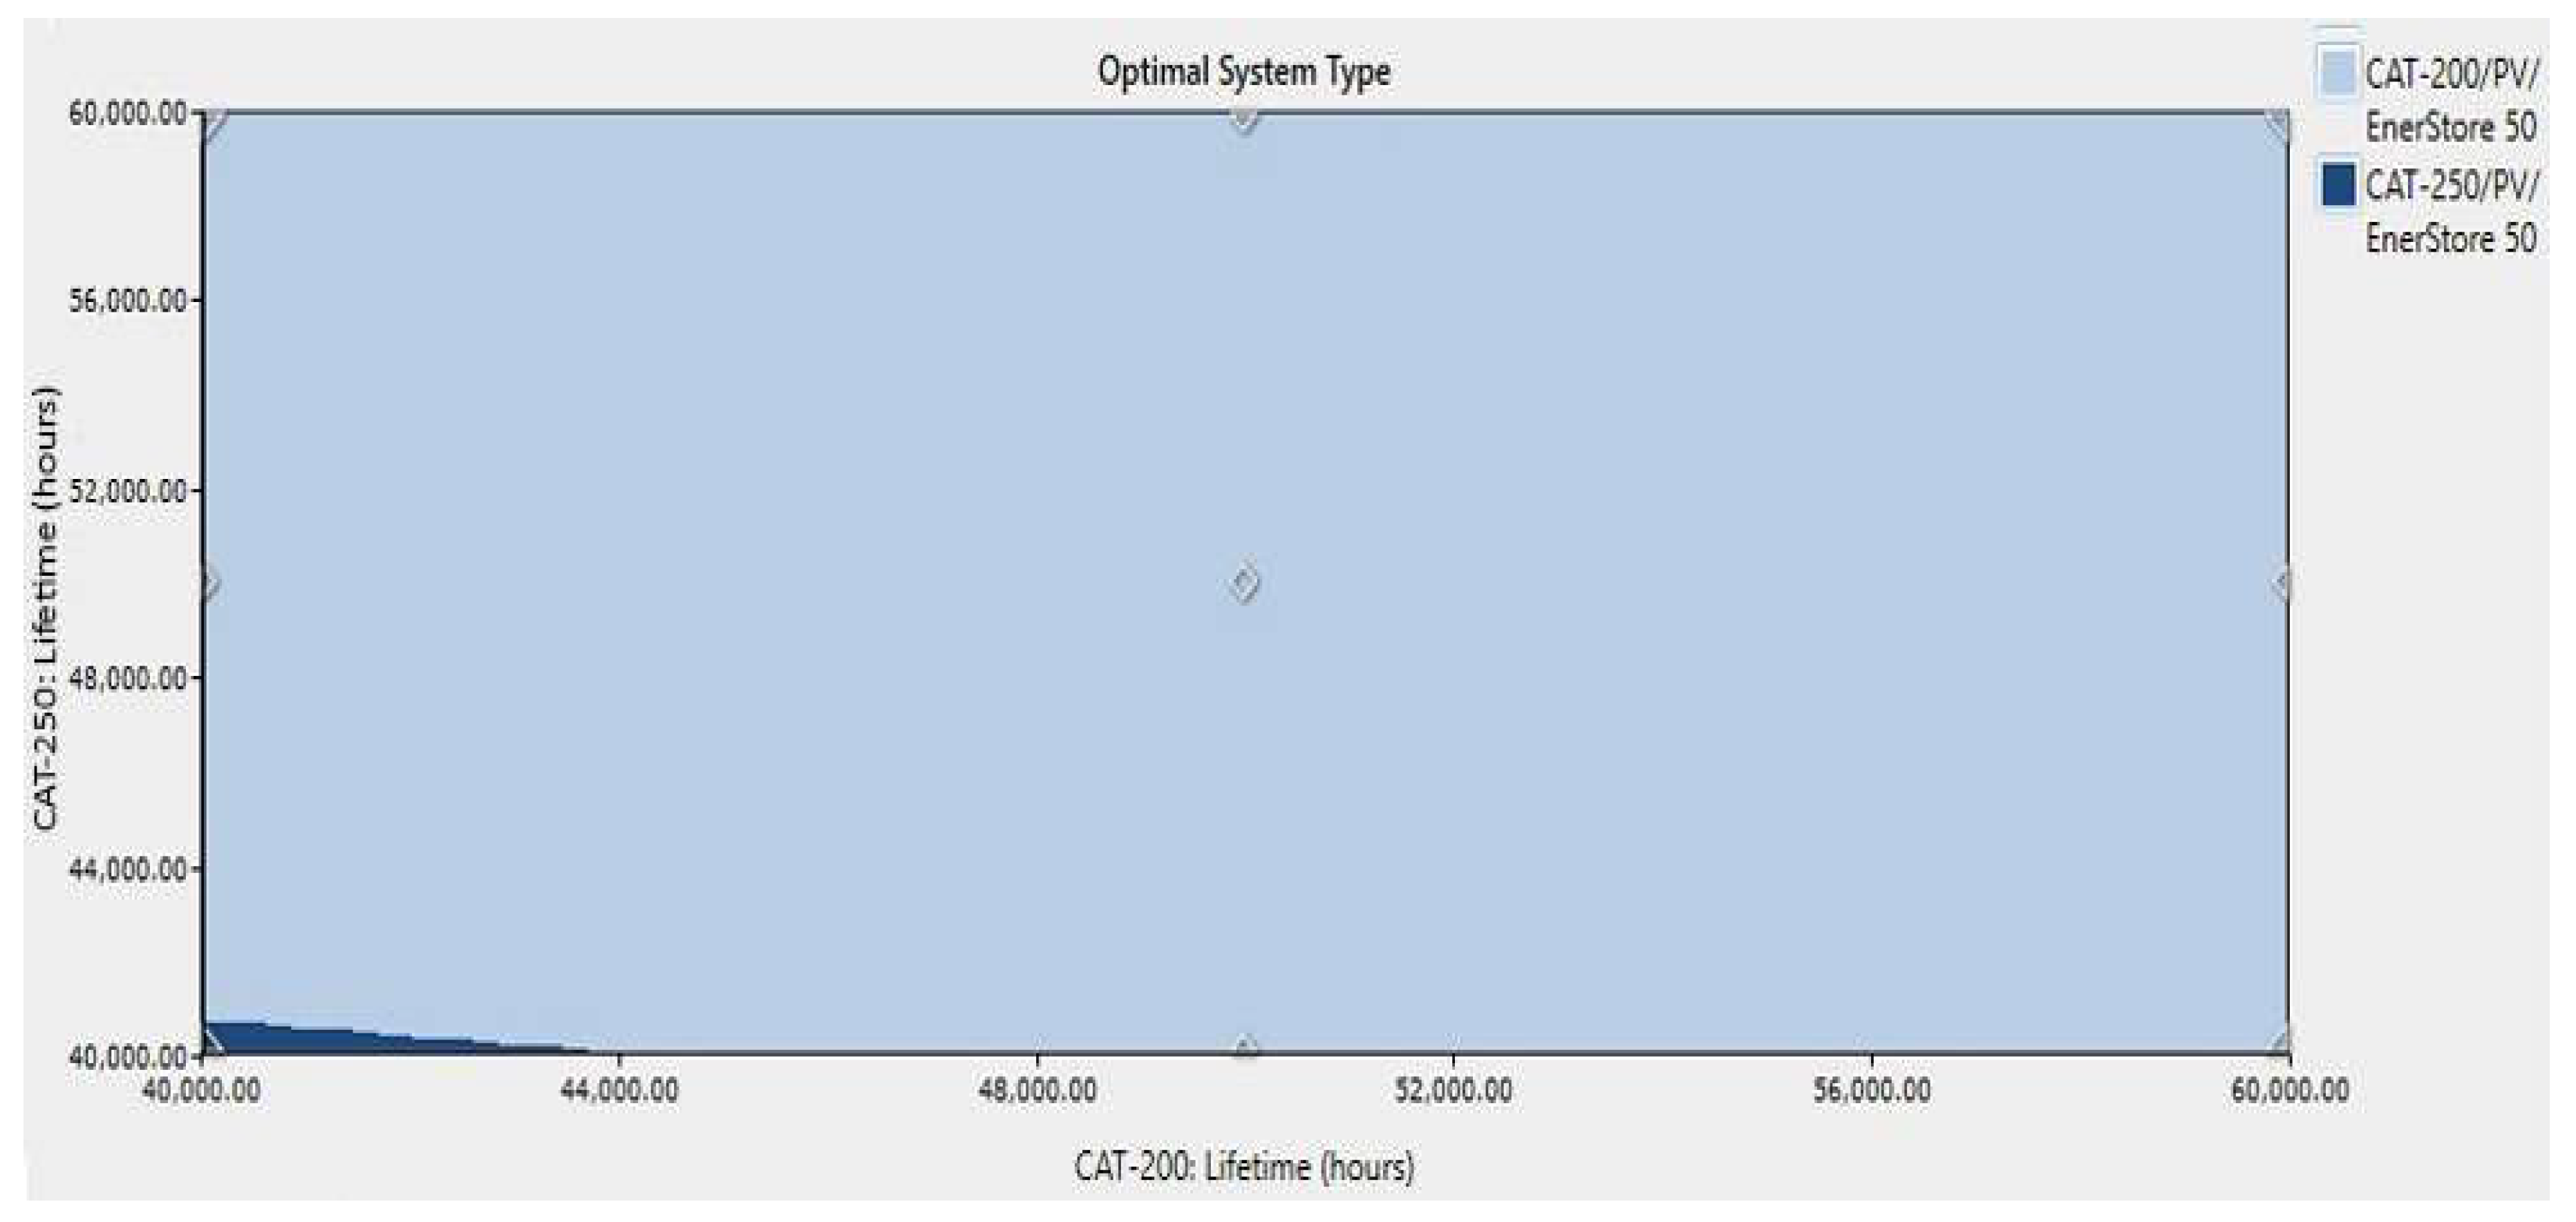
The total system performance was studied in the sensitivity analysis in relation to changes in key parameters like the fuel cost, load expansion, solar energy, and battery bank pricing. The findings indicate a greater trend toward the use of hybrid systems, particularly as fuel prices and load demands rise, which include solar panels, batteries, and DGs. Additionally, lowering the cost of the PV system and storage would encourage the usage of PV arrays and batteries, because such systems would have a lower NPC and LCOE.
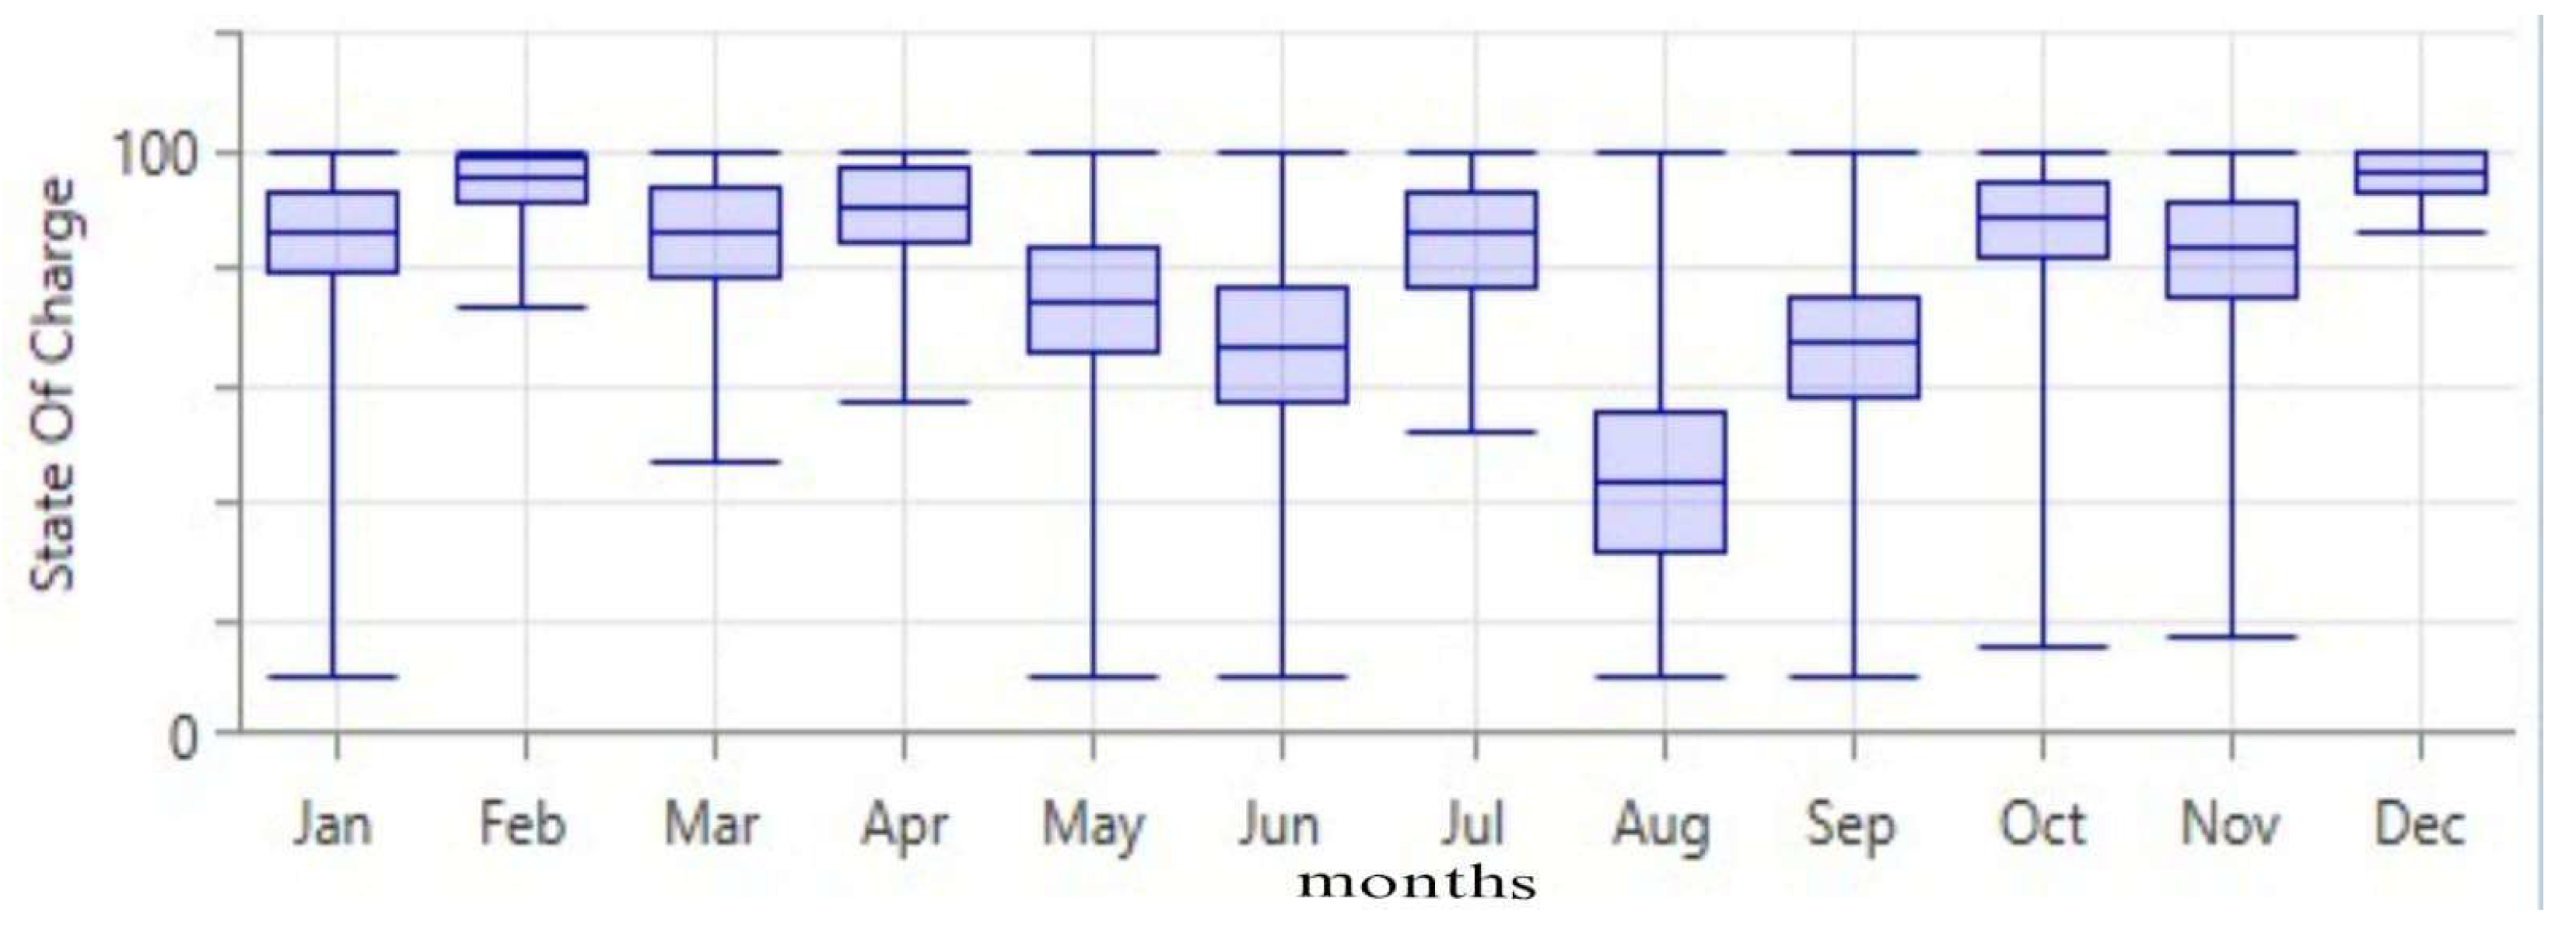
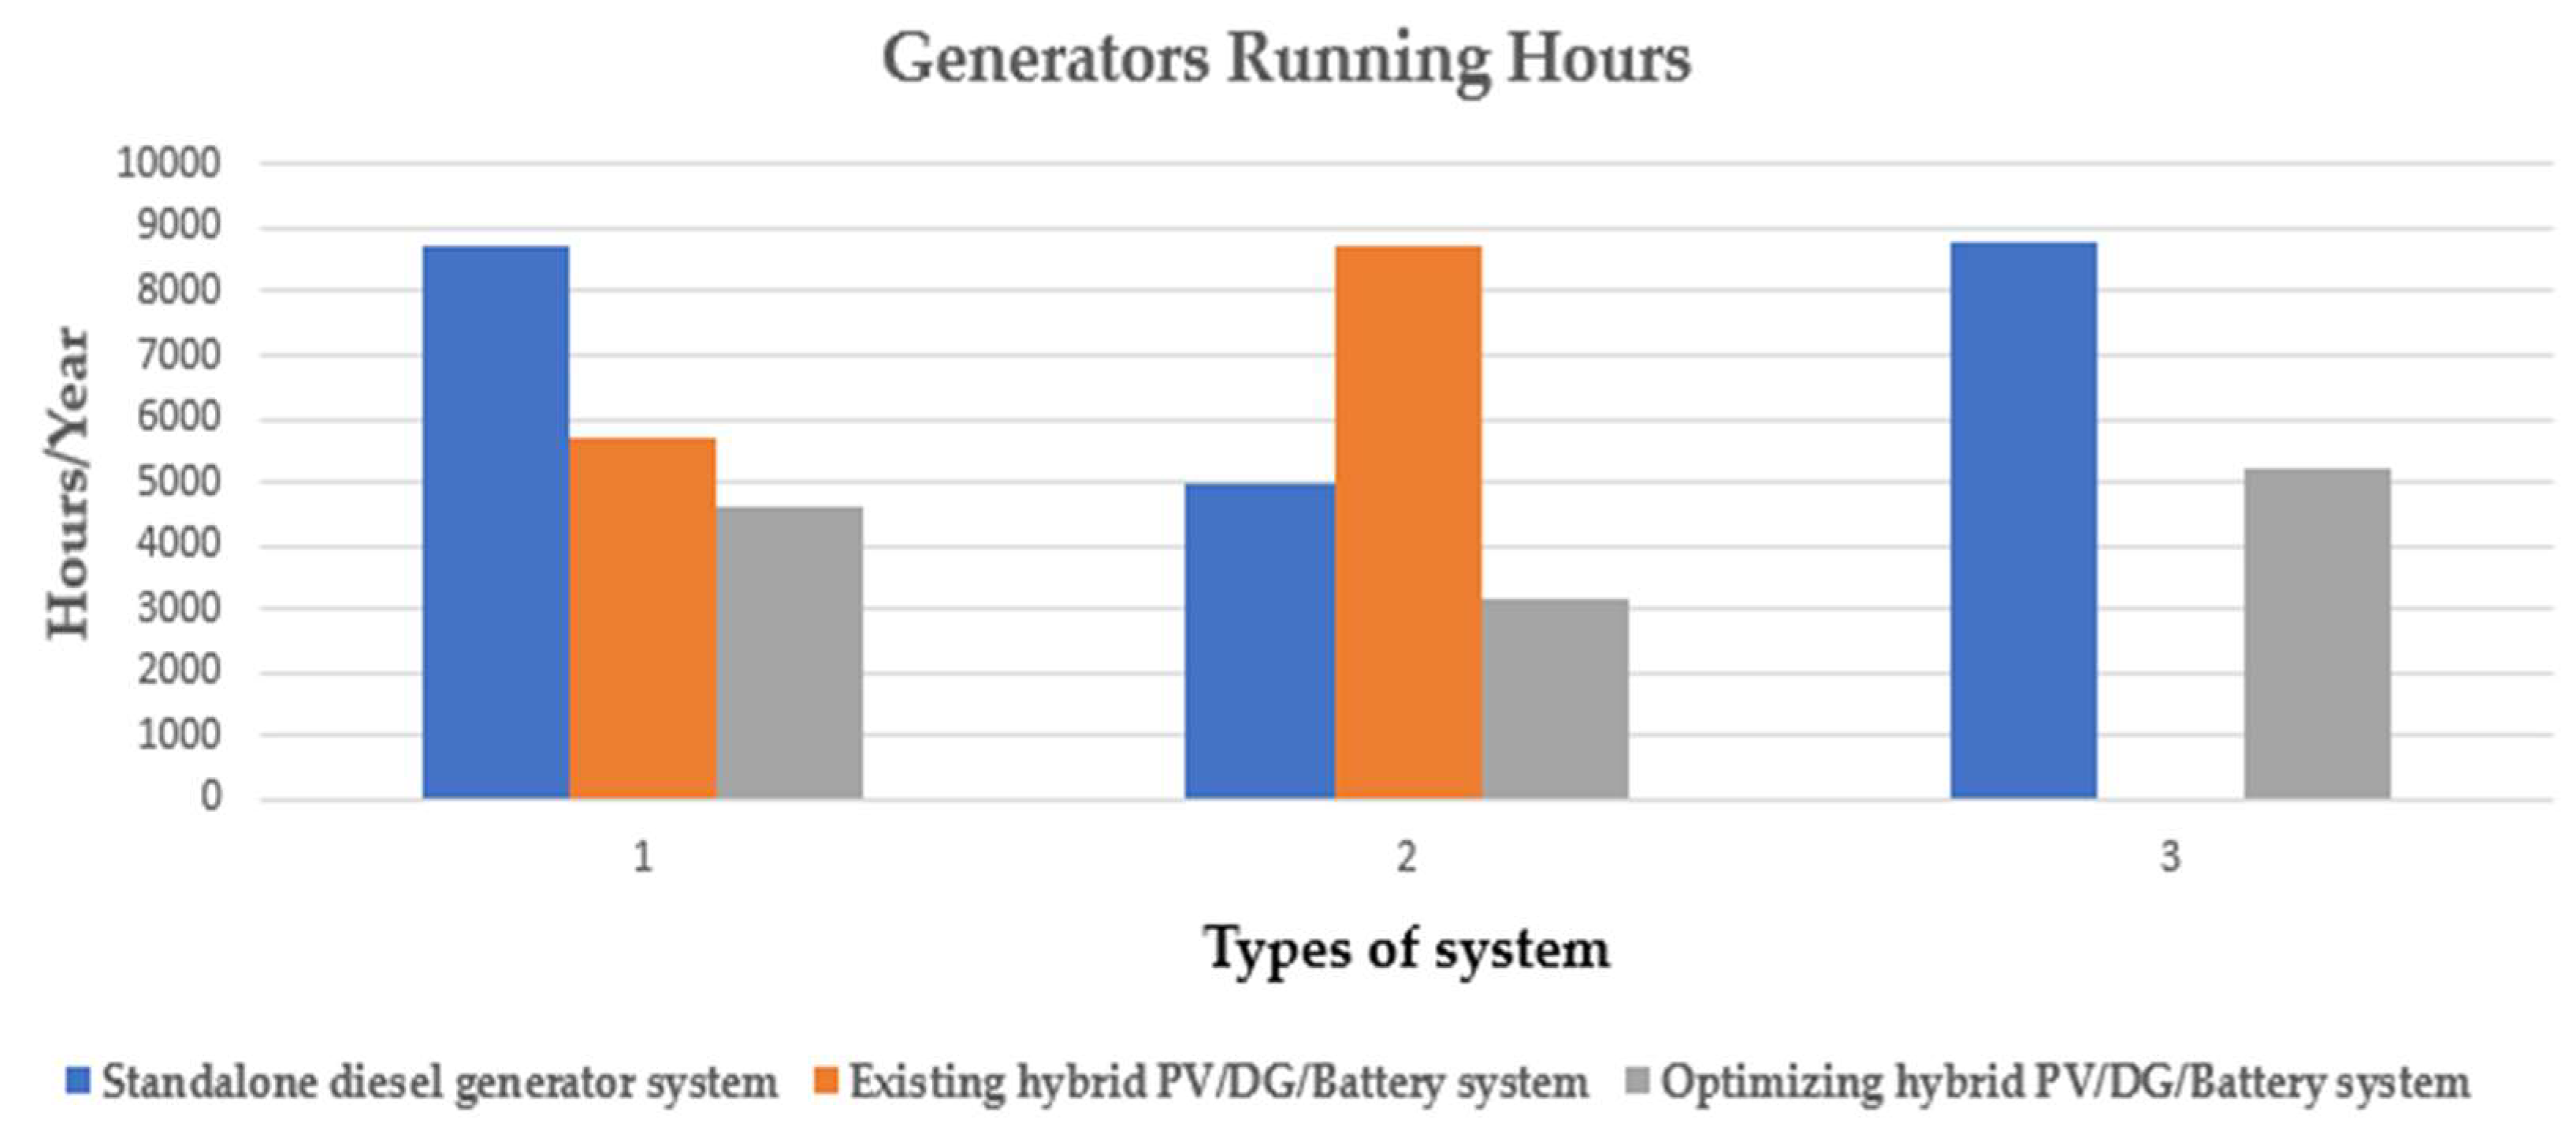
The stability of the system depends heavily on the storage system. The storage system provides a good way to reduce extra energy. Thus, the best possible use of this energy for the existing design is discovered. The level of charge of the storage system shows that both systems have frequent charging cycles. However, the 100% PV/storage system has more cycles, because it primarily relies on the batteries to power loads when the PV is not available. The hybrid system is also compared to freestanding DGs to assess the consequences of deploying similar systems on fuel usage, generator running hours, hazardous emissions, and economic difficulties.
According to the findings, integrated systems may use less fuel and emit significantly reduced amounts of harmful environmental emissions. Due to the system’s increased use of smaller generators to power the loads throughout the day, the DGs’ operating hours would also be reduced. Since the generators are operating at reduced loads, there is a decrease in the overall NPC and LCOE as well as the costs associated with their replacement, maintenance, operation, and fuel.

6.2. Impact on the Environment

The findings indicate that freestanding DGs contribute the highest rate of hazardous emissions into the environment, in comparison to a system that uses just solar energy and batteries. The hybrid PV/DG/storage system, on the other hand, exhibits excellent economic and environmental characteristics. The system’s harmful emissions would decrease as the amount of energy produced by RE sources increased. It is also obvious that the structure of the system and the volume of energy produced affect the decrease in hazardous emissions.

7. Comparison with the Existing RE-Based Hybrid System Presented in the Literature

This section provides a comparative overview of previous research. Table 11 compares the current study’s findings with previous research with respect to the consumption of electricity, COE, NPC, and operation and maintenance costs. The analysis on a hybrid system PV/DG/Grid/battery by Çetinbaş et al. in [26] had the highest COE of 0.520 USD/kWh, which might be attributed to a lesser usage of RE sources. However, because of the improved optimization method and abundance of RE sources, the present research achieves the lowest COE of 0.159 USD/kWh. Moreover, the hybrid system (WT/DG/battery) used by Ammari et al. [29] for a performance analysis achieved the maximum NPC of USD 29.9 million because of the high-power requirement and additional components. Another hybrid system proposed for China in [33] had a COE and NPC of 0.471 USD/kWh and USD 13.1 million, which are higher than the proposed system for Bangladesh. Ultimately, it is determined that the resources present at the chosen site allow for the dependable and cost-effective use of a hybrid, PV/DG/battery RE system.

8. Limitations of the Proposed RE-Based Hybrid System along with Recommendations

The suggested solutions aim to increase the overall system flexibility, efficiency, and reliability by integrating many energy sources. Although there are many benefits to the systems, there are also drawbacks, because the inventors failed to account for potential generational losses and equipment failures. Therefore, the findings of this study should be regarded as approximations.
  • The PV array’s low efficiency of only 13% may limit its ability to provide reliable power during peak periods, so the system needs to operate more on DGs that cause environmental pollution.
  • There was a lack of backup diesel generators to provide a steady supply of electricity during repairs or unplanned outages.
  • Due to high capital and replacement costs for PV arrays and batteries, a 100% RE system appears to be economically impractical.
However, these problems can be solved by adopting some measures. Environmental pollution can be reduced by thinking about using natural gas or biodiesel generators as cleaner alternatives to DGs. Establishing a thorough maintenance program and tracking system, and investigating the financing, incentives, and subsidies that are available for RE projects might be useful for high startup expenses and backup generators.

9. Conclusions and Future Research Proposals

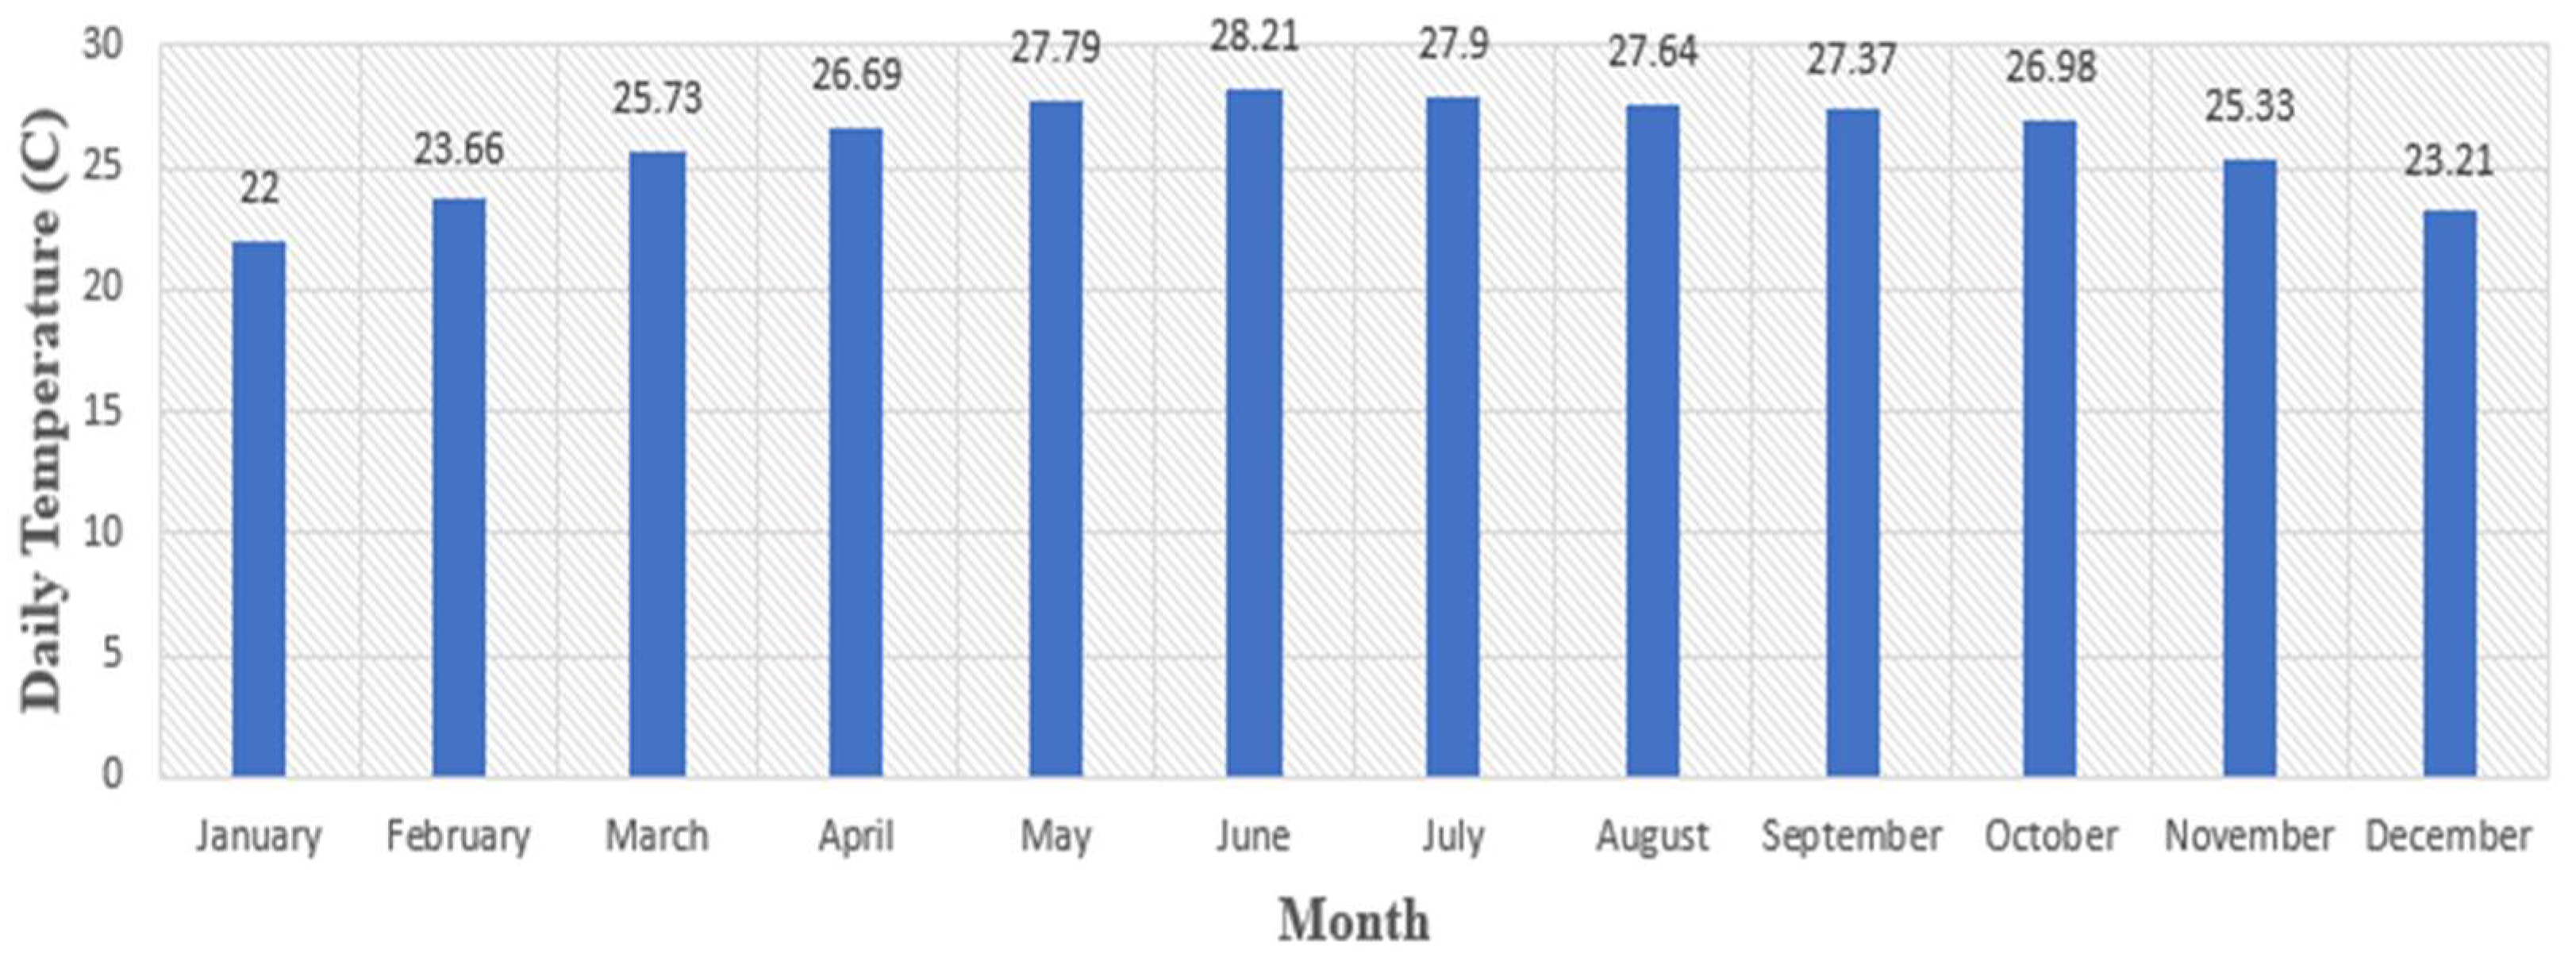
This study investigates the techno-economic and sensitivity analysis of a hybrid power system, as well as multiple performance matrix scenarios for a station in Kuakata. According to the study, a site with a significant annual average global solar radiation (5.00 kWh/m2 per day) and yearly average temperature (25.11 °C) is a feasible location for the installation of a PV/DG/battery hybrid system. According to the HOMER simulation findings, the most economically feasible solution for the site load consists of a 200 kW PV array, 250 kW, 200 KW, and 160 KW DG, and six units of batteries, each with a nominal voltage of 100 V and a capacity of 500 Ah. The simulation’s results indicate that the ideal system would produce 3000 kWh of energy per day, with an operating cost (OC) of USD 3967.32, an LCOE of 0.367 USD/kWh, and an NPC of USD 5.19 M. It also demonstrates the effects of adding PV power to mini-grids at various RE penetration levels (0%, 36.75%, 42.87%, 61.43%, 78.8%, and 100%) based on significant operational methods.
This research examines PV system sizes, demand profiles, temperatures, radiation, hazardous emissions, and RE penetration impacts on the LCOE, NPC, and technical qualities, highlighting its socioeconomic benefits. According to capacity-based measurements, the RE penetration is 51.9% and greenhouse gas emissions are 0.27 Mkg/yr. Furthermore, the study analyzed system expenses, revealing that the standard, standalone DG design is financially unfeasible due to high diesel prices, impacting the operational costs, and results in negative environmental impacts. The sensitivity analysis reveals that when 22.52 °C is the ideal temperature and 5 kWh/m2/day of sun radiation, a nominal discount rate of 10%, a 25-year PV array lifespan, a price of 1.8 USD/L for diesel fuel, and an average load of 4800 KWh/d are all present, the system operates best. The findings also indicate that anticipating the energy sources and load profiles is particularly helpful for developing a more efficient, cost-effective, and environmentally friendly management plan. This work can serve as a model for policymakers to make policies in hybrid RE systems, which may be followed by other researchers or operators or RE-based enterprises while developing similar systems.
Future research on RE in Bangladesh is crucial, focusing on environmental trust fund utilization, climate change awareness, resource planning, natural disaster mitigation, load demand satisfaction, remote energy supply, and optimal power plant performance. Tidal energy is one more sustainable energy source that has to be considered. A future research proposal could be integrating tidal energy to replace the DGs, making the optimized system more efficient. This could be beneficial for the environment in addition to being economically advantageous.

Author Contributions

Conceptualization, S.M.N.H., M.M.H. and S.A.; methodology, A.G.M.B.M., M.R.A., S.A., M.H. and T.A.; software, M.M.H. and A.F.L.; validation, T.A., A.G.M.B.M., M.R.A. and M.M.H.; investigation, S.M.N.H., A.G.M.B.M., M.M.H. and S.H.; formal analysis, A.F.L. and S.H.; data curation, S.A. and M.H.; writing—original draft preparation, S.M.N.H., A.F.L. and S.A.; writing—review and editing, M.R.A., T.A. and S.H.; visualization, S.M.N.H., M.H. and A.G.M.B.M.; supervision, M.R.A. All authors have read and agreed to the published version of the manuscript.

Funding

The authors would like to thank the Chittagong University of Engineering and Technology (CUET) for providing financial support under the Development of CUET Project and Project No. CUET/DRE/2021-22/EEE/016 under Directorate of Research and Extension (DRE), CUET.

Data Availability Statement

Data can be found within this study.

Acknowledgments

The authors would like to thank the American International University–Bangladesh (AIUB) for providing all kind of research supports to complete the research.

Conflicts of Interest

The authors declare no conflict of interest.

References

  1. Kennedy, K.M.; Ruggles, T.H.; Rinaldi, K.; Dowling, J.A.; Duan, L.; Caldeira, K.; Lewis, N.S. The role of concentrated solar power with thermal energy storage in least-cost highly reliable electricity systems fully powered by variable renewable energy. Adv. Appl. Energy 2022, 6, 100091. [Google Scholar] [CrossRef]
  2. Ahmadi, M.H.; Ghazvini, M.; Sadeghzadeh, M.; Alhuyi Nazari, M.; Kumar, R.; Naeimi, A.; Ming, T. Solar power technology for electricity generation: A critical review. Energy Sci. Eng. 2018, 6, 340–361. [Google Scholar] [CrossRef]
  3. Rabaia, M.K.H.; Abdelkareem, M.A.; Sayed, E.T.; Elsaid, K.; Chae, K.-J.; Wilberforce, T.; Olabi, A. Environmental impacts of solar energy systems: A review. Sci. Total Environ. 2021, 754, 141989. [Google Scholar] [CrossRef]
  4. Mehmood, U. Contribution of renewable energy towards environmental quality: The role of education to achieve sustainable development goals in G11 countries. Renew. Energy 2021, 178, 600–607. [Google Scholar] [CrossRef]
  5. Ukoima, K.; Agwu, E.O.; Nkalo, U.K. Review of the impact of electricity supply on economic growth: A Nigerian case study. IOSR J. Electr. Electron. Eng. 2019, 14, 28–34. [Google Scholar] [CrossRef]
  6. Khatun, S.; Shaon, S.M.; Sadekin, N. Impact of poverty and inequality on economic growth of Bangladesh. J. Econ. Sustain. Dev. 2021, 12, 107–120. [Google Scholar] [CrossRef]
  7. Rashid, F.; Hoque, E.; Aziz, M.; Sakib, T.N.; Islam, T.; Robin, R.M. Investigation of Optimal Hybrid Energy Systems Using Available Energy Sources in a Rural Area of Bangladesh. Energies 2021, 14, 5794. [Google Scholar] [CrossRef]
  8. Karim, M.E.; Karim, R.; Islam, T.; Muhammad-Sukki, F.; Bani, N.A.; Muhtazaruddin, M.N. Renewable Energy for Sustainable Growth and Development: An Evaluation of Law and Policy of Bangladesh. Sustainability 2019, 11, 5774. [Google Scholar] [CrossRef]
  9. Masud, M.H.; Nuruzzaman, M.; Ahamed, R.; Ananno, A.A.; Tomal, A.N.M.A. Renewable energy in Bangladesh: Current situation and future prospect. Int. J. Sustain. Energy 2020, 39, 132–175. [Google Scholar] [CrossRef]
  10. Hoque, M.Z.; Haque, E.; Islam, S. Mapping integrated vulnerability of coastal agricultural livelihood to climate change in Bangladesh: Implications for spatial adaptation planning. Phys. Chem. Earth Parts A/B/C 2022, 125, 103080. [Google Scholar] [CrossRef]
  11. Fan, W.; Hao, Y. An empirical research on the relationship amongst renewable energy consumption, economic growth and foreign direct investment in China. Renew. Energy 2020, 146, 598–609. [Google Scholar] [CrossRef]
  12. Rahman, M.L.; Islam, M.S.; Latif, M.A.; Khan, M.A.H.; Saime, M.A.; Ali, M.H. Renewable Energy Scenario in Bangladesh. Ijarii 2018, 4, 270–279. [Google Scholar]
  13. Hossain, F.S.; Rahman, T.; Al Mamun, A.; Mannan, O.B.; Altaf-Ul-Amin, M. An approach to increase the power output of Karnafuli Hydroelectric Power Station: A step to sustainable development in Bangladesh’s energy sector. PLoS ONE 2021, 16, e0257645. [Google Scholar] [CrossRef] [PubMed]
  14. Hasan, Y.; Monir, M.U.; Ahmed, M.T.; Aziz, A.A.; Shovon, S.M.; Akash, F.A.; Khan, M.F.H.; Faruque, J.; Rifat, S.I.; Hossain, J.; et al. Sustainable energy sources in Bangladesh: A review on present and future prospect. Renew. Sustain. Energy Rev. 2022, 155, 111870. [Google Scholar] [CrossRef]
  15. Sustainable And Renewable Energy Development Authority (SREDA). Available online: https://www.sreda.gov.bd (accessed on 3 May 2023).
  16. Osička, J.; Černoch, F. European energy politics after Ukraine: The road ahead. Energy Res. Soc. Sci. 2022, 91, 102757. [Google Scholar] [CrossRef]
  17. Thirunavukkarasu, M.; Sawle, Y. A Comparative Study of the Optimal Sizing and Management of Off-Grid Solar/Wind/Diesel and Battery Energy Systems for Remote Areas. Front. Energy Res. 2021, 9, 752043. [Google Scholar] [CrossRef]
  18. Pourbehzadi, M.; Niknam, T.; Aghaei, J.; Mokryani, G.; Shafie-khah, M.; Catalão, J.P.S. Optimal operation of hybrid AC/DC microgrids under uncertainty of renewable energy resources: A comprehensive review. Int. J. Electr. Power Energy Syst. 2019, 109, 139–159. [Google Scholar] [CrossRef]
  19. Onifade, T.T. Hybrid renewable energy support policy in the power sector: The contracts for difference and capacity market case study. Energy Policy 2016, 95, 390–401. [Google Scholar] [CrossRef]
  20. Olatomiwa, L. Optimal configuration assessments of hybrid renewable power supply for rural healthcare facilities. Energy Rep. 2016, 2, 141–146. [Google Scholar] [CrossRef]
  21. Odou, O.D.T.; Bhandari, R.; Adamou, R. Hybrid off-grid renewable power system for sustainable rural electrification in Benin. Renew. Energy 2020, 145, 1266–1279. [Google Scholar] [CrossRef]
  22. Sinha, S.; Chandel, S.S. Review of software tools for hybrid renewable energy systems. Renew. Sustain. Energy Rev. 2014, 32, 192–205. [Google Scholar] [CrossRef]
  23. Thirunavukkarasu, M.; Sawle, Y.; Lala, H. A comprehensive review on optimization of hybrid renewable energy systems using various optimization techniques. Renew. Sustain. Energy Rev. 2023, 176, 113192. [Google Scholar] [CrossRef]
  24. Rehman, S.; Al-Hadhrami, L.M. Study of a solar PV–diesel–battery hybrid power system for a remotely located population near Rafha, Saudi Arabia. Energy 2010, 35, 4986–4995. [Google Scholar] [CrossRef]
  25. Esan, A.B.; Agbetuyi, A.F.; Oghorada, O.; Ogbeide, K.; Awelewa, A.A.; Afolabi, A.E. Reliability assessments of an islanded hybrid PV-diesel-battery system for a typical rural community in Nigeria. Heliyon 2019, 5, e01632. [Google Scholar] [CrossRef] [PubMed]
  26. Çetinbaş, İ.; Tamyürek, B.; Demirtaş, M. Design, analysis and optimization of a hybrid microgrid system using HOMER software: Eskişehir osmangazi university example. Int. J. Renew. Energy Dev. 2019, 8, 65–79. [Google Scholar] [CrossRef]
  27. Ohijeagbon, O.D.; Ajayi, O.O. Solar regime and LVOE of PV embedded generation systems in Nigeria. Renew. Energy 2015, 78, 226–235. [Google Scholar] [CrossRef]
  28. Baneshi, M.; Hadianfard, F. Techno-economic feasibility of hybrid diesel/PV/wind/battery electricity generation systems for non-residential large electricity consumers under southern Iran climate conditions. Energy Convers. Manag. 2016, 127, 233–244. [Google Scholar] [CrossRef]
  29. Ammari, C.; Hamouda, M.; Makhloufi, S. Comparison Between Three Hybrid System PV/Wind Turbine/Diesel Generator/Battery Using HOMER PRO Software. In Proceedings of the 2011 International Conference on Electrical Engineering and Control Applications, Harbin, China, 17–19 July 2011; pp. 227–237. [Google Scholar] [CrossRef]
  30. Naderipour, A.; Ramtin, A.R.; Abdullah, A.; Marzbali, M.H.; Nowdeh, S.A.; Kamyab, H. Hybrid energy system optimization with battery storage for remote area application considering loss of energy probability and economic analysis. Energy 2022, 239, 122303. [Google Scholar] [CrossRef]
  31. Yahiaoui, A.; Tlemçani, A.; Kouzou, A. Optimization, Power Management and Reliability Evaluation of Hybrid Wind-PV-Diesel-Battery System for Rural Electrification. Autom. Control. Intell. Syst. 2021, 9, 73. [Google Scholar] [CrossRef]
  32. Mishra, S.; Panigrahi, C.K.; Kothari, D.P. Design and simulation of a solar–wind–biogas hybrid system architecture using HOMER in India. Int. J. Ambient. Energy 2016, 37, 184–191. [Google Scholar] [CrossRef]
  33. Li, C.; Zhou, D.; Wang, H.; Lu, Y.; Li, D. Techno-economic performance study of stand-alone wind/diesel/battery hybrid system with different battery technologies in the cold region of China. Energy 2020, 192, 116702. [Google Scholar] [CrossRef]
  34. Ramli, M.A.M.; Hiendro, A.; Al-Turki, Y.A. Techno-economic energy analysis of wind/solar hybrid system: Case study for western coastal area of Saudi Arabia. Renew. Energy 2016, 91, 374–385. [Google Scholar] [CrossRef]
  35. Hossen, M.D.; Islam, M.F.; Ishraque, M.F.; Shezan, S.A.; Arifuzzaman, S.M. Design and Implementation of a Hybrid Solar-Wind-Biomass Renewable Energy System considering Meteorological Conditions with the Power System Performances. Int. J. Photoenergy 2022, 2022, 8792732. [Google Scholar] [CrossRef]
  36. Rai, P.; Saeed, S.H.; Mishra, S.O. Harmful gases detection using artificial neural networks of the environment. Indones. J. Electr. Eng. Comput. Sci. 2023, 30, 1389–1398. [Google Scholar] [CrossRef]
  37. Sinha, S.; Chandel, S.S. Review of recent trends in optimization techniques for solar photovoltaic–wind-based hybrid energy systems. Renew. Sustain. Energy Rev. 2015, 50, 755–769. [Google Scholar] [CrossRef]
  38. Shamshirband, S.; Mohammadi, K.; Chen, H.-L.; Samy, G.N.; Petković, D.; Ma, C. Daily global solar radiation prediction from air temperatures using kernel extreme learning machine: A case study for Iran. J. Atmos. Sol.-Terr. Phys. 2015, 134, 109–117. [Google Scholar] [CrossRef]
  39. Shoeb, M.; Shafiullah, G.M. Renewable Energy Integrated Islanded Microgrid for Sustainable Irrigation—A Bangladesh Perspective. Energies 2018, 11, 1283. [Google Scholar] [CrossRef]
  40. Chowdhury, S.A.; Aziz, S.; Groh, S.; Kirchhoff, H.; Filho, W.L. Off-grid rural area electrification through solar-diesel hybrid minigrids in Bangladesh: Resource-efficient design principles in practice. J. Clean. Prod. 2015, 95, 194–202. [Google Scholar] [CrossRef]
  41. Rahman, M.M.; Hettiwatte, S.; Shafiullah, G.; Arefi, A. An analysis of the time of use electricity price in the residential sector of Bangladesh. Energy Strategy Rev. 2017, 18, 183–198. [Google Scholar] [CrossRef]
  42. Siddaiah, R.; Saini, R.P. A review on planning, configurations, modeling and optimization techniques of hybrid renewable energy systems for off grid applications. Renew. Sustain. Energy Rev. 2016, 58, 376–396. [Google Scholar] [CrossRef]
  43. Liu, Y.S.; Yigitcanlar, T.; Guaralda, M.; Degirmenci, K.; Liu, A.; Kane, M. Leveraging the Opportunities of Wind for Cities through Urban Planning and Design: A PRISMA Review. Sustainability 2022, 14, 11665. [Google Scholar] [CrossRef]
  44. Nurunnabi, M.; Roy, N.K.; Hossain, E.; Pota, H.R. Size Optimization and Sensitivity Analysis of Hybrid Wind/PV Micro-Grids- A Case Study for Bangladesh. IEEE Access 2019, 7, 150120–150140. [Google Scholar] [CrossRef]
  45. Kumar, P.; Pal, N.; Sharma, H. Performance analysis and evaluation of 10 kWp solar photovoltaic array for remote islands of Andaman and Nicobar. Sustain. Energy Technol. Assess. 2020, 42, 100889. [Google Scholar] [CrossRef]
  46. Ramesh, M.; Saini, R.P. Dispatch strategies based performance analysis of a hybrid renewable energy system for a remote rural area in India. J. Clean. Prod. 2020, 259, 120697. [Google Scholar] [CrossRef]
  47. Halabi, L.M.; Mekhilef, S.; Olatomiwa, L.; Hazelton, J. Performance analysis of hybrid PV/diesel/battery system using HOMER: A case study Sabah, Malaysia. Energy Convers. Manag. 2017, 144, 322–339. [Google Scholar] [CrossRef]
  48. Kumar, P.; Pal, N.; Sharma, H. Techno-economic analysis of solar photo-voltaic/diesel generator hybrid system using different energy storage technologies for isolated islands of India. J. Energy Storage 2021, 41, 102965. [Google Scholar] [CrossRef]
  49. See, A.M.K.; Mehranzamir, K.; Rezania, S.; Rahimi, N.; Afrouzi, H.N.; Hassan, A. Techno-economic analysis of an off-grid hybrid system for a remote island in Malaysia: Malawali island, Sabah. Renew. Sustain. Energy Transit. 2022, 2, 100040. [Google Scholar] [CrossRef]
  50. Oviroh, P.; Jen, T.-C. The Energy Cost Analysis of Hybrid Systems and Diesel Generators in Powering Selected Base Transceiver Station Locations in Nigeria. Energies 2018, 11, 687. [Google Scholar] [CrossRef]
  51. Maisanam, A.K.S.; Biswas, A.; Sharma, K.K. Integrated socio-environmental and techno-economic factors for designing and sizing of a sustainable hybrid renewable energy system. Energy Convers. Manag. 2021, 247, 114709. [Google Scholar] [CrossRef]
  52. Agyekum, E.B.; Ampah, J.D.; Afrane, S.; Adebayo, T.S.; Agbozo, E. A 3E, hydrogen production, irrigation, and employment potential assessment of a hybrid energy system for tropical weather conditions—Combination of HOMER software, shannon entropy, and TOPSIS. Int. J. Hydrogen Energy 2022, 47, 31073–31097. [Google Scholar] [CrossRef]
  53. Rajkumar, R.K.; Ramachandaramurthy, V.K.; Yong, B.L.; Chia, D.B. Techno-economical optimization of hybrid pv/wind/battery system using Neuro-Fuzzy. Energy 2011, 36, 5148–5153. [Google Scholar] [CrossRef]
  54. Rahman, A. Retail Power Price: Hiked Again, in Just 3 Weeks. The Daily Star. 1 February 2023. Available online: https://www.thedailystar.net/environment/natural-resources/energy/news/retail-power-price-hiked-again-just-3-weeks-3235606 (accessed on 29 August 2023).
Figure 1. Bangladesh’s proportion of renewable energy [15].
Energies 17 01476 g001
Figure 2. Monthly average solar global horizontal irradiance (GHI) data.
Energies 17 01476 g002
Figure 3. Monthly average temperature data.
Energies 17 01476 g003
Figure 4. Seasonal load profile.
Energies 17 01476 g004
Figure 5. Proposed off-grid, RE-based hybrid system implemented in HOMER.
Energies 17 01476 g005
Figure 6. Flowchart depicting the operation of the system under various circumstances.
Energies 17 01476 g006
Figure 7. State of charge of the storage system.
Energies 17 01476 g007
Figure 8. Effects of solar radiation and temperature on the optimum configuration.
Energies 17 01476 g008
Figure 9. The influence of the inflation rate on the optimal system.
Energies 17 01476 g009
Figure 10. Effect on system’s economy by varying fuel price, discount, and average load.
Energies 17 01476 g010
Figure 11. The impacts of PV array lifespan and efficiency on the optimized system.
Energies 17 01476 g011
Figure 12. The effect of diesel generator lifespan on the optimized configuration.
Energies 17 01476 g012
Figure 13. Generator running hours before and after adding PV system or batteries and optimizing conditions.
Energies 17 01476 g013
Figure 14. Cost analysis of optimized hybrid PV/DG/battery.
Energies 17 01476 g014
Table 1. Scenarios of load usage over the summer season.
Residential Load
Load TypeNo. of HouseholdsAppliance TypeRating (W)No. of AppliancesTotal Power (W)Run Time (h/day)Total Load (KWh)
Light201012,000784
Fan60414,40012172.8
Computer12017200536
High-class TV11016600639.6
household60Rice cooker1000160,0001.590
Refrigerator250115,00024360
Iron750145,000145
AC1000160,0005300
Water pumps780146,800146.8
Total load demand for high-class household = 1174.2 KWh
Light2069600768.2
Fan60314,40010144
Middle-class Computer12019600438.4
household80TV11018800435.2
Refrigerator250120,00024480
Iron750160,0000.530
Total load demand for middle-class household = 795.8 KWh
Light2025600739.2
Low-class household140Fan6018400650.4
TV110115,400461.6
Total load demand for low-class household = 151.2 KWh
Public and Commercial Load
Light201664010.64
School2Fan60253000515
Computer110122030.66
Water pump7801156011.5
Total load demand for school = 17.8 KWh
Light201020061.2
Fan6010600169.6
Health center1Computer110111020.22
Lab equipment11001110055.5
Refrigerator2501250246
Water pump780178021.56
Others600160042.4
Total load demand for health center = 26.48 KWh
Light2044800828.4
Commercial load(markets)60Fan60136001554
Refrigerator250115,00024360
Total load demand for commercial load (market) = 442.4 KWh
Deferrable Load
Streetlight Light8022017,60010176
Total load demand for deferrable load = 176 KWh
Battery-run auto-rickshaw Battery charging12005060,0003180
Total load demand for battery-run auto-rickshaw = 180 KWh
Overall load demand for autumn season = 2963.88 kWh
Table 2. Scenarios of load usage over the autumn season.
Residential Load
Load TypeNo. of HouseholdsAppliance TypeRating (W)No. of AppliancesTotal Power (W)Run Time (h/day)Total Load (KWh)
Light201012,000784
Fan60414,40010144
Computer12017200428.8
High-class TV11016600639.6
household60Rice cooker1000160,0002120
Refrigerator250115,00024360
Iron750145,0000.522.5
AC1000160,0002120
Water pumps780146,8000.523.4
Total load demand for high-class household = 924.3 KWh
Light2069600768.2
Fan60314,4008115.2
Middle-class Computer12019600438.4
household80TV11018800435.2
Refrigerator250120,00024480
Iron750160,0000.530
Total load demand for middle-class household = 767 KWh
Light2025600739.2
Low-class household140Fan6018400650.4
TV110115,400461.6
Total load demand for low-class household = 151.2 KWh
Public and Commercial Load
Light201664010.64
School2Fan6025300039
Computer110122030.66
Water pump780115600.50.78
Total load demand for school = 11.8 KWh
Light201020061.2
Fan601060070.42
Health center1Computer110111020.22
Lab equipment11001110055.5
Refrigerator2501250246
Water pump780178021.56
Others200120040.8
Total load demand for health center = 15.7 KWh
Light2044800828.4
Commercial load
(markets)
60Fan60136001036
Refrigerator250115,00024360
Total load demand for commercial load (market) = 424.4 KWh
Deferrable Load
Streetlight Light8022017,60010176
Total load demand for deferrable load = 176 KWh
Battery-run auto-rickshaw Battery charging12005060,0003180
Total load demand for battery-run auto-rickshaw = 180 KWh
Overall load demand for autumn season = 2667.68 kWh
Table 3. Scenarios of load usage over the winter season.
Residential Load
Load TypeNo. of HouseholdsAppliance TypeRating (W)No. of AppliancesTotal Power (W)Run Time (h/day)Total Load (KWh)
Light201012,000784
Fan60414,40000
Computer12017200428.8
High-class TV11016600639.6
household60Rice cooker1000160,0002120
Refrigerator250115,00024360
Iron750145,0000.522.5
AC1000160,00000
Water pumps780146,8000.523.4
Total load demand for high-class household = 678.3 KWh
Light2069600768.2
Fan60314,40000
Middle-class Computer12019600438.4
household80TV11018800435.2
Refrigerator250120,00024480
Iron750160,0000.530
Total load demand for middle-class household = 651.8 KWh
Light2025600739.2
Low-class household140Fan601840000
TV110115,400461.6
Total load demand for low-class household = 100.8 KWh
Public and Commercial Load
Light201664010.64
School2Fan6025300000
Computer110122030.66
Water pump780115600.50.78
Total load demand for school = 2.08 KWh
Light201020061.2
Fan601060000
Health center1Computer110111020.22
Lab equipment11001110055.5
Refrigerator2501250246
Water pump780178021.56
Others200120040.8
Total load demand for health center = 15.28 KWh
Light2044800828.4
Commercial load
(markets)
60Fan601360000
Refrigerator250115,00024360
Total load demand for commercial load (market) = 388.4 KWh
Deferrable Load
Streetlight Light8022017,60010176
Total load demand for deferrable load = 176 KWh
Battery-run auto-rickshaw Battery charging12005060,0003180
Total load demand for battery-run auto-rickshaw = 180 KWh
Overall load demand for autumn season = 2152.66 kWh
Table 4. List of the installed equipment.
PV Hybrid StationSolar Photovoltaic SystemDiesel GensetBattery Bank
KWBrandKWBrandKWhBrand
Kuakata200IGOYE250, 160, 200Genesal300Kore
Table 5. Technical specifications for system parts.
EquipmentFactorValueEquipmentFactorValue
PV arrayRated power (kWp)200ConverterRated power (KW)200
Temperature coefficient (°C)−0.5Lifetime (years)15
Derating factor (%)80Rectifier efficiency (%)85
Operation temperature (°C)47Inverter efficiency (%)90
Lifetime (years)25
Efficiency (%)13
BatteryNominal voltage (V)100Diesel generatorsRated power (KW)250, 160, 200
Nominal capacity (kwh)50Load minimum ratio (%)25
Round trip efficiency (%)72Minimum running hour (h)30,000
Maximum charge current (A)150Lifetime (hours)60,000
Maximum discharge current (A)300
Lifetime (years)30
Table 6. The price and further details about the system’s components [45,46,47].
ComponentsCapital (USD)Replacement (USD)Operation and Maintenance CostsLifetimeSuppliers
PV panel900/kW900/kW10 USD/year25 yearsIGOYE Solar Co., Yangzhou, China
Diesel generators700/kW650/kW0.03 USD per op. hour60,000 hGenesal Energy, Bergondo, Spain
Storage (battery)400/kW400/kW5 USD/year30 yearsKore Power, Coeur dAlene, ID, USA
Converter600/kW550/kW10 USD/year15 yearsMornsun, Guangzhou, China
Table 7. System operation behaviors.
ComponentRated Capacity (KW)Production (%)Running Hours (h/yr)Fuel Consumption (L/yr)
Freestanding diesel generator
G132040.608752222,143
G232022.704984125,068
G320036.708760202,938
Total84010022,496550,149
Existing hybrid PV/DG (without storage)
PV array35046.5--
G132027.15699143,043
G220026.48751158,242
Total87010014,450301,285
Optimized hybrid PV/DG/battery
PV array20061.79--
G125012.13463951,729
G216011.51318043,889
G320014.57524681,366
Total81010013,065176,984
100% PV system and batteries
Rated capacity (KW)Total production (kwh/yr)Hours of operation (h/yr)
PV4001,171,2857892
Table 8. Economics summary of existing, optimized, and hypothetical scenarios.
SiteSystem DescriptionNPC (USD)Operational Cost (USD)LCOE (USD)LPSP
KuakataStandalone DG (0% RE)9.56 M724,7070.6750.09%
Existing hybrid PV/DG7.13 M402,0980.500.07%
Optimized Hybrid PV/DG/battery5.19 M3967.320.3670.01%
PV/battery (100% RE)8.14 M1147.960.5750.007%
Table 9. Overall systems cost summary.
SiteDescriptionCost
CapitalReplacementFuelOperation and MaintenanceSalvage
Standalone DG (0% RE)USD 193,200USD 135,790.70USD 92,456,580.80USD 8724.52USD 21,513.36
KuakataExisting hybrid PV/DGUSD 1,869,423.31USD 167,149.94USD 5,063,322.71USD 5977.72USD 38,318.13
Optimized hybrid PV/DG/batteryUSD 1,771,571.97USD 143,796.23USD 3,302,834.65USD 3967.32USD 31,510.20
PV/battery (100% RE)USD 7,010,370.68USD 1,579,344.67USD 0.00USD 1147.96USD 428,718.11
Table 10. Harmful system pollutant emissions.
SiteDescriptionEmissions (kg/yr)
Carbon DioxideCarbon MonoxideUnburned HydrocarbonsParticular MatterSulfur DioxideNitrogen Oxide
KuakataStandalone DG (0% RE)914,124203111111722536332
Existing hybrid PV/DG459,762197911311311252643
Optimized hybrid PV/DG/battery419,8493800614.87229920
PV/battery (100% RE)No emissions
Table 11. Comparison between the proposed and other available systems in the literature.
Hybrid SystemsCountryPower Consumption (kWh/day)Peak Load (kW)Initial Cost (USD)COE
(USD/kwh)
NPC
(USD)
O and M (USD)
PV/DG/Grid/battery [26]Turkey25,110.321888.401.69 M0.5206.70 M387,830
Wind/DG/battery [29]Algeria7,520,0003219.6410.2 M0.45529.9 M823,477
Wind/DG/battery [33]China40,5722536.671.17 M0.47113.1 M507,866
PV/DG/battery (proposed system)Bangladesh3000501.611.77 M0.3675.19 M3967.32
Disclaimer/Publisher’s Note: The statements, opinions and data contained in all publications are solely those of the individual author(s) and contributor(s) and not of MDPI and/or the editor(s). MDPI and/or the editor(s) disclaim responsibility for any injury to people or property resulting from any ideas, methods, instructions or products referred to in the content.

