Article

Field Trial Evaluation of a Hybrid Heat Pump in an Existing Multi-Family House before and after Renovation

1
Chair of Building Energy Systems and Heat Supply, Technical University of Dresden, 01062 Dresden, Germany
2
Bosch Thermotechnik GmbH, 35457 Lollar, Germany
3
Fraunhofer Institute of Solar Energy Systems ISE, 79110 Freiburg, Germany
4
Faculty of Mechanical Engineering and Mechatronics, Karlsruhe University of Applied Sciences, 76133 Karlsruhe, Germany
*
Author to whom correspondence should be addressed.
Energies 2024, 17(6), 1502; https://doi.org/10.3390/en17061502
Submission received: 4 February 2024 / Revised: 26 February 2024 / Accepted: 12 March 2024 / Published: 21 March 2024
(This article belongs to the Special Issue Advances in Energy-Efficient Buildings II)

Abstract

:
Renovation of existing buildings is fundamental to reduce greenhouse gas emissions of the building sector and to ensure the efficient operation of renewable heating systems. In multi-family houses, the suitability of heat pumps is limited by high required temperatures for the hot water preparation, which can be mitigated by hybrid heat pump systems. In this study, the energetic performance of a hybrid heat pump in a multi-family house, built in 1964, is investigated based on field data before and after a renovation. Multiple months are measured and mapped to a full year period. The combination of different renovation measures in the heating system and building envelope is rated w.r.t. their ecological and economical impact by taking into account the actual investment costs. The evaluation shows that the installation of a hybrid heat pump can achieve an accumulated greenhouse gas emissions reduction of 45%, which is similar to a building renovation to a new-build standard, which reduces the space heating demand by up to 62%. Nevertheless, only a combination of both measures can substantially reduce the emissions, which in this case are 81% lower compared to a gas boiler in 1990, which is still below the German climate target for 2040. Due to the low investment costs of a hybrid heat pump system, tenants are more likely to profit from a renting costs reduction, while a building renovation is especially economically beneficial at high energy prices. The results therefore emphasize that the insulation level should be selected carefully, as heat pumps already prepare space heating efficiently and that the heat pump must be able to support the hot water preparation to reach high emission reduction targets.

1. Introduction

1.1. Motivation

The residential and commercial building stock is responsible for 36% of the greenhouse gas emissions of the European Union and consumes 40% of its final energy [1]. Roughly two-thirds of the inhabited floor area is provided by buildings which were built before 1981 with a high heat demand [2], which is mainly covered by fossil fuels [3]. With its Climate Target Plan 2030, the European Union aims for an emissions reduction of 60% in the building sector by 2030 compared to 2015 [4]. The modernization of the energy supply systems is part of the renovation wave strategy [3].
As this situation also applies to the German building stock, the German government aims for a 68% reduction until 2030 compared to 1990 and a total emissions reduction of 88% until 2040 [5].
The relevance of the decarbonization of the building stock is also emphasized in recent scientific research, as summarized by the reviews of Boeck et al. [6] and Hamid et al. [7]. A large number of studies use building energy simulations to investigate the impact of either building envelope improvements, changing of the heating system or a combination of both. A comprehensive overview of the resulting life cycle costs and primary energy consumption of different insulation levels and heating systems in seven climatic clusters of Europe is presented by Fedrizzi et al. [8]. The study highlights the benefits of applying heat pump systems in terms of primary energy savings and life cycle costs in all climates after a renovation. A different approach is provided by Morck et al. [9] in which real-life renovation examples in various European countries are evaluated. The overview emphasizes that the standardization of renovation solutions on a European level is questionable due to different boundary conditions in the respective countries. This also becomes evident in the focus on different heating systems, which are investigated in the aforementioned reviews.
Within the German context, the findings of Walberg et al. [10] emphasize that the energy demand of buildings after renovation should be limited to around 115% of a new build level to avoid too high modernization costs, which could instead be used for a decarbonization of the heat supply system. Air source heat pumps (ASHPs) are already the predominant solution in new-build houses [11] but have a small share in existing multi-family houses, which provide more than half of the apartments in Germany [12]. Besides high investment costs and restricted heat source availability in urban spaces, the high required flow temperatures for a hygienic domestic hot water (DHW) preparation are a barrier, as elaborated by Kropp et al. [13]. Hybrid heat pumps [14] are therefore considered a possible solution to compensate the limitations of typical air–water heat pump systems, while providing redundancy and operation flexibility with similar CO2 emission reductions and life cycle costs as monoenergetic heat pump systems [15].

1.2. Objectives

As highlighted by the reviews of De Boeck et al. [6] and Hamid et al. [7], many studies investigate the impact of envelope and heating system renovations, while only a few put a focus on heat pumps in the existing German building stock.
Günther et al. [16] evaluate the operation characteristics of air and ground source heat pumps in 56 existing, mainly 1 and 2 family, houses in Germany. The study’s findings emphasize the high dependency of the heat pump SCOP on the specific space heating (SH) demand and corresponding flow temperatures, while no correlation to the building age is found. The large variation in SH flow temperatures in the observed buildings and the SCOP of the air heat pump systems leads to potential CO2,eq emission reductions of between 19 and 56% compared to a boiler system in 2018. The evaluation of 10 bivalent heat pump systems shows that a majority of the heat pumps contributes to the DHW preparation and reach shares between 39 and 100%.
Lämmle et al. [17] derive the linear dependency of the heat pump SCOP on a novel annual energy weighted condenser temperature. On the example of the envelope renovation of two existing multi-family houses, the impact of a reduction in the heating design temperatures on this indicator is demonstrated. Furthermore, the study investigates the exchange of single critical radiators, since not all rooms equally profit from an envelope renovation. The findings emphasize that in one case an exchange of only 7% of the radiators allows a reduction in design temperatures by the same level as the building renovation and results in additional electricity savings of 40%. Nevertheless, the study highlights that the potential is highly dependent on the original sizing of each system and a room wise heat load calculation is required.
The exchange of an existing boiler system with a bivalent heat pump system in an unrneovated small multi-family house in Germany is investigated based on field test data and simulations by Neubert et al. [18]. The findings highlight that the operation and hydraulic configuration of heat pump systems should be monitored carefully since the simulated low invasive corrections of a defect SH non-return valve and the reduction in the SH design flow temperatures result in operation cost reductions of up to 7%. The study additionally emphasizes that the installation of a small heat pump, which only covers 20% of the building design load, can already provide up to 74% of the SH demand, while reducing the CO2,eq emissions by 22%.
In the work of Kropp et al. [13], four different DHW configurations for monoenergetic heat pump systems in a multi-family house are simulated. The study emphasizes both the importance of the hydraulic configuration and the reduction in the DHW storage temperatures to achieve significant heat pump shares and efficiencies. Compared to a DHW storage with an inner coil, a heating water storage with a central plate heat exchanger can already increase the heat pump SCOP for DHW from 1.5 to 2.0, since the limited coil heat transfer area is mitigated. The highest performance, with a SCOP of 3.2, is achieved by either using a decentral plate heat exchanger for each flat or filtrating the DHW water, so that supply temperatures can be reduced to 55 °C and a heat pump contribution for DHW of nearly 100% is achieved.
Braeuer et al. [15] investigate the combination of monoenergetic and bivalent air and ground source heat pump systems in existing small, medium and large German multi-family houses with different envelope renovation packages. The renovation scenarios are compared w.r.t. their impact on the accumulated CO2,eq emission reductions, net present value and the potential rent increase of the tenant due to German legislation, which allows an amortization of the landlord’s investments, as described in Section 2.5.2. The study shows that in around half of the investigated cases, a rent reduction for the tenant can be reached, while the amortization period for the landlord is even at a 0% interest rate above 10 years. The findings therefore quantify the conflict of interest between tenant and landlord in multi-family houses and emphasize that the economically beneficial solution for both actors is not easily achievable. The study’s findings once more point out that bivalent heat pump systems and the renovation of windows and facade are the most cost-efficient renovation measures.
A related study is conducted by Vollmer et al. [19] in which they coupled a particle swarm optimization algorithm with a dynamic building simulation to identify optimal renovation roadmaps in multi-family houses. The results are similar to the findings in Braeuer et al. [15], as they identify a combination of building envelope and heating system renovation with heat pumps as the most relevant option to achieve significant CO2,eq emission reductions. Furthermore, the study emphasizes that the usage of a ground source bivalent heat pump is more efficient in terms of cost and emissions reduction compared to a major envelope refurbishment.
Walberg et al. [10] analyse renovation perspectives of the German residential building stock to achieve the climate targets under consideration of modernization efficiencies and costs. The analysis is based on actual renovations in 13.100 buildings and specific renovation costs for various energetic target states are derived. The study highlights that a reduction in the primary energy demand below a level of 115% in multi-family houses, compared to the legal requirements, is disadvantageous in terms of costs. The study points out that the saved investment costs in the building envelope should be used to decarbonize the heat supply system, as significant CO2,eq emission reductions of more than 88% can only be achieved by a combination of envelope renovation and low carbon heat supply systems.
To the authors’ knowledge, no study investigates the combined heating and envelope renovation of German multi-family houses based on field data. The novelty of this work is, therefore, to analyse the CO2,eq emission reductions and the economic impact of a hybrid heat pump system compared to a calculated boiler system, based on high-resolution measurement data of a small multi-family house before and after an envelope renovation. The analysis of the original measurement periods provides a detailed insight into influences on the heat pump efficiency, which can raise awareness for possible loss channels when designing and operating a heat pump. Since the measurement data originate from different time periods, a full year reference period is obtained by interpolation in Section 2.4.2. These annual consumption and generation data are used to calculate the CO2,eq emission reductions compared to a non-condensing boiler system in 1990, as this year serves as a reference for German emission reduction policies. By taking into account a CO2,eq emissions reduction path of natural gas and electricity, this comparison highlights to what extent the conducted measures are suitable to fulfil the targets until 2040. This analysis is complemented by comparing the accumulated emissions of the scenarios in a 25-year period.
The economic impact of the renovation measures is assessed by the Net Present Value (NPV) and is put into relation to the literature to give an indication of whether decisions based on reference values would be consistent to the findings in other theoretical studies. Lastly, the comparison of CO2,eq abatement costs and tenant rent change, with and without subsidies, provides insights into the stakeholder dependency of the renovation benefit.

2. Materials and Methods

2.1. Renovation Scenarios

This study uses measurement data of a hybrid heat pump system in an unrenovated (1hyb) and renovated building (2hyb), as displayed in Figure 1.
The measured consumption and generation data in both states are interpolated on a common reference period from 22.05.2021 to 21.05.2022, as described in Section 2.4.2. Annual data of a condensing boiler system (1b,2b) and a non-condensing boiler system (1b-nc) in 1990, as reference scenarios, are calculated with the methodology in Section 2.4.4. The obtained annual data are applied on a 25-year period, starting in 2021, to compare the energetic and economic performance, which also considers replacement investments, as displayed in Figure 2.
The expected time of use for heating system components is derived from the VDI 2067 [20] and for building elements from the German Federal Ministry for Housing, Urban Development and Building (BMWSB) [21]. For the scenarios of the unrenovated state (1b,1hyb), a renovation is assumed at the start of the period, which does not alter the heat loss coefficients compared to the unrenovated state in Table 1. The renovation is assumed to maintain the value of the property, as the envelope elements are at their expected end of use in 2021. This procedure is not in accordance to German building legislation but serves as a theoretical baseline if no energy efficiency measures would be required. In this case, only the business-as-usual (BAU) costs of a renovation are applied.

2.2. Building and Location

The field trial building, displayed in Figure 3, is located in the post code area 08626 of Germany. The design outdoor temperature of the climatic zone, according to the DIN EN 12831-1, is −14.7 °C [22]. With respect to German climate, the location is considered cold [18].
General building data, as well as the estimated heat loss coefficients before and after the renovation, are provided in Table 1. The heat loss for transmission and ventilation, without radiation or internal gains, is calculated with the simplified approach of the DIN EN 12831-1 [23] at the stated design outdoor temperature and a design room temperature of 20 °C. The calculated transmission losses of the building are at a level of 89% of German legal requirement GEG [24], which applies for new buildings and larger renovations. Since the top floor and ground floor level are not renovated, the heat loss coefficients in grey do not apply. The new building facade incorporates a decentralized ventilation system, which was not in operation during the monitoring period.
Table 1. Field trial building data.
PropertyValue
Window and door area A window [m2]61
Useable building area A build , use [m2] [25]311
Living area A build , living [m2]283
Facade area without windows and door A facade [m2]329
Roof area A roof [m2]190
beforeafterlegal
renovationrenovationrequirement GEG
Number of inhabited flats4 of 55 of 5
Heat loss coeff. exterior wall [W/(m2K)]1.400.160.24
Insulation thickness facade s ins , facade  1 [m]00.2
Heat loss coeff. roof [W/(m2K)]1.400.120.24
Insulation thickness roof s ins , roof [m]00.3
Heat loss coeff. top floor [W/(m2K)]1.001.000.24 (n.a.)
Heat loss coeff. ground floor [W/(m2K)]0.560.560.30 (n.a.)
Heat loss coeff. windows [W/(m2K)]1.900.851.10
Air exchange rate [h−1]0.340.34
Heat load, transmission [kW]24.210.111.4
Heat load, ventilation [kW]2.72.72.7
Total heat load [kW]27.012.814.2
1  λ ins = 0.035 W/(mK).

2.3. Heat Generation System and Settings

The heat generation system consists of a 27.5 kW gas condensing boiler and an 8.4 kW (A-7/W35) air–water heat pump. The heat pump is coupled to the return of the boiler via a low-loss header, which results in a serial connection, as shown in Figure 4. The hybrid operation strategy during the monitored periods aims for a minimization of the CO2 equivalent emissions. In case of an insufficient flow temperature at the heat pump outlet, the boiler assists.
In Section 3.1.3, different efficiency boundaries are compared to quantify the impact of loss channels. S C O P 1 in Equation (2) considers the provided heat Q th , sh , hp * without defrosts and the used electrical energy W el , sh , hp * of the compressor W el , sh , hp , comp , fan W el , sh , hp , fan and controller W el , sh , hp , ctrl only during SH operation with active compressor operation (marked with *).
W el , sh , hp = W el , sh , hp , comp + W el , sh , hp , fan + W el , sh , hp , ctrl
S C O P 1 = Q th , sh , hp * W el , sh , hp *
S C O P defrost additionally considers used thermal Q th , defrost , hp and electrical W el , defrost , hp energy during defrosting cycles in Equation (3).
S C O P defrost = Q th , sh , hp * + Q th , defrost , hp W el , sh , hp * + W el , defrost , hp
S C O P 2 extends this boundary in Equation (4) by operation states without compressor operation, such as thermal Q th , dhw , hp and electrical W el , dhw , hp energy during DHW preparation.
S C O P 2 = Q th , sh , hp + Q th , defrost , hp + Q th , dhw , hp W el , sh , hp + W el , defrost , hp + W el , dhw , hp
The stated efficiency of the heat pump in this study refers to the system boundary S C O P 3 , which is calculated by Equation (5), and additionally considers the electrical energy consumption W el , P 1 of the pump P1, as displayed in Figure 4.
S C O P 3 = Q th , sh , hp + Q th , defrost , hp + Q th , dhw , hp W el , sh , hp + W el , defrost , hp + W el , dhw , hp + W el , P 1
The DHW demand is supplied by a 277 L single-coil storage. Since the DHW piping contains more than 3 L, the outlet temperature of the DHW storage has to stay above 60 °C according to the German regulation DVGW 551 [26]. The SH emission system was not changed during the renovation and consists of panel radiators. The flow temperature control is based on a weather compensation control (WCC) with a set point of 76 °C at the design point in the unrenovated state.
Due to the expected decrease in the design heat load to 47%, the design flow temperatures can be reduced, as discussed by Lämmle et al. [17] and displayed in Figure 5. A theoretical design temperature set point of 51 °C was initially applied but tenants reported a reduced thermal comfort. Therefore, a supply water temperature set point of 57 °C is used in the evaluation period.
The building design heat loads, based on Table 1, and flow temperatures are displayed before and after the renovation in Figure 5.
The minimal and maximal thermal output of the heat pump is derived from a simulation model in the work of Neubert et al. [18] and shows a decrease in the bivalent point from 4 °C to −5 °C. The maximum heat pump capacity at both design conditions is 5.0 kW, as the maximum flow temperature is 55 °C. The maximum heat pump capacity Q ˙ th , hp , max and the design heat load of the building Φ design are applied in Equation (6) to determine the performance share for space heating ξ sh , which is used to estimate the coverage of the heat pump by the VDI 4650 [27]
ξ sh = Q ˙ th , hp , max Φ design

2.4. Measurement Data Processing

2.4.1. Data Acquisition

The evaluation uses data with a 30 s resolution of the displayed quantities in Figure 4. The measurement equipment is described in Neubert et al. [18].

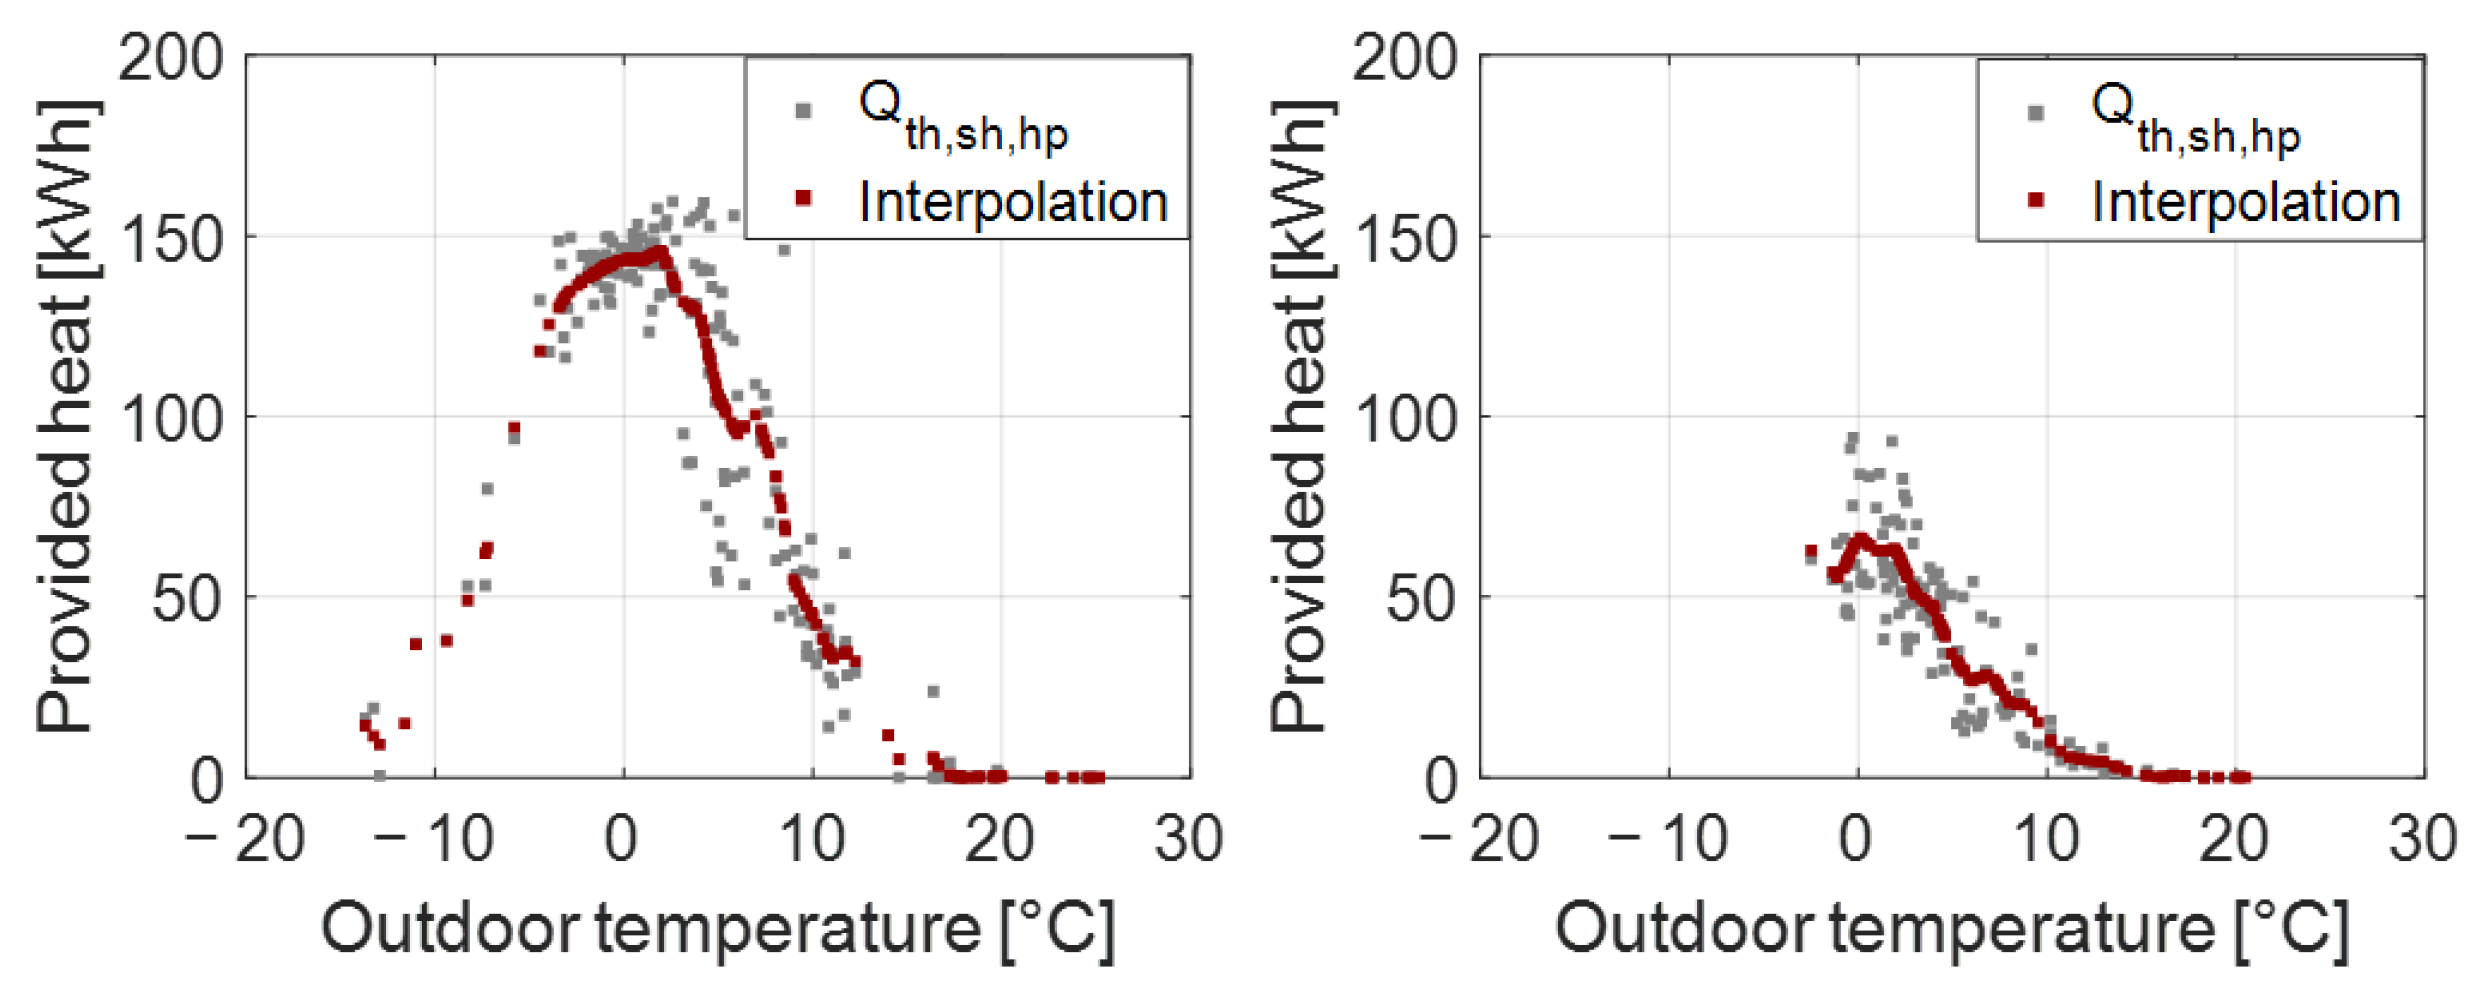
2.4.2. Interpolation onto a Common Reference Period

To allow a comparison of the energetic performance of the renovation scenarios, the measured provided, consumed and used energy is interpolated based on the outdoor air temperature to a reference period, which is displayed in Figure 1. These quantities contain the provided heat and consumed gas of the boiler Q th , dhw , b , Q th , sh , b , Q gas , dhw , b , Q gas , sh , b and of the heat pump Q th , dhw , hp , Q th , sh , hp , W el , hp . All auxiliary electrical consumers W el , aux , such as pumps and the boiler control unit, are combined. The transferred heat to the SH distribution system Q sh , used and to the domestic hot water tank Q dhw , used are accounted for as used heat. Additionally, the heat Q th , sh , rev is calculated when a reversed flow in the SH circuit occurs due to the defect non-return valve.
The selected reference period is slightly colder acc. to a long-term analysis of the local climate. The respective outdoor temperature distribution of the periods is displayed in Figure 6 and shows that the unrenovated state covers the total outdoor temperature range of the reference period and no extrapolation in terms of temperatures is necessary.
The monitored period of the renovated building shows an uncovered range of temperatures above 25 °C. These uncovered higher ambient temperatures are above the heating limit temperature and no different behaviour due to extrapolation is expected. The comparison of the daily provided heat of the heat pump before and after the renovation is displayed in Figure 7 with the respective interpolated values.
The comparison of the provided heat for SH by the boiler in Figure 8 indicates a bivalent point at 4 °C before the renovation. After the renovation, the heat pump can cover the SH demand without boiler support.

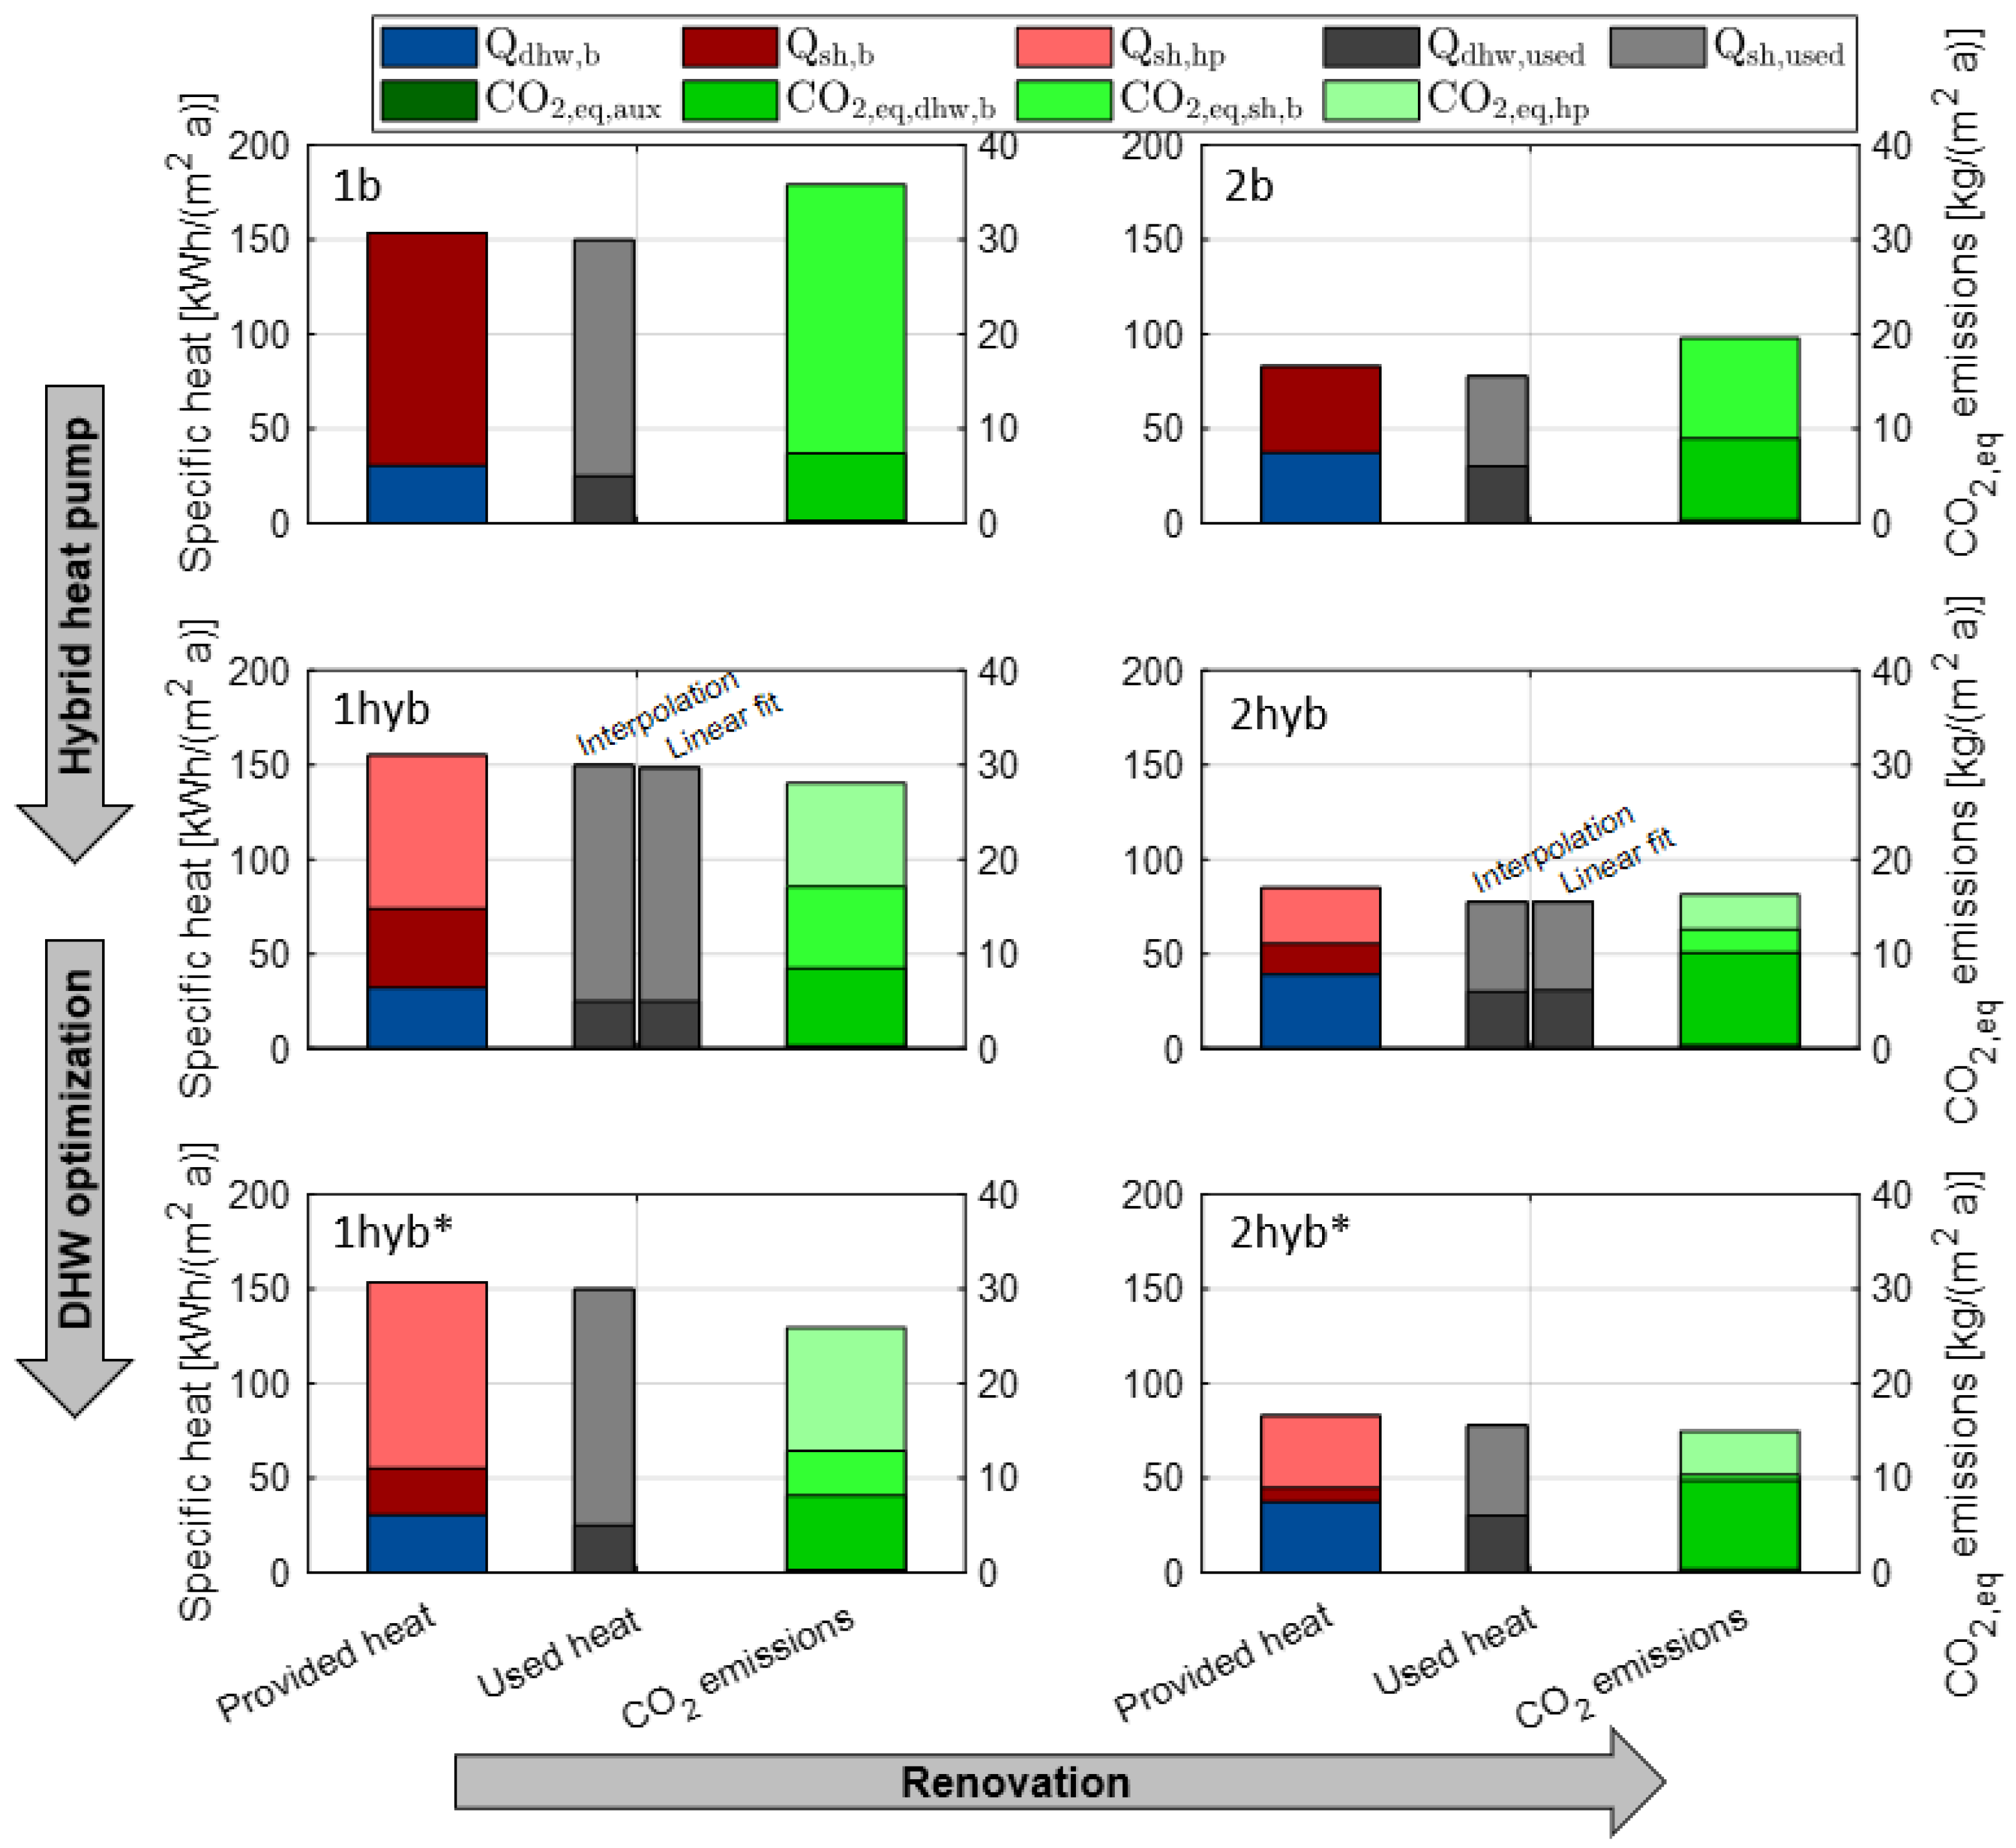
2.4.3. Linear Fit of Used Energy

In addition to the interpolated values, the used energy for space heating Q sh , used and domestic hot water Q dhw , used is calculated by linear models. This approach allows a comparison of both methods in Section 3.2.
The space heating demand of the building is calculated as a function of the daily mean outdoor air temperature T ¯ air , day in Equation (7). The resulting fit is displayed in Figure 10 with the coefficients in Table 4.
ϕ day = x 1 + x 2 · T ¯ air , day
The weekly transferred heat to the DHW storage is fitted linearly to the outdoor temperature T ¯ air , week , as described in Equation (8) and is displayed in Figure 11.
Q dhw , stor , week = x 1 + x 2 · T ¯ air , week

2.4.4. Calculation of the Boiler Scenario

The provided heat for SH of a condensing boiler system (1b,2b) and a non-condensing boiler system (1b-nc), as a baseline scenario in 1990, is calculated by adding the measured provided heat of heat pump and boiler. The consumed gas energy is calculated with a constant efficiency of 76% for the non-condensing boiler and 86% for the condensing boiler [28]. For the DHW preparation, the provided heat of the boiler is used, as the boiler completely serves the DHW preparation.

2.4.5. Calculation of Improved DHW Preparation

As highlighted in Figure 4, the SH non-return valve is defective and leads to a reversed flow in the SH circuit during DHW operation. Furthermore, water is circulated in the HP circuit during the DHW operation, although the heat pump cannot contribute to this demand and heat losses occur. Both effects are corrected by calculation to obtain scenarios 1hyb* and 2hyb*. The transferred heat to the SH system due to the reversed flow Q th , sh , rev is deducted from the provided heat of the boiler Q th , sh , b . This heat is proportionally accounted for by the SH operation of the heat pump and the boiler being below the bivalent point. Above the bivalent point, the heat is accounted completely for by the heat pump. For the heat pump, the daily S C O P d e f r o s t without DHW standby losses is used to calculate the corresponding electrical consumption, whereas the gas consumption is calculated with the efficiency of the total period. Additionally, the heat losses in the heat pump circuit during the DHW preparation Q th , dhw , hp are eliminated and deducted from the provided heat of the boiler during DHW Q th , dhw , b .

2.5. Economical and Ecological Evaluation of Renovation Measures

This study aims to compare the economical and ecological impact of the renewal of the heating system and the building envelope. For this purpose, the net present value (NPV) is calculated for a total period of 25 years, starting in 2021 until 2045. While the initial investment costs can be decisive for the choice of a renovation path and the source of funding [29], the net present value allows us to consider running costs over a certain period. The ecological impact is calculated based on the relative emissions compared to a baseline scenario in 1990 and the total emissions of the heating system during the 25-year period.

2.5.1. Net Present Value

The N P V is used to calculate the discounted costs and income from an investment over a period τ according to Equation (9) [15] w.r.t. inflation r and interest rate q. As no income is generated by the heating system, all N P V are negative. For better readability, the analysis in Section 3.4 displays the N P V with the unit -/m2. The calculation considers the initial investment I 0 , replacement costs C rep , maintenance costs C maint , the remaining value at the end of the period R V of a component c and the energy costs C en of the energy carrier y.
N P V = c = 1 c = z component I 0 , c C rep , c C maint , c + R V c + y = 1 y = z energy C en , y

Investment Costs

The investment costs are calculated by cost functions and are displayed in Table 2. Since the coefficients relate to the first quarter of 2015 [30] and 2020 [15], they are converted to the level of the renovation in the third quarter of 2021 by using the average construction price change [31].
The cost functions include a 19% value-added tax and also consider installation costs for heating system components. The field trial costs are separated in business-as-usual (BAU) costs and energy-related additional (ERA) costs according to the definition in the respective cost function literature. BAU costs occur anyway as components need to be replaced when their time of use is exceeded but do not consider an improvement of the energetic quality above a minimal required level. In opposite, ERA costs are the additional costs for an energy efficiency modernization. Similar to Hinz [30], the gas boiler system and two glazed windows are considered as a minimum available standard on the market, while insulation and heat pump systems are energetic modernizations. In Germany, the differentiation can be relevant, as a maximum of 8% of the initial investment costs can be levied in rental houses to allow an amortization of the investment. This applies if the investment is used for an energetic modernization of the property as elaborated by Braeuer et al. [15] and is limited to a maximum of 2 to 3 EUR/m2 per month [32].
To rate the impact of subsidies for renovation measures in Section 3.4, the funding conditions with effect from 01.01.2023 are applied. For the hybrid heat pump system, only the heat pump part is eligible for funding with 25% [33]. For building envelope renovations, a subsidy of up to 20% can be applied if a professional renovation consultation has been conducted [34]. The funding is also applied for all envelope BAU costs, as these are considered as required preparatory work.

Replacement and Remaining Value

Since the time of use τ use is below the total observed period, an investment for each replacement i is calculated by Equation (10). The interest rate q is assumed with 7.5% [15] and the price increase with 2% in accordance to the target of the European Central Bank.
C rep , c = i = 1 i = z rep I 0 , c , BAU + I 0 , c , ERA · r i · τ use , c q i · τ use , c
The remaining value of the components at the end of the period τ is calculated by Equation (11) and assumes a linear loss of value over the time of use w.r.t. the ith replacement investment [20].
R V c = I 0 , c · r i · τ use , c · i + 1 · τ use , c τ τ use , c · 1 q τ

Operation Costs

The costs due to operation result both from maintenance and inspection and from the energy consumption. The maintenance and inspection costs are calculated by Equation (12) for each year t with a fixed factor m of the investment costs in Table 2.
C maint , c = t = 1 t = τ m c · I 0 , c , BAU + I 0 , c , ERA · r t q t
The operation costs of all final energies y are calculated by Equation (13) for all years t. The energy prices p are derived in Section 2.5.4.
C e n , y = t = 1 t = τ Q y , t · p y , t · r t q t

2.5.2. Cost Differences for Landlord and Tenant

As the economic impact of a renovation is different for landlord and tenant, the NPV is insufficient to represent their perspectives. While the investment costs, and often also the maintenance costs, are payed by the landlord, the energy costs are partially split between both.
According to German legislation, the CO2-related costs of energy usage for SH and DHW preparation C en , CO 2 must be split between tenant and landlord in dependency of the specific CO2 emissions of the building [35], as shown in Equation (14). With the emission factors and prices in Section 2.5.4, the CO2-related costs of natural gas amount to 0.6 to 3.0 ct/kWh between 2020 and 2050. Consequently, if the building has specific emissions of, e.g., 30 kg/m2a, the tenants’ share β would amount to 60%.
C en , ten = C en C en , CO 2 · β
As explained in Section 2.5.1, the ERA costs of the investment can be levied to the tenant. The accumulated change of rent Δ C rent , 25 in the 25-year period is composed of the energy cost change, w.r.t. the unrenovated state C en , ten , 1 b and the investment related rent increase in Equation (15).
Δ C rent , 25 = C en , ten C en , ten , 1 b + t = 1 t = τ 0.08 · I 0 , ERA q t

2.5.3. CO2,eq Emissions

The accumulated equivalent CO2,eq,25 emissions of a system are calculated by Equation (16) for the period w.r.t. the usable building area A b u i l d , u s e and the emission factors e in Section 2.5.4.
C O 2 , eq , 25 = t = 1 t = τ Q g a s , t · e g a s , t + W e l , t · e e l , t A b u i l d , u s e

2.5.4. Energy Prices and Emission Factors

The comparison of the system energy costs uses prices of gas and electricity in Table 3 [15] for scenario C O P 1 of Wagner et al. [36], in which a CO2 price of 180 / t CO 2 is assumed. The household tariff for electricity in the study is converted to a heat pump tariff with a constant factor of 0.736 [15].
As energy prices in Germany increased sharply due to the European energy crisis in 2022, an alternative scenario is derived w.r.t. to energy prices in August 2022. A gas price of 17.8 ct/kWh is used for an annual consumption of 20,000 kWh [37]. The household electricity price for an annual consumption of 4000 kWh is 42.0 ct/kWh [38], which equals a heat pump tariff of 31.0 ct/kWh with the constant factor in Braeuer et al. [15]. These prices are used as basis for the starting year 2021 and the same absolute changes are applied, as displayed in Figure 9 with 25% steps for the sensitivity analysis in Section 3.4.3.
The CO2,eq emissions of electricity at the low voltage transfer grid and of gas w.r.t. the lower calorific value at the building level with a power to gas share are obtained from GEMIS version 5.0 [39].
Table 3. Specific emissions and prices of gas and electricity (LowEx).
Emissions
Natural Gas
g CO 2 , eq kWh gas
Emissions
Electricity
g CO 2 , eq kWh el
Price
Natural Gas
ct kWh gas
Price
Electricity
ct kWh el
1990 *267.1805.6--
2000256.8679.1--
2020222.9404.76.323.6
2030204.2194.711.318.7
2040194.9108.113.419.0
2050185.521.415.419.4
* The 16% decrease in direct CO2,eq emissions between 1990 and 2000 [40] is extrapolated onto the total emissions of GEMIS in 2000.

2.5.5. CO2,eq Abatement Costs

Abatement costs for building renovation measures are an additional indicator to rate the efficiency of the emission reduction [41]. In this work, the abatement costs C ab , CO 2 , 25 are calculated by Equation (17) w.r.t. to the boiler system in the unrenovated state (1b).
C ab , CO 2 , 25 = N P V N P V 1 b C O 2 , eq , 25 C O 2 , eq , 25 , 1 b

3. Results

The evaluation focuses on the behaviour during the actual monitored periods in a first step. In a second step, the performance in the reference period is investigated.

3.1. Performance in the Monitored Periods

An overview of the provided heat for SH and DHW, as well as the heat load of the building before and after renovation, is provided in Figure 10.
Despite the different duration and outdoor temperature distribution of the periods, as discussed in Section 2.4.2, some general conclusions can be derived for SH and DHW preparation, as well as the overall efficiency.

3.1.1. Space Heating

The daily mean heat load in both cases is visibly lower compared to the calculated design values in Table 1. This could be caused by the simplifications of the calculation procedure, which do not consider heat gains by occupancy and radiation. The obtained fit parameter for the daily heat load are shown in Table 4 and lead to design heat loads of 17.7 kW results for the unrenovated building and 6.1 kW for the renovated one at −14.7 °C.
Based on these design heat loads and the maximum heat pump capacity in Section 2.3, an actual performance share ξ s h of 28 and 82% can be obtained by Equation (6). The corresponding heat pump coverages for SH of 85% and 100% in the guideline VDI 4650 are not reached in the measured periods with 58% in the unrenovated state and 70% in the renovated state. The coverage of the heat pump for space heating α sh , hp is calculated w.r.t. the provided heat of the generators, as in the work of Günther et al. [16]. In the unrenovated state, the lower share mainly results from the high SH temperature set points, the very low outdoor temperatures and the defect non-return valve in the SH circuit [18], which is highlighted in Figure 4.
Although the lower flow temperatures in the renovated state improve the operation conditions of the heat pump, the DHW operation of the boiler becomes increasingly influential, especially since the non-return valve remains defect. Due to the WCC adjustment, the temperature difference between SH and DHW operation increases and the thermal inertia of the (floorstanding, high-volume) boiler and distribution system becomes more relevant. Figure 10 illustrates the effect as the boiler share for SH operation increases unexpectedly with rising outdoor temperatures, despite the fact that the boiler is almost never started to serve SH. The contribution of heat results solely from the boiler block, which is cooled down by the SH pump operation and lowers the potential for the heat pump operation.

3.1.2. Domestic Hot Water Preparation

The share of the provided heat for DHW of the total heat increases from 15% to 40% due to the renovation. This high share is partly caused by the constant operation of the circulation pump in the DHW distribution network in combination with the aforementioned thermal capacity of the generation system.
The comparison of the fit and the measured transferred heat to the DHW storage in Figure 11 shows a higher demand in the renovated state, which can be traced back to the occupancy of one additional flat.

3.1.3. Energy Efficiency

The main influences on the heat pump performance are the operation temperatures on the sink and source side, the compressor frequency and the energy uptake during defrosts.
The renovation with an adjustment of the WCC set point leads to a significant reduction in the mean flow temperature and, consequently, to an increase in the S C O P 1 , which is depicted in Figure 12. At similar outdoor temperatures, as in the period before the renovation, the S C O P 1 is 0.46 higher, as can be seen in Table 5.
The lower heat output of the heat pump after the renovation also leads to less ice accumulation and, therefore, a significant reduction in the number of defrosts. Nevertheless, the efficiency reduction due to the extracted heat and the used electrical energy during the defrosts ( S C O P defrost ) is similar before and after the renovation.
Another relevant influence on the efficiency after the renovation is the heat loss in the heat pump circuit in the standby mode. This results mainly from losses during the DHW preparation, at which high water temperatures enter the heat pump circuit and lead to a reduction of 0.17 in S C O P 2 .
The consideration of the electrical consumption of the supply pump P1 in S C O P 3 leads to a marginal reduction, which is slightly higher after the renovation.

3.2. Performance in the Reference Period

The interpolation of the provided and used heat for the two building renovation states and the two heat generation systems is displayed in Figure 13. Relevant performance indicators are displayed in Table 6 and also include the emissions of a condensing and non-condensing boiler with the emissions factors in 1990.

3.2.1. Status Quo

In the unrenovated state, the annual specific SH demand accounts to 125 kWh/(m2a) and is reduced by 62% to 47 kWh/(m2a) after the renovation.
The comparison of the interpolated used heat for SH and DHW with the linear fit shows only small differences in the order of 2% and the interpolation is therefore considered to create plausible data. In the following evaluation, only the interpolated values are used. The used energy for the DHW tank charge is 22% higher after the renovation, as described in Section 3.1.2, and accounts for 17% of the total annual heat demand in the unrenovated state and 39% in the renovated state. The total provided heat is 4% higher than the used heat in the unrenovated state and 9% higher in the renovated one, which can be linked to heat losses. The exact amount of all losses cannot be evaluated due to the accuracy of the used interpolation procedure. Nevertheless the obtained values seem plausible, as the heat pump circuit already causes losses during the DHW preparation of 1% in the unrenovated and 3% in the renovated state. Remaining losses could be linked to the boiler and the heat pump operation in SH mode.
Before the renovation (1hyb), the heat pump achieves a coverage of 66% of the building heat load, which is higher than during the monitored period due to the higher outdoor temperatures of the reference period. The reached coverage after the renovation (2hyb) is reduced to 65%, due to the impact of the non-return valve and the boiler capacity, as described in Section 3.1.1. The simulated fix of the non-return valve in the work of Neubert et al. [18] shows a reduction in the provided heat during DHW preparation by 33%. An investigation of the optimized DHW preparation is therefore conducted in a subsequent step.

3.2.2. Optimized DHW Preparation

The correction of the defect non-return valve and the heat losses during DHW preparation in the heat pump circuit, as described in Section 2.4.5, leads to a reduction in the provided boiler heat by 36% in the unrenovated state and 19% in the renovated state. As a consequence of the corrected reversed flow, the heat pump share is highly increased to 80% (1hyb*) and 83% (2hyb*) and furthermore the SCOP increases, as the impact of heat losses is reduced. The absolute reduction in CO2,eq emissions by the investigated measures is small, but the overall share of the fossil emissions is reduced, which is important within a further decarbonized electrical grid. The further investigation uses the improved DHW preparation.

3.3. Reduction of CO2,eq Emissions

The greenhouse gas emission reductions in the scenarios are compared to a baseline scenario in 1990 with a non-condensing boiler (1b-nc), as this year is the reference for the German climate targets. In a second step, the accumulated emissions of the 4 systems over the 25 year period are compared.

3.3.1. Comparison to 1990

The comparison in Figure 14 shows that the lower specific emissions factor of gas since 1990, due to lower indirect emissions and a small power to gas share, already decreases the emissions by 13%. Furthermore, if an efficient condensing boiler is used (1b), the emissions are 28% lower compared to the baseline scenario of 1990. If a hybrid heat pump is applied in this unrenovated state (1hyb*), an emission reduction of 48% is achieved. With the assumed specific emissions of gas and electricity in 2030, the emission reduction increases to 65%, which is marginally below the German emission reduction target of 68%. In 2040, the emissions would be 71% below the baseline of 1990.
If the building is renovated, the application of a gas condensing boiler (2b) can already reach an emission reduction of 63% compared to 1990. The additional usage of a heat pump (2hyb*) reduces the emissions only by an additional 10% in 2021 and fulfils the emission target for 2030. The small benefit of employing the heat pump is mainly caused by two effects. On the one hand, the specific emissions increase, as the DHW preparation is still conducted by the boiler and has an increased share of the total heat demand. On the other hand, is a part of the SH demand covered by the boiler during the DHW operation in this system. With the assumed emissions factors in 2030 and 2040, reductions of 78% and 81% can be achieved. With respect to a target reduction of 88% in 2040, the system therefore requires further measures to increase the heat pump share for DHW.

3.3.2. Accumulated CO2,eq Emissions

The single measures of scenario 1hyb* and 2b lead to comparable emission reductions of 45% and 46%, as shown in Figure 15. The combination of adding a hybrid heat pump and a renovation of the building envelope leads to emission reductions of 65% compared to a new gas boiler in an unrenovated building. Over the 25-year period, this reduction equals 167 t of CO2,eq.

3.4. Cost Analysis

3.4.1. Investment Costs

The calculated investment costs are compared with the actual investment costs of the field trial components in Figure 16 w.r.t. the useable building area of 311 m2 (detailed values in Table 7 and Table 8).
It is important to note that the energetically unrenovated states (1b,1hyb) already lead to high investment costs due to the fact that the building envelope has reached the end of the expected life time and a renovation would therefore occur anyway. Significant deviations w.r.t. the absolute value can be observed for the facade, roof, scaffold and heating system periphery and could be linked to multiple causes. In general, the BAU cost functions of these components have a small coefficient of determination in the original source, which is plausible due to the large variation in possible renovation actions within each component. Furthermore, it is important to note that the renovation measures have been conducted in the context of a publicly funded project in which a ventilation system has been integrated into the facade. Since this system was not in use during the monitoring period, related costs are deducted. Nevertheless, an uncertainty remains, which especially affects the facade.

3.4.2. Net Present Value

The NPV evaluation in Figure 17 uses the energy prices before the European energy crisis (LowEx) while detailed values for the cost components with subsidies and cost range are displayed in Table 9.
The results emphasize that almost all renovation scenarios lead to an increase in the NPV if subsidies are applicable. Since all measures also reduce the CO2,eq emissions, the abatement costs in these cases are therefore negative, as elaborated on in Section 3.4.3.
It can also be seen that the relative difference to the pure boiler scenario (1b) is nearly equal for the calculation and the field trial besides large absolute differences of the NPV. This is linked to the fact that the BAU costs are the main driver of the deviation, as explained in Section 2.5.1, and also applies for the baseline scenario (1b). Derived conclusions w.r.t. to the cost efficiency of the renovation measures based on calculated values would therefore coincide to a large extent with the actual values of the field test.

3.4.3. Rent Change and CO2,eq Abatement Costs

Since the NPV only focuses on a global cost efficiency of the renovation, the CO2,eq abatement costs and the rent change of the tenant are evaluated in a sensitivity analysis of energy prices. The actual field trial costs are applied.

CO2,eq Abatement Costs

The comparison of CO2,eq abatement costs in Figure 18 emphasizes that the hybrid heat pump in the unrenovated state (1hyb*) causes negative abatement costs, as long as gas prices are above the low level of the past years (LowEx). Due to the relatively small investment costs of the heat pump, the energy prices have a dominant effect irrespective of subsidies.
In contrast, the envelope renovation (2b) shows a high dependency on the availability of subsidies. While negative abatement costs are achieved in all price scenarios with subsidies, this is only the case with very high gas prices if no subsidies apply.
A combined heating system and envelope renovation results in a similar trend with a reduced influence of energy prices.

Rent Change

The impact of energy prices on the accumulated rent change is displayed in Figure 19.
As the rent change is an opportunity for the landlord to amortize the investment in the renovation, a negative value indicates a benefit for both tenant and landlord.
The usage of a heat pump (1hyb*) shows a similar trend for the rent change as for the abatement costs. This is mainly due to the fact that the complete investment costs of the heat pump are modernization costs and subsidies are therefore reducing the modernization impact on the tenant.
In contrast, the building renovation (2b) shows a different behavior when subsidies are applied. While the abatement costs are negative, which indicates a total potential for a cost neutral renovation, the rent could actually increase. This is caused by the fact that the subsidies for an envelope renovation not only apply for the ERA costs but also for the BAU costs, which are the majority of the investment. This indicates, that the high ERA investment costs are not compensated with energy cost reductions and that the 20% subsidies can only partially improve the situation.
The combination of building and heating system renovation (2hyb*) combines the properties of both scenarios. The impact of high gas and electricity prices becomes dampened through a lower total consumption. The results highlight that the economical benefit of applying a high efficiency heating system becomes reduced if the overall heat demand is reduced by the envelope renovation.

4. Discussion

The accumulated CO2,eq emission reduction demonstrates that the impact of installing a hybrid heat pump is equivalent to a building renovation to a new-build state. A significantly higher emission reduction of the heating system renovation could be expected if the heat pump is used for DHW preparation, which is the default for single family home residential buildings [16]. The simulated renovation of a medium multi-family house with the legally required insulation level (GEG) and bivalent heat pump leads to an accumulated emission reduction of 81% (scenario S4 A60b) [15]. While a direct comparison to the obtained 65% emission reduction in this study is not possible, due to differences in heat generator sizing and efficiency, it highlights an optimization potential for which the DHW preparation by the heat pump can be perceived as a relevant lever.
The comparison nevertheless confirms the aim of climate action policies, since a substantial emission reduction is only possible by combining both a building envelope renovation and the application of heat pump systems. The synergy of an envelope renovation and a heat pump system is also present in the observed increase of the heat pump efficiency due to the WCC set point reduction, which is in accordance with the findings in the literature [16,17].
Furthermore, the study highlights the importance of the DHW preparation. On the one hand, a fault in the system setup, such as a defect non-return valve, can lead to unnecessarily high temperatures in the distribution system, which lowers the reachable heat pump share for space heating and increases losses. On the other hand, even in normally operated systems, high DHW temperatures lead to a high boiler share. Even in a future nearly decarbonized electrical grid, the CO2,eq emission reduction potential is limited to 81% compared to 1990 and, therefore, fails to reach the reduction targets of the German government for 2040. Nevertheless, the usage of two sensor charging strategies in central DHW storages, as well as central or decentral plate heat exchanger with buffer storages can significantly increase the heat pump share for the DHW preparation [13]. To reach a compromise between comfort and emission reduction through the operation of hybrid heat pumps, further research is required.
The actual envelope investment costs of the field trial are high w.r.t. the literature’s cost functions [15,30]. The specific renovation costs of 940 EUR/ m living 2 are 29% higher compared to the E70 renovation scenario of Walberg et al. [10], which has a transmission loss level of 85% compared to a GEG reference building [24]. Since the investigation of a small multi-family house is at the lower range of multi-family houses, the specific costs are expected to be higher than the average multi-family house, as can be seen at much higher costs for one or two family houses in the work of Walberg et al. [10]. The results are therefore considered plausible to a large extended.
Although a direct comparison is not possible, due to differing building properties and time period, the calculated NPV of the envelope investment in this study is higher than the respective costs for a renovation to a passive house level in Braeuer et al. [15]. This could be linked to different used cost curves and results in a much higher share of investment costs to energy costs in this study, which potentially reduces the benefits for both tenant and landlord. It is also important to note that the ERA costs of the envelope renovation contribute to more than 30% of the total costs and can be influenced by the decision on the renovation depth.
The following conclusions can be derived in terms of cost efficiency.
1.
The cost efficiency of a building envelope renovation increases when approaching the end of the life time of the envelope elements, as the BAU costs occur at this point anyway.
2.
A renovation with lower heat loss coefficients than legislatively required will likely only reach cost efficiency if subsidies are granted, as these then apply to all ERA and the majority of BAU costs.
3.
Despite an overall economical efficiency of the envelope renovation with subsidies, the rent could still increase if the levied modernization costs are not compensated by the energy cost reduction.
4.
If cost efficiency for the project is only reached with subsidies, this means that costs are levied to the society and cost efficiency is not achieved globally.
5.
An overoptimization of the envelope insulation level could be present, as the space heating demand of 47 kWh/(m2a) is well below the determined optimum of 70 kWh/(m2a) in the work of Vollmer et al. [19] and is with 89% below the recommended transmission loss level in the work of Walberg et al. [10]. Since heat pumps can serve the SH demand efficiently, costs savings for the envelope could be invested in more efficient heat generation technologies.

Limitations

In this study, an interpolation of operation characteristics in dependency of the outdoor air temperature is used. Although the comparison of the used energy for SH and DHW with a linear fit shows only small deviations, larger deviations can arise from behaviour which is not directly coupled to the outdoor air temperature. During holiday periods, the DHW consumption would be expected to decrease significantly, while this behaviour might not be present in the original dataset if only few months have been recorded. Additionally, the outdoor air dependency of the energetic quantities is also less significant after the renovation and the interpolation has, therefore, a higher uncertainty.
The calculation of the boiler reference scenario is considered as a conservative estimation, as the boiler would be expected to have a higher efficiency without a return temperature increase by the heat pump. Nevertheless, the boiler efficiency shows in general only a small sensitivity. Since heat pump systems have a much higher dependency of their efficiency on operation conditions, a calculation of a monoenergetic heat pump system is not conducted in this study, although it is a relevant alternative to a hybrid system.
The investigated unrenovated scenarios for a further 25 years are theoretical cases, as the envelope of the field trial building has reached the end of its useful life and would need to be equipped with insulation by law. Nevertheless, the scenario highlights the need to carefully choose the required insulation level. A further investigation, which considers actual costs of renovations, a bigger range of heating technologies and the variety of envelope conditions, is required for an insight in required renovation paths for the building stock.
Furthermore, the forecast onto a 25-year period is subject to high uncertainties. While the impact of energy prices is varied in a sensitivity study, the uncertainty of the energy carrier specific emissions factor development is not considered. Furthermore, the evaluation does not consider impacts of the climate change on the heat demand, which could lower the space heating demand in the observed period and improve the heat pump efficiency [42].
The techno-economic comparison of building envelope and heating system renovation in this study does not quantify the positive impact of an envelope renovation on the thermal comfort due to less inhomogeneous room temperature distribution and the prevention of mould formation, which was present in the unrenovated state. Furthermore, the reduction of the heat demand through an envelope renovation also reduces the electrical grid load by the heat pump.

5. Conclusions

In this study, the measurement data of a hybrid heat pump system in a small multi-family house, before and after a renovation to a new built state, are evaluated. The operation characteristics are assessed in dependency of the outdoor temperature and are used for an interpolation in a one-year reference period. The results of the study highlight the importance of the DHW setup, as the high flow temperature set point and the applied storage system in combination with the low achievable temperature of the heat pump require the preparation solely by the boiler in this system. Due to the missing heat pump share for DHW, the achieved emission reduction by envelope and heating system renovation of 81%, compared to a non-condensing boiler in 1990, is insufficient to fulfill the German climate targets for 2040. Nevertheless, the combination of renovation measures, reduces the accumulated emissions in a 25-year period by 65% while the heat pump also benefits from a SCOP increase by 0.29 due to the lower space heating temperatures.
The comparison of the actual investment costs of the field trial with data in the literature indicates a high cost level of the former one. Therefore, this deep renovation is only cost effective, if subsidies are granted and a rent increase for tenants can occur in scenarios with a low to medium gas price level, despite the space heating demand reduction of 62%, if the landlord levies the investment costs.
Overall, the results show that the application of a hybrid heat pump is an immediate measure to significantly reduce the emissions with low investment costs, compared to a building renovation. Nevertheless, to fulfill future climate targets, the heat pump must be able to support the DHW preparation and an envelope renovation is mandatory, for which the required insulation level should be selected carefully to avoid an increase in rent for tenants.

Author Contributions

Conceptualization, D.N., C.G., A.M. and C.F.; funding acquisition, C.G., A.M. and C.B.; investigation, D.N. and J.W.; methodology, D.N.; project administration, C.G., A.M. and C.B.; resources, J.W.; software, D.N.; supervision, A.M. and C.F.; validation, D.N.; visualization, D.N.; writing—original draft, D.N. All authors have read and agreed to the published version of the manuscript.

Funding

The project “LowEx-Bestand”, on which this work is based, is funded by the German Federal Ministry for Economic Affairs and Climate Action, funding codes 03ET1377 B and 03SBE0001B.

Data Availability Statement

The data presented in this study are available upon request from the corresponding author with permission from the field test owner.

Conflicts of Interest

Daniel Neubert reports a relationship with Bosch Thermotechnik GmbH that includes employment. Christian Glueck reports a relationship with Bosch Thermotechnik GmbH during the time of the study that included employment. Armin Marko reports a relationship with Bosch Thermotechnik GmbH that includes employment.

Nomenclature

Abbreviations
ASHPair source heat pump
BAUbusiness as usual
DHWdomestic hot water
ERAenergy-related additional
SHspace heating
WCCweather compensation control
Symbols
Aaream2
acoefficient investment costs-
bcoefficient investment costs-
Ccosts
cindex component-
eend energy CO2 emission factorkg kWh−1
I 0 initial investment costs
iindex replacement-
mmaintenance and inspection factor-
m ˙ mass flowkg s−1
nrelative compressor speed-
N P V specific net present value€ m−2
penergy price€ kWh−1
Qheat/chemical energykWh
qinterest rate-
rinflation-
sthicknessm
R V remaining value
S C O P seasonal coefficient of performance-
Ttemperature°C
tindex timea
Welectrical energykWh
xcoefficient/variable-
y          index energy carrier-
zcounter-
α coverage share-
β CO2-related energy cost share of tenant-
η efficiency-
λ thermal conductivityW m−1K−1
Φ heat loadW
τ time perioda
ξ performance share-
Subscripts
ababatement
bboiler
buildbuilding
circcirculation
compcompressor
ctrlcontroller
elelectrical
enenergy
eqequivalent
hpheat pump
insinsulation
maintmaintenance
relrelative
repreplacement
revreverse
shspace heating
specspecific
storstorage
tentenant
ththermal
useuseable

References

  1. European Comission. Factsheet-Energy Performance of Buildings; European Comission: Brussels, Belgium, 2021; Available online: https://ec.europa.eu/commission/presscorner/detail/en/fs_21_6691 (accessed on 3 February 2024).
  2. Birchall, S.; Gustafsson, M.; Wallis, I.; Dipasquale, C.; Bellini, A.; Fedrizzi, R. Survey and simulation of energy use in the European building stock. In Proceedings of the CLIMA 2016, Aalborg, Denmark, 22–25 May 2016. [Google Scholar]
  3. European Comission. A Renovation Wave for Europe—Greening Our Buildings, Creating Jobs, Improving Lives; European Comission: Brussels, Belgium, 2020; Available online: https://eur-lex.europa.eu/legal-content/EN/TXT/?uri=CELEX%3A52020DC0662 (accessed on 3 February 2024).
  4. European Comission. Stepping up Europe’s 2030 Climate Ambition; European Comission: Brussels, Belgium, 2020; Available online: https://eur-lex.europa.eu/legal-content/EN/TXT/?uri=CELEX%3A52020DC0562 (accessed on 3 February 2024).
  5. Bundes-Klimaschutzgesetz (KSG). § 3. 2021. Available online: https://www.buzer.de/3_Klimaschutzgesetz.htm (accessed on 3 February 2024).
  6. De Boeck, L.; Verbeke, S.; Audenaert, A.; De Mesmaeker, L. Improving the energy performance of residential buildings: A literature review. Renew. Sustain. Energy Rev. 2015, 52, 960–975. [Google Scholar] [CrossRef]
  7. Abdul Hamid, A.; Farsäter, K.; Wahlström, Å.; Wallentén, P. Literature review on renovation of multifamily buildings in temperate climate conditions. Energy Build. 2018, 172, 414–431. [Google Scholar] [CrossRef]
  8. Fedrizzi, R.; Dipasquale, C.; Bellini, A. D6.5-Position Paper on Systemic Energy Renovation. 2016. Available online: http://inspirefp7.eu/wp-content/uploads/2017/01/WP6_D6.5_20161201_P1_Position-Paper-on-Systemic-Energy-Renovation.pdf (accessed on 15 May 2022).
  9. Mørck, O.; Almeida, M.; Ferreira, M.; Brito, N.; Thomsen, K.E.; Østergaard, I. Shining examples analysed within the EBC Annex 56 project. Energy Build. 2016, 127, 991–998. [Google Scholar] [CrossRef]
  10. Walberg, D.; Gniechwitz, T.; Paare, K.; Schulze, T. Die Zukunft des Bestandes. Studie zur Aktuellen Bewertung des Wohngebäudebestands in Deutschland und Seiner Potenziale, Modernisierungs- und Anpassungsfähigkeit; Technical Report Forschngsbericht Nr. 82; Arbeitsgemeinschaft für zeitgemäßes Bauen e.V.: Kiel, Germany, 2022; Available online: https://www.gdw.de/media/2022/02/studie-wohnungsbau-tag-2022-zukunft-des-bestandes.pdf (accessed on 3 February 2024). (In German)
  11. Bundesverband Wärmepumpe e.V. (BWP). Starkes Wachstum im Wärmepumpenmarkt. 2022. Available online: https://www.waermepumpe.de/presse/pressemitteilungen/details/starkes-wachstum-im-waermepumpenmarkt/#content (accessed on 2 March 2024). (In German).
  12. Statistisches Bundesamt. Bauen und Wohnen. Mikrozensus-Zusatzerhebung 2014. Bestand und Struktur der Wohneinheiten. Wohnsituation der Haushalte; Technical Report Heft 1; Statistisches Bundesamt: Wiesbaden, Germany, 2016. [Google Scholar]
  13. Kropp, M.; Hörnle, O.; Lämmle, M.; Wapler, J.; Hess, S. Einfluss der Trinkwarmwasser-Systemvariante auf die Performance von Wärmepumpen in Mehrfamilienhäusern. 2020. Available online: http://www.lowex-bestand.de/wp-content/uploads/2021/01/AA-IV-07-DKV-2020-Manuskript-Kropp.pdf (accessed on 3 February 2024). (In German).
  14. Association of the European Heating Industry (ehi). Hybrid Heat Pumps. Available online: https://ehi.eu/heating-technologies/hybrids-hybrid-heat-pumps/ (accessed on 22 February 2024).
  15. Braeuer, F.; Rodenbücher, B.; Scharf, K.; Vollmer, R.; Eberle, R.; Obid, M.; Wapler, J.; Bongs, C.; Schmidt, F.; Ruppert, M.; et al. Bericht zu AP 5: Techno-ökonomische und ökologische Analyse von Sanierungspaketen aus Gebäudehülle und LowEx-Systemen; Technical report; Fraunhofer-Institut für Solare Energiesysteme ISE: Freiburg, Germany, 2022. [Google Scholar]
  16. Günther, D.; Wapler, J.; Langner, R.; Helmling, S.; Miara, M.; Fischer, D.; Zimmermann, D.; Wolf, T.; Wille-Hausmann, B. Wärmepumpen in Bestandsgebäuden. Ergebnisse aus dem Forschungsprojekt “WP Smart im Bestand”; Technical Report; Fraunhofer-Institut für Solare Energiesysteme ISE: Freiburg, Germany, 2020. [Google Scholar]
  17. Lämmle, M.; Bongs, C.; Wapler, J.; Günther, D.; Hess, S.; Kropp, M.; Herkel, S. Performance of air and ground source heat pumps retrofitted to radiator heating systems and measures to reduce space heating temperatures in existing buildings. Energy 2022, 242, 122952. [Google Scholar] [CrossRef]
  18. Neubert, D.; Glück, C.; Schnitzius, J.; Marko, A.; Wapler, J.; Bongs, C.; Felsmann, C. Analysis of the Operation Characteristics of a Hybrid Heat Pump in an Existing Multifamily House Based on Field Test Data and Simulation. Energies 2022, 15, 5611. [Google Scholar] [CrossRef]
  19. Vollmer, R.; Lämmle, M.; Hess, S.; Henning, H.M. Optimization of energetic refurbishment roadmaps for multi-family buildings utilizing heat pumps. Energy Build. 2023, 280, 112729. [Google Scholar] [CrossRef]
  20. VDI-Gesellschaft Bauen und Gebäudetechnik (GBG). Economic Efficiency of Building Installations. Fundamentals and Economic Calculation Part 1; VDI 2067 Part 1; Verein Deutscher Ingenieure e.V.: Düsseldorf, Germany, 2021. [Google Scholar]
  21. Bundesministerium für Wohnen, Stadtentwicklung und Bauwesen (BMWSB). Nutzungsdauern von Bauteilen für Lebenszyklusanalysen nach Bewertungssystem Nachhaltiges Bauen (BNB). 2017. Available online: https://www.nachhaltigesbauen.de/fileadmin/pdf/Nutzungsdauer_Bauteile/BNB_Nutzungsdauern_von_Bauteilen_2017-02-24.pdf (accessed on 3 February 2024).
  22. German Institute for Standardization. DIN/TS 12831-1; Method for Calculation of the Room Heat Load—Part 1: National Addition to DIN EN 12831-1, with CD-ROM. Beuth Verlag GmbH: Berlin, Germany, 2020.
  23. German Institute for Standardization. DIN EN 12831-1; Energy Performance of Buildings—Method for Calculation of the Design Heat Load—Part 1: Space Heating Load, Module M3-3. Beuth Verlag GmbH: Berlin, Germany, 2017.
  24. Gesetz zur Einsparung von Energie und zur Nutzung erneuerbarer Energien zur Wärme- und Kälteerzeugung in Gebäuden* (Gebäudeenergiegesetz-GEG). § 48. 2023. Available online: https://www.buzer.de/48_GEG.htm (accessed on 3 February 2024).
  25. German Institute for Standardization. DIN EN 18599-1; Energy Efficiency of Buildings—Calculation of the Net, Final and Primary Energy Demand for Heating, Cooling, Ventilation, Domestic Hot Water and Lighting—Part 1: General Balancing Procedures, Terms and Definitions, Zoning and Evaluation of Energy Sources. Beuth Verlag GmbH: Berlin, Germany, 2018.
  26. Deutsche Vereinigung des Gas- und Wasserfaches e.V. Trinkwassererwärmungs- und Trinkwasserleitungsanlagen; Technische Maßnahmen zur Verminderung des Legionellenwachstums; Planung, Errichtung, Betrieb und Sanierung von Trinkwasser-Installationen; Arbeitsblatt W 551; DVGW: Bonn, Germany, 2004. [Google Scholar]
  27. VDI-Gesellschaft Energie und Umwelt (GEU). Corrigendum Concerning Standard VDI 4650 Part 1:2019-03; VDI 4650 Part 1 Corrigendum; Verein Deutscher Ingenieure e.V.: Düsseldorf, Germany, 2020. [Google Scholar]
  28. Wolff, D.; Teuber, P.; Budde, J.; Jagnow, K. Felduntersuchung: Betriebsverhalten von Heizungsanlagen mit Gas-Brennwertkesseln; Technical Report; Fachhoschule Braunschweig Wolfenbüttel: Wolfenbüttel, Germany, 2004. [Google Scholar]
  29. Schnaidt, S.; Wagner, A. Bericht zu AP 1.2 & 1.4: Akteure und Prozesse in der Gebäudesanierung & Nichttechnische Rahmenbedingungen und Einflussfaktoren des Sanierungsprozesses; Technical Report; KIT-Die Forschungsuniversität in der Helmholtz-Gemeinschaft: Karlsruhe, Germany, 2020. [Google Scholar]
  30. Hinz, E. Kosten Energierelevanter Bau- und Anlagenteile bei der Energetischen Modernisierung von Altbauten; Technical Report; Institut Wohnen und Umwelt: Darmstadt, Germany, 2015. [Google Scholar]
  31. Baukosteninformationszentrum Deutscher Architektenkammern GmbH. Baupreisindex. 2022. Available online: https://bki.de/baupreisindex (accessed on 3 February 2024). (In German).
  32. Bürgerliches Gesetzbuch (BGB). § 559. 2023. Available online: https://www.buzer.de/s1.htm?a=559-560&ag=6597 (accessed on 3 February 2024).
  33. Bundesamt für Wirtschaft und Ausfuhrkontrolle. Anlagen zur Wärmeerzeugung (Heizungstechnik). 2023. Available online: https://www.bafa.de/DE/Energie/Effiziente_Gebaeude/Sanierung_Wohngebaeude/Anlagen_zur_Waermeerzeugung/anlagen_zur_waermeerzeugung_node.html (accessed on 8 June 2023). (In German).
  34. Bundesamt für Wirtschaft und Ausfuhrkontrolle. Einzelmaßnahmen an der Gebäudehülle. 2023. Available online: https://www.bafa.de/DE/Energie/Effiziente_Gebaeude/Sanierung_Wohngebaeude/Gebaeudehuelle/gebaeudehuelle_node.html (accessed on 8 June 2023). (In German).
  35. Gesetz zur Aufteilung der Kohlendioxidkosten (Kohlendioxidkostenaufteilungsgesetz-CO2KostAufG). § 5. 2022. Available online: https://www.buzer.de/5_CO2KostAufG.htm (accessed on 3 February 2024).
  36. Wagner, J.; Madlener, R. Auswirkungen von CO2-Preisen auf den Gebäude-, Verkehrs- und Energiesektor; Technical Report; Energiewirtschaftliches Institut an der Universität zu Köln gGmbH (EWI): Köln, Germany, 2019. [Google Scholar]
  37. Verivox GmbH. Aktuelle Gaspreise für Neukunden. 2022. Available online: https://www.verivox.de/gas/gaspreise/ (accessed on 3 February 2024). (In German).
  38. Verivox GmbH. Aktuelle Strompreise für Neukunden. 2022. Available online: https://www.verivox.de/strom/strompreise/ (accessed on 3 February 2024). (In German).
  39. Fritsche, U.R.; Rausch, L.; Simon, K.H. Umweltwirkungsanalyse von Energiesystemen: Gesamt-Emissions-Modell Integrierter Systeme (GEMIS); Technical Report; Öko-Institut: Darmstadt, Germany, 1989. [Google Scholar]
  40. Icha, P.; Kuhs, G. Entwicklung der Spezifischen Kohlendioxid-Emissionen des Deutschen Strommix in den Jahren 1990–2019; Technical Report; Umweltbundesamt: Dessau-Roßlau, Germany, 2020. [Google Scholar]
  41. Galvin, R. Policy pressure to retrofit Germany’s residential buildings to higher energy efficiency standards: A cost-effective way to reduce CO2 emissions? Build. Environ. 2023, 237, 110316. [Google Scholar] [CrossRef]
  42. Galimshina, A.; Moustapha, M.; Hollberg, A.; Padey, P.; Lasvaux, S.; Sudret, B.; Habert, G. What is the optimal robust environmental and cost-effective solution for building renovation? Not the usual one. Energy Build. 2021, 251, 111329. [Google Scholar] [CrossRef]
Figure 1. Overview of renovation scenarios and measurement periods with outdoor temperature distribution.
Energies 17 01502 g001
Figure 2. Conducted and anticipated renovation of envelope and heating system components.
Energies 17 01502 g002
Figure 3. Field trial building before (left) and after (right) the envelope renovation.
Energies 17 01502 g003
Figure 4. Field trial hydraulic scheme with evaluated measured properties [18].
Energies 17 01502 g004
Figure 5. WCC design flow temperature and building heat load before (left) and after (right) renovation with the thermal capacity of the heat pump at minimal and maximal compressor frequency.
Energies 17 01502 g005
Figure 6. Temperature distribution of the reference period and monitoring periods of the unrenovated and renovated building.
Energies 17 01502 g006
Figure 7. Measured and linear interpolated daily provided heat of the heat pump before (left) and after (right) the renovation.
Energies 17 01502 g007
Figure 8. Measured and linear interpolated daily provided heat of the boiler before (left) and after (right) the renovation.
Energies 17 01502 g008
Figure 9. Energy price trends for peak and low-price scenario with intermediate steps.
Energies 17 01502 g009
Figure 10. Provided heat from heat pump and boiler with calculated and measured mean building heat load before (left) and after (right) the renovation.
Energies 17 01502 g010
Figure 11. Weekly transferred heat to the DHW storage with fit.
Energies 17 01502 g011
Figure 12. Daily SCOP and energy weighted flow temperature before and after the renovation.
Energies 17 01502 g012
Figure 13. CO2,eq emissions, provided and used heat before and after renovation with condensing boiler and hybrid heat pump.
Energies 17 01502 g013
Figure 14. Emission reduction of renovation scenarios compared to a non-condensing gas boiler in 1990.
Energies 17 01502 g014
Figure 15. Accumulated CO2,eq,25 emissions of the 25 year period.
Energies 17 01502 g015
Figure 16. Investment costs with and without subsidies.
Energies 17 01502 g016
Figure 17. Net present value of the scenarios with and without subsidies.
Energies 17 01502 g017
Figure 18. CO2,eq abatement costs with (top) and without (bottom) subsidies.
Energies 17 01502 g018
Figure 19. Accumulated change of rent of the 25-year period with (top) and without (bottom) subsidies.
Energies 17 01502 g019
Table 2. Investment cost curves (Q3 2021).
ComponentInvestment CostsBusiness-as-UsualEnergy-Related AdditionalVariables xInspection and Maintenance m [%]
I 0 (BAU) Costs(ERA) Costs
abab
Roof 1 ( λ ins = 0.035 W/(mK)) a + b · x 1 · x 2 181.80.52614.723.078 x 1 = s ins , roof 0
x 2 = A roof
Facade 1 ( λ ins = 0.035 W/(mK))"100.3025.733.656 x 1 = s ins , facade 0
x 2 = A facade
Windows (2n) 1 a · x b · x 538.0−0.23100 A window , single 0
Windows (3n) 1"538.0−0.23176.62−0.163 A window , single 0
Windows (3n-PH) 1"538.0−0.231319.3−0.304 A window , single 0
Scaffold 1"98.42−0.32000 A living 0
Planning 1"954.1−0.55900 A living 0
Gas boiler 2"1156−0.42000 Q ˙ b 2.5 3
ASHP 2 (rated at A2/W35)"006270−0.537 Q ˙ hp 2.5 3
DHW storage 2"685.4−0.80400 V stor 2.0 3
Periphery 1"876.9−0.53300 A living 2.5 3
1 Hinz [30]. 2 Braeuer et al. [15]. 3 VDI 2067 [20].
Table 4. Daily heat load parameters (fit).
UnrenovatedRenovated
x 1 9.4 kW3.4 kW
x 2 −0.57 kW/K−0.19 kW/K
Table 5. Mean air and flow temperature with different SCOP boundaries.
UnrenovatedRenovated
T ¯ air , hp 1.9 °C2.1 °C
T ¯ flow , hp 46.2 °C41.3 °C
n ¯ comp , rel 78.8%42.9%
S C O P 1 2.823.28
S C O P d e f r o s t 2.71 (−0.11)3.16 (−0.08)
S C O P 2 2.67 (−0.04)2.99 (−0.17)
S C O P 3 2.65 (−0.02)2.94 (−0.05)
Table 6. Performance indicators of investigated scenarios.
ScenarioYear α sh , hp SCOP 3 η b Q g a s W e l C O 2 , eq , spec
[%] [-] [%] [kWh/(m2a)] [kWh/(m2a)] [kg/(m2a)]
1b-nc1990--76.0201.30.749.0
1b1990--86.0178.50.743.5
1b2021--86.0178.50.735.8
1hyb2021662.7987.484.829.228.1
2b2021--86.096.40.919.5
2hyb2021652.8889.961.710.416.3
With DHW optimization
1hyb *2021802.8987.463.134.825.9
2hyb *2021833.1489.950.013.014.9
Table 7. Calculated and actual envelope investment costs (field trial) (Q3 2021).
No Energetic Renovation (1)Energetic Renovation (2)
CalculationField trialCalculationField trial
ComponentBAU/ERABAU/ERABAU/ERABAU/ERA
costs [€]costs [€]costs [€]costs [€]
Roof34,540/048,270/037,580/20,59048,270 ( + 28 %)/19,840 ( 4 %)
Facade33,430/061,350/033,430/32,94061,350 ( + 84 %)/47,980 ( + 46 %)
Windows27,930/0 123,980/027,930/5360 223,980 ( 14 %)/4670 ( 13 %)
Scaffold4570/011,230/04570/011,230 ( + 146 %)/0
Planning11,500/014,110/011,500/014,110 ( + 23 %)/0
Total111,970/0158,940/0115,010/58,890158,940 ( + 38 %)/72,480 ( + 23 %)
Total
with subsidies
no subsidiesno subsidies92,010/47,110127,150/57,990
1 double glazing (2n). 2 facade: triple glazing (3n), roof: triple glazing with improved frame (3n-PH).
Table 8. Calculated and actual system investment costs (field trial) (Q3 2021).
Boiler (b)Hybrid (hyb)
CalculationField trialCalculationField trial
ComponentBAU/ERABAU/ERABAU/ERABAU/ERA
costs [€]costs [€]costs [€]costs [€]
Gas boiler7990/09200/07990/09200 ( + 15 %)/0
ASHP0/00/00/17,3400/17,020 ( 2 %)
DHW storage2060/03300/02060/03300 ( + 60 %)/0
Periphery12,250/056,580/012,250/05680 ( 54 %)/0
Total22,300/018,180/022,300/17,34018,180 ( 18 %)/17,020 ( 2 %)
Total
with subsidies
no subsidiesno subsidies22,300/13,01018,180/12,770
Table 9. Net present value cost components with subsidies and energy cost range (Changes to lower costs in green).
1b1hyb*2b2hyb*
Calc.Field trialCalc.Field trialCalc.Field trialCalc.Field trial
Energy electricity [-€/m2]2…395…1282…336…48
Energy gas [-€/m2]256…53290…188138…28772…149
Maintenance [-€/m2]2420433424204334
Investment system [-€/m2]76651281127665128112
Investment envelope [-€/m2]342484342484423562423562
Total [-€/m2]700…977826…1103698…829815…946664…814787…938701…791816…905
Change to 1b [%]--+0+15+1+14+5+17+5+15−0+19+1+18
Disclaimer/Publisher’s Note: The statements, opinions and data contained in all publications are solely those of the individual author(s) and contributor(s) and not of MDPI and/or the editor(s). MDPI and/or the editor(s) disclaim responsibility for any injury to people or property resulting from any ideas, methods, instructions or products referred to in the content.

