Article

Research on Digital Twin Dynamic Modeling Method for Transmission Line Deicing System

1
Department of Mechanical Engineering, North China Electric Power University (Baoding), Baoding 071003, China
2
School of Ocean & Civil Engineering, Shanghai Jiao Tong University, Shanghai 200240, China
*
Authors to whom correspondence should be addressed.
Energies 2024, 17(6), 1424; https://doi.org/10.3390/en17061424
Submission received: 3 February 2024 / Revised: 4 March 2024 / Accepted: 11 March 2024 / Published: 15 March 2024
(This article belongs to the Section F: Electrical Engineering)

Abstract

:
A digital twin is recognized as a pivotal technology in a new type of power system monitoring as it provides an effective method for monitoring the vibration caused by ice shedding in overhead transmission lines. The digital twin model differs from traditional models in that it has the characteristics of precise mapping and real-time simulation. These emerging characteristics lead to urgent updating of the existing modeling approaches. Therefore, the current study proposes a dynamic digital twin modeling method for transmission line ice-shedding systems. In this approach, an analytical solution for conductor deicing oscillation is proposed to describe the span and tension unchanged in any time period and then segmented and iteratively corrected with measured time-varying parameters to implement real-time simulation functionality. A dynamic geometric model for transmission lines is proposed based on the Unity3D platform. In addition, a human-computer interaction visualization platform is proposed to display twin data, with the objective of realizing precise mapping of real transmission lines. Finally, an application of this systematic approach to continuous three-span wire demonstrates the feasibility and effectiveness of the proposed approach.

1. Introduction

The digitization transformation of the transmission line system, as the core hub of power transmission, plays a crucial role in the development of the new power system toward digitization, intelligence, and networking [1,2,3,4]. A digital twin, as a key technology in the digitization transformation, has progressively emerged as the optimal choice for achieving real-time simulation of transmission line conditions and conducting accurate assessments and predictions. In recent years, flashovers and line failures caused by the oscillation of conductor deicing have become more frequent, directly impacting the reliability of the transmission line system [5,6,7]. Therefore, to enhance the safety of the transmission lines, it is necessary to establish accurate models for monitoring the status of the transmission line. There is an urgent need for a viable digital twin dynamic modeling method for transmission line deicing systems that considers these emerging characteristics.
The deicing oscillation of transmission lines is a prevalent occurrence in regions susceptible to ice on transmission lines [8,9,10]. The deicing of conductors induces vigorous motion, causing the conductor to oscillate vertically. The oscillation of the conductor results in a reduction of air clearances between conductors or between conductors and supporting structures, leading to flashovers in severe cases. Moreover, the deicing oscillation exerts significant dynamic tension on insulator strings, hardware, and towers, potentially causing damage to these components [10,11,12]. The literature [13] offers a nonlinear finite-element model developed using ADINA to simulate the static and transient dynamic responses of the physical model. The literature [14] also presents numerical modeling methods of ice load and ice-shedding load on transmission lines. The temperature field behind ice detachment at different rates has been studied using ABAQUS2016 software, and the dynamic response of multi-span transmission lines with different structural parameters has been analyzed, including span length, number of spans, height difference between the two suspension ends of ice spans, length of suspension insulator strings, number of sub conductors in bundle conductors, and conductor types. The literature [15] presents a reduced-scale modeling method for ice shedding from conductor lines, verified with numerical simulations and full-scale test results. However, traditional simulation methods are limited by offline operation and cannot offer a real-time reflection of the actual system’s state. Experimental methods involve high equipment costs and lengthy platform construction cycles, posing challenges in meeting the current real-time simulation requirements of transmission line systems.
With the continuous development of the Internet of Things, sensors, and simulation modeling technologies in recent years, digital twins have found profound applications in areas such as product design, manufacturing, engineering construction, and interdisciplinary analysis [16,17,18,19,20]. However, research on the application of the digital twin technology in the field of transmission lines is still limited. The primary challenge arises from the large-scale nature of transmission line scenarios, involving extensive geometric model data and intricate environmental details. The design of interactive platforms is intricate, entailing a substantial workload to meet the standards for accurate mapping between virtual and real models. It demands comprehensive analysis and planning for each stage of the work.
To precisely and efficiently calculate the oscillation response of transmission lines, this paper introduces a novel digital twin dynamic modeling method for the deicing system of transmission lines. Consider the influences of damping, conductor self-weight, ice covering, horizontal tension, and variations in the calculated clearance on the conductor’s oscillation process. In this context, the calculated clearance represents the separation between distinct insulator strings and the connection points of the conductor. Selecting any transmission line for investigation, formulate a differential equation governing the conductor’s oscillation under constant tension and clearance. Derive the analytical solution, integrate it with the measured time-varying parameters, and develop a comprehensive digital twin model that integrates mechanisms and data for conductor oscillation. Subsequently, utilizing the Unity3D platform, analyze the dynamic geometric model’s functionality, outline the implementation process, develop the interactive platform for the twin system, and accomplish the precise mapping of virtual and real lines. Ultimately, validate the model on a continuous three-stage line, presenting a novel solution for real-time monitoring and prevention of disasters in overhead transmission lines.
The remainder of the paper is organized as follows: Section 2 describes a method for a digital model of deicing vibration. Section 3 describes a method for a digital twin dynamic geometric model for transmission lines. In Section 4, we verify the feasibility of the proposed method in the case study, and in Section 5, we conclude the paper.

2. Research on Modeling Methods for Digital Models of Deicing Oscillation

In this section, a set of differential equations for the ice-shedding oscillation of the conductor at any position and any time is presented, and then analytical solutions are derived. The objective is to simulate the dynamic wire deicing oscillation process in real time, offering a potent tool for subsequent analysis and prediction.

2.1. Theoretical Analysis of de Icing Oscillation

Consider the practical scenario in which wire deicing oscillation predominantly occurs in windless conditions and assume that the deicing process takes place in the xoz plane. This assumption forms the basis for establishing a simplified model of the wire, as depicted in Figure 1, to characterize the oscillation phenomenon of the kth wire in the ith time interval of a continuous n-span transmission line. The analysis focuses on exploring the amplitude variation pattern during the wire oscillation process.
Figure 1, Z i k x , t depicts the profile of the kth grade conductor during the ith time interval. The equation describing the deicing oscillation of the conductor within the ith time interval is derived using the local finite element method.
2 Z i k x , t t 2 a i k 2 2 Z i k x , t x 2 + 2 H i k Z i k x , t t = g
Boundary conditions:
Z i k x = 0 = 0 Z i k x = L i k = 0
Initial conditions:
{ Z i k t = t i = ϕ i k x Z ˙ i k t = t i = ψ i k x
where a i k 2 = T i k / m i k , 2 H i k = c / m i k , 0 < x < L i k , 0 < t < t d , T i k represents the horizontal tension exerted on the kth grade conductor during the ith time interval, m i k is the unit length mass for the kth grade conductor during the ith time interval, c represents the wire damping, L i k represents the calculated span for the kth grade conductor during the ith time interval, t d represents the time interval, g represents the gravitational acceleration, ϕ i k x signifies the initial configuration of the kth grade conductor within the ith time interval, ψ i k x denotes the initial velocity of the kth grade conductor within the ith time interval, and the duration of this time interval is td. Therefore, Equation (1) encapsulates the differential equation governing the deicing oscillation of the kth grade conductor during the ith time interval.
Traditional models commonly rely on numerical solution approaches. However, the inherent approximation nature of numerical solutions can lead to distortions in calculations at localized points. To ensure the accuracy of the model, this section examines the boundary conditions based on the actual operating conditions of the transmission line. By employing the method of variable separation and utilizing the provided initial conditions, we can derive the analytical solution for the oscillation displacement function of the wire relative to the self-weighted configuration.
When the wire is subjected to its self-weight, with gravity acting as the external force, the expression can be derived from Equation (1):
a i k 2 2 Z i k x , t x 2 = g
The initial configuration of a wire under its own weight can be obtained by integrating:
z 0 k x = g m 2 T 0 k x L x
where z 0 k x represents the line shape of the wire under its own weight and T 0 k represents the initial tension of the wire. Using the method of separating variables, the displacement of any point on the wire is:
w i k x , t = i = 1 n X i x T i t
where X i x represents a function related to position and T i t represents a function related to time. By substituting Equation (1), the general solution of the displacement function of the kth level conductor deicing oscillation model during the ith time period can be calculated as follows:
w i k x , t = j = 1 n e h j k t A j k c o s ω j k t + B j k s i n ω j k t s i n j π x L i k
The general solution of the wire velocity function during the ith time period is:
v i k x , t = j = 1 n e h j k t D j k c o s ω j k t F j k s i n ω j k t s i n j π x L i k
where:
D j k = ω j k B j k h j k A j k F j k = h j k B j k + ω j k A j k ω j k = j 2 π 2 a i k 2 L i k 2 h j k 2 h j k = ζ j k a i k j π L i k A j k = 2 L i k 0 L i k ϕ j k x z 0 k x sin j π x L i k d x B j k = h j k ω j k A i k + 2 ω j k L i k 0 L i k ψ i k x s i n j π x L i k d x
where ζ j k represents the damping ratio for the jth mode and h j k is a constant associated with the damping of the conductor mode during the ith time interval. In Equation (1), H i k is a constant associated with the damping of the kth grade conductor and the system during the ith time interval.
In each oscillation model within a time interval, the calculated span is acquired through empirical measurements, while the tension is determined by considering the initial and final conditions from the preceding time interval. This enables real-time data to promptly contribute to the model’s updating and calculation process, markedly augmenting the authenticity of the model in contrast to conventional offline simulations. Moreover, it facilitates the precise simulation of the time-varying characteristics of conductor states in practical power lines for subsequent design utilizing the time-series segmentation algorithm.

2.2. Analysis of the Modeling Process of Digital Models

In experiments, continuous variations have been observed in the tension and calculated span within overhead lines [17]. Assuming constant tension and calculated span may result in less accurate solutions when calculating the real-time state of conductor oscillations. Furthermore, environmental factors in actual power lines can significantly influence the tension and calculated span of conductors.
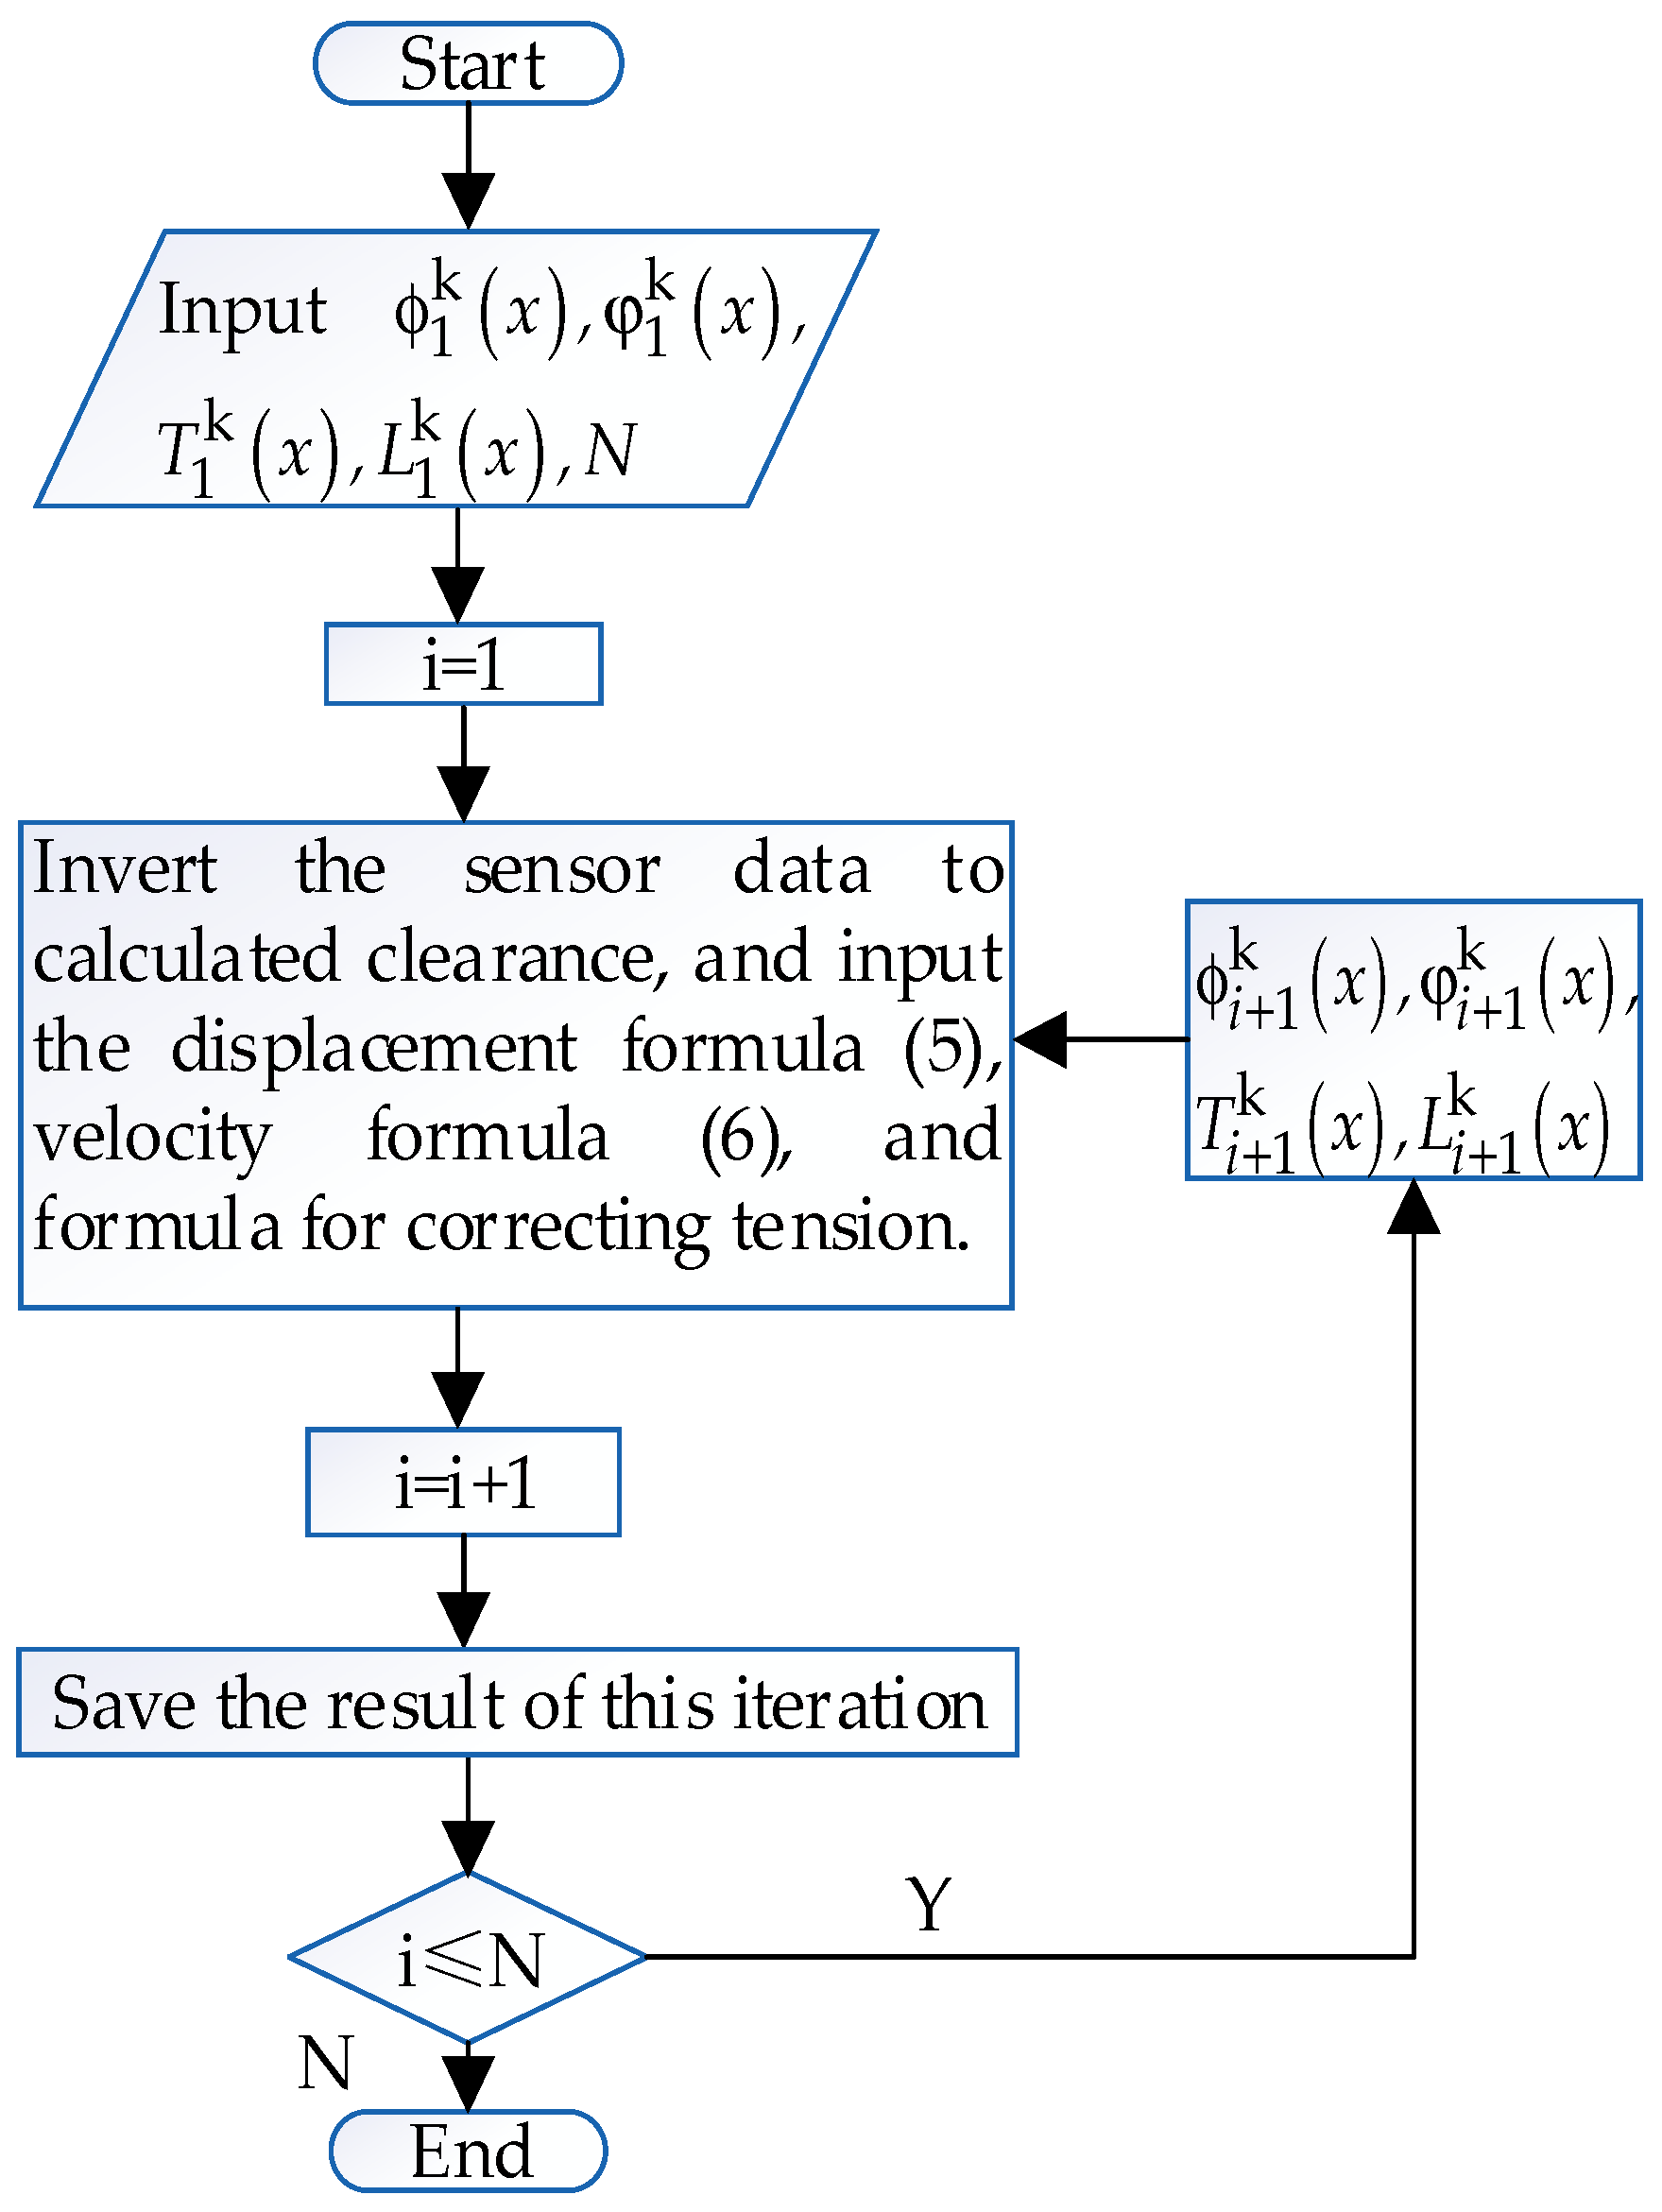
As depicted in Figure 2, this section introduces a time-series segmentation algorithm that enables the fusion of analytical solutions and data. The deicing process is divided into several time intervals in the time series, each of length td; it is assumed that the tension and calculated span of the conductor remain constant within each time interval, allowing different values for tension and calculated span in different intervals. For a continuous-grade n-line, measurements of n − 1 suspension insulator strings and conductor connection points’ displacements are required. Combining this with the initial calculated span yields n calculated spans. The precise analytical solutions for the n grades are then combined with the measured time-varying parameters to establish a deicing oscillation digital twin model for the transmission line based on both analytical solutions and data. This model enables real-time monitoring of conductor status by iteratively updating the calculated span and tension for each grade in each time interval using measured data.
The method of using sensor angle data to calculate the span of the wire in Figure 2 is a difficult point in twin model modeling. This article combines angle sensors with the length of insulator strings to participate in iteration and obtain the calculation span for each time period.
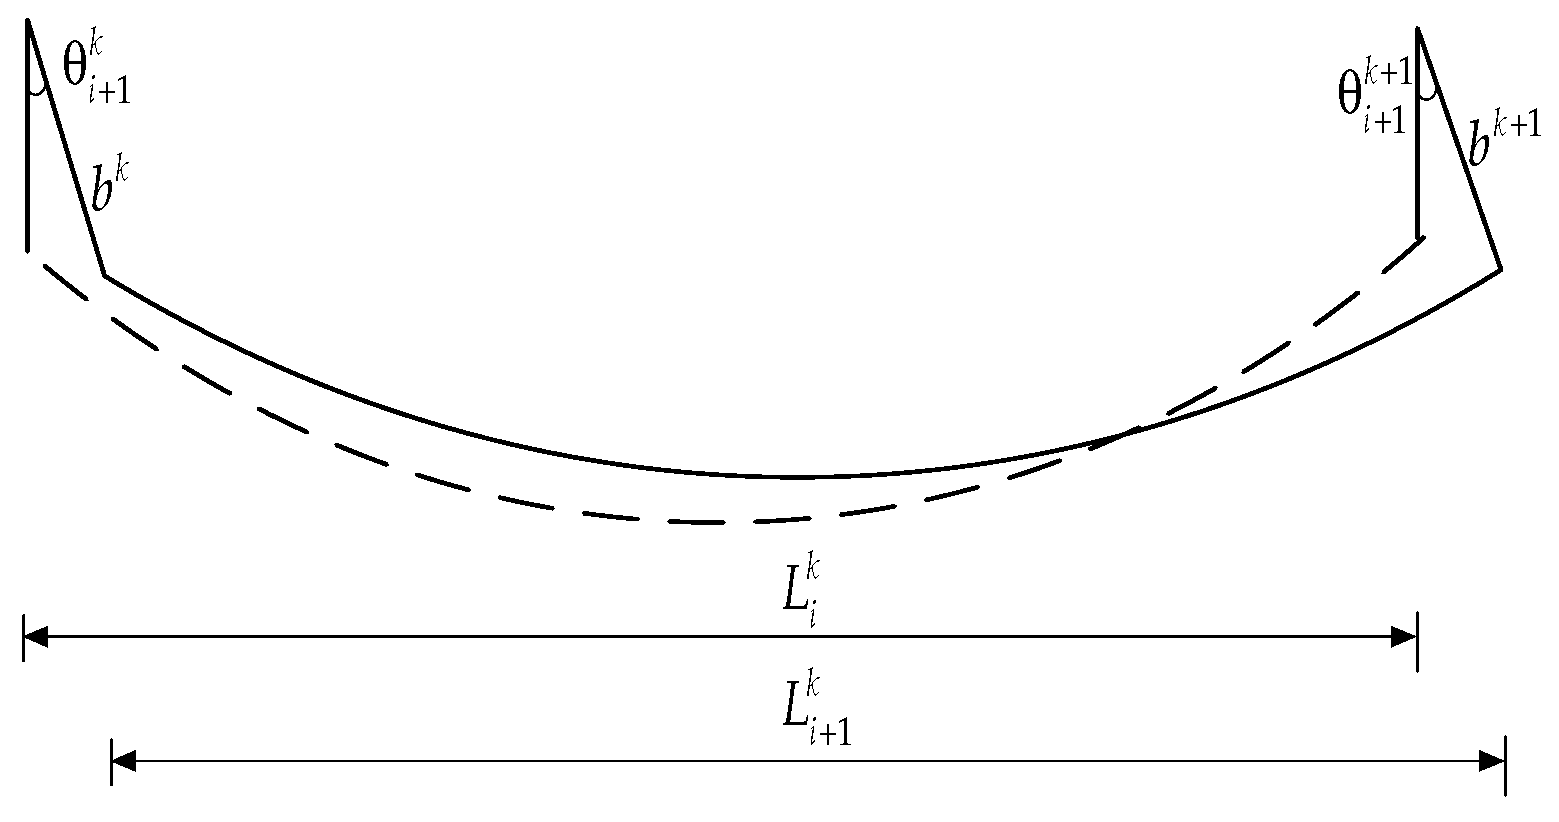
As shown in Figure 3, the dashed line represents the shape of the conductor in the ith time period, and the solid line represents the shape of the conductor in the (i+1)th time period. In order to clearly display the variation in the wire shape with the calculated span, the drawings were exaggerated. In actual power lines, this swing angle is very small, so it can be approximately assumed that the connection points between each level of wire and the suspension insulator string have always maintained an equal height state. The calculated clearance value is equal to the difference between the initial span and the horizontal displacement of the wire suspension point, i.e.,
L i + 1 k = L i k + u i + 1 k + 1 u i + 1 k
where L i + 1 k is the calculated clearance at the (i+1)th iteration, L i k is the calculated clearance at the ith iteration, u i + 1 k + 1 is the horizontal displacement value of the (k+1)th point at the (i+1)th iteration equal to b k + 1 s i n θ i + 1 k + 1 , b k + 1 is the length of the (k+1)th suspension string, θ i + 1 k + 1 is the swing angle of the (k+1)th insulator string at the (i+1)th iteration, u i + 1 k is the horizontal displacement value of the kth point at the (i+1)th iteration equal to b k s i n θ i + 1 k , b k is the length of the kth suspension string, and θ i + 1 k is the swing angle of the kth insulator string at the (i+1)th iteration. The calculation span of the wire can be obtained by combining the angle measured by the pose sensor with the initial span calculation.
In Figure 2, L i + 1 k represents the calculated span value obtained through measurements for the kth grade conductor during the (i+1)th time interval. The analytical solutions for displacement and velocity are given by Equations (5) and (6), respectively, while the tension correction is expressed as:
T i + 1 k = T i k + E A 0 L i k 1 + ϕ i k 2 d x / 0 L i k 1 + ϕ i + k 2 d x 1
where T i + 1 k represents the steel wire tension of the kth wire in the (i+1)th time period, T i k represents the steel wire tension of the kth wire in the (i+1)th time period, ϕ i k represents the derivative of the shape of the kth wire with respect to x at the end of the ith time period, and ϕ i + k represents the derivative of the shape of the kth wire relative to x at the beginning of the ith time period.
In the actual measurement of line parameters, due to the use of steel core aluminum stranded wire structures and the variety of models, the tensile stiffness is difficult to measure directly. Therefore, it is particularly important to develop a simple and efficient solution to accurately evaluate the tensile stiffness of wires. The weight of an ordinary steel core aluminum stranded wire LGJ 150/20 per meter is approximately 0.55 kg When the line span reaches 1000 m, the self-weight of the wire exceeds 0.5 tons. It can be seen that the tension inside the wire is mainly determined by the load of the wire. External structural factors such as bolt connection clearance, bolt slippage, and hole misalignment may have an impact on the wire, but the impact is small, and most of them change periodically with the movement of the wire, which can be regarded as elastic factors. For the convenience of calculation, the wire is simplified here as an elastic structure, where deformation occurs within the elastic limit. The original length is the span, and after the completion of the wiring, the wire elongates under the action of load and other factors. The wire length is known, and the following formula can be used to describe the tensile stiffness of the wire:
E A = T 0 L 0 S 0 L 0
In the formula, L0, and S0 are the initial span and initial line length, and T0 is the initial horizontal tension of the conductor. This way, the stiffness of the wire can be directly determined based on these three parameters, taking into account sufficient factors and avoiding complex experimental measurement processes.
The specific algorithmic steps are as follows:
(1)
Input Time-Varying Parameters:
Segment the deicing oscillation process into N time intervals on the time series, each with a length of td.
Maintain constant tension and calculated span of the conductor within each time interval. Obtain the change in the calculated span by combining the measured endpoint displacement values with the original span. Calculate the calculated span during the ith time interval from sensor measurements and update it in the model using analytical solutions.
(2)
Determine Initial Conditions for Iterative Model Updates
The relationship between adjacent time intervals is such that the final conditions of the previous time interval serve as the initial conditions for the next time interval. In other words, for the first time interval, the tension in the model is determined by the initial values. Starting from the second time interval, the tension is calculated using the initial and final conditions of the previous interval, plugged into Equation (7).
As illustrated in Figure 3, input the initial tension, initial span, and initial configuration, ϕ 1 k x representing the self-weight configuration z 0 k x , and initial velocity ψ 1 k x = 0. Based on the input time-varying parameters, substitute them into the analytical solutions for the oscillation function and velocity function to solve for the conductor’s configuration, ϕ 2 k x , and velocity ψ 2 k x at the end of the first time interval. Next, calculate the change in conductor length based on ϕ 1 k x and ϕ 2 k x to obtain the tension in the conductor. This calculated tension becomes the tension for the next time interval and, combined with the measured calculated span, participates in the second iteration. This iterative process continues in a loop.
(3)
Storage
Substitute the time-varying parameters into the analytical solutions for the oscillation function and velocity function to obtain the conductor’s oscillation configuration function Z i k x , t at the ith time interval. Save these functions in a cyclic order, with each time interval having a length of td. Next, modify and store the time axis of the N segments of data in the order of as the start and end times for each time interval.
(4)
End
Due to storage space or other constraints, a maximum limit of time intervals N is preset. The index i increases continuously during the iteration process until the condition of exceeding N is met, at which point the iteration process concludes.
In contrast to isolated-grade conductors, the calculated span for continuous-grade power lines is consistently changing, and endpoint displacements can be obtained through measurement data transmission. Therefore, this method exhibits strong applicability to various line conditions. The efficiency of virtual-to-real iteration can be enhanced by increasing the sampling frequency and reducing the time interval, and it offers higher accuracy compared with traditional monitoring systems.

3. Research on Modeling Methods for Dynamic Geometric Models of Transmission Lines

Twin geometric models are the focus of twin systems [21,22,23,24]. This section of the paper proposes a new process for creating a dynamic geometric twin model that precisely represents the actual power line and guarantees swift and stable data transmission from collection to application, distinct from existing physical simulation models. The procedure starts with a thorough analysis of functionality, then proceeds to the design and implementation of the modeling process, and concludes with the development of an interactive platform for showcasing the data results.

3.1. Functional Analysis of Digital Twin Dynamic Geometric Models

(1)
Visualization of Line Status: Initially, a digital twin geometric model of the transmission line is created by replicating the physical spatial arrangement of the power transmission lines in a virtual space. Subsequently, a digital twin numerical model of the line is established, using twin data to govern the virtual line’s operation. This facilitates the real-time visualization of the actual line’s operational status, mapped onto the virtual representation within the twin platform. Enabling interactive communication between the physical and virtual lines ensures real-time synchronization of the operational status.
(2)
Integration of Multi-Source Heterogeneous Data: The data sources utilized in visualization demonstrate both diversity and heterogeneity. Concerning diversity, this platform classifies data sources into static and dynamic categories. Static data include specific types, such as line towers, phases, ground wires, and insulator strings. Dynamic data, on the other hand, refer to real-time data, including noncontact machine vision recognition technology based on monocular or binocular methods and contact-based speed and acceleration sensors to obtain real-time dynamic data of the transmission line. In accordance with the requirements of digital twin visualization and actual line conditions, this platform introduces a digital twin visualization multi-source heterogeneous data collection architecture, as illustrated in Figure 4. The architecture divides the data in the digital twin visualization platform into two major components: static data collection and dynamic data collection. Both components involve multiple-source heterogeneous data processing centers for collection, processing, and storage, facilitating the integration of various data types and addressing the issue of visualization information isolation.
(3)
Fusion Modeling of Analytical Solutions and Data: Owing to unpredictable time-varying factors like tension, calculated spacing, and ice shedding during conductor oscillation, the entire system demonstrates non-smooth dynamic characteristics with continuous displacement and discontinuous velocity and acceleration throughout the oscillation process. Sensors connected to the computer via a USB serial port transmit data to a database. Subsequently, Unity scripts within the digital twin environment access database information, establishing communication between the sensors and the Unity3D platform. This enables real-time data transmission from sensors to scripts and real-time data requests from scripts to sensors. A segmented smoothing algorithm is utilized to manage the system through segmentation in the time series. This involves combining real-time data obtained from measurements with analytical solutions for ice-shedding oscillations. The integration of analytical solutions and data forms the basis for constructing a digital twin model that incorporates both analytical solutions and measured data.
(4)
Cross-Platform Device Access: Given that many digital twin visualization scenarios demand high-performance hardware and intricate software environments, this imposes considerable limitations on the presentation of digital twin visualizations. This paper suggests a web-based architecture for a digital twin-model information management system, employing a B/S (browser/server) model. The system can collect and process data through multiple interfaces and formats, enabling real-time transmission and operation of digital twin models and charts after unified processing. This design enables operators to access the system remotely using any mainstream browser via the HTTP protocol.

3.2. Analysis of Modeling Methods for Dynamic Geometric Models

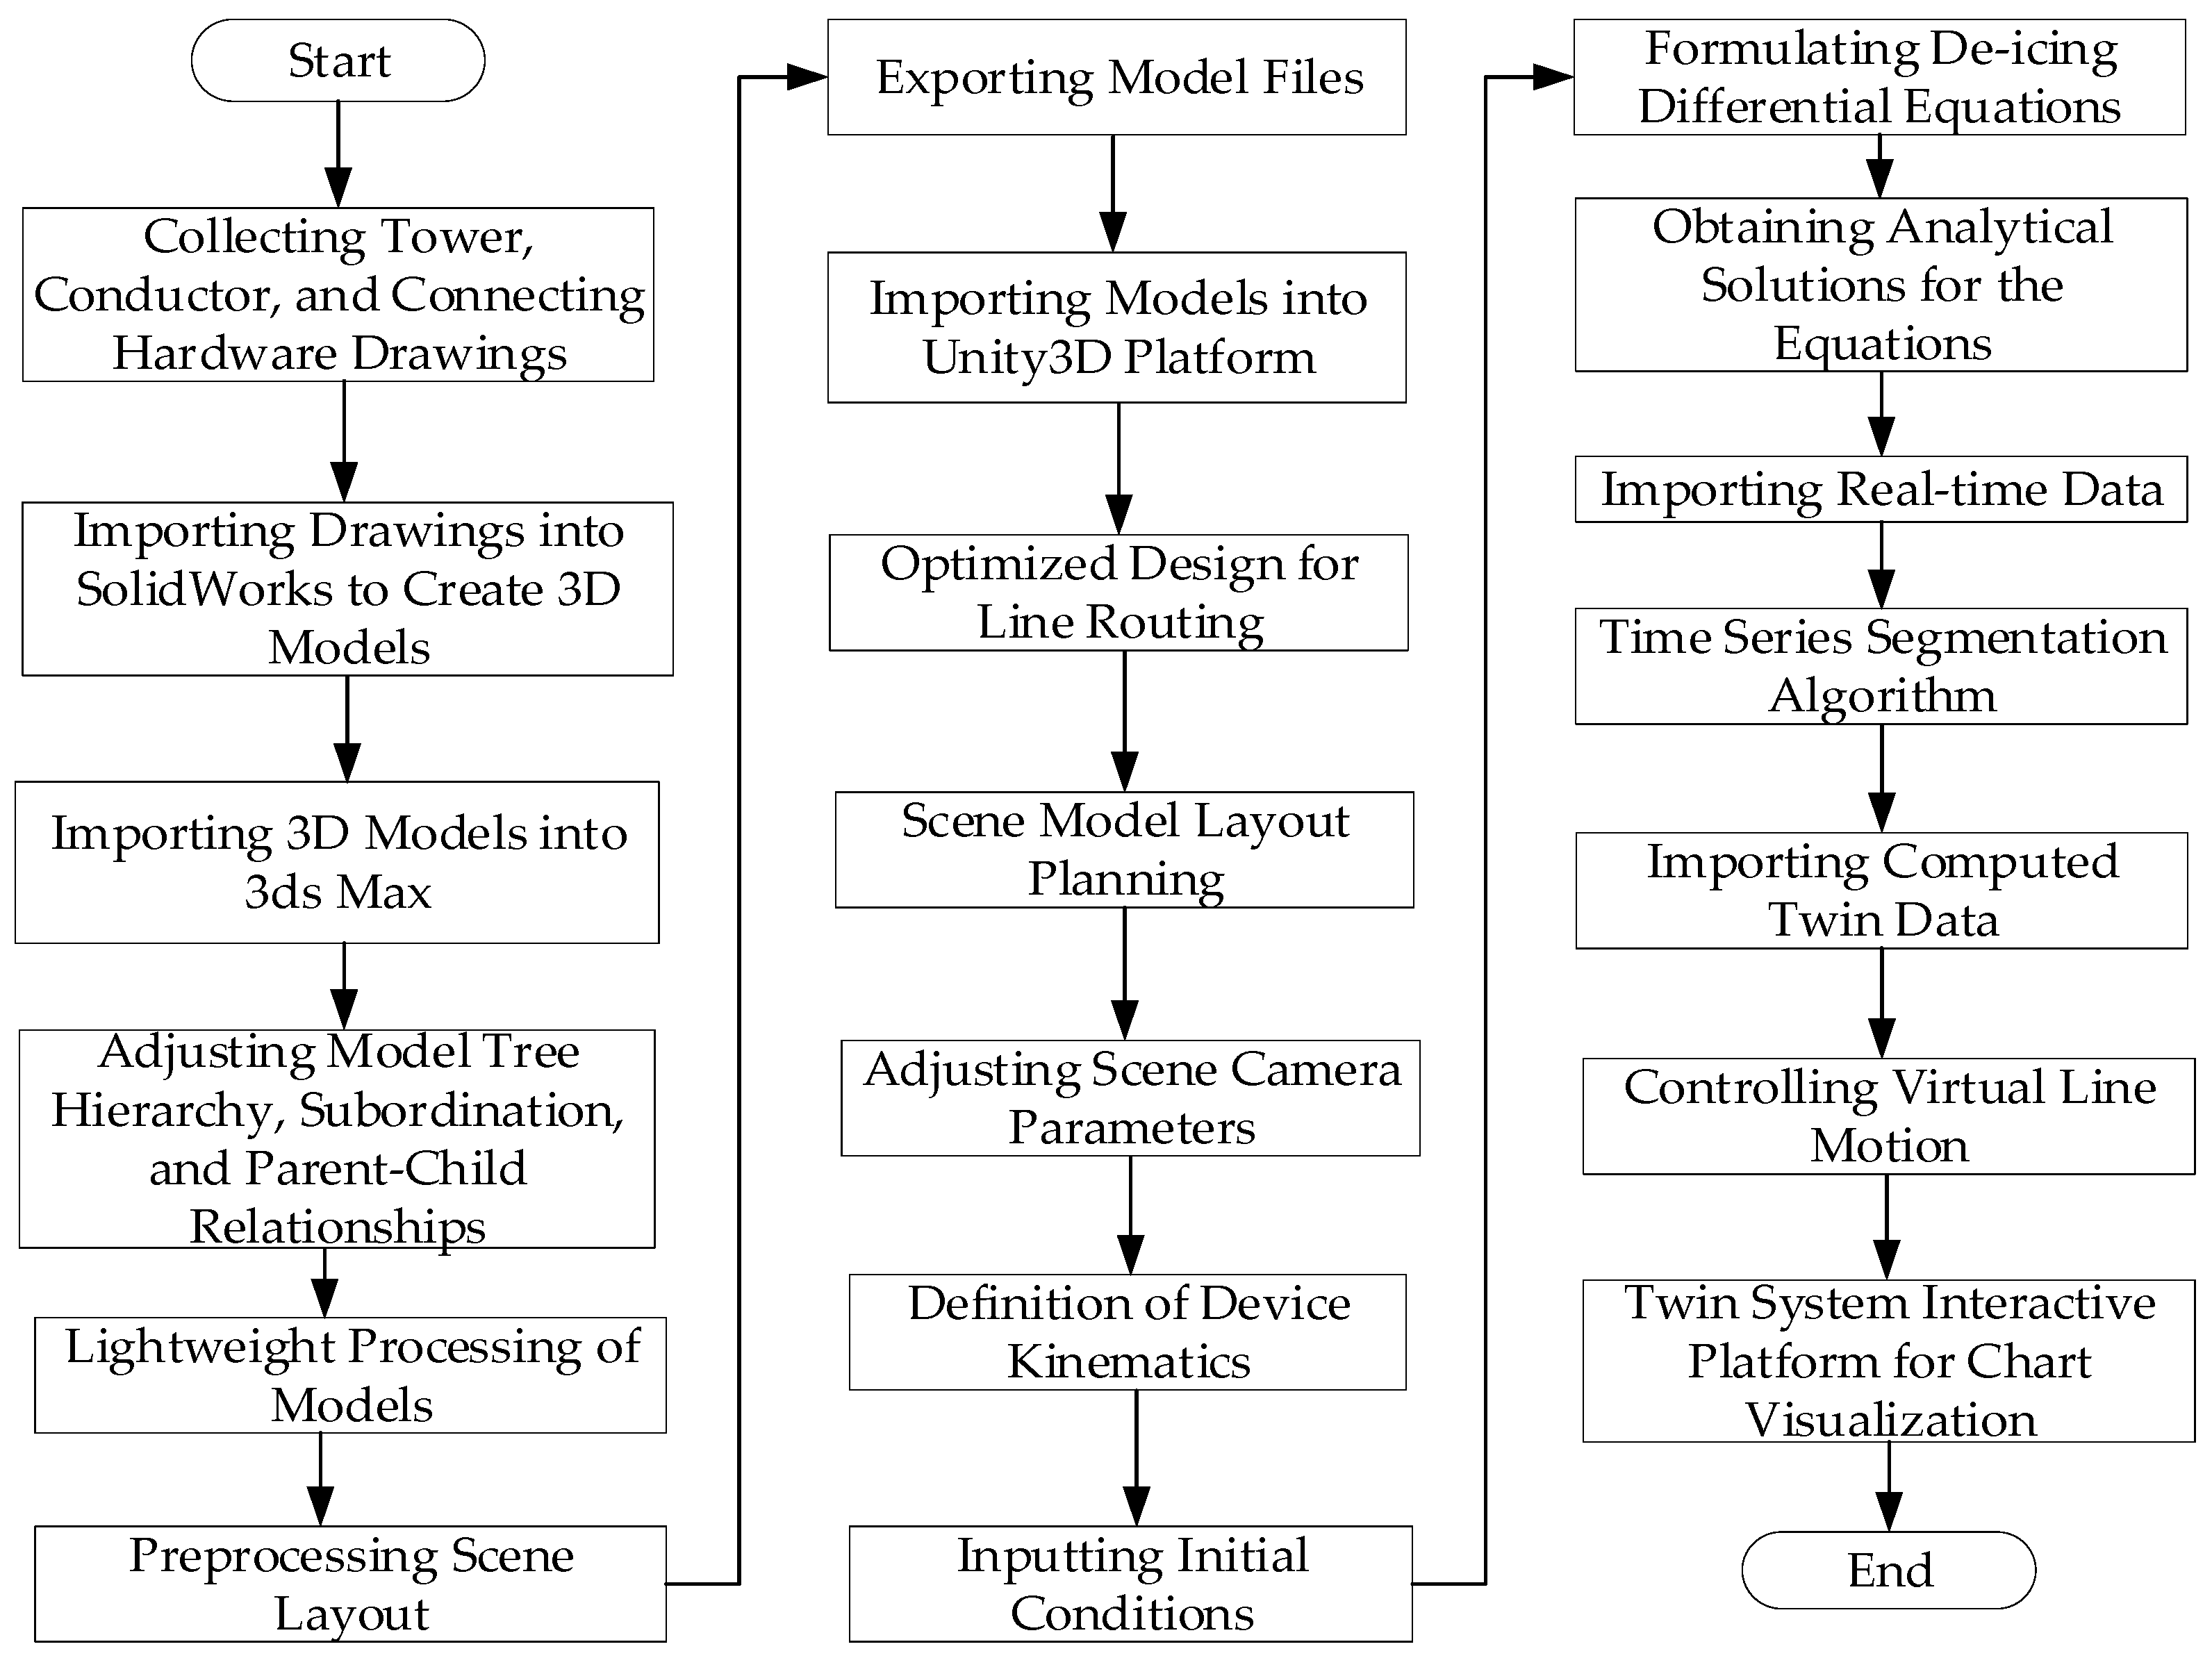
Based on the main functions of the digital twin dynamic geometric model of the line, this section designs the modeling process of the dynamic geometric model. The main process is divided into several parts, including static 3D geometric model construction, twin digital model import, route layout planning, data display, etc. The process is shown in Figure 5.
(1)
Twin Three-Dimensional Geometric Model Construction: Examine the voltage level of the target power line and procure detailed drawings encompassing towers, conductors, ground wires, and connecting fittings. In the SolidWorks2016 software, initiate the creation of two-dimensional sketches for the line components. Utilize feature tools to meticulously refine the part sketches through operations such as stretching, rotating, filleting, and other relevant processes. Assemble and finalize the modeling, subsequently exporting the file in OBJ format. Following this, import the file into the 3Dmax platform for additional refinement. Within the material editor, carefully select suitable materials and apply them to each component of the power line by dragging and dropping. Proceed to configure rendering parameters, making meticulous adjustments to resolution, rendering quality, ray tracing, global illumination, shadows, depth of field, and other effects to heighten the realism of the equipment display. Last, impose constraints in accordance with the actual requirements of the power line.
(2)
Line Layout Planning: Import the processed model files into the Unity3D platform for the virtual engine, establishing a corresponding virtual scene for the transmission line and conducting layout planning. This process unfolds in three main steps:
Step 1:
Determine the coordinates of the towers in the virtual scene by analyzing micro-terrain features of the line section. Consider the impact of wind speed, ice thickness, and atmospheric conditions on the horizontal and vertical loads of conductors. Analyze the mechanical and physical characteristics of overhead lines, including elastic modulus, linear expansion coefficient, and tensile strength, influencing the positioning of the line. Calculate the safe distances of conductors to the ground and objects being crossed. Optimize under various conditions, adjusting positions and heights of towers in the crossing sections to achieve tower layout design for the virtual scene, providing positioning information for the towers.
Step 2:
Adjust the scene parameters of the virtual line to present the digital twin scene optimally. Modify scene camera parameters to capture the actions of the entire line scene effectively. Save multiple camera parameters, if necessary, for camera angle transitions, showcasing line positions and fitting details.
Step 3:
Add light sources, such as ambient light, directional light, and point light, to the virtual scene to enhance equipment visibility, improve material texture, and increase the realism of the digital twin line. Finally, save the created line to the model for later use on the digital twin interaction platform.

3.3. Analysis of Interaction Platform Design Methods

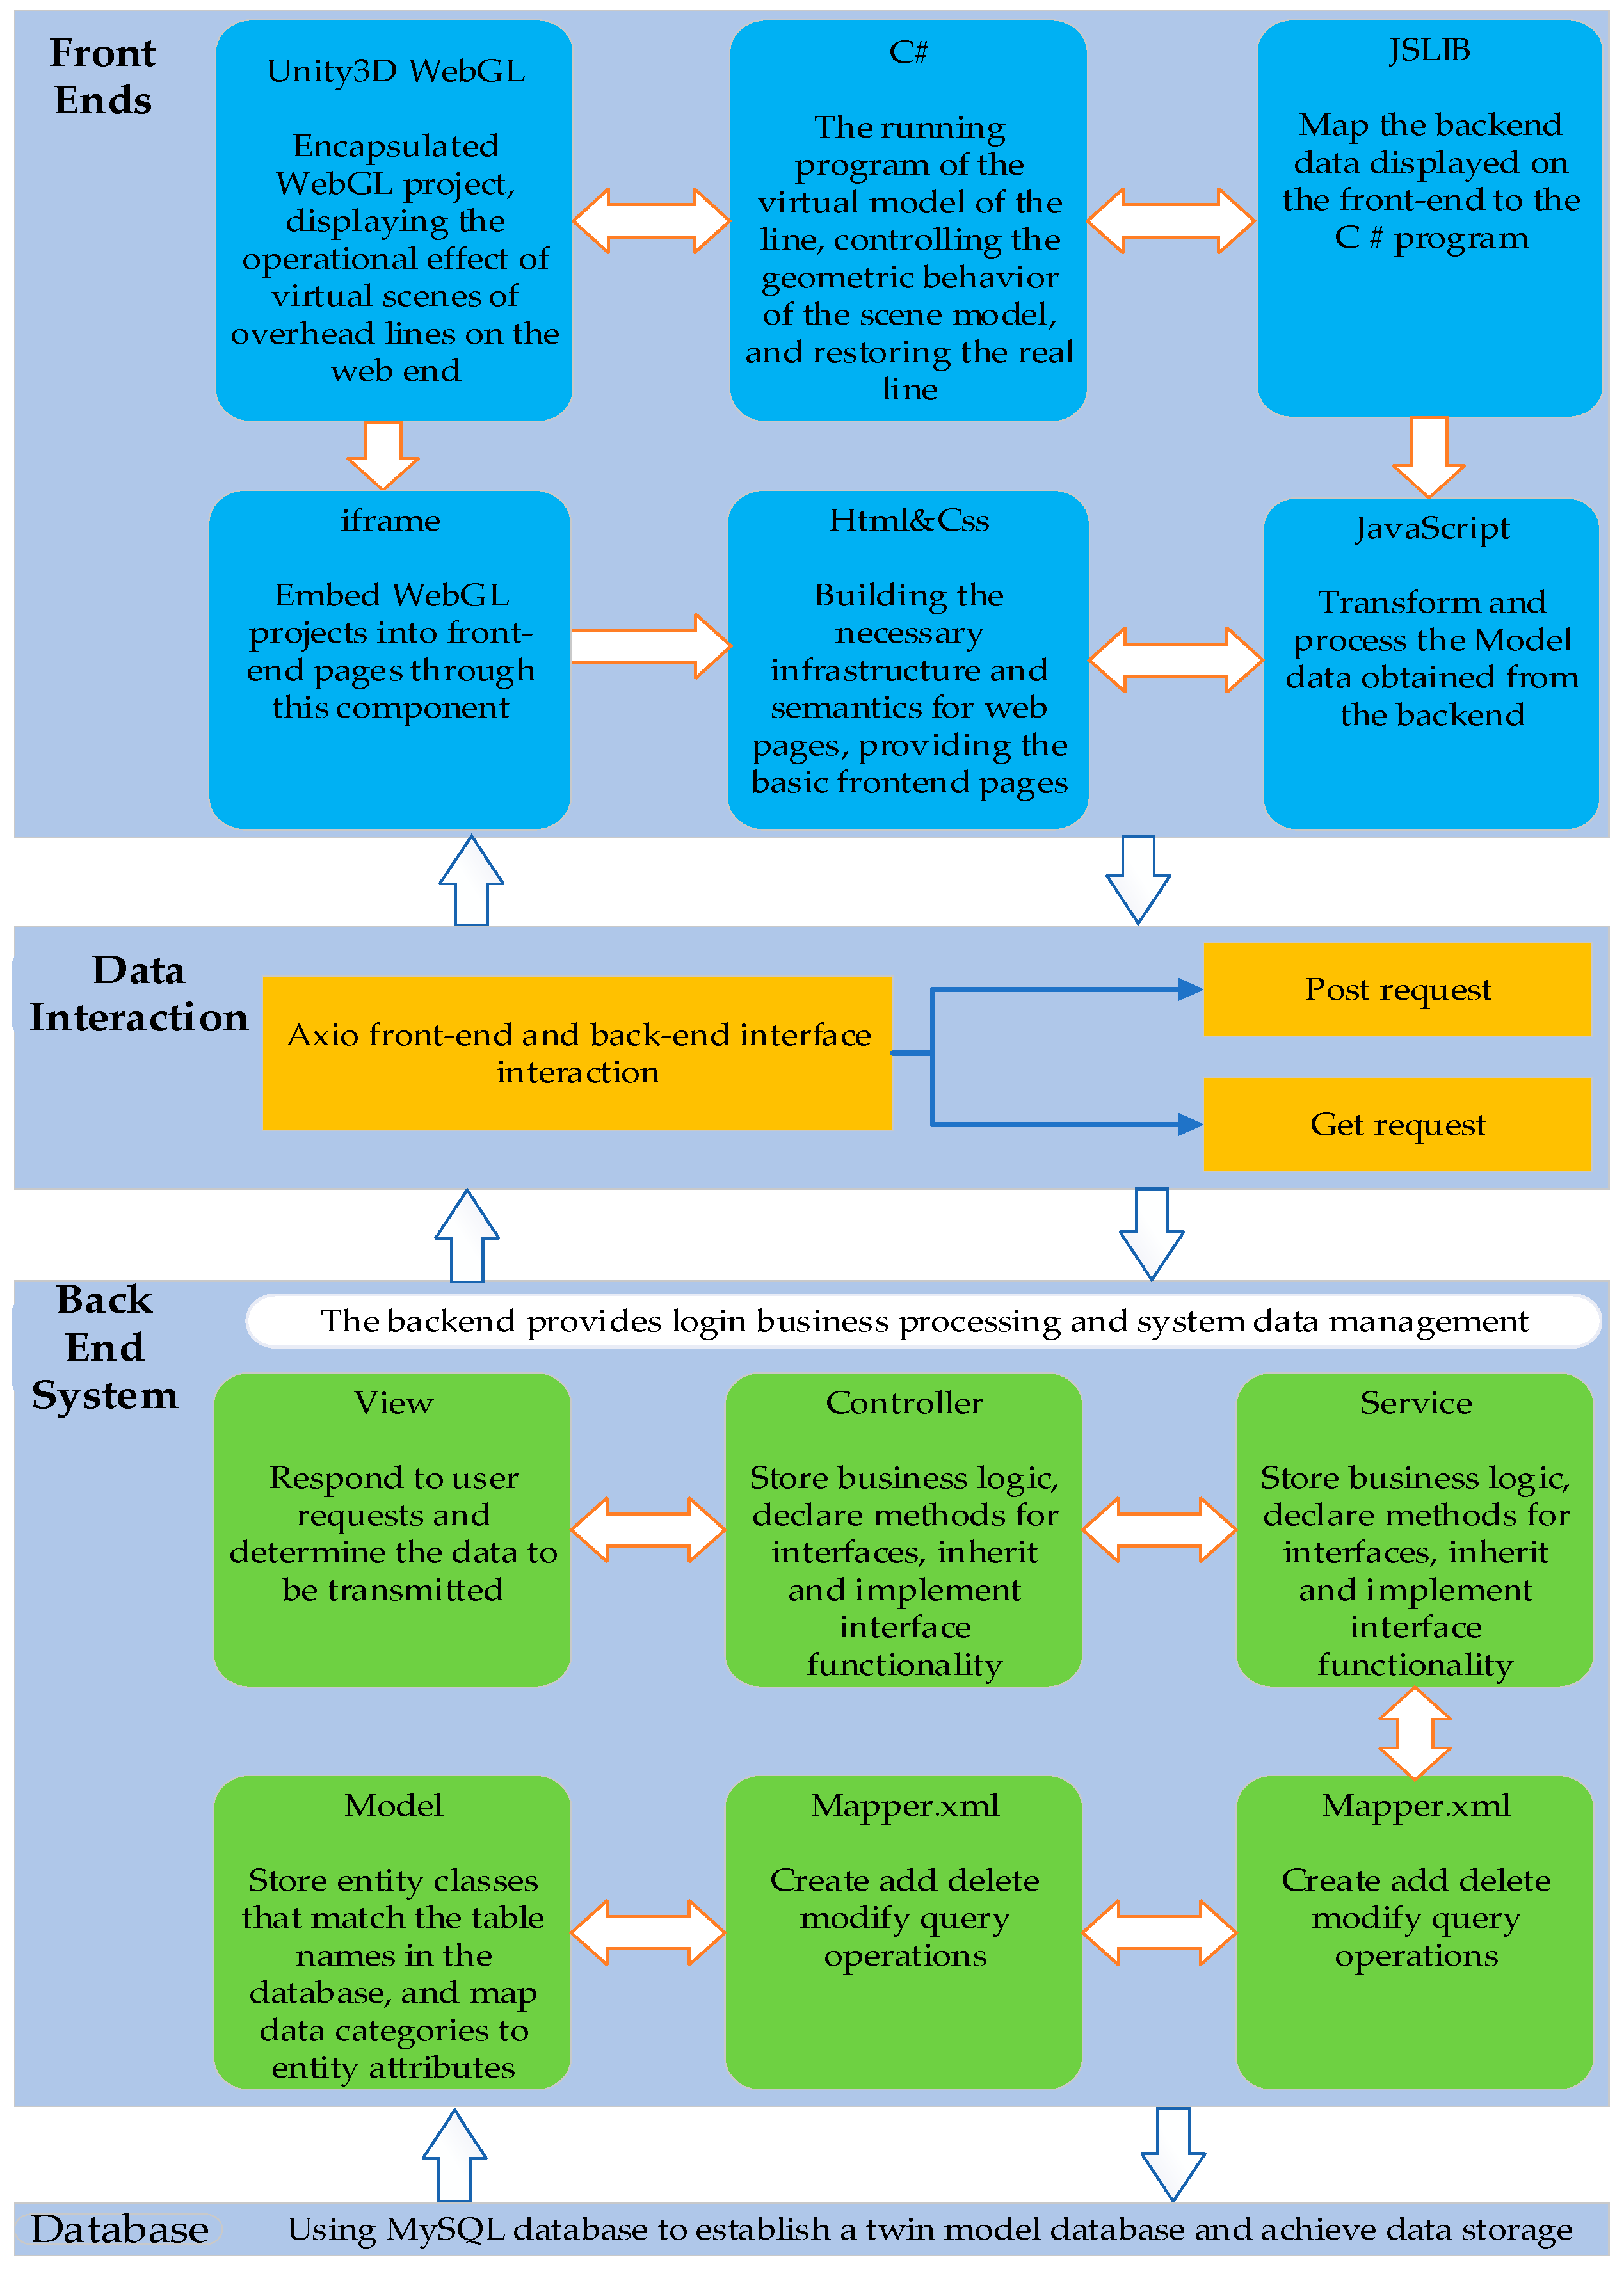
The deicing digital twin system interactive platform functions as a gateway, translating real-world power line entities into the digital domain. It incorporates essential features, including real-time stable network communication, efficient data management, dynamic simulation capabilities, user-friendly human-machine interaction controls, visual representation tools, cross-platform accessibility, and more. Concurrently, the development of the platform follows an object-oriented approach, ensuring the provision of interfaces for subsequent upgrades and expansions. Accordingly, in line with these specifications, this paper suggests a WEB-based architecture for a digital twin model information interaction management system. Figure 6 illustrates the component diagram of the system architecture.
The design concept of the interactive platform architecture in this section adopts the MVC (model-view-controller) framework [25,26,27], widely used in current practices. This framework comprises three distinct modules: model, view, and controller. These modules serve different functions and remain independent of each other at the code level. In case the requirements of a particular module change, the code of that specific module can be directly modified without the need to alter the code of other modules. This design minimizes inter-module dependencies, thereby facilitating the early design and subsequent maintenance of the system.
This framework adopts the technique of front-end and back-end separation. The back-end system code is written in Java, utilizing SSM technology to achieve back-end persistence and business logic functionality. The back-end architecture is structured into layers, including the entity layer, persistence layer, business logic layer, and control layer. This design significantly reduces code editing, ensures standardization, and enhances component reusability, facilitating the addition of corresponding functional modules to the system in the future. The front-end interface is designed using the Vue framework, separating the front-end and back-end code for ease of subsequent maintenance. By employing the Axios network request library, interaction between the front-end and back-end is achieved. The system operates in a B/S (browser/server) mode, allowing operators to access it remotely through the HTTP protocol using mainstream browsers available in the market.
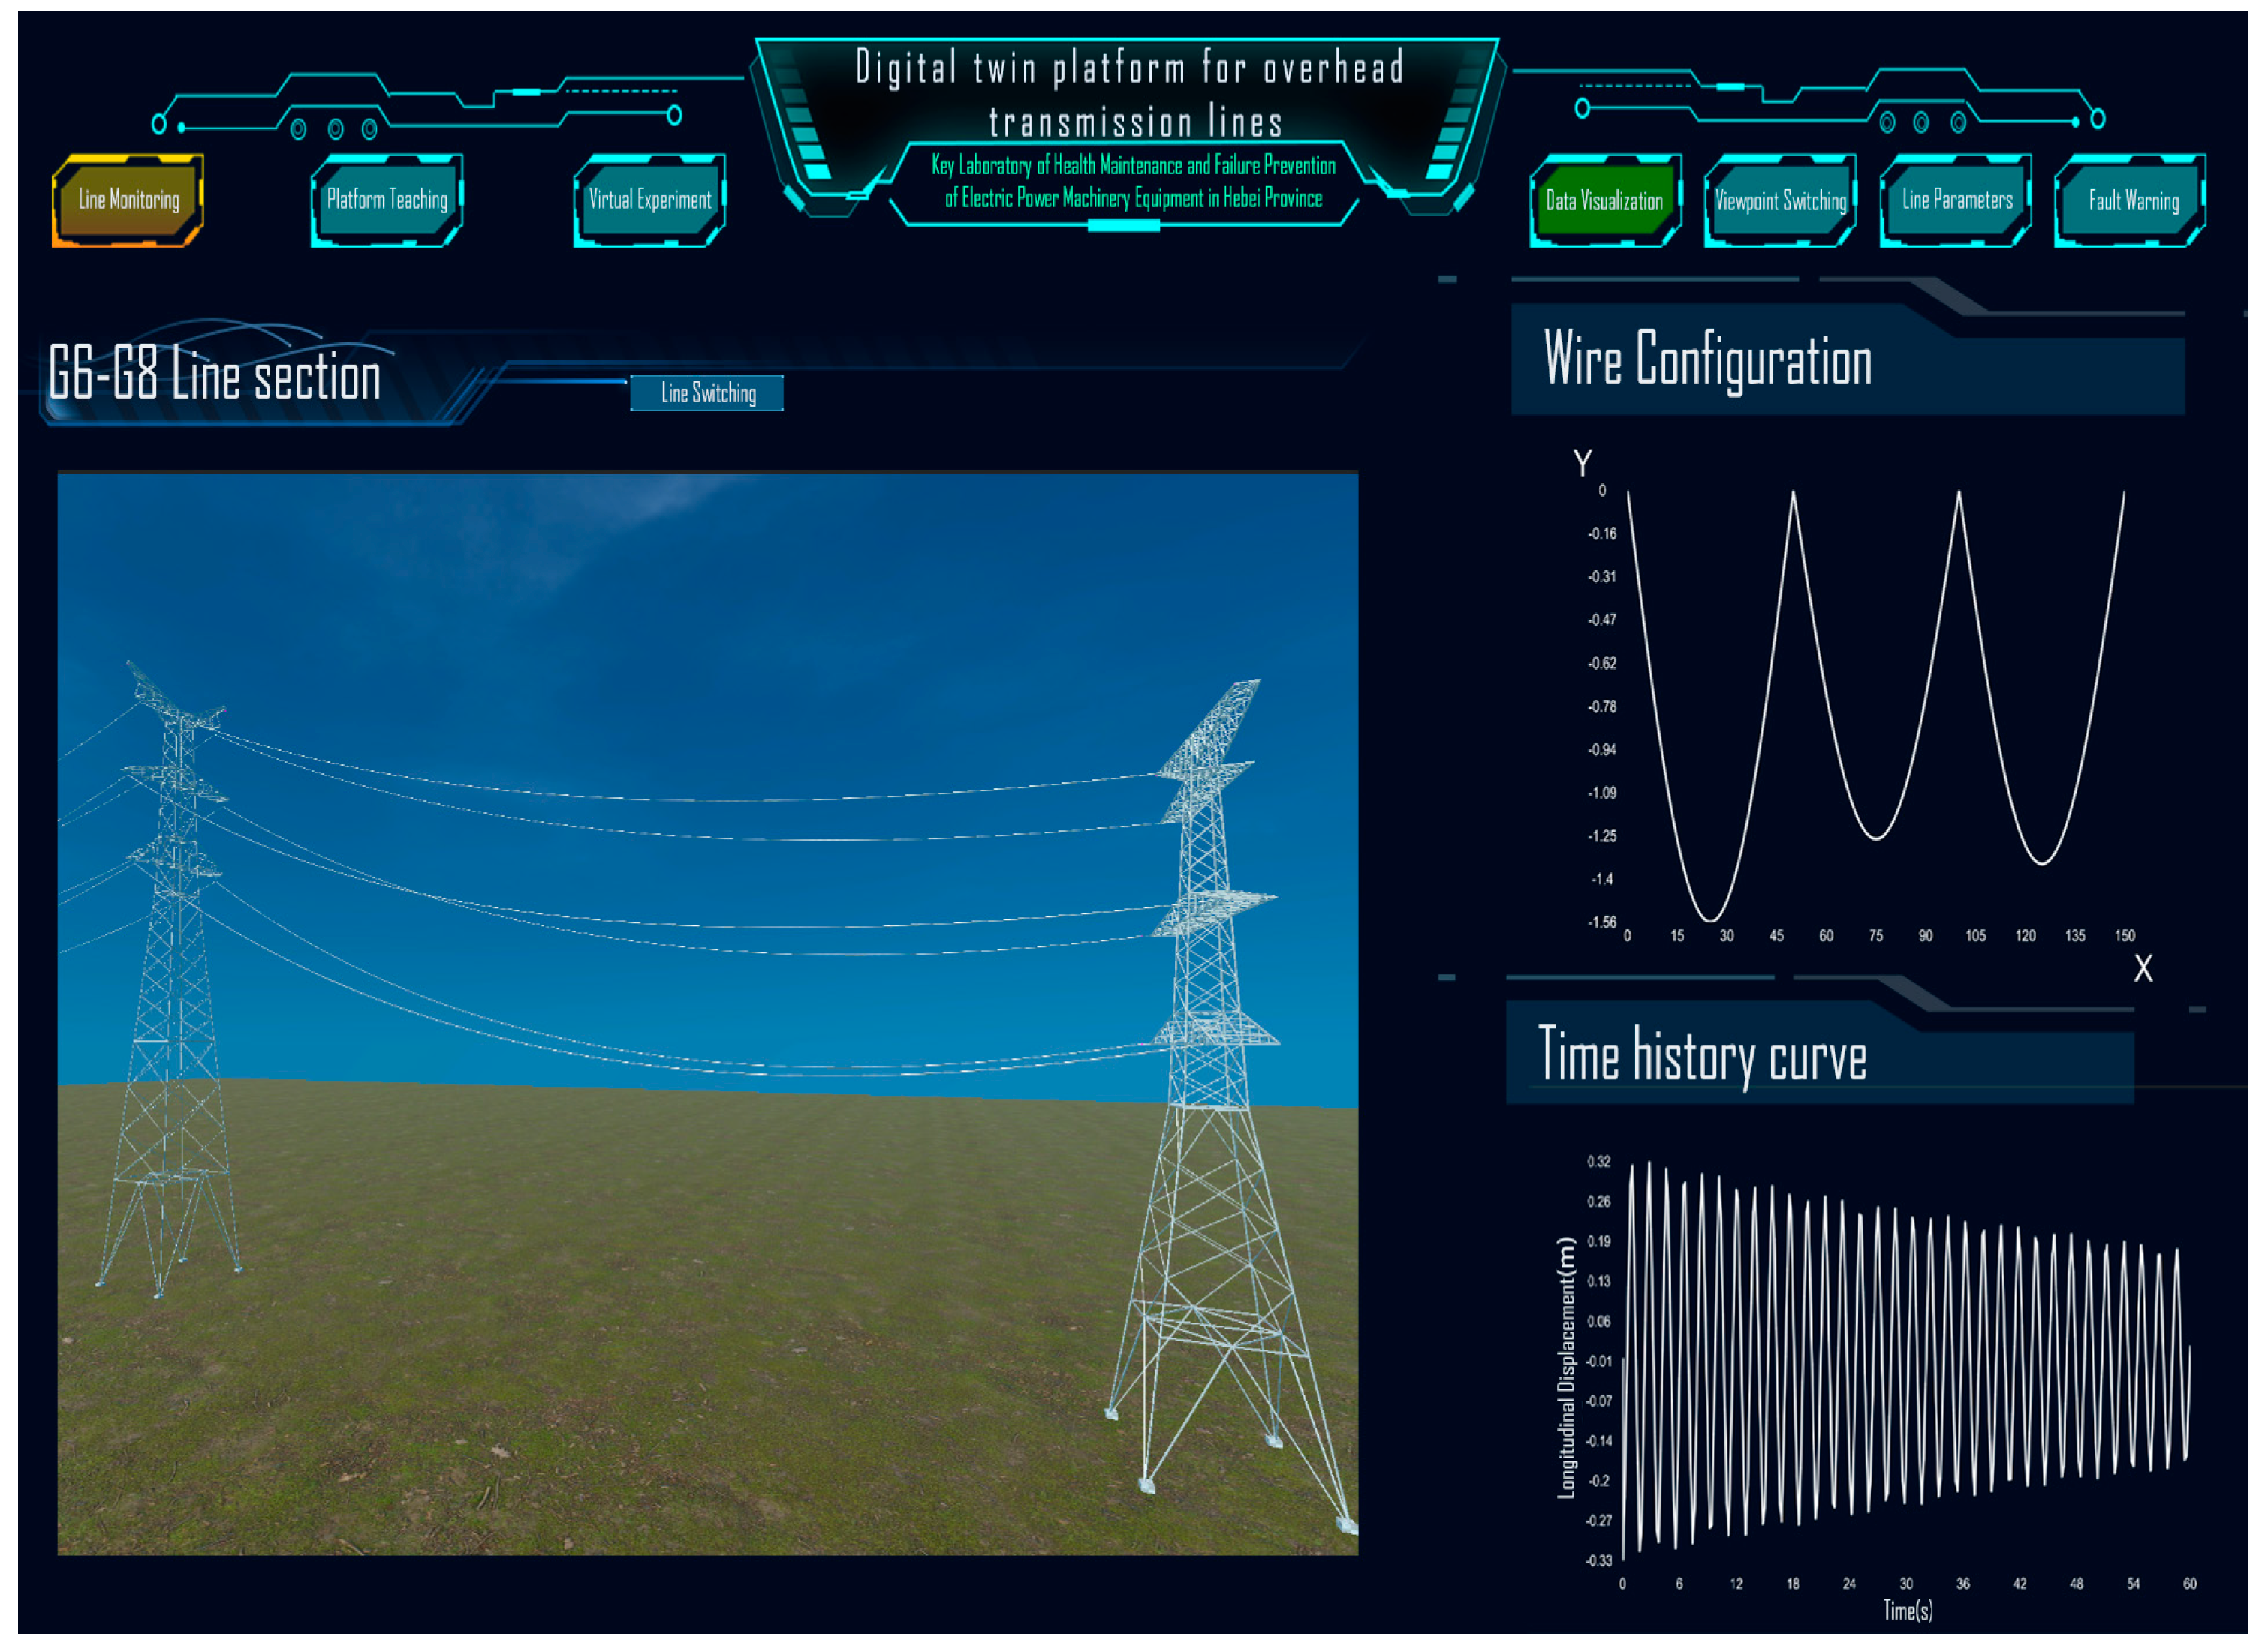
To ensure the implementation of the visualization function of the digital twin platform, a mapping virtual circuit is constructed using the Unity3D development engine, as illustrated in Figure 7.
After completing the construction of the virtual circuit scene, to enable virtual-real interaction, a series of behavioral logic models with specific behaviors and logical relationships need to be established. The data-driven deicing oscillation process of transmission lines is achieved by utilizing external sensors and transmission line communication protocols to collect real-time data, bind model variables, and preset behaviors.
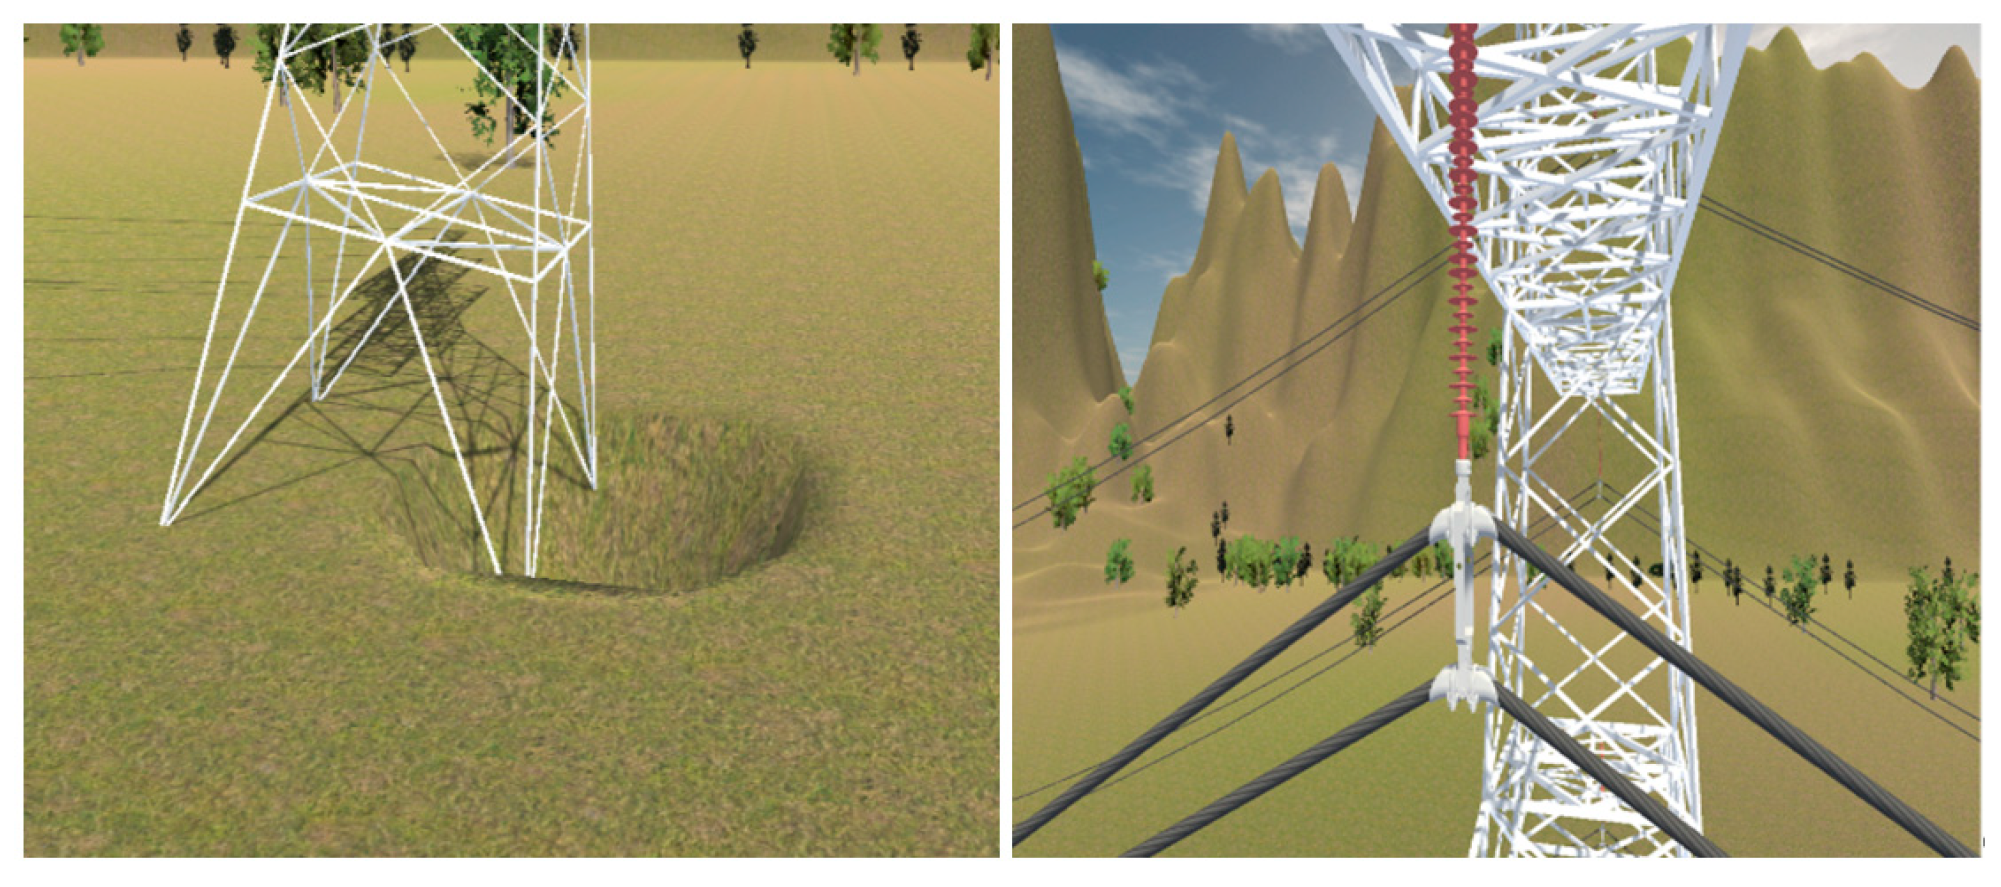
A parent–child relationship exists within the structure of the model tree, and the SetParent function, written in C#, can be employed to establish this relationship between the two models. For example, the parent–child relationship of iron towers, conductors, and suspension insulator strings varies during the deicing process. The motion of the transmission line model involves two types: movement and rotation. The Translate and Rotate functions are used to achieve functions such as wire deformation and suspension string rotation, enhancing the content of the virtual transmission line digital space. Subsequently, a high-fidelity simulation program is constructed using C# scripts to map the geometric behavior of the physical world, providing users with a more immersive perception and enriching model details. As illustrated in Figure 8, details such as ground depressions and fittings connections are proportionally restored.
The transmission line deicing twin interaction platform serves as a window for interacting with twin geometry and digital models, acting as a key component in showcasing the twin system externally. The platform utilizes C# language to develop relevant interface programs for data information transmission and conducts an applicability analysis on the built model. Sensors are employed to monitor the action parameters of physical devices, and these data are input into the twin digital model of the circuit to generate twin control data. These control instructions are uploaded to the deicing twin interaction platform, controlling the motion of the virtual circuit and outputting relevant charts, thereby achieving virtual–real synchronization.
This section analyzes the functions of the twin dynamic geometric model, designs and plans the implementation process, and then develops a twin system interaction platform, providing a clear solution for achieving accurate mapping of virtual and real lines.

4. Comparisons and Discussion

In this study, the data obtained from the identification of measurement points on the experimental route were compared with the theoretical solution that calculates the span and tension unchanged, demonstrating the necessity of correction. Subsequently, the model was corrected in real time through the combination of measurement data and algorithms. Finally, the calculated value of the twin model at the marked position was output and compared with the actual measurement data to verify the accuracy of the twin model.
As depicted in Figure 9, a real experimental platform for continuous three-level conductors was constructed. The two ends of this section of the line were fixed and suspended at an equal height, and the connection point between the wire and the insulator string was at the same height. The second and third suspension points could rotate around the fixed point through the insulator string. In order to save space and facilitate line hanging, the sections of the tower body were ignored. The tower head was directly installed on the concrete pile foundation, and a pose sensor was installed on the straight tower to measure the swing angle of the suspension insulator string.
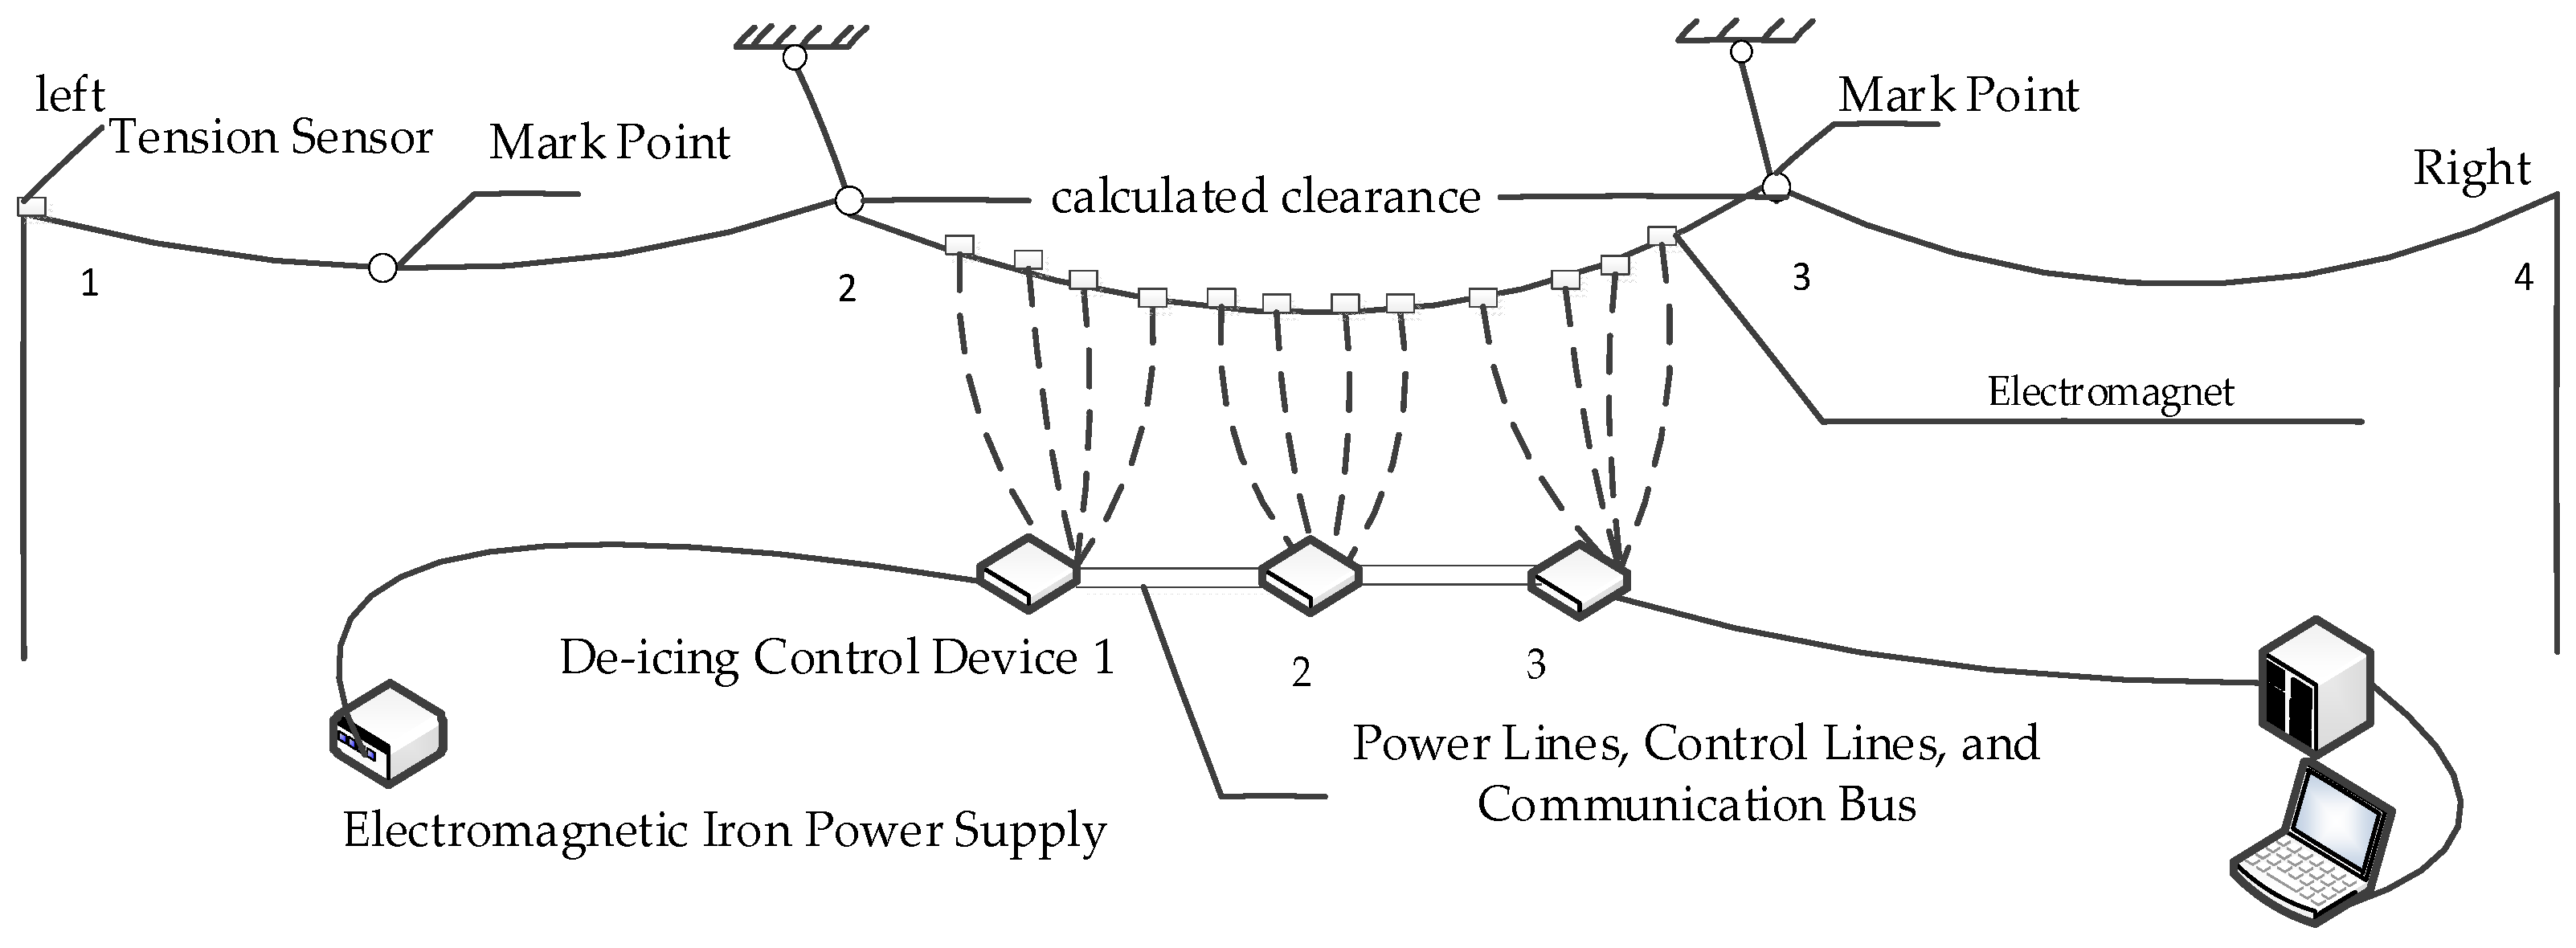
For the convenience of understanding the experimental process, a schematic diagram shown in Figure 10 was used to supplement and explain the various experimental conditions. The initial span of each gear was 150 m, the wire model was ACSR240/40, the unit length mass was 0.601 kg/m, and the sampling frequency was 22 Hz to ensure that the entire process was carried out under windless conditions. The experiment was divided into three groups. The first group involved the second level of the line covered with ice, with ice thicknesses of 15 mm and 20 mm, respectively, while the other two levels were not covered with ice. The second group of experiments included the first level of the line covered with ice, with ice thicknesses of 10 mm and 15 mm, respectively, while the other two levels were not covered with ice.
In this experiment, three built-in chip deicing test boxes were utilized and connected. Each deicing test box was linked to four electromagnets, and sandbags were suspended on the electromagnets to simulate icing conditions. The wire hanging points were numbered 1, 2, 3, and 4. The simulation experiment in this article employed a monocular method for measurement, and three circular marking points were established at node 2, node 3, and x = 25 m on the wire.
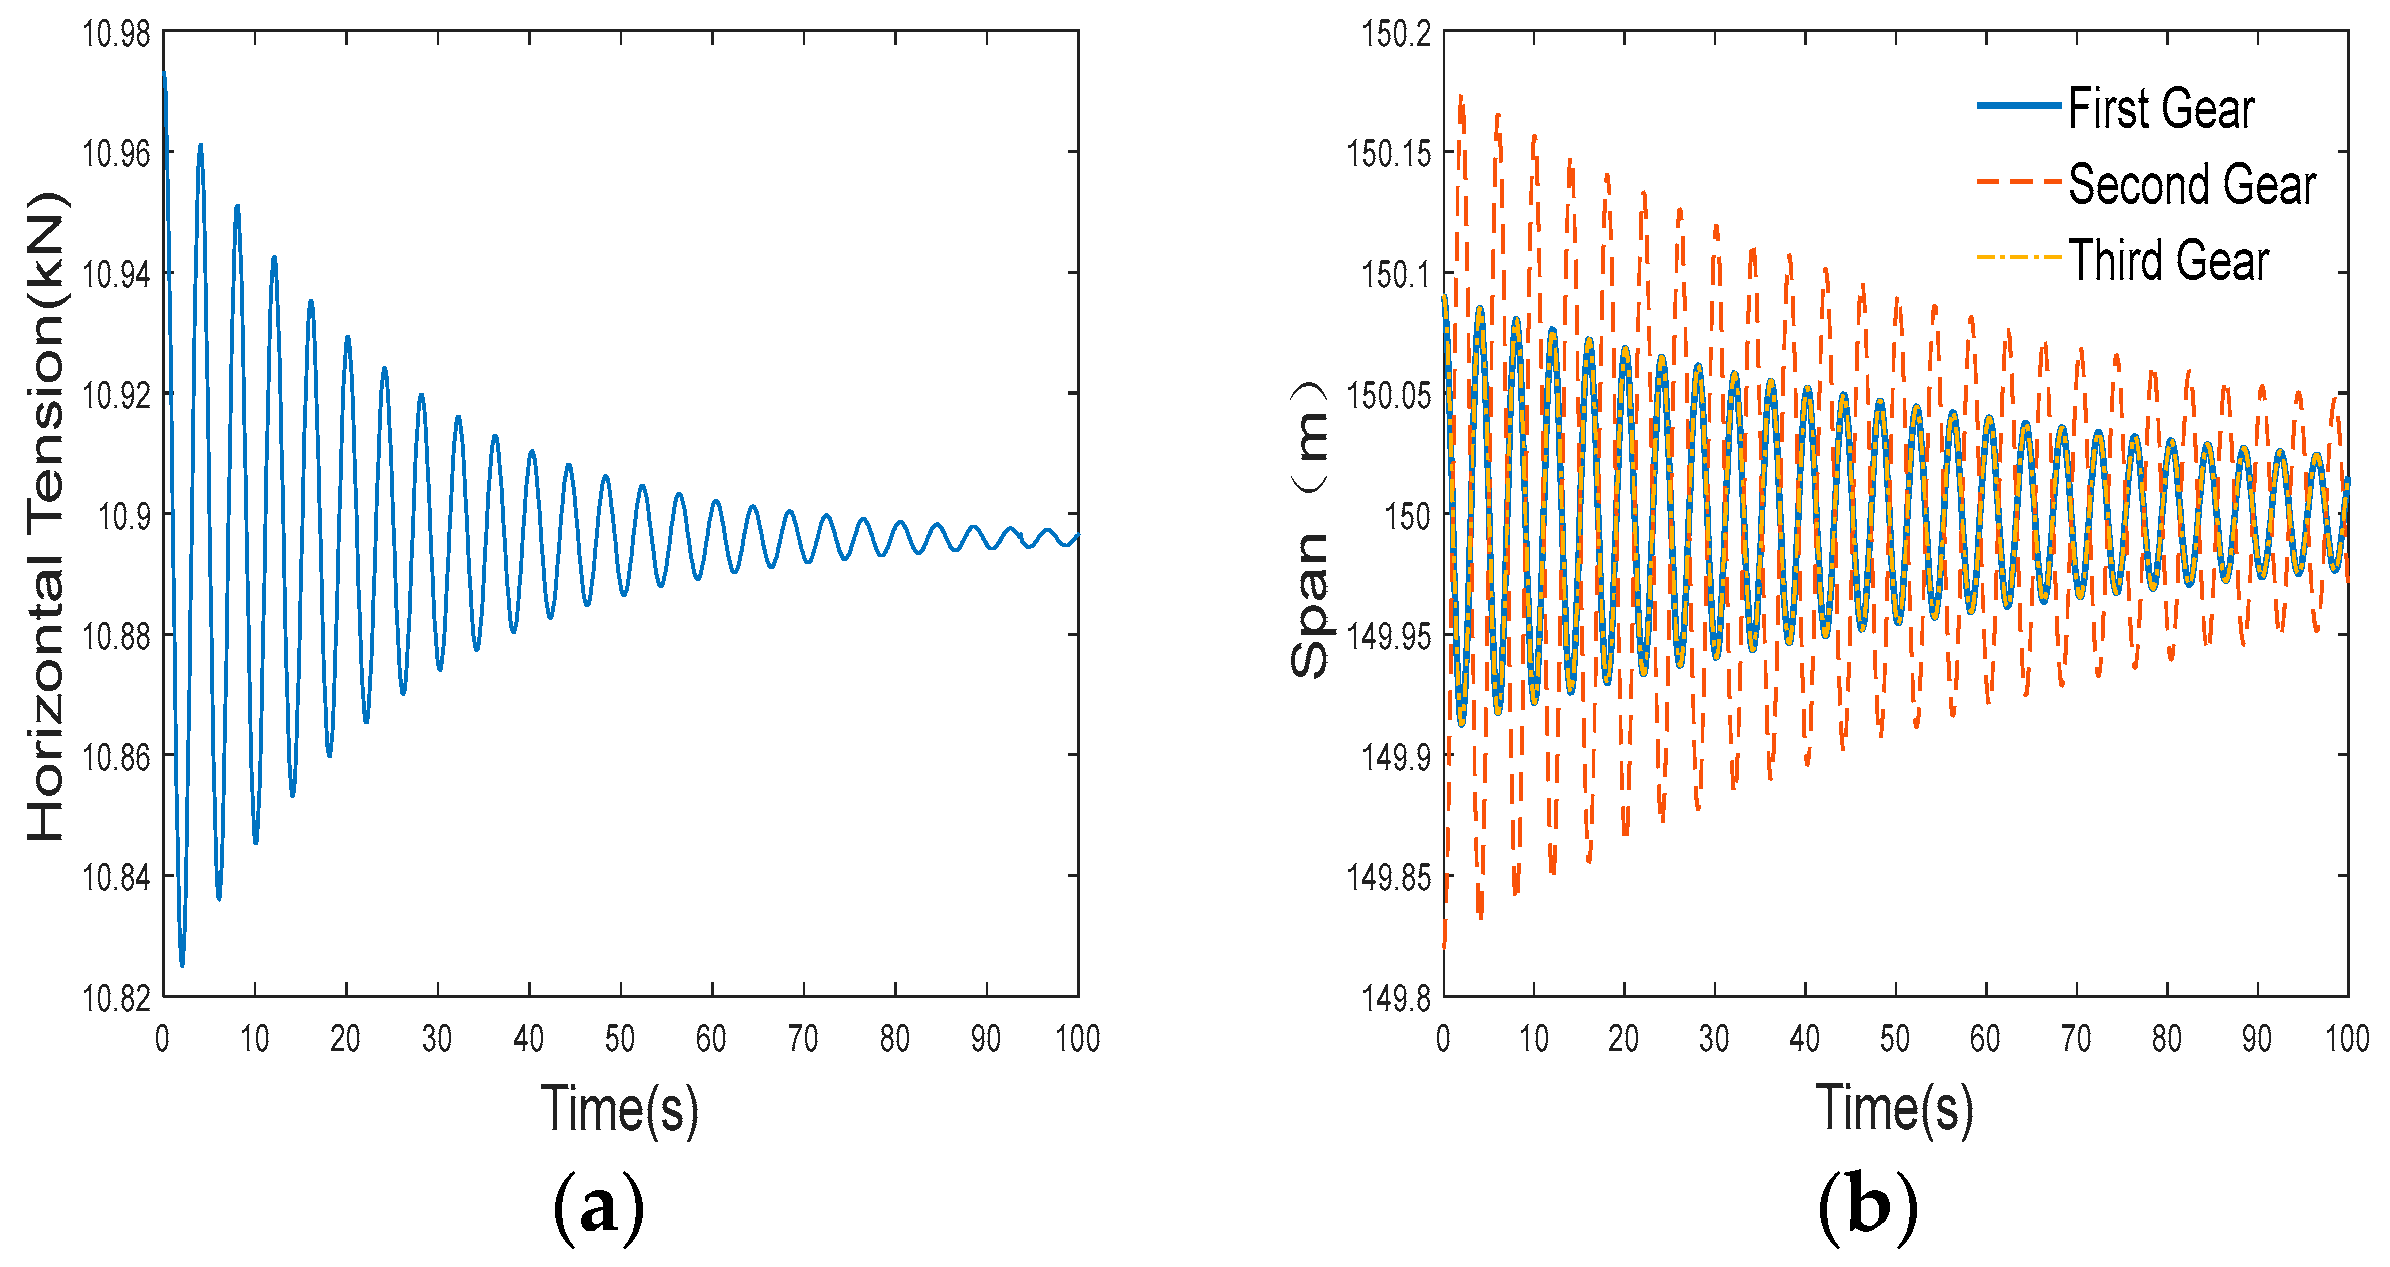
This system was employed for continuous partial deicing. The first group represents the second-level deicing experiment. Figure 11a illustrates the measurement of the horizontal tension of the first-level wire, and Figure 11b displays the displacement of hanging points 2 and 3 relative to the self-weight balance position. Subsequently, in combination with the initial span, the time–history curve of the calculated span change was obtained. It was observed that the deicing oscillation of the wire was an attenuated oscillation motion, and the calculated amplitude of the ice-covered span was larger than that of the non-ice-covered span.
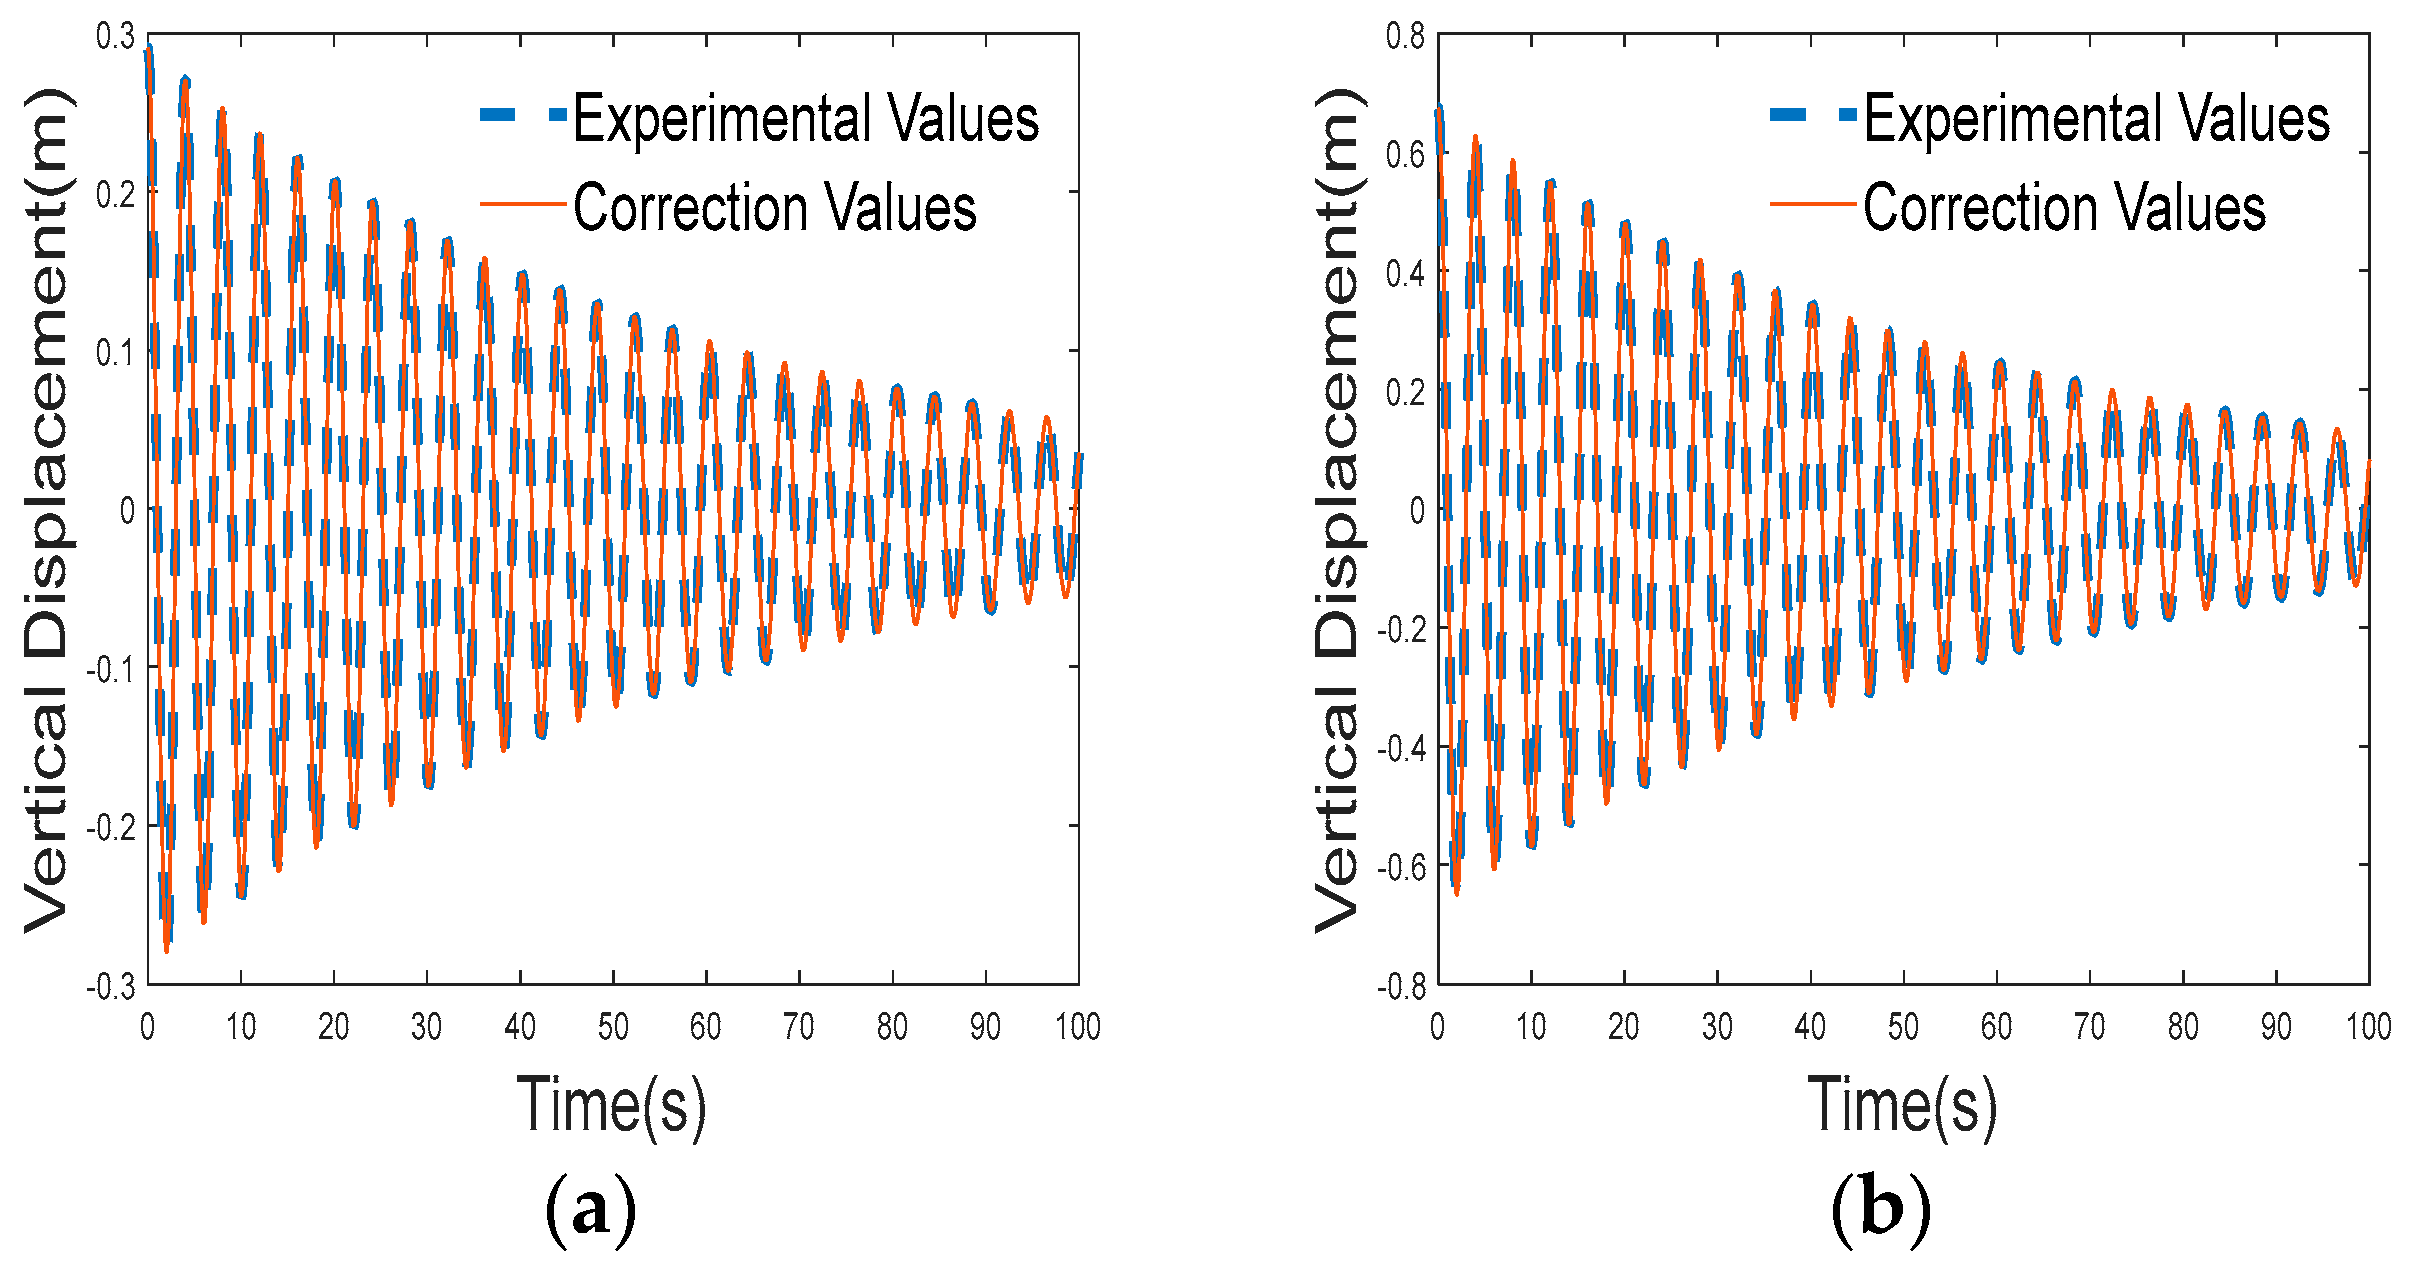
Subsequently, the platform was used for 15 mm and 20 mm deicing experiments, and the measurement values corresponding to the marked points of the dual model correction solution were compared. The results are shown in Figure 12.
Figure 12a depicts the comparison of the experimental values and corrected solutions of the vertical displacement of the second-stage conductor during full deicing with a 15 mm ice cover. Figure 12b illustrates the comparison of the displacement with a 20 mm ice cover during full deicing. The comparison has revealed that as the ice thickness increases, the displacement after deicing gradually increases.
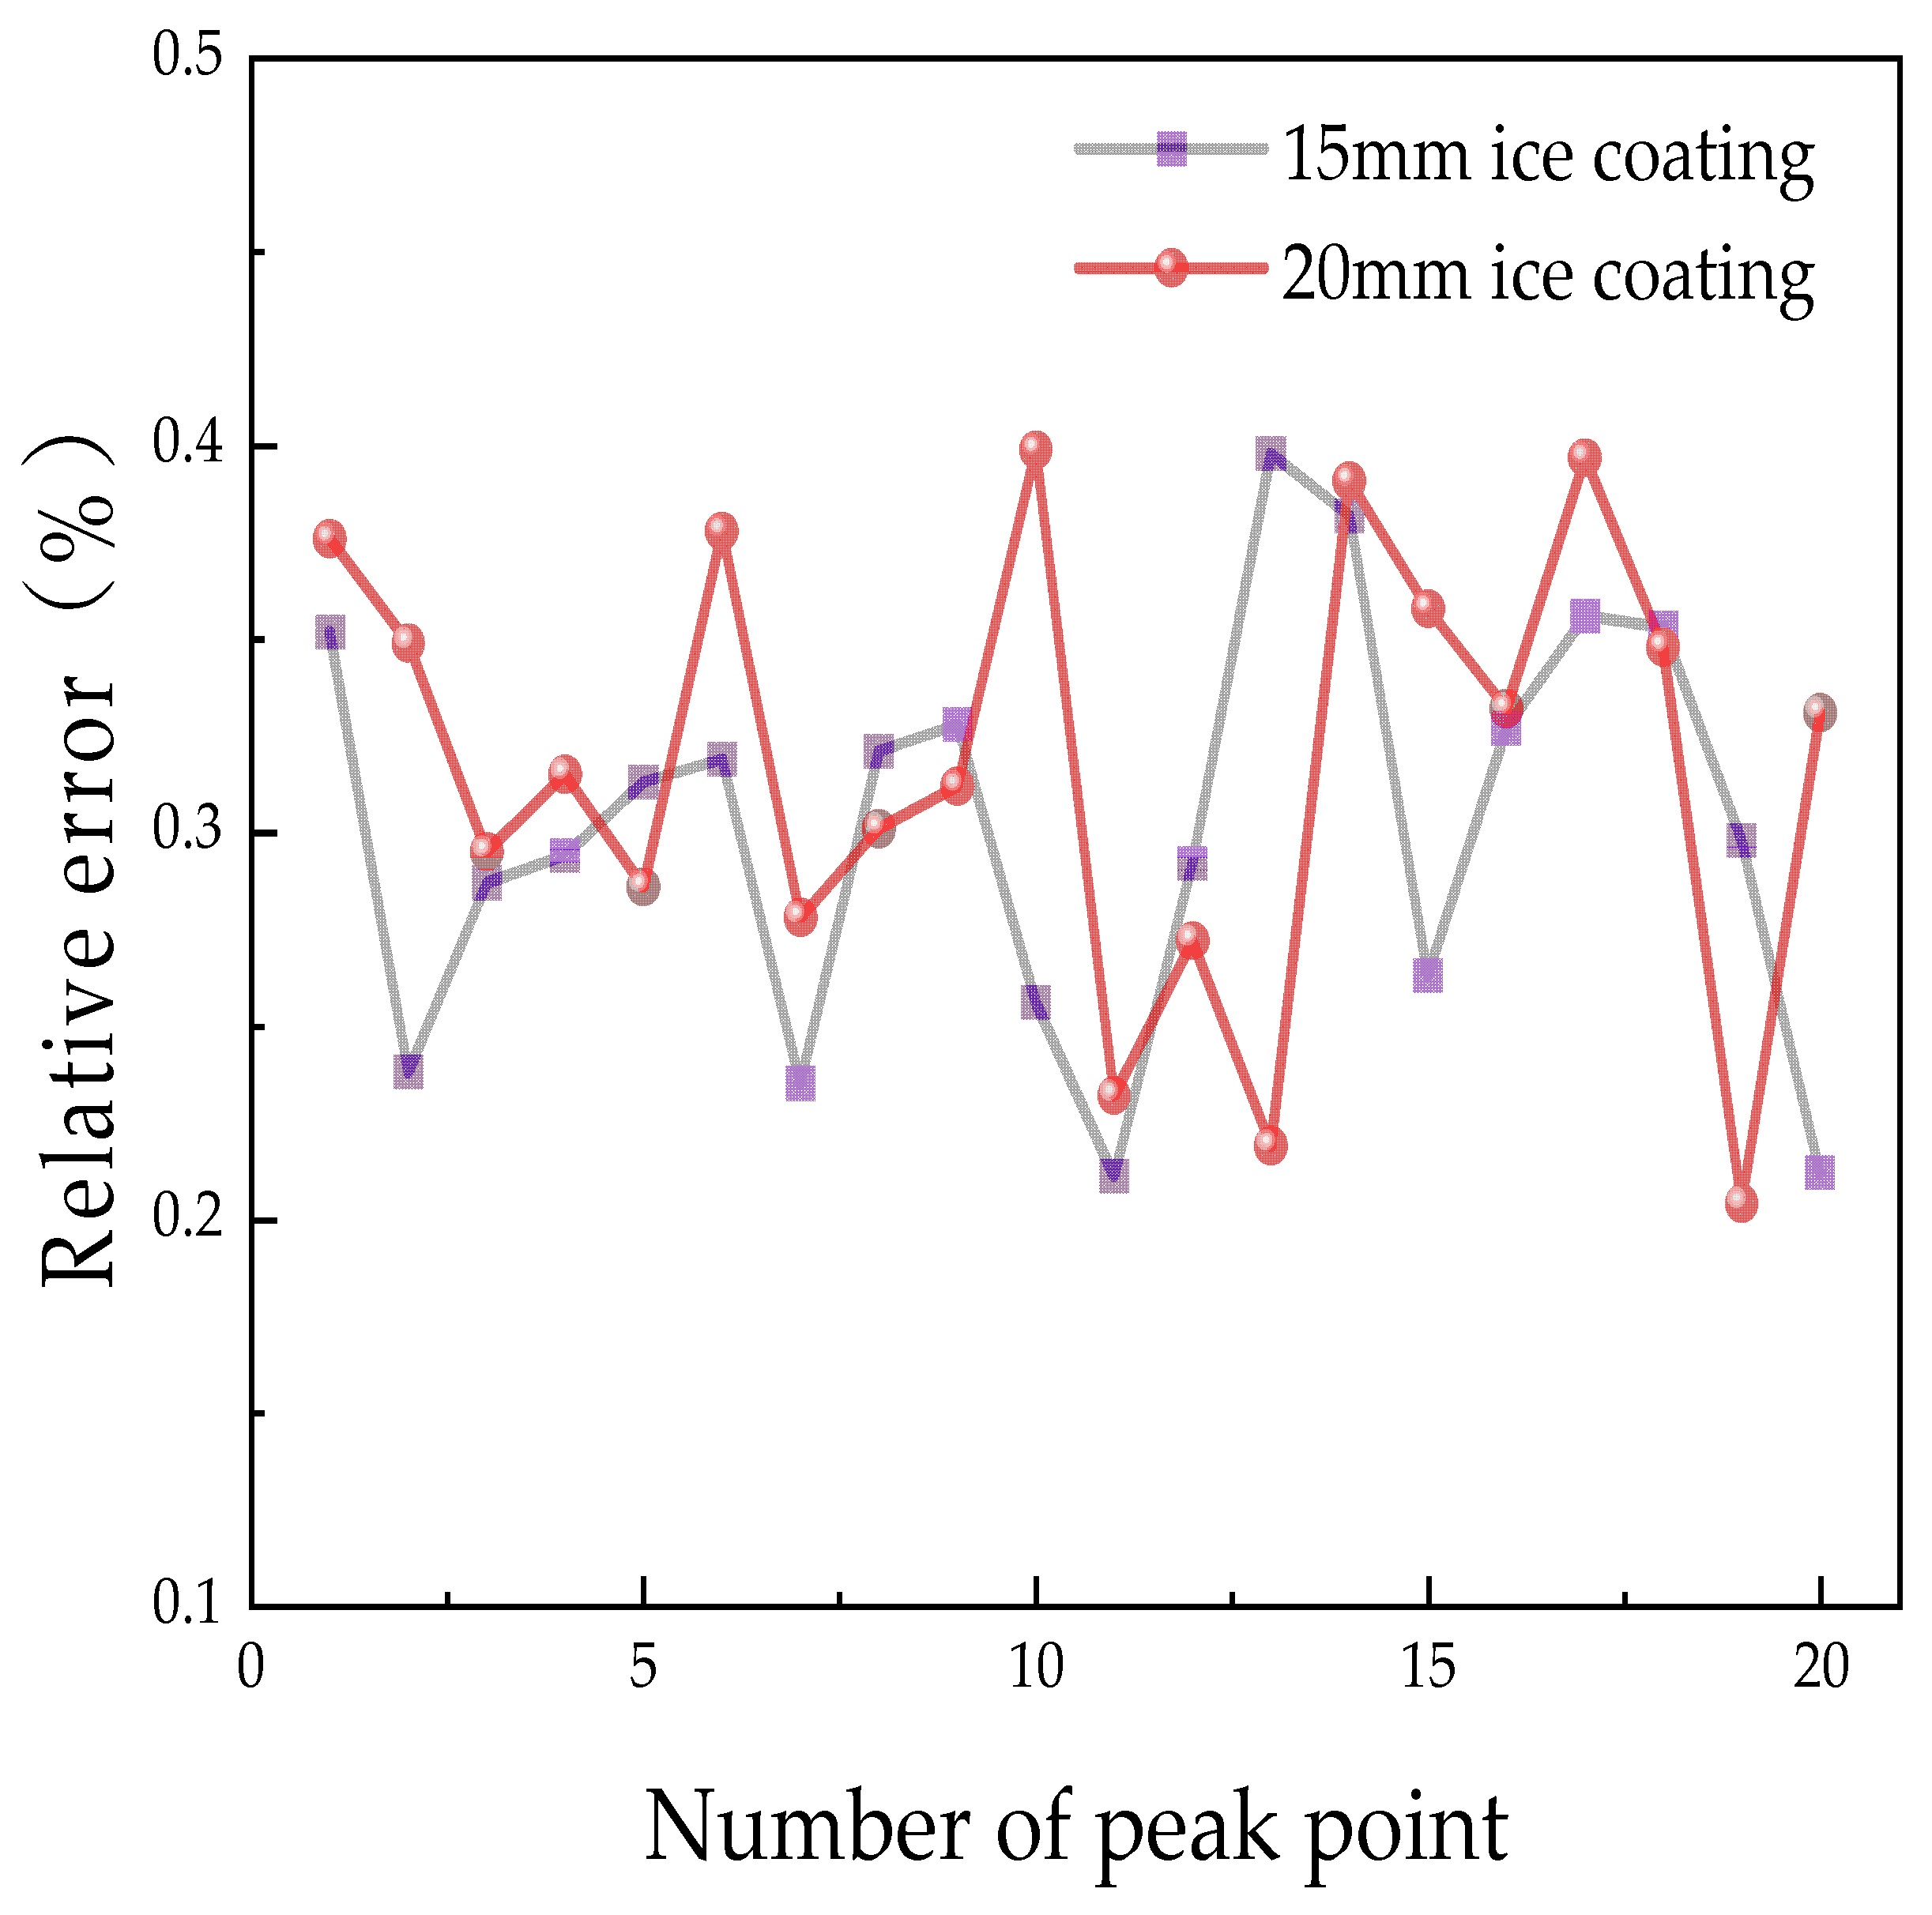
The difference between true peak and calculated peak values was used here to measure the error, which was:
ε = A T A F A T × 100 %
where A T was the measured true peak and A F was the peak calculated by the model. The highest risk of flashover caused by deicing oscillation of the wire occurs near the point where the wire vibrates to a larger amplitude. Therefore, starting from the starting point, in the two analysis graphs in Figure 12, 20 peak points (including peaks and valleys) were extracted from each graph in descending order of amplitude for comparison, as shown in Figure 13.
From Figure 13, it can be seen that the calculated values for 15 mm and 20 mm deicing had an error within 0.3% compared with the measured values.
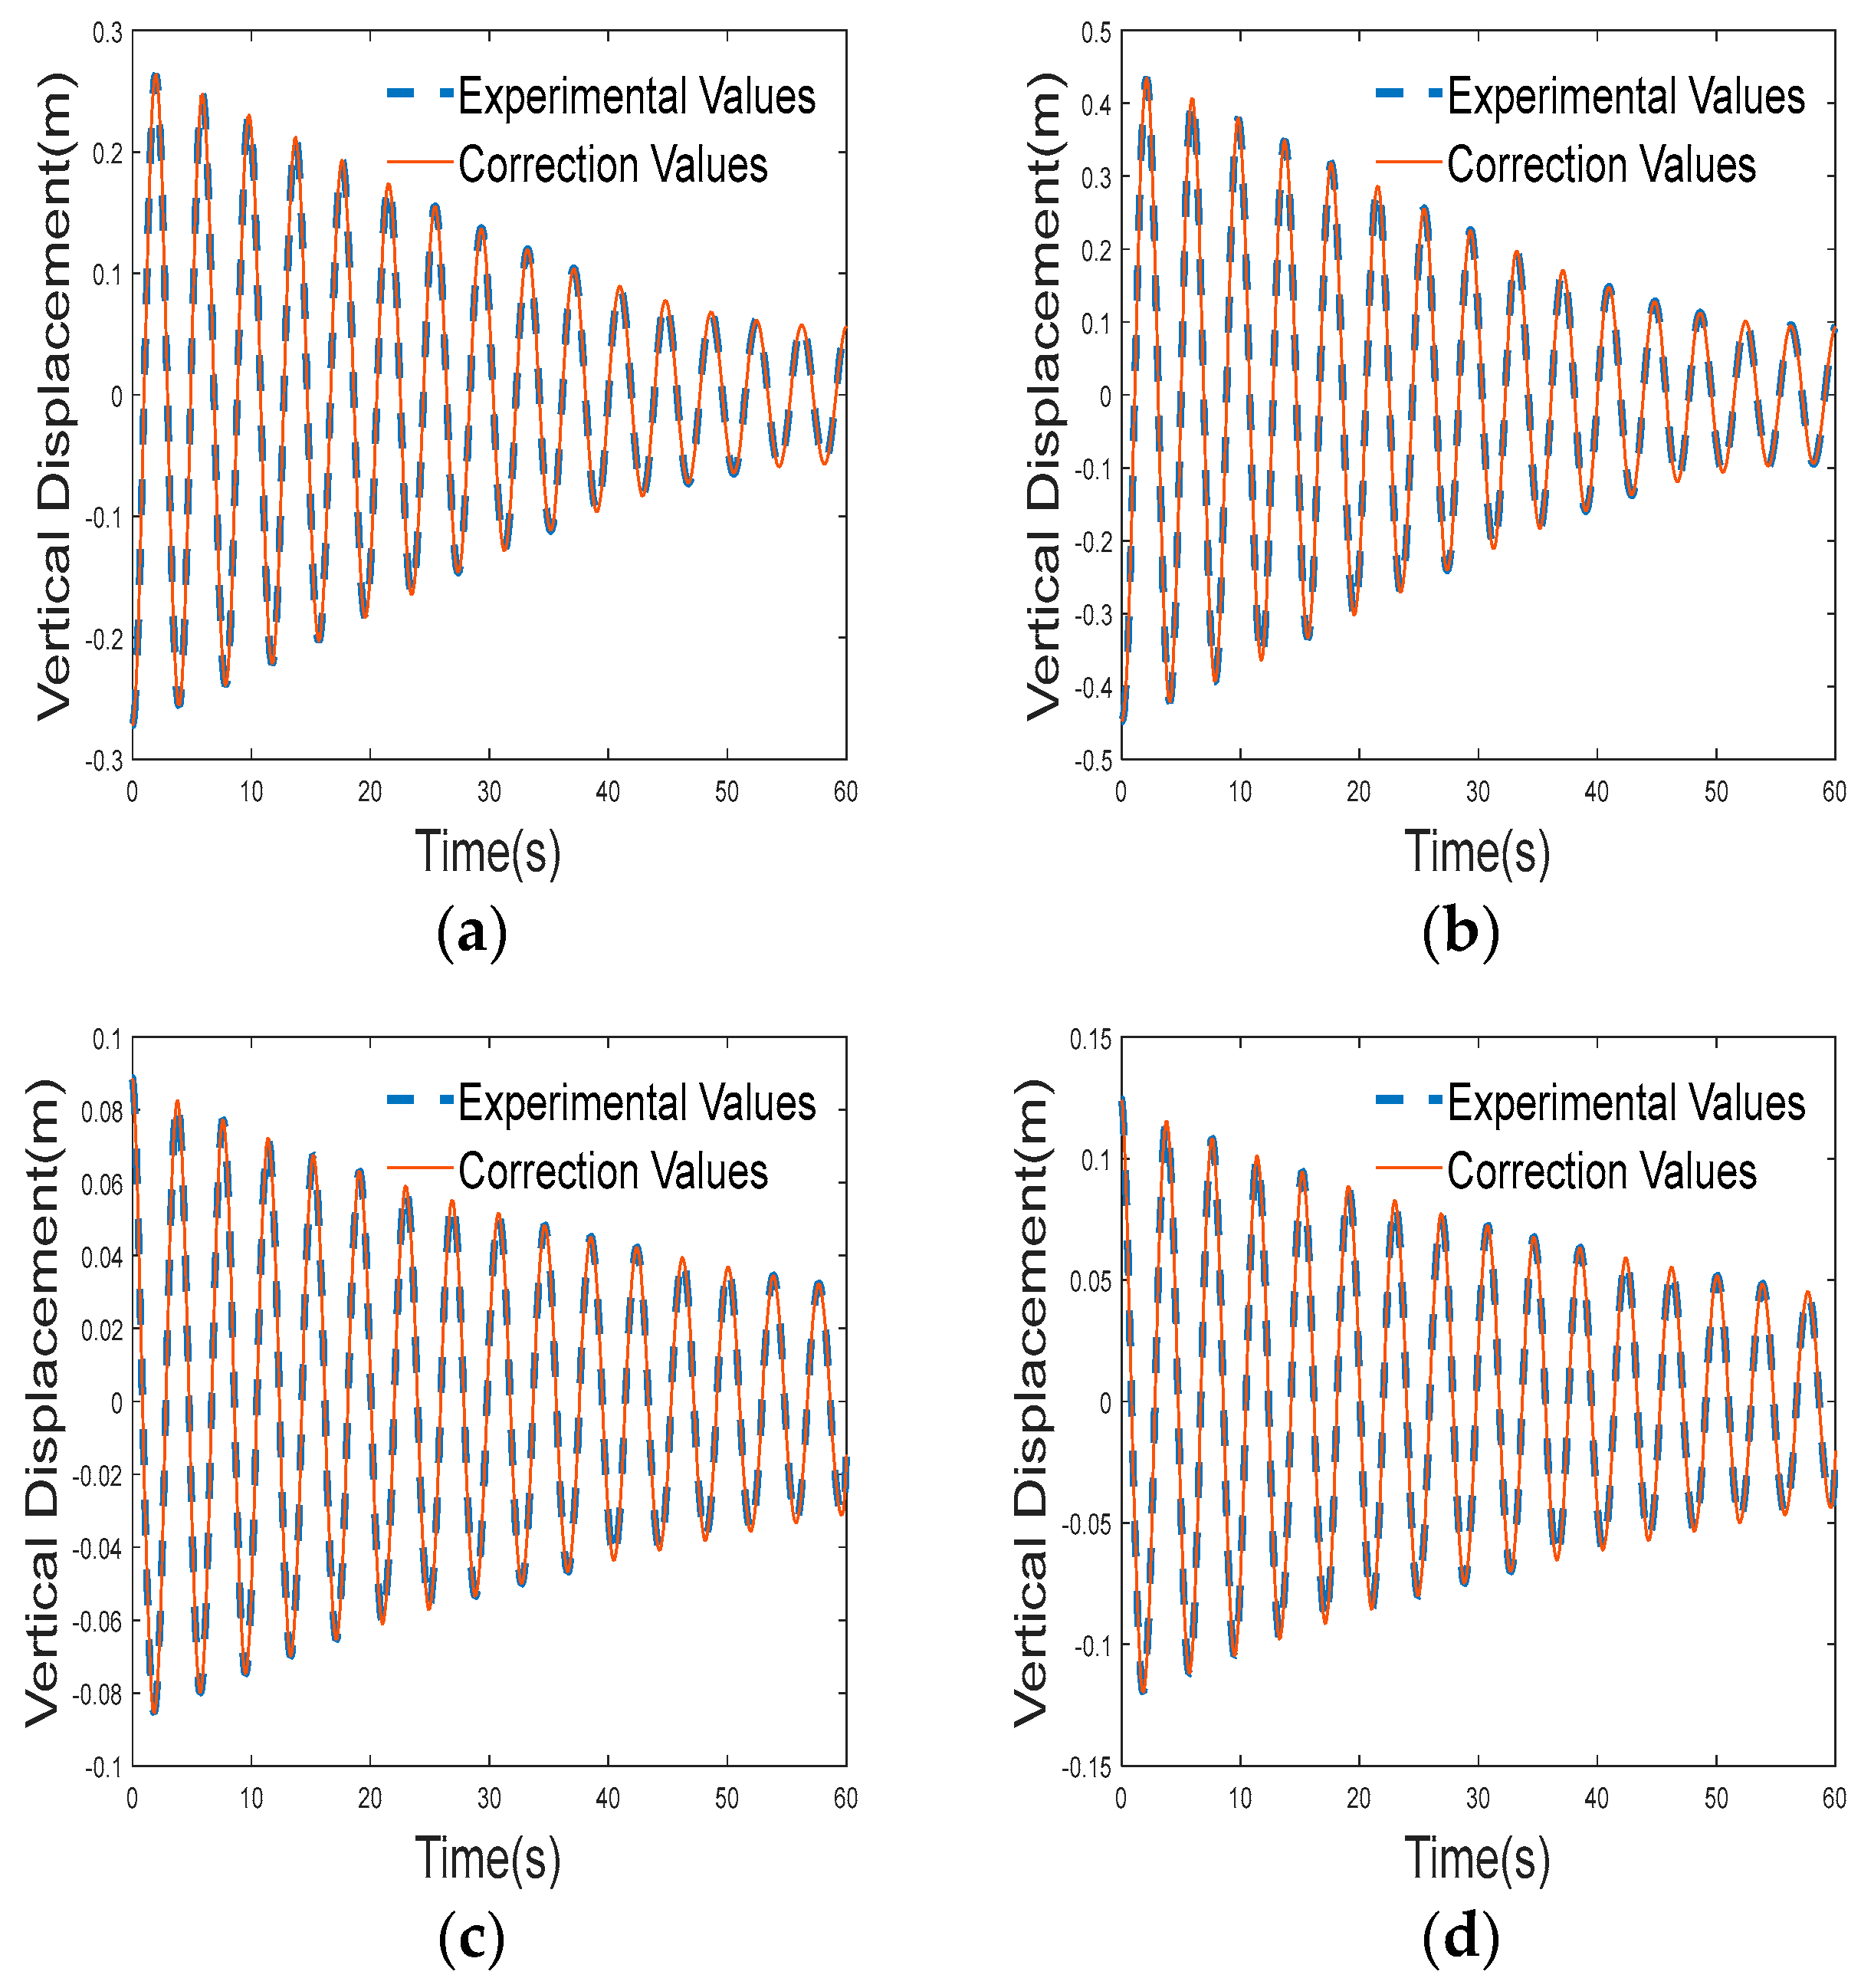
Next, the icing position was altered, and this system was utilized to conduct continuous partial deicing experiments for the second group with 10 mm and 15 mm icing in the first group, as well as complete deicing experiments for the third group with 10 mm and 15 mm icing. The results are presented in Figure 14.
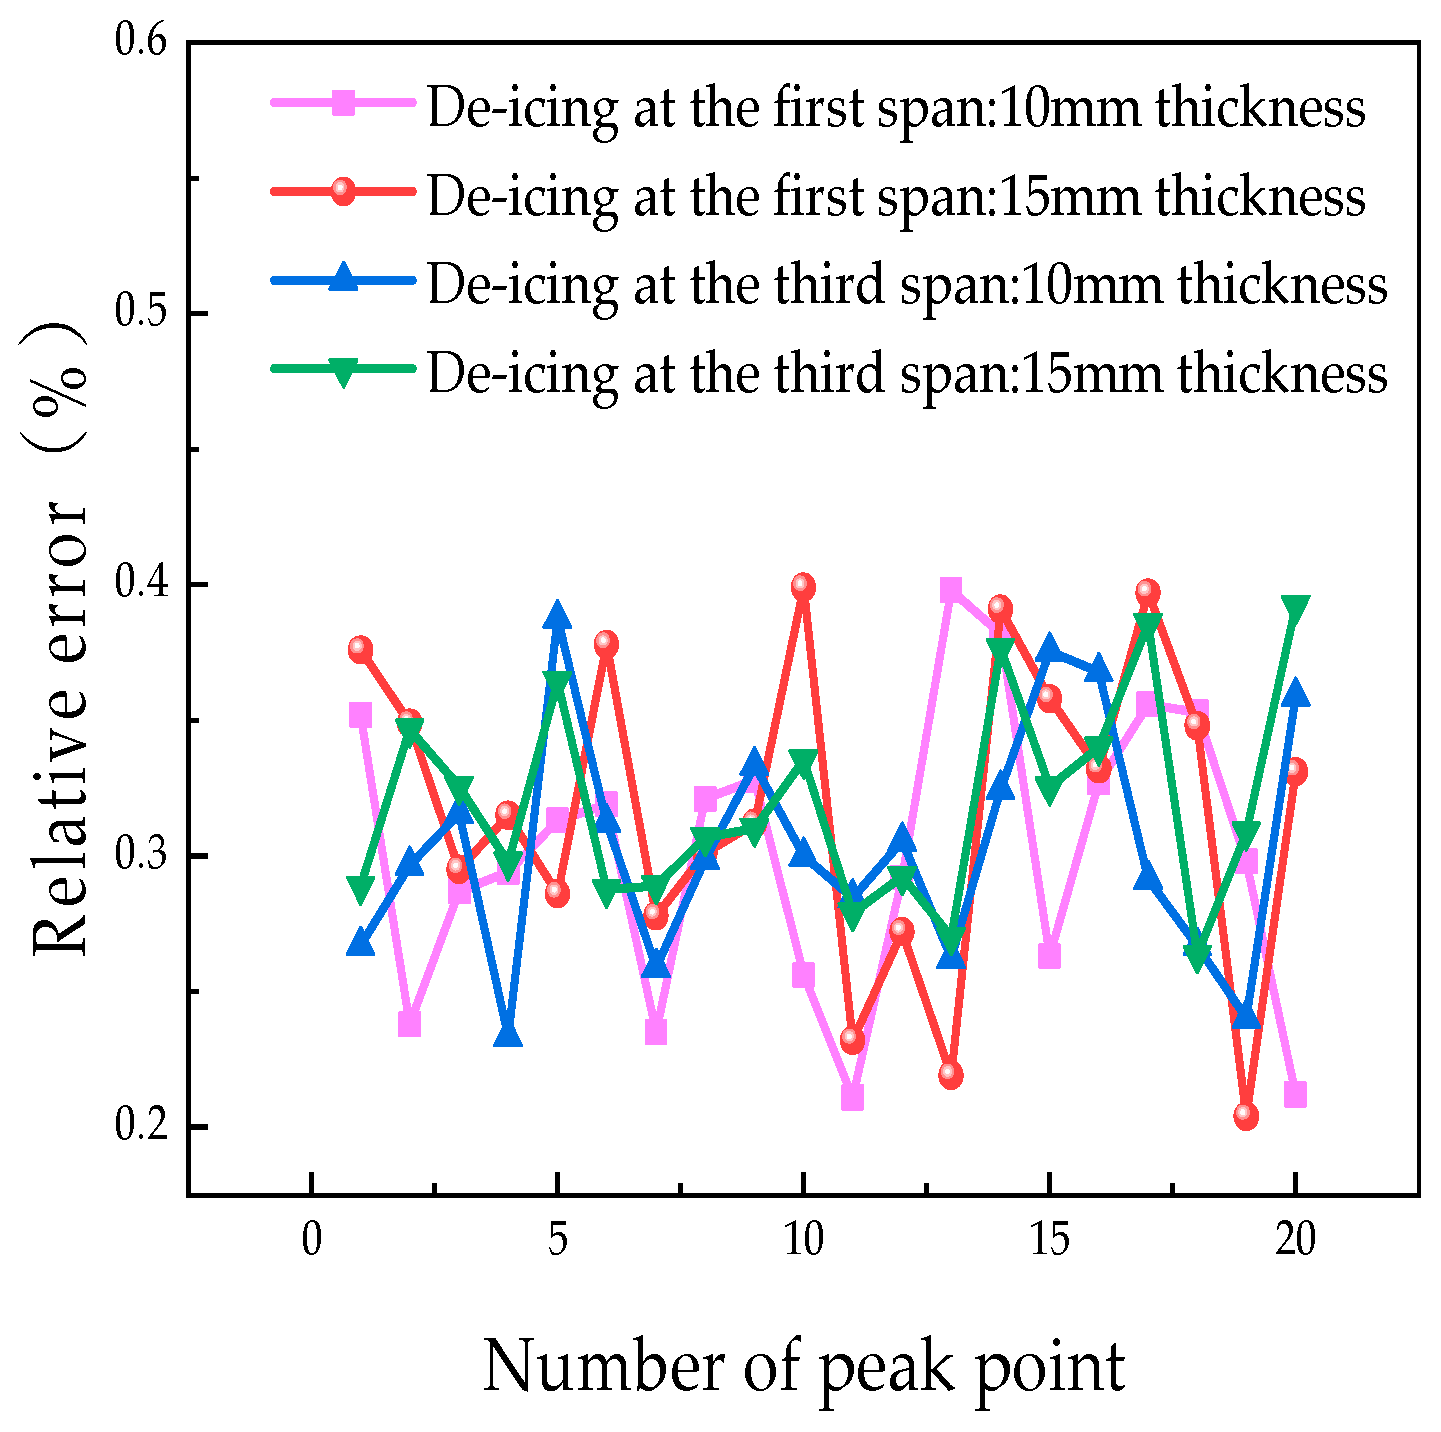
Figure 14a,b displays the vertical displacement of the first-level conductor under different working conditions, while Figure 14c,d illustrates the vertical displacement of the second-level conductor under different working conditions. The measurement point x = 25 m is fixed, and the comparison shows that the closer the position is to the deicing gear, the more severe the vibration is. The highest risk of flashover caused by deicing oscillation of the wire occurs near the point where the wire vibrates to a larger amplitude. Starting from the starting point, 20 peak points (including peak and valley points) have been extracted from each of the four analysis graphs in Figure 14 in descending order of amplitude for comparison, as shown in Figure 15.
Comparing the calculated and measured values of the first-stage 10 mm and 15 mm deicing and the third-stage 10 mm and 15 mm deicing, it could be seen that the error was stable at 0.3%. Based on three sets of experimental results, it could be proven that this system could achieve high-fidelity modeling, and the results were highly close to real data.

5. Conclusions

To tackle the challenge posed by existing simulation technologies unable to fully replicate the time-varying characteristics of real-world scenarios, this paper proposes the design of a digital twin system for deicing overhead transmission lines. The system leverages real-time data from sensors and integrates the data with theoretical model solutions through a time-series segmentation algorithm to construct a model and data-fused digital twin for power transmission lines on a 3D engine. The system accomplishes two core functionalities: accurate mapping and real-time simulation. Additionally, a conductor experimental platform is established, utilizing the concentrated mass method to simulate conductor deicing oscillations and verify the reliability of the digital twin system. The theoretical contributions are summarized as follows.

5.1. Theoretical Contributions

This study first considers the effects of damping, wire weight, icing, horizontal tension, and calculated span changes on the wire oscillation process. A new modeling method for a new digital model of the transmission line deicing system is proposed. The method takes any transmission line as the research object, establishes a differential equation for wire oscillation with constant tension and span, combines the analytical solution with the measured time-varying parameters, and establishes a real-time iterative and updated twin digital model of wire oscillation that integrates mechanism and data. Moreover, the model can reflect the real situation and, thus, provide more realistic results since the model considers the new features caused by the application of the digital twin dynamic model.
Second, this study proposes a dynamic geometric twin model that accurately represents the actual power line and ensures fast and stable data transmission from selection to application. This program comprehensively analyzes the functions, designs, and plans the implementation process, and then develops a twin system interaction platform, providing a clear solution for achieving precise mapping of virtual and real lines.
Third, through experiments on established real power lines, this study proves that wire deicing oscillation is an attenuated oscillation motion. By comparing the 20 representative peak points with larger amplitudes on the calculation model under different working conditions with corresponding measurement data values, it is proved that the model error in this paper is around 0.3%, which can achieve the expected accurate mapping.

5.2. Future Perspectives

The main focus of this study is on the deicing oscillation with predominant planar motion. Expanding on the established digital twin platform, future exploration may extend to more movement phenomena of conductors. It is expected that these advances will contribute to the digital transformation of transmission lines, thereby improving the stability and safety of the power system.

Author Contributions

Conceptualization, Q.C., R.M. and Z.W.; methodology, Q.C.; software, Q.C. and T.L.; validation, Q.C.; formal analysis, Q.C.; investigation, Q.C.; resources, Q.C.; data curation, Q.C.; writing—original draft preparation, Q.C.; writing—review and editing, Q.C.; visualization, Q.C.; supervision, Q.C.; project administration, Q.C.; funding acquisition, Z.W and R.M. All authors have read and agreed to the published version of the manuscript.

Funding

This research was funded by the Natural Science Foundation of China (Grant No. 71971139).

Data Availability Statement

Data are contained within the article.

Conflicts of Interest

The authors declare no conflicts of interest.

References

  1. Ru, L.; Yu, H.; Xiang, W.; Bo, Z.; Hao, C. Estimating the Impacts of a New Power System on Electricity Prices under dual Carbon Targets. J. Clean. Prod. 2024, 438, 140583. [Google Scholar] [CrossRef]
  2. Jing, H.; Feng, M.; Bi, R.; Zhou, T.; Ju, H.; Qiang, L. Minimum Inertial Demand Estimation of Renewable Energy Considering New Power System Frequency Constraints Using Sparrow Search Algorithm. Energy Rep. 2023, 9, 476–482. [Google Scholar] [CrossRef]
  3. Xiang, C.; Guang, T.; Yan, H.; Yang, Y.; Jia, L.; Yu, W.; Yuan, C. New Power System Development Path Mechanism Design. Glob. Energy Interconnect. 2023, 6, 166–174. [Google Scholar] [CrossRef]
  4. Jun, Z.; Chi, W.; Gong, W.; Du, J.; Yong, Y. Research on Investment-return Model of New power System Considering Financial Pressure. Energy Rep. 2023, 9, 540–546. [Google Scholar] [CrossRef]
  5. Viana, M.S.; Ramos, D.S.; Manas Junior, G.; Udaeta, M.E.M. Analysis of the Implementation of Virtual Power Plants and Their Impacts on Electrical Systems. Energies 2023, 16, 7682. [Google Scholar] [CrossRef]
  6. Chen, L.; Shi, X.; Peng, B.; Sun, J. Dynamic Simulation of Power Systems Considering Transmission Lines Icing and Insulators Flashover in Extreme Weather. IEEE Access 2022, 10, 39656–39664. [Google Scholar] [CrossRef]
  7. Liu, Y. Dynamic Interactive Characteristics Between Icicle Growth and Corona Discharge on HVDC Outdoor Insulator During Icing Accretion. High Volt. 2023, 8, 570–582. [Google Scholar] [CrossRef]
  8. Weng, B. Newly designed identifying method for ice thickness on high-voltage transmission lines via machine vision. High Volt. 2021, 6, 904–922. [Google Scholar] [CrossRef]
  9. Shu, L.; Liu, Y.; Jiang, X.; Hu, Q.; He, G.; Yu, Z.; Xiao, L. Three-dimensional electric field simulation and flashover path analysis of ice-covered suspension insulators. High Volt. 2020, 5, 327–333. [Google Scholar] [CrossRef]
  10. Huang, Y.; Jiang, X.; Virk, M.S. Ice Accretion Study of FXBW4-220 Transmission Line Composite Insulators and Anti-icing Geometry Optimization. Electr. Power Syst. Res. 2021, 194, 107089. [Google Scholar] [CrossRef]
  11. Hu, Q.; Li, T.; Shu, L. Dynamic Characteristics of the Corona Discharge during the Energised Icing Process of Conductors. IET Gener. Transm. Distrib. 2013, 7, 366–373. [Google Scholar] [CrossRef]
  12. Dong, B.; Jiang, X.; Yin, F. Development and Prospect of Monitoring and Prevention Methods of Icing Disaster in China Power Grid. IET Gener. Transm. Distrib. 2022, 16, 4480–4493. [Google Scholar] [CrossRef]
  13. Jamaleddine, A.; McClure, J. Simulation of Ice-shedding on Electrical Transmission Lines Using Adina. Comput. Struct. 1993, 47, 523–536. [Google Scholar] [CrossRef]
  14. Yan, B.; Chen, K.; Guo, Y. Numerical Simulation Study on Jump Height of Iced Transmission Lines after Ice Shedding. IEEE Trans. Power Deliv. 2013, 28, 216–225. [Google Scholar] [CrossRef]
  15. Huang, G. Experimental Study on Dynamic Response Characteristics of Isolated-span Transmission Lines after Ice-shedding. High Volt. 2023, 8, 196–208. [Google Scholar] [CrossRef]
  16. Chen, C.; Ming, L.; Li, M. Digital Twin Modeling and Operation Optimization of The Steam Turbine System of Thermal Power Plants. Energy 2024, 290, 129969. [Google Scholar] [CrossRef]
  17. Concetta, S.; Haya, A.; Dassisti, G. Guidelines for Designing a Digital Twin for Li-ion Battery: A Reference Methodology. Energy 2023, 284, 128699. [Google Scholar] [CrossRef]
  18. Shu, L.; Jian, T.; Zheng, J.; Yuan, D. Research on Multi-digital Twin and Its Application in Wind Power Forecasting. Energy 2024, 292, 130269. [Google Scholar] [CrossRef]
  19. Lei, Z.; Zhou, H.; Dai, X.; Hu, W.; Liu, G.-P. Digital Twin based Monitoring and Control for DC-DC Converters. Nat. Commun. 2023, 14, 5604. [Google Scholar] [CrossRef]
  20. Kobayashi, K.; Alam, S. Deep neural operator-driven real-time inference to enable digital twin solutions for nuclear energy systems. Sci. Rep. 2024, 14, 2101. [Google Scholar] [CrossRef]
  21. Fushimi, T.; Tagami, D.; Yamamoto, K.; Ochiai, Y. A digital twin approach for experimental acoustic hologram optimization. Commun. Eng. 2024, 3, 12. [Google Scholar] [CrossRef]
  22. Jiang, J.; Li, H.; Mao, Z.; Liu, F.; Zhang, J.; Jiang, Z.; Li, H. A Digital Twin Auxiliary Approach Based on adaptive sparse attention network for diesel engine fault diagnosis. Sci. Rep. 2022, 12, 675. [Google Scholar] [CrossRef]
  23. Isolan, L.; Malinconico, M.; Tieu, W.; Hollis, C.; Testa, M.; Melandri, M.; Brunetti, A.; Sumini, M. A Digital Twin for 64Cu Production with Cyclotron and Solid Target System. Sci. Rep. 2022, 12, 19379. [Google Scholar] [CrossRef]
  24. Wolf, K.; Dawson, R.; Mills, J.P.; Blythe, P.; Morley, J. Towards a Digital Twin for Supporting Multi-agency Incident Management in a Smart City. Sci. Rep. 2022, 12, 16221. [Google Scholar] [CrossRef]
  25. Jin, T.; Sun, Z.; Li, L.; Zhang, Q.; Zhu, M.; Zhang, Z.; Yuan, G.; Chen, T.; Tian, Y.; Hou, X.; et al. Triboelectric Nanogenerator Sensors for Soft Robotics Aiming at Digital Twin Applications. Nat. Commun. 2020, 11, 5381. [Google Scholar] [CrossRef]
  26. Min, W.; Wen, Y. Research on digital twin modeling and monitoring technology for smoke alarm calibration system. Sci. Rep. 2023, 13, 19239. [Google Scholar] [CrossRef]
  27. Huang, Y.; Tao, J.; Gang, S. A Novel Digital Twin Approach based on Deep Multimodal Information Fusion for Aero-engine Fault Diagnosis. Energy 2023, 270, 126894. [Google Scholar] [CrossRef]
Figure 1. Simplified model for kth level wire oscillation within the ith time period.
Energies 17 01424 g001
Figure 2. Time series segmentation algorithm flowchart.
Energies 17 01424 g002
Figure 3. Schematic diagram for calculated clearance.
Energies 17 01424 g003
Figure 4. Architecture for multi-source heterogeneous data collection.
Energies 17 01424 g004
Figure 5. Transmission line twin system operation flowchart.
Energies 17 01424 g005
Figure 6. Architecture of the information management system for the digital twin model of the line.
Energies 17 01424 g006
Figure 7. Line twin display platform.
Energies 17 01424 g007
Figure 8. Details of the twin model of the line.
Energies 17 01424 g008
Figure 9. Real experimental platform for continuous three-level conductors.
Energies 17 01424 g009
Figure 10. Continuous three-gear transmission line ice shedding simulation experimental platform.
Energies 17 01424 g010
Figure 11. Time–history curve of calculation span and tension changes: (a) time–history curve of tension of the first level wire and (b) the calculated time–history curve of the span change.
Energies 17 01424 g011
Figure 12. Comparison of deicing displacement with different ice thicknesses: (a) 15 mm ice coating and (b) 20 mm ice coating.
Energies 17 01424 g012
Figure 13. Error analysis chart.
Energies 17 01424 g013
Figure 14. Comparison diagram of deicing displacement under different working conditions: (a) deicing at the first span: 10 mm thickness; (b) deicing at the first span: 15 mm thickness; (c) deicing at the third span: 10 mm thickness; (d) deicing at the third span: 15 mm thickness.
Energies 17 01424 g014
Figure 15. Error analysis chart.
Energies 17 01424 g015
Disclaimer/Publisher’s Note: The statements, opinions and data contained in all publications are solely those of the individual author(s) and contributor(s) and not of MDPI and/or the editor(s). MDPI and/or the editor(s) disclaim responsibility for any injury to people or property resulting from any ideas, methods, instructions or products referred to in the content.