Abstract
To construct a clean and efficient energy system, advanced solar thermal power generation technology is developed, i.e., a solar hybrid STIGT (Steam Injected Gas Turbine) system with near zero water supply. Such a system is conducive to the efficient use of solar energy and water resources, and to improvement of the performance of the overall system. Given that the strong correlation between multiple-input and multiple-output of the new system, the MDMC (Multivariable Dynamic Matrix Control) method is proposed as an alternative to a PID (Proportional-Integral-Derivative) controller to meet requirements in achieving better control characteristics for a complex power system. First, based on MATLAB/Simulink, a dynamic model of the novel system is established. Then it is validated by both experimental and literature data, yielding an error no more than 5%. Subsequently, simulation results demonstrate that the overshoot of output power on MDMC is 1.2%, lower than the 3.4% observed with the PID controller. This improvement in stability, along with a reduction in settling time and peak time by over 50%, highlights the excellent potential of the MDMC in controlling overshoot and settling time in the novel system, while providing enhanced stability, rapidity, and accuracy in the regulation and control of distribution networks.
1. Introduction
Fast-growing industrialization and extensive traditional energy consumption, such as coal and natural gas, has exacerbated the energy crisis caused by humans. This crisis, compounded by environmental concerns, has posed significant barriers to the advancement of the energy industry [1]. Sustainable development encounters two primary challenges: the reduction of traditional fossil fuel consumption and greenhouse gas emissions [2]. Micro gas turbine-based energy supply systems are facing difficulties in meeting the demands of high efficiency and environmental preservation. Therefore, research is focused on enhancing power generation efficiency, optimizing energy supply systems, minimizing pollution, and effectively recovering low-grade waste heat etc. To address these issues, global scholars have proposed technologies such as solar photovoltaic (PV) power generation, steam re-injection, and absorption refrigeration as potential solutions.
Solar PV power generation systems offer several advantages, including low cost, high reliability, high power generation efficiency, and low greenhouse gas emissions. However, they also face challenges such as the intermittent nature of solar energy and the instability of the energy generated [3,4]. Introducing steam re-injection technology could enhance the generation efficiency of solar thermal hybrid power generation and improve the system’s power peaking flexibility. The steam re-injection cycle, based on the principle of utilizing high-temperature exhaust gas to heat feedwater and re-injecting the resulting steam back into the cycle, is a means to improve the efficiency and output power of gas turbine power generation [5,6,7]. To address issues related to large water consumption and high inlet air temperature in the solar hybrid Steam Injected Gas Turbine (STIGT) system, an intermediate cooling water/heat recovery system is introduced [8,9]. This system enables the solar hybrid STIGT energy supply system to operate with near zero water supply, utilizing intermediate cooling equipment to cool the inlet air and ensure the efficient and stable operation of the system. Although this system improves thermodynamic performance, it also brings challenges to the dynamic stability of the system. In actual operation, in order to shorten the response time of the system and to achieve a steady state that can be resistant to disturbances, the choice of appropriate control strategy is particularly critical.
PID control is widely used in industry [10,11,12] and researchers are exploring alternative controllers for energy systems with the aim of improving system stability, response, and energy utilization. Eldigair et al. used OBC (Optimization-based controller) in vehicle thermal management, showing lower computational burden than the PI controller [13]. Yang et al. applied DANNC (Discrete adaptive neural network controller) in refrigeration systems for faster stabilization and smaller overshoot than those of the PID [14]. MFAC (Model-free adaptive control), used by Dong et al., proved its effectiveness in temperature control of absorption chillers, offering faster response and robustness than the PID method [15]. Chai et al. suggested MFAC for energy-saving in absorption chillers, with stronger robustness and a faster response than the PID [16]. Staudt et al. used MPC (Model-predictive control) in heat pumping devices for wider operating ranges and better part load capability than the PID [17]. The DNA (Direct Nyquist Array) method investigated by Touqan et al. suppressed disturbances in HVAC systems better than the PID [18]. The study conducted by Zhao et al. showed that MLR (Multivariable linear regression) enhanced COP values and reduced electricity consumption over the PID [19]. Compared with the PID, ADRC (Active disturbance rejection control) by Huo et al. improved performance in hybrid solar-fossil fuel systems [20]. Jiang et al. found that MDMC (Multivariable dynamic matrix control) could improve thermal power responses and disturbance attenuation in various systems [21].
The potential use of predictive control in the solar hybrid STIGT system with near zero water supply is indicated by academic success in applying it to thermal systems, such as air conditioning. The novel STIGT system, which is similar to air conditioning, has multiple-inputs and outputs with strong coupling and is sensitive to load and external conditions. Maintaining control effectiveness with diverse loads and environmental conditions presents difficulties for traditional PID controllers. Multivariable Dynamic Matrix Control (MDMC) is a type of model predictive control that is easily applicable, has broad availability, and can streamline the computation of multi-input and multi-output systems [22,23], including the novel STIGT system. MDMC might enhance the dynamic characteristics of the solar hybrid STIGT system. This boosts the overall power generation efficiency and resilience to disturbances, ensuring stable operation.
Due to the low modeling cost and ease of implementation, MDMC has been proved as an effective technique for handling multivariable systems [21] and can be deployed in the broader engineering field [24]. Given the strong correlation between multiple-inputs and multiple-outputs of the novel system, the MDMC is considered for optimization and improvement in the characteristics of the power system. A mathematical and physical model of the MDMC for the novel system is presented in this context. The model is examined by experimental data and reported literature. It is expected that the novel system, using the MDMC, achieves better control characteristics than that of the PID. This context could contribute beneficial research experiences in the similar field of engineering control by proposing the MDMC method as an alternative to the PID controller.
2. Dynamic Model of the Novel Solar Hybrid STIGT System
The novel solar hybrid STIGT system consists of three subsystems: the STIGT subsystem, the solar absorber subsystem, and the water/heat recovery subsystem. The principle of the novel system is shown in Figure 1 [25].
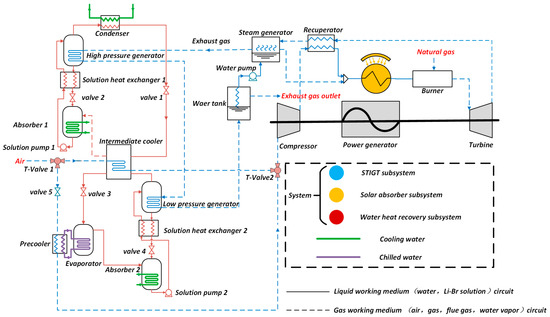
Figure 1.
Schematic diagram of the novel system.
2.1. The STIGT Subsystem
The STIGT subsystem primarily consists of the gas turbine and the steam generator. The gas turbine has two dynamic components: a recuperator with large thermal inertia and a rotor shaft with large rotational inertia.
The recuperator is modeled as a counterflow air-to-air heat exchanger as shown in Figure 2, which is discretized into N volume cells along the air flow direction.
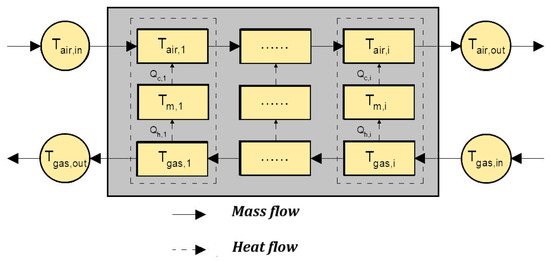
Figure 2.
Distribution of heat and mass flow in the recuperator.
According to the conservation of energy, each volume unit is established [26],
where are the convective heat transfer coefficients between the hot-side wall surface and the flue gas and between the cold-side wall surface and the air, W/(m2·K), respectively; is the heat transfer area of the th volume cell, m2; and is the wall temperature, K. An energy equation is established for the metal wall surface:
where is the thermal inertia time constant of the recuperator, which is generally determined by the specific heat and mass of the recuperator metal.
where , , and are the mechanical power of the turbine, the compressor, and the external load, kW, respectively, is the rotational inertia of the shaft, kg·m2, and is the angular velocity, rad/s.
The steam generator works in a process similar to a recuperator, and the effect of thermal inertia is neglected because the mass of the feed water is much smaller than the mass of the flue gas.
2.2. Model of the Water/Heat Recovery Subsystem
In this context, reference is made to the research results of Jiang et al. on a new absorption/transcritical hybrid refrigeration system, on the basis of which a new water/heat recovery system is proposed to utilize waste heat recovery from a low-grade heat source for refrigeration purposes [27]. The refrigeration unit as the model of water/heat recovery subsystem consists of an exchanger, a solution pump, and a throttling device, which are connected by piping. The solution heat exchanger recovers some of the generator heat and improves efficiency. All internal heat exchangers are counterflow-shell and tube heat exchangers. The solution pump provides power for solution circulation.
To reasonably simplify the dynamic model, the following assumptions are made [28,29],
- (1)
- The temperature, pressure, and Li-Br concentration inside the components are uniform.
- (2)
- The pressures inside the generator and condenser are equal, and the pressures inside the absorber and evaporator are equal.
- (3)
- The fluid transportation delay between the two components is neglected.
- (4)
- The heat transfer coefficients on the hot and cold sides of the heat exchanger remain constant.
- (5)
- The throttling processes between the generator and absorber and the condenser and evaporator are adiabatic.
The solution and vapor in the generator and absorber follow the mass conservation equation:
Therefore, the Li–Br solute satisfies:
Similarly, the LiBr–H2O solution satisfies the energy conservation equation:
where and are the mass flow rate of the inlet and outlet solutions, kg/s, respectively; and are the enthalpy of the inlet and outlet solutions, kJ/kg, respectively; and and are the mass fraction of the inlet and outlet solutions. and are the mass of the solution and the mass of the vapor in the generator/absorber, kg.
Conservation of mass equations are developed for the liquid and vapor phases of the refrigerant in the condenser (similar principle for intercooler, evaporator etc.).
Establish the energy conservation equation:
The sum of the refrigerant gas-phase volume , m3, and the liquid-phase volume, , m3, satisfies conservation of volume:
where , are the mass flow rate of the inlet and outlet refrigerant, kg/s, respectively; , are the enthalpy of the inlet and outlet refrigerant, kJ/kg, respectively; , are the liquid-phase mass and gas-phase mass of the internal refrigerant, kg, respectively; , are the liquid-phase density and gas-phase density of the internal refrigerant, kg/m3, respectively; and is the heat taken away from the outside, kJ.
2.3. Model of the Solar Absorber Subsystem
The central tower concentrator technology is adopted in this context, which is a system that mainly consists of a main reflector (heliostat field) mounted on the receiver aperture and a tower-top absorber [30]. The optical efficiency of the heliostat field is defined as the ratio of the solar power absorbed by the absorber () to the solar power radiated to all the heliostats (product of and heliostat aperture ), which is mainly determined by the azimuthal angle and the elevation angle of the sun’s position during the system operation. The effect of the sun’s position on the heliostat also includes optical losses from cosine effects, reflections, shadowing, and blocking [31]. The optical efficiency is:
where is the surface reflectivity of the heliostat, , , represent the cosine effect and the efficiency of optical losses due to shadowing and blocking, respectively, all as a function of the and . The azimuthal angle of the heliostat field in the sun-relative tower concentrator system is and elevation angle is .
The thermal energy absorbed by the solar absorber and its thermal efficiency is the key to the exit temperature of the work product, which is sufficiently high that the main losses come from radiation with the surroundings and convection (the heat conduction is ignored), as shown in Figure 3.
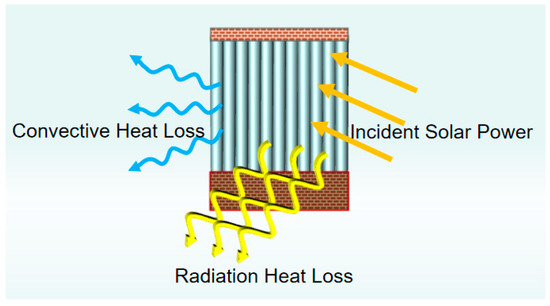
Figure 3.
Diagram of heat loss of solar absorber.
According to the heliostat field layout the incident solar energy is
where is the direct normal irradiance, W/m2; is the total receiving area of the heliostat field, m2. is the optical efficiency of the heliostat field.
Among them, the radiation loss is
where is the emissivity; is the Stefan–Boltzmann constant [32], which is taken as 5.67 × 10⁸ W/(m2·K4); is the operating temperature of the solar absorber; is the ambient temperature; and is the aperture area of the receiver, m2.
The convection loss is
where is the convective loss coefficient of the solar absorber, W·m2/K.
The dynamic process mainly occurs in the heat transfer part, and its main principle is similar to the model of the heat reclaimer in STIGT, which utilizes the distribution parameter method to calculate the temperature distribution of the internal solar absorber heated wall surface and the air, which will be discretized along the direction of the air flow into N volumetric units, and each unit transfers heat to the air by the heated wall surface of the solar absorber.
The calculation of heat transfer coefficients is obtained by using the empirical equations related to the Nusselt coefficient [33].
where is the diameter of the absorber aperture and is the length of the absorber cavity.
3. Methods and Model Validation
To compare the control characteristics between PID and MDMC for the novel system in this context, the response of both control times for a single control variable loop is studied with the chilled water outlet temperature as the external disturbance factor of the system when the set temperature changes. Then, with the external heat source temperatures and inlet flow rates of the cold water as the external disturbance factors of the system, the effectiveness of the two control methods is compared.
3.1. Model Validation of STIGT Subsystem
The dynamic simulation model of the gas turbine is established based on Simulink, as shown in Figure 4, which contains the gas compressor, recuperator, burner, turbine, and rotor module, in which the PID controller module controls the rotor speed and the turbine outlet temperature by adjusting the natural gas consumption.
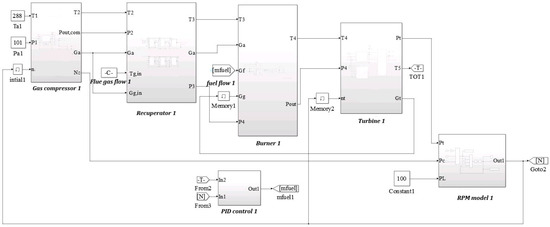
Figure 4.
Simulink model of the gas turbine.
In order to quantitatively describe the precision of the parameters in each model, the average relative deviation () is introduced,
Experimental data of the recuperator and rotating shafts during the step reduction of the load from 78 kW to 60 kW for the T100 micro gas turbine are utilized in this context and compared with the simulated results shown in Figure 5. The between the simulated and experimental values of the recuperator is 1.1%, and the average relative deviation of the rotor shaft is 0.2%.
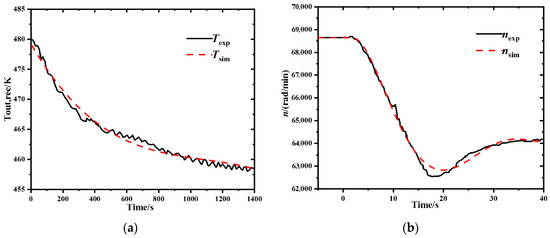
Figure 5.
Dynamic verification: (a) Recuperator; (b) Rotor shaft.
3.2. Model Validation of Water/Heat Recovery Subsystem
As shown in Figure 6, a dynamic simulation model of a single-effect Li–Br absorption refrigeration unit is developed as the validation of water/heat recovery subsystem, which contains a high-pressure generator, a low-pressure generator, a condenser, an evaporator, two absorbers, two solution heat exchangers, four throttling valves, and an intercooler.
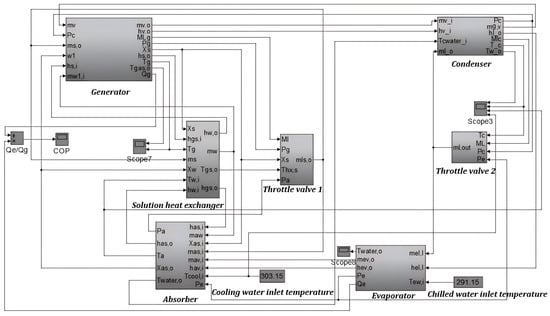
Figure 6.
Simulation model of the single-effect Li–Br absorption refrigeration unit.
In order to validate the dynamic model, the experimental data of [34] for a 10 kW single-effect absorption refrigeration unit is selected for comparison with the simulation data derived from the establishment of the corresponding operating conditions. The hot water outlet temperature (Inlet temperature steps from 75 °C to 85 °C) and chilled water outlet temperature (Inlet temperature fluctuating around 17.5 °C) change are shown in Figure 7.
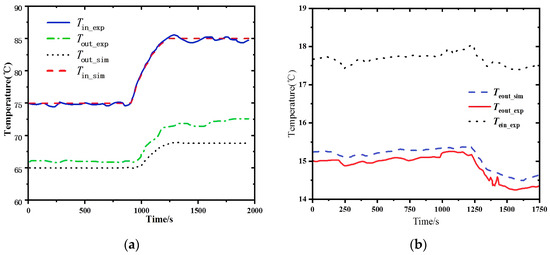
Figure 7.
Dynamic verification: (a) Generator; (b) Evaporator.
It is found that there is a certain error between the simulation and the reference data in terms of values, but most of the dynamic consistency between the measured and simulated values is high.
3.3. Model Validation of Solar Absorber Subsystem
The validation of the solar absorber subsystem is mainly to study and compare the heat-up characteristics of the solar absorber. The experiments are carried out in the experimental test system of tower-type solar absorber at the solar technology R&D base in Qingshan Lake, Zhejiang University. The experimental principle of solar absorber testing is shown in Figure 8.
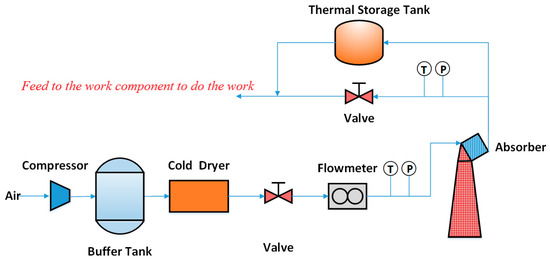
Figure 8.
Testing diagram of the solar absorber.
The fixed heliostat field in which the solar absorber is located, as well as the principle of the solar absorber, are shown in Figure 9.
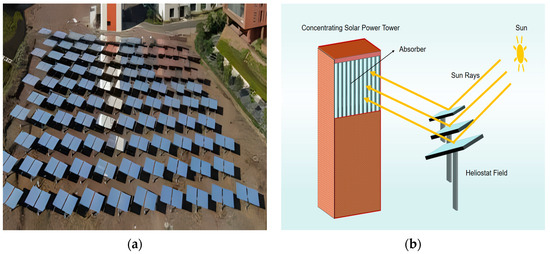
Figure 9.
(a) Heliostat field for solar absorber; (b) Principle of solar absorber.
The specific parameters of the relevant experimental equipment and measuring instruments used in the experiment are shown in Table 1, in which the thermocouples and flow meters are connected to the Agilent collector; the data are transmitted to the computer by recording every 3 s. Compressor and cold dryer were manufactured by Kingswood Smee (Ningbo, China). Agilent device was mannufactured by Keysight (Santa Clara, CA, USA). The others were manufactured by Kingswood Smee (Huaian, China). The structural parameters of the solar absorber are shown in Table 2.

Table 1.
Specific parameters of the solar absorber subsystem in experiments.

Table 2.
Structural parameters of the solar absorber.
To test the effect of change and air flow rate change on the outlet temperature of the solar absorber, the experiment chose to test three working conditions. The experiment selected a day with clear weather and sufficient light; the day 6:00 to 15:30 variation with time in the experiment is shown in Figure 10.
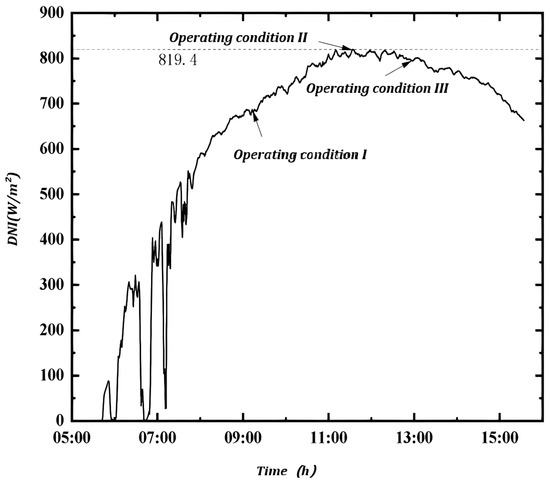
Figure 10.
variation with time in the experiment of the solar absorber.
The maximum value of on that day was 819.4 W/m2, and the average from 9:00 to 15:30 (the working time of the solar absorber) is about 762.7 W/m2 (the input value for the calculation of the simulation).
According to the above conditions used to describe the dynamic model of the solar absorber subsystem, as shown in Figure 11, a model with multi-segment volume unit heat transfer is established, including heat transfer of each segment by the solar absorber wall to the air, to obtain the final air outlet temperature.
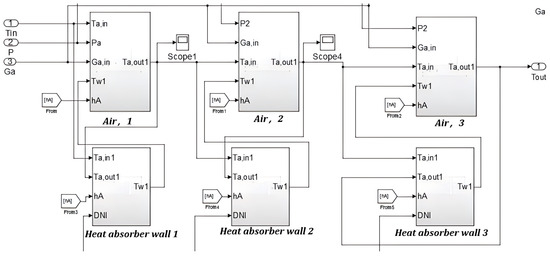
Figure 11.
Simulink model of the solar absorber subsystem.
From the model of the solar absorber subsystem in 2.3, it is known that it is necessary to calculate , , and , and that the principle of ray-tracing of the concentrator system is established through the SolarPilot 1.3.8 software (Figure 12a) as well as the layout of the heliostat field (Figure 12b).
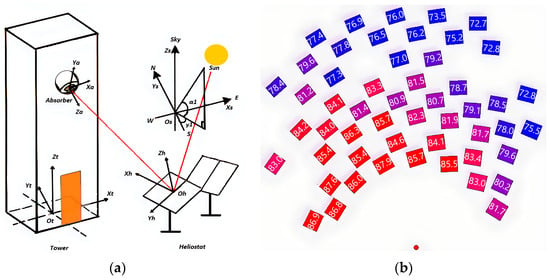
Figure 12.
(a) Principle of ray-tracing; (b) Layout of the heliostat field.
The established model is used to calculate the outlet temperature of the solar absorber for comparison with the experimental results, and three different working conditions are simulated. The results are shown in Figure 13, Figure 14 and Figure 15.
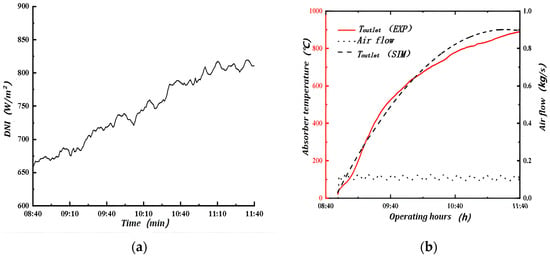
Figure 13.
(a) changes—condition I; (b) Outlet temperature and flow rate of the solar absorber.
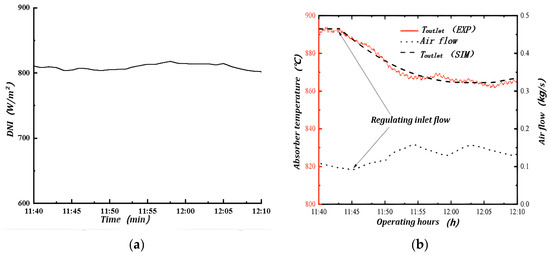
Figure 14.
(a) changes—condition II; (b) Outlet temperature and flow rate of the solar absorber.
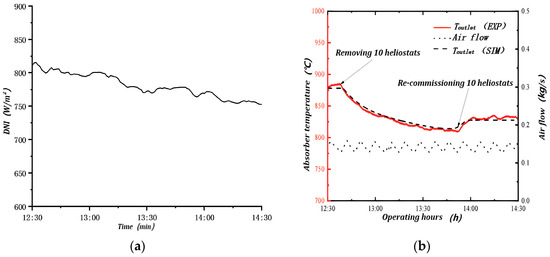
Figure 15.
(a) changes—condition III; (b) Outlet temperature and flow rate of the solar absorber.
The response process of the solar absorber is as depicted in Figure 13 for the period 8:40–11:40 under working condition I. During this process, the variation range of is kept above 670 W/m2 while the air flow rate into the solar absorber is stabilized at 0.1212 kg/s. The solar absorber outlet temperature starts to increase from an initial setting of 32 °C to a maximum temperature of 893 °C at 11:40, with an average warming rate of 5.7 °C/min. The between the simulation and the experimental data is 4.97%.
Under working condition II, the response process is as shown Figure 14 during the period 11:40–12:40. During this process, the reaches its peak value throughout the day with a small fluctuation, stabilizing at 800–810 W/m2. By controlling the valve, the air flow rate of the solar absorber is regulated from 0.1212 kg/s to 0.1558 kg/s and reaches a new quasi-steady state. The between the simulation and the experimental data is 1.6%.
The response process under working condition III during the period 12:40–14:30 is presented in Figure 15. In order to investigate the effect of fluctuations on the , 10 heliostats (48 heliostats in total) are removed from the ninth row at 12:40. At this time, the flow rate remains constant, while incident radiation into the solar absorber decreases, leading to a decrease in . The previously removed heliostats are recommissioned at 13:50, and as incident radiation into the solar absorber increases, also increases. The between the simulation and the experimental data is 1.45%.
4. Results and Discussion
4.1. Analyses of MDMC Strategy
Exhaust gas from conventional micro gas turbines contains a large amount of underutilized waste heat. In the solar hybrid STIGT system, the waste heat temperature is further reduced by the introduction of the steam generator and absorption refrigeration. Since the novel system in this context requires a very low heat source temperature, recovering the waste heat could confer greater advantages. In practice, due to disturbances in the heat source, an absorption refrigeration unit is often subjected to fluctuations, and response of the recovery process to the disturbances is slow. Therefore, it is important to understand the dynamic response of absorption refrigeration units under variable operating conditions to improve their energy efficiency ratio.
In previous work [25], control strategies were not considered. Excellent control strategies and methods for an absorption refrigeration system could maximize the user’s cold load demand and ensure the safe and stable operation of the system. However, conventional PID control has some defects: a set of parameters, , , and , are still determined by the controlled object model and cannot be rectified with changes in real times. Generally, optimal parameters of the PID control are expected to change adaptively, while the actual object and the model show obvious deviations. It means that optimal parameters of the PID controller are too complicated to calculate when the controlled object is uncertain or unknown, resulting in the control effects being less than optimal. Moreover, the PID control process is simple and mainly used for single-input single-output systems. For multi-input and multi-output systems, more effective and targeted control algorithms are expected.
The MDMC is developed from DMC (Dynamic Matrix Control) and is performed at each sampling time, which can be set by the control designer, based on current measurements and predictions of future output values. There are two types of calculations in the controller: setpoint calculations and control calculations, the latter including process constraints and other parameters that can be specified manually, and the control process is represented as in Figure 16. The main task of the controller is to determine the series of control actions for the manipulated variable so that the system can track optimally to its setpoint value. The control objective of the DMC is to compute the value of the manipulated variable so that the corrected predicted value of the next moment corrected predictions are as close as possible to the reference trajectory, thus reducing the response time.
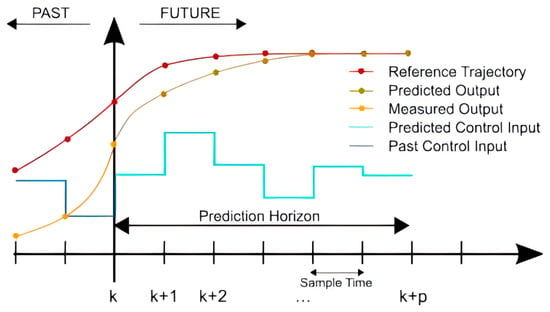
Figure 16.
Principle of DMC.
On top of DMC, MDMC algorithms based on multivariate control have been developed. For a linear multivariable system,
where is the current control time, is the modeling time domain, and is the control increment.
Rolling optimization is considered next. Like the univariate case, in the rolling optimization of MDMC, each output is required to closely track the corresponding expectation at the next moment.
where is .
The entire control process is repeated continuously. The MDMC algorithm, with the presence of constraints, greatly enhances the system’s safety and reduces settling time, which is beneficial for a dynamic system with significant lag time such as a water/heat recovery subsystem.
4.2. Establishment of Dynamic Model
To study the dynamic law of the system, the LMTD (Logarithmic Mean Temperature Difference) analysis is realized through the operating conditions of each component as well as the internal temperature and Li–Br concentration. According to the reference heat capacity value provided in the literature [35], when there is a steady state heat flow from each component, the product of heat transfer coefficient and heat transfer area is adjusted to bring the heat transfer process to this range under the assumption that the end difference of each heat transfer component is in the range of 3–5 °C. Specific parameters select the appropriate equation to calculate the convective heat transfer coefficient. The internal convection coefficient between the heat transfer fluid and the heat exchanger is calculated considering the geometry of the components and the physical phenomena occurring inside the refrigeration cycle. The area of the throttle valve is included as well as the volume of each component selected from the reference values in the literature [36]; the results of the calculations are shown in Table 3.

Table 3.
Constant parameters of dynamic model for the water/heat recovery subsystem.
According to the parameters in Table 3 combined with the model validation results in 3.2, the physical parameters of the Li–Br solution and water are retrieved from EES (Engineering Equation Solver), and the dynamic model of the water/heat recovery subsystem is established in Simulink, as shown in Figure 17. This model consists of a high/low pressure generator, a condenser, an absorber I/II, an evaporator, two solution heat exchangers, an intercooler, and four throttle valves.
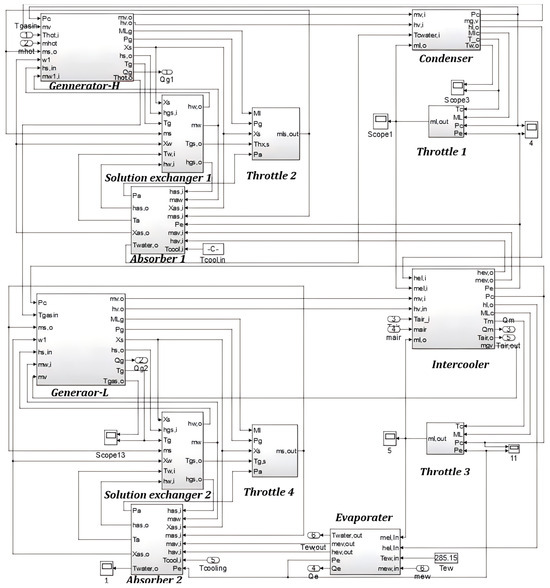
Figure 17.
Simulation model of water/heat recovery subsystem.
4.3. Control Strategy of the Novel System
Assuming that the exhaust gas (as a driving heat source) flow rate of 0.8 kg/s, air source flow rate of 0.7 kg/s, and chilled water flow rate of 0.4 kg/s are the rated conditions, the dynamic analysis of the water/heat recovery system in this context shows that the settling time of the system is about 656 s. In a typical industrial process, the lag time (or hysteresis time) is close to 11 min, which is typical of a large hysteresis system. In a typical absorption refrigeration unit of the same cooling capacity and size, the response time of the system also reaches 5–6 min. More heat exchanger components lead to larger thermal inertia and response times, which negatively impacts the stability and safety of the system.
To select a suitable control strategy and explore the control range of the three parameters, the heat source flow, air flow, and chilled water flow are reduced by 50% by controlling the valve openings at 1000 s, and the changes in the outlet temperature of chilled water and outlet temperature of air are compared under the three conditions, as shown in Figure 18.
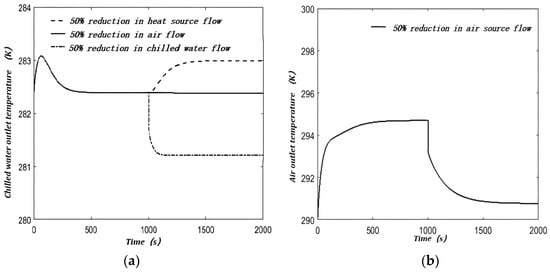
Figure 18.
Dynamic characteristics under variable flow rate of heat source, air, and chilled water: (a) Outlet temperature of chilled water; (b) Outlet temperature of air.
The control range of air flow is relatively small; a 50% reduction in heat source results in a 20% reduction in cooling capacity, while the same reduction in chilled water flow results in a more than 60% reduction in cooling capacity, as shown in Figure 18a. Even if air flow is reduced by 50%, the effect on outlet temperature of chilled water is negligible, but the outlet temperature of air drops by nearly 4 °C, as shown in Figure 18b. However, when the chilled water flow rate decreases, the COP (Coefficient of Performance) drops drastically, which is very detrimental to the system operation.
In order to further investigate the control strategy of the intercooler in water/heat recovery subsystem and the impacts of the inlet temperature and flow rate for air on the intercooler parameters, the inlet temperature and flow rate undergo a 20% upward or downward step at 600 s and 1200 s, respectively, to investigate the dynamic characteristics of intercooler including the temperature , the outlet temperature of air , and the COP, as depicted in Figure 19.
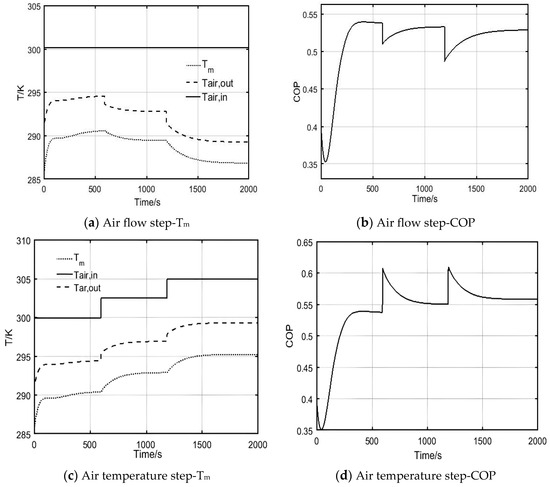
Figure 19.
Dynamic response of , , and COP.
Therefore, the use of air flow to control the parameters of the intercooler is feasible. PID control with the chilled water outlet temperature as a control variable results in a large hysteresis of the controller regulating action due to the slower dynamic response of the refrigeration unit. Moreover, when the load changes suddenly and substantially, the PID output will fluctuate in magnitude, making it possible for the water/heat recovery subsystem to over-input heat sources, which can easily cause instability in the novel system.
To solve the shortcomings of the long dynamic response time of the water/heat recovery system in this context, it is necessary to use a more advanced control model to replace the traditional PID model. For the water/heat recovery system in the novel system in this context, the dynamic response time is greater than that of the single-effect Li-Br absorption unit due to the larger number of heat exchanger components, and the controllable variables include the air flow rate and the heat source flow rate. In addition, due to ambient temperature changes, the given value of the chilled water temperature can change due to internal or external factors, and the PID cannot effectively track the change of the given value in the long term. To address the challenges of this system characteristic, the MDMC in predictive control is applied to the control using the established two-stage Li-Br absorption dynamic model.
4.4. Model of Control Parameters and Comparison Results
Using the model of the heat exchanger, it can be observed that the heat capacity of the heat exchanger metal and its internal solution inside the four components determines the thermal inertia of the heat exchanger process, that the heat capacity of the solution or the water is determined by the physical properties themselves, and that the accumulation of the thermal inertia of all the components leads to the system having a large hysteresis characteristic. Therefore, to determine the control parameters efficiently, this context identifies the process model from the control value heat source flow to the outlet temperature of chilled water by controlling the heat source flow. A step signal is used as input to obtain the model parameters from the system response. The input and output curves of the step signal are used as a reference for model identification, as shown in Figure 20.
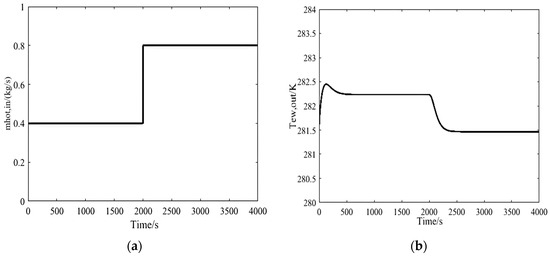
Figure 20.
Recognizing: (a) input curves; (b) output curves.
Investigating the model of the process from different temperature perturbations such as inlet temperature of heat source , inlet temperature of chilled water , and outlet temperature of chilled water , the identification is made by considering the system as a third-order purely hysteresis model:
where is similar to the proportionality coefficient in PID control, here is the gain coefficient; , , are time constants; is the lag time constant; is the transfer function constant. The identification results are obtained through the system identification toolbox in Matlab2019, as shown in Table 4.

Table 4.
Identification parameters from toolbox in Matlab.
According to the obtained transfer function model, a multivariable controller is needed in such working conditions; this controller can balance the actions of all actuators simultaneously. This control solves the problem of one input affecting another output compared to the drawback of the independent control of PID, which can only control a single input and a single output. Based on the controlling quantities (air flow and driving heat source flow), the controlled quantities (outlet temperature of both the air source and chilled water), and the external perturbation quantities (temperature of the driving heat source and chilled water flow), such a multi-input, multi-output system develops a control strategy, as shown in Figure 21.
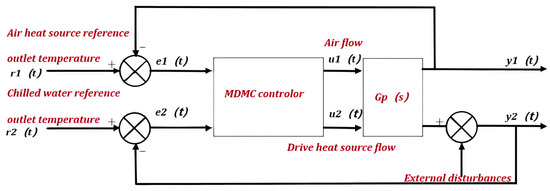
Figure 21.
MDMC strategy for multivariate input-output systems.
In general, the gas turbine inlet air temperature needs to be cooled to 15 °C under ISO (International Organization for Standardization) operating conditions. According to the control strategy and control objectives in the dynamic model of the water/heat recovery subsystem, both the PID controller and MDMC controller, respectively, are established and encapsulated. The results are shown in Figure 22.
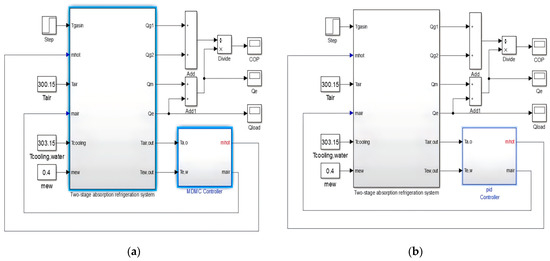
Figure 22.
Simulink control model of the novel system: (a) MDMC; (b) PID control.
For the intercooler, if the air outlet temperature is set to 15 °C, the internal temperature must be around 10–12 °C. The low temperature of the intercooler will influence the evaporation of the refrigerant in the high-pressure stage and the condensation of the refrigerant in the low-pressure stage. Therefore, for the stable operation of the system, the set value of the air outlet temperature is set to 18 °C. The air inlet temperature is assumed to be 27 °C. the outlet temperature of chilled water is set at 8 °C.
4.4.1. Comparisons between MDMC and Single-Loop PID Control
To compare the impact of PID and MDMC for the set temperature change, the set value of outlet temperature for chilled water is changed from 8 °C to 9 °C as the control target, and the response of the control time of both is investigated in a single control variable loop. The PID parameters are obtained by the self-tuning method, and the parameters to be adjusted by MDMC include the sampling time = 15 s, the prediction time domain P = 50 s, and the limiting conditions: the heat source flow rate 0 < m ≤ 2 kg/s, the chilled water outlet temperature 0 °C < ≤ 12 °C. The main method for effective control of the navel system is to minimize the amount of energy used in the system within the control range. The variables of the optimization function are the system state (chilled water outlet temperature) and the control input (heat source flow rate). The results of both are shown in Figure 23.
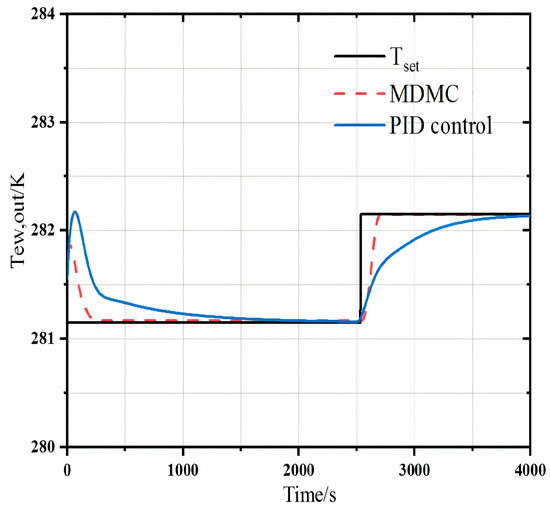
Figure 23.
Comparisons of dynamic response between MDMC and PID control under step up of .
When the system starts up, the MDMC responds before the PID control. The initial value of the heat source flow rate is given as 0.8 kg/s in the MDMC, and then the change value of the outlet temperature of chilled water or air temperature is selected to predict and recalculate the output value based on the new sampling data every 15 s. After five prediction cycles, the heat source flow rate reaches the set value. The MDMC reaches the set value of 8 °C in about 250 s, while the PID reaches the target set value in about 2000 s. The overshoot of the target temperature by MDMC is smaller than that of the PID control. When the target value changes from 8 °C to 9 °C, the MDMC has a settling time of 300 s, much faster than the 1500 s of PID, and the peak time of the MDMC is significantly lower than that of PID, proving the superiority of MDMC in this system.
4.4.2. Comparisons between MDMC and Dual-Loop PID Control
In the rolling optimization of the MDMC of the novel system, the outputs chilled water outlet temperature and air outlet temperature are closely tracked to their corresponding desired values at P moments in the future by varying each of the two control inputs (exhaust heat source flow and air heat source flow) at M moments in the future. The desired value calculates the target values of outlet temperature of air or chilled water according to the given output load target value and operation mode of the unit, the multivariable prediction controller calculates the adjustment amount of the valve opening, and the output will also be feedback corrected, controlling the system unit to reach the load set value. The heat source temperature and the chilled water inlet flow rate are used as the external disturbing factors of the system to explore the comparison of the control effect between MDMC and dual-loop PID.
Comparison of the control effect between MDMC and dual-loop PID control was conducted, with the heat source temperature increasing from 70 °C to 80 °C at 2000 s as a step signal input, the air outlet temperature set at 18 °C and remaining unchanged, and the set value of the chilled water outlet temperature remaining at 8 °C.
As depicted in Figure 24a, the MDMC performs better than the PID control in the regulation of the settling time of the air outlet temperature. When the initial value is set to 14 °C from the prediction time domain, the MDMC adjusts the air flow rate during the following 50 s. So, the air outlet temperature reaches the setpoint value much more quickly, and the response time of the MDMC is much shorter than that of the PID control. When the disturbance is added, according to the results of the previous operation, the MDMC can predict the future trend of the outlet temperature change, and, in order to bring the air outlet temperature up to the set value, adjust the flow rate of the heat source every 50 s in the period of 2000–2500 s. The PID control reacts more slowly and generates an overshoot of 3.8%, while MDMC generates an overshoot of 1.1%. Due to the fact that the set PID control parameters, , , and , cannot be corrected in real time, and large oscillations occur after large perturbations; these perturbations have serious impacts on the stability and safety of the system, especially the long-time instability of the inlet air temperature of the micro-gas turbine, leading to frequent changes in the operating conditions of the system, which might damage the system.
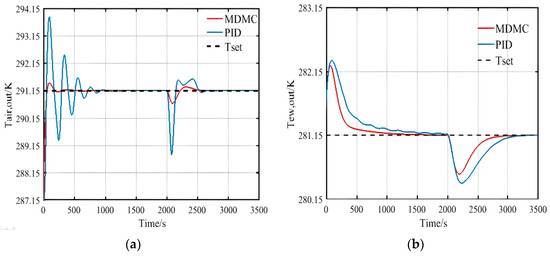
Figure 24.
Step up of heat source temperature by MDMC and PID control: (a) Response of outlet temperature for air; (b) Response of outlet temperature for chilled water.
From the regulation of settling time of the chilled water outlet temperature in Figure 24b, MDMC and PID control both reach a steady state by a certain point in time. The trends of the two change curves are similar during the start-up phase, but the controlling loop by PID is still slightly oscillating due to the influence of the fluctuations in the air flow in the previous loop. Fluctuations in the air flow are reduced by the decoupling of multiple variables in the MDMC, which makes the regulation more effective. It is proved that the coupled control of the dual-loop PID still has significant limitations, while the MDMC has superiority in both response time and controlling overshoot for the simultaneous control of multiple variables.
The air inlet temperature of the compressor has crucial impacts on the system output power, and the results are shown in Figure 25. With a target of the air outlet temperature of 18 °C, PID control leads to frequent oscillations of the inlet temperature, resulting in oscillations of the output power between 96 kW and 102 kW, with an overshoot of 2.5% of the rated power, and three oscillation cycle occurs before relatively stabilizing; the time to re-achieve stability is 2000 s. In contrast, the MDMC oscillates by only 0.72%, and takes only one oscillation from startup to stabilization, which is about 1000 s. Although the micro gas turbine has the characteristics of fast response, which means better self-regulation, the frequent oscillations of the inlet temperature are extremely detrimental to the stability of the power generation system.
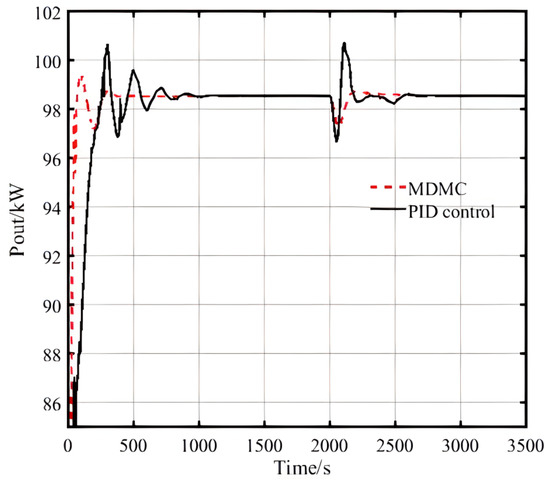
Figure 25.
Impacts of air inlet temperature of the compressor on output power by MDMC and PID control.
Moreover, the impacts of perturbation of the chilled water flow rate on the system are also investigated. From the air outlet temperature adjustment time in Figure 26a, when the chilled water flow rate steps from 0.4 kg/s to 0.46 kg/s, and the initial value of the setting is 14 °C, MDMC is used. By predicting the change of the air flow rate in the time domain in the next 50 s, and analyzing the trajectory of the temperature change in each cycle according to the simulation curve and adjusting the output volume in advance, the output volume will be adjusted in advance after about 14 prediction cycles of 700 s to reach the target temperature value. The dual-loop PID control produces more intense attenuation oscillations in the at startup and when disturbed; the number of oscillations reaches four times, and the at startup exceeds the target temperature by 2 °C. Compared with the PID control, the MDMC algorithm has more excellent control performance and anti-interference in multiple loops.
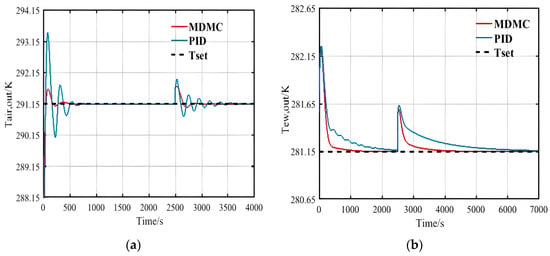
Figure 26.
Step up of flow rate for chilled water by MDMC and PID control: (a) Response of outlet temperature for air; (b) Response of outlet temperature for chilled water.
From the settling time of the chilled water outlet temperature in Figure 26b, using PID control, needs about 4500 s to run until 7000 s to reach the set value of 8 °C, and the time required is much larger than the previous perturbation case. While using MDMC, needs about 1500 s to reach the set value, and the control effect of MDMC is still better than that of PID control. In terms of anti-interference, the MDMC and PID control are both relatively smooth, and there is no oscillation near the set temperature.
The chilled water flow also has a crucial impact on the system output power; the results are shown in Figure 27.
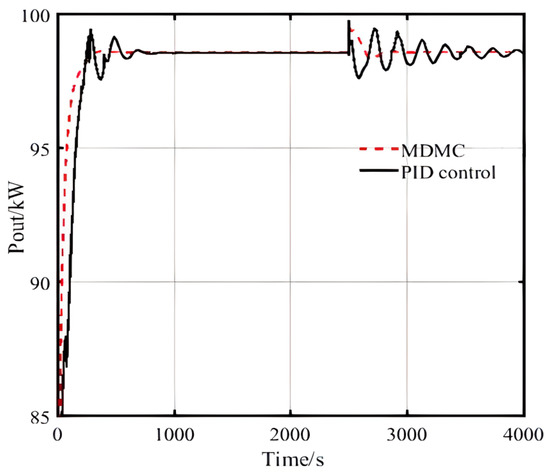
Figure 27.
Impacts of chilled water flow on output power by MDMC and PID control.
When the target of outlet temperature for air is set at 18 °C, the PID control gradually reaches a stable state after a few cycles of oscillation, relatively speaking; the changes in the flow rate of chilled water have less impact on the overall system, and the overall overshoot is about 2–3%. The PID control reaches the vicinity of the target point after about 1500 s of oscillation, which is more frequent and difficult to stabilize, and brings a greater test to the regulation ability of the microfuel engine. The algorithm of the MDMC fluctuates less, and the stability of the dual-loop control is improved to a certain extent.
Finally, to ensure the stable operation of the novel system and the demand for near-zero water supply, it is necessary to ensure that the recovered water volume is within a more stable range, so the water recovery rate (i.e., recovered water volume/injected water volume) is still controlled using PID and MDMC. With 98% of the water recovery rate as the control objective, the 20% fluctuation sum of and air flow rate as the perturbation input of the system, and the flow rate of the heat source into the water/heat recovery system as the control variable, when fluctuates or air flow rate fluctuates, the temperature of the input heat source will be affected. At this time, it is assumed that the fluctuation will occur in the role of the 4000 s. The PID parameter is obtained by using a self-tuning method, and the parameters that need to be adjusted for MDMC are the sampling time ( = 20 s), the prediction time domain (p = 100 s), and the limiting conditions (heat source flow and air flow 0 < m ≤ 2 (kg/s)).
As the system operates, the amount of water injection is relatively stable; the system is subjected to changes such as solar , resulting in changes in the amount of recovered water affects the stable operation of the system. Assuming that the recovered water is injected into the system in a timely manner to generate output power, different levels of water injection will make the system output power change accordingly, as depicted in Figure 28a.
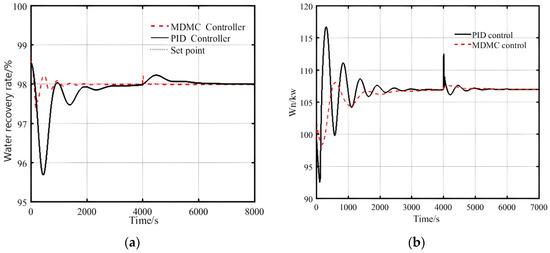
Figure 28.
fluctuation by MDMC and PID control: (a) Response of water recovery rate; (b) Response of system output power.
It is seen that the MDMC comes into play at about 400 s in Figure 29a. After 20 prediction cycles of about 2000 s, the control time domain stabilized at around 98% after only two oscillation cycles. In comparison, the PID control takes five oscillation cycles of about 4000 s to stabilize at start-up near 95.6%. The instability that water recovery has indirectly affects the output power. In terms of interference resistance, as shown in Figure 28b and Figure 29b, the most drastic fluctuations occur in the initial output power of the system, because the whole system has not reached stability at the time of startup and the output power is more sensitive to water injection. The overshoot for output power using PID reaches 3.4%, while the overshoot of MDMC is about 1.2%. Over the fluctuation of and air flow, the MDMC reduces the influence of air flow through multivariate decoupling, making the settling time and peak time more than 50% shorter than that of PID.
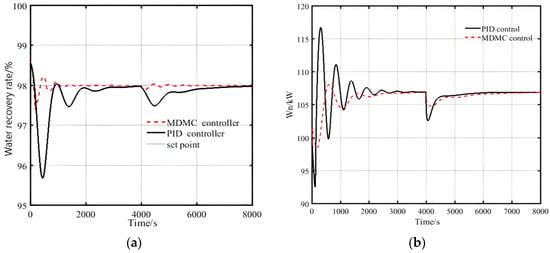
Figure 29.
Air flow fluctuation by MDMC and PID control: (a) Response of water recovery rate; (b) Response of system output power.
Different scales of energy supply and generation systems have different control requirements for different parameters [37], and the system has different settling time and overshoot under the effect of disturbances. To compare the dynamic characteristics of different controller disturbances on the novel system, a comparison of the parameters is given in Table 5. The steady state error ≈ 0.

Table 5.
Comparisons of dynamic characteristics under different disturbance by MDMC and PID control.
It is observed that the maximum overshoot of MDMC is 1.2% from the perturbations under each operating condition, while the maximum of PID is 3.4%, which further indicates that the stability of MDMC is better. The settling time and peak time required by MDMC is generally more than 50% shorter than that of PID, which indicates that the response time of MDMC is faster. Therefore, in summary, compared to PID, MDMC, with its short settling time and small overshoot, is more suitable for the control of the novel system described in this context.
5. Conclusions
In this context, from both control strategy and dynamic characteristics, simulation on multivariable dynamic matrix control for a novel solar hybrid STIGT system with near zero water supply is conducted to perform water/heat recovery and improve the system efficiency.
After modelling and validation of the novel solar hybrid STIGT system, the dynamic characteristics show that the novel system can operate more stably with the introduction of MDMC, which overcomes the severe time lag of conventional PID in controlling the input power to the grid as well as the poor immunity to interference. From the investigated results, the main conclusions are as follows.
- (1)
- The dynamic control modeling of the novel solar hybrid STIGT system is established and the error ranges are less than 5%, presenting good enough consistency between theoretical results and experimental data.
- (2)
- MDMC is introduced into the novel solar hybrid STIGT system, compared with PID control, and the settling time and peak time under various operating conditions is reduced more than 50%. This improvement better satisfies the output power requirements for the rapidity of the power grid.
- (3)
- In the face of disturbance, i.e., heat source temperatures and chilled water flow rates, output power overshoot reduce from 3.4% of the PID to 1.2% of the MDMC, and furthermore, the number of oscillations is reduced from 4–5 times of the PID to 1–2 times of the MDMC. These results show that MDMC can cope with system disturbances more effectively and improve system stability and performance.
For the novel system, the proposed strategy based on the MDMC is more robust to properly handle output power transients caused by changes in external disturbances (e.g., heat, chilled water, , and air flow). The MDMC method is a potential tool for regulating overshoot and settling time in distribution networks with better stability, speed and accuracy, and can be extended to similar system applications.
As machine learning methods, such as linear regression (LR), decision trees (DT), random forests (RF), and artificial neural networks (NN), become a hot research topic in the energy field [38], the dynamics of the novel systems could be further estimated in the future by using external data, such as temperature, air flow etc., as well as rated data from heat exchangers.
Author Contributions
Conceptualization, Y.H.; Methodology, S.Z.; Software, S.Z.; Validation, Z.L.; Investigation, L.Z.; Resources, Z.L.; Data curation, J.W.; Writing—original draft, S.Z.; Writing—review & editing, Y.H.; Project administration, J.W. All authors have read and agreed to the published version of the manuscript.
Funding
This research received no external funding.
Data Availability Statement
Data are contained within the article.
Conflicts of Interest
Jiwu Wu was employed by Zhejiang Jilisi Auto Air-Condition Co., Ltd. The remaining authors declare that the research was conducted in the absence of any commercial or financial relationships that could be construed as a potential conflict of interest.
References
- Karmaker, A.K.; Rahman, M.M.; Hossain, M.A. Exploration and corrective measures of greenhouse gas emission from fossil fuel power stations for Bangladesh. J. Clean. Prod. 2020, 244, 118645. [Google Scholar] [CrossRef]
- Zhang, C.G.; Sun, J.M.; Lubell, M. Design and simulation of a novel hybrid solar-biomass energy supply system in northwest China. J. Clean. Prod. 2019, 233, 1221–1239. [Google Scholar] [CrossRef]
- Akram, U.; Khalid, M.; Shafiq, S. Optimal sizing of a wind/solar/battery hybrid grid-connected microgrid system. IET Renew. Power Gen. 2018, 12, 72–80. [Google Scholar] [CrossRef]
- Zheng, H.F.; Tian, G.J.; Zeng, S.; Zhang, Z.H.; Lv, Z.H.; Wang, Q. Study on the performance of multi-medium heat exchanger in solar composite refrigeration system. Appl. Therm. Eng. 2024, 24, 122826. [Google Scholar] [CrossRef]
- Ziółkowski, P.; Kowalczyk, T. On energy, exergy, and environmental aspects of a combined gas-steam cycle for heat and power generation undergoing a process of retrofitting by steam injection. Eng. Conv. Manag. 2019, 192, 374–384. [Google Scholar] [CrossRef]
- Bishal, S.S.; Faysal, D.F.; Ehsan, M.M.; Salehin, S. Performance evaluation of an integrated cooling and power system combining supercritical CO2, gas turbine, absorption refrigeration, and organic rankine cycles for waste energy recuperating system. Results Eng. 2023, 17, 100943. [Google Scholar] [CrossRef]
- Cao, Y.; Mihardjo, L.W.W.; Dahari, W.; Tlili, I. Waste heat from a biomass fueled gas turbine for power generation via an ORC or compressor inlet cooling via an absorption refrigeration cycle: A thermoeconomic comparison. Appl. Therm. Eng. 2021, 182, 116117. [Google Scholar] [CrossRef]
- Vandersickel, A.; Wedel, W.G.; Spliethoff, H. High temperature heat and water recovery in steam injected gas turbines using an open absorption heat pump. Appl. Therm. Eng. 2020, 165, 114663. [Google Scholar] [CrossRef]
- Shabani, M.J.; Babaelahi, M. Innovative solar-based multi-generation system for sustainable power generation, desalination, hydrogen production, and refrigeration in a novel configuration. Int. J. Hydrogen Energy. 2024, 59, 1115–1131. [Google Scholar] [CrossRef]
- Cézar, K.L.; Caldas, A.G.A.; Caldas, A.M.A.; Cordeiro, M.C.L.; Dos Santos, C.A.C. Development of a novel flow control system with arduino microcontroller embedded in double effect absorption chillers using the LiBr/H2O pair. Int. J. Refrig. 2020, 111, 124–135. [Google Scholar] [CrossRef]
- Franco, S.S.; Henríquez, J.R.; Ochoa, A.A.V.; da Costa, J.A.P.; Ferraz, K.A. Thermal analysis and development of PID control for electronic expansion device of vapor compression refrigeration systems. Appl. Therm. Eng. 2022, 206, 118130. [Google Scholar] [CrossRef]
- Xu, Y.J.; Zhang, S.J.; Xiao, Y.H. Modeling the dynamic simulation and control of a single effect LiBr–H2O absorption chiller. Appl. Therm. Eng. 2016, 107, 1183–1191. [Google Scholar] [CrossRef]
- Eldigair, Y.; Kunusch, C.; Ocampo-Martinez, C. Optimization-Based Thermal Control Strategy for Auxiliary Cooling Circuits in Fuel Cell Vehicles. IEEE Trans. Transport. Electrif. 2023, 9, 2734–2743. [Google Scholar] [CrossRef]
- Yang, P.; Liu, J.P.; Yu, J.P.; Zhu, H.Z. Discrete time adaptive neural network control for WME and compression refrigeration systems. Int. J. Refrig. 2023, 153, 155–167. [Google Scholar] [CrossRef]
- Dong, N.; Lv, W.J.; Zhu, S.; Gao, Z.K.; Grebogi, C. Model-free adaptive nonlinear control of the absorption refrigeration system. Nonlinear Dyn. 2022, 107, 1623–1635. [Google Scholar] [CrossRef]
- Chai, Y.; Wu, A.G.; Dong, N.; Wang, Y.K.; Li, Y.D. Dynamic Operation and Control Strategy of Absorption Chiller under Different Working Conditions. In Proceedings of the 2018 13th World Congress on Intelligent Control and Automation (WCICA), Changsha, China, 4–8 July 2018. [Google Scholar] [CrossRef]
- Staudt, S.; Unterberger, V.; Muschick, D.; Gölles, M. MIMO state feedback control for redundantly-actuated LiBr/H2O absorption heat pumping devices and experimental validation. Control Eng. Pract. 2023, 140, 105661. [Google Scholar] [CrossRef]
- Touqan, B.; Abdul-Ameer, A.; Salameh, M. HVAC multivariable system modelling and control. Proc. Inst. Mech. Eng. 2023, 237, 2049–2061. [Google Scholar] [CrossRef]
- Zhao, T.Y.; Wang, J.M.; Xu, M.; Li, K.S. An online predictive control method with the temperature based multivariable linear regression model for a typical chiller plant system. Build. Simul. 2020, 13, 335–348. [Google Scholar] [CrossRef]
- Huo, M.G.; Wu, Z.L.; He, T.; Li, D.H. Thermodynamic modeling and control of hybrid solar-fossil fuel power generation and storage system. Appl. Therm. Eng. 2023, 229, 120593. [Google Scholar] [CrossRef]
- Jiang, D.; Dong, Z. Dynamic matrix control for thermal power of multi-modular high temperature gas-cooled reactor plants. Energy. 2020, 198, 117386. [Google Scholar] [CrossRef]
- Wojtulewicz, A.; Ławryńczuk, M. Implementation of Multiple-Input Multiple-Output Dynamic Matrix Control Algorithm for Fast Processes Using Field Programmable Gate Array. IFAC-P. OL. 2018, 51, 324–329. [Google Scholar] [CrossRef]
- García, J.; Padilla, R.V.; Kim, J.S. A transient optical-thermal model with dynamic matrix controller for solar central receivers. Appl. Therm. Eng. 2019, 154, 686–698. [Google Scholar] [CrossRef]
- Dong, Z.; Cheng, Z.H.; Zhu, Y.L.; Huang, X.J.; Dong, Y.J.; Zhang, Z.Y. Review on the Recent Progress in Nuclear Plant Dynamical Modeling and Control. Energies 2023, 16, 1443. [Google Scholar] [CrossRef]
- He, Y.J.; Zheng, S.P.; Xiao, G. Solar hybrid steam-injected gas turbine system with novel heat and water recovery. J. Clean. Prod. 2020, 276, 124268. [Google Scholar] [CrossRef]
- Pili, R.; Eyerer, S.; Dawo, F. Development of a non-linear state estimator for advanced control of an ORC test rig for geothermal application. Renew. Eng. 2020, 161, 676–690. [Google Scholar] [CrossRef]
- He, Y.J.; Jiang, Y.Y.; Gao, N. Theoretical analyses of a new two-stage absorption-transcritical hybrid refrigeration system. Int. J. Refrig. 2015, 56, 105–113. [Google Scholar] [CrossRef]
- Myat, A.; Thu, K.; Kim, Y.D. A second law analysis and entropy generation minimization of an absorption chiller. Appl. Therm. Eng. 2011, 31, 2405–2413. [Google Scholar] [CrossRef]
- Evola, G.; Pierrès, N.L.; Boudehenn, F. Proposal and validation of a model for the dynamic simulation of a solar-assisted single-stage LiBr/water absorption chiller. Int. J. Refrig. 2013, 36, 1015–1028. [Google Scholar] [CrossRef]
- Kincaid, N.; Mungas, G.; Kramer, N. An optical performance comparison of three concentrating solar power collector designs in linear Fresnel, parabolic trough, and central receiver. Appl. Eng. 2018, 231, 1109–1121. [Google Scholar] [CrossRef]
- Giostri, A.; Binotti, M.; Sterpos, C. Small scale solar tower coupled with micro gas turbine. Renew. Eng. 2020, 147, 570–583. [Google Scholar] [CrossRef]
- Florides, G.A.; Kalogirou, S.A. Design and construction of a LiBr-water absorption machine. Eng. Convers. Manag. 2003, 44, 2483–2508. [Google Scholar] [CrossRef]
- Giorgetti, S.; Bricteux, L.; Parente, A. Carbon capture on micro gas turbine cycles: Assessment of the performance on dry and wet operations. Appl. Eng. 2017, 207, 243–253. [Google Scholar] [CrossRef]
- Carrero, M.M.; Ferrari, M.L.; Paepe, W.D. Transient simulations of a T100 micro gas turbine converted into a micro humid air turbine. In Proceedings of the Asme Turbo Expo: Turbine Technical Conference & Exposition, Montreal, QC, Canada, 15–19 June 2015. [Google Scholar] [CrossRef]
- Wang, J.; Shang, S.; Li, X.T. Dynamic performance analysis for an absorption chiller under different working conditions. Appl. Sci. 2017, 7, 797. [Google Scholar] [CrossRef]
- Ma, W.B.; Deng, S.M. Theoretical analysis of low-temperature hot source driven two-stage LiBr/H2O absorption refrigeration system. Int. J. Refrig. 1996, 19, 141–146. [Google Scholar] [CrossRef]
- Al-Shetwi, A.Q.; Hannan, M.A.; Jern, K.P. Grid-connected renewable energy sources: Review of the recent integration requirements and control methods. J. Clean. Prod. 2020, 253, 119831. [Google Scholar] [CrossRef]
- Sousa Alcântara, S.C.; Villa Ochoa, A.A.; da Costa, J.A.P.; Arruda Michima, P.S. Development of a method for predicting the transient behavior of an absorption chiller using artificial intelligence methods. Appl. Therm. Eng. 2023, 231, 120978. [Google Scholar] [CrossRef]
Disclaimer/Publisher’s Note: The statements, opinions and data contained in all publications are solely those of the individual author(s) and contributor(s) and not of MDPI and/or the editor(s). MDPI and/or the editor(s) disclaim responsibility for any injury to people or property resulting from any ideas, methods, instructions or products referred to in the content. |
© 2024 by the authors. Licensee MDPI, Basel, Switzerland. This article is an open access article distributed under the terms and conditions of the Creative Commons Attribution (CC BY) license (https://creativecommons.org/licenses/by/4.0/).