Abstract
This study focuses on the detailed analysis of exhaust emissions from multi-point fuel injection (MPFI) engines by manipulating the injection parameters through a programmable electronic control unit. In addition, tests are carried out using different generations of catalytic converters and checking that their working temperature is correct using a thermographic camera, verifying operation, to evaluate their effect on emission reduction. Detailed comparisons of the results between these configurations will allow the identification of the combination that reduces emissions the most without compromising engine efficiency and performance. This research aims to promote a more sustainable approach in the automotive sector by properly configuring systems, but also by demonstrating the technical robustness of their application in vehicles. It has also helped to verify that varying injection and ignition parameters help to fine-tune fuel injection, resulting in efficient combustion. Combining this variation with catalytic converters has further reduced exhaust pollutants.
1. Introduction
Air pollution is a global concern, due to the increase in temperature as the result of greenhouse gases. Since the United Nations Climate Change Conference (COP21), 194 countries have set out to reduce emissions, especially of carbon dioxide (CO2). The European Union plans to eliminate carbon emissions by 2050 and reduce greenhouse gases by 40% by 2030 to keep the global average temperature below 2 °C [1]. It should be emphasised that technological development must be encouraged as a key strategy to achieve the COP21 strategies for the benefit of the environment and to promote economic growth and sustainable development in any industrial sector [2]. Considering that the transport sector has been the one with the largest increase in greenhouse gas emissions [3], vehicle emissions regulations are becoming increasingly stringent, aiming to reduce pollution levels. To comply with this, manufacturers take different measures and follow technological improvements, such as mechanical and electronic improvements, to make combustion as stoichiometric and clean as possible.
Regulations, such as the Euro emission and safety standards, have led to increased research in the last decade to improve engines, due to limited fuel resources and environmental concerns [4]. Research has led to the development of new combustion technologies, which are not only efficient but also environmentally friendly [5]. One of the working conditions for reducing emissions is to improve the system in technical ways, such as changing the compression ratio, high injection pressures, improved ignition systems, smaller engines, Miller cycle and low-carbon fuels [6]. This has led to different technologies and engine names depending on the type of injection, and cylinder layout, among others.
Manufacturers have developed various systems, including the MPFI (Multipoint Fuel Injection) engine, also known as MPI (Multipoint Injection), MFI (Multipoint Fuel Injection) or MI (Multipoint Injection). This widely adopted system is noted for its combustion efficiency, achieved through an electronic injection that provides a specific injector for each cylinder. The distinguishing feature of MPFI lies in its ability to achieve a virtually homogeneous premix of air and fuel, maintaining a stoichiometric ratio within the combustion chamber. This approach not only improves fuel combustion efficiency but also has significant environmental benefits by avoiding and reducing particulate emissions. As a result, soot production is reduced to virtually negligible levels, contributing to a cleaner and more environmentally friendly operation [7].
Ling et al. [8], show that making changes in engine operation, especially the ignition control model is a variation in the electronic system aimed at adjusting the desired parameters. Adjusting the advance or retard timing of ignition reduces unburned hydrocarbons (HC) and nitrous oxides (NOx) emissions but if the timing is inadequate could cause an explosion, decrease performance, and increase fuel consumption. Electronics are key to engine design, seeking to do more with less fuel, helping engineers and programmers to simulate how small changes affect the functional requirements of the vehicle [9]. Researchers Pla et al. [10] designed an ignition advance system with injection mapping combined with an engine knock estimator, resulting in an increase in thermal efficiency of 5% to 7% at steady state conditions, leading to lower fuel consumption, lower emissions, and improved engine performance.
Balazadeh et al. [11] highlight that technological advances to increase engine efficiency and reduce vehicle drag and different powertrain configurations achieve significant greenhouse gas reductions in the transport sector. In their study “Advances in Vehicle and Powertrain Efficiency of Long-Haul Commercial Vehicles: A Review” by configuring engine, powertrain, and design parameters in heavy transport, they achieved a reduction in fuel consumption, increasing the distance travelled by 100–150%. Another study [12]: “Computational investigations on MPFI engine fuelled blended ethanol, H2O based Micro-emulsions, and conventional gasoline” considers the high demand for oil and the use of software and different fuels to change the electronics and performance. It reduces emissions and improves performance as well as engine temperature. In this paper, the researcher Qadiri used 85% ethanol, 10% gasoline and 5% water with a computer program, achieving a reduction in HC of 0.0040 kg/kW-h (kilograms per kilowatt-hour). At 100% engine load, NOx is 0.004 kg/kW-h and carbon monoxide (CO) is approximately 0.0001 kg/kW-h, which is in line with exhaust emission standards. Savickas et al. [13] apply telemetric analysis for the measurement of emissions in harvesters since agriculture and transport have a high impact on greenhouse gas emissions. In this way, thanks to the tool implemented by the researchers, the farmer can estimate the performance of the harvester and thus evaluate the performance in terms of CO2 emitted. It cannot be ignored that, in addition to fuel, modification of the electrical parameters affects the combustion quality. The brain that controls the engine, working behind all the electric and electronic systems, is the Engine Control Unit (ECU), which activates the main actuators that affect efficiency and fuel economy.
Electronic injection has not only been involved in improved engine performance, but it has also influenced emission control, and its operation depends on information received by the ECU from sensors [14]. To adjust the injection parameters, it is necessary to vary the engine electronics and make the actuators work according to the signals sent by reprogramming. Since the ECU controls these signals, it is their operation that must be reprogrammed.
However, engines already incorporate a control unit with preset parameters and are not programmable, so there are units on the market that can be reprogrammed. Any vehicle with an ECU can be reprogrammed for different performances. This adjustment achieves power increase and improvement of other elements, shaping the behaviour and performance of the vehicle, depending on what the user wishes to modify [15]. The fundamental control constants to be considered in engine operation are injection type, ignition type, oxygen sensor configuration, fuel characteristics, and number of injectors, among others [16]. The control unit of a programmable ECU will control the amount of fuel dosed to each cylinder depending on engine speed and air inlet pressure, which can be varied in a spreadsheet that allows the injection values to be modified [17].
The programmable ECU varies the injection and ignition process by interpolating data to build a tuning function that improves engine performance [18]. Thanks to the information collected, fuel consumption can be optimised, providing a suitable air-fuel mixture according to the driver’s needs, injecting more or less fuel, meeting the demands and without the vehicle losing power. It is important to emphasise that if one or more sensors are faulty, the signals will be erroneous, affecting the engine and its internal components [19]. Environmental factors must also be considered when programming. The original ECU has standard values for engines at sea level, however, air density and temperature do affect engine performance [20]. The manufacturer will not have a different map according to the environmental zones and conditions under which the vehicle will be used, so when reprogramming it is important to reconcile not only internal but also external factors.
In the Ecuadorian context, manufacturers do not analyse the external factors of the areas where their vehicles will be used, such as air quality, fuel quality, height above sea level and geographical location. To address the problem, variations in the parameters have been studied by installing a programmable ECU, designing a map that is suitable for the actual external conditions of the vehicle and developing an appropriate driving cycle by adjusting it to the geography. Still, such research has not been sufficiently explored in the Ecuadorian context, and that is the problem that this research seeks to address. According to Gadvay et al. [21], reprogramming can be used to reduce emissions or fuel consumption, and their research has shown that varying the injection parameters to control emissions does not reduce torque or power, using the Race Evo programme and a dynamometric bench to prove their hypothesis. On the other hand, the researchers Montúfar et al. [22] achieved a reduction of fuel consumption from 0.265 to 0.1786 gallons with such modification on the route they studied. It can be shown that implementing a programmable module allows the engine map to be optimised to reduce emissions [23].
On the other hand, J. Cevallos [24] adapted different injection maps considering 2800 metres above sea level (masl), as a result, at idle speed the engine emitted 0.12% CO, 220% HC, 11.1% CO2 and 0.30% oxygen (O2), and at full load (2500 min−1) 0.03% CO, 115% HC, 11.1% CO2 and 0.50% O2. This successfully complies with national regulations. It is therefore considered viable to install a reprogrammable ECU that allows the necessary engine parameters to be varied to increase efficiency and reduce emissions.
There are several brands of reprogrammable ECUs available. For this study, the Pandoo brand will be used with its Box Inject ECU module. To control the throttle body and ignition system it will be used alongside two systems in addition to the main module. The programming software, with the latest available version 1.55, allows the three-dimensional maps to be modified according to volumetric efficiency and ignition advance, obtaining the zones that need to be repowered to optimise the engine’s characteristic curves [25].
Another parameter to consider is that fuel injection also depends on the catalytic system because the catalytic system is complemented by a lambda sensor that monitors the amount of oxygen in the exhaust gases, thus the ECU regulates the air-fuel ratio so that the catalyst operates at a stoichiometric mixture and 100% efficiency [26].
The utilization of the lambda sensor for monitoring oxygen levels in the exhaust gasses plays a pivotal role in facilitating the catalyst’s effective oxidation of CO and HC. Additionally, this monitoring contributes to the decomposition of NOx, enhancing overall catalytic efficiency [27]. Since catalytic converters began to be used, the reduction of gases emitted by vehicles has been noted, and with recent advances in their durability and efficiency, they are relied upon to reduce pollution [28]. The working temperature of the catalytic converter is critical because when it is suitable, its work is more efficient. According to Gasser et al. [29] in their study “Optimal Temperature Control in a Catalytic Converter”, there is a minimum limit to work properly and a maximum limit to avoid damage.
The ideal working temperature of a catalyst ranges from 300 °C to 800 °C and a lambda close to 1 for the catalyst to work properly. Researchers Brinklow et al. [30] performed a test without activating a cylinder and with an open cycle, using a three-way catalyst, achieving a reduction of CO from 6300 parts per million (ppm) to 5000 ppm, indicating an increase in combustion efficiency due to the oxidation of carbon to CO2.
Structurally, the catalyst contains platinum (Pt) or palladium (Pd) for oxidation reactions, and rhodium metal (Rh) for NOx reduction. The monoliths it contains also affect catalyst performance. According to Rood et al. [31], a zeolite monolith catalyst traps an estimated 85% of HC, whereas a traditional zeolite monolith catalyst with cordierite only traps 65% of HC.
Within this framework, the study of the fluctuations in parameters such as engine load, injection pulse, and catalytic system for emission control is instrumental in advancing superior systems. This, in turn, leads to the development of more efficient engines in terms of performance, ensuring continued compliance with the most stringent standards. Notably, consideration will be given to Euro 3, Euro 4, and Euro 5 catalytic converters, prevalent in Ecuador. Recognising that the lifespan of catalytic converters significantly impacts emission outcomes, any saturation or reduction in efficiency could result in the release of harmful emissions and particulate matter into the environment.
2. Materials and Methods
2.1. Materials
To adjust the fuel injection control general parameters, a Pandoo ECU, called Box Inject, is used, as shown in Figure 1a. Figure 1b shows an Electronic Acceleration Body Control Module and Figure 1c shows an Ignition Control Module, all of these devices are of Brazilian origin, and the Pandoo brand is based in Sao Paulo. These were selected because of their availability in the university laboratory and for being the most accessible and versatile ECUs available in the Ecuadorian market.

Figure 1.
Inject programmable systems Pandoo. (a) Box Inject module (b) Electronic Acceleration Body Control Module. (c) Ignition Control Module.
2.1.1. Programmable Control Injection Pandoo
Called Box Inject allows the following engine parameters to be adjusted:
- Injection pulse
- Ignition advance
- TPS sensor corrections
- Engine temperature corrections
- Battery voltage corrections
- Output configurations (actuators)
- Input configurations (sensors)
2.1.2. Electronic Acceleration Body Control Module
In this study, an electronic throttle body was used. Since the Box Inject ECU cannot control it by itself, a control module was added just for the throttle body. This device is also from Pandoo, called ETPS Control, Figure 1b.
This module controls the throttle opening in the throttle body to maintain the desired engine load [32]. To enable communication between the pedal and the throttle body, calibration must be carried out with the aid of specialised software.
2.1.3. Ignition Control Module
The coils used are not transistorised, they are coils without internal ignition, so a module is needed to control the current flow so that they do not burn out. Box Inject cannot control this parameter without the module. Therefore, the Pandoo Power Spark, Figure 1c, has been used, which can control the current that will reach the coils.
Power Spark can have from 1 to 6 channels, according to the number of coils the motor has. In this study, 4 coils were used, so the module has 4 channels. The operation consists of receiving the ignition signal from the electronic injection, and controlling the coil charge and discharge time so that there is no loss of performance [33].
With all the available functions, the operation of the engine electronics can be controlled to suit the required needs.
The characteristics of the devices of control can be found in Table 1 for all ECUs.

Table 1.
Technical specifications.
2.1.4. Software
To modify the engine parameters, especially the injection maps, it was necessary to use the official Pandoo software. This software, Pandoo ECU Manager, connects automatically via USB to the Box Inject ECU, where the modified maps are saved to control the engine and the other modules via CAN (Controller Area Network) network, E-TPS and Power Spark.
Along with the spreadsheet of the injection values or ignition advance parameters, there is the 3D map, Figure 2, which will indicate in which zone the engine is operating according to the load provided.
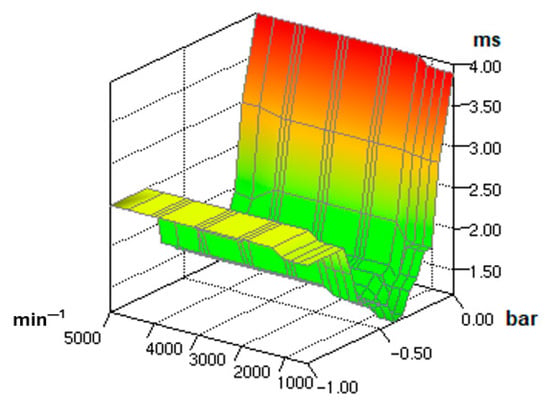
Figure 2.
3D injection pulse map.
The error rate is minimal in data transmission, the modules communicate via high-speed CAN protocol, up to 1 Mbit/s [34], which provides reliable and efficient communication, eliminating disturbances due to noise or vibration.
2.1.5. Engine
The tests were carried out on a 2.0 DOHC G4KA engine belonging to the manufacturer Hyundai, the engine bench is of the brand YESA model 3140, of Korean origin, based in Seoul. According to data from the Association of Automotive Companies of Ecuador (AEADE) [35], its technology, the MPFI system, is the most common in the country’s market, with brands such as Kia and Hyundai. Table 2 shows the technical characteristics.

Table 2.
G4KA Engine Specifications.
With the standard vehicle parameters, the following emission values are shown in Table 3, which are to be improved with the variation of maps using the Box Inject.

Table 3.
G4KA Engine emissions with standard parameters.
2.1.6. Electronic Throttle Body
An electronic throttle body has replaced the mechanical throttle body, so the communication between the pedal and the throttle body is via sensors. The pedal receives the signal that will make the small motor in the throttle body work, opening or closing the throttle. The ignition and injection timing will be modified by the position of the throttle valve and how progressive this change is [36].
2.1.7. Sensors
Sensors will be fundamental to the electrical and electronic operation of the engine. These devices will receive signals and send them to the ECU so that the actuators can operate according to the information received. The data captured by the sensor are known as instrumentation variables, which can be temperature, light intensity, distance, acceleration, pressure, force, humidity, and displacement, among others, and will be converted into analogue or digital signals that can be interpreted by the ECU [37].
2.1.8. Coils
The coils employed in this system are the inherent engine coils, devoid of transistorizing and lacking internal ignition. These coils are governed by the Power Spark module. Each cylinder is equipped with a dedicated coil, featuring two pins—one for positive voltage and the second pin, under the control of the module, for negative voltage.
2.1.9. Fuel
The G4KA engine with an MPFI injection system uses gasoline as fuel. Gasoline consists of hydrocarbons such as butanes, butenes and methylnaphthalene, and its composition can vary from one refinery to another [38]. The fuel is related to vehicle emissions, therefore, the maximum and minimum number of physicochemical factors of gasoline have been established, these are density, vapour pressure, distillation curve, octane number, and content of compounds such as benzene, olefins, sulphur, or aromatics [39]. The characteristics of gasoline are summarised in Table 4, according to [40].

Table 4.
Gasoline Properties.
2.1.10. Catalysts of Different Generations
Catalytic converters play an important role in reducing the pollution generated by vehicles and have been evolving and improving their composition to comply with current regulations (EURO, EPA, etc.). Currently, the exhaust after-treatment system has focused on three-way catalysts based on oxidation, absorption, filtration, and storage processes [41].
The study uses two Indima oxidation catalysts and an original three-way catalytic converter. The oxidation or two-way catalytic converters convert CO and HC into CO2 and water, they are of Euro 3 and Euro 4 generation. On the other hand, the Euro 5 catalytic converter is a 3-way catalytic converter, which first carries out the NOx reduction process and then the oxidation of CO and HC, resulting in nitrogen (N2), CO2 and water (H2O).
The specifications of the Euro 3, Euro 4, and Euro 5 catalytic converters are presented in Table 5. It was decided to purchase it new, unused, in order not to have problems due to wear of the internal materials that may affect the measurements taken.

Table 5.
Catalytic converter specifications.
For a catalytic converter to operate effectively, it must exceed 300 °C, even going as far as 900 °C under extreme conditions [42]. It is for this reason that catalytic converters are located closer and closer to the exhaust manifold, taking advantage of the heat from the exhaust gas outlet.
2.1.11. Emission Measurement Equipment
To obtain the gases emitted, after each variation of the injection map, the gas analyser, Brain Bee AGS-688, Figure 3, available at the university laboratory, is used. It will provide the values of CO, corrected CO, HC, O2, NOx and Lambda. The equipment complies with European standards for quality and accuracy, including meeting the strict German TÜV standard [43].
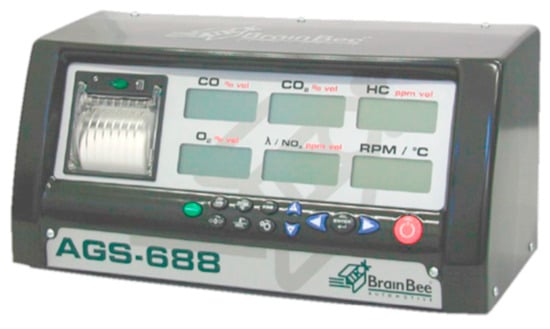
Figure 3.
Brain Bee AGS-688.
Table 6 summarises the most important characteristics that will be considered for the test measurements.

Table 6.
Characteristics of gas analyser.
Tests shall be performed both at idling speed and at full load, following the procedures of the Quito metropolitan district vehicle technical inspection [45].
2.1.12. Thermographic Camera
For the visualization of temperature within the exhaust system and catalytic converter, a Fotric thermographic camera model 348 A, illustrated in Figure 4, will be employed.
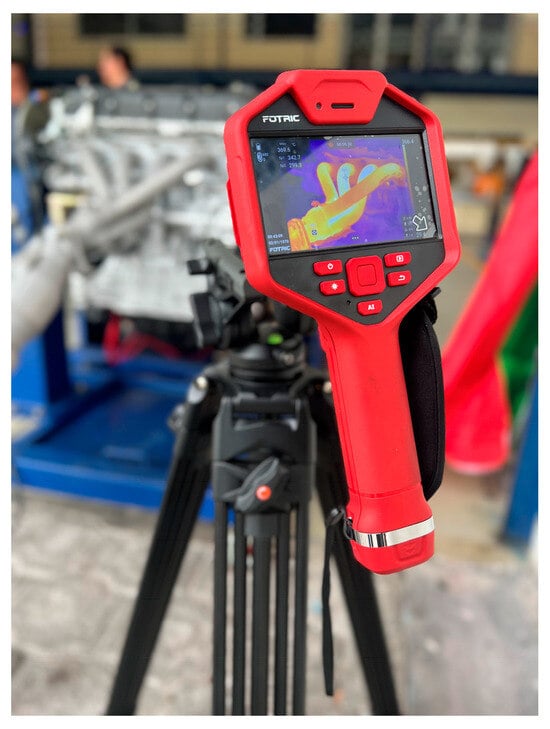
Figure 4.
Thermographic Camera Fotric 348 A.
The characteristics of the equipment presented in Table 7 were obtained from the official website [46]. According to what is presented, the measuring range should be properly selected, and measurements should be taken at one metre of distance as indicated on the camera display.

Table 7.
Specifications on the Fotric thermographic camera.
As seen in Table 8, the emissivity value together with the reflected temperature, ambient temperature, relative humidity, and distance are displayed on the bottom right-hand side of the screen.

Table 8.
Temperature Measurements Parameters.
Within the camera configurations, the material studied must be selected, due to the emissivity, which is the capacity of a material to emit infrared energy. In all cases, this measurement was only taken for the exhaust manifold, which is made of steel, with an emissivity of 0.98 selected in the equipment.
2.2. Methods
In this study, an experimental method will be followed by instrumenting an indirect injection engine bench with an MPFI 2.0 litre system corresponding to a Hyundai Sonata. The technology of this engine is common in the most sold light vehicles in the country, and it was installed in several models of the Korean companies Hyundai and Kia, such as the Kia Carens model.
In this case, the programmable ECU Box Inject of the Pandoo brand, available in the university laboratory, will be used. This module will communicate with the engine via the CAN network and USB to the programming software on the laptop. Additionally, the E-TPS module will be acquired to control the electronic throttle body together with the pedal and the Power Spark module to increase the performance of the ignition coils and generate an improvement in the ignition spark.
The software used is Pandoo ECU Manager which allows real-time calibration of data and varies the TPS signals, current atmospheric pressure, and ignition advance [34]. It is important to follow the manual for the initial configuration of all equipment, as any error can be irreversible. First, start by configuring the base map with the two new modules.
Connecting the ETPS module will control the engine power to maintain the desired throttle butterfly opening, the connection will be on the track that has the most voltage variation in both the accelerator pedal and throttle body [32]. The 4-channel Power Spark module will control each ignition coil, managing the ignition spark, based on the signal generated by the programmable electronic injection module [33].
Emissions data will be taken from each map designed to choose the most efficient one, and the variation in the data will also be tested when using Euro 3, Euro 4, and Euro 5 catalytic converters, since in Ecuador they are the most common in the vehicle fleet. An optimal map needs to be crafted for each technology, aiming to minimize emissions while maintaining engine stability. This is imperative because the operational parameters of the catalytic converters implemented differ from those of the original catalytic converter. Customizing the engine control map ensures compatibility with the specific characteristics and requirements of the new catalytic converters, aligning them with the desired emissions reduction and engine stability objectives.
With the emission data obtained from each injection and catalyst map, it will be possible to compare the initial or original engine emissions and the improvement in the system.
Figure 5 shows the characteristics of the experimental process carried out in the methodology, allowing a control of the test model, to ensure its feasibility in the results.
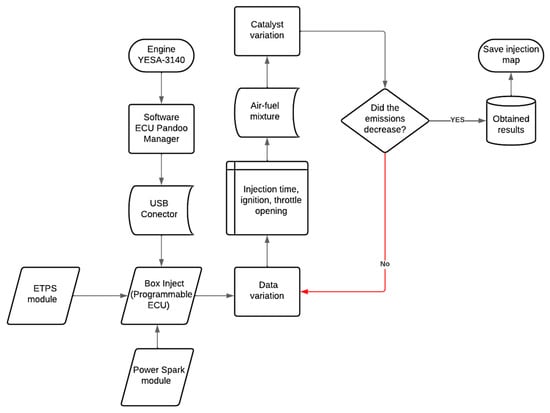
Figure 5.
Methodology flowchart.
Once the data have been obtained, an analysis of the most important control variables that can be modified with the Box Inject programmable ECU will be developed, which will include injection pulse, ignition timing, throttle butterfly opening signal and ignition advance. For each catalytic converter, certain parameters will be changed, to be explained in the final study, which will lead to the expected results. The data shall be compared with the current Ecuadorian regulations, as specified in Table 9, to which the studied catalytic converters correspond, as well as compared with each other to conclude.

Table 9.
Emissions limits according to NTE-INEN 2204 and Euro regulations.
Additionally, the temperature reached in the exhaust system before the catalytic converter was taken using the Fotric thermographic camera to verify that it was higher than 300 °C. The camera must be placed at the same height as the area to be measured, at one metre, and the measuring range must be set from 0 °C to 650 °C to take the data properly.
Finally, the results obtained for each variable will be described, discussing the process followed to arrive at the desired values according to the current regulations, and how the variation of the electronic parameters of an engine could help vehicle technology in the country to improve its performance efficiency.
3. Uncertainty Analysis
To ensure that the data obtained do not have a significant margin of error, an uncertainty analysis was carried out, considering the percentage of reading error in the equipment used. The values are specified in Table 10.

Table 10.
Study Uncertainty Analysis.
The total error of the study is 0.59%. This value is minimal and acceptable, it does not influence significantly the results obtained at the end of the study.
The distance is a parameter that increases the uncertainty factor of the emissivity of the material, which in this case is negligible, since according to the configuration of the thermographic camera, it specifies the distance and the emissivity range, with the lowest percentage of error for the material analysed.
Objects with changes of shape on their surface denote an altered shape, therefore, they were placed with a thermal paint with a matte finish, decreasing the dispersion, to generate a better emissivity. This allows a better range of measurement according to the features of measurement of the camera, since the emissivity factor on surfaces painted with thermal paint, improve the emissivity and thermal radiation of the material.
In addition to this, the material has been selected, which in this case is for a rough surface at 50 °C, with these pre-set configurations the camera can take the values properly, self-calculating emissivity from a range of 0.95 to 0.98, and with the temperature taken the highest emissivity value was 0.98, to avoid measurement errors it was also configured that the measurement distance is 1 m between the material and the camera.
The emissivity does depend on the temperature, but when using the thermal imaging camera, the user does not need to know the calculation ratios of temperature, radioactivity or emissivity, because the camera software calculates everything by itself, only the configuration must be set correctly [47].
With all the elements listed above, the efficiency of the engine can be improved, and the results of the study will be evaluated below.
4. Results
The injection pulse variation has been started, with the Euro 3 generation catalytic converter installed and continued with the other catalytic converters thereafter. The configurations realised are summarised in Table 11 below. The whole injection map works according to engine revolutions and engine vacuum, read by the Manifold Absolute Pressure sensor (MAP).

Table 11.
Injection parameters for each configuration on the engine.
For each map, the injection and ignition values increase so that the engine has sufficient load and can work properly under the set conditions with each catalytic converter.
For the catalytic converter to function efficiently, it needs to reach an optimum operating temperature of more than 300 °C [42]. With the help of the Fotric thermographic camera, images of the catalytic systems are taken to verify that the catalytic ceramics are in a suitable temperature range.
Figure 6 shows how the catalytic converter is installed (catalytic Euro 3 Figure 6a, catalytic Euro 4 Figure 6b and catalytic Euro 5 Figure 6c), close to the exhaust manifold to take advantage of the temperature at which the combustion gases leave the exhaust.
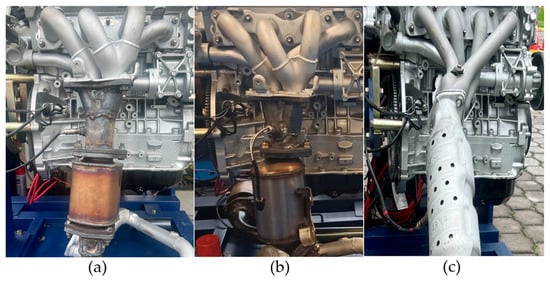
Figure 6.
G4KA Engine with catalytic converters. (a) Engine with Euro 3 catalytic (b) Engine with Euro 4 catalytic. (c) Engine with Euro 5 catalytic.
In each evolution of the catalytic converter, the aim has been to get them closer and closer to the engine to reach operating temperature as soon as possible and thus functioning correctly. Two measuring points have been placed on the thermographic camera, sp1 at the exhaust manifold and sp2 before the catalytic converter, as seen in Figure 7 (catalytic Euro 3 Figure 7a, catalytic Euro 4 Figure 7b and catalytic Euro 5 Figure 7c), to verify the temperature at which the exhaust gases reach the ceramics of the catalytic filter.

Figure 7.
Exhaust system temperature upstream the Euro 3 (a), Euro 4 (b) and Euro 5 (c) catalytic converters.
The results of the measuring points according to the thermographic camera and the maximum temperature reached in the system are shown in Table 12.

Table 12.
The temperature reached by each catalytic converter.
After analysing the emissions graphically, we will compare and verify whether the vehicle complies with the regulations of the Quito Vehicle Technical Inspection (RTV).
According to the RTV [45], to take emissions at idle speed, the vehicle must wait until it is at normal operating temperature and then enter the gas analyser probe. On the other hand, for a full load, in gasoline engines, accelerate the vehicle to 2500 min−1 for 10 s and the probe will take the measurement.
The gas analyser takes the measurement every 3 s, a total of 5 data points have been taken in 15 s for each emitted gas to make a comparison between the different maps and catalysts.
First, to analyse what happened to HC emissions in each system, with the following data from Table 13.

Table 13.
HC idling emission values taken over time.
Figure 8 shows that the engine without a catalytic system generates HC emissions of 48 ppm denoted by the blue line ranging from 47 ppm to 49 ppm because there is no after-treatment system. These values are achieved only by reprogramming the injection parameters, which shows the difference when using a catalytic system with an indirect injection map. For Euro 3 catalytic converter the emission is around 17 ppm indicated by the red line ranging from 16 ppm to 18 ppm as a result of reprogramming and the catalytic system. For Euro 4 catalytic converter it increases slightly and is recorded at 20 ppm denoted by the purple line ranging from 18 ppm to 22 ppm, with this result it is recognised that combustion needs to be improved for this system. However, the Euro 5 catalyst combined with the previously selected injection map performed very well, achieving 10 ppm HC denoted by the black line ranging from 9 ppm to 11 ppm, which is a significant reduction compared to the other configurations evaluated. These results show the effectiveness of Euro 5 catalytic converters in reducing hydrocarbon emissions and highlight the importance of choosing the right composition to optimise the environmental performance of the engine.
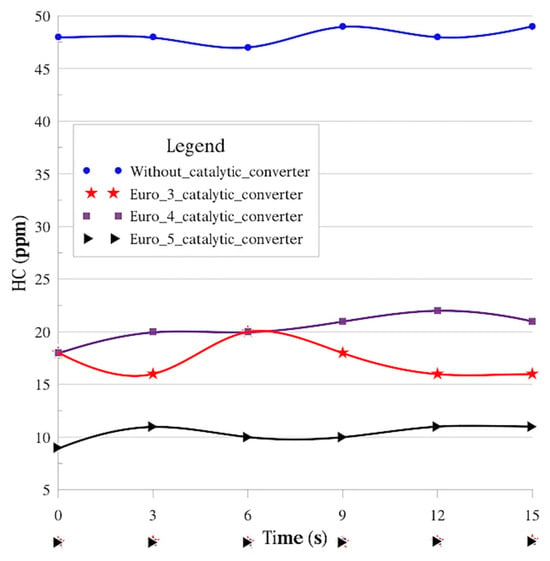
Figure 8.
Scatter plot according to time and HC emissions in parts per million at idle speed, showing the behaviour of the different after-treatment system configurations and injection parameters.
The next parameter to be checked is the CO emissions, taken in a time of 15 s and according to each system adapted to the engine. The results can be seen in Table 14.

Table 14.
CO idling speed emissions values taken over time.
Figure 9 shows the CO emissions of each system analysed. According to the findings, only the engine with the silencer emits 0.15% CO indicated by the blue line, ranging from 0% to 0.26%. On the other hand, the introduction of Euro 3 catalytic converters reduces these emissions to 0.07% indicated by the red line, in a range of 0% to 0.2% which decreases further to not using a catalyst. The system using the Euro 4 catalytic converter achieved a greater reduction, registering only 0.05% CO denoted by the purple line, in a range of 0% to 0.1% which further decreases CO. With the Euro 5 catalytic converter, CO went down to 0.03%, indicating an improvement in the combustion of the gases denoted by the black line, in the range of 0% to 0.1% with more tendency to neutrality, showing a better result than with the other configurations. This work shows the continued relevance of the use of catalytic systems to reduce this gas.
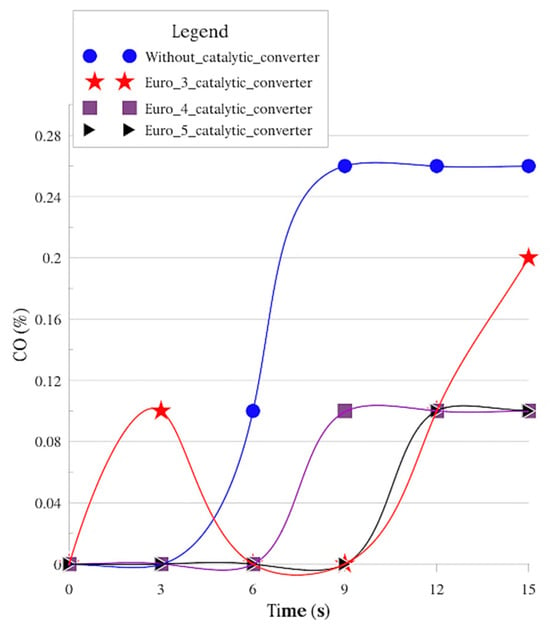
Figure 9.
Scatter plot according to time and CO emissions in percentage at idle speed, showing the behaviour of the different after-treatment system configurations and injection parameters.
One of the methods that helps determine the combustion efficiency in the engine is measuring the concentration of gases such as O2 [48]. To collect the data on the O2 content in the exhaust gases, a lambda sensor is used to monitor the values, which allows the fuel content to be known, as well as the behaviour of the catalytic converter, which is given by the air-fuel mixture. Therefore, some catalytic converters also reduce oxygen according to the operating conditions, releasing it when its presence is low [49]. A very low oxygen value indicates that the mixture has more fuel than air and a very high value indicates that it has more air than fuel, so at neither extreme is combustion efficient. When the oxygen and carbon monoxide values intersect, it means that the mixture is stoichiometric and therefore the combustion is very efficient.
The O2 emissions for each of the maps and their catalysts are presented in Table 15. In brief, a difference can be seen, with the value decreasing according to the catalyst technology.

Table 15.
O2 idling emissions values taken over time.
Figure 10 shows that without the use of a catalyst (the blue line) the values range between 1.23% to 1.45%, O2 emissions reach 1.39%, and the difference with the Euro 3 catalyst is not so large indicated by the red line in a range of 1.27% to 1.29%, as it is 1.28% in average, indicating that the mixture is very poor. With the Euro 4 catalytic converter, there is a more noticeable change, emitting 0.79% indicated by the purple line in a range of 0.74% to 0.84% and with the Euro 5 catalytic converter there is a reduction of up to 0.81% of O2, indicated by the purple line in a range of 0.7% to 0.84%.
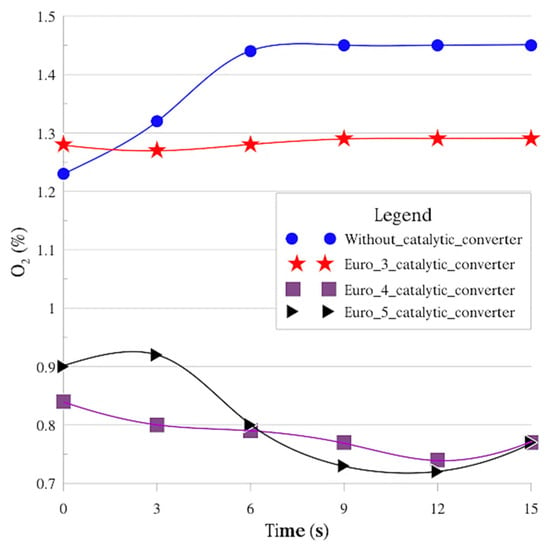
Figure 10.
Scatter plot according to time and O2 emissions in percentage and at idle speed, showing the behaviour of the different after-treatment system configurations and injection parameters.
The NOx emissions for each of the maps and their catalysts are presented in Table 16.

Table 16.
NOx values taken over time at idle speed.
Figure 11 indicates that the NOx values do not exceed 1 ppm and the results range between 0 ppm and 1 ppm in this regime in any case. Both nitrogen and oxygen enter the engine through the air, and NOx is formed due to combustion. No NOx is emitted without the use of a catalyst, as shown in the blue line. But for the other systems, the combustion temperature increases due to the pressure exerted on the exhaust manifold when using a catalyst, causing the NOx to oscillate between 0 ppm and 1 ppm as shown in the lines in Figure 11.
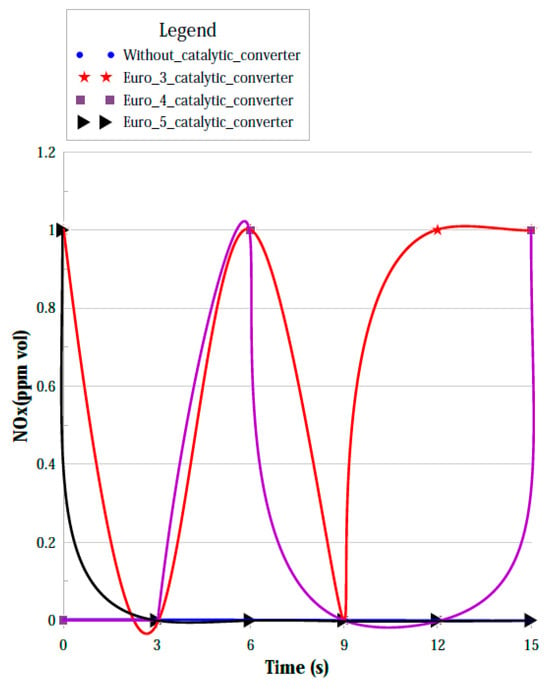
Figure 11.
Scatter plot according to time and NOx emissions in ppm and at idle speed, showing the behaviour of the different after-treatment system configurations and injection parameters.
The last gas analysed is CO2, which is the main greenhouse gas, but the most difficult to control. According to EPA [50], most CO2 comes from the air, not the fuel, and upon combustion, hydrogen combines with oxygen to form water, while carbon combines with oxygen to form CO2. The results obtained at idle speed are shown in Table 17.

Table 17.
CO2 values taken over time at idle speed.
Contrary to the previous tests, in this case, the CO2 is low without the use of a catalyst. If the mixture is very lean or very rich, the CO2 value is lower than when the air-fuel ratio is stoichiometric. Considering that the O2 data are higher than in the other systems, then it is a lean mixture. As indicated in Figure 12, the blue line ranges from 8.7% to 8.8%, but for the other systems the value increases, with the Euro 3 system in the range of 13.5% to 13.6% (the red line), the same for the Euro 4 system (purple line) within the same range of 13.5% to 13.6%. For the Euro 5 system (black line), this factor decreases, entering a range of 13.3% to 13.4%.
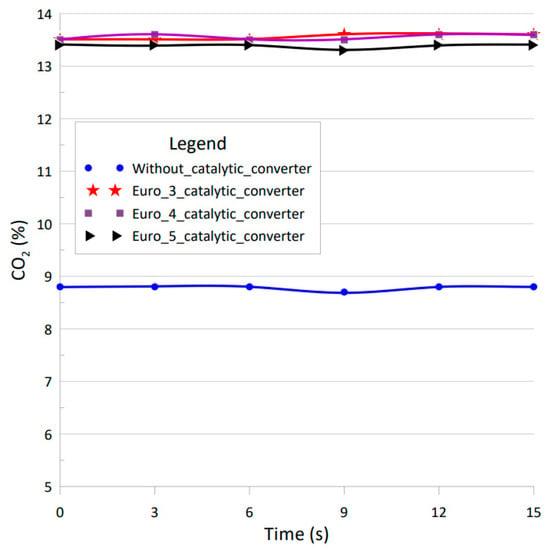
Figure 12.
Scatter plot according to time and CO2 emissions in % and at idle speed, showing the behaviour of the different after-treatment system configurations and injection parameters.
Figure 12 shows the results of CO2 and how they behave through time.
The full load HC values are presented below in Table 18, taken over a time of 15 s for each catalyst configuration and injection parameter.

Table 18.
HC values taken over time at full load.
In Figure 13 the HC emissions are still below the limit. With the engine without a catalytic converter 41 ppm HC was achieved as indicated by the blue line, in the range of 37 ppm to 46 ppm, which is a very high value in contrast to the other systems, but with the catalytic converter, there is a significant reduction. With the Euro 3 catalytic converter, 23 ppm were achieved as indicated by the red line, in the range of 20 ppm to 27 ppm, which significantly reduces this value, with the Euro 4 catalytic converter 18 ppm as noted on the purple line, in the range of 17 ppm to 20 ppm. With the Euro 5 catalytic converter, only 2 ppm HC were achieved as illustrated by the black line, in the range of 1 ppm to 5 ppm, achieving a significant improvement over the other systems, thanks to the modification of the injection parameters and the use of a Euro 5 generation catalytic converter.
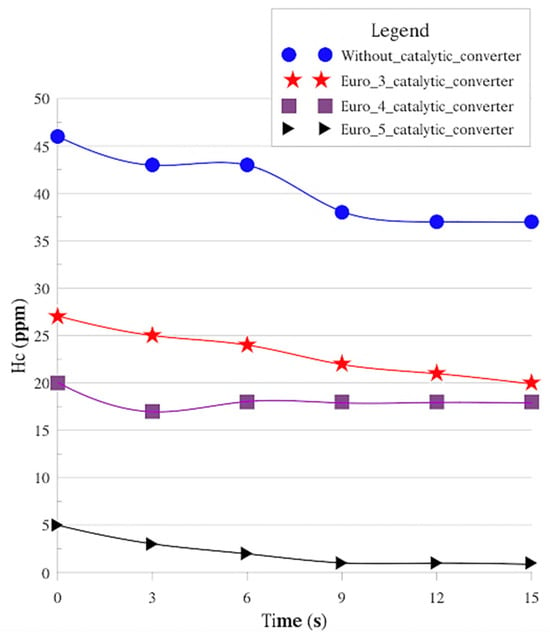
Figure 13.
Scatter plot according to time and HC emissions in ppm, showing the behaviour of the different post-treatment system configurations and injection parameters.
For CO emissions the following values are obtained, throughout 15 s in each system. Table 19 shows the CO results at full load.

Table 19.
CO values taken over time at full load.
Figure 14 shows CO emissions. When there is no catalyst, emissions are reduced to 0.19%, indicated on the blue line, which ranges from 0.18% to 0.21%, which is a good result but was further improved by using catalysts. With the Euro 3 catalyst, the average value is 0.01% as indicated on the red line, ranging from 0.1% to 0.2%, which improved even more than without using a catalyst. While the Euro 4 catalyst produces 0.03% indicated by the purple line, ranging from 0.2% to 0.4%, increasing the value at full load, the same case happened with the Euro 5 system, black line, ranging from 0.1% to 0.3% and an average value of 0.02%, indicating that there are not enough oxygen molecules to form CO2 and therefore CO increases slightly.
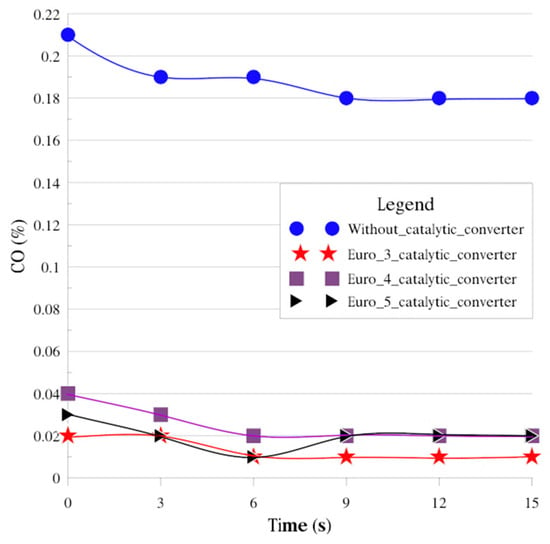
Figure 14.
Scatter plot according to time and CO emissions, showing the behaviour of the different after-treatment system configurations and injection parameters.
The full load O2 values are presented below in Table 20, taken over a time of 15 s for each catalyst configuration and injection parameter.

Table 20.
O2 values taken over time at full load.
According to Figure 15, the emissions performance without using a catalyst reaches 6.27% O2 which means a very poor mix at full load, the range shown by the red line is between 5.89% to 6.93%, which is very high. This value is followed by the Euro 5 catalyst. Although it reduced the previous emissions, it was not the one that produced the least O2, reaching 2.75%, indicating that the air-fuel mixture has more air than fuel, as indicated by the black line, which ranges from 2.49% to 2.91%. With the Euro 3 catalytic converter it decreased to 2% as indicated by the red line with ranges from 1.87% to 2.13% and with the Euro 4 catalytic converter it dropped to 2.02% O2 as represented by the purple line with ranges from 1.96% to 2.17%.
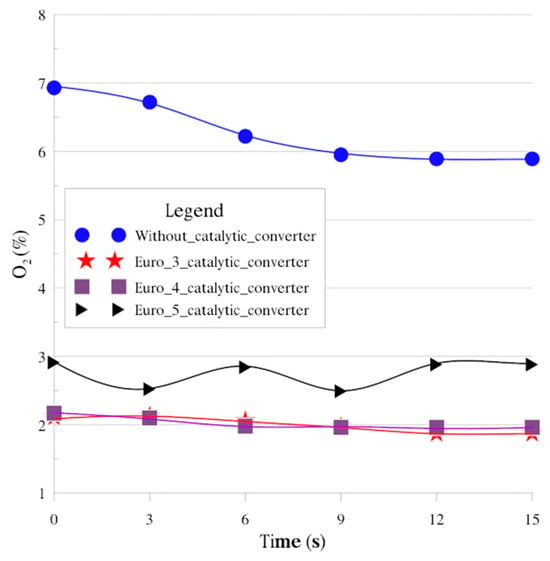
Figure 15.
Scatter plot according to time and O2 emissions, showing the behaviour of the different post-treatment system configurations and injection parameters.
The same tests shall be carried out to monitor NOx emissions, but with the engine at full load, 2500 min−1. The time the engine will be kept at full load will be 10 s and the values will be taken in 15 s and 5 data points will be obtained. Table 21 shows the NOx results at full load.

Table 21.
NOx values taken over time at full load.
At full load, the NOx values are higher, as shown in Table 21, in contrast to the almost zero values when the vehicle is idling. The values depend on the combustion temperature, the higher the combustion temperature, the higher the values, and the temperature is a function of the load [51]. This is why the values in Table 21 increased compared to Table 16. Figure 16 provides a better approach to the NOx behaviour. Without using a catalyst, NOx reaches an average value of 44.83 ppm, following the blue line within a range of 25 ppm to 51 ppm. This result is followed by the Euro 5 system with 32.83 ppm, black line, with values between 30 ppm to 36 ppm. The Euro 4 system reached 24.67 ppm, purple line, within a range of values from 22 ppm to 27 ppm. With the Euro 3 system, the best result was obtained, reaching only 12.17 ppm, as shown in the red line, the values are in the range of 4 ppm to 19 ppm, i.e., the combustion temperature is not as high as in the other cases.
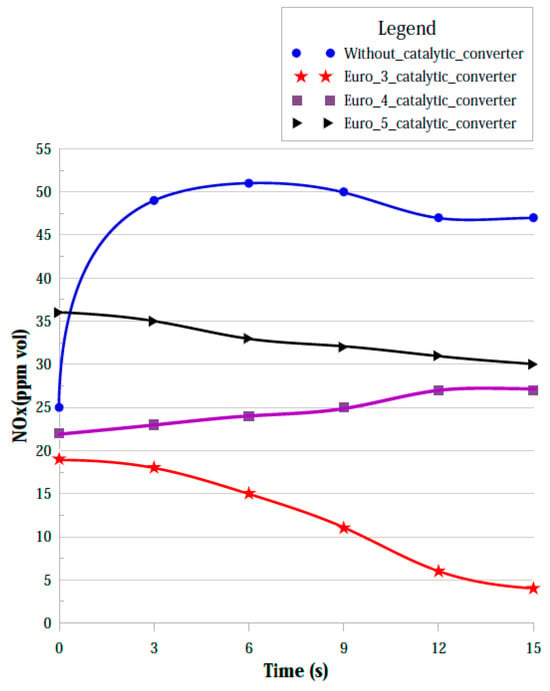
Figure 16.
Scatter plot according to time and NOx emissions, showing the behaviour of the different post-treatment system configurations and injection parameters.
Tests at full load to measure CO2 were carried out following the same criteria as for the other gases, obtaining the results shown in Table 22.

Table 22.
CO2 values taken over time at full load.
Figure 17 illustrates the behaviour of CO2, showing the difference between the systems. Without a catalytic converter, the CO2 values remain low, as in the idle test as illustrated by the red line, with a range of values between 10.7% to 11%, the air-fuel ratio in the case of the system without a catalyst is still very poor, as evidenced by the O2 values, therefore CO2 is still low. With the Euro 5 catalytic converter, the second lowest value was obtained with an average value of 12.18%, black line, with data ranging from 12.1% to 12.2%. With the Euro 4 system, the value obtained was 12.43%, following the purple line in a range of 12.4% to 12.5%. With the Euro 3 system, this value increased to 13.35%, as shown in the red line, with values fluctuating between 13% and 13.5%.
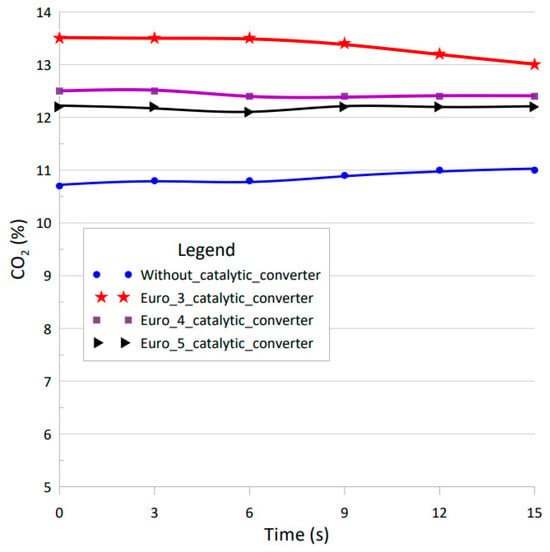
Figure 17.
Scatter plot according to time and CO2 emissions, showing the behaviour of the different post-treatment system configurations and injection parameters.
The following table shows the data accepted by the Quito Vehicle Technical Inspection with a type 0 rating, which means that the vehicle complies with inspection without any error or problem and will be compared with each configuration carried out.
Table 23 presents the data summarised and compared with the Ecuadorian regulations at idling speed. Although the Vehicle Technical Inspection does not regulate NOx emissions in gas vehicles, the table shows the range according to the generation of the catalytic converter according to the Euro regulation, only for the case of NOx.

Table 23.
Emissions are obtained at idle speed.
According to Table 23, only by varying the injection parameters the engine without a catalytic converter passed the idling phase. While using catalytic converters apart from the variation with the programmable ECU, it also passes and further reduces the exhaust values. At full load, the data are summarised in Table 24, and as in Table 23, for the range of NOx the Euro limits are considered according to the catalytic generation.

Table 24.
Emissions are obtained at full load.
According to Table 24, all cases pass the Technical Inspection except in the system without a catalytic converter with the load above the established O2 limit. This means that the mixture is lean. Similarly, the NOx are well below the limit of the standards proposed by the Euro regulations of the respective generations. CO2 is not yet regulated by either the Ecuadorian or the Euro standards.
5. Discussion
Once the tests are completed, the results obtained are analysed with the standard injection parameters in Table 25. The average of each gas emitted in 15 s is calculated for comparison.

Table 25.
Study results compared with the standard parameters.
The disparity of the results is remarkable; the data obtained with the standard injection parameters significantly exceeds the values achieved with various configurations including the Box Inject ECU and catalytic converters, resulting in substantial reductions in emission percentages. A summary of the emission reduction percentages is presented in Table 26, which underlines the importance of dynamic implementation in emission control. This involves adjusting operating methods and modifying the injection plan to achieve significant improvements in environmental performance.

Table 26.
Percentage reduction obtained by varying injection parameters and catalyst use.
Excellent performance was achieved with an injection map designed for Euro 5 catalytic converters, achieving a high reduction ratio, and maintaining adequate engine performance.
Under ideal thermal conditions, the gaseous products are N2, CO2, H2O and O2. However, combustion is not ideal and produces harmful gases [52].
HCs result from incomplete combustion, which means that the fuel has not burned completely. CO is formed in very rich mixtures when there are not enough O2 molecules to form CO2. The O2 content is an indicator of the stoichiometry of the air-fuel mixture, with low O2 values being optimal. However, a very high value means that the mixture is too poor. A good target is to keep O2 and CO close to zero, different values indicate a very rich or lean mixture. As with O2, CO2 also indicates combustion efficiency, because the higher it is, the closer the air-fuel mixture is to the ideal value. NOx is formed by combining N2 and O2 due to the combustion temperature and is also higher when the mixture is slightly lean.
The introduction of the Euro 5 scheme and the catalytic converter significantly improved emission parameters. HC levels fell from 246 ppm to 10 ppm, an impressive 95.93% reduction. Likewise, CO is significantly reduced from 0.39% to only 0.03%, an impressive reduction of 92.31%. At the same time, the basic O2 content was significantly reduced from 1.47% to 0.81%, achieving an impressive reduction of 44.90%. While admitting that there is room for improvement, the reduction in O2 levels indicates a poor mixture, indicating that the injection parameters can be modified. However, a thorough analysis confirmed that the best configuration is in the Euro 5 scheme and the catalytic converter. This configuration is not under Ecuadorian laws, but it maintains the integrity of the machine.
6. Conclusions
- In all the variations of the injection pulse parameters and ignition timing, it was considered that the engine must have sufficient power and a fast accelerator pedal reaction. This is to resemble the real conditions of a vehicle, not just a static engine. Therefore, it is not desirable to have a very lean mixture, with more air than fuel, because, although it reduces consumption, the engine power would be reduced, and the emission values would be over the limit, due to incomplete combustion. A very rich mixture is not good either, because this can lead to increased CO and HC values, as well as damage to the exhaust system components due to fuel residues.
- By reprogramming the Electronic Control Unit (ECU) and taking external factors into account, a significant improvement in efficiency was observed. In addition to the use of catalytic converters, this study focused on optimising combustion to reduce exhaust emissions. Specifically, the best result was obtained using a Euro 5 catalyst, with an injection pulse of 1.348 ms to 1.456 ms at idle, efficiency was achieved with emissions of 0.3% CO, 10 ppm HC and 0.81% O2. Similarly, using an injection pulse between 2.376 ms and 3.00 ms at 2500 min−1 resulted in even lower values: 0.02% CO2 ppm HC and 2.75% O2. Although the O2 level is within acceptable limits at full load, this value indicates lean mixing, which could be improved by adjusting the lambda coefficient closer to 1.
- The applicability of this research is important because of the significant impact of this technology on the local market. The results show the possibility of upgrading vehicles equipped with common MPFI technology in the Ecuadorian vehicle fleet. This modernisation aims to comply with current regulations without reducing the efficiency of these vehicles and at the same time helping to reduce harmful gases.
7. Recommendations
- When installing a catalytic converter, it is recommended to place it close enough to the exhaust manifold to achieve a good operating temperature of above 300 °C. This proximity allows the ceramics to enter the working phase quickly. If it is installed too far away from the exhaust manifold, there is a risk that the temperature required for efficient operation is not reached. This condition affects their ability to oxidise or reduce exhaust gases, resulting in a malfunction of the vehicle’s emission control system.
- Before starting ECU programming, it is essential to select the correct initial settings. This step is extremely important because incorrect settings can cause damage. Not only is the engine likely not to start or run properly, but it can also lead to the deterioration of the engine’s internal components. These conditions would not only require a lot of maintenance but can further degrade engine performance, affecting durability and efficiency.
- It is recommended to analyse the lambda coefficient of each ignition and injection map along with the catalytic converter. This is done to obtain a near-ideal air-fuel mixture for optimal combustion, which has a direct impact on emission reduction.
Author Contributions
Methodology, C.F.-H., J.Z.-R. and E.V.R.-R.; Software, C.F.-H.; Validation, J.Z.-R. and E.V.R.-R.; Formal analysis, J.Z.-R.; Data curation, C.F.-H. and J.Z.-R.; Writing—original draft, C.F.-H. and J.Z.-R.; Writing—review & editing, E.V.R.-R.; Visualization, E.V.R.-R.; Supervision, E.V.R.-R. All authors have read and agreed to the published version of the manuscript.
Funding
This research received no external funding.
Data Availability Statement
Data are contained within the article.
Conflicts of Interest
The authors declare no conflicts of interest.
References
- Van Den Berg, E. #COP21 The Last Train? Decarbonisation of the Global Economy. Available online: https://www.fundacionaquae.org/cop21-el-ultimo-tren-descarbonizacion-de-la-economia-global/ (accessed on 2 December 2023).
- United Nations Framwork Convention on Climate Change; UNFCCC: Bonn, Germany, 2016.
- Iniciativa Climática de México Heading towards COP26. Newsletter #9 2021, 9, 1–4.
- Kumar, M.; Shen, T. In-Cylinder Pressure-Based Air-Fuel Ratio Control for Lean Burn Operation Mode of SI Engines. Energy 2017, 120, 106–116. [Google Scholar] [CrossRef]
- You-cheng, S.; Min, X.; Yong, G.; Yi, C.; Lei, S.; Kang-yao, D. Effects of Injection Pressure, Exhaust Gas Recirculation and Intake Pressure on the Cycle-to-Cycle Variations of HCCI Combustion. J. Energy Inst. 2016, 89, 293–301. [Google Scholar] [CrossRef]
- Melaika, M.; Herbillon, G.; Dahlander, P. DI-CNG Injector Nozzle Design Influence on SI Engine Standard Emissions and Particulates at Different Injection Timings. Fuel 2022, 317, 123386. [Google Scholar] [CrossRef]
- Ram, S.; Yadav, R.K.; Singh, I. Combustion and Exhaust Emission Improvement in a 3-Cylinder Mpfi Engine Through Downsizing. U. Porto J. Eng. 2023, 9, 194–208. [Google Scholar] [CrossRef]
- Ling, X.; Wu, C.; Liu, Y.; Lu, S. Ignition Timing Control Strategy Based on Open ECU Design. J. Meas. Eng. 2016, 4, 82–86. [Google Scholar]
- Costlow, T. Engine Developers Increase Efforts to Decrease Fuel Usage. Available online: https://www.mobilityengineeringtech.com/component/content/article/tohe/pub/features/articles/40881 (accessed on 2 December 2023).
- n Pla, B.; Bares, P.; Jimenez, I.; Guardiola, C.; Zhang, Y.; Shen, T. A Fuzzy Logic Map-Based Knock Control for Spark Ignition Engines. Appl. Energy 2020, 280, 116036. [Google Scholar] [CrossRef]
- Balazadeh Meresht, N.; Moghadasi, S.; Munshi, S.; Shahbakhti, M.; McTaggart-Cowan, G. Advances in Vehicle and Powertrain Efficiency of Long-Haul Commercial Vehicles: A Review. Energies 2023, 16, 6809. [Google Scholar] [CrossRef]
- Qadiri, U. Computational Investigations on MPFI Engine Fueled Blended Ethanol, H2O Based Micro-Emulsions, and Conventional Gasoline. Environ. Adv. 2023, 12, 100367. [Google Scholar] [CrossRef]
- Savickas, D.; Steponavičius, D.; Kemzūraitė, A. A Novel Approach for Analysing Environmental Sustainability Aspects of Combine Harvester through Telematics Data. Part I: Evaluation and Analysis of Field Tests. Precis. Agric. 2024, 25, 100–118. [Google Scholar] [CrossRef]
- Sandovalin, J.; Correa, E.; Guasumba, J.; Calero, D. Electronic Injection Systems and Gas Control. Polo Del Conocimiento. 2022. Available online: https://polodelconocimiento.com/ojs/index.php/es/article/view/3828/html (accessed on 11 December 2023).
- EC Editors What Is Car Reprogramming and What Is It For? Available online: https://elcomercio.pe/ruedas-tuercas/automotriz/que-es-y-para-que-sirve-la-reprogramacion-de-autos-peru-mexico-espana-estados-unidos-noticia/?ref=ecr#:~:text=En%20t%C3%A9rminos%20generales%2C%20una%20reprogramaci%C3%B3n,comportamiento%20y%20rendimiento%20del%20veh% (accessed on 21 November 2023).
- Díaz, M.J.; Sopa Bravo, L.G.; Erazo, G.; Salazar, F. Electronic Reprogramming of the Corsa Evolution 1.4 Vehicle, to Raise the Characteristic Parameters of the Internal Combustion Engine. Bachelor’s Thesis, Universidad de las Fuerzas Armadas ESPE, Latacunga, Ecuador, 2013. [Google Scholar]
- Veloz, D.; Guamán, C. Implementation of a Haltech Electronic System to Economise Fuel Consumption in the Chevrolet Corsa OBD II Engine of the Automotive Engineering School. Bachelor’s Thesis, Escuela Superior Politécnica de Chimborazo, Riobamba, Ecuador, 2014. [Google Scholar]
- Santillán, P. Analysis of Programmable ECU Mapping to Optimise the Performance and Emissions of a Light-Duty Car under the Riobamba Driving Cycle. Bachelor’s Thesis, Escuela Superior Politécnica de Chimborazo, Riobamba, Ecuador, 2022. [Google Scholar]
- Aguilar Jaramillo, C.D.; Gallo Quispe, E.M.; Calero Torres, D.A.; Naranjo Guerra, J.I. Performance Analysis of Electronic Fuel Injection Sensors to Control Fuel Consumption. Dominio Las Cienc. 2022, 8, 451–769. [Google Scholar] [CrossRef]
- Molina, B. Analysis of an Otto Cycle Engine under Different Atmospheric Factors by a Comparative Study of Identification Parameters to Obtain the Energy Efficiency. Bachelor’s Thesis, Universidad Politécnica Salesiana-Sede Cuenca, Cuenca, Ecuador, 2020. [Google Scholar]
- Gadvay-Lara, C.J.; Monar-Arguello, C.M. Use of Automotive Software to Reduce Pollutant Emissions from an Electronic Injection Vehicle by Modifying the Flash Memory without Affecting Its Torque and Power in the City of Riobamba. Bachelor’s Thesis, Escuela Superior Politécnica del Chimborazo, Riobamba, Ecuador, 2021. [Google Scholar]
- Montúfar Paz, P.A.; Manya Ocaña, B.; Santillán Yaulema, J.; Razo Cifuentes, A. Study and Optimisation of the Effect of ECU Mapping on the Performance and Emissions Generated by a Light-Duty Vehicle Evaluated in the Riobamba Driving Cycle. Polo Del Conoc. Sci.-Prof. J. 2022, 7, 1698–1712. [Google Scholar]
- Coba, P.S.; Yánez, S.; Torres Balseca, D. Mapping Strategies of a Programmable Computer for the Reduction of Pollutant Emissions. Bachelor’s Thesis, Universidad Internacional del Ecuador, Quito, Ecuador, 2022. [Google Scholar]
- Cevallos, J. Analysis of the Ideal Mapping on a Programmable Computer within the Parameters of Ignition Advance and Injection on an N1 Vehicle Based on INNEN 2204 Standard. Bachelor’s Thesis, Universidad Internacional del Ecuador, Quito, Ecuador, 2022. [Google Scholar]
- Pumarica Llamatumbi, D.F.; Tonato Caiza, M.J. Research to Raise the Performance Parameters of the T18SED L4 DOHC 1.8L Internal Combustion Engine through Electronic Reprogramming by Parallel Connection of a Programmable ECU. Bachelor’s Thesis, Universidad de las Fuerzas Armadas, Latacunga, Ecuador, 2018. [Google Scholar]
- Dey, S.; Mehta, N.S. Automobile Pollution Control Using Catalysis. Resour. Environ. Sustain. 2020, 2, 100006. [Google Scholar] [CrossRef]
- Albaladejo Hernández, D.; García Vera, F.; Hernández Grau, J. Influence of Catalyst, Exhaust Systems and ECU Configurations on the Motorcycle Pollutant Emissions. Results Eng. 2020, 5, 100080. [Google Scholar] [CrossRef]
- Karthikeyan, S.; Suresh, A.L.; Sathyanadan, M.; Krishnan, S.; Kumar Srisailam, S.; Tang, W. Performance of BS-VI Catalyst and Influence of Deactivation Conditions on Emission Durability for Commercial Vehicle Applications. Mater. Today Proc. 2022, 68, 2631–2639. [Google Scholar] [CrossRef]
- Gasser, I.; Rybicki, M.; Wollner, W. Optimal Control of the Temperature in a Catalytic Converter. Comput. Math. Appl. 2014, 67, 1521–1544. [Google Scholar] [CrossRef]
- Brinklow, G.; Herreros, J.M.; Rezaei, S.Z.; Omid, D.; Athanasios, T.; Millington, P.; Kolpin, A. Impact of Cylinder Deactivation Strategies on Three-Way Catalyst Performance in High Efficiency Low Emissions Engines. Chem. Eng. J. Adv. 2023, 14, 100481. [Google Scholar] [CrossRef]
- Rood, S.; Eslava, S.; Manigrasso, A.; Bannister, C. Recent Advances in Gasoline Three-Way Catalyst Formulation: A Review. Proc. Inst. Mech. Eng. Part D J. Automob. Eng. 2020, 234, 936–949. [Google Scholar] [CrossRef]
- Pandoo Instalation Manual E-TPS Module Control. Available online: https://update.pandoo.com.br/Manual_ETPS_Control-v0.03.pdf (accessed on 11 December 2023).
- Pandoo Instalation Manual PowerSpark. Available online: https://update.pandoo.com.br/Manual_Pandoo_Power_SPARK.pdf (accessed on 11 December 2023).
- Pandoo Instalation Manual BoxInject. Loja Pandoo. Available online: https://update.pandoo.com.br/Manual_Pandoo_Box_Inject_v0.60.pdf (accessed on 11 December 2023).
- AEADE Sales Bulletin. Available online: https://www.aeade.net/wp-content/uploads/2023/08/BOLETIN-VENTAS_PRENSA-AGOSTO_2023.pdf (accessed on 11 December 2023).
- Ingeniería y Mecánica Automotriz What Is the TPS Sensor and How Does It Work? Available online: https://www.ingenieriaymecanicaautomotriz.com/category/mecanica/sensores-automotrices/tps-cuerpo-de-aceleracion/ (accessed on 12 December 2023).
- Medina, A. Automotive Sensors; Institutional Security Seminar CCC-INAOE: Puebla, Mexico, November 2018. [Google Scholar] [CrossRef]
- MLC Energía Do You Know What Gasoline Is Made Of? Available online: https://mlcenergia.com/de-que-esta-hecha-la-gasolina/ (accessed on 13 December 2023).
- Boluda, C.J.; Macías Alonso, M.; González Marrero, J. The Chemical Complexity of Automotive Fuels. Ing. Y Apl. 2019, 2, 51–79. [Google Scholar] [CrossRef]
- Rojas-Reinoso, V.; Alvarez-Loor, J.; Zambrano-Becerra, H.; Soriano, J.A. Comparative Study of Gasoline Fuel Mixture to Reduce Emissions in the Metropolitan District. Sustainability 2023, 15, 2921. [Google Scholar] [CrossRef]
- Leman, A.M.; Jajuli, A.; Feriyanto, D.; Rahman, F.; Zakaria, S. Advanced Catalytic Converter in Gasoline Enginer Emission Control: A Review. In MATEC Web of Conferences; EDP Sciences: Les Ulis, France, 2017. [Google Scholar] [CrossRef]
- Tuper S/A Catalyst Overheating: Check Other Components before Replacing the Catalytic Converter. Available online: https://www.tuper.com.br/es/noticias/calentamiento-del-catalizador-compruebe-otros-componentes-antes-de-reemplazar-el-convertidor-catalitico/ (accessed on 17 December 2023).
- Globaltech Gas Analyser AGS-688. Available online: https://globaltech-car.com/producto/analizador-de-gases-brain-bee-modelo-ags-688/ (accessed on 22 December 2023).
- ISO3930; Instruments for Measuring Vehicle Exhaust Emissions Amendment 1. International Organization for Standardization: Switzerland, Geneva, 2004.
- Vehicle Technical Inspection. Vehicle Inspection Instructions; Metropolitan Transit Agency: Quito, Ecuador, 2016. [Google Scholar]
- Fotric Connecting the Digital Future Fotric 348A. Available online: https://www.fotric.com/product-page/fotric-348a (accessed on 8 December 2023).
- Muzika, L.; Tesař, J.; Švantner, M.; Skála, J.; Honnerová, P. Comparison of Methods for Emissivity Influence Suppression on Thermographic Data. Buildings 2022, 13, 69. [Google Scholar] [CrossRef]
- Tutunea, D.; Dumitru, I.; Oţăt, O.V.; Racila, L.; Geonea, I.D.; Rotea, C.C. Oxygen Sensor Testing for Automotive Applications. Appl. Mech. Mater. 2020, 896, 249–254. [Google Scholar] [CrossRef]
- Rojas Reinoso, E.V.; Romero Hidalgo, V.J.; Pancha Ramos, J.M. Analysis of the CO2, CO and Lambda Factor Emission Performance of a Vehicle with a Conventional Injection System with and without Catalytic Converter. Ingenius 2019, 23, 23–29. [Google Scholar] [CrossRef]
- United States Environmental Protection Agency Greenhouse Gas Emissions from a Typical Passenger Vehicle. Available online: https://www.epa.gov/greenvehicles/greenhouse-gas-emissions-typical-passenger-vehicle#:~:text=Most%20of%20the%20weight%20of,carbon%20dioxide%20(CO2) (accessed on 18 December 2023).
- The International Council on Clean Transportation Vehicle NOx Emissions the Basics. Available online: https://theicct.org/stack/vehicle-nox-emissions-the-basics/ (accessed on 14 February 2024).
- Rodrigo, J. Mecánica y Electricidad Nro 39. January 2009. Available online: http://www.centro-zaragoza.com:8080/web/sala_prensa/revista_tecnica/hemeroteca/articulos/R2_A4.pdf (accessed on 19 December 2023).
Disclaimer/Publisher’s Note: The statements, opinions and data contained in all publications are solely those of the individual author(s) and contributor(s) and not of MDPI and/or the editor(s). MDPI and/or the editor(s) disclaim responsibility for any injury to people or property resulting from any ideas, methods, instructions or products referred to in the content. |
© 2024 by the authors. Licensee MDPI, Basel, Switzerland. This article is an open access article distributed under the terms and conditions of the Creative Commons Attribution (CC BY) license (https://creativecommons.org/licenses/by/4.0/).