Abstract
Currently, the integration of distributed power supply into the power grid is steadily increasing. The grid’s carrying capacity serves as a crucial metric for evaluating the grid’s resilience following the widespread integration of distributed power supply. During typhoon conditions, if the power grid experiences line breakage and load loss faults, the grid’s framework is altered, rendering the conventional carrying capacity assessment method obsolete. This study introduces a method for assessing the risk of line carrying capacity and an index for line overload probability under typhoon conditions, integrating line and transformer capacity constraints to evaluate the grid’s carrying capacity risk. The probability of line failure is modeled during typhoon events, and a modified IEEE39 node example is employed to simulate a high-penetration grid in a typhoon scenario. Addressing the issue of inadequate intraday dispatch capability under insufficient carrying capacity, we propose a multi-timescale dispatch method and derive the optimal grid dispatch strategy using the viscous bacteria algorithm. The efficacy of the multi-timescale dispatch strategy in addressing the grid’s carrying capacity risk is validated through simulation, while the economic cost of mitigating the grid’s carrying capacity risk and the line overload probability is assessed across varying parameter values.
1. Introduction
In recent years, China’s coastal regions have experienced frequent and severe typhoon disasters, including “Moranti”, “Pigeon”, and “Mangosteen”, leading to extensive power grid equipment failures and resulting in substantial economic losses [1]. Concurrently, as China advances its “carbon peak, carbon neutral” energy strategy, the penetration of wind power in coastal areas has been steadily increasing. The operational characteristics of wind turbines during strong winds, such as full generation or shutdown, significantly diminish the carrying capacity of distributed power supply in power grids under typhoon conditions, exacerbating operational risks and intensifying the conflict between economic viability and grid resilience. This conflict between economic efficiency and grid resilience is increasingly pronounced. Therefore, it is crucial to analyze the impact of typhoons on the carrying capacity of power grids with high wind power penetration, optimize on-grid dispatching resources for typhoon defense scheduling, enhance grid resilience in extreme weather conditions, and mitigate property losses.
Current research on defense measures against extreme weather encompasses several key areas. Studies from the literature [2,3,4,5,6,7] have developed a transmission and substation equipment failure probability assessment model. This model is based on the mechanism analysis of disasters or utilizes data-driven artificial intelligence algorithms to address individual external disasters, such as lightning, hill fires, ice storms, typhoons, and heavy rainfall. Additionally, the literature [8,9,10] has focused on designing and implementing a power grid monitoring, warning, and security and stability defense system to handle various external disasters. Furthermore, the literature [11] provides a comprehensive overview of research related to information gathering for defense against external disasters, the risk assessment of power systems during external disasters, and methods for enhancing the security and stability of power systems in response to external disasters.
Given the volatility and uncertainty of wind power generation, the power grid must prioritize operational stability. Carrying capacity represents the maximum capacity of distributed power sources that the power grid can accommodate while ensuring stable operation [12]. This capacity is defined as the maximum installed capacity of renewable energy, the maximum power generation, or the maximum power generation percentage of renewable energy that the power system can integrate while adhering to constraints related to reliable electricity supply, safe and stable operation, and economic considerations. These constraints are based on specific renewable energy resources, grid-connected capacity, conventional power supply installation, and load levels [13]. During extreme weather events such as typhoons, the assessment method for carrying capacity undergoes modification. Current research on carrying capacity assessment methods primarily focuses on line constraints, such as line and transformer capacity, and node constraints, including voltage deviation, voltage fluctuation, and short circuit capacity [14].
During typhoons, the grid carrying capacity may exceed the scheduling capacity, necessitating real-time intraday scheduling and the formulation of advance day-ahead scheduling strategies to anticipate and mitigate the typhoon’s impact on grid carrying capacity. To address the fluctuations in wind and light and their impact on grid planning, a two-stage optimal scheduling model has been developed for combined renewable energy and energy storage systems to enhance wind and light consumption capacity [15]. However, the operational efficiency of pumped storage units is hindered by their current mode of operation, which involves pumping out timed segments according to the power grid’s unified scheduling instructions [16]. To enhance operational efficiency and flexibility, scholars have begun to explore scheduling sequences for pumped storage and different units, as well as the alignment with varying precision. Studies from the literature [17] have proposed a two-layer scheduling model to address the peak shifting sequence problem for pumped storage power stations and thermal power units, improving the utilization efficiency of pumped storage units while ensuring economic benefits. Additionally, the literature [18,19] has established a multi-timescale scheduling model to increase the consumption of a high proportion of renewable energy and enhance the operating efficiency of pumped storage units.
This study aims to establish a typhoon transit model and a line failure model. It will propose a carrying capacity assessment method by defining carrying capacity, analyzing the carrying capacity risk of each line and each index in the event of grid disconnection during a typhoon transit, and formulating a risky scheduling method for the grid to address insufficient carrying capacity during typhoons through a multi-scenario and multi-method scheduling mode. Additionally, it will consider the carrying capacity risk and the operating cost of the grid, and verify the effectiveness of the scheduling scheme to manage carrying capacity risk through simulation. The study will verify the effectiveness of the scheduling scheme to manage carrying capacity risk through simulation. Furthermore, the study will investigate the grid carrying capacity risk and the cost of grid scheduling under different value cases, considering that the overload limit indicator in the evaluation index is determined by the scheduler supervisor in real-world situations.
The innovation of this study is to propose the carrying capacity risk index and transformer overload probability in order to quantify the various faults of the grid under typhoon weather without two indexes in order to assess the robustness of the grid and combine these two indexes to optimize and formulate the scheduling strategy, and to study the relationship between them and the cost of the carrying capacity risk, in order to select the most appropriate indexes to formulate the optimization strategy. In the current research on grid carrying capacity, most studies focus on the normal operation of regional power grids. They are frequently analyzed with high-wind-power generation penetration, while few have delved into grid carrying capacity analysis and associated risks during extreme weather conditions. The risk indicator for carrying capacity in this study not only assesses the grid’s resilience against typhoon conditions but also evaluates the maximum renewable energy capacity accessible during typhoons. This metric offers valuable insights for future renewable energy planning within the grid. This study highlights both the grid’s robustness in typhoon response and the maximum renewable energy capacity during such events, providing critical insights for future renewable energy planning within the power grid.
2. Modeling of Power Grids under Typhoons
2.1. Typhoon Wind Field Modeling
To analyze the wind turbine output during a typhoon, it is necessary to calculate the typhoon’s path and its wind speed in order to obtain the wind speed at each node of the grid. This paper utilizes the improved Rankine vortex theory model to achieve this [20]:
The parameters used in the improved Rankine vortex theory model are as follows: represents the wind speed of the typhoon in the region; is the parameter for adjusting the wind speed distribution, set to a value of 0.5; denotes the length from the center of the typhoon; represents the maximum wind speed of the typhoon; and denotes the radius of the maximum wind speed of the typhoon.
The maximum radius of the typhoon can be calculated according to Nunm’s formula [21]:
where is the latitude of the typhoon; is the air pressure at the periphery of the typhoon, which is often taken as 1013.3 hPa; is the air pressure at the center of the typhoon; and is the speed of the typhoon’s movement.
In this paper, we defined the scenario where the current predicted normal wind speed exceeds the predicted wind speed of the typhoon as the normal wind field case, and conversely, when the predicted wind speed of the typhoon surpasses the normal wind speed, it was termed the typhoon case. The normal wind speed can be derived from historical area data and short-term wind speed prediction using the neural network method. Subsequently, the wind speed at Wind Turbine Generator (WTG) “” was determined as follows:
where vwi,t is the predicted wind speed of WTG i at the predicted moment t; vni,t is the normal wind speed of WTG i at the predicted moment t; and vhi,t is the typhoon wind speed of WTG i at the predicted moment t.
where vin, vmax, vout are the cut-in wind speed, rated wind speed and cut-out wind speed of the WTGs, respectively; kp,i is the output coefficient of WTG i; and PWi,max is the rated output power of WTG i.
To the common 1.5 MW doubly fed asynchronous wind turbine, for example, its use of frequency converter wind turbine group rotor speed needs to be maintained at 0.69 (standard value) or more; the single machine incremental power rating does not exceed 0.1 (standard value). And for the power below 0.75 (the youngest value) of the wind turbine, its rotor speed and unit power have the following relationship [22]:
where ωref is the rotor speed of the WTGs and PW is the output of the WTGs.
Therefore, it was defined that during the forecast period, for the WTGs whose forecast output meets , the requirements were dispatchable, while the other WTGs were non-dispatchable and run at normal output without dispatching. Normally, for a 1.5 MW doubly fed asynchronous wind turbine, vin = 3 m/s, vmax= 12 m/s, vou = 25 m/s [23].
2.2. PDR Response Modeling
Price-based Demand Response (PDR) can effectively alter customers’ electricity consumption patterns by establishing rational day-ahead and real-time tariffs grounded in consumer psychology principles. Typically, a price-based demand elasticity matrix is employed to illustrate the impact of the rate of change in electricity price on the rate of change in load [24]:
where is the total scheduling time, which takes the value of 24; is the rate of change in load at moment t; is the rate of change in demand at moment t; and is the price-type demand elasticity matrix, whose main diagonal is the auto-elasticity coefficient, and whose sub-diagonal is the mutual elasticity coefficient; the amount of the load response after the PDR is
where is the amount of load response at moment t. The load after PDR becomes
3. Modeling of Grid Faults and Renewable Energy Real-Time Carrying Capacity under Typhoon Conditions
3.1. Grid Failure under Typhoon Conditions
- (1)
- Worst-case scenario modeling
The worst N-K faults were searched for using the classical DAD model [25] based on robust optimization without considering additional source load resilience enhancement measures, as shown in the following equation:
where represents the generator output at time t. signifies the transmission power of line at time t. denotes the load shedding at node at time t. , refer to the feasible decision-making domains before and during the disaster, encompassing line current constraints, generator output constraints, load shedding constraints, and other operational constraints. represents the objective function related to the cost of power generation and load shedding. stands for the fault state variable of component. indicates normal state, indicates a faulty state. represents the fault state of the component. denotes the constraint set’s total number of components. represents the upper limit of the actual number of failed components. This model can calculate the most severe N-K fault scenarios, up to , in descending order of load shedding.
- (2)
- Most Probable Fault Modeling
The most probable N-K faults are referred to in [26], which are combined into N2 fault scenarios according to the N-K requirement, which are combined into N2 fault scenarios with failure rates ranging from large to small.
- (3)
- Chain Fault Modeling
The creation of the chained fault set involved a two-step process. Initially, the initial fault line set, comprising interlocking faults, was chosen from the N3 circuits that require particular attention in engineering practice or have a high likelihood of failure. Subsequently, one initial fault line was isolated, and the interlocking N-K fault propagation links were computed using the following equation:
where , are the rated and maximum transmission capacity of the line; , are the line fault rate before and after the chain fault. After the initial line failure, the line chain failure is caused by heavy load or even overload due to current transfer until the N-K chain failure is reached.
- (4)
- Construct a multi-type fault uncertainty set.
The typhoon and the aging state of components cannot be predicted accurately, which leads to the deviation between the theoretical and actual failure rates of the line, and thus the actual probability of each of the aforementioned failure scenarios has uncertainty, which is portrayed by adopting the following equation:
where is the uncertainty set of the probability distribution of multiple types of faults, the mathematical nature of which is a fuzzy set that characterizes the probability distribution of faults; is the actual probability of the nth fault scenario ; is the relative theoretical probability of the nth fault scenario after normalizing the probabilities of the individual fault scenarios.
The utilization of relative values, as opposed to absolute values, is based on mathematical and physical considerations. Mathematically, this approach ensures that the sum of the probability distributions for all failure scenarios equals 1. Physically, it is assumed in this paper that the set already encompasses all the failure scenarios, requiring resilience enhancement measures. The value represents the total deviation between the probability distributions of actual and theoretical failure scenarios. This deviation holds mathematical significance as it denotes the distance between the two probability distributions, which can be calculated using empirical formulas when dealing with a substantial amount of sample data of probability distributions in instances where data on HILP (high-impact low probability) event scenarios.
Considering that the actual probability of failure scenarios should fluctuate in a limited range of theoretical probabilities, , were introduced to limit the range of fluctuations; , , were all selected to adjust the degree of model conservatism; is the total number of the three types of failure scenarios described previously . In essence, the probability distribution uncertainty of the three types of failure scenarios, namely, the most serious failure, the most probable failure, and the chain failure, was portrayed by using the 1-parameter. The absolute value expression of the set, , represented by , , was transformed as follows for subsequent model solving.
3.2. Real-Time Carrying Capacity Assessment and Risk Modeling of Renewable Energy Sources under Typhoon Disasters
The increasing penetration of renewable energy sources in the power grid has raised the significance of the grid’s capacity to accommodate these sources. This capacity serves as a critical indicator for assessing the stability of the power grid. Given specific conditions related to renewable energy resources, grid-connected capacity, installed conventional power supply, and load levels, the power system must determine the maximum capacity it can accept for renewable energy installation, maximum power generation, or the maximum power generation as a percentage, while ensuring reliable power supply, safe and stable operation, and economic feasibility.
Its bearing capacity expression is
where is the load rate, is the peaking rate of conventional units, is the upper standby rate, and is the power of the renewable energy unit at the moment of . From the above, it can be seen that the carrying capacity is a time-varying value.
The grid’s carrying capacity under typhoon conditions differs from that addressed in the carrying capacity definition equation. This is due to the sudden full load of wind turbines and the loss of load resulting from downed poles and towers during a typhoon, leading to a sudden drop in the carrying capacity. To enhance the assessment of the grid’s condition during typhoon events, this paper introduces a risk indicator for grid branch carrying capacity :
where is the power of line at the moment of failure and loss of load; is the load difference of the line at the moment of ; is the power of the distributed power supply of branch at the moment of .
In assessing the load carrying capacity, it is essential to consider not only the load out balance constraints but also the risk of inadequate line transformer capacity. In scenarios involving load loss, the insufficient capacity of branch transformers may be the initial issue. This paper introduces the line overload probability indicator to characterize the likelihood of transformer overloads occurring on lines with the most severe load carrying capacity deficiencies in the grid. This indicator effectively reflects the lower limit probability of the grid’s stability. The formula for its calculation is as follows:
where , are the transformer capacity of line , transformer load factor; is the power factor of line ; and are the maximum capacity and maximum load of line .
Its overall grid carrying capacity risk indicator is calculated as
where is the weight function and the larger value of ; indicates that the higher the risk of grid carrying capacity at this moment, the more difficult the scheduling.
4. Dispatch Strategy for Renewable Energy Carrying Capacity Enhancement in Typhoon Weather
4.1. Scheduling Strategy for Day-Ahead Intra-Day Capacity Enhancement
The response times of dispatch resources within a multi-source grid span varies from seconds to days, reflecting significant variability. For instance, considering DR resources, they can be categorized as price-based demand response (PDR) and incentive-based demand response (IDR) [26]. The response speed of PDR and IDR varies from seconds to days based on their respective response equipment [27].
Currently, capacity enhancement primarily relies on real-time scheduling, which underutilizes the power grid’s scheduling potential. To address this, in this paper, we propose a scheduling strategy that incorporates intraday carrying capacity enhancement prior to the day. The day-ahead scheduling strategy framework, illustrated in Figure 1, involved analyzing the probability of grid line failures based on typhoon predictions from the meteorological agency. Subsequently, a risk index was computed, and a scheduling model was established, with the regional grid’s carrying capacity risk and the lowest total operating cost as the objective function. Solving this model provided the start–stop plan and output value for each unit type, PDR, and day-ahead IDR response. The day-ahead scheduling operated on a 1 h time scale, developed 24 h in advance.
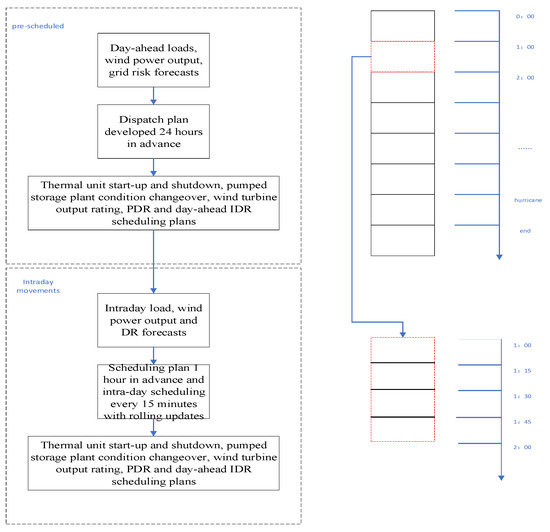
Figure 1.
Multi-time scale prevention control framework.
The day-ahead intra-day scheduling strategy in this study commenced by forecasting grid load, wind power generation, and grid fault risk, enabling the formulation of a scheduling plan 24 h in advance. This strategy was executed through adjustments in the operational parameters of thermal power units and pumped storage plants, as well as through wind turbine output planning and PDR response.
4.2. Scheduling Model for Day-Ahead Capacity Increase
4.2.1. Modeling Objective
The objective of defensive scheduling is to minimize the sum of the total system operating cost and the grid carrying capacity risk cost. In this paper, the line overload indicator was transformed into the grid carrying capacity risk cost and integrated into the grid carrying capacity cost. The objective function, denoted as f1, is:
- (1)
- Thermal power unit operating costs:
- (2)
- Wind turbine operating costs
- (3)
- Energy storage operating costs
- (4)
- Pumping operating costs
- (5)
- DR Response Costs
- (6)
- Cost of Carrying Capacity Risk
4.2.2. Restrictive Condition
- (1)
- Power balance constraints
- (2)
- Grid current constraints:
- (3)
- Thermal power unit constraints
Thermal unit output constraints:
where is the switching status of the thermal unit; is the minimum technical output of thermal unit ; and is the maximum technical output of thermal unit .
Thermal unit creep constraints:
where and are the upward and downward climb rates of unit , respectively.
- (4)
- Wind turbine constraints
- (5)
- Energy storage facility constraints
For batteries, too high charging and discharging power will also significantly affect the cycle life; therefore, the charging and discharging power , of the storage plant needs to satisfy the following constraints:
where , denote the maximum charging and discharging power allowed by the energy storage facility at moment , respectively.
- (6)
- Pumped storage unit constraints
Unit output constraints:
where , are the upper and lower limits of the power generation of the storage unit; , are the upper and lower limits of the pumping power of the storage unit.
Single operating condition constraints for pumped storage units:
where the sum of , is less than or equal to 1, indicating that unit can only be in power generation or pumping condition at the same moment; , are Boolean variables characterizing the power generation and pumping conditions of the pumped-storage power station, taking 1 as yes and 0 as no, which similarly indicates that the working condition of the power station is unique at the same moment.
Power station reservoir levels and their movement constraints:
where is the water level in the upper reservoir of the power station at the moment of ; , are the upper and lower limits of the water level in the upper reservoir of the power station; the water level in the upper reservoir of the power station at the initial and final moments of the scheduling cycle, respectively, and the two are equal on behalf of the balance of pumping and generating water within the scheduling cycle; is the conversion coefficient of the water and electricity when the unit is pumping; and is the conversion coefficient of the water and electricity when the unit is generating electricity. The upper reservoir capacity constraint also represents the lower reservoir constraint.
- (7)
- DR resource response constraints
PDR response volume constraints:
where, ΔPPDR,t is the amount of PDR load change at moment t; λPDR is the PDR response ratio, which responds to the upper limit of the amount of adjustment of the customer’s electricity consumption plan. is the load of node at moment .
IDR response constraints a few days ago:
where is the maximum regulation of the IDR at moment t before the day; RIDRA is the response rate of the IDR before the day.
4.3. Intraday Carrying Capacity Enhancement Scheduling Strategy Model
The objective function of the Intraday Carrying Capacity Enhancement Dispatch Strategy model is also to minimize the sum of the total system operating cost and the grid carrying capacity risk cost. Since the day-ahead scheduling had already determined the operating states and conditions of the units, the operating cost excluded start-stop and condition changeover costs, and the DR response cost contained only the Intraday IDR response cost; the objective function f2 is
where kIDRA is the intraday DR response cost coefficient; ΔPPDR,t is the amount of intraday DR load response at moment t.
The system constraints, thermal and wind turbine constraints of the intraday defensive dispatch model are the same as those of the day-ahead defensive dispatch model, and the intraday DR response constraints are similar to those of the day-ahead DR response constraints, which are not repeated in this paper.
5. Model Solution
The above multi-carrying capacity enhancement scheduling model has a nonlinear problem (i.e., the square of the thermal unit output , the square of the node voltage ), and there are many constraints, the computational volume is large, and it is difficult to use conventional analytical algorithms to solve it, so this paper adopts the slime mold algorithm.
The sticky bacteria optimization algorithm is based on the predatory behavior of sticky bacteria from a food source to an encountered chemical signal concentration to make an oscillation contraction reaction; the higher the food concentration encountered, the faster its growth rate, and the formation of the vein network is thicker. When the food concentration is low, the slime mold will adjust the exploration direction, so as to approach other food sources by the shortest route. There are three main behaviors in the predation process of slime molds: approaching food, wrapping food and acquiring food [28].
5.1. Proximity to Food
The expressions for control parameter , parameter and weighting coefficient are, respectively [29]:
where is the current individual fitness value; is the best fitness value in all iterations; is the sequence of fitness values; is the best fitness value in the contemporary iteration; and is the best fitness value in the current iteration.
5.2. Wrapped Food and Access to Food
Slime molds find high concentrations of food sources and still isolate some individuals to continue searching for higher concentrations of food sources, so the location of the slime mold population was updated to [29]
where , are the upper and lower bounds of the search area; is a custom parameter, which was 0.03 in this paper. Control parameter oscillates randomly between and eventually converges to 0 as the number of iterations increases. The control parameter oscillates between .
5.3. Algorithmic Step
- (1)
- Assessing the fitness level and optimizing the parameter as the total cost of ownership;
- (2)
- Initializing the model and algorithm parameters and defining the maximum number of iterations;
- (3)
- Computing the fitness of each individual in the initial population;
- (4)
- Executing the convergence loop, updating the position of individuals, and preserving the subset of the population with the lowest fitness;
- (5)
- Evaluating whether the number of iterations has been reached or the iteration stop condition is met; if not, proceed to step (3);
- (6)
- If the conditions are met, presenting the optimal solution of the optimization problem.
The following is a comparison of the convergence of Mucilage Algorithm and Particle Swarm Algorithm in ZDT1 and ZDT2 functions [30], which shows that the Mucilage Algorithm is better than the Particle Swarm Algorithm in dealing with the nonlinear problems in terms of convergence [31].
The comparison of the convergence frontiers in the two graphs reveals that the slime mold algorithm closely approximates the true frontier surface more effectively than the particle swarm algorithm. This observation indicates that the slime mold algorithm excels in handling multivariate, multi-objective optimization calculations. The convergence comparison between ZDT1 and ZDT2 is shown in Figure 2 and Figure 3.
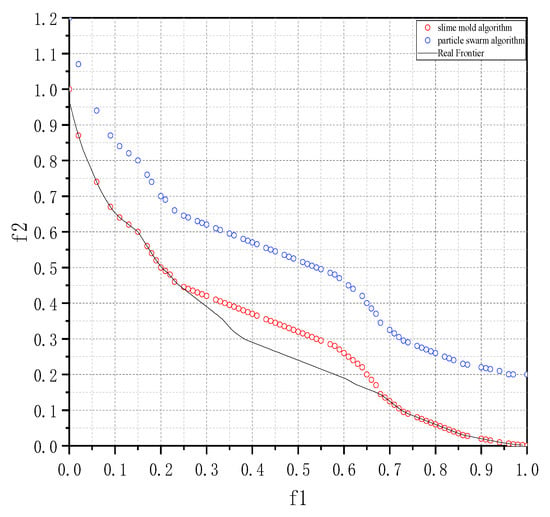
Figure 2.
Particle swarm algorithm vs. slime mold algorithm in ZDT1.
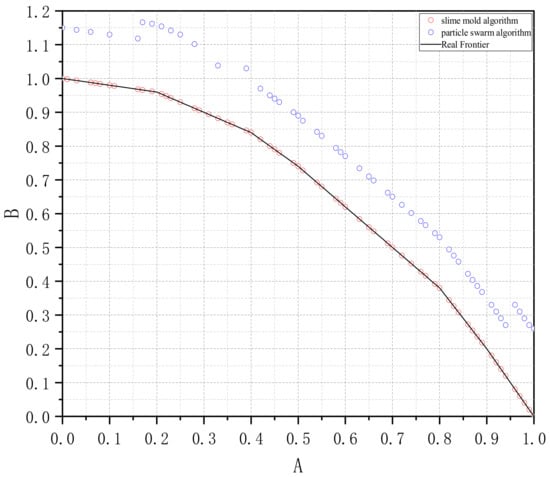
Figure 3.
Particle swarm algorithm vs. slime mold algorithm in ZDT2.
In this paper, the modified IEEE 39 node was used, which contained a total of nine conventional thermal power units, and 46 transmission lines. The power capacity of each line and the load node was the same as in the literature [32], and the thermal power unit at node 35 was replaced with a 650 MW pumped storage plant, whose unit parameters and the rest of the parameters are shown in Table 1. A 150 MW wind farm was connected to each of nodes 4, 5, 8, 11, 16, 20 and 29, accounting for 15% of the total installed capacity of the system, with an operating cost of $20/(MW·h); DR resources were deployed at each load node, assuming that the PDR response was not higher than 10% of its load, and that the day-ahead and intraday DR responses were not higher than 5% and 3%; the cost of lost loads was noted as $50/(MW·h). The arithmetic examples were analyzed based on the Python language platform and its trend simulation toolkit pandapower.

Table 1.
Thermal power unit parameters.
Typhoon data were analyzed using historical typhoon data for the arithmetic example (the grid and typhoon paths are shown in Figure 4 and Figure 5), noting that the typhoon formation time was t1, and the typhoon marker lines in the figure were the typhoon paths at the moments t50~t61. Meanwhile, since this paper used historical typhoon data as the typhoon prediction path, there was no error in the wind power output, which resulted in zero electrochemical storage output, so the electrochemical storage device output at the WTGs was regarded as a part of the WTGs’ adjustable metrics for scheduling the electrochemical energy storage resources.
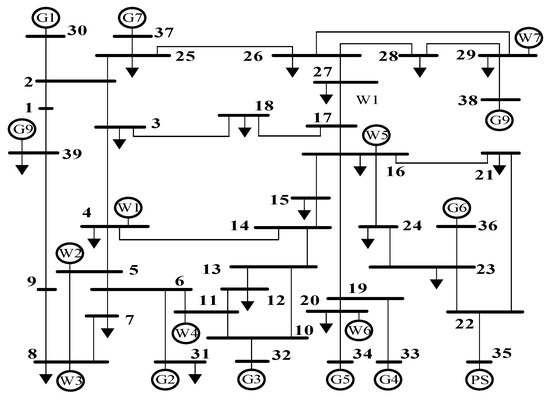
Figure 4.
Modified IEEE39 node system. The numbers in the figure represent node numbers.
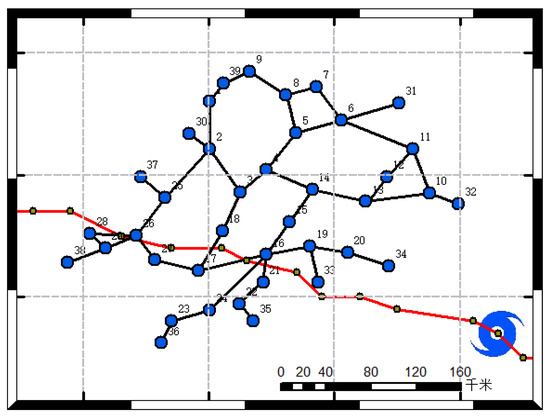
Figure 5.
Grid layout and the path of typhoon. The blue dots in the figure represent grid nodes. The Black solid line represent transmission lines. “千米” represent Kilometres. The red solid line represents the trajectory of the typhoon. Green dot represents the typhoon’s stopping point.
5.4. Risk Analysis of Power Grid Accidents
According to the typhoon prediction model proposed in this paper, the wind speed of each node of the grid at each time period was determined, and the node wind speed curve shown in Figure 6 illustrates that nodes 20 and 34, due to their proximity to the typhoon landfall point and earliest encounter with the typhoon, experienced the highest wind speeds compared to other nodes. Additionally, nodes 16 and 19 encountered a decrease in wind speed at moments 47 and 48, followed by an increase, as they were closer to the typhoon center and within its maximum wind circle, resulting in lower wind speeds at these nodes.
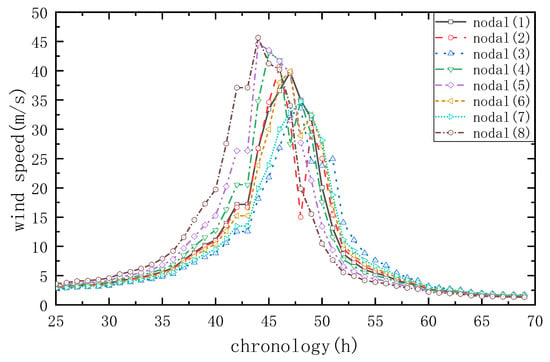
Figure 6.
Wind velocity distribution of nodes.
Analyzing the wind speed distribution at each node, it is evident that the typhoon’s impact on the grid carrying capacity risk was primarily between moments 40 and 50. The probability of line breakage during the typhoon was calculated and presented in Figure 7, indicating that line breaks were mainly distributed between moments 50 and 56. Notably, lines 32 and 33 were at a high risk of failure as they were the first to be hit by the typhoon. At moment 51, the probability of lines 32 and 33 failing was 1, while at moment 52, the probability of line 27 failing was also 1, indicating an imminent failure.
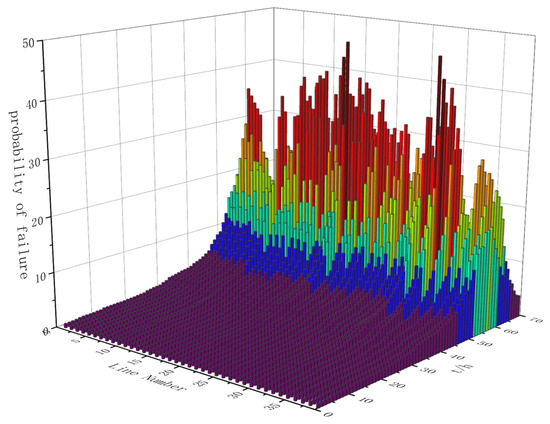
Figure 7.
Line failure probability.
Based on the line fault probability depicted in Figure 7, assuming no faults occur in the grid before moment 51 and utilizing the optimal current dispatch scheme that solely considers grid operation cost, the turbine operates at full load. At this specific moment, the partial branch load median, branch carrying capacity risk indicators, and branch overload probability indicators are illustrated in Figure 8.
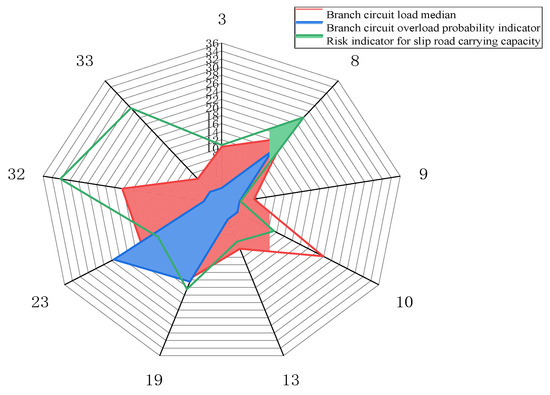
Figure 8.
Indicators after disconnection.
Figure 8 reveals that, at this juncture, lines 8, 19, and 23 exhibit a certain probability of overload failure, respectively, with their branch carrying capacity risk indicators at a high level. Furthermore, despite line 3 showing an overload fault probability indicator of 0, its branch carrying capacity risk indicator remains significantly high, suggesting a potential chain fault. Upon analyzing the grid network framework, it became apparent that lines 3, 9, 10, and 13 are neighboring lines or sub-lines of lines 8, 19, and 23, displaying a high correlation degree. This observation validates the comprehensive nature of the proposed branch carrying capacity risk index, which effectively reflects branch risk and the potential for chain failures in lines, thus offering a dependable assessment standard for dispatchers
5.5. Comparative Analysis of the Results of Different Scheduling Options
Comparison of different scheduling schemes: to assess the feasibility and effectiveness of the multi-timescale defense scheduling strategy proposed in this paper, four different scheduling methods were compared. Its specific strategies are shown in Table 2.

Table 2.
Different scheduling scenarios.
5.5.1. Analysis of Control Effects
Table 3 presents the risk indicators of the power grid under different scheduling schemes. It is evident that Scheme 1 exhibited significantly higher grid carrying capacity risk indicators compared to other schemes, with an 11.78% line overload probability. Schemes 2, 3, and 4, on the other hand, demonstrated a substantial reduction in grid risk indicators, with line overload probabilities of 7.51%, 2.73%, and 2.02%, respectively, representing reductions of 36.23%, 76.81%, and 82.87% compared to Scheme 1. Scheme 4, in particular, coordinated wind power, energy storage, pumped storage, and intraday IDR, resulting in higher dispatch accuracy and further reduction in grid carrying capacity risk.

Table 3.
Scheduling effect of each scheme.
5.5.2. Control Cost Analysis
To analyze the integrated control cost of the multi-timescale defensive scheduling strategy, the paper assumes that a line fails only when the probability of failure is 1; otherwise, it operates normally. The wind farm was considered damaged when the average wind speed exceeded 42 m/s within 30 min. The wind turbine output and scheduling results of each scheme during the time period t41 to t65 are shown in Figure 9 and Figure 10.
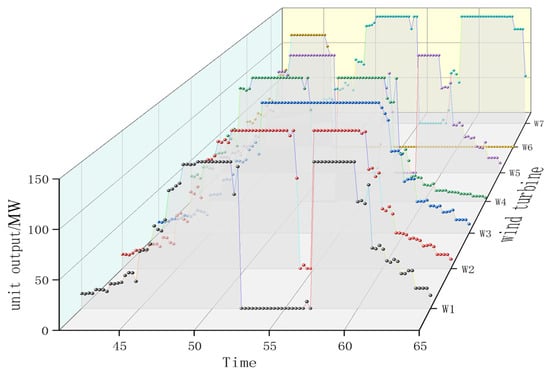
Figure 9.
Forecast output of wind turbines.
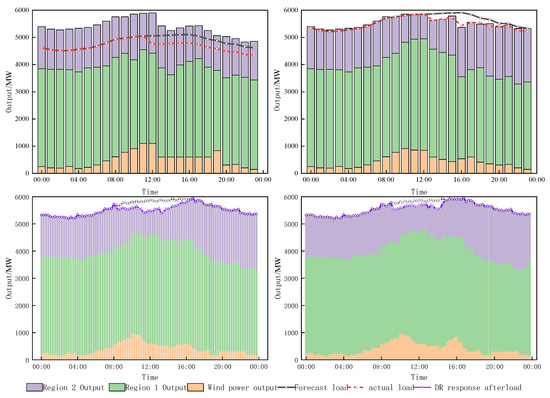
Figure 10.
Scheduling plans under different schemes.
Figure 9 illustrates that the wind farms maintained active output under safe operating conditions during the typhoon’s impact on the grid. At moment 52, the W6 unit sustained damage due to an average wind speed of 45.8 m/s, resulting in an unrecovered output in subsequent moments.
In Scenario 1, as depicted in Figure 10, the absence of wind farm output led to a reduced adjustable capacity within the grid. At moment 51, the failure of lines 32 and 33 caused the loss of grid thermal power units G4 and G5, further diminishing the adjustable capacity. Consequently, a total load cut of 283.82 MW occurred at this moment. Scenarios 2, 3, and 4 demonstrate that wind power units can provide active output under safe operating conditions. Additionally, wind turbine and electrochemical storage outputs accounted for 12.74%, 12.36%, and 11.56% of the total power generation within the respective moments. Notably, the wind farm output was effectively controlled during the typhoon.
The grid carrying capacity risk for different scenarios is shown in Figure 11.
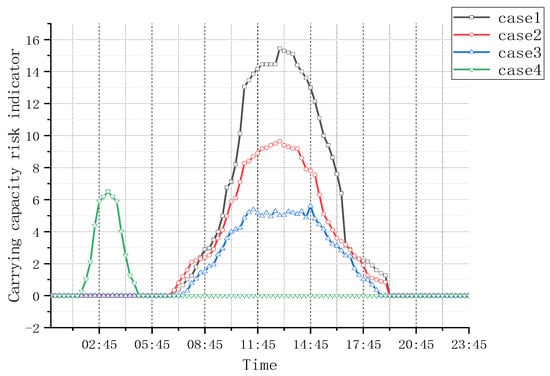
Figure 11.
Power grid risk index under different schemes.
In Scenario 1, based solely on the cost of grid operation and scheduling, the grid carrying capacity risk indicator peaked at 15.46 during the specified period. Scenario 2, in comparison, exhibited a decreased risk indicator of 9.65, marking a 37.58% reduction. Scenarios 3 and 4, by considering the cost of grid carrying capacity risk and wind farms in power scheduling, along with coordinated demand response (DR) resources, achieved reduced risk indicators of 6.52 and 5.61, respectively, marking reductions of 58.83% and 63.71%. This confirms the effectiveness of the proposed scheduling scheme in significantly improving the regional power grid’s carrying capacity during typhoon weather.
Table 4 presents the total cost of scheduling for different schemes. Scheme 1, due to its lack of consideration for wind farm output, incurred a higher cost, primarily attributed to a loss of load cost and increased grid carrying capacity risk. Scheme 3, relative to Scenarios 1 and 2, offered more dispatchable resources, leading to an increase in thermal power operation cost but also an enhancement in carrying capacity, resulting in an overall increased total cost. Compared to Scheme 3, Scenario 4, by incorporating intraday IDR resources and refining dispatch accuracy, achieved a 62.26% reduction in carrying capacity risk cost and a 1.89% decrease in total cost, confirming the efficacy of the proposed day-ahead intraday carrying capacity enhancement dispatch strategy in improving grid operation under typhoon conditions while ensuring economic performance.

Table 4.
Cost of different schemes.
5.6. Real Grid Case Studies
The paper took the typhoon of November 2021, which happened in a city in China, as a case study. A typhoon disaster as a case study, this ice disaster caused 16 × 66 kV lines and 250 × 10 kV lines, directly affecting 723,700 households normal electricity consumption. A part of the distribution network in this city was selected as a reference area. The topology is shown in Figure 12.
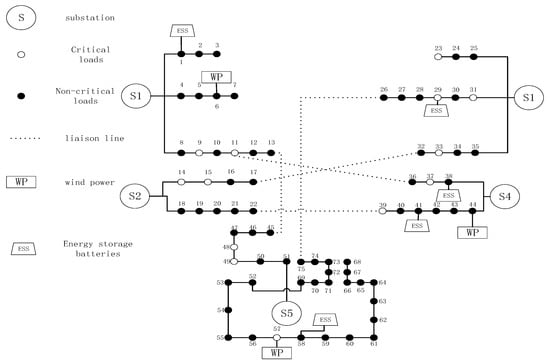
Figure 12.
Nodal wiring diagram of a regional power grid. The numbers in the figure represent node numbers.
The probability of failure for each line is plotted in Figure 13.
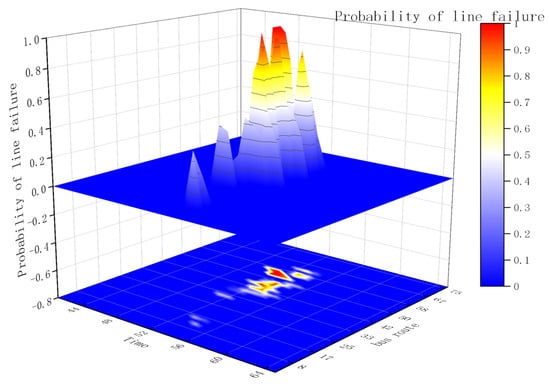
Figure 13.
Line fault probability chart.
At this point, a risk assessment of the power grid in the area was carried out based on the above indicators of risk to the grid carrying capacity and the probability of transformer overload. At this point in time, the average grid carrying capacity risk indicator was calculated to be 28.962 and the average transformer overload probability was 19.68 per cent.
Still, according to the scheduling optimization objective in this study, the scheduling optimization in this case was achieved by the viscous bacteria algorithm, and the wind power and energy storage output is shown in Figure 14 after the optimization solution.
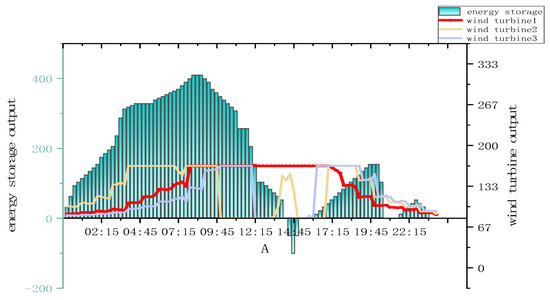
Figure 14.
Power and energy storage output.
The detailed comparison parameters of the two schemes are shown in Table 5.

Table 5.
Comparison of grid robustness before and after optimization.
From the comparison table, it can be seen that the optimization strategy can effectively reduce the risk of load carrying capacity and the probability of transformer overload, but due to the problem of disaster severity in the actual case, the effect of the robustness enhancement strategy in the actual case was not as good as that in the IEEE calculation example.
In this chapter, the study validates the effectiveness of the research model in both simulated scenarios and real-world power grid applications using the IEEE 39 standard calculations and analysis of a specific regional power grid. The comparison between the actual grid and the model demonstrates that the proposed strategy optimizes the regional grid’s capacity under typhoon conditions and enhances its resilience to risks. Specifically, the analysis of Figure 10 and Figure 14 reveals that a scarcity of Wind Turbine Generators (WTGs) in the regional grid leads to an excessive reliance on energy storage facilities for grid management. However, due to the limited capacity of these storage units, they are unable to provide adequate dispatch resources, thereby falling short in mitigating risks associated with grid capacity. Consequently, the strategy outlined in this study is best suited for power grids equipped with ample dispatch resources.
5.7. Analysis of Risk-Cost Parameters
It is important to note that the line transformer overload limit parameters discussed in this paper were derived from the subjective assessment of the dispatcher during past incidents. The selection of these parameters significantly influences the economic and risk mitigation aspects of enhancing load-bearing capacity scheduling. The analysis considers the total cost and risk associated with different parameter configurations by examining the range between the upper limit of transformer overload (5% to 15%) and the transformer overload probability indicator (1.5% to 3.5%). The results of the surface fitting, along with the scatter points, are illustrated in Figure 15. The probability of transformer overload was reduced from 3.5 per cent to 1.5 per cent, and the cost of grid carrying capacity risk was elevated from $20,000 to $22,420. The cost of grid carrying capacity risk increased from $20,000 to $42,840 as the carrying capacity risk indicator increased from 5 to 15. It can be seen that the transformer overload probability has an impact on the grid carrying capacity risk, but the impact factor is much smaller than the grid carrying capacity risk indicator; therefore, under the premise of considering the economy, priority should be given to the relaxation of the grid carrying capacity risk indicator, in order to reduce the cost arising from the carrying capacity risk (after the carrying capacity risk indicator has been reduced by 10, and after the carrying capacity risk cost continues to be reduced). So, this study took the carrying capacity risk of 10 and the transformer overload probability of 2.5% as the optimized values. In this chapter, the study validates the efficacy of the research model in both simulated and actual power grids using the IEEE 39 standard arithmetic example and a regional power grid. The experimental comparison between the real grid and the model demonstrates that the approach proposed in this study can enhance the grid’s capacity to withstand typhoon conditions and improve its resilience to risks. A comparison between Figure 10 and Figure 14 reveals that with fewer Wind Turbine Generators (WTGs) in the regional grid, there is an excessive reliance on the dispatch capacity of the energy storage system. However, due to the limited capacity of the energy storage, it struggles to provide adequate dispatch resources, thereby falling short in mitigating risks to the grid’s capacity. Consequently, the strategy presented in this research is best suited for power grids equipped with relatively abundant dispatch resources.
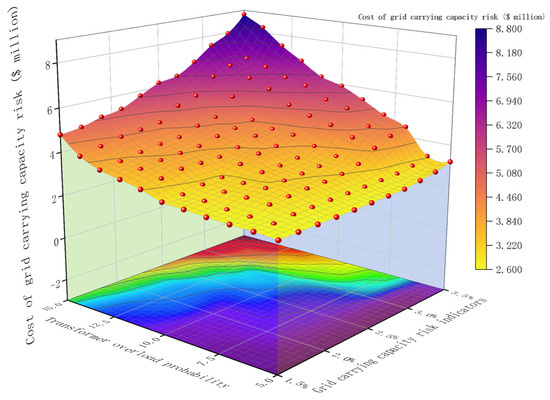
Figure 15.
Prevention and control costs under different loss load parameters.
A graphical representation of the grid carrying capacity risk and its cost relationship is shown in Figure 16.
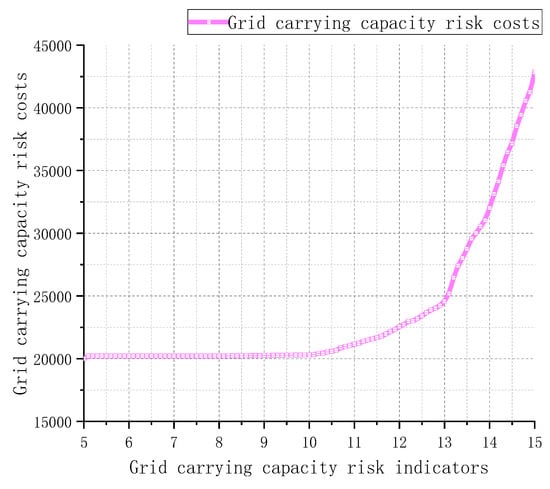
Figure 16.
Grid carrying capacity risk indicators—carrying capacity risk cost relationships.
6. Conclusions
Revised Paragraph: This study introduced a strategy for assessing and enhancing carrying capacity under typhoon conditions by utilizing carrying capacity risk and line overload indicators to reflect the regional power grid’s capacity. The case study confirms that the proposed scheduling scheme can improve the grid’s carrying capacity and reduce the risk of insufficient capacity during typhoons while considering economic factors.
- (1)
- The paper introduced the branch carrying capacity risk indicator and the branch overload probability indicator, which, based on the common definition of carrying capacity, assessed the risk of insufficient grid capacity. This approach combined the risks of typhoon-related line failures and grid carrying capacity.
- (2)
- The branch carrying capacity risk indicator, branch overload probability indicator, and grid carrying capacity risk indicator can collectively evaluate the operational risks under typhoon conditions, identifying the risk associated with each grid branch based on current typhoon and grid operation.
- (3)
- This study utilized a line failure model to convert typhoon parameters, such as path and wind speed, into line risk probability, analyzing the risk indicators under various line breakage conditions. This analysis clarified the impact of typhoons on grid capacity and validated the proposed risk indicators’ rationale.
- (4)
- The proposed multi-timescale carrying capacity risk defense scheduling strategy can be applied to multi-source power grids containing wind power, electrochemical energy storage, pumped storage and DR to provide reasonable defense scheduling schemes based on the predicted typhoon information, and to guarantee the safe and stable operation of power grids under typhoons.
Author Contributions
Conceptualization, Z.L. (Zimin Liu) and D.L.; methodology, Z.L. (Zimin Liu) and D.L.; software, Z.L. (Zimin Liu) and J.H.; validation, L.H., Z.L. (Zimin Liu) and D.L.; formal analysis, Z.L. (Zong Liu); investigation, Z.L. (Zimin Liu); resources, D.L.; data curation, D.L.; writing—original draft preparation, Z.L. (Zimin Liu); writing—review and editing, Z.Y.; visualization, Z.L. (Zimin Liu); supervision, L.H.; project administration, J.H.; funding acquisition, J.H. All authors have read and agreed to the published version of the manuscript.
Funding
This research received no external funding.
Data Availability Statement
As part of the research data in this study involves internal data of State Grid Corporation of China, the data will not be disclosed due to this privacy reason.
Conflicts of Interest
Authors Dahu Li were employed by the company State Grid Hubei Electric Power Limited company. The remaining authors declare that the research was conducted in the absence of any commercial or financial relationships that could be construed as a potential conflict of interest. The company State Grid Hubei Electric Power Limited company had no role in the design of the study; in the collection, analyses, or interpretation of data; in the writing of the manuscript, or in the decision to publish the results.
References
- Wen, S.; Wang, Y.; Tang, Y.; Xu, Y.; Li, P. Proactive Frequency Control based on Ultra-Short-Term Power Fluctuation Forecasting for High Renewables Penetrated Power Systems. IET Renew. Power Gener. 2019, 13, 2166–2173. [Google Scholar] [CrossRef]
- Xie, Y.Y.; Xue, Y.S.; Wang, H.H.; Xu, T.S.; Dong, Z.Y.; Jin, X.C. Spatio-temporal online warning of lightning fault probability in power grids. Power Syst. Autom. 2013, 37, 44–51. [Google Scholar]
- Wu, Y.J.; Xue, Y.S.; Lu, J.Z.; Xie, Y.Y.; Xu, T.S.; Li, W.Y.; Wu, C. Mountain fire disaster on power grid failure rate of temporal and spatial effects. Power Syst. Autom. 2016, 40, 14–20. [Google Scholar]
- Xie, Y.Y.; Xue, Y.S.; Wen, F.S.; Dong, Z.Y.; Zhao, J.H. Impact of ice disaster on transmission line failure rateof spatio-temporal assessment. Power Syst. Autom. 2013, 37, 32–41. [Google Scholar]
- Yu, C.; Huang, Y.; Chang, K.; Liu, S.; Guo, J. The early warning of icing flashover fault of transmission line based warning of icing flashover fault of transmission line basedon partial mutual information method and support vector. In Proceedings of the 4th IEEE Conference on Energy Internet and Energy System Integration, Wuhan, China, 30 October 2020–1 November 2020; IEEE: Piscataway, NJ, USA, 2020. [Google Scholar]
- Shi, J.; Ding, Z.; Lee, W.J.; Yang, Y.; Liu, Y.; Zhang, M. Hybrid forecasting model for very-short term wind power forecasting based on grey relational analysis and wind speed distribution features. IEEE Trans. Smart Grid 2014, 5, 521–526. [Google Scholar] [CrossRef]
- Wang, H.H.; Xu, T.S.; Li, B.J.; Xue, Y.S.; Jin, X.C.; Guo, Y.J. Application design of grid security and stability coordinated defence system with adaptive natural environment. Power Syst. Autom. 2014, 38, 143–151. [Google Scholar]
- Lu, J.Z.; Wu, C.P.; Yang, L.; Zhang, H.X.; Liu, Y.; Xu, X.J. Research and application of transmission line hill fire monitoring and early warning system. Power Syst. Prot. Control 2014, 42, 89–95. [Google Scholar]
- Chang, K.; Yu, C.; Liu, S.; Huang, Y.; Li, W. Design and application of power grid security risk assessment and hierarchical control system in natural disasters. In Proceedings of the International Conference on Power System Technology, Haikou, China, 8–9 December 2021. [Google Scholar]
- Luo, J.B.; Yu, C.; Xie, Y.Y.; Chen, B.; Hunag, W.; Cheng, S.; Wu, Y.J. A review on the defence methods of power system security and stability under natural disasters. Power Syst. Prot. Control 2018, 14, 158–170. [Google Scholar]
- Xue, Y.; Zhang, C.; Jiang, F.; Dou, W.; Zhang, H.; Yang, C. Optimal capacity allocation method of integrated energy system considering renewable energy uncertainty. Front. Energy Res. 2022, 10, 1016756. [Google Scholar] [CrossRef]
- Lee, R.; Lee, H.; Kim, D.; Yoon, J. Investigation on Optimal Electric Energy Storage Capacity to Maximize Self-Consumption of Photovoltaic System. J. Energy Resour. Technol.-Trans. Asme 2022, 144, 070903. [Google Scholar] [CrossRef]
- Huang, M.Q.; Li, Y.H.; Yang, J.; Wang, M.K. Calculation method of distribution network carrying capacity under the influence of spatial dispatchable characteristics of electric vehicles. Grid Technol. 2023, 45, 1–15. [Google Scholar] [CrossRef]
- Zhong, W.L.; Haichao, W.; Xue, W.; Quan, A. Adaptive assessment of renewable energy on-grid based on grid carrying capacity. Chin. J. Electr. Eng. 2023, 43, 107–113. [Google Scholar]
- Xu, R.H.; Zhao, T.; Ma, H.; He, K.L.; Lv, H.K.; Guo, X.T.; Chen, Q. Operation optimization of distributed energy systems considering nonlinear characteristics of multi-energy transport and conversion processes. Energy 2023, 283, 129192. [Google Scholar] [CrossRef]
- Li, Y.; Wang, J.; Zhou, Y.; Wei, C.; Guan, Z.; Chen, H. Multi-dimension day-ahead scheduling optimization of a community-scale solar-driven CCHP system with demand-side management. Renew. Sustain. Energy Rev. 2023, 185, 113654. [Google Scholar] [CrossRef]
- Huang, W.; Li, Y.; Li, J. Multi-time scale joint optimal scheduling for wind-photovoltaic-ele ctrochemical energy storage-pumped storage considering renewable energy uncertainty. Electr. Power Autom. Equip. 2023, 43, 91–98. [Google Scholar]
- Lin, L.; Yue, X.; Xu, B.; Sun, Y.; Wei, M. Sequence and strategy of pumped storage-thermal combined peak shaving considering benefits of pumped storage and deep regulation of thermal power. Power Syst. Technol. 2021, 45, 20–32. [Google Scholar]
- He, H.; Hu, S.B.; Zhang, J.H.; Yu, X.Y.; Sun, H.; Lu, S.Y. Sample entropy based divided-period dispatch of net load in renewable energy power system. Autom. Electr. Power Syst. 2019, 43, 77–86. [Google Scholar]
- Yao, H.M.; Qin, W.P.; Jing, X.; Wang, K.; Zhu, Z.L.; Han, H.Q. Likelihood theory-based assessment method for distributed photovoltaic carrying capacity of low-voltage distribution networks. High Volt. Technol. 2023, 1–11. [Google Scholar] [CrossRef]
- Odgaard, A.J.; Odgaard, M.A.J. Free-Surface Air Core Vortex. J. Hydraul. Eng. 1986, 112, 610–620. [Google Scholar] [CrossRef]
- Gautam, D.; Goel, L.; Ayyanar, R.; Vittal, V.; Harbour, T. Control strategy to mitigate the impact of reduced inertia due to doubly fed induction generators on large power systems. IEEE Trans. Power Syst. 2011, 26, 214–224. [Google Scholar] [CrossRef]
- Panteli, M.; Pickering, C.; Wilkinson, S.; Dawson, R.; Mancarella, P. Power System Resilience to Extreme Weather: Fragility Modelling, Probabilistic Impact Assessment, and Adaptation Measures. IEEE Trans. Power Syst. 2017, 32, 3747–3757. [Google Scholar] [CrossRef]
- Liu, Z.; Wierman, A.; Chen, Y.; Razon, B.; Chen, N. Data center demand response: Avoiding the coincident peak via workload shifting and local generation. Perform. Eval. 2013, 70, 770–791. [Google Scholar] [CrossRef]
- Dehghani, F.; Mohammadi, M.; Karimi, M. Resilience enhancement strategy for distribution systems under extreme weather events. IEEE Trans. Smart Grid 2018, 9, 1442–1451. [Google Scholar]
- Xie, Y.; Li, C.; Lv, Y.; Yu, C. Predicting lightning outages of transmission lines using Generalised Regression Neural Network. Appl. Soft Comput. J. 2019, 78, 438–446. [Google Scholar] [CrossRef]
- Ji, C.; Yang, Q.; Ning, N.; Liu, Y.; Lyu, L. Mitigating Downward Reserve Deficiency of Power System via Coordinating EV Demand Response at Valley Period. IEEE Access 2020, 8, 112368–112378. [Google Scholar] [CrossRef]
- Kropat, E.; Meyer-Nieberg, S. Slime Mold Inspired Evolving Networks under Uncertainty (SLIMO). In Proceedings of the Hawaii International Conference on System Sciences, Waikoloa, HI, USA, 6–9 January 2014; IEEE: Piscataway, NJ, USA, 2014. [Google Scholar] [CrossRef]
- Wang, H.-J.; Pan, J.-S.; Nguyen, T.-T.; Weng, S. Distribution network reconfiguration with distributed generation based on parallel slime mould algorithm. Energy 2022, 244, 123011. [Google Scholar] [CrossRef]
- Lekbich, A.; Belfqih, A.; Ouderhman, T.; Zedak, C.; Boukherouaa, J.; Elmariami, F. A multi-objective optimization-based model for the deployment of reclosers and remote-controlled switches using NSGA2 and entropy weighted TOPSIS method. Indones. J. Electr. Eng. Comput. Sci. 2020, 20, 1128. [Google Scholar] [CrossRef]
- Pu, C.-Y.; Xun, X.-C.; Song, H.-Z.; Zhang, F.-W.; Lu, Z.-W.; Zhou, D.-W. Prediction of Pressure-Induced Structural Transition and Mechanical Properties of MgY from First-Principles Calculations. Commun. Theor. Phys. 2016, 65, 92–98. [Google Scholar] [CrossRef]
- Yang, Z.; Huaqiang, L.; Yimiao, W.; Peiqing, L. A Complex Network Theory and Conditional Probability Based Risk Assessment Method for Disastrous Accidents. Power Syst. Technol. 2013, 37, 3190–3196. [Google Scholar]
Disclaimer/Publisher’s Note: The statements, opinions and data contained in all publications are solely those of the individual author(s) and contributor(s) and not of MDPI and/or the editor(s). MDPI and/or the editor(s) disclaim responsibility for any injury to people or property resulting from any ideas, methods, instructions or products referred to in the content. |
© 2024 by the authors. Licensee MDPI, Basel, Switzerland. This article is an open access article distributed under the terms and conditions of the Creative Commons Attribution (CC BY) license (https://creativecommons.org/licenses/by/4.0/).