1. Introduction
Global megatrends in carbon neutrality and energy efficiency have prompted countries to implement policies that promote the widespread adoption of renewable energy. Consequently, the solar energy industry has experienced significant growth, driven by factors such as price competitiveness and the expansion of various market participants.
By 2022, silicon-based bifacial solar modules were projected to capture a significant market share of 65%. This dominance can be attributed to the similarities in the manufacturing processes of bifacial and monofacial solar modules, resulting in minimal price differences. Additionally, the advantage of capturing light on the rear side of the module contributed to an improvement of approximately 5% in power generation. Consequently, the adoption of bifacial modules has increased in most photovoltaic (PV) projects [
1].
Meanwhile, attempts have been made to overcome the theoretical efficiency limitations of silicon solar cells, including the development of multi-junction solar cells and research on flexible thin-film solar cells. These advancements are aimed at increasing the efficiency of solar modules and diversifying their applications. Additionally, tandem solar cells can then surpass the efficiency limit of silicon solar cells (29%) and theoretically reach a maximum efficiency of 45% have been investigated. China’s company “L” has announced a verified efficiency of 33.9% for tandem solar cells. Additionally, attempts to achieve high efficiencies with perovskite- and CIGS-based multi-junction solar cells have rapidly increased [
2,
3].
The Korea Electric Power Corporation (KEPCO) implemented a renewable energy connection guarantee system in South Korea on 31 October 2016. As a result, applications that require the connection of distributed power sources of at most 1 MW have increased significantly. This system is designed to guarantee the connection of renewable energy sources of at most 1 MW by reinforcing power facilities, resulting in increased demand for infrastructure expansion, including distribution lines (DLs).
This resulted in the construction of new lines by KEPCO, which was uneconomical. Additionally, the construction of new power infrastructure can lead to complaints from nearby residents; therefore, a multifaceted response is required. Accordingly, research and development aimed at reducing the construction of new connecting lines are necessary.
In this study, we propose a vertical PV system whose installation conditions differ from that of a conventional system (tilted 25°, facing south). In addition, we plan to study a strategy for improving the line utilization rate and hosting capacity by deriving the output patterns for each installation condition.
The vertical installation of bifacial modules was initially introduced by Next2Sun in Germany and has been successfully implemented on a scale exceeding 16 MW. This system can be applied in various fields, such as agricultural fencing, noise barrier, and building integrated photovoltaics [
4].
Additionally, extensive studies on vertical PV systems that utilize bifacial modules have been conducted. In particular, studies to integrate vertical PV systems into various applications, such as agricultural fences and rooftops, to investigate both power generation and additional benefits are underway [
5,
6]. Furthermore, measures to increase the power generation of vertical PV systems have been proposed [
7]. Moreover, the economic viability and advantages of vertical PV systems under specific conditions have been analyzed [
8].
To enhance the renewable energy hosting capacity within the power grid, distribution system operators must consider certain scenarios and technologies to improve distribution systems [
9]. Additionally, the impact analysis of improving the hosting capacity by considering regulatory relaxations and investment recovery in the power industry has been presented [
10]. Studies addressing hosting capacity improvements in distribution system designs related to an increase in PV and electrical vehicle capacity have been reported [
11]. Furthermore, scenarios that explain the combination of vertical and conventional PV systems for hosting capacity enhancement have been explored internationally [
12].
This study involved practical demonstrations of various vertical and conventional PV systems. We employed actual data collected over 11 months, including generation patterns and peak generation data, to investigate hosting capacity improvement. To analyze the hosting capacity effects, voltage stability and thermal capacity line verification were conducted to ensure the reliability of the research results.
2. Materials and Methods
2.1. Cumulative PV System Capacity in South Korea
According to the Korea Energy Agency, as of December 2021, the total installed capacity of PV systems in South Korea was 21.2 GW. This capacity is distributed across various sectors as follows (
Table 1): 5.8 GW in the Korea Power Exchange (KPX) market, 13.2 GW in power purchase agreement (PPA) contracts with the KEPCO, and 2.4 GW in behind-the-meter (BTM) installations [
13,
14,
15].
PV systems are concentrated in specific areas where land costs are low and solar conditions are favorable. However, this concentration has led to a shortage of connection lines, resulting in waiting times for connections. This issue has become a societal concern as it directly impacts the profitability of businesses. Additionally, connections to the end of the power grid result in power quality issues, such as voltage spikes, owing to reverse flow. Consequently, studies aimed at enhancing the hosting capacity by considering the voltage quality in connection lines are underway.
In South Korea, where approximately 60% of the land is mountainous, vertical PV systems that can be applied in various settings have been developed. Government projects related to vertical PV systems, including those with additional functionalities, such as fences and soundproof walls, are underway. Furthermore, with the ongoing development of flexible thin-film and multi-junction solar cells, which have fewer installation constraints, their integration with vertical PV systems is worth exploring.
2.2. Characteristics of Vertical PV Systems with Bifacial Modules
In a conventional PV system with a sloped configuration, the modules are typically installed facing south at a tilted angle of 25–30° to maximize annual energy production. These systems reach their peak performance when the sun’s altitude is the highest, typically around noon. However, vertical PV systems, which utilize bifacial modules installed vertically with the front and rear sides facing east and west, respectively, exhibit a dual-peak energy production pattern concentrated in the morning and afternoon, forming a twin-peak shape [
16].
A comparison of the power output patterns of conventional (south-facing) and vertical (east-west orientation) PV systems is shown in
Figure 1. Based on previous findings, depending on the installation environment, vertical PV systems can achieve energy production levels comparable to or higher than those of conventional systems. Energy production is influenced by various factors, such as the latitude of the installation country, altitude variations, and climatic conditions.
2.3. Installation and Operation of Vertical and Conventional PV Testbeds
To collect output characteristic data for vertical and conventional PV systems, a testbed was constructed in Naju City, Jeollanam-do, South Korea. This region was selected owing to its high occurrence of PV connection delays. The vertical PV system had a capacity of 14.8 kW, whereas the conventional PV system (south-facing with a tilt angle of 25°) had a capacity of 11.0 kW. To analyze the output characteristics of the vertical PV system utilizing bifacial modules, a control group was established by installing a conventional PV system with bifacial modules. The ground at the generation site was covered with gravel, resulting in an albedo level of 18% [
17]. The actual landscape of the constructed testbed is shown in
Figure 2. Magnified images of the vertical and conventional PV systems utilized in this study are shown in the red boxes.
The bifacial solar modules utilized in this study were rated at 460 W by Hanwha Q CELLS, Republic of Korea. Modules with glass materials of the same thickness (2 mm) on both sides were selected to facilitate the analysis of the output characteristics from both the front and rear sides. The specifications are listed in
Table 2.
2.4. Effects of Connecting PV Systems to the DL
Typically, PV systems are connected to the ends of DLs, where land prices are more affordable. However, such PV systems can induce reverse currents, which can increase the voltage of the distribution system, resulting in power quality deterioration. The extent to which PV generation influences the voltage of the distribution system can be expressed as follows [
18]:
where
represents the voltage variation on the DL for the PV system,
represents the impedance from the PV system to the DL, and
represents the current of the PV system.
where
and
represent the active and reactive powers, respectively, whereas
represents the bus voltage of the PV system.
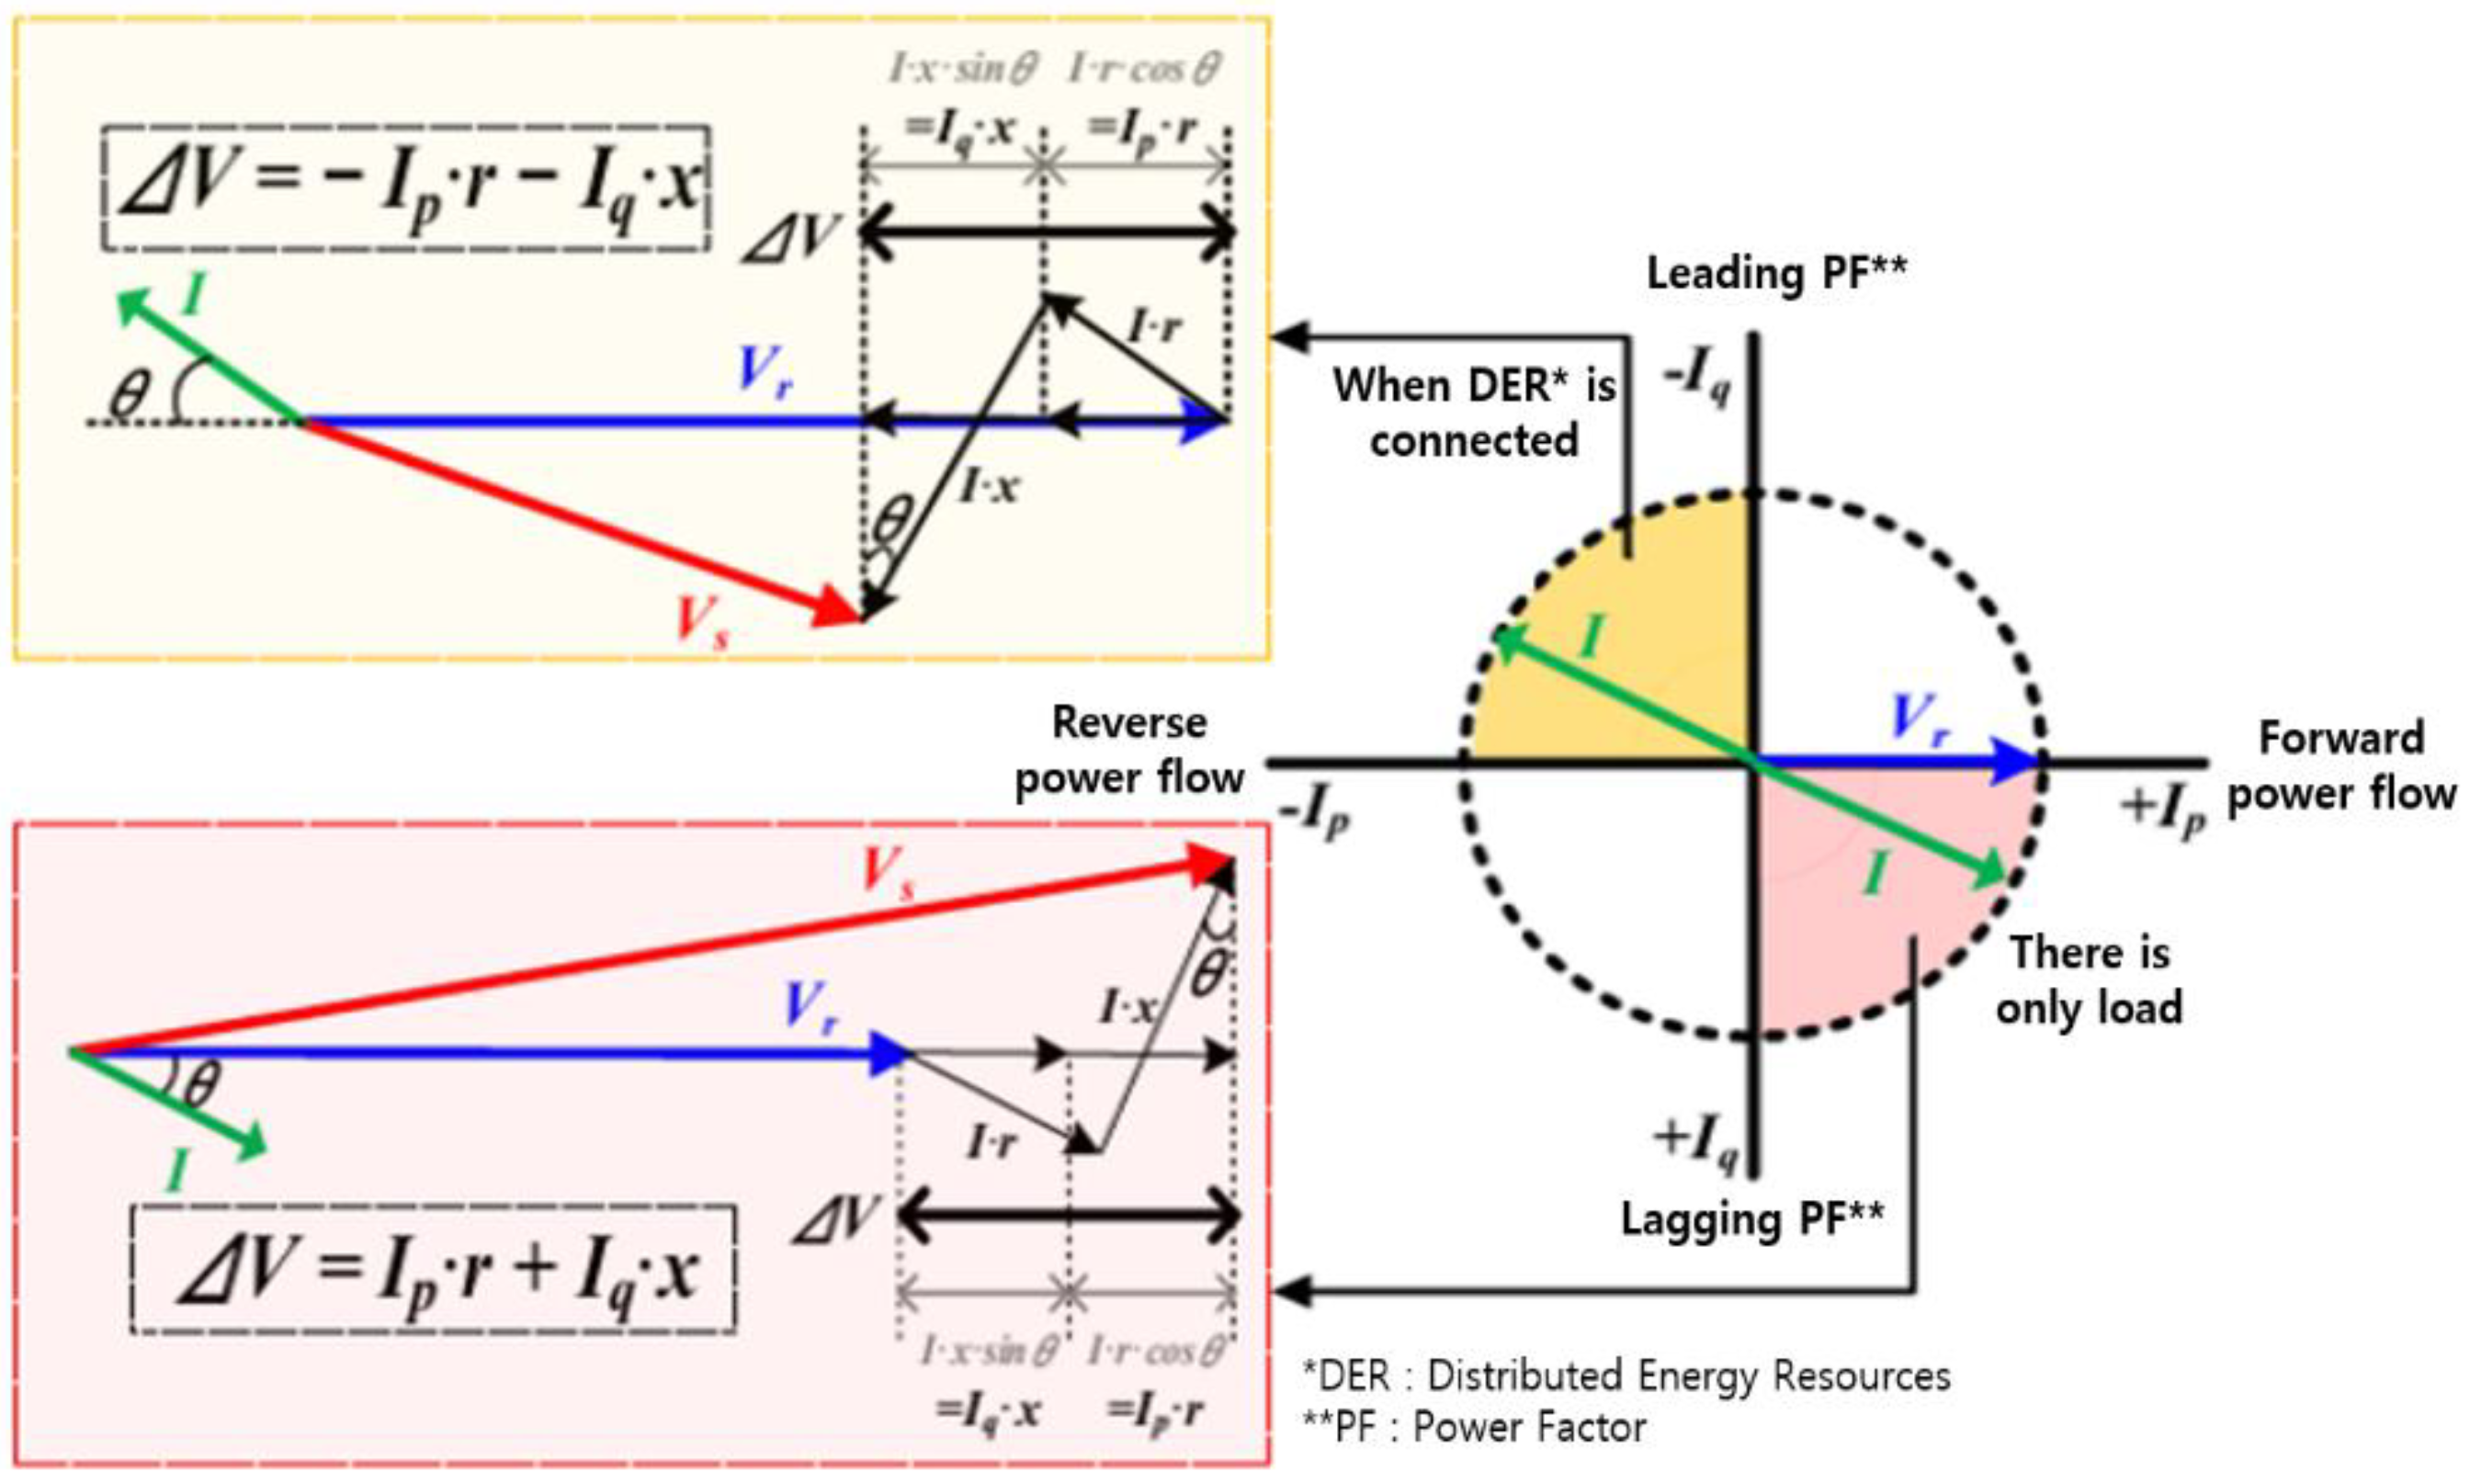
Equation (3) can be derived from Equations (1) and (2). The voltage variation in the distribution system owing to the active and reactive powers of the PV system can be understood from Equation (3). The total voltage variation in the distribution system can be divided into the d-axis (real component) and q-axis (reactive component), and the overall system voltage variation can be expressed as
where
represents the total voltage of the distribution system. The d-axis voltage is significantly higher than the q-axis voltage; hence, the q-axis component can be ignored. Therefore, Equation (4) can be expressed as
using vectors. This effect is expressed in a vector diagram as shown in
Figure 3. It can be seen that the receiving voltage,
(at the point where power is received) increases more than the sending voltage,
(sent from the substation).
2.5. OpenDSS-Based Modeling to Validate Hosting Capacity Enhancement
To validate the feasibility, OpenDSS was utilized for modeling to analyze the impact of connecting a PV system to a DL. OpenDSS (version 9.8.0.1) is a specialized software developed by the Electric Power Research Institute (EPRI) in the United States to design and operate distribution systems. As shown in
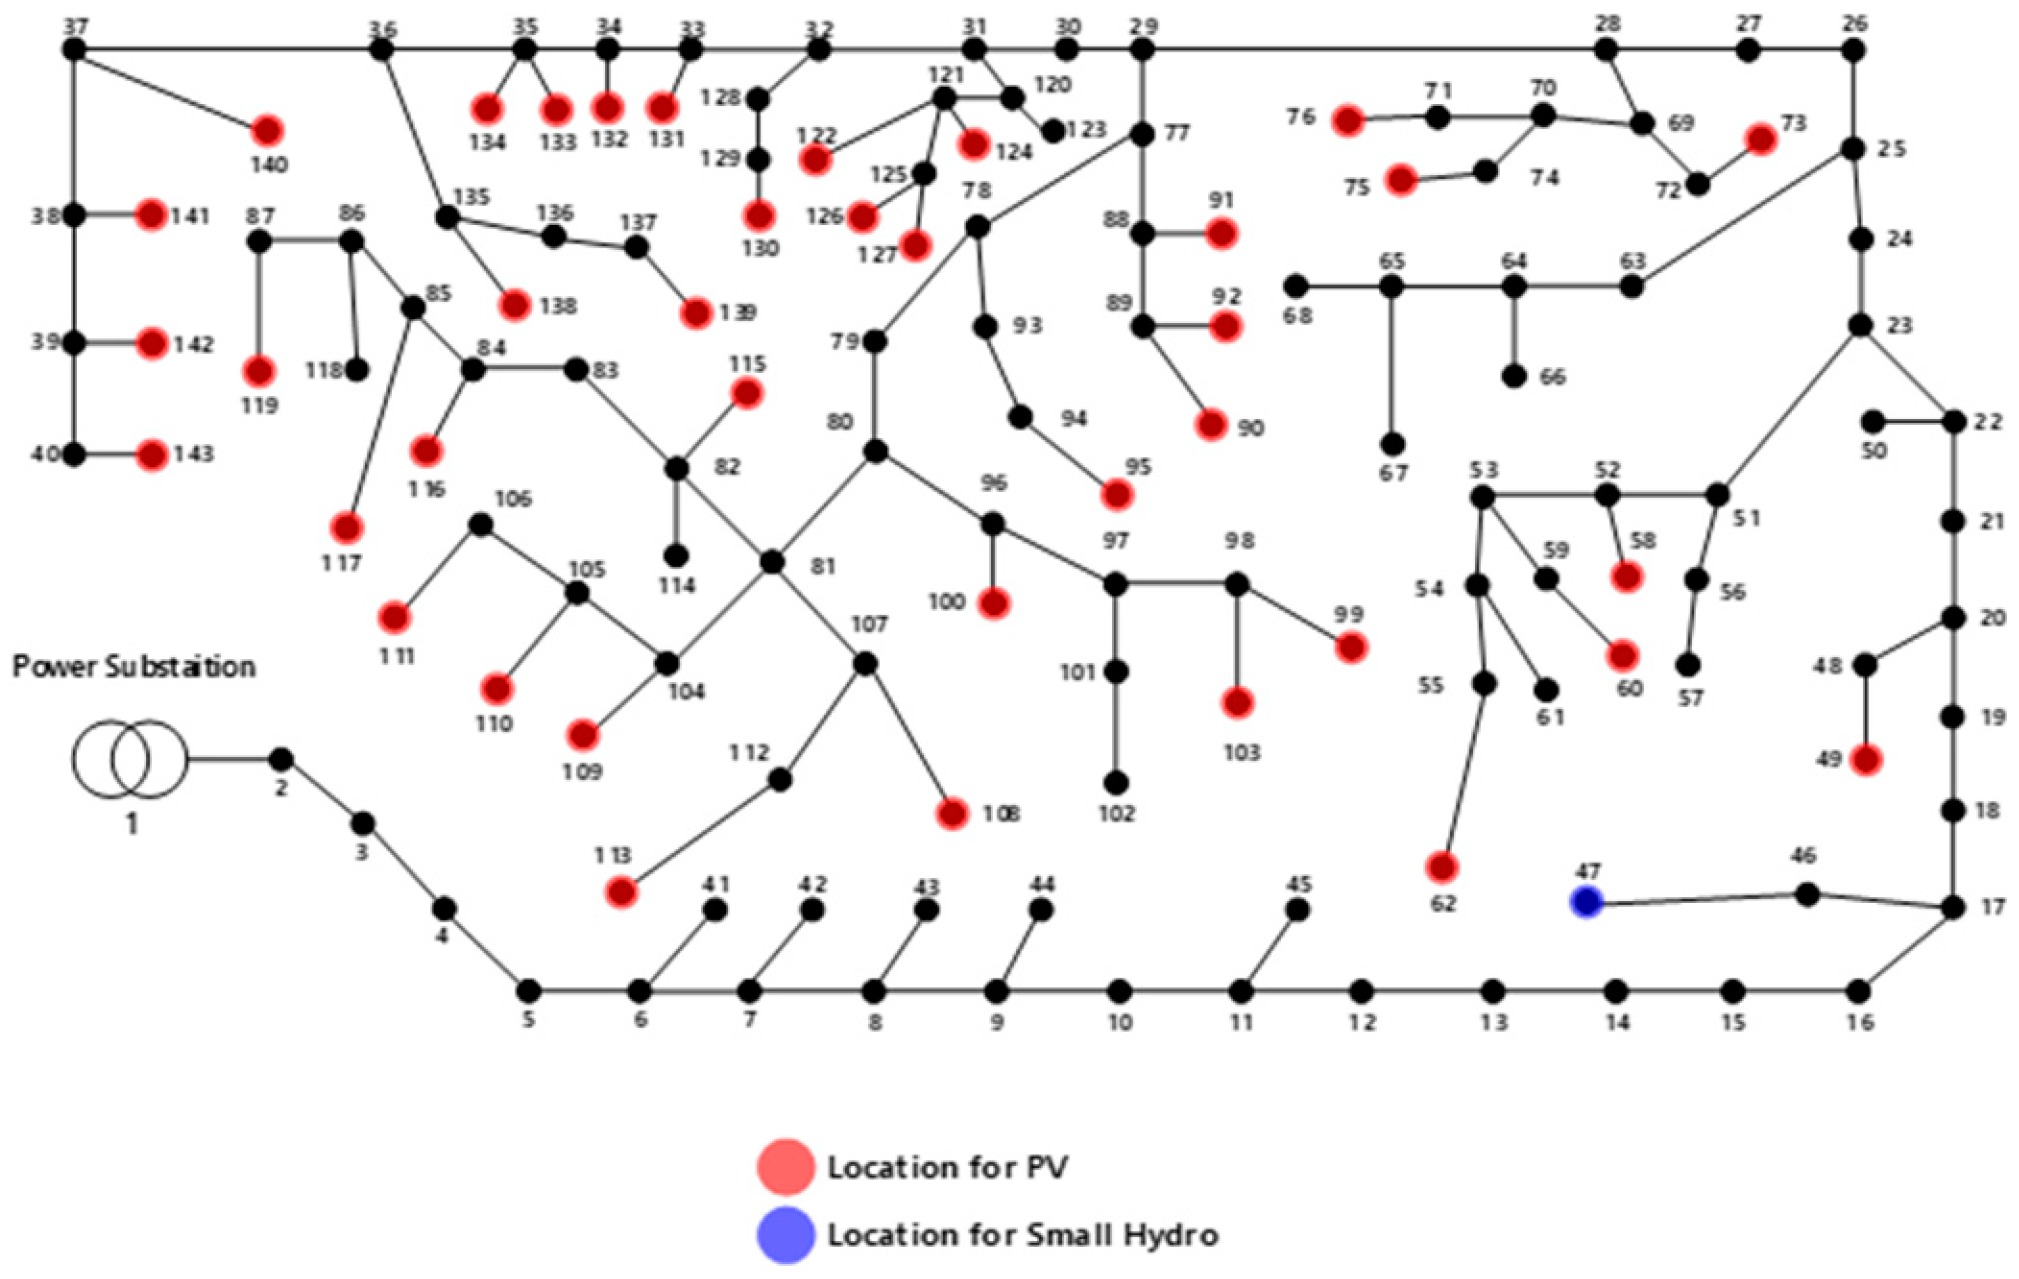
Figure 4, the model included a DL connected to the PV system, where connection delays occurred in South Korea. Patterns of vertical and conventional PV generation were obtained from the actual testbed.
“H” DL is a 22.9 kV line that satisfies the conditions outlined in
Table 3. The rated voltage of the main transformer is 154/22.9 [kV]. The power factor of the load is 0.95, and the capacity of the photovoltaic system is 12 [MW]. There are three types of line: ACSR-160 [mm
2], ACSR-95 [mm
2], and ACSR-58 [mm
2], and the total length of distribution system is 25 [km]. The actual system diagram is shown in
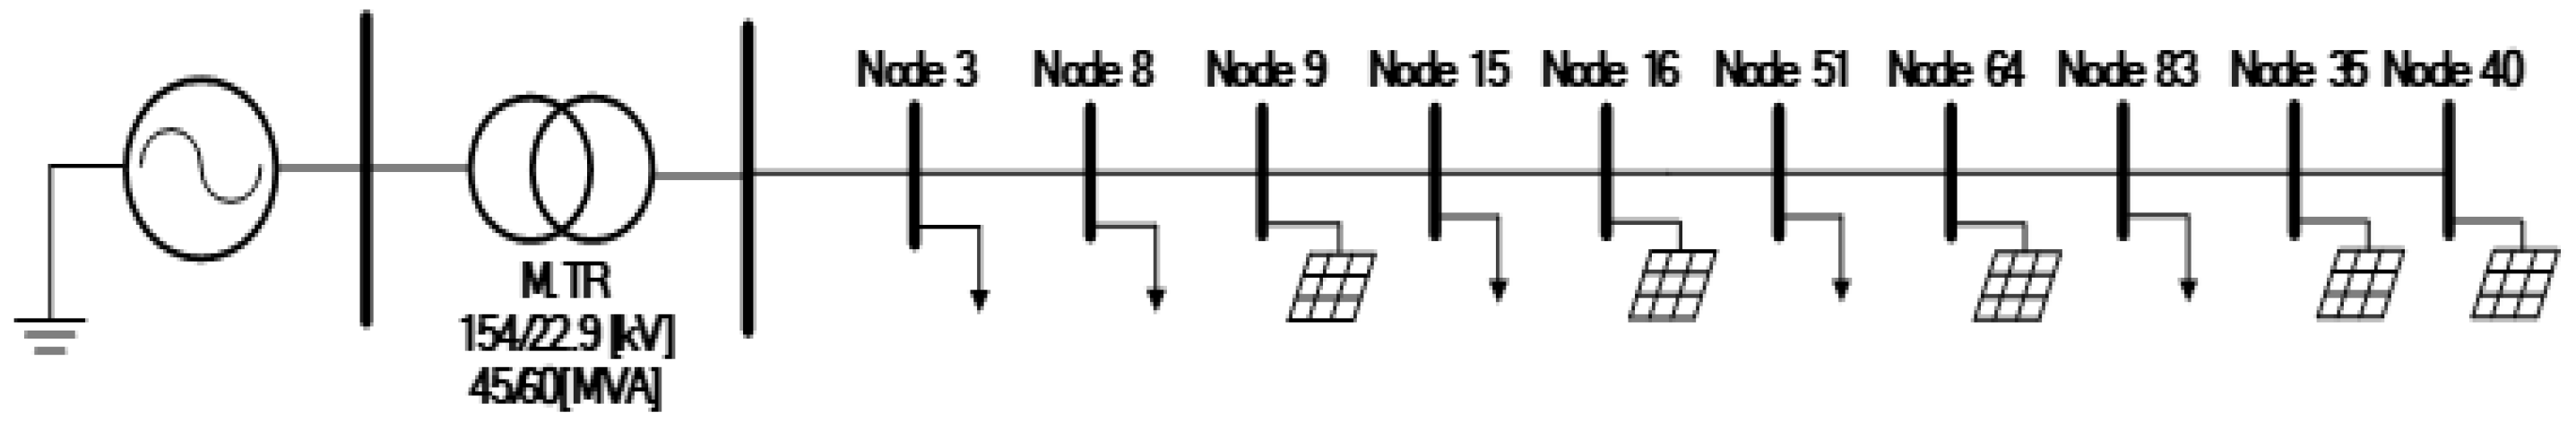
Figure 4. For simulation efficiency, the system was abbreviated, as shown in
Figure 5. We abbreviated the distributed photovoltaic system and load to the nearest main feeder node, and abbreviated to a system with a total of 10 nodes, while still maintaining the line impedance, load capacity/location, and PV capacity/location to reflect the actual power system conditions. Additionally, load data for this DL are based on the gross load from January to August 2023, obtained using data from the operational system of KEPCO.
Generation data were based on the hourly output data obtained from the testbed. Simulations were performed for combined PV generation outputs ranging from 0 to 100% in 10% increments, using both conventional and vertical PV generation during the same hours.
The pattern of vertical PV generation was based on the installation conditions in which the front of the modules faced west. This choice was made because the peak load on “H” DL is typically experienced in the afternoon. In the future, depending on the load pattern of the connected DL, azimuths of 90° and 270° for the vertical PV system may be considered.
3. Results and Discussion
3.1. Analysis of East-West-Oriented Vertical PV System Operational Data
Operational data under various installation conditions were monitored for both module- and inverter-level voltage, current, and power, as well as meteorological sensors (solar radiation and temperature). Data were collected at a minimum interval of 1 min; however, for this study, the analysis was conducted at 1 h intervals. For example, data for 7 h represent the average values acquired from 6:00 to 7:00. Therefore, caution should be exercised when directly comparing these results with research cases based on a lower time resolution.
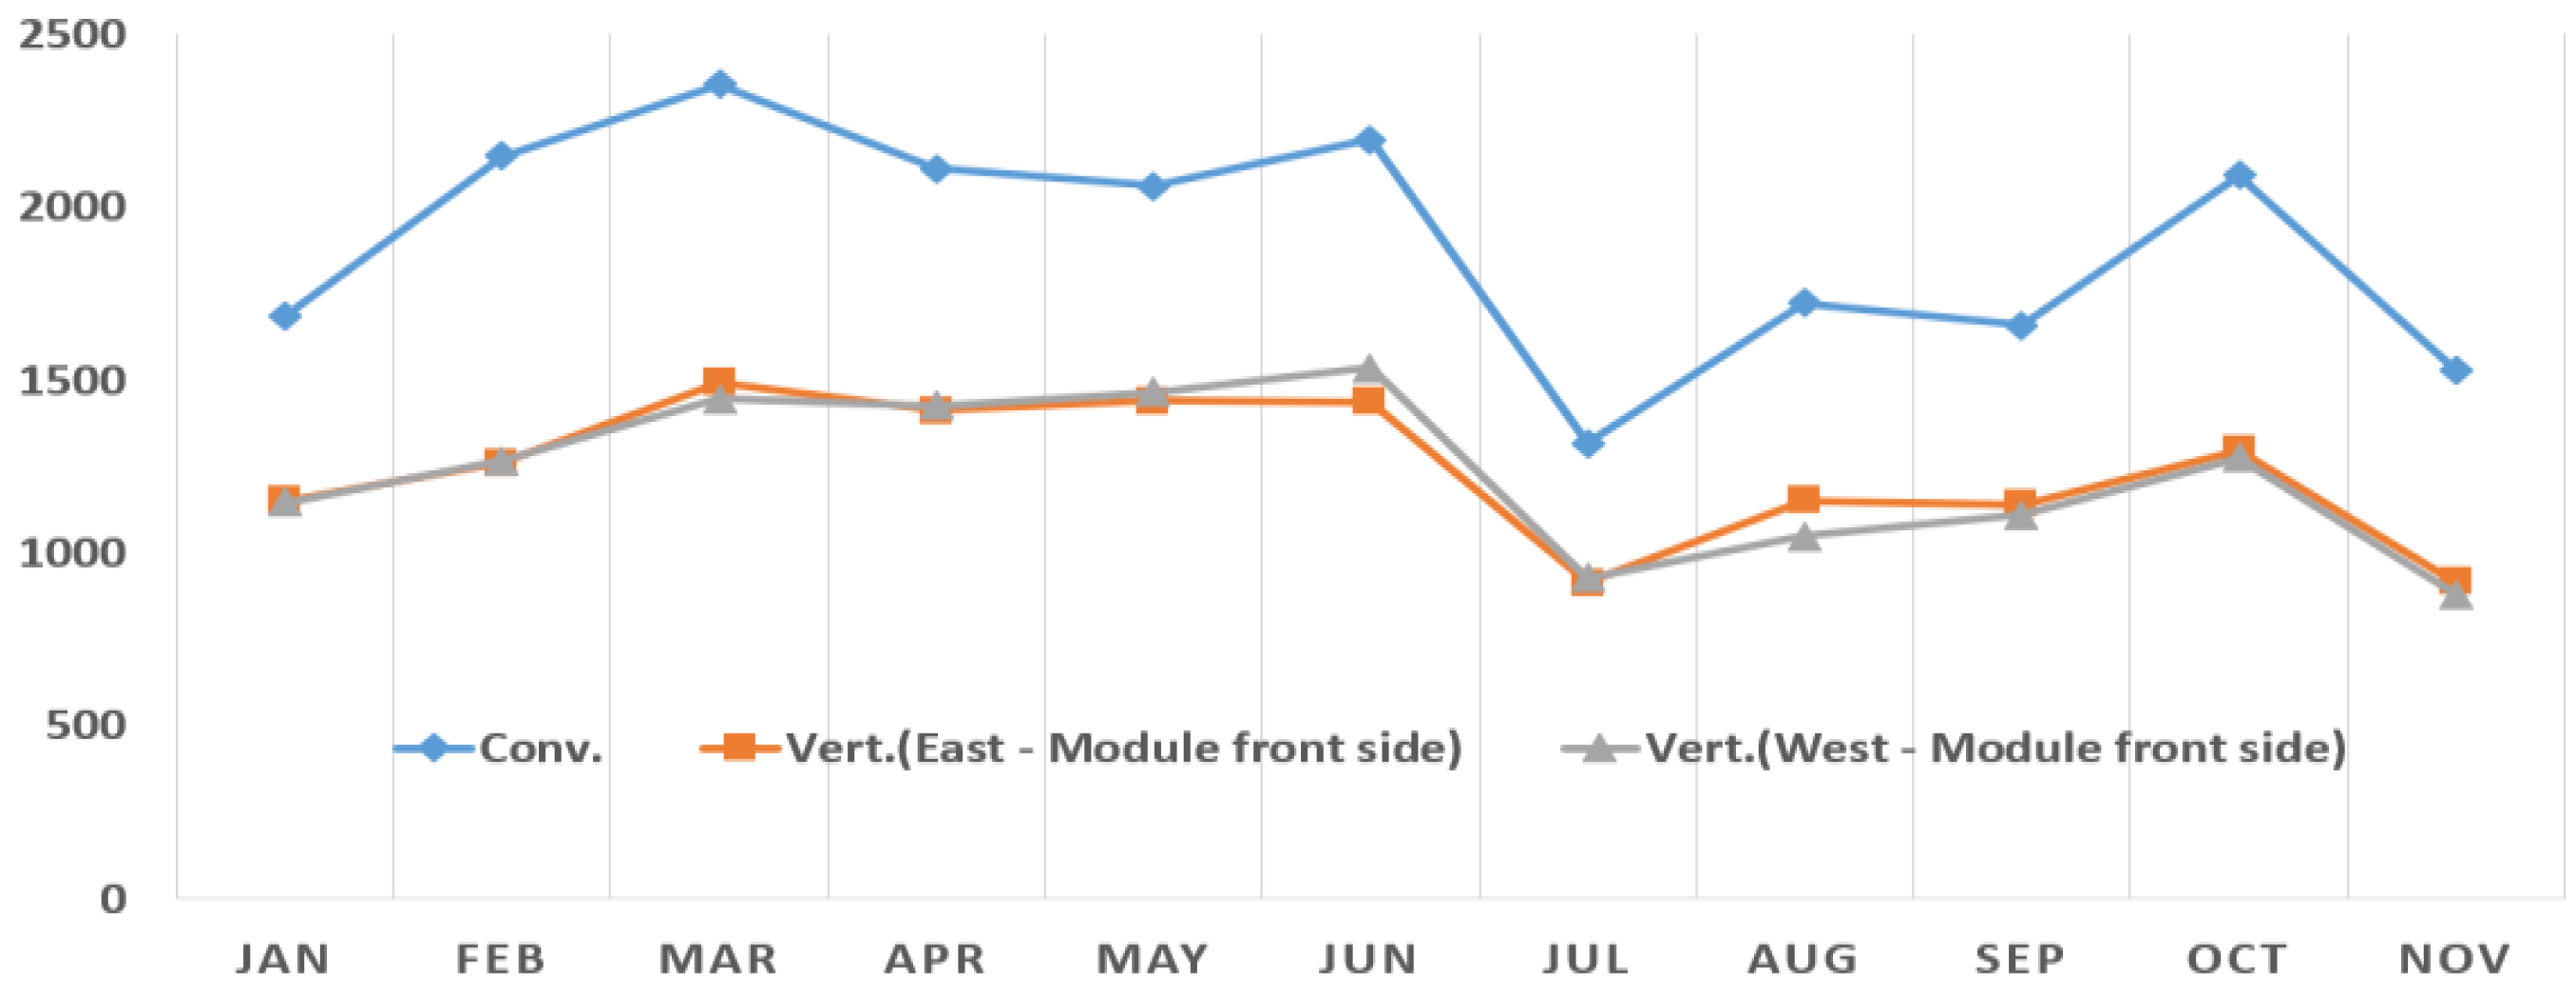
Data collection commenced in January 2023, and the trends of both conventional and vertical PV generations up to November are shown in
Figure 6.
The power generated by the vertical PV system was approximately 65.2% of that generated by the conventional system. This capacity can be improved through optimized structural placements for large-scale commercial applications. By utilizing environmental data from the installation area and assuming a continuous linear arrangement rather than the existing testbed structure, the generation capacity was estimated to be approximately 9.9% through a simulation tool called PVsyst.
The maximum power generation outputs for each period based on operational data from November are listed in
Table 4. The peak generation of the vertical PV system is lower than that of the conventional PV system because the physical characteristics of vertically installed solar modules do not allow it to capture solar radiation optimally. Consequently, we validated that the peak generation of the vertical PV system is lower than that of the conventional PV system, and the characteristics of concentrated generation in the morning and afternoon can be observed. As these values do not represent continuous generation patterns throughout the day, caution must be exercised in their interpretation and utilization.
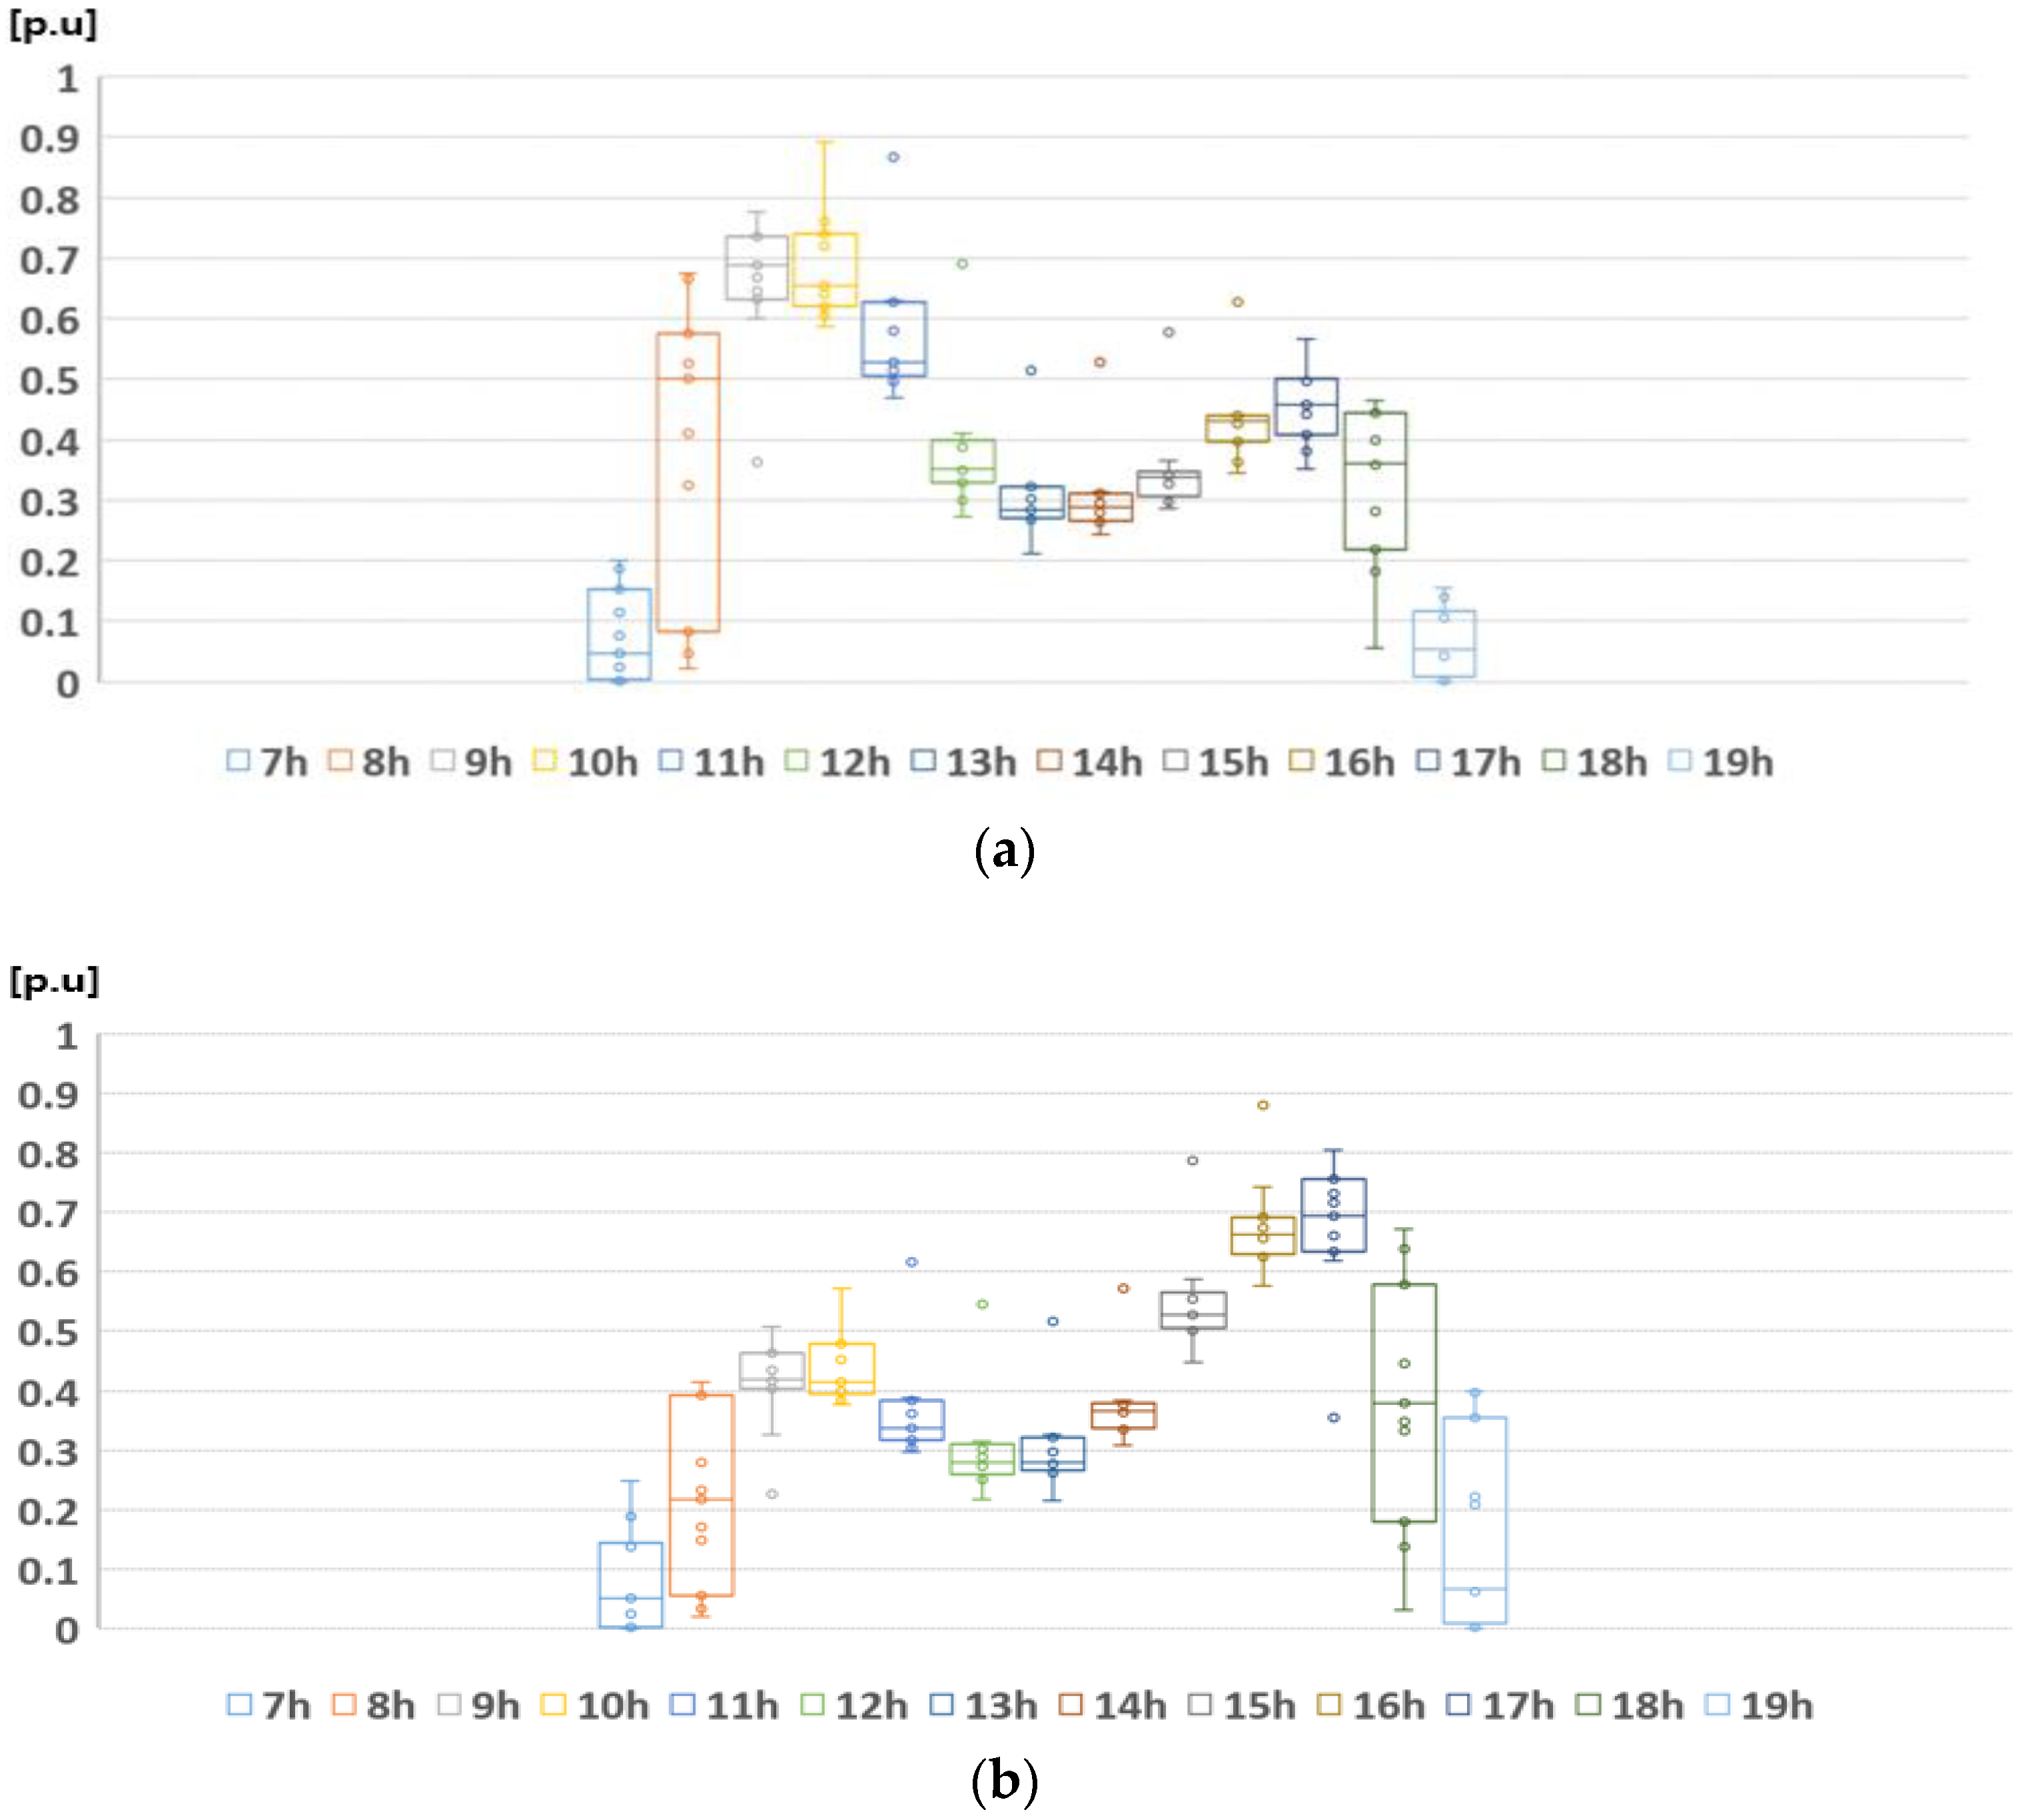
The peak power generations of the vertically installed solar modules facing east and west are at 88–89% of the installed capacity.
Figure 7 shows boxplots of the monthly time-of-day maximum power generation peaks, focusing on systems wherein the fronts of the modules faced east and west. The module power generations in each
Figure 7a,b are the operational data of a bifacial module (460 W) with the same rated capacity located in the same testbed.
3.2. Analysis of the Optimal Combination Ratio for Power Output Smoothening between Conventional and Vertical PV Systems
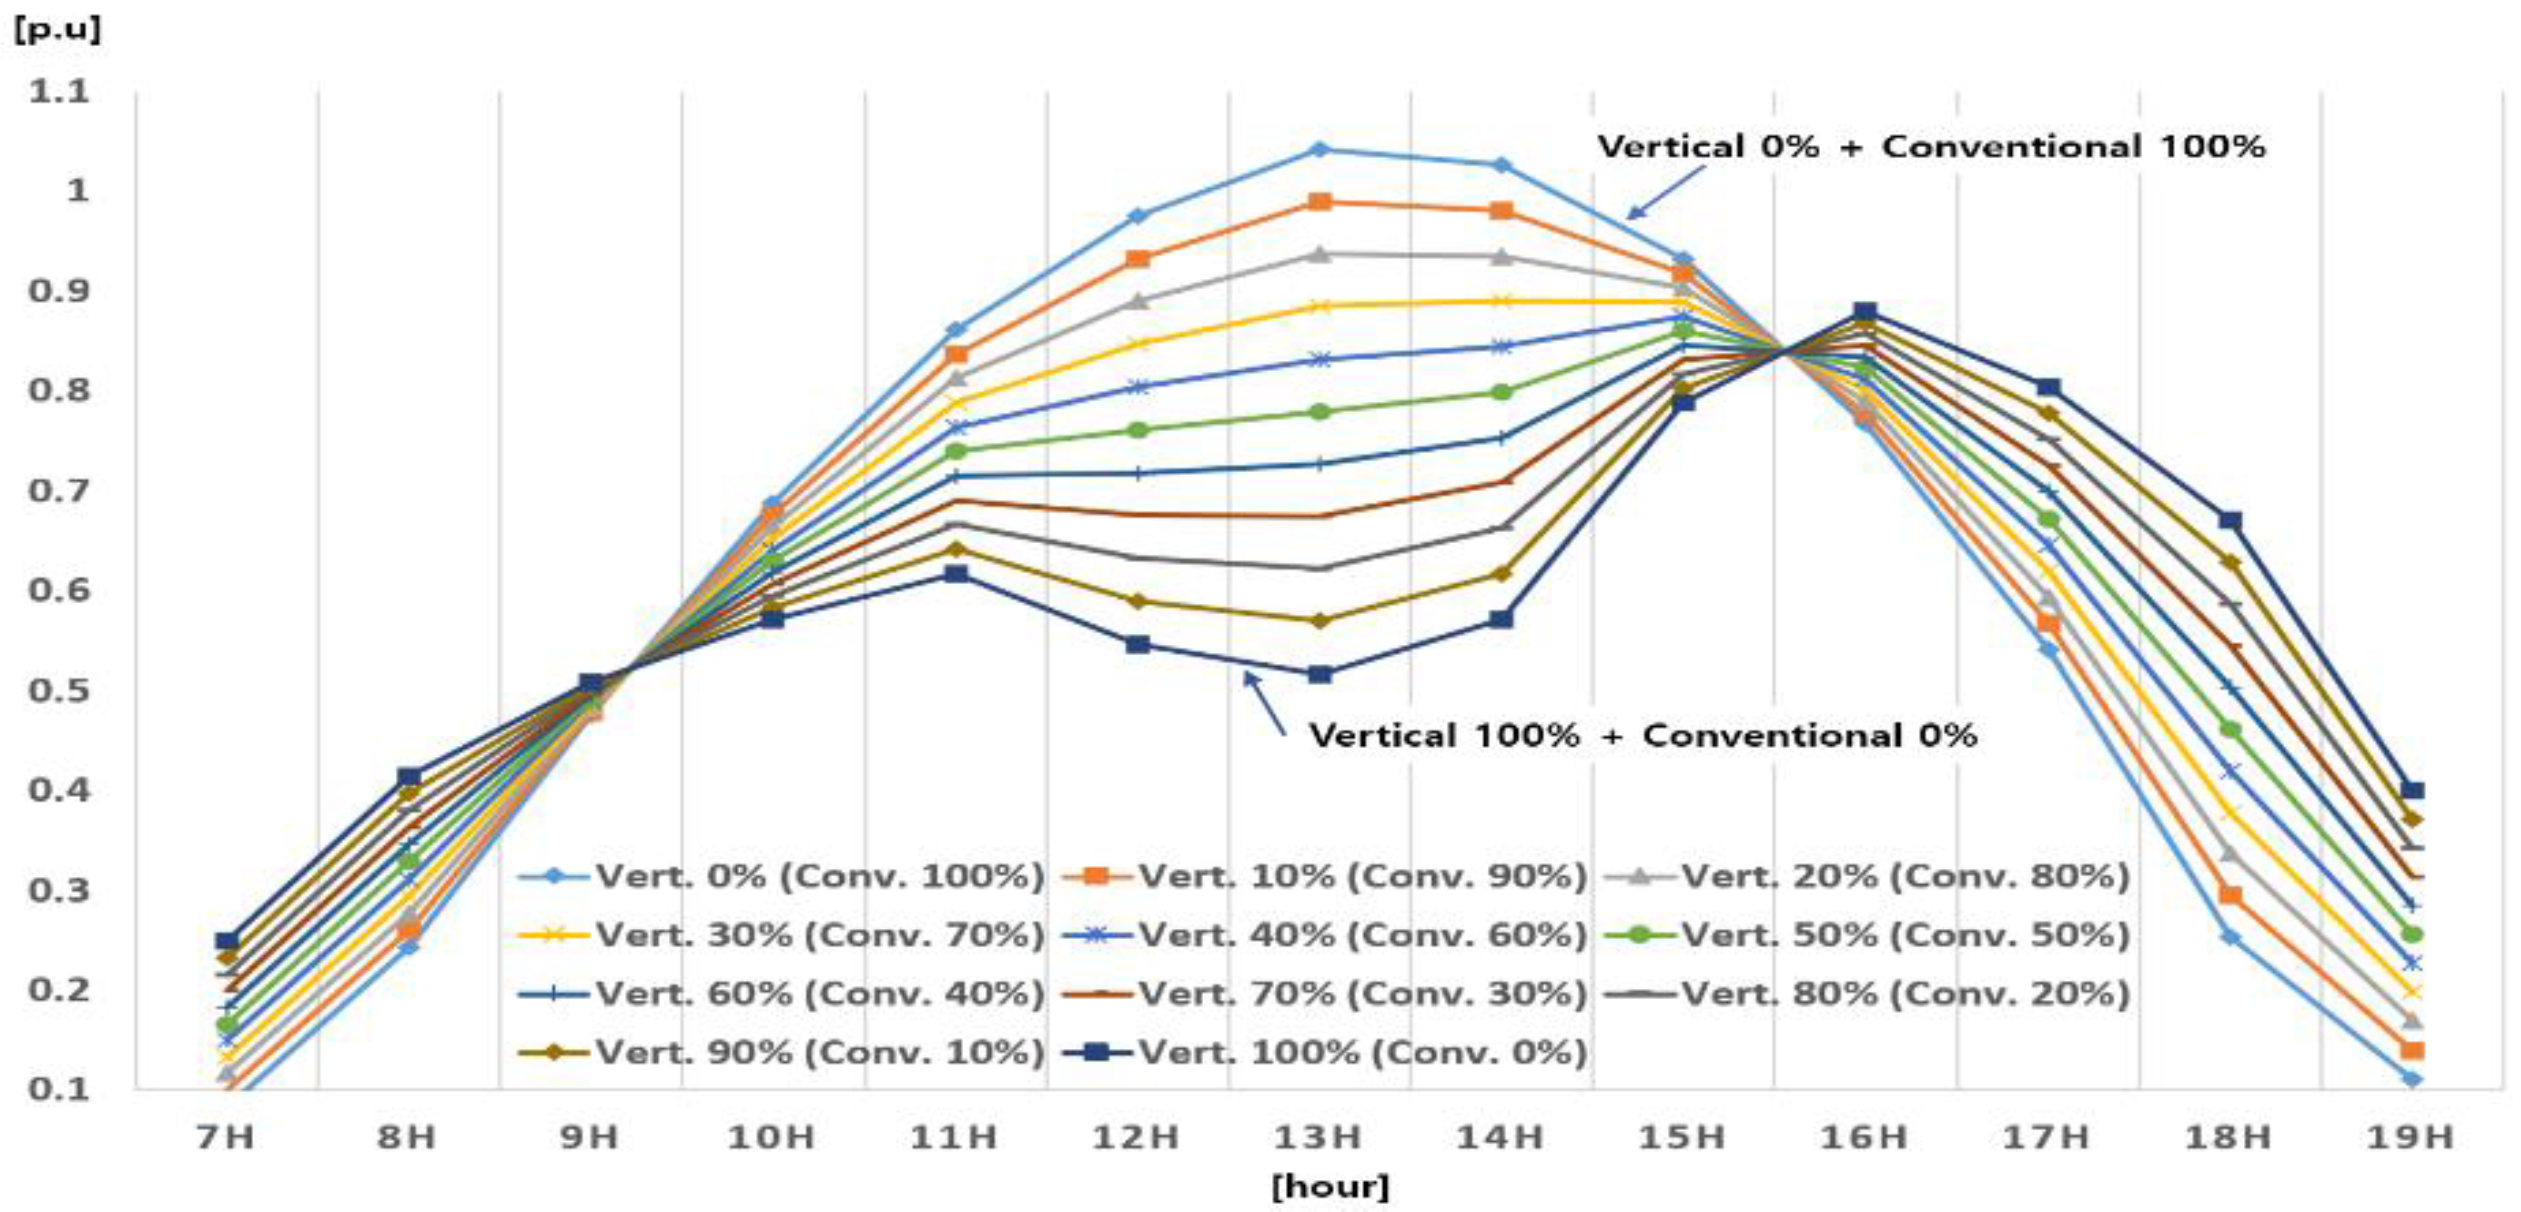
Vertical PV systems exhibit a distinct peak power generation pattern that sets them apart from conventional PV systems. Unlike their counterparts, vertical PV systems have a lower peak output but can generate power during the morning and afternoon periods. In addition, the concentrated generation hours of conventional and vertical PV systems differ. By combining these systems, the overall power output of PV generation systems can be flattened. To achieve this, an analysis was conducted to determine the optimal combination ratio of vertical and conventional PV systems.
The generation patterns utilized in the analysis were created based on operational data collected from January to November 2023. The patterns were generated using the maximum time-of-day output for both conventional and vertical PV systems. The vertical PV system was selected when the front of the bifacial module faced west, and the output patterns were synthesized by varying the ratio of vertical PV generation from 0 to 100% in 10% increments. The output patterns are shown in
Figure 8.
To analyze the smoothing effect of the output, periods when output smoothing is required should be defined. Thus, we chose the time frame from 10:00 AM to 4:00 PM, wherein renewable energy curtailments are the most prevalent on Jeju Island, which experiences a high occurrence of the renewable energy curtailments in South Korea.
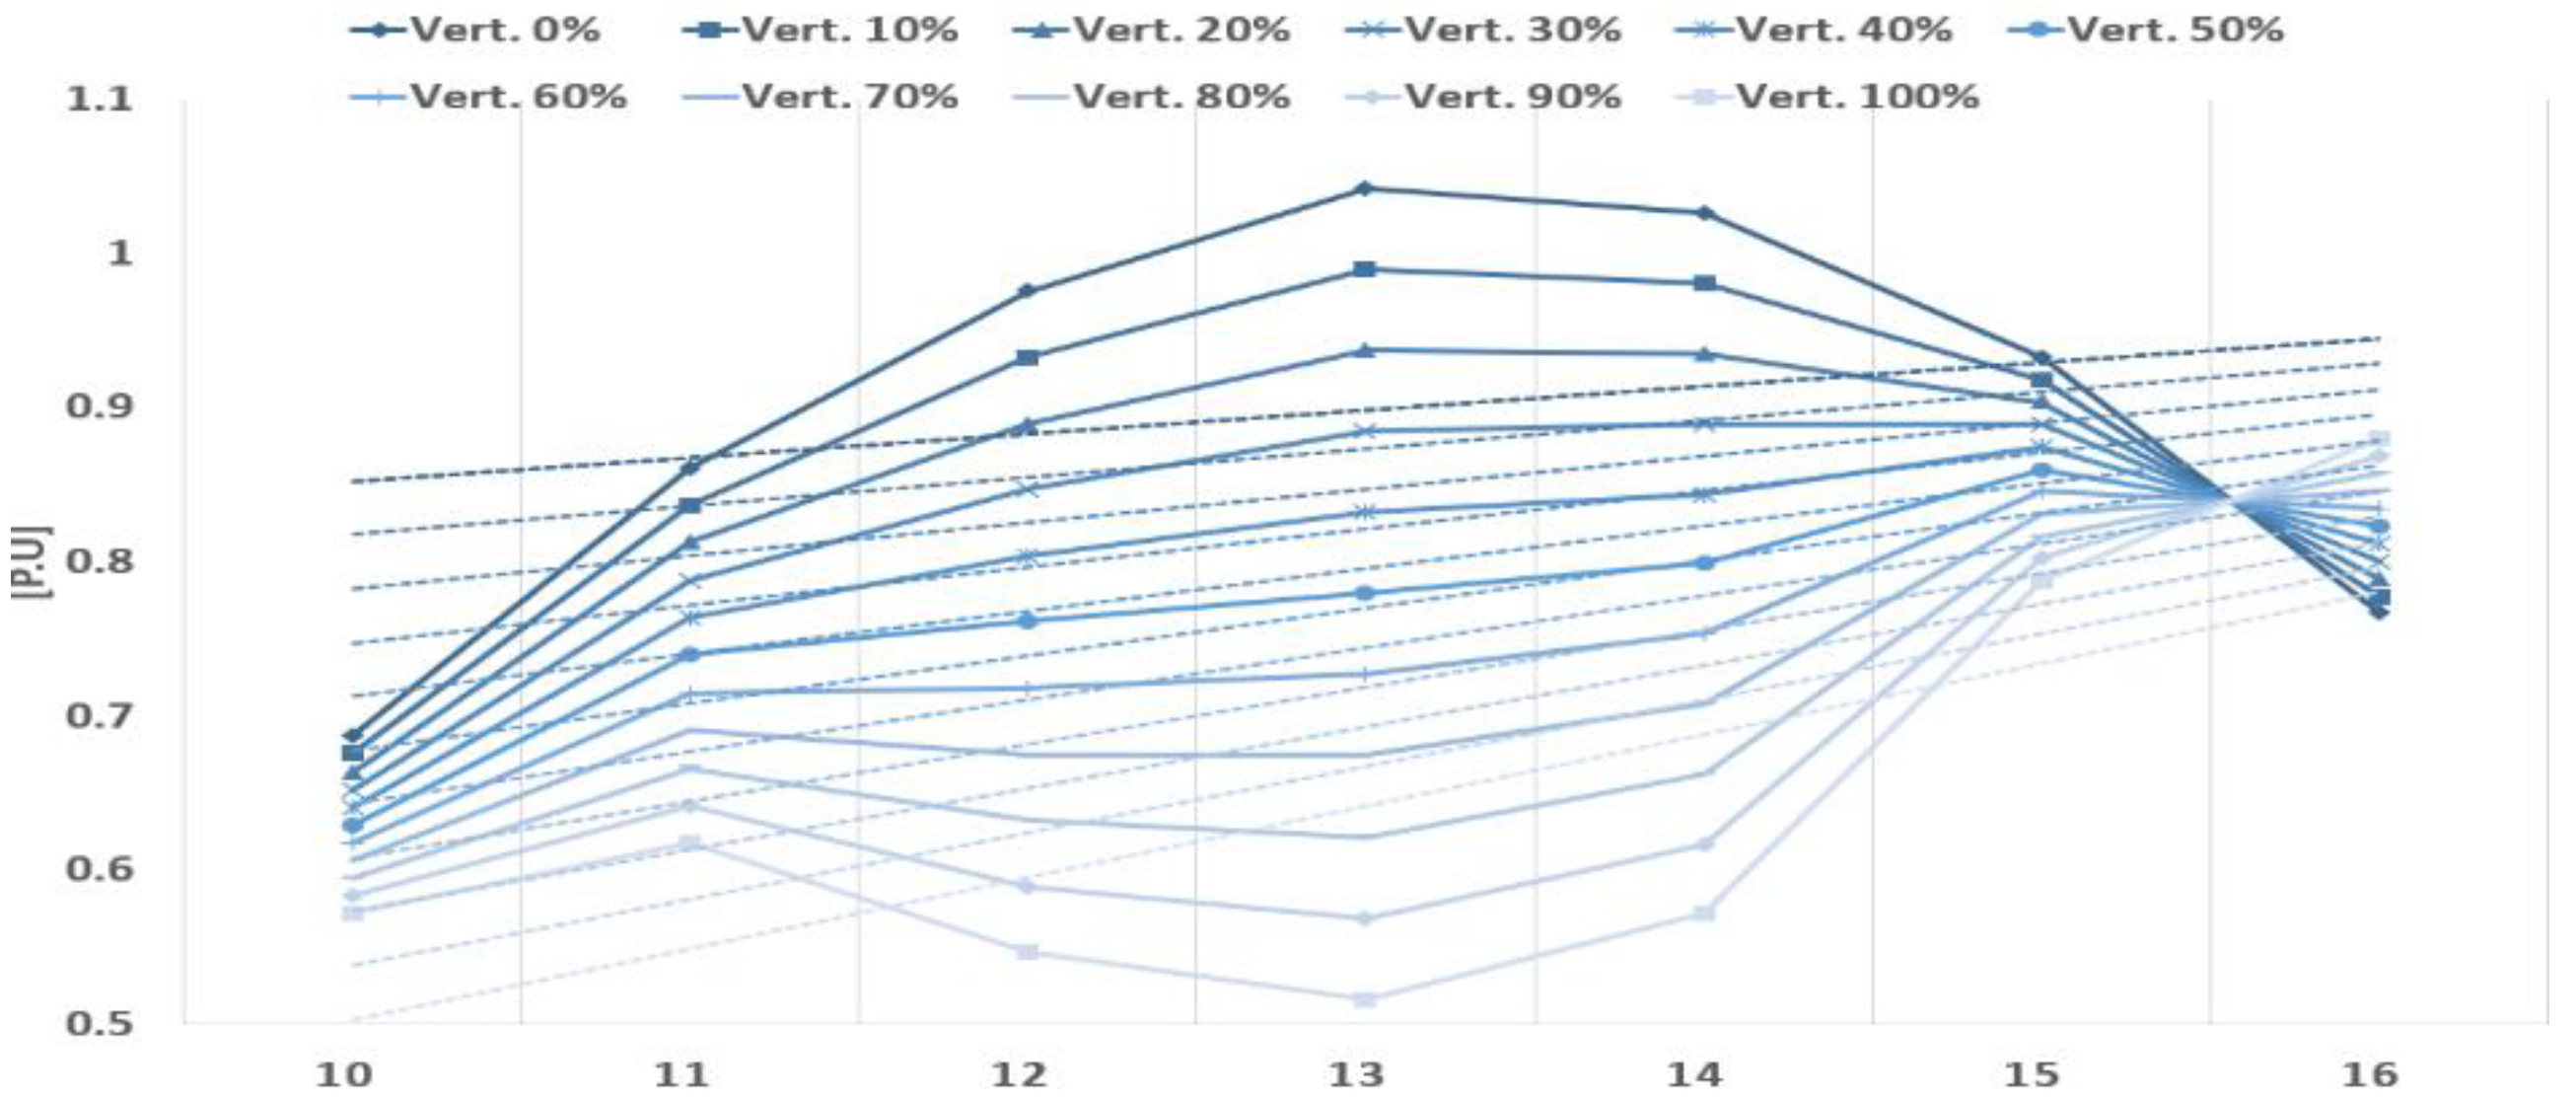
First, linear regression trend lines for the output patterns, from 10:00 AM to 4:00 PM and under different PV composition ratios, are presented in
Figure 9. The analysis focused on the degree of output smoothing, average generation, and deviation for each combination. Same color trend lines are employed to indicate the patterns for each combination.
For a linear function, a slope closer to zero indicates better smoothing, whereas the y-intercept reflects the magnitude of the generation. Goodness-of-fit is indicated by the coefficient of determination (
R2), which indicates how closely the synthesized output aligns with the trend line, essentially measuring the deviation. A slope close to 0,
R2 close to 1, and higher y-intercept are considered advantageous for output smoothing. Additionally, an error analysis using the mean absolute error (
), mean squared error (
), and root mean squared error (
) metrics was conducted to compare the trend lines with the actual generation output. The closer these metrics are to zero, the smaller the deviation between the trend line and generated output, signifying an advantage in terms of smoothing. The formulas for
,
, and
are expressed in Equations (5)–(7), respectively [
20].
Table 5 presents the results for various combination ratios of vertical and conventional PV systems. The
R2 and
/
/
values were relatively excellent for combination ratios ranging from 50 to 70%. However, comprehensive assessments indicated that because the lower slope of the trend line is almost flat, a vertical PV system ratio between 40 and 70% is advantageous.
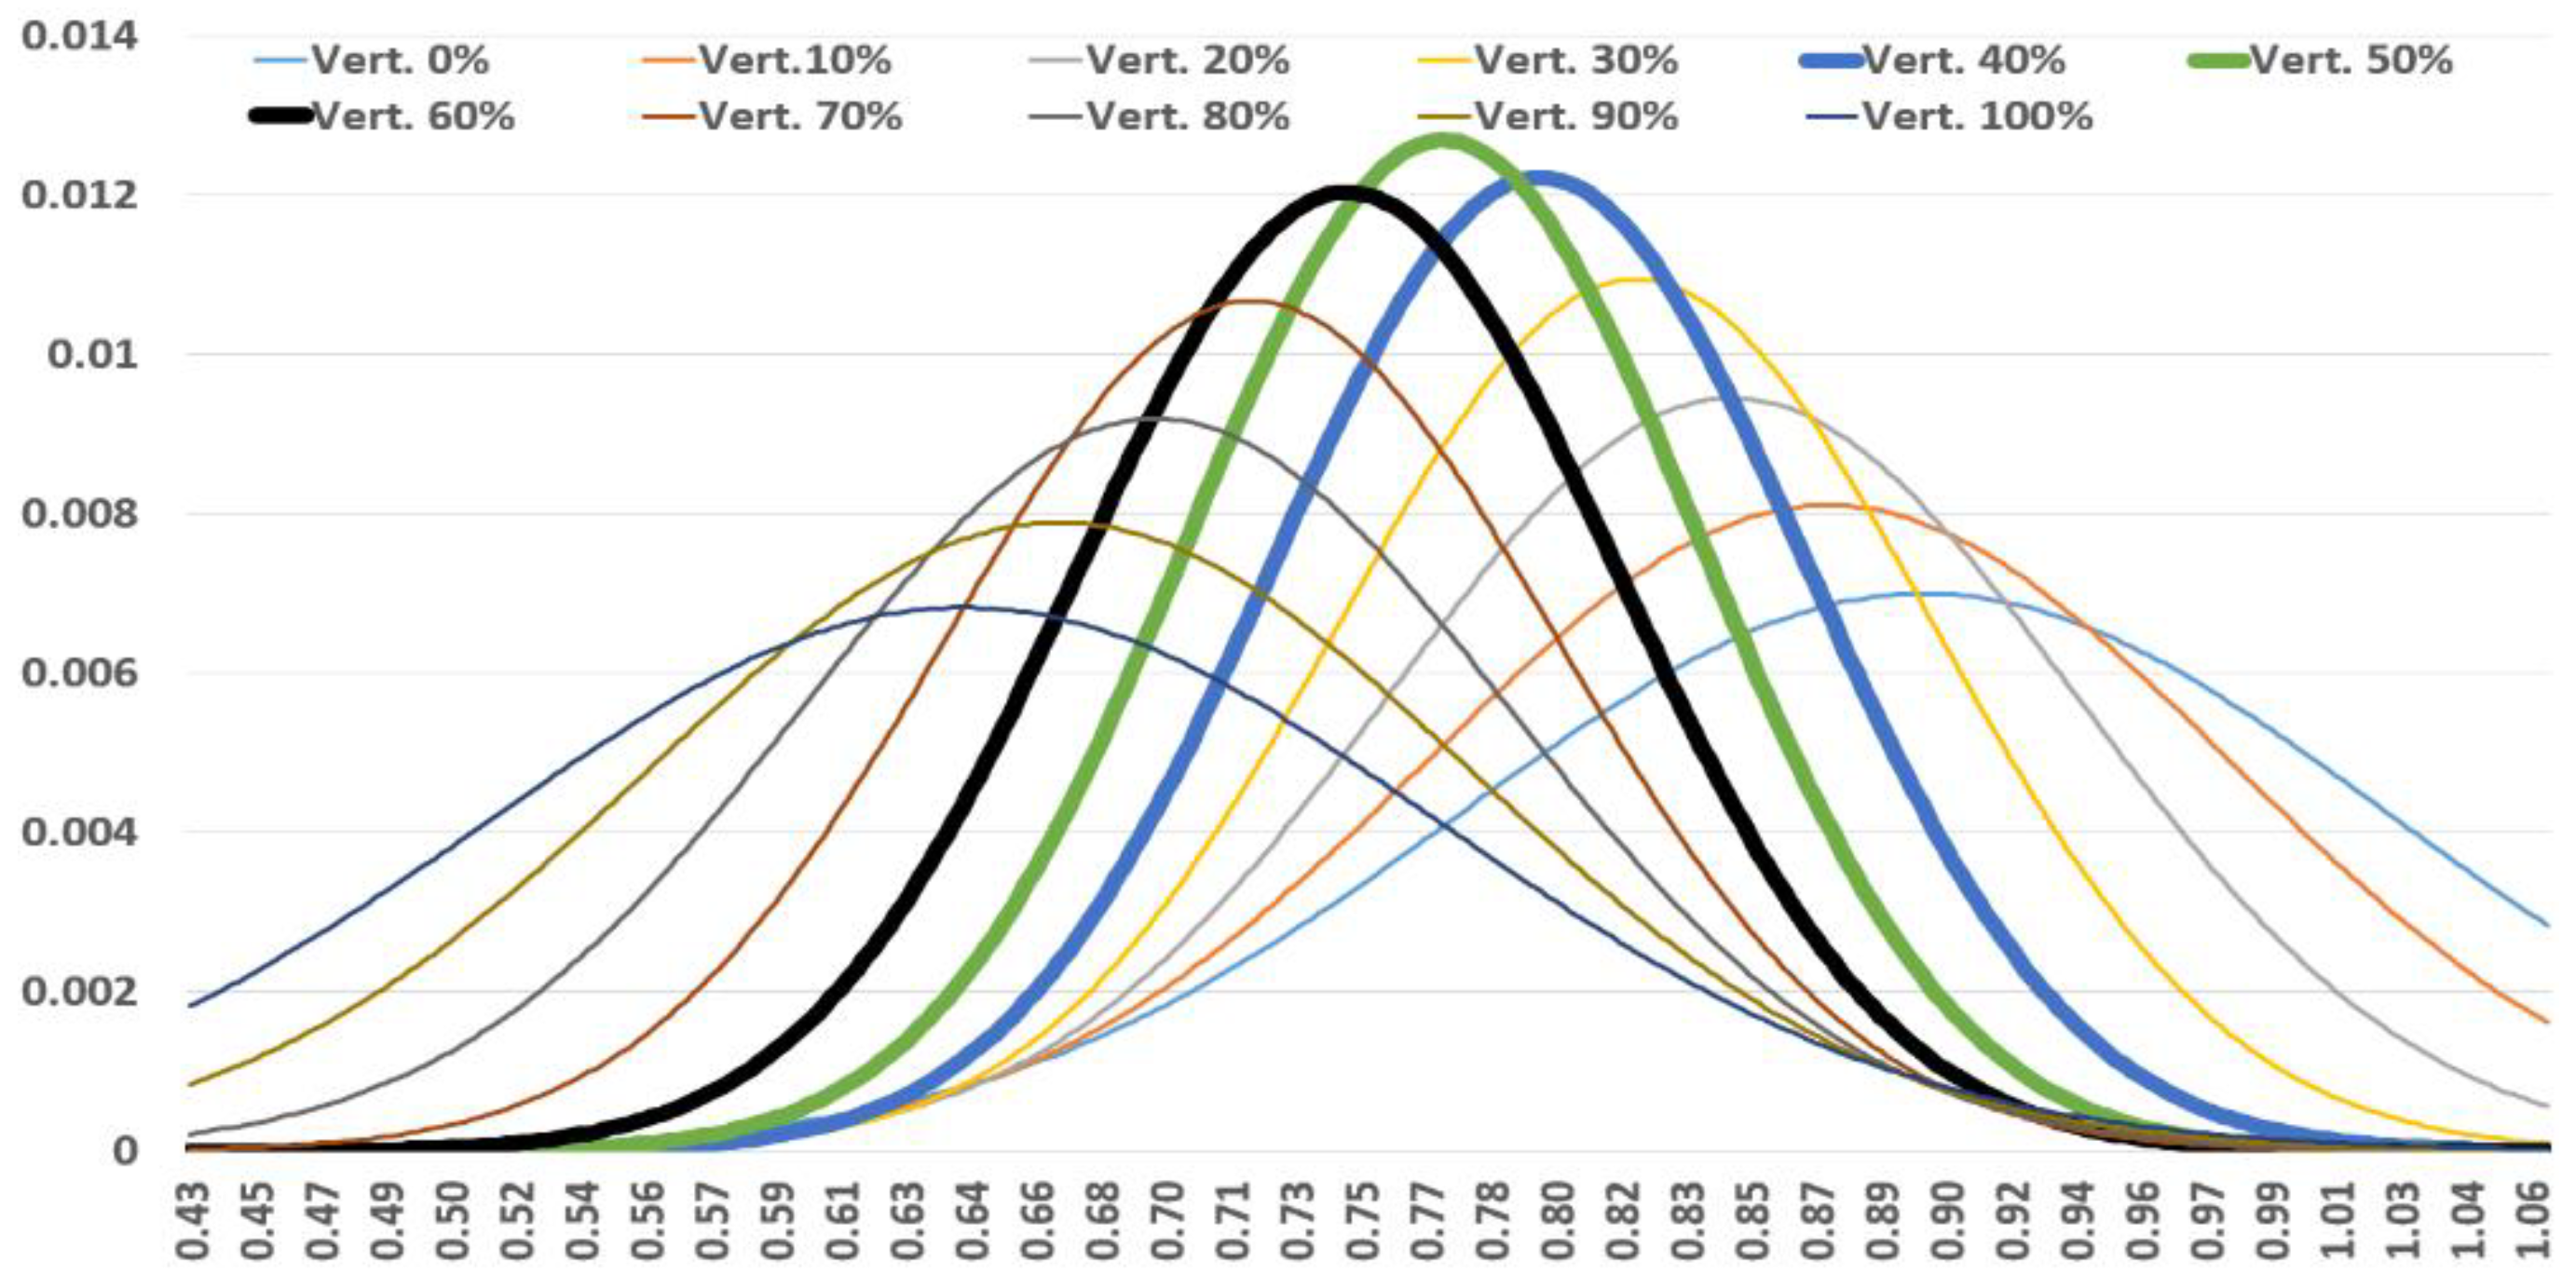
Second, the output for each ratio was represented by a normal distribution function, as shown in
Figure 10. The bold line indicates the range of ratios in which the output between 10:00 and 16:00 deviates less than the mean value. Extreme points and a distribution skewed to the right are advantageous for output flattening. Thus, a vertical ratio of 40–60% can be considered favorable.
Combining the results of the two analyses, we can judge that a range of 40–60% is appropriate. By matching this combined PV generation output with the actual load data and analyzing the voltage fluctuations, the optimal combination for the connected feeder can be determined by considering the balance between generation and demand.
3.3. Thermal Capacity Analysis of the DL
The heat generated by the current in high-voltage lines can result in the thermal degradation of the lines. In the case of a high current that results in significant heat generation, a fire incident may occur. Therefore, the thermal capacity of the line, considering the heat generated by the current, can be calculated using Equation (8). The results obtained through OpenDSS were analyzed by applying the actual line type and specifications utilized in the “H” DL.
where
is the continuous allowable capacity of the line,
is the diameter of the conductor (cm),
is the allowable temperature increase (°C),
is the AC resistance per unit length at the continuous maximum temperature (Ω/cm),
is the solar radiation (W/m
2),
is the heat dissipation coefficient owing to radiation (W/°C·cm
2),
is the heat dissipation coefficient owing to convection (W/°C·cm
2),
is the ambient temperature (°C),
is the conductor temperature (°C), and
is the wind speed (m/s).
In South Korea, the operating capacity of power lines is defined by considering the thermal capacity. This capacity is used to determine the total connecting PV system capacity of the lines.
Continuous allowable capacity refers to the maximum capacity that a power line can operate under. It is calculated by considering the worst weather conditions during the summer (
Table 6).
Moreover, the maximum emergency operating capacity includes a margin for degradation over the continuous allowable capacity. In South Korea, this represents the capacity of a power line to operate for a short period, considering a margin for degradation to prevent accelerated degradation owing to heat. The margin utilized in domestic regulations is 89% [
21].
The normal maximum operating capacity represents the capacity of the power line to operate continuously for an extended period. It is calculated by considering both the maximum emergency operating capacity and reliability through a partial interconnection. In the case of line failure, a partial interconnection is implemented to ensure continuous power supply. In this study, the normal maximum operating capacity was set to 12 MW for the DL as a reference to align with the South Korea standard.
The thermal capacity of the line for the optimal combination of PV systems connected to the “H” DL through OpenDSS is shown in
Table 7. The analysis covered eight months of time-series data for the thermal capacity of the “H” DL, with a PV system capacity of 12 MW, considering different ratios of vertical to conventional PV systems. Based on the results, when the maximum thermal capacity was BPV 10 BVPV 0, 9.768 MVA occurred and is shown in
Figure 11. Within 10 MVA, the limit of the ACSR-160 [mm
2], there was no operational problem.
3.4. Voltage Analysis of the DL
We conducted simulations for each case of combined PV generation based on the “H” DL. The simulation involved deriving the voltage fluctuation ratio, which is a requirement for the operation of 22.9 kV DLs in South Korea. The required voltage maintenance ranged from approximately 20.8 to 23.8 kV (0.909–1.039 p.u.). In this “H” line, the analysis focused on the voltage fluctuation ratio of the connected lines when combined with PV generation, as well as conventional PV generation. The objective was to determine the number of additional combined PV systems that can be connected in compliance with the voltage maintenance range, thereby deriving the effect of improved hosting capacity [
22].
The voltage fluctuation is closely related to the peak power generation of the PV system and can influence the voltage fluctuation when matched with the time-series load data of the lines. The voltage fluctuation levels for each case are shown in
Table 8.
Figure 12 shows the voltage profile of vertical PV 30% and conventional PV 70%. It has lowest maximum voltage increase rate as
Table 8 shows. The maximum voltage increase rate was 6.67%.
These results were based on an analysis of the time-series voltage fluctuations of “H” DL for eight months, considering a PV system capacity of 12 MW with varying ratios of the vertical PV system.
3.5. Enhanced Hosting Capacity
By examining the voltage profiles for each combination, we observed cases in which the time-series values exceeded 3.9% relative to 1 p.u. However, we validated that stable operation could be achieved in all scenarios by adjusting the voltage range to 21.5 kV through the transmission voltage control (on load tap changer control) implemented in actual substations.
Under the conditions of “H” DL, the most favorable effect on the hosting capacity improvement was achieved when a 60~80% ratio of the vertical PV system was employed, as shown in
Table 9. Therefore, the optimal combination ratio for improving hosting capacity can be determined to be 60% among the ratios of 60 to 80% because the lower the ratio of vertical PV, the higher the PV power generation.
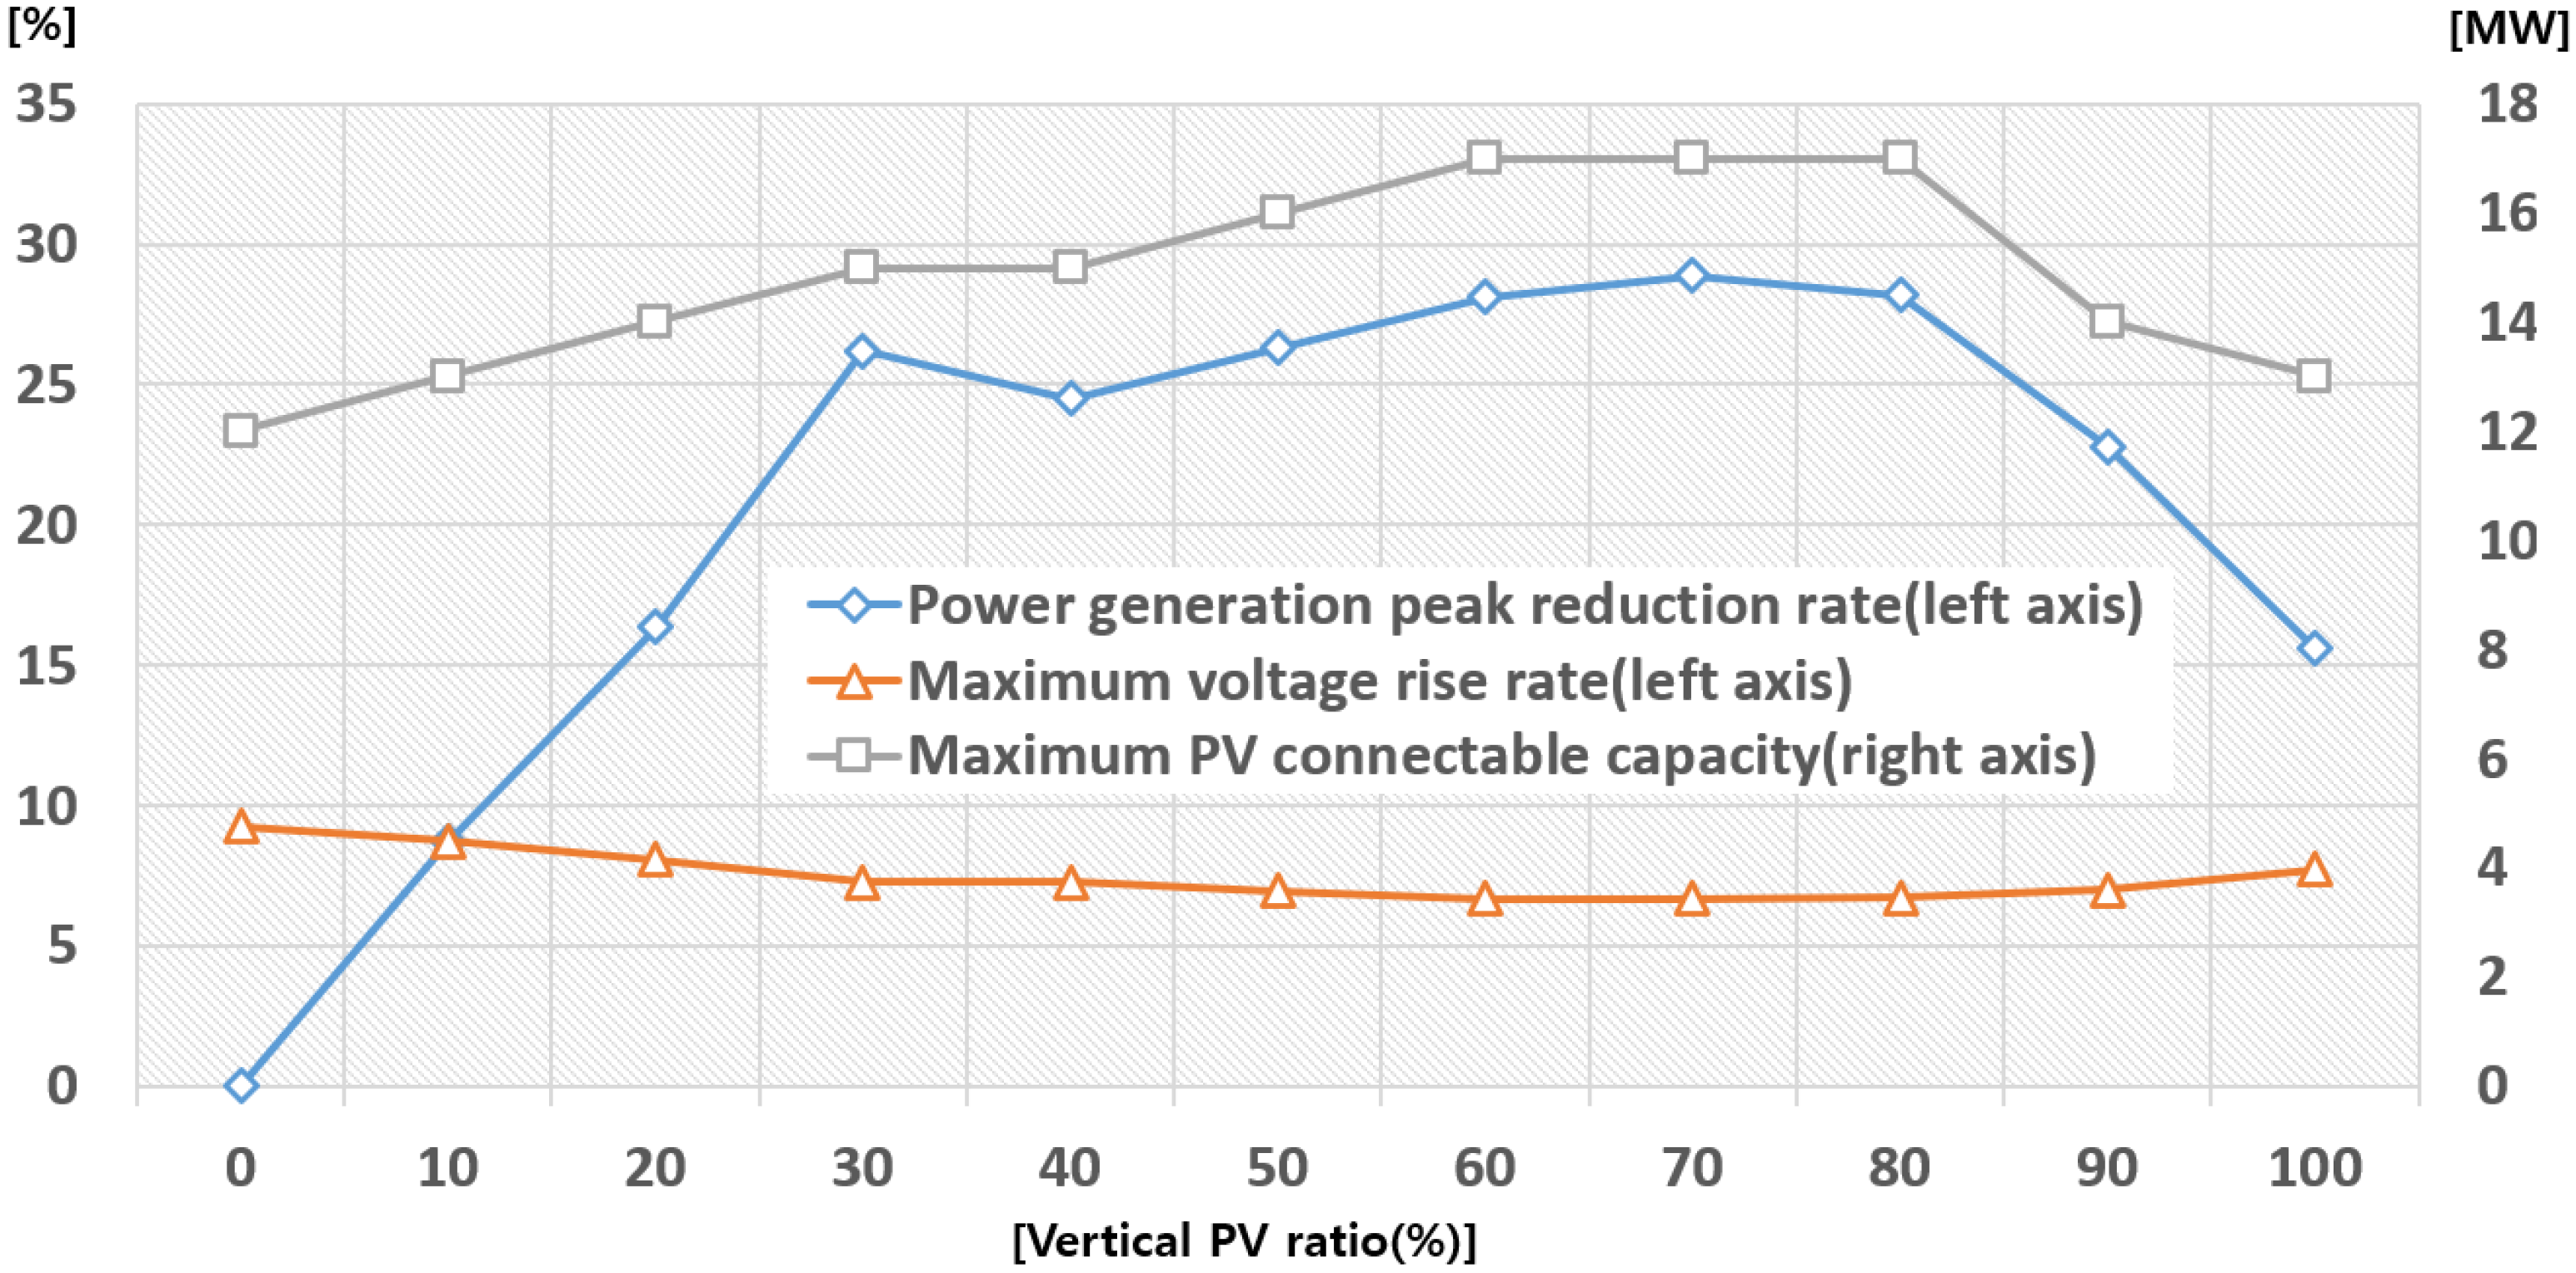
In
Figure 13, The orange line represent the maximum voltage increase rate as shown in
Table 8. The gray line represents the enhanced hosting capacity values of the vertical to conventional PV system ratio shown in
Table 9.
4. Conclusions
This study proposed a strategy to enhance the hosting capacity of PV systems by utilizing vertical PV systems with bifacial modules on a DL. The objective was to connect more PV systems while maintaining the line condition. To analyze the effectiveness of this strategy, we exploited the characteristics of output leveling by combining the outputs of vertical and conventional PV generation. Simulations were conducted based on actual PV generation data from January to November 2023. A quantitative analysis of the smoothing degree of the combined PV output was performed using a trend line and normal distribution function. The smoothing effect was relatively better when vertical PV accounted for 40–60% of the total capacity when both types of PV were combined. The OpenDSS software, which is advantageous for distribution system analysis, was utilized to validate the feasibility of the derived combined PV system. The model considered a DL where actual PV connection delays occurred, and the voltage fluctuation owing to the connection of the combined PV system was analyzed based on actual load information. Under the selected DL condition, the optimal combination ratio was determined to be 60%, resulting in a hosting capacity improvement of 40%. This indicates that an additional 5 MW could be connected to the 12 MW DL. Furthermore, an OpenDSS analysis of the thermal capacity based on the current flowing through the line revealed there were no constraints on continuous operation, even with the additional PV system.
Thus, if the utility operator connects conventional PV systems at an appropriate ratio by considering the vertical PV systems that are gradually being introduced into the grid, more PV systems can be connected than the PV connection capacity based on the DL. Therefore, financial gains can be achieved by delaying the installation of connecting lines.
Furthermore, the PV combinations proposed in this study that employ both vertical and conventional PV systems are expected to increase the utilization rate of the connection line. This could alleviate the issues of renewable curtailments and the Duck Curve phenomenon in the power grid caused by a sharp increase in the conventional PV system capacity [
23].
Notably, the effects of enhancing the hosting capacity may vary based on the types of modules utilized, conditions of the connected line, and load patterns. Therefore, case-specific preliminary analyses are necessary during project planning, and the hosting capacity can be enhanced by optimizing the combination ratio for each project. This study derived the results of using a silicon-based bifacial solar module. If multi-junction solar cells based on thin-film solar cells, which have been actively researched recently, become large enough to be applied to power generation projects and the technology becomes more mature, similar effects can be obtained, especially in urban areas.


