Abstract
With the increasing penetration of renewable energy resources,
their variable, intermittent and unpredictable characteristics bring new challenges to the power system. These challenges require micro-meteorological data and techniques to provide more support for the power systems, including planning, dispatching, operation, and so on.
This paper aims to provide readers with insights into the effects of micro-meteorology on power systems, as well as the actual improvement brought by micro-meteorology in some power system scenarios. This paper provides a review including the relevant micro-meteorological techniques such as observation, assimilation and numerical techniques, as well as artificial intelligence, presenting a relatively complete overview of the most recent and relevant micro-meteorology-related literature associated with power systems. The impact of micro-meteorology on power systems is analyzed in six different forms of power generation and three typical scenarios of different stages in the power system, as well as integrated energy systems and disaster prevention and reduction. Finally, a case study in China is provided. This case takes wind power prediction as an example in a power system to compare the performance when applying micro-meteorological data or not. The experimental results demonstrated that using the micro-meteorological reanalysis dataset with high spatial--temporal resolution for wind power prediction performed better, verifying the improvement of micro-meteorology to the power system to some extent.
1. Introduction
The current global demand for energy is still growing [1]. Fossil fuels, as the traditional main energy source, cause environmental and health problems [2,3]. The combustion of fossil fuels emits large amounts of greenhouse gases, leading to serious problems such as climate change [4], and posing a threat to humanity [5,6]. Therefore, governments have revisited energy strategies and policies to reduce negative impacts [1], and at the same time, a range of methods have been implemented to effectively curtail greenhouse gas emissions and alleviate related challenges, e.g., promoting clean and renewable energy resources [7,8], developing new devices with minimal environmental impact [9,10] and enhancing current technologies’ efficiency [11,12]. Among these suggested methods, transitioning to renewable energy resources is one of the most promising methods to reduce greenhouse gases and secure energy supplies [1].
As renewable energy gradually replaces fossil fuels, the proportion of renewable energy in power generation continues to increase. However, as the penetration rate of renewable energy continues to increase, the variable, intermittent and unpredictable characteristics of renewable energy resources such as wind and solar energy bring new challenges (e.g., flexibility and stability) to the power system [13].
One of the main reasons for these challenges is that the output of various renewable energy resources in the power system is determined by underlying meteorological factors [14,15]. Some researchers have focused on the effect of weather information (especially with high temporal–spatial resolutions) on power systems [16,17,18]. Weather models are capable of delivering relevant predictions in the planning and operation of power systems [17]. Therefore, meteorology-related data and technologies can provide support for dispatching, distribution, operation and maintenance in power systems. Meteorology plays a vital role throughout the complete lifecycle of power operation (including energy project planning and site selection, design selection, construction, operation, maintenance management, and so on) and among various different forms of power generation. Therefore, meteorological data and technologies are inevitably a cornerstone in power systems.
Focusing on the requirement of higher temporal–spatial resolutions in planning, optimization and other models in power systems [16], this paper targets micro-meteorology. This paper is devoted to presenting the association between micro-meteorology and new power systems, and analyzing the role of micro-meteorology. Micro-meteorology studies the interaction of the lower atmosphere with the Earth’s surface [19]. Compared with general meteorology, micro-meteorology focuses on the lower atmosphere, which is closer to the surface, and finer scales. Micro-meteorology is able to provide support for dispatching, distribution, operation, maintenance, etc. within the power system. For example, as large-scale wind power and photovoltaic power are integrated into the power system, the uncertainty of wind power and photovoltaic power pose severe challenges to the balance and dispatch of the power system. Accurate high-resolution gridding observation and micro-meteorology forecasting can establish a solid foundation for accurately predicting power output and load, providing excellent support for power spot market transactions. Furthermore, renewable energy stations are often dispersed over a wide area, with weak resilience in withstanding meteorological disasters. Therefore, high-quality micro-meteorological early warnings can provide great help in preventing losses, casualties, etc., caused by meteorological disasters.
Therefore, this study focuses on examining and analyzing the influence of micro-meteorology on new power systems, and provides real cases for evaluation and support. There are three parts of this work, i.e., (1) a brief review of power-system-related micro-meteorology technologies, (2) a detailed analysis of the impact of micro-meteorology in new power systems, and (3) a case study about a micro-meteorology reanalysis dataset from desert, Gobi and desertification land, and the evaluation of wind power prediction in this micro-meteorological dataset. The overall framework of this study is shown in Figure 1.
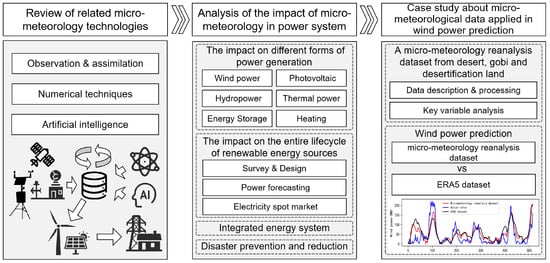
Figure 1.
Overall framework of this study.
(1) Review of power-system-related micro-meteorology technologies. This paper surveys several micro-meteorological fields related to the power system (i.e., observation and assimilation, numerical technologies and artificial intelligence), providing a brief introduction of the recent and common-used micro-meteorological technologies applied in power systems. Specifically, this paper reviews the micro-meteorological technologies from three aspects, i.e., observation and assimilation, numerical technologies and artificial intelligence. Observation, assimilation and numerical technologies are the most commonly used micro-meteorological technologies in power systems, involving micro-meteorological data acquisition, micro-meteorological data refinement processing, micro-meteorological feature forecasting, etc. Moreover, with the development of artificial intelligence, artificial-intelligence-based methods present great competitiveness in various micro-meteorological fields, e.g., weather forecasting and downscaling. Therefore, this paper specifically reviews the literature related to micro-meteorology based on artificial intelligence in recent years, which has utilized or has huge application potential in power systems.
(2) Analysis of the impact of micro-meteorology in new power systems. A detailed analysis of the impact of micro-meteorology in new power systems is presented in this study from four aspects, i.e., the impact on different power generation forms, the impact on the entire lifecycle of renewable energy power operations, the integrated energy system, and disaster prevention and reduction. In order to analyze the impact on different power generation forms, this paper discusses how micro-meteorology affects power operation and output of different power generations, as well as the differences in impacts caused by different micro-meteorological factors. For the analysis of the impact on the entire lifecycle of renewable energy power operations, three typical scenarios are selected, corresponding to the early, middle and late stages of the entire lifecycle, respectively, (i.e., survey and design, power prediction, and electricity spot market trading). Regarding the latter two aspects, this paper analyzes the role of micro-meteorology in the integrated energy system and introduces the support for disaster prevention and reduction.
(3) Case study about a micro-meteorological dataset and its evaluation of wind power prediction. This paper presents a case in Jiuquan, China, introducing a micro-meteorological reanalysis dataset constructed in desert, Gobi and desertification land, as well as taking wind power prediction as a representative application for evaluation. Four models are utilized to predict wind power, namely, eXtreme Gradient Boosting (XGBoost), Light Gradient Boosting Machine (LightGBM), long short-term memory (LSTM) and gated recurrent unit (GRU). This paper compares the performance of this micro-meteorological reanalysis dataset with 0.01° × 0.01° resolution and an open source reanalysis dataset (ERA5 [20]) with 0.25° × 0.25° resolution. Two metrics are used for evaluation, i.e., mean absolute error (MAE) and root mean square error (RMSE). The results demonstrate that using the micro-meteorological dataset achieved about 1–3 improvements in MAE and about 1–2 improvements in RMSE, verifying the effectiveness of the micro-meteorological dataset.
The main contributions are as follows:
- This paper reviews the micro-meteorology technology applied and developed in the new power system, including related observations, assimilation, numerical prediction, dynamical downscaling and the artificial intelligence literature.
- This paper analyzes the importance of micro-meteorology in the new power system, including the impact of micro-meteorology on different forms of power generation, the implementation of micro-meteorology in the entire lifecycle of renewable energy power operations, integrated energy system, and disaster prevention and reduction.
- This paper provides a case study in Jiuquan, China to illustrate the importance of micro-meteorology in real applications. Wind power prediction is taken as a representative application to evaluate the performance with a micro-meteorology dataset. The results show that using a micro-meteorological dataset achieved better wind power prediction performance utilized by four common models, presenting the effectiveness of micro-meteorological data.
2. Related Works
This paper chooses Google Scholar (https://scholar.google.com/, accessed on 19 February 2024) as the literature search engine, and uses “power”, “energy”, “meteorology”, “climate”, “weather”, “power|meteorology”, “power|climate”, “power|weather”, “energy|meteorology”, “energy|climate”, “energy|weather”, “meteorological observation”, “assimilation”, “wrf”, “weather|neural” and “weather|learning” as key words during the search process. Google Scholar provides a service to broadly search for the scholarly literature. Researchers can search in Google Scholar across many disciplines and sources: articles, theses, books, abstracts and court opinions, from academic publishers, professional societies, online repositories, universities and other web sites. Google Scholar contains most of the academic literature across various databases. Compared with citation databases such as Web of Science and Scope, Google Scholar provides more literature from various databases, while the quality of the literature varies. Therefore, for the search results corresponding to each key word, the retrieved literature were sorted according to the key word relevance, and the top 500 were manually checked based on publication sources, relevance and year of publication. Especially, the most relevant literature to the production and application was filtered during the checking process, and, ultimately, 89 were cited in this section.
Two statistical analyses of the 89 cited studies are conducted in this section. As shown in Figure 2, the number of studies carried out by different countries or regions was counted. Researchers from America contributed the most literature in this paper, followed by researchers from China. The proportion of the literature from European countries (e.g., the UK, Portugal, Norway and Germany) is also relatively high. Figure 3 illustrates the amount of research published during different periods in this paper. Most of the literature cited in this paper has been published since 2010. The amount of research published from 2015 to 2019 was the highest among all the divided periods. The literature relevant to artificial intelligent emerged after 2015.
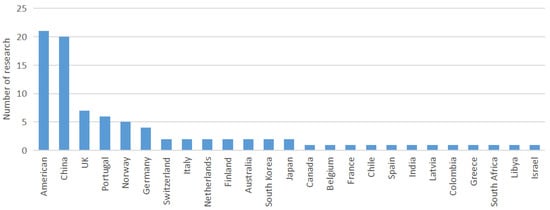
Figure 2.
The amount of research carried out by different countries or regions.
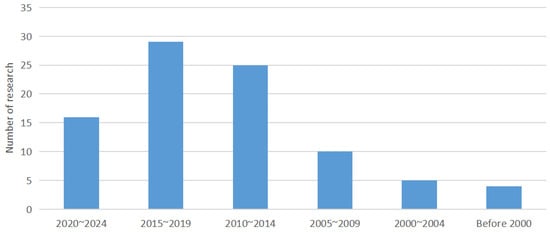
Figure 3.
The amount of research published during different periods.
2.1. Observation and Assimilation
Meteorological observation is a scientific activity that conducts systematic, comprehensive and quantitative observation and recording of the atmospheric environment. It is the basis of modern meteorological science and an important means of weather forecasting and climate research. It is important for meteorological service agencies, scientific research institutions and related industries. Development is also of great significance. The meteorological observation system involves land, sea, air and space, and can be classified into nine categories: radar observation, high-altitude meteorological observation, ground meteorological observation, ground-based remote sensing vertical observation, etc. [21].
With the development of society and the advancement of science and technology, meteorological observation technology is also constantly improving and innovating. Comprehensive meteorological observation technology is one of the most advanced meteorological observation technologies at present. It includes a variety of meteorological observation methods and technologies and can measure the physics of the five major layers of the earth’s climate system: the atmosphere, hydrosphere, cryosphere, lithosphere, and biosphere [22]. It is able to carry out long-term, continuous and systematic observations of chemical and biological characteristics and their changing processes and interactions, thereby providing more accurate and comprehensive meteorological data.
Countries around the world have established meteorological observatories to monitor the physical, chemical, biological, and hydrological aspects [23]. For example, the Blue Hill Meteorological Observatory, situated at the 194 m peak of Great Blue Hill in Milton, MA, USA, was established in 1884/1885 to conduct continuous observations of weather and climate conditions, along with extensive atmospheric science education and outreach activities [24,25]. The Lindenberg Meteorological Observatory, situated roughly 50 km southeast of Berlin’s outskirts in Germany, dates back to 1905 and was created for conducting field measurements of the atmosphere is vertical structure and conducting research [26,27,28,29]. The Sphinx Observatory, located above the Jungfraujoch peak in Switzerland at an altitude of 3571 m, was constructed in 1936/1937 [30]. The Nepal Climate Observatory–Pyramid is situated at an altitude of 5079 m above sea level in the eastern Nepal Himalaya and was installed in March 2006 to observe trace gases, aerosols, and meteorological parameters [31,32]. The China Meteorological Administration (CMA) selected five national climate observatories (including Dali in Yunnan, Zhangye in Gansu, Xilinhot in Neimenggu, Shouxian in Anhui, and Dianbai in Guangzhou), and launched 24 national climate observatories to carry out long-term, continuous, stereoscopic, and integrated observations [23].
In order to carry out power prediction and operation planning more accurately, it is necessary to monitor the micro-meteorological factors, to provide more accurate and higher temporal–spatial resolution micro-meteorological information [15]. Wang et al. designed micro-meteorological disaster monitoring and pre-warning system in the power grid [33]. Gu et al. constructed an integrated micro-meteorological monitoring system composed of meteorological monitoring stations and clusters [15]. Li et al. proposed a system of micro-meteorological data collection and application (SMDCA), including micro-meteorology collection, data transmission, and data application [18].
In addition, the performance of meteorological satellites has been continuously upgraded. Currently, the spatial and temporal resolution of Fengyun meteorological satellite products can reach 250 m [34]. With the continuous development and improvement of smart meteorology, strengthening smart collaborative observation systems and improving high-precision atmospheric live monitoring products are important development directions for micro-meteorological observation technology.
Although observations are critical for estimating the state of the Earth system, they suffer from two key limitations [35]. The first limitation is that observations contain errors, i.e., bias, randomness, and representativeness [36,37]. The second limitation lies in spatio-temporal gaps [38]. It is necessary to fill in the gaps in the observations, and during this process, a model is needed, e.g., linear interpolation or geostatistical approaches based on the spatial and temporal auto-correlation of the observations [38]. For instance, the model could be a chemistry-transport model (CTM) [39], a general circulation model (GCM) [40], a land surface model (LSM) [41], etc., combining chemical equations and heterogeneous chemistry, incorporating the discretized Navier–Stokes equations, and exploiting the transfer of energy between the land surface and the atmosphere, respectively. Therefore, the observations can be extended by the model and the observational gaps are filled. It is desirable to implement automatic or intelligent interpolation methods, that use models to fill observation information gaps. The method that allows such interpolation is data assimilation [38,42].
Data assimilation is an objective approach of combining observational and model information to provide an estimate of the most likely state of the Earth system and its uncertainty [35]. Data assimilation mainly encompasses two broad categories of numerical algorithms, i.e., variational algorithms (e.g., 4-D variational method) and sequential algorithms (e.g., Kalman filter) [43].
The 4-D variational (4D-Var) method is developed based on the 3-D variational (3D-Var) method via incorporating temporal dimension [43]. Minimization is performed within a time window usually of 6 or 12 h, e.g., for chemical data assimilation [39,44]. To make variational methods more efficient, incremental methods are often used, replacing the nonlinear assimilation problem with a series of approximate linear least squares problems [45]. The applicability of 4D-Var in weather forecasting has been demonstrated [46].
The Kalman filter (KF) method [47] is a typical method of sequential assimilation algorithms, in which a recursive sequential algorithm is applied to evolve a forecast. A variant of the KF is the Physical-space Statistical Analysis Scheme (PSAS) [48], which is very effective for systems where the number of observations is much smaller than the model state space dimensions. KF can be generalized to non-linear operators, and the resulting equations is called the Extended Kalman filter (EKF) [43]. Eskes et al. developed a KF method for ozone analysis and prediction [49]. They use observation minus prediction statistics [50] to estimate horizontal error correlations, observation errors, and prediction errors, aiming to reduce the required computer resources. A Variational Kalman filter (VKF) was developed to overcome the limitations of KF and EKF for high-dimensional systems [51], demonstrating comparable results to standard KF and EKF. Following this, Solonen et al. proposed an extension of the VKF to ensemble filtering [52].
Meteorological observation and data assimilation technology are important foundations for micro-meteorological research and the key to application fields such as weather forecasting and climate research. In practice, the spatial and temporal resolution and quality requirements for meteorological observation data are increasing, and micro-meteorological observation and data assimilation technology will become more and more important.
2.2. Numerical Techniques
Traditional numerical techniques used for high-resolution micro-meteorological forecasting and downscaling are generally dynamic forecasting and downscaling techniques. Among micro-meteorological dynamic forecasting and downscaling technologies, the Weather Research and Forecasting (WRF) model is the most common and widely used micro-meteorological forecasting and downscaling technology. WRF is a widely used numerical weather prediction and atmospheric research tool developed by the National Center for Atmospheric Research, the National Oceanic and Atmospheric Administration, and their partners. It is used to model short-term weather forecasts, atmospheric processes, and long-term climate simulations. WRF has higher accuracy than traditional numerical weather prediction models and has higher spatial and temporal resolution, making it an important tool for micro-meteorological research.
In terms of micro-meteorological research and application, WRF has had many successful practices. Heikkila et al. used ERA-40 reanalysis data to drive the WRF model for double-nested downscaling simulations [53]. The results showed that the simulation showed great advantages in the spatial distribution of precipitation, extreme precipitation values, and precipitation frequency. Soares et al. proposed a dynamically downscaled climatology of Portugal, produced by a high resolution (9 km) WRF simulation, forced by 20 years of ERA-Interim reanalysis (1989–2008), nested in an intermediate domain with 27 km of resolution [54]. WRF results at 9 km compare favorably with published results supporting its use as a high-resolution regional climate model. This higher resolution allows for a better representation of extreme events, which is critical for developing mitigation/adaptation strategies by policy makers and downstream users of regional climate models in applications such as flash floods or heatwaves. Evans et al. used NNRP reanalysis data as the lateral boundary conditions of the WRF model and conducted a 24-year long-term simulation of Australia [55]. The resolution of the main region was 50 km and the resolution of the sub-region was 10km. The results showed that the sub-region can be simulated well. It can obtain the statistical characteristics of precipitation from daily to interannual time scales and can capture the spatial distribution characteristics of precipitation anomalies related to ENSO anomaly years. Zhang et al. used the WRF model to conduct a triple nested simulation of the United States [56], and the results proved that increasing the resolution can significantly improve the precipitation simulation effect. In East Asia, relevant studies also showed that the WRF model can simulate the overall characteristics of the East Asian monsoon system and the characteristics of the regional precipitation diurnal cycle, and is a good downscaling tool [57,58,59]. Liu et al. developed a multi-scale four-dimensional weather data assimilation and large eddy simulation system WRF-RTFDDA-LES [60]. They used the Newton relaxation method to assimilate observation data on kilometer-level mesoscale model grids for large eddy simulation and realize weather forecasts. Weather forecasts on nested grids from large scale (~2000 km) to small scale (~100 m) can capture the wind field characteristics and micro-scale airflow inside many wind farms. Cardoso et al. presented and evaluated precipitation from a high-resolution WRF climate simulation against daily gridded observations in the Iberian Peninsula [61]. The simulation with higher resolution displays a remarkable improvement in representing Iberian precipitation patterns across all time scales, emphasizing the representation of variations and extreme weather statistics. KUSAKA et al. adopted the WRF model at a 3 km horizontal grid increment to achieve dynamical downscaling and predicting heat stress in August 2070 for the Tokyo, Osaka, and Nagoya metropolises [62]. Yang et al. employed the WRF model, coupled with a single-layer Urban Canopy Model, to simulate urban climate in Nanjing, located in eastern China. Drawing from the results of simulations spanning ten summers between 2000 and 2009, they found that the WRF model has the capability to capture high-resolution features of urban climate in the Nanjing area [63]. Marta-Almeida et al. studied a high resolution atmospheric modelling for a 20-year recent historical period [64]. The dynamic downscaling approach adopted used the Max Planck Institute Earth System Model (MPI-ESM) to drive the WRF running in climate mode. Three online nested domains were used covering part of the North Atlantic and Europe, with a resolution 81 km, reaching 9 km in the innermost domain which covers the Iberian Peninsula. To sum up, the WRF model has good capabilities in dynamic forecasting and downscaling and is currently widely used in actual operations.
WRF is also widely adopted in energy-related meteorological and resource fields. Carvalho et al. evaluated the performance of the WRF model in wind simulation under different numerical and physical options for an area of Portugal located in complex terrain and characterized by its significant wind energy resource and compared the results of six different WRF simulations on the wind data collected at thirteen wind measuring stations located in Portugal in areas of high wind energy potential [65,66]. Deppe et al. used the WRF model with 10 km horizontal grid spacing to explore improvements in wind speed forecasts at a typical wind turbine hub height (80 m) [67]. They evaluated version 3.1.1 of the WRF model to accurately reproduce 80 m wind speeds and ramp events by comparing WRF simulations using six different planetary boundary layer (PBL) schemes to observations of 80 m wind speed gathered at the Pomeroy, Iowa wind farm site. Aiming at estimating offshore wind power potential for the central coast of Chile, Mattar et al. adopted the WRF model to simulate wind fields at the regional level on the wind speed data from in situ stations and ERA-Interim reanalysis [68]. Wind field simulations were performed at different heights (20, 30, 40 and 140 m.a.s.l.) and a spatial resolution of 3 × 3 km for the period from 1 February 2006 to 31 January 2007, which comprised the entire series of in situ data available. Tuy et al. used the WRF and Sentinel-1 level 2 ocean (L2 OCN) products to assess the offshore wind power potential in Cambodia, aiming to evaluate potential sites and to estimate the annual energy production (AEP) and equivalent CO2 reduction [69]. The model was initially calibrated and validated against observed onshore winds at four weather stations before its main simulation for the two-year study period of 2018–2019.
Zhao et al. proposed a new multi-step forecasting method for operational wind forecast, using 96 steps of the next day, termed the CS-FS-WRF-E model, which is based on a WRF ensemble forecast, a novel Fuzzy System, and a Cuckoo Search (CS) algorithm [70]. This novelty model outperformed other approaches in different wind farms and was used for operational wind forecasting within acceptable computations. Next, they proposed to divide multi-step forecast into waves based on their synoptic backgrounds and developed a new multi-step forecasting method termed CSFC-Apriori-WRF, providing a one-day-ahead wind speed and power forecast consisting of 96 steps [71]. For the stability conditions evaluation of the marine atmospheric boundary layer (MABL) in an offshore wind farm development, the WRF model has been applied over the North Sea during March 2005 [72]. The performance of the WRF model was analyzed for sensitivity to different horizontal resolutions, input datasets, PBL parameterizations, and nesting options. When comparing the model results with other modeling studies and high-quality observations recorded at offshore measurement platform FINO1, it was found that the combination of ERA-Interim reanalysis data and the 2.5-level MYNN PBL scheme successfully simulated the MABL over the North Sea. Salvação et al. presented a ten-year wind hindcast for the Iberian Peninsula coast and conducted simulations with the WRF model at a spatial resolution of 9 and 3 km with a 6-hourly output [73]. Prósper et al. performed high-resolution (333 m) WRF forecasting for a farm in complex terrain and conducted detailed validation with observations at the nacelle of each turbine for one full year [74]. The results showed that the forecasts were very skillful with wind speed MAE = 1.87 m/s and wind power NMAE = 14.75%.
2.3. Artificial Intelligence
In recent years, innovative applications of fundamental theories such as mathematics, probability, and statistics, coupled with the widespread adoption of high-performance computing capabilities and the increasing availability of massive data, have propelled the rapid development of artificial intelligence (AI) technology. This has fostered the emergence of a new scientific research paradigm known as “AI for Science”, providing researchers with novel methods and tools to enhance the accuracy of weather prediction and forecasting [75,76]. Grover et al. explored forecasting weather as a data-intensive challenge [77]. They proposed a hybrid approach and utilized a deep neural network to model the joint features of meteorological variables. The experiments on real-world meteorological data highlighted the promise of this approach. Volkovs et al. proposed a novel deep learning method for weather forecasting [78]. They primed the model states with atmospheric data, which achieved better results.
AI has already been applied to various finer-divided areas such as temperature forecasting, short-term precipitation forecasting, ENSO prediction, numerical forecasting model interpretation, remote sensing, extreme weather events identification and prediction, and so on [79,80,81,82,83,84,85,86,87,88,89,90,91,92]. For example, on the issue of short-term precipitation forecasting, researchers have developed numerous short-term precipitation forecasting methods based on Doppler radar echo data and machine learning, and have been well verified in operational applications [83,93]. Agrawal et al. proposed the MetNet nowcast precipitation forecast model based on satellite cloud images (GOES) and radar data (MRMS) [94]. They adopted convolutional downsampling, ConvLSTM structure and attention mechanism, achieving an 8-h precipitation forecast with a resolution of 1 km in the United States. The results demonstrated that the methods performed better than the US NOAA integrated forecast system within the 2-h nowcast time limit. Kaparakis et al. utilized UNet as the core model and proposed the Weather Fusion UNet (WF-UNet) model to investigate its performance for precipitation nowcasting [95]. The WF-UNet model integrates precipitation and wind speed variables as input. In the evaluation in Western Europe, the WF-UNet model performed better compared to other UNet-based methods using only precipitation radar input data.
AI technology has also been widely applied in addressing the resolution challenge [96]. For dynamic modeling, researchers trained dynamic convolutional layers, filtering whose weights are updated dynamically based on inputs during the forward pass, in short-term weather forecasting [97]. Vandal et al. proposed a generalized stacked superresolution CNN framework for statistical downscaling of climate variables [98]. Superresolution refers to the ability of a network to produce an output image with a higher resolution than the input. It was suggested that a single trained model can effectively downscale spatial heterogeneous regions, and the deep learning methods have demonstrated advantages over other techniques. Gentine et al. utilized MLP to learn intricate dynamics like convective heating, moistening, and cloud-radiative transfer feedback from high-resolution simulations, with the aim of replacing multiple existing parameterization methods [99]. Furthermore, the climate modeling community is assembling large datasets to facilitate large-scale big data deep learning [100]. Albert et al. utilized GAN to model urban expansion, which is closely linked to water consumption [101]. Trained on images of 30,000 cities, GAN was able to accurately replicate the realistic patterns and distribution of urban masses without any externally imposed restrictions, such as rules prohibiting the construction of cities on bodies of water. Instead, GAN learned these rules through the training process.
Most recently, large-scale weather forecast models based on deep learning have received great attention and development, becoming a strong competitor of traditional numerical forecast models [102,103,104,105,106,107].
Researchers proposed a data-driven deep learning earth system simulator FourCastNet [102,103]. FourCastNet used the Adaptive Fourier Neural Operator (AFNO) to solve continuous and high-resolution inputs and can generate real-time weather forecasts one week in advance. It is faster than the existing NWP in predicting global weather and generating mesoscale forecasts. It has reached five orders of magnitude and the achieved state-of-the-art accuracy.
Subsequently, Bi et al. proposed a powerful AI-based medium-range global weather forecasting system Pangu-Weather [104]. Pangu-Weather adopted the Swin Transformer as the backbone and designed a three-dimensional Earth-Specific Transformer (3DEST). Earth-specific absolute positional bias related to latitude, longitude and height was introduced to learn the irregular components of each spatial operation. In addition, the Pangu-Weather proposed a hierarchical temporal aggregation strategy and trained four models with different forecast intervals, namely 1-h intervals, 3-h intervals, 6-h intervals, and 24-h intervals. These models were called according to the greedy algorithm. Minimize the number of iterations required to predict meteorological conditions at a specific time. The results on the fifth generation of the European Centre for Medium-Range Weather Forecasts (ECMWF) reanalysis (ERA5) data showed that Pangu-Weather performed well at deterministic forecast and extreme weather forecast, while achieved 10,000 times faster than the Operational IFS.
Next, GraphCast, a state-of-the-art AI model capable of medium-range weather forecasting with unprecedented accuracy, was proposed [105]. GraphCast used graph neural network (GNN) as the basic architecture and adopted an encoding-processing-decoding structural configuration. The encoder mapped the data from the latitude and longitude grid to multi-grid graph nodes to learn features. The processor used a 16-layer deep GNN to learn the information transfer process and update multiple Grid nodes, the final decoder used directed GNN to map the learned multi-grid features back to the latitude and longitude grid and combine them with the input information to form the output. GraphCast was able to predict weather conditions up to 10 days in advance with greater accuracy and speed than the industry gold-standard weather simulation system, the High-Resolution Forecast (HRES), produced by the European Centre for Medium-Range Weather Forecasts (ECMWF).
Following, researchers from the Shanghai Artificial Intelligence Laboratory, University of Science and Technology of China, Shanghai Jiao Tong University, Nanjing University of Information Science and Technology, the Institute of Atmospheric Physics of the Chinese Academy of Sciences, and the Shanghai Central Meteorological Observatory, released the large-scale global medium-range weather forecast model called Fengwu [106]. The model was built based on multi-modal and multi-task deep learning methods. It utilized multi-modal neural networks and multi-task automatic equalization weights to solve the problem of representation and mutual influence of multiple atmospheric variables. Fengwu only took 30 s to generate high-precision global forecast results for the next 10 days.
Chen et al. proposed a cascaded deep learning weather forecast system (called Fuxi) that provides a 15-day global weather forecast [107]. Fuxi was an autoregressive model, consisting of three modules, i.e., Cube Embedding, U-Transformer and a fully connected layer. It used the weather parameters of the first two time steps as input to predict the weather parameters of the next time step (one time step is 6 h), and used an autoregressive multi-step loss to reduce the cumulative error over long lead times. Experimental results showed that Fuxi achieved 15-day forecasts.
Details of the current large-scale global weather forecast models are compared in Table 1.

Table 1.
A summary of the current large-scale global weather forecast models.
3. Analysis
3.1. The Impact of Micro-Meteorology on Power Generation
Micro-meteorology plays a crucial role in the collection and storage processes of various energy sources such as wind power, photovoltaic power, hydropower, and thermal power [108]. Monitoring meteorological changes at a micro-scale in real-time allows for timely adjustments to the operational status of power generation devices, maximizing the capture of renewable energy and optimizing energy storage methods.
3.1.1. Wind Power
The micro-meteorological factors have three main effects on wind power. Firstly, micro-meteorological factors can affect the variations in wind speed and direction. Factors such as terrain, buildings, and vegetation can cause the flow of wind to generate vortices and turbulence, resulting in changes in wind speed and direction in space and time. These factors must be considered in wind farm layout and turbine design to maximize the utilization of available wind energy.
Secondly, micro-meteorological factors can influence turbulence and buffeting effects. Turbulence refers to irregular variations in wind speed and direction, playing a significant role in micro-meteorology. Turbulence can lead to vibration and stress concentration on wind turbine blades, thereby reducing the lifespan and performance of the turbines. Therefore, by measuring and predicting micro-meteorological conditions, it is possible to avoid areas with strong turbulence, reducing vibration and damage to the turbines.
Thirdly, micro-meteorological factors also affect temperature and humidity variations. An increase in temperature can lead to a decrease in air density, which then affects the transmission and conversion efficiency of wind energy. Changes in humidity can also impact air density and wind speed. Therefore, understanding the influence of micro-meteorological factors on temperature and humidity can optimize the operation of wind farms and the performance of turbines.
In practical applications, the collection and processing of micro-meteorological data are critical steps in wind farm construction and operational management. Typically, multiple micro-meteorological observation sites are established at various heights around the wind farm, and the data is transmitted to a central control room for real-time monitoring and analysis through wireless or wired networks. These observation sites measure micro-meteorological parameters such as wind speed, wind direction, temperature, humidity, and other relevant meteorological elements. Through the collection and analysis of these data, the meteorological conditions inside and around the wind farm can be understood, providing effective references and guidance for the operation of wind turbines.
At the same time, researchers also conduct relevant studies and simulations on different micro-meteorological factors [109]. For example, simulations are conducted to evaluate the impact of terrain and buildings on the wind field and to understand the stress distribution on wind turbine blades under different turbulence conditions. Simulations are also carried out to investigate the effects of temperature and humidity variations on the transmission and conversion of wind energy. Through these studies and simulations, a better understanding of the mechanisms by which micro-meteorological factors affect wind power can be achieved, providing a scientific basis for the optimization design and operational management of wind farms.
In conclusion, micro-meteorological factors play a crucial role in wind power, directly influencing the efficiency of wind energy utilization and the reliability of wind turbines. Through in-depth research and real-time monitoring of micro-meteorology, the layout of wind farms and the design of turbines can be optimized, resulting in improved utilization of wind energy and extended lifespan of turbines, thus promoting the development of sustainable energy.
3.1.2. Photovoltaic
Meteorology plays a crucial role in photovoltaic power generation, as it directly influences the performance and operation of photovoltaic systems.
Solar radiation analysis is a key aspect of meteorological observations in photovoltaic power generation. Solar radiation encompasses the process of solar energy propagation in the atmosphere, including total radiation, direct radiation, and scattered radiation, among other components. Solar radiation is the basic energy source for photovoltaic power plants, so accurate measurement and analysis of solar radiation are crucial for assessing the power generation potential of photovoltaic power plants. Meteorological observations allow for the detection of variations in solar radiation across different time periods and seasons, offering a foundation for site selection and power generation forecasting for photovoltaic power plants. In addition, the spatial distribution of solar radiation also affects the layout and installation of photovoltaic power plants. Through the analysis of meteorological data, the optimal tilt angle and orientation of the components can be determined to optimize the utilization of solar radiation resources.
Temperature is another important meteorological parameter in photovoltaic power generation. Temperature directly affects the efficiency and performance of photovoltaic cells. Excessive operating temperature of photovoltaic cells can result in decreased efficiency and diminished power generation. Therefore, comprehending the impact of temperature fluctuations on photovoltaic power generation is crucial. By utilizing meteorological observations and mathematical models, the temperature characteristics of photovoltaic components can be assessed, enabling adjustments in component layout and heat dissipation design to enhance power generation efficiency. Moreover, high temperatures can impact the longevity of photovoltaic components, underscoring the significance of regulating component operating temperatures as a key method to prolong their lifespan.
Wind speed and wind direction are two other meteorological parameters that have a significant impact on the operation of photovoltaic power systems. Strong winds can affect the stability and safety of photovoltaic components, leading to potential damage. Observing the variations in wind speed and wind direction can help take corresponding structural design and protective measures to ensure the normal operation and safety of photovoltaic components. Furthermore, wind can also affect the heat dissipation of photovoltaic components. Appropriate wind speed can help with heat dissipation, lowering component temperature and improving power generation efficiency. Therefore, monitoring and analyzing wind speed and wind direction are necessary in the design and operation of photovoltaic power systems.
Humidity and precipitation are also factors to consider in meteorological observations. High humidity and heavy precipitation can have negative effects on the performance and lifespan of photovoltaic components. Humidity can contribute to the accumulation of dust and dirt on the surface of photovoltaic components, reducing their light absorption capacity. Precipitation can cause water pooling on component surfaces, increasing optical losses and potentially causing electrical short circuits. Through meteorological observations, variations in humidity and precipitation are obtained; thus, appropriate protective measures can be taken to ensure the normal operation and lifespan of photovoltaic components.
In addition to the parameters mentioned above, meteorological observations can also provide a scientific basis for site selection, component layout, tilt angle selection, and power generation prediction in photovoltaic projects. By utilizing meteorological data, the potential and risks of photovoltaic power plants can be assessed, and rational planning and decision-making can be made to improve the performance and economic benefits of photovoltaic power systems. For example, through the analysis of parameters such as solar radiation, temperature, and wind speed, the optimal site for a photovoltaic power plant can be determined to achieve higher power generation. By collecting and analyzing meteorological data, the annual and seasonal power generation of a photovoltaic power plant can be predicted, providing a decision-making basis for its operation and management.
Through meteorological observation and analysis, the impact of factors such as solar radiation, temperature, wind speed, wind direction, humidity, and precipitation on photovoltaic power generation can be assessed. Decisions can then be made regarding component layout, heat dissipation design, protective measures, and power generation prediction to improve the efficiency, reliability, and economic performance of photovoltaic power systems. The study and application of meteorology will provide important support for the development and promotion of the photovoltaic power generation industry.
3.1.3. Hydropower
Micro-meteorology plays an equally important role in the hydropower industry, as it directly affects the operation and efficiency of hydroelectric power plants. In the planning, design, construction, and operation of hydroelectric power plants, the collection and analysis of micro-meteorological data are crucial for ensuring the safety, stability, and efficient operation of the plants. The following will elaborate on the role and impact of micro-meteorology in the hydropower industry.
Firstly, rainfall observation and prediction are among the important applications of micro-meteorology in the hydropower industry. Rainfall is a significant factor in determining the inflow volume and available water resources for hydroelectric power plants. By monitoring rainfall in real time using micro-meteorological observation data and integrating them with meteorological models, precise rainfall predictions can be generated. Precise rainfall forecasts help hydroelectric power plants make reasonable reservoir scheduling to maximize the utilization of water resources and reduce the risks of disasters caused by excessive or insufficient rainfall. Furthermore, rainfall monitoring offers timely alerts and warnings to pertinent personnel at the power plants, empowering them to implement suitable emergency measures for ensuring the safe operation of the plants.
Secondly, temperature observation and its impact are also key applications of micro-meteorology in the hydropower industry. Temperature has a direct influence on the operation and efficiency of hydroelectric power plants. By observing micro-meteorological data, the changes in ambient temperature can be understood, thereby assessing the cooling conditions of the power plants. High temperatures can lead to decreased efficiency and power generation capacity of hydroelectric units, as well as increased heat dissipation loads on the turbines and generating equipment. Through temperature observation and analysis, corresponding measures can be taken, such as increasing cooling equipment and optimizing turbine designs, to improve the efficiency and reliability of the hydroelectric power plants.
Additionally, humidity observation and its impact are also significant applications of micro-meteorology in the hydropower industry. Humidity affects the power generation efficiency and equipment lifespan of hydroelectric power plants. High humidity increases the heat dissipation load on hydroelectric units and may cause surface condensation and corrosion of equipment. By monitoring humidity changes through micro-meteorological observation data, timely adjustments can be made, such as strengthening ventilation and implementing moisture-proof treatments, to ensure the normal operation and extended lifespan of the power plant equipment.
Moreover, wind speed observation and its impact are important applications of micro-meteorology in the hydropower industry. Wind speed is a crucial factor in wind power generation and also has an influence on the operation of hydroelectric power plants. Strong winds may affect the fluctuation of the water surface in reservoirs, thereby impacting the power generation efficiency and safety of hydroelectric units. Real-time monitoring of wind speed through micro-meteorological data, combined with the characteristics of wind power generation, enables wind energy forecasting and adjustments to the power generation plan, maximizing the utilization of wind energy resources.
Furthermore, solar radiation observation and its impact are significant applications of micro-meteorology in the hydropower industry. Solar radiation is the fundamental energy source for photovoltaic power generation and also affects the operation of hydroelectric power plants. The intensity and variations of solar radiation affect factors such as evaporation rates from the water surface and water temperature, which in turn impact the power generation efficiency and reservoir water management of hydroelectric units. Through real-time monitoring of solar radiation using micro-meteorological data, optimization of the power generation plan and scheduling of the hydroelectric power plants can be achieved based on the characteristics of solar energy generation.
By collecting and analyzing micro-meteorological observation data, optimization and improvements can be made in aspects such as rainfall prediction, temperature control, humidity regulation, wind energy utilization, and solar energy generation. These measures contribute to enhancing the power generation efficiency, reliability, and economic viability of hydroelectric power plants, as well as promoting the utilization and conservation of sustainable energy sources. The application of micro-meteorology provides technical support and a decision-making basis for the development of the hydropower industry, making significant contributions to the development of sustainable energy.
3.1.4. Thermal Power
Micro-meteorology also plays an important role in the field of thermal power generated by coal combustion, which is converted into kinetic energy to produce electrical energy, and it has a direct impact on the operation and power generation efficiency of thermal power plants.
Firstly, temperature observation and its impact is one of the key applications of micro-meteorology in the field of thermal power. The combustion process in a thermal power plant necessitates specific temperature conditions to achieve complete fuel combustion and adequate heat supply. Monitoring variations in environmental temperature using micro-meteorological observation data enables the adjustment of boiler operating parameters in thermal power plants to sustain the required combustion temperature. Simultaneously, micro-meteorological data can aid in forecasting the evolving trends in atmospheric temperature, facilitating the development of a sound heating plan and adjustments in thermal power operations to ensure the stable and efficient power generation of the thermal power plant.
Secondly, humidity observation and its impact are also one of the important applications of micro-meteorology in the field of thermal power. Humidity has a direct impact on the combustion process and environmental pollutant emissions of thermal power plants. High humidity may cause incomplete combustion of fuel and increase the water content in the flue gas, thereby reducing the combustion efficiency and environmental emission quality of thermal power plants. By monitoring the changes in humidity in real-time through micro-meteorological observation data, and combining the impact of humidity on combustion, the operating parameters and control equipment of thermal power plants can be adjusted to ensure complete combustion of fuel and reduce the emission of environmental pollutants.
In addition, wind speed observation and its impact are also one of the important applications of micro-meteorology in the field of thermal power. The wind speed directly affects the combustion process and flue gas emissions of thermal power plants. Severe winds can disrupt the combustion stability of the thermal power plant’s boiler and alter the direction of flue gas emissions, thereby impacting power generation efficiency and environmental emission quality. Real-time monitoring of wind speed variations using micro-meteorological observation data, and integrating the effects of wind speed on combustion and emissions, allows the adjustment of operating parameters and emission equipment of thermal power plants to ensure combustion stability and reasonable emission of environmental pollutants.
Furthermore, pressure observation and its impact are also one of the important applications of micro-meteorology in the field of thermal power. Pressure has a certain impact on the combustion process of thermal power plant boilers and flue gas emissions. Changes in pressure will affect the stability of combustion air volume, fuel supply, and flue gas emissions. By monitoring the changes in pressure in real-time through micro-meteorological observation data, and combining the impact of pressure on combustion and emissions, the operating parameters and control equipment of thermal power plants can be adjusted to ensure the stability of combustion and reasonable emission of environmental pollutants.
Through the collection and analysis of micro-meteorological observation data, temperature, humidity, wind speed, and pressure parameters can be monitored and adjusted to optimize the combustion process and environmental emissions of thermal power plants and improve power generation efficiency and environmental protection levels. The application of micro-meteorology can provide technical support and a decision-making basis for the development of the thermal power industry and make an important contribution to the sustainable development of the energy industry.
3.1.5. Energy Storage
Micro-meteorology also has a direct impact on the operation and efficiency of energy storage systems. Firstly, solar energy storage is a prevalent method of energy storage closely linked to micro-meteorology. Micro-meteorological observation data can yield critical information such as solar radiation, air temperature, and humidity, essential for the design and operation of solar energy storage systems. Analysis of micro-meteorological data enables the prediction of evolving trends in solar energy resources, facilitating adjustments to the charging and discharging strategies of energy storage systems to maximize the utilization of solar energy resources and enhance energy storage system efficiency.
Secondly, wind energy storage is also a common method of energy storage, and the application of micro-meteorology to wind energy storage is equally important. Micro-meteorological observation data can provide information such as wind speed, wind direction, and air temperature, which are of significant importance for the design and operation of wind energy storage systems. Through the analysis of micro-meteorological data, the changing trends of wind energy resources can be predicted, helping to adjust the charging and discharging strategies of energy storage systems to maximize the use of wind energy resources and improve the efficiency of energy storage systems. Additionally, micro-meteorological data can also be used to evaluate the feasibility and economic viability of wind energy storage systems, providing a basis for project decision-making.
Furthermore, temperature observation and its influence are also one of the important applications of micro-meteorology in the field of energy storage. Temperature has a direct impact on the battery performance and energy efficiency of energy storage systems. High temperatures can accelerate the aging and loss of batteries, reducing the lifespan and efficiency of energy storage systems. Through micro-meteorological observation data, the changing environmental temperature can be monitored in real time, and appropriate measures can be taken to control the temperature, protect the batteries, and improve the efficiency and reliability of energy storage systems.
Through the collection and analysis of micro-meteorological observation data, effective utilization of renewable energy resources such as solar and wind energy can be achieved, optimizing the charging and discharging strategies of energy storage systems, and improving the efficiency and reliability of energy storage.
3.1.6. Heating
Micro-meteorology also plays an important role in the field of heating and has a direct impact on the operation and efficiency of heating systems. Firstly, temperature observation and its influence are crucial applications of micro-meteorology in the heating field. Micro-meteorological observation data can provide real-time information on environmental temperature changes. Based on this data, heating systems can adjust the operating parameters of heating equipment to regulate the output of heat power according to external temperature changes, meeting the heating demands in different seasons and weather conditions. For example, during cold winters when the outdoor temperature is low, the heating system can increase the supply of hot water or steam to ensure stable and comfortable indoor temperatures.
Secondly, humidity observation and its influence are also important applications of micro-meteorology in the heating field. Humidity has a certain impact on the regulation of heating systems and indoor comfort. In dry environments, heating systems can increase the humidity of indoor air to improve comfort. Through micro-meteorological observation data, humidity changes can be monitored in real time, and in combination with the control strategies of heating systems, the control devices for indoor humidity can be adjusted to provide a comfortable heating environment indoors.
Furthermore, wind speed observation and its influence are also important applications of micro-meteorology in the heating field. Wind speed directly affects heat loss and energy consumption in heating systems. Strong winds can increase heat dissipation from building walls and windows, thereby increasing the load on heating systems and energy consumption. Through micro-meteorological observation data, wind speed changes can be monitored in real time, and in combination with the control strategies of heating systems, insulation measures for building walls and windows can be adjusted to reduce heat loss and energy consumption.
In addition, air pressure observation and its influence are also important applications of micro-meteorology in the heating field. Changes in air pressure can affect the delivery and distribution of hot water or steam in heating systems. Through micro-meteorological observation data, air pressure changes can be monitored in real time, and in combination with the control strategies of heating systems, the operating parameters of heating pipelines can be adjusted to ensure the normal operation and heating quality of the systems.
Through the collection and analysis of micro-meteorological observation data, monitoring and regulation of parameters such as temperature, humidity, wind speed, and air pressure can be achieved, optimizing the operation and energy consumption of heating systems, and improving heating efficiency and indoor comfort.
The impact of micro-meteorology on power generation is summarized in Table 2.
Table 2.
A summary of the impact of micro-meteorology on different forms of power generation.
3.2. The Impact of Micro-Meteorology on the Entire Lifecycle of New Energy Sources
New energy sources represented by wind and solar power are subject to the constraints and challenges of changeable weather. Micro-meteorological technology plays an important role throughout the entire lifecycle of new energy sources, from site selection in planning, grid connection and operation, to post-evaluation and trading recovery (as shown in Figure 4).
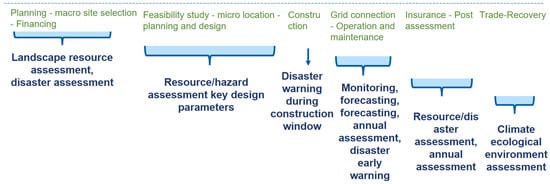
Figure 4.
The impact of micro-meteorology on the entire lifecycle of new energy sources.
3.2.1. Survey and Design
In recent years, with the gradual increase in environmental awareness and the continuous growth in energy demand, new energy generation projects have received widespread attention and vigorous promotion. In the detailed survey and parameter design of these projects, micro-meteorological data plays a crucial role.
Firstly, micro-meteorological data is indeed crucial for the site selection and construction of wind power projects. In the preliminary investigation of wind power projects, the collection and analysis of historical meteorological data can identify regions abundant in wind energy resources, laying a foundation for the construction of wind power projects. During actual construction, micro-meteorological data can provide information such as wind speed, wind direction, and wind energy density, helping to determine the layout of wind turbines and the construction of wind farms. High-resolution meteorological data can also provide a more detailed analysis of meteorological conditions, helping wind power projects predict wind energy output, adjust wind turbine operation status, and improve wind power generation efficiency.
Secondly, micro-meteorological data also plays an important role in the site selection and design of photovoltaic power generation projects. Photovoltaic power generation relies on factors such as solar radiation intensity, duration of sunlight, and atmospheric transparency. High-resolution meteorological data can provide more detailed meteorological information. By comparing and analyzing micro-meteorological data from different regions, areas abundant in solar energy resources can be identified, reducing errors in the placement and tilt angle of photovoltaic panels, and improving photovoltaic power generation efficiency.
In addition to its impact on project site selection and design, micro-meteorological data are also crucial for project operation and maintenance. For example, in the actual operation of wind power projects, micro-meteorological data can provide information such as wind speed and direction for wind turbine adjustment and maintenance. In the operation of photovoltaic power generation projects, micro-meteorological data can provide weather forecasts and temperature information for system optimization and maintenance. Furthermore, micro-meteorological data are also important for other power generation projects such as hydroelectric power. For example, in the design of hydroelectric power plants, micro-meteorological data can provide information on rainfall and runoff, helping to design reservoir capacity and select hydroelectric generators.
In addition, accurate short-term weather forecasting is needed during engineering construction and operation to take appropriate construction arrangements and emergency measures, ensuring safe and smooth project construction and operation. High-resolution meteorological data can provide more accurate data support for these predictions, helping to avoid potential meteorological risks and safeguard the smooth progress of engineering projects.
The scientific application of micro-meteorological data is a necessary condition for building more reliable, efficient, and environmentally friendly new energy generation projects. With the continuous advancement of technology and the improvement of data acquisition techniques, the acquisition and analysis of micro-meteorological data will become more precise and comprehensive. In the future, with the continuous expansion and popularization of renewable energy generation projects, the application of micro-meteorological data will become more widespread and in-depth. With the help of micro-meteorological data, more and more renewable energy generation projects will become an important pillar for people’s survival and development.
3.2.2. Power Forecasting
Although new energy generation has become relatively mature and widely applied, compared to traditional thermal power plants, it still exhibits strong randomness and volatility. When large-scale integration into the power grid occurs, it will have a significant impact on grid stability. Ensuring the stability of the grid requires the ability to predict power and generation in advance and adjust generation and grid load accordingly.
Compared to traditional power generation methods, renewable energy, mainly wind power and photovoltaic power, is more susceptible to environmental factors such as wind speed, wind direction, sunshine duration, temperature, and atmospheric pressure during the generation process. It has higher randomness, volatility, and uncontrollability. The large-scale integration of renewable energy into the grid poses significant challenges to the stable operation and power dispatch of the system [110].
Therefore, accurate prediction of new energy power is one of the effective methods to solve the aforementioned difficulties. Meteorological data play a vital role in new energy power prediction. Taking wind power prediction as an example, one commonly used method is to establish a wind power prediction model based on historical meteorological and power output data of wind farms, and use numerical weather forecast results as input to predict the power output of wind farms. The precision of weather forecasts significantly impacts the accuracy of power predictions.
The core of new energy power prediction technology lies in exploring the relationship between numerical weather forecasts representing weather changes and the power variations in new energy power stations. If the weather forecasts for the location of the power station are inaccurate, it will result in significant errors in new energy power predictions.
The commonly available meteorological forecasts in the market mainly provide city-level meteorological data at the ground level. The data do not match the spatial distribution of new energy power stations, and the vertical distribution does not match wind power generation. In addition, the current general meteorological forecasts have low resolution and cannot provide high-resolution and more detailed forecasts at the location of the power station [111]. Therefore, conducting power predictions usually requires purchasing commercial numerical weather forecast data, mainly in two types: grid-based data with a spatial resolution of about 3km*3km and specified latitude and longitude points, often located at wind measurement towers or specific points within wind farms.
Therefore, the importance of constructing a micro-meteorological forecast system for new energy generation is becoming increasingly evident. High-resolution micro-meteorological forecast data can support the fine modeling of new energy power prediction at the single-machine level and equipment level, improving the accuracy of power predictions at new energy power stations.
3.2.3. China Electricity Spot Market Trading
In China’s spot market environment, accurate micro-meteorological data forecasting is of great significance in new energy power forecasting, network-wide load forecasting, and inter-provincial transactions. It can ultimately effectively guide electricity sales companies and wholesale users to formulate reasonable trading strategies.
Meteorological analysis and prediction are the basis for various load predictions and new energy predictions in the electricity market, with the main goal of preparing for spot market price prediction through the prediction of various loads as well as photovoltaic and wind power output.
Meteorological fluctuations and randomness are key factors influencing the power output variability of new energy stations in the context of predicting new energy power. Wind power generation is strongly related to meteorological factors such as wind speed and air density, while photovoltaic power generation is strongly related to meteorological factors such as solar radiation intensity (solar incidence angle, cloud cover, etc.) and temperature. Accurate meteorological information prediction is crucial for new energy power prediction. The power of new energy stations is often negatively correlated with spot prices. The real-time balance of supply and demand in the power system. With the construction of a new type of power system dominated by new energy sources, the impact of new energy station power on spot prices becomes more prominent. If micro-meteorological forecasting can be achieved one week or even longer in advance and converted into new energy power prediction, market entities can formulate trading strategies proactively and flexibly.
In terms of load, the overall load of the power grid is affected by meteorological factors. Temperature is the most significant meteorological factor affecting the overall load of the power grid, and the load level and temperature are positively correlated in summer and negatively correlated in winter. Under the distributed photovoltaic “self-use, surplus to the grid” mechanism, when the temperature is constant, the distributed photovoltaic greatly reduces the user’s demand for grid power supply, and even the distributed photovoltaic sends power back to the grid, leading to a decrease in the grid’s coordinated load level. The grid load level directly affects the power generation capacity supply and demand of thermal power enterprises, thereby affecting the spot market price level. High-precision micro-meteorological forecasting is crucial for predicting load levels and spot market price levels.
During the period of inter-provincial market opening, larger-scale high-precision micro-meteorological forecasting is critical for predicting spot market prices in the province. When the temperature in the receiving province is higher in summer or lower in winter, the inter-provincial price has an advantage, and the power generation enterprises sending power to the province raise the provincial spot market quotation level, pulling up the clearing price of the provincial spot market through quotation, obtain settlement income from the provincial spot market, and participate in the inter-provincial market space with maximum power generation capacity to obtain high inter-provincial market income. However, when there is no need for external power to meet the balance of provincial electricity consumption, the inter-provincial market price lacks advantages, and power generation enterprises sending power out of the province often lower the provincial spot market quotation to fully participate in the provincial market.
With the continuous implementation of the further deepening of the electricity trading marketization reform, the impact of meteorological factors on the market supply and demand ends and even spot prices will become more apparent, becoming the core data that affect the quality of trading decisions. Therefore, strengthening the production, optimization, collection, and application of micro-meteorological forecasting data will also become the necessary path for all kinds of market entities to build core trading capabilities.
3.3. Integrated Energy System
Zeng et al. [112] argued that building a comprehensive energy system promotes the integrated development of power generation, transmission, distribution, storage, and multiple energy complementary development. Micro-meteorology provides basic data support for the integrated operation and optimization of comprehensive energy systems. The basic connotation of a comprehensive energy system can be summarized as “multiple energy complementary and coordinated optimization”, covering multiple energy resources such as electricity, coal, oil, natural gas, and renewable energy. Micro-meteorology data supports the centralized and distributed energy types to achieve a full complementary supply of multiple energy sources. Based on the smart grid, it can achieve interconnection with various types of networks such as heating networks, natural gas networks, and transportation networks. With micro-meteorology data as one of the main bases, it can play the regulatory capacity of flexible storage resources such as energy storage, which can effectively mobilize the response potential of demand-side resources. It can realize the horizontal multiple energy complementarity and vertical coordinated development between multiple energy systems, thereby constructing a diversified energy supply system and promoting an energy supply revolution.
Micro-meteorology data will provide effective help for the dispatching and optimization of integrated energy systems. Through scientifically dispatching multiple energy sources within the system, a comprehensive energy system can achieve efficient consumption of renewable energy, efficient utilization of comprehensive energy, and safe and economic energy use by users. At the same time, the organic coordination of multiple energy systems also helps to eliminate the supply bottleneck of different energy systems, delay the construction of energy supply systems, and improve the utilization efficiency of various energy equipment. In addition, in the application of virtual power plants, micro-meteorology data aggregate and optimize distributed energy resources (including distributed power generation, energy storage systems, controllable loads, etc.), providing basic data support for power markets and grid operations, and providing management and auxiliary services for distribution and transmission networks.
Therefore, micro-meteorology has a profound impact on the integrated scheduling and multi-energy complementary of comprehensive energy systems. For example, it can be specifically reflected in the following aspects:
(1) Wind and solar power output fluctuations: With the increase in the proportion of new energy, wind and solar power are important components of a comprehensive energy system, and their output fluctuations have an important impact on the integrated scheduling and operation of the power system. Therefore, improving the accuracy of wind and solar power output prediction based on micro-meteorology data is one of the key tasks of the integrated scheduling of comprehensive energy systems.
(2) Extreme weather events: Extreme weather events such as typhoons, heavy rain, and snow may have a serious impact on the operation of the power system, including equipment damage and power interruption. Therefore, based on micro-meteorology observations, risk assessment of extreme weather events and the formulation of corresponding emergency plans are important measures to ensure that the energy system can respond and recover quickly in the face of meteorological risks.
(3) Flexible scheduling of power generation resources: Under the influence of meteorological changes, the energy system needs to flexibly schedule various types of power generation resources. For example, when the output fluctuations of wind and solar power are large, the input of adjustable power generation resources such as thermal power and hydropower can be increased to balance the system load. In addition, by establishing regional power markets, cross-regional power scheduling can be achieved, which can alleviate the pressure caused by meteorological effects to a certain extent. In these solutions, accurate decision-making and scheduling based on micro-meteorology forecasts are crucial.
(4) Application of energy storage technology: The comprehensive energy system needs to balance the impact of meteorological conditions on the stability of energy output, and energy storage technology plays an important role in this process. By applying energy storage technologies such as batteries and pumped storage, it is possible to smooth the load curve of the system during wind and solar power output fluctuations and improve system stability. At the same time, energy storage technology can also provide additional support during peak periods of electricity demand and reduce the pressure on the power system. Micro-meteorology data have important significance for optimizing and allocating energy storage systems and achieving peak shaving and valley filling.
Therefore, in the integrated scheduling and multi-energy complementary of comprehensive energy systems, it is necessary to fully consider the impact of micro-meteorology factors, take corresponding measures, and improve the ability and stability of comprehensive energy systems.
In summary, the core characteristics of a comprehensive energy system are reflected in interconnection, comprehensive utilization, and optimized sharing. Micro-meteorology plays a very important role in internal optimization and scheduling, power generation planning, event warning, emergency response, and other important links to comprehensive energy systems. It is also among the basic data for the refined planning, allocation, and scheduling of comprehensive energy systems. With the increase in the proportion of new energy, micro-meteorology will become increasingly important in comprehensive energy systems.
3.4. Disaster Prevention and Reduction
In the context of global warming, the frequency and intensity of extreme weather events are continuously increasing [113]. The Intergovernmental Panel on Climate Change (IPCC) Sixth Assessment Report by the Working Group I states unequivocally that human influence has undoubtedly caused the warming of the atmosphere, ocean, and land, leading to widespread and rapid changes in the atmosphere, ocean, cryosphere, and biosphere. The scale and multi-faceted nature of the overall climate system changes are unprecedented over centuries or even thousands of years. Human-induced climate change has already affected the weather and extreme climates in every region worldwide.
Extreme weather and climate events often involve abnormal changes in meteorological elements [114]. For instance, during heatwaves and static stability in the atmosphere, widespread calm wind conditions can render wind turbines virtually ineffective for periods of time. Similarly, in extremely cold and overcast conditions, solar photovoltaic components may not receive sufficient solar radiation for conversion. In times of drought, river flow may decrease, leading to reduced power generation at hydroelectric plants; insufficient reservoir water levels could result in their inability to function normally. During floods, riverbed erosion and dam damage may occur, impacting water turbine generators and power facilities, potentially causing reservoir overflow and disrupting power generation at hydroelectric plants. As renewable energy becomes a dominant component of the new energy structure, heightened attention must be given to the new risks posed by climate change. A micro-meteorological observation network will provide essential foundational data for predicting extreme weather conditions.
The response to extreme weather events, particularly extreme temperature events such as heatwaves and extreme cold, often requires substantial energy reserves and distribution support. Climate change-induced extreme weather events will present an unusually complex situation for future energy supply needs. The extreme snowstorm in Texas in early 2021 [115] resulted in widespread power and water system failures, leaving residents without water and electricity for several days, and some even perished from freezing and starvation at home [116]. Texas faced a shortage of reliable electricity during the cold snap. Report [117] indicated that half of the state’s wind turbines froze, causing the proportion of wind power in the electricity mix to drop from 42 percent to 8 percent. In such circumstances, relying on more precise micro-meteorological forecasts to issue early warnings for extreme weather and prevent natural disasters such as geological hazards could greatly enhance disaster prevention and reduction efforts, effectively serving safety, operations, power generation, and market trading, playing a crucial role in energy preparedness, dispatch, and stable grid operation.
4. Case Study
This section provides a case study to illustrate how data and technique of micro-meteorolgy can help to improve the efficiency of the new power system.
China is planning to optimize its energy mix by building massive wind and solar power facilities in the country’s Gobi and other desert areas to support the objective of reaching more than 1200 gigawatts of installed solar and wind capacity by 2030. Meteorological data and services are becoming more crucial for renewable energy development and operation. This is clearly reflected in the memorandum of understanding between the International Renewable Energy Agency (IRENA) and the World Meteorological Organization (WMO) on working together to support the transition to renewable energy through tailored weather, water and climate services that was recently signed at the COP27. While China’s Gobi desert area has enormous potential for harvesting solar and wind energy, this is also an area where in situ observations and forecasting skills of numerical weather predictions are more limited. In addition, high-influence weather phenomena such as gust, strong wind and sandstorms are more frequent. Thus, power prediction skills for wind and photovoltaic generation are very challenging in this area.
This section shows how high-resolution data that captures the local micro-meteorology conditions of a wind farm well in the Gobi desert area can help improve the accuracy of power prediction.
4.1. Data Description
Firstly, the mesoscale numerical model WRF-ARW4.5 is used to conduct numerical simulation experiments, so as to obtain a micro-meteorology reanalysis dataset in the Gobi desert area. During the experiment, the Grid Nudging is used for data assimilation, and the open source reanalysis dataset-ERA5 is used as the background field. The ERA5 reanalysis data come from a global meteorological dataset provided by ECMWF. The time resolution of the dataset is 1 h and the spatial resolution is 0.25° × 0.25°.
The micro-meteorology reanalysis dataset was collected from March 2022 to February 2023 with a time resolution of 15 min and a spatial resolution of 0.01° × 0.01°. The spatial range covered by the dataset is 40.30° N–41.25° N, 95.60° E–96.62° E. The dataset includes upper-air variables and surface variables. In this section, the temperature, relative humidity, pressure, wind direction, wind speed at different heights and precipitation of grid points adjacent to a wind farm in Jiuquan, China are selected for data analysis and wind power prediction. The details of meteorological variables are shown in Table 3. The first 70% of the data points are used as training samples, and the remaining data points are used as test data.
Table 3.
The details of meteorological variables.
4.2. Key Variable Analysis
First, the 90 m wind speed of 144 grid points covering the wind farm at different times is shown in Figure 5. The spatial range covered by 144 grid points is 40.80° N–40.97° N, 96.37° E–6.44° E, so the spatial span of 144 grid points is 0.17° × 0.07°, which is significantly smaller than t9he spatial resolution of ERA5 dataset. It can be seen from Figure 5 that the 90 m wind speed at each grid point changes significantly at the same time. For example, at 6:00 on 1 March 2022, the maximum wind speed in all grid points is 8.68 m/s, and the minimum wind speed is 5.13 m/s. The difference between them reaches 3.55 m/s. This shows that the wind farm located in the Gobi desert area has local meteorological characteristics, which can be displayed by the micro-meteorology reanalysis dataset, but can not be reflected by the data with low spatial–temporal resolution, such as ERA5 dataset.
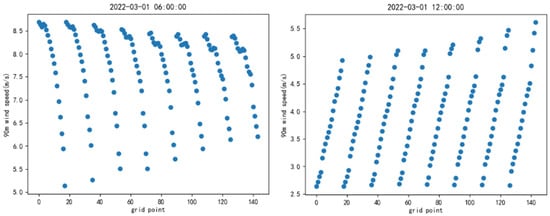
Figure 5.
The 90 m wind speed of grid points at different times.
Next, the correlation between 90 m wind speed at different grid points and wind power is analyzed, and the results are shown in Figure 6. It can be seen that the correlation between wind power and 90 m wind speed at most grid points is strong, which is not less than 0.7. In addition, the spatial span of grid points covering the wind farm is also 0.17° × 0.07°, which is significantly smaller than the spatial resolution of the ERA5 dataset. The correlation coefficient between wind power and 90 m wind speed at each grid point is different, which indicates that the wind speed at 90 m height is variable within the spatial span and has local micro-meteorological characteristics, which can not be captured by the ERA5 dataset. It is proved that the micro-meteorology reanalysis dataset can capture the local micro-meteorology conditions of a wind farm in the Gobi desert area well.
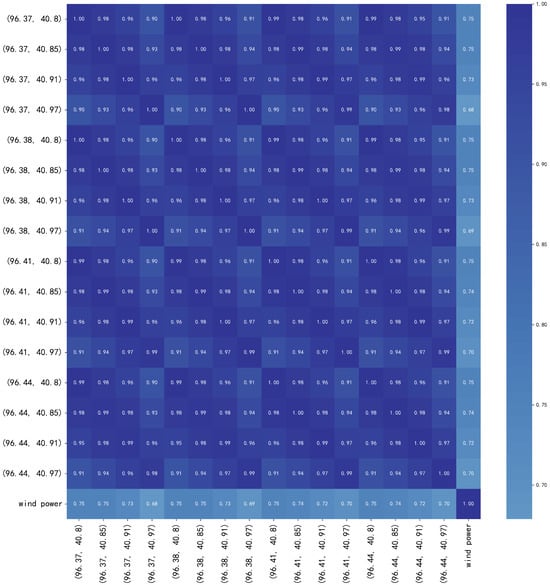
Figure 6.
The correlation matrix between 90 m wind speed at different grid points and wind power.
4.3. Wind Power Prediction
In this section, the wind power prediction based on the micro-meteorology reanalysis dataset and the ERA5 reanalysis data is compared.
4.3.1. Experimental Setting
The ERA5 dataset also includes pressure, temperature, humidity, wind speed, wind direction and other variables in the upper air and surface. But the temporal resolution and spatial resolution of the dataset are lower than those of the micro-meteorology reanalysis dataset. In this section, the ERA5 dataset was also collected from March 2022 to February 2023. The temperature, pressure, wind direction and wind speed at different heights and precipitation of grid points adjacent to the wind farm in Jiuquan were selected for wind power prediction. In addition, the data used for wind power prediction are shown in Table 4. It can be seen that the time resolution of ERA5 does not match the wind power data, so linear interpolation was performed on the ERA5 dataset to make its time resolution 15 min. The training set and the test set were also divided according to the ratio of 7:3.
Table 4.
Data used for wind power prediction.
The models uesd in this section are eXtreme Gradient Boosting (XGBoost), Light Gradient Boosting Machine (LightGBM), long short-term memory (LSTM) and gated recurrent unit (GRU). XGBoost and LightGBM are traditional machine learning models and tree-based models, which have been applied to tackle the problem of wind power prediction (WPP). XGBoost is a supervised ensemble learning algorithm, which can be used to solve regression problems. XGBoost uses the decision tree as the base learner to construct multiple weak learners. In the iterative learning process, it continuously trains along the direction of reducing the gradient, and uses the second-order Taylor series to expand the loss function. In order to find the global optimal solution, regularization is added to the objective function to control the accuracy and complexity of the model. XGBoost can process in parallel, prevent overfitting, and has fast speed. LightGBM is an ensemble learning algorithm based on a gradient lifting tree. By adding gradient-based one-side sampling and exclusive feature bundling, LightGBM solves the time-consuming problem caused by the traditional gradient lifting tree which needs to traverse all data at the feature splitting point to calculate the information gain. In summary, traditional machine learning models can adaptively learn the characteristics of data and predict nonlinear WP data accurately. Compared with physical models and traditional statistical models, they have a better prediction performance. However, these models have limitations in expressing complex data and fully reflecting the characteristics of data [118].
Over the past few years, deep learning models have become the most popularly used machine learning models, owing to their intricate structures and potent nonlinear mapping capabilities. They are increasingly being employed in a variety of applications, including WPP. In deep learning models, RNN-based models are widely used in WPP; due to their structure, they are prone to the problem of gradient disappearance or explosion. LSTM and GRU are commonly used RNN-based models, and LSTM introduces a gating mechanism on the basis of RNN, replacing common neuron modules with special memory neuron modules, so it can well solve the long-term dependence problem of sequences [119], and various studies [120] have shown that compared to other prediction methods, LSTM has a higher accuracy in WPP. GRU is a variant of LSTM, which also can solve the problem of gradient disappearance and explosion. Compared with LSTM, GRU does not have a dedicated memory cell, so GRU has a simpler structure, making it be trained faster than LSTM. But LSTM has a better performance for the dataset with longer sequences. In this section, the LSTM and GRU were implemented in PyTorch with a “mean square error (MSE)” loss function and an “Adaptive Moment Estimation (Adam)” optimizer.
In order to measure the prediction performance of the different datasets, three prediction error indicators were used: mean absolute error (MAE), root mean square error (RMSE) and CR. The equations for these indicators are given in Equations (1)–(4).
where n is the number of test samples, and yi and are the ith actual value and the corresponding estimated value, respectively.
where is the ith startup capacity of the wind farm.
4.3.2. Results
The wind power prediction results of different models applied to the two datasets are presented in Table 5. In the table, Dataset 1 refers to the micro-meteorology reanalysis dataset, and Dataset 2 refers to the ERA5 dataset. It can be seen that compared with the prediction results using the ERA5 dataset, the wind power prediction results of all models based on the micro-meteorology reanalysis dataset have high accuracy. Moreover, compared to shallow machine learning models LightGBM and XGBoost, deep learning models LSTM and GRU have better prediction performance. In addition, according to RMSE and , LSTM has the highest accuracy among all the models. Therefore, LSTM is chosen as the best prediction model, and the wind power prediction results of LSTM based on the two data sets and the absolute value of the error between the prediction results and the actual values over a period of time are shown in Figure 7. It can be seen that at most times, the absolute value of the error is smaller and the prediction accuracy is higher when using the micro-meteorology reanalysis dataset.
Table 5.
Prediction results of different models for two datasets.
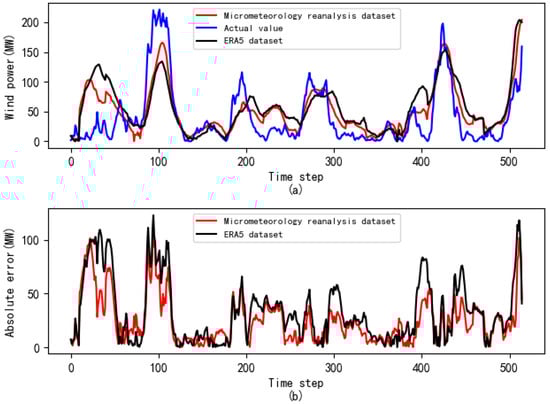
Figure 7.
The wind power prediction results of LSTM. (a) The prediction results based on the two data sets. (b) The absolute error between the prediction results and the actual values.
The analysis shows that the meteorological observation stations in the desert, Gobi and desertification land are sparse, and the basic meteorological data resources in these areas are seriously insufficient. In addition, due to the influence of the natural geographical environment, the obvious local micro-meteorology is prone to occur in the wind farm area. Therefore, the micro-meteorology reanalysis dataset can capture the local micro-meteorology conditions of the wind farm in the Gobi desert area well, and using the micro-meteorology reanalysis dataset with high spatial–temporal resolution for wind power prediction can effectively improve the prediction accuracy.
5. Discussion
Despite its clear benefits analyzed before, the integration of micro-meteorology into the power system faces challenges. This section discusses several challenges from observations, data, techniques, uncertainty, and cooperation.
5.1. Observation System
Due to the spatial heterogeneity of micro-meteorological phenomena, an extensive and dense observation network is required to capture meteorological changes at various spatial locations. This requires reasonable planning of the layout of the observation network to ensure that it covers a sufficient spatial range. It also requires timely collection, transmission and processing of observation data to ensure the accuracy and reliability of the data. However, because new energy development is often located in remote areas, meteorological observation equipment is seriously insufficient. At the same time, because these devices are usually high-precision, high-sensitivity instruments, they require regular calibration and maintenance to maintain their performance and accuracy.
In addition, the establishment and maintenance of a micro-meteorological observation system requires a large amount of financial and technical support. Due to insufficient financial and technical support, the micro-meteorological observation system may have problems such as aging equipment and backward technology, resulting in a decline in the quality of observation data or an inability to meet demand. Therefore, it is necessary to strengthen investment in financial and technical support to ensure the normal operation and development of the micro-meteorological observation system.
5.2. Data
In order for micro-meteorology to play a better role in the new power system, the requirements for real-time data are relatively high, which brings great challenges to data collection and transmission. Micro-meteorological data usually contain a large amount of information, such as wind speed, wind direction, temperature, humidity, air pressure, etc. These data require complex processing and analysis to extract useful information and transform it into understandable prediction results. In this process, professional technical personnel and advanced data analysis tools are needed.
In addition, data quality assurance is also an important challenge. The accuracy and reliability of micro-meteorological data have an important impact on subsequent meteorological prediction and decision-making. Therefore, data calibration and quality assurance are an indispensable part. This requires establishing strict data quality standards and calibration processes to ensure data accuracy and reliability.
Furthermore, because micro-meteorological data have the characteristics of high dimensionality, high frequency, and high spatial correlation, efficient data storage and processing technologies need to be developed to meet real-time and accuracy requirements.
5.3. Reliable Predictive Models
The prediction model based on micro-meteorological data is one of the key technologies to realize the incorporation of micro-meteorology into new power systems. However, due to the high complexity and uncertainty of micro-meteorological phenomena, establishing accurate and reliable prediction models is a challenging task. Currently, commonly used methods include statistical models, physical models, neural networks, etc. These methods each have their own advantages and disadvantages when dealing with specific problems, so they need to be selected and optimized based on actual application scenarios. In addition, the interpretability and generalization ability of the model also needs to be considered to ensure the reliability and stability of the prediction results.
5.4. Uncertainty
Micro-meteorological phenomena are affected by many factors, such as climate change, topography, atmospheric composition, etc., and these factors may bring uncertainty. Therefore, it is necessary to consider these uncertain factors when establishing a forecast model and use probability theory and statistical methods to evaluate and revise the forecast results. An early warning mechanism needs to be established to provide timely warnings of possible meteorological disasters and take effective response measures to reduce their impact on the power system.
5.5. Cooperation and Support
In order to better play the role of micro-meteorology in new power systems, more comprehensive exchanges and cooperation and integration of data, technology and personnel between the two fields are needed. In addition, it is also necessary to actively promote policy and financial support, strengthen the development of interdisciplinary technologies, and promote the building of researchers and teams.
However, these challenges also bring opportunities for innovation and growth. As the energy sector transitions towards more distributed and flexible systems, micro-meteorology can play a more pivotal role. Furthermore, advances in big data and artificial intelligence technology will provide more possibilities for the application of micro-meteorology in power systems.
6. Conclusions
Meteorological conditions affect all aspects of new power systems. The production and operation of the power system are closely related to the atmospheric environment. Especially as the proportion of renewable energy in power systems continues to rise, micro-meteorology is becoming one of the core technologies to ensure the safety and stability of power systems.
In the entire power generation process of the regional power system, including survey and design, wind power, solar power, hydrothermal power generation, energy storage, heating, power prediction, electricity market transactions, etc., micro-meteorology plays an important role. Micro-meteorology provides basic data and technical support systems for the power system, making contributions to dispatch optimization, disaster prevention and early warning, management and control, transaction operation scenarios, etc.
In the future, targeted micro-meteorological technological innovation work will be considered and carried out in various aspects, such as improving the utilization rate of meteorological data resources, enriching meteorological data development and utilization methods and tools, and promoting the transformation of meteorological data resources into data elements. These works will be conducive to the establishment and application of micro-meteorological services for more efficient management and overall optimization of multiple energy forms, improving overall energy efficiency, reducing costs, and achieving accurate predictions of power market trends through the development and utilization of multi-scale meteorological data.
Author Contributions
Conceptualization, M.Z. and Q.H.W.; investigation, H.Z., R.Y. and Y.L.; survey, H.Z.; analysis, R.Y.; case study, Y.L.; validation, Y.L.; writing—original draft preparation, H.Z., R.Y. and Y.L.; writing—review and editing, M.Z., H.Z. and Q.H.W.; visualization, Y.L., H.Z. and R.Y.; supervision, M.Z. and Q.H.W.; project administration, M.Z., X.M. and Q.H.W.; funding acquisition, M.Z., X.M. and Q.H.W. All authors have read and agreed to the published version of the manuscript.
Funding
This research was funded by the Research Fund of China Huaneng Clean Energy Research Institute QNYJJ22-22 and the Soft Science Research Project 2023-2 of China Huaneng Group.
Data Availability Statement
The data presented in this study are available on request from the corresponding author. The data are not publicly available due to commercial restrictions.
Conflicts of Interest
The authors declare that the research was conducted in the absence of any commercial or financial relationships that could be construed as a potential conflict of interest.
References
- Olabi, A.; Abdelkareem, M.A. Renewable energy and climate change. Renew. Sustain. Energy Rev. 2022, 158, 112111. [Google Scholar] [CrossRef]
- Yang, X.; Pang, J.; Teng, F.; Gong, R.; Springer, C. The environmental co-benefit and economic impact of China’s low-carbon pathways: Evidence from linking bottom-up and top-down models. Renew. Sustain. Energy Rev. 2021, 136, 110438. [Google Scholar] [CrossRef]
- Curtin, J.; McInerney, C.; Gallachóir, B.Ó.; Hickey, C.; Deane, P.; Deeney, P. Quantifying stranding risk for fossil fuel assets and implications for renewable energy investment: A review of the literature. Renew. Sustain. Energy Rev. 2019, 116, 109402. [Google Scholar] [CrossRef]
- Olabi, A.; Obaideen, K.; Elsaid, K.; Wilberforce, T.; Sayed, E.T.; Maghrabie, H.M.; Abdelkareem, M.A. Assessment of the pre-combustion carbon capture contribution into sustainable development goals SDGs using novel indicators. Renew. Sustain. Energy Rev. 2022, 153, 111710. [Google Scholar] [CrossRef]
- Gustavsson, L.; Nguyen, T.; Sathre, R.; Tettey, U.Y.A. Climate effects of forestry and substitution of concrete buildings and fossil energy. Renew. Sustain. Energy Rev. 2021, 136, 110435. [Google Scholar] [CrossRef]
- He, X.; Wang, F.; Wallington, T.; Shen, W.; Melaina, M.; Kim, H.; De Kleine, R.; Lin, T.; Zhang, S.; Keoleian, G.; et al. Well-to-wheels emissions, costs, and feedstock potentials for light-duty hydrogen fuel cell vehicles in China in 2017 and 2030. Renew. Sustain. Energy Rev. 2021, 137, 110477. [Google Scholar] [CrossRef]
- Hussain, A.; Arif, S.M.; Aslam, M. Emerging renewable and sustainable energy technologies: State of the art. Renew. Sustain. Energy Rev. 2017, 71, 12–28. [Google Scholar] [CrossRef]
- Madi, E.; Pope, K.; Huang, W.; Iqbal, T. A review of integrating ice detection and mitigation for wind turbine blades. Renew. Sustain. Energy Rev. 2019, 103, 269–281. [Google Scholar] [CrossRef]
- Olabi, A.G.; Abdelkareem, M.A.; Wilberforce, T.; Sayed, E.T. Application of graphene in energy storage device–A review. Renew. Sustain. Energy Rev. 2021, 135, 110026. [Google Scholar] [CrossRef]
- Sayed, E.T.; Abdelkareem, M.A.; Bahaa, A.; Eisa, T.; Alawadhi, H.; Al-Asheh, S.; Chae, K.J.; Olabi, A. Synthesis and performance evaluation of various metal chalcogenides as active anodes for direct urea fuel cells. Renew. Sustain. Energy Rev. 2021, 150, 111470. [Google Scholar] [CrossRef]
- Olabi, A.; Elsaid, K.; Rabaia, M.K.H.; Askalany, A.A.; Abdelkareem, M.A. Waste heat-driven desalination systems: Perspective. Energy 2020, 209, 118373. [Google Scholar] [CrossRef]
- Pili, R.; Martínez, L.G.; Wieland, C.; Spliethoff, H. Techno-economic potential of waste heat recovery from German energy-intensive industry with Organic Rankine Cycle technology. Renew. Sustain. Energy Rev. 2020, 134, 110324. [Google Scholar] [CrossRef]
- Impram, S.; Nese, S.V.; Oral, B. Challenges of renewable energy penetration on power system flexibility: A survey. Energy Strategy Rev. 2020, 31, 100539. [Google Scholar] [CrossRef]
- Li, C.; Shi, H.; Cao, Y.; Wang, J.; Kuang, Y.; Tan, Y.; Wei, J. Comprehensive review of renewable energy curtailment and avoidance: A specific example in China. Renew. Sustain. Energy Rev. 2015, 41, 1067–1079. [Google Scholar] [CrossRef]
- Gu, Y.; Zhang, S.; Dai, X.; Lu, Y.; Wang, Y. Research on Regional Micro-meteorological Measurement System for the Operation Control of Distribution Network List the author names here. In Proceedings of the 2020 International Conference on Advanced Electrical and Energy Systems, Osaka, Japan, 18–21 August 2020; Volume 582, p. 012005. [Google Scholar]
- Deng, X.; Lv, T. Power system planning with increasing variable renewable energy: A review of optimization models. J. Clean. Prod. 2020, 246, 118962. [Google Scholar] [CrossRef]
- Papaefthymiou, G.; Dragoon, K. Towards 100% renewable energy systems: Uncapping power system flexibility. Energy Policy 2016, 92, 69–82. [Google Scholar] [CrossRef]
- Li, L.; Li, Z.; Zhang, X.; Li, C. Micrometeorological Data Collection and Application in Internet of Things for Power Systems. IFAC-PapersOnLine 2020, 53, 431–435. [Google Scholar] [CrossRef]
- Moncrieff, J.; Valentini, R.; Greco, S.; Guenther, S.; Ciccioli, P. Trace gas exchange over terrestrial ecosystems: Methods and perspectives in micrometeorology. J. Exp. Bot. 1997, 48, 1133–1142. [Google Scholar] [CrossRef]
- Hersbach, H.; Bell, B.; Berrisford, P.; Hirahara, S.; Horányi, A.; Muñoz-Sabater, J.; Nicolas, J.; Peubey, C.; Radu, R.; Schepers, D.; et al. The ERA5 global reanalysis. Q. J. R. Meteorol. Soc. 2020, 146, 1999–2049. [Google Scholar] [CrossRef]
- Lv, S.; Huang, J.; Zhou, K. Research on effective operation mode of Meteorological Observation Quality Management System. J. Meteorol. Res. Appl. 2023, 44, 103–108. [Google Scholar]
- Change, I.P.O.C. Climate change 2007: The physical science basis. Agenda 2007, 6, 333. [Google Scholar]
- Xu, A.; Li, J. An overview of the integrated meteorological observations in complex terrain region at Dali National Climate Observatory, China. Atmosphere 2020, 11, 279. [Google Scholar] [CrossRef]
- Conover, J.H. The Blue Hill Meteorological Observatory: The First 100 Years, 1885–1985; Springer: Berlin/Heidelberg, Germany, 2018. [Google Scholar]
- Magee, N.B.; Melaas, E.; Finocchio, P.M.; Jardel, M.; Noonan, A.; Iacono, M.J. Blue Hill Observatory sunshine: Assessment of climate signals in the longest continuous meteorological record in North America. Bull. Am. Meteorol. Soc. 2014, 95, 1741–1751. [Google Scholar] [CrossRef]
- Neisser, J.; Adam, W.; Beyrich, F.; Leiterer, U.; Steinhagen, H. Atmospheric boundary layer monitoring at the Meteorological Observatory Lindenberg as a part of the “Lindenberg Column”: Facilities and selected results. Meteorol. Z. 2002, 11, 241–253. [Google Scholar] [CrossRef]
- Adam, W.; Dier, H.; Leiterer, U. 100 years aerology in Lindenberg and first long-time observations in the free atmosphere. Meteorol. Z. 2005, 14, 597–607. [Google Scholar] [CrossRef]
- Berger, F.H.; Hantel, M. Meteorological Observatory Lindenberg 1905–2005. Meteorol. Z. 2005, 14, 596. [Google Scholar] [CrossRef]
- Weller, M.; Gericke, K. Long-term observations of aerosol optical depths at the Meteorological Observatory Lindenberg. Meteorol. Z. 2005, 14, 651–662. [Google Scholar] [CrossRef]
- Overton, A.K. Jungfraujoch high altitude research station. Weather 2008, 63, 76–79. [Google Scholar] [CrossRef]
- Bonasoni, P.; Laj, P.; Angelini, F.; Arduini, J.; Bonafe, U.; Calzolari, F.; Cristofanelli, P.; Decesari, S.; Facchini, M.; Fuzzi, S.; et al. The ABC-Pyramid Atmospheric Research Observatory in Himalaya for aerosol, ozone and halocarbon measurements. Sci. Total Environ. 2008, 391, 252–261. [Google Scholar] [CrossRef]
- Bonasoni, P.; Laj, P.; Marinoni, A.; Sprenger, M.; Angelini, F.; Arduini, J.; Bonafè, U.; Calzolari, F.; Colombo, T.; Decesari, S.; et al. Atmospheric Brown Clouds in the Himalayas: First two years of continuous observations at the Nepal Climate Observatory-Pyramid (5079 m). Atmos. Chem. Phys. 2010, 10, 7515–7531. [Google Scholar] [CrossRef]
- Zhili, W.; Xiaofeng, Z.; Guoliang, W. Design and Realization of Micro-meteorological Disaster Morni ng and Pre-warning System in Power Grid. Power D Energy 2014, 35, 712–716. [Google Scholar]
- Yang, J.; Zhang, P.; Lu, N.; Yang, Z.; Shi, J.; Dong, C. Improvements on global meteorological observations from the current Fengyun 3 satellites and beyond. Int. J. Digit. Earth 2012, 5, 251–265. [Google Scholar] [CrossRef]
- Lahoz, W.A.; Schneider, P. Data assimilation: Making sense of Earth Observation. Front. Environ. Sci. 2014, 2, 16. [Google Scholar] [CrossRef]
- Lahoz, W. Research satellites. In Data Assimilation: Making Sense of Observations; Springer: Berlin/Heidelberg, Germany, 2010; pp. 301–321. [Google Scholar]
- Ménard, R. Bias estimation. In Data Assimilation: Making Sense of Observations; Springer: Berlin/Heidelberg, Germany, 2010; pp. 113–135. [Google Scholar]
- Lahoz, W.; Khattatov, B.; Ménard, R. Data assimilation and information. In Data Assimilation: Making Sense of Observations; Springer: Berlin/Heidelberg, Germany, 2010; pp. 3–12. [Google Scholar]
- Errera, Q.; Daerden, F.; Chabrillat, S.; Lambert, J.; Lahoz, W.; Viscardy, S.; Bonjean, S.; Fonteyn, D. 4D-Var assimilation of MIPAS chemical observations: Ozone and nitrogen dioxide analyses. Atmos. Chem. Phys. 2008, 8, 6169–6187. [Google Scholar] [CrossRef]
- Salby, M.L. Fundamentals of Atmospheric Physics; Elsevier: Amsterdam, The Netherlands, 1996. [Google Scholar]
- Lahoz, W.A.; De Lannoy, G.J. Closing the gaps in our knowledge of the hydrological cycle over land: Conceptual problems. Surv. Geophys. 2014, 35, 623–660. [Google Scholar] [CrossRef]
- Kalnay, E. Atmospheric Modeling, Data Assimilation and Predictability; Cambridge University Press: Cambridge, UK, 2003. [Google Scholar]
- Bouttier, F.; Courtier, P. Data Assimilation Concepts and Methods; European Centre for Medium-Range Weather Forecasts (ECMWF): Reading, UK, 2002. [Google Scholar]
- Lahoz, W.; Errera, Q.; Swinbank, R.; Fonteyn, D. Data assimilation of stratospheric constituents: A review. Atmos. Chem. Phys. 2007, 7, 5745–5773. [Google Scholar] [CrossRef]
- Courtier, P.; Thépaut, J.N.; Hollingsworth, A. A strategy for operational implementation of 4D-Var, using an incremental approach. Q. J. R. Meteorol. Soc. 1994, 120, 1367–1387. [Google Scholar]
- Simmons, A.J.; Hollingsworth, A. Some aspects of the improvement in skill of numerical weather prediction. Q. J. R. Meteorol. Soc. A J. Atmos. Sci. Appl. Meteorol. Phys. Oceanogr. 2002, 128, 647–677. [Google Scholar] [CrossRef]
- Kalman, R.E. A new approach to linear filtering and prediction problems. J. Basic Eng. 1960, 82, 35–45. [Google Scholar] [CrossRef]
- Cohn, S.E.; Da Silva, A.; Guo, J.; Sienkiewicz, M.; Lamich, D. Assessing the effects of data selection with the DAO physical-space statistical analysis system. Mon. Weather Rev. 1998, 126, 2913–2926. [Google Scholar] [CrossRef]
- Eskes, H.; Velthoven, P.V.; Valks, P.; Kelder, H. Assimilation of GOME total-ozone satellite observations in a three-dimensional tracer-transport model. Q. J. R. Meteorol. Soc. A J. Atmos. Sci. Appl. Meteorol. Phys. Oceanogr. 2003, 129, 1663–1681. [Google Scholar] [CrossRef]
- Lahoz, W.; Errera, Q. Constituent assimilation. In Data Assimilation: Making Sense of Observations; Springer: Berlin/Heidelberg, Germany, 2010; pp. 449–490. [Google Scholar]
- Auvinen, H.; Bardsley, J.M.; Haario, H.; Kauranne, T. The variational Kalman filter and an efficient implementation using limited memory BFGS. Int. J. Numer. Methods Fluids 2010, 64, 314–335. [Google Scholar] [CrossRef]
- Solonen, A.; Haario, H.; Hakkarainen, J.; Auvinen, H.; Amour, I.; Kauranne, T. Variational ensemble Kalman filtering using limited memory BFGS. Electron. Trans. Numer. Anal. 2012, 39, 271–285. [Google Scholar]
- Heikkilä, U.; Sandvik, A.; Sorteberg, A. Dynamical downscaling of ERA-40 in complex terrain using the WRF regional climate model. Clim. Dyn. 2011, 37, 1551–1564. [Google Scholar] [CrossRef]
- Soares, P.M.; Cardoso, R.M.; Miranda, P.M.; de Medeiros, J.; Belo-Pereira, M.; Espirito-Santo, F. WRF high resolution dynamical downscaling of ERA-Interim for Portugal. Clim. Dyn. 2012, 39, 2497–2522. [Google Scholar] [CrossRef]
- Evans, J.; McCabe, M. Regional climate simulation over Australia’s Murray-Darling basin: A multitemporal assessment. J. Geophys. Res. Atmos. 2010, 115. [Google Scholar] [CrossRef]
- Zhang, Y.; Dulière, V.; Mote, P.W.; Salathé, E.P. Evaluation of WRF and HadRM mesoscale climate simulations over the US Pacific Northwest. J. Clim. 2009, 22, 5511–5526. [Google Scholar] [CrossRef][Green Version]
- Koo, M.S.; Hong, S.Y. Diurnal variations of simulated precipitation over East Asia in two regional climate models. J. Geophys. Res. Atmos. 2010, 115. [Google Scholar] [CrossRef]
- Lo, J.C.F.; Yang, Z.L.; Pielke, R.A., Sr. Assessment of three dynamical climate downscaling methods using the Weather Research and Forecasting (WRF) model. J. Geophys. Res. Atmos. 2008, 113. [Google Scholar] [CrossRef]
- Zhang, J.; Wu, L.; Dong, W. Land-atmosphere coupling and summer climate variability over East Asia. J. Geophys. Res. Atmos. 2011, 116. [Google Scholar] [CrossRef]
- Liu, Y.; Warner, T.; Liu, Y.; Vincent, C.; Wu, W.; Mahoney, B.; Swerdlin, S.; Parks, K.; Boehnert, J. Simultaneous nested modeling from the synoptic scale to the LES scale for wind energy applications. J. Wind Eng. Ind. Aerodyn. 2011, 99, 308–319. [Google Scholar] [CrossRef]
- Cardoso, R.; Soares, P.; Miranda, P.; Belo-Pereira, M. WRF high resolution simulation of Iberian mean and extreme precipitation climate. Int. J. Climatol. 2013, 33, 2591–2608. [Google Scholar] [CrossRef]
- Kusaka, H.; Hara, M.; Takane, Y. Urban climate projection by the WRF model at 3-km horizontal grid increment: Dynamical downscaling and predicting heat stress in the 2070’s August for Tokyo, Osaka, and Nagoya metropolises. Meteorol. J. 2012, 90, 47–63. [Google Scholar] [CrossRef]
- Yang, B.; Zhang, Y.; Qian, Y. Simulation of urban climate with high-resolution WRF model: A case study in Nanjing, China. Asia-Pac. J. Atmos. Sci. 2012, 48, 227–241. [Google Scholar] [CrossRef]
- Marta-Almeida, M.; Teixeira, J.C.; Carvalho, M.J.; Melo-Gonçalves, P.; Rocha, A.M. High resolution WRF climatic simulations for the Iberian Peninsula: Model validation. Phys. Chem. Earth, Parts A/B/C 2016, 94, 94–105. [Google Scholar] [CrossRef]
- Carvalho, D.; Rocha, A.; Gómez-Gesteira, M.; Santos, C. A sensitivity study of the WRF model in wind simulation for an area of high wind energy. Environ. Model. Softw. 2012, 33, 23–34. [Google Scholar] [CrossRef]
- Carvalho, D.; Rocha, A.; Gómez-Gesteira, M.; Santos, C.S. WRF wind simulation and wind energy production estimates forced by different reanalyses: Comparison with observed data for Portugal. Appl. Energy 2014, 117, 116–126. [Google Scholar] [CrossRef]
- Deppe, A.J.; Gallus, W.A.; Takle, E.S. A WRF ensemble for improved wind speed forecasts at turbine height. Weather Forecast. 2013, 28, 212–228. [Google Scholar] [CrossRef]
- Mattar, C.; Borvarán, D. Offshore wind power simulation by using WRF in the central coast of Chile. Renew. Energy 2016, 94, 22–31. [Google Scholar] [CrossRef]
- Tuy, S.; Lee, H.S.; Chreng, K. Integrated assessment of offshore wind power potential using Weather Research and Forecast (WRF) downscaling with Sentinel-1 satellite imagery, optimal sites, annual energy production and equivalent CO2 reduction. Renew. Sustain. Energy Rev. 2022, 163, 112501. [Google Scholar] [CrossRef]
- Zhao, J.; Guo, Z.H.; Su, Z.Y.; Zhao, Z.Y.; Xiao, X.; Liu, F. An improved multi-step forecasting model based on WRF ensembles and creative fuzzy systems for wind speed. Appl. Energy 2016, 162, 808–826. [Google Scholar] [CrossRef]
- Zhao, J.; Guo, Y.; Xiao, X.; Wang, J.; Chi, D.; Guo, Z. Multi-step wind speed and power forecasts based on a WRF simulation and an optimized association method. Appl. Energy 2017, 197, 183–202. [Google Scholar] [CrossRef]
- Giannakopoulou, E.M.; Nhili, R. WRF model methodology for offshore wind energy applications. Adv. Meteorol. 2014, 2014, 319819. [Google Scholar] [CrossRef]
- Salvação, N.; Soares, C.G. Wind resource assessment offshore the Atlantic Iberian coast with the WRF model. Energy 2018, 145, 276–287. [Google Scholar] [CrossRef]
- Prósper, M.A.; Otero-Casal, C.; Fernández, F.C.; Miguez-Macho, G. Wind power forecasting for a real onshore wind farm on complex terrain using WRF high resolution simulations. Renew. Energy 2019, 135, 674–686. [Google Scholar] [CrossRef]
- Shen, X.; Meng, K.; Guo, Z.; Zhang, L. Convolutional Long-Short Term Memory Network for convective weather prediction based on 3D Doppler radar data. In Proceedings of the 2020 International Conference on Cyberspace Innovation of Advanced Technologies, Guangzhou, China, 4–6 December 2020; pp. 459–464. [Google Scholar] [CrossRef]
- Wang, B.; Lu, J.; Yan, Z.; Luo, H.; Li, T.; Zheng, Y.; Zhang, G. Deep Uncertainty Quantification: A Machine Learning Approach for Weather Forecasting. In Proceedings of the 25th ACM SIGKDD International Conference on Knowledge Discovery & Data Mining, Anchorage, AK, USA, 4–8 August 2019; pp. 2087–2095. [Google Scholar] [CrossRef]
- Grover, A.; Kapoor, A.; Horvitz, E. A Deep Hybrid Model for Weather Forecasting. In Proceedings of the 21th ACM SIGKDD International Conference on Knowledge Discovery and Data Mining, Sydney, NSW, Australia, 10–13 August 2015; pp. 379–386. [Google Scholar] [CrossRef]
- Volkovs, K.; Urtans, E.; Caune, V. Primed UNet-LSTM for Weather Forecasting. In Proceedings of the 2023 7th International Conference on Advances in Artificial Intelligence, Istanbul, Turkiye, 13–15 October 2023; pp. 13–17. [Google Scholar] [CrossRef]
- Zhang, L.; Zhang, L.; Du, B. Deep learning for remote sensing data: A technical tutorial on the state of the art. IEEE Geosci. Remote Sens. Mag. 2016, 4, 22–40. [Google Scholar] [CrossRef]
- Makantasis, K.; Karantzalos, K.; Doulamis, A.; Doulamis, N. Deep supervised learning for hyperspectral data classification through convolutional neural networks. In Proceedings of the 2015 IEEE International Geoscience and Remote Sensing Symposium (IGARSS), Milan, Italy, 26–31 July 2015; pp. 4959–4962. [Google Scholar]
- Liu, Y.; Racah, E.; Correa, J.; Khosrowshahi, A.; Lavers, D.; Kunkel, K.; Wehner, M.; Collins, W. Application of deep convolutional neural networks for detecting extreme weather in climate datasets. arXiv 2016, arXiv:1605.01156. [Google Scholar]
- Hernández, E.; Sanchez-Anguix, V.; Julian, V.; Palanca, J.; Duque, N. Rainfall prediction: A deep learning approach. In Proceedings of the 11th International Conference, HAIS 2016, Seville, Spain, 18–20 April 2016; pp. 151–162. [Google Scholar]
- Shi, X.; Gao, Z.; Lausen, L.; Wang, H.; Yeung, D.Y.; Wong, W.K.; Woo, W.C. Deep learning for precipitation nowcasting: A benchmark and a new model. Adv. Neural Inf. Process. Syst. 2017, 30, 5622–5632. [Google Scholar]
- You, J.; Li, X.; Low, M.; Lobell, D.; Ermon, S. Deep gaussian process for crop yield prediction based on remote sensing data. In Proceedings of the The Thirty-First AAAI Conference on Artificial Intelligence; The Twenty-Ninth Innovative Applications of Artificial Intelligence Conferencel; The Seventh Symposium on Educational Advances in Artificial Intelligence, San Francisco, CA, USA, 4–9 February 2017; Volume 31. [Google Scholar]
- Papernot, N.; McDaniel, P.; Swami, A.; Harang, R. Crafting adversarial input sequences for recurrent neural networks. In Proceedings of the MILCOM 2016—-2016 IEEE Military Communications Conference, Baltimore, MD, USA, 1–3 November 2016; pp. 49–54. [Google Scholar]
- Lee, W.; Kim, S.; Lee, Y.T.; Lee, H.W.; Choi, M. Deep neural networks for wild fire detection with unmanned aerial vehicle. In Proceedings of the 2017 IEEE International Conference on Consumer Electronics (ICCE), Las Vegas, NV, USA, 8–10 January 2017; pp. 252–253. [Google Scholar]
- Sharma, J.; Granmo, O.C.; Goodwin, M.; Fidje, J.T. Deep convolutional neural networks for fire detection in images. In Proceedings of the Engineering Applications of Neural Networks: 18th International Conference, EANN 2017, Athens, Greece, 25–27 August 2017; pp. 183–193. [Google Scholar]
- Zhang, Q.; Xu, J.; Xu, L.; Guo, H. Deep convolutional neural networks for forest fire detection. In Proceedings of the 2016 International Forum on Management, Education and Information Technology Application, Guangzhou, China, 30–31 January 2016; pp. 568–575. [Google Scholar]
- Chen, I.C.; Hu, S.C. Realizing Specific Weather Forecast through Machine Learning Enabled Prediction Model. In Proceedings of the 2019 3rd High Performance Computing and Cluster Technologies Conference, Guangzhou, China, 22–24 June 2019; pp. 71–74. [Google Scholar] [CrossRef]
- Egbueze, P.U.; Wang, Z. Weather Recognition Based on Still Images Using Deep Learning Neural Network with Resnet-15. In Proceedings of the 2022 6th International Conference on Deep Learning Technologies, Xi’an, China, 26–28 July 2022; pp. 8–13. [Google Scholar] [CrossRef]
- Li, X.; Wang, Z.; Lu, X. A Multi-Task Framework for Weather Recognition. In Proceedings of the 25th ACM International Conference on Multimedia, Mountain View, CA, USA, 23–27 October 2017; pp. 1318–1326. [Google Scholar] [CrossRef]
- Awami, S.H.; Shakmak, Y.H.; Mohammed, R.A. A Novel Approach for Forecasting Average Temperature Using Artificial Neural Networks (Applied to Benghazi City’s Weather). In Proceedings of the 6th International Conference on Engineering & MIS 2020, Almaty, Kazakhstan, 14–16 September 2020. [Google Scholar] [CrossRef]
- Shi, E.; LI, Q.; GU, D.; Zhao, Z. Weather radar echo extrapolation method based on convolutional neural networks. J. Comput. Appl. 2018, 38, 661. [Google Scholar]
- Agrawal, S.; Barrington, L.; Bromberg, C.; Burge, J.; Gazen, C.; Hickey, J. Machine learning for precipitation nowcasting from radar images. arXiv 2019, arXiv:1912.12132. [Google Scholar]
- Kaparakis, C.; Mehrkanoon, S. WF-UNet: Weather Data Fusion using 3D-UNet for Precipitation Nowcasting. Procedia Comput. Sci. 2023, 222, 223–232. [Google Scholar] [CrossRef]
- Shen, C. A transdisciplinary review of deep learning research and its relevance for water resources scientists. Water Resour. Res. 2018, 54, 8558–8593. [Google Scholar] [CrossRef]
- Klein, B.; Wolf, L.; Afek, Y. A dynamic convolutional layer for short range weather prediction. In Proceedings of the IEEE Conference on Computer Vision and Pattern Recognition, Boston, MA, USA, 7–12 June 2015; pp. 4840–4848. [Google Scholar]
- Vandal, T.; Kodra, E.; Ganguly, S.; Michaelis, A.; Nemani, R.; Ganguly, A.R. Deepsd: Generating high resolution climate change projections through single image super-resolution. In Proceedings of the 23rd ACM SIGKDD International Conference on Knowledge Discovery and Data Mining, Halifax, NS, Canada, 13–17 August 2017; pp. 1663–1672. [Google Scholar]
- Gentine, P.; Pritchard, M.; Rasp, S.; Reinaudi, G.; Yacalis, G. Could machine learning break the convection parameterization deadlock? Geophys. Res. Lett. 2018, 45, 5742–5751. [Google Scholar] [CrossRef]
- Racah, E.; Beckham, C.; Maharaj, T.; Ebrahimi Kahou, S.; Prabhat, M.; Pal, C. Extremeweather: A large-scale climate dataset for semi-supervised detection, localization, and understanding of extreme weather events. Adv. Neural Inf. Process. Syst. 2017, 30, 3405–3416. [Google Scholar]
- Albert, A.; Strano, E.; Kaur, J.; González, M. Modeling urbanization patterns with generative adversarial networks. In Proceedings of the IGARSS 2018—2018 IEEE International Geoscience and Remote Sensing Symposium, Valencia, Spain, 22–27 July 2018; pp. 2095–2098. [Google Scholar]
- Pathak, J.; Subramanian, S.; Harrington, P.; Raja, S.; Chattopadhyay, A.; Mardani, M.; Kurth, T.; Hall, D.; Li, Z.; Azizzadenesheli, K.; et al. Fourcastnet: A global data-driven high-resolution weather model using adaptive fourier neural operators. arXiv 2022, arXiv:2202.11214. [Google Scholar]
- Kurth, T.; Subramanian, S.; Harrington, P.; Pathak, J.; Mardani, M.; Hall, D.; Miele, A.; Kashinath, K.; Anandkumar, A. Fourcastnet: Accelerating global high-resolution weather forecasting using adaptive fourier neural operators. In Proceedings of the PASC ’23: Platform for Advanced Scientific Computing Conference, Davos, Switzerland, 26–28 June 2023; pp. 1–11. [Google Scholar]
- Bi, K.; Xie, L.; Zhang, H.; Chen, X.; Gu, X.; Tian, Q. Accurate medium-range global weather forecasting with 3D neural networks. Nature 2023, 619, 533–538. [Google Scholar] [CrossRef]
- Lam, R.; Sanchez-Gonzalez, A.; Willson, M.; Wirnsberger, P.; Fortunato, M.; Alet, F.; Ravuri, S.; Ewalds, T.; Eaton-Rosen, Z.; Hu, W.; et al. Learning skillful medium-range global weather forecasting. Science 2023, 382, 1416–1421. [Google Scholar] [CrossRef]
- Chen, K.; Han, T.; Gong, J.; Bai, L.; Ling, F.; Luo, J.J.; Chen, X.; Ma, L.; Zhang, T.; Su, R.; et al. FengWu: Pushing the Skillful Global Medium-range Weather Forecast beyond 10 Days Lead. arXiv 2023, arXiv:2304.02948. [Google Scholar]
- Chen, L.; Zhong, X.; Zhang, F.; Cheng, Y.; Xu, Y.; Qi, Y.; Li, H. FuXi: A cascade machine learning forecasting system for 15-day global weather forecast. arXiv 2023, arXiv:2306.12873. [Google Scholar] [CrossRef]
- Paraschiv, L.S.; Paraschiv, S. Contribution of renewable energy (hydro, wind, solar and biomass) to decarbonization and transformation of the electricity generation sector for sustainable development. Energy Rep. 2023, 9, 535–544. [Google Scholar] [CrossRef]
- Moonen, P.; Defraeye, T.; Dorer, V.; Blocken, B.; Carmeliet, J. Urban Physics: Effect of the micro-climate on comfort, health and energy demand. Front. Archit. Res. 2012, 1, 197–228. [Google Scholar] [CrossRef]
- Ma, L.; Jiang, J. Challenges and countermeasures for the development of China’s wind power industry under the low-carbon energy transition. China Energy 2021, 43, 8. [Google Scholar]
- Zhu, Q.; Li, J.; Qiao, J.; Shi, M.; Wang, C. Application and prospect of artificial intelligence technology in renewable energy forecasting. Proc. CSEE 2023, 43, 3027–3047. [Google Scholar] [CrossRef]
- Zeng, M.; Xu, Y. Essentials of an integrated energy system: Integration of source, grid, load and storage + multi-energy complementation. China Energy News, 12 April 2021. [Google Scholar]
- Majedul Islam, M. Threats to Humanity from Climate Change. In Climate Change: The Social and Scientific Construct; Springer: Cham, Switzerland, 2022; pp. 21–36. [Google Scholar]
- McBean, G. Climate Change and Extreme Weather: A Basis for Action. Nat. Hazards 2004, 31, 177–190. [Google Scholar] [CrossRef]
- James, D.G.; David, J.F.; Upmanu, L.; Vijay, M. How unprecedented was the February 2021 Texas cold snap? Environ. Res. Lett. 2021, 16, 064056. [Google Scholar]
- Smead, R.G. Ercot—the eyes of texas (and the world) are upon you: What can be done to avoid a february 2021 repeat. Clim. Energy 2021, 37, 14–18. [Google Scholar] [CrossRef]
- Everhart, K.; Gergely, M. Severe Power Cuts in Texas Highlight Energy Security Risks Related to Extreme Weather Events; Technical Report; International Energy Agency: Paris, France, 2021.
- Wei, H.; Wang, W.S.; Kao, X.X. A novel approach to ultra-short-term wind power prediction based on feature engineering and informer. Energy Rep. 2023, 9, 1236–1250. [Google Scholar] [CrossRef]
- Yu, R.; Gao, J.; Yu, M.; Lu, W.; Xu, T.; Zhao, M.; Zhang, J.; Zhang, R.; Zhang, Z. LSTM-EFG for wind power forecasting based on sequential correlation features. Future Gener. Comput. Syst. 2019, 93, 33–42. [Google Scholar] [CrossRef]
- Yuan, X.; Chen, C.; Jiang, M.; Yuan, Y. Prediction interval of wind power using parameter optimized Beta distribution based LSTM model. Appl. Soft Comput. 2019, 82, 105550. [Google Scholar] [CrossRef]
Disclaimer/Publisher’s Note: The statements, opinions and data contained in all publications are solely those of the individual author(s) and contributor(s) and not of MDPI and/or the editor(s). MDPI and/or the editor(s) disclaim responsibility for any injury to people or property resulting from any ideas, methods, instructions or products referred to in the content. |
© 2024 by the authors. Licensee MDPI, Basel, Switzerland. This article is an open access article distributed under the terms and conditions of the Creative Commons Attribution (CC BY) license (https://creativecommons.org/licenses/by/4.0/).