Article

Study of Load Adjustment Strategy for Nuclear Power Units Focusing on Rankine Cycle: Flexibility–Environment–Economy

1
State Grid Shandong Electric Power Research Institute, Jinan 250003, China
2
Institute of Thermal Science and Technology, Shandong University, Jinan 250061, China
*
Author to whom correspondence should be addressed.
Energies 2024, 17(6), 1357; https://doi.org/10.3390/en17061357
Submission received: 18 February 2024 / Revised: 8 March 2024 / Accepted: 8 March 2024 / Published: 12 March 2024
(This article belongs to the Section F1: Electrical Power System)

Abstract

:
The demand for the power grid system’s capacity to undergo peak-shaving is increasing as the proportion of renewable energy rises. In China, nuclear power units usually only provide a base load operation in the view of safety and economic considerations, but they do not provide load adjustment services, which undoubtedly increases the pressure of grid load adjustment. In this paper, a novel flexibility load adjustment strategy of the CHP nuclear unit is studied, which is achieved by introducing the thermal storage tank (TST) into the Rankine cycle without changing the output of the nuclear reactor. The AP1000 pressurized water reactor nuclear power unit for combined heat and power is taken as an example, and the thermodynamic model is established through the water vapor equation. Furthermore, the reference system is simulated for the goal of minimizing the imbalance between power supply and demand, and the flexibility–environment–economy benefits are evaluated. The results show that the heat storage/release of the TST may achieve power output flexible adjustment of the nuclear unit, and the power imbalance of the reference energy system is reduced from 1107.99 MWh to 457.24 MWh, a reduction of 58.73%. The introduction of a 600 MWh TST can enable the reference unit to contribute 335 MWh of peak electricity within the reference day. From the perspective of replacing the power generation output increment of coal-fired power units with equal amounts, it can achieve a reduction of 106.09 tons of coal consumption in the case day, which means that 277.73 tons of CO2 emissions can be reduced. The profit of the reference unit can be improved by CHY 70,125 via participating in load adjustment in the case day if following the time-of-use electricity price.

1. Introduction

In China, one of the most effective ways to achieve the “double carbon” goal is to increase the proportion of renewable energy in the energy system. In Shandong province, it is expected that the installed renewable energy power generation capacity will obtain more than 80 million kilowatts, and more than 150 billion kilowatt hours of electricity power from outside the province will be input by 2025 [1]. As wind power, photovoltaic power generation, and other renewable energy sources have the characteristics of randomness, volatility, uncontrollability, etc., the increase in their power generation will bring serious challenges to the safe and stable operation of the power grid. The power system requires increasing regulation flexibility.
Shandong province is located in Northern China. The regulation flexibility of the power grid is mainly provided by coal-fired units currently, in which the combined heat and power (CHP) units account for a large proportion. The operation mode of thermal power generation severely restricts the load adjustment ability of coal-fired power units during the heating season. To increase the proportion of wind power and photovoltaic power generation, fresh peak-shaving resources are urgently required.
In China, nuclear power generation has been developed to a certain extent to respond to the demand for electricity and the requirements of low carbon emissions [2]. For a long time, China’s nuclear power units have mainly operated in the baseload mode and have not provide electrical auxiliary services. Therefore, the increase in the nuclear power units’ installed capacity is also relatively squeezing the load flexibility adjustment capacity of the grid. Actually, the demand for the comprehensive utilization of nuclear energy is increasing, e.g., peak-shaving and district heating; as the proportion of renewable energy increases, small-capacity and low-efficiency coal-fired CHP units are gradually shut down. Therefore, it is of great significance and an application prospect to study the novel load adjustment strategy for nuclear power units.
In 2021, the State Council issued the Carbon Peaking Action Program by 2030, in which the active development of nuclear power in a safe and orderly manner is proposed to steadily promote the demonstration of nuclear energy for a heat supply. Nuclear power is facing novel development opportunities and challenges. Haiyang is the first city to achieve commercial heating through nuclear energy in China, where nuclear power units have replaced corresponding coal-fired power units, making a huge contribution to carbon reduction. However, it will further compress the load adjustment capability of the entire regional grid if the load adjustment capability of equal-capacity coal-fired power units cannot be effectively replaced.
Considering the safety constraints, the “12-3-6-3” daily load tracking mode is often used worldwide, which is the main peak regulation strategy used for nuclear power units. For nuclear power units, the traditional ways of load adjustment are achieved by adjusting the reactor control rod position, boron concentration, etc. [3]. This could cause some problems, such as axial power deviation of the core, which affects the reactor’s stability and lifetime. In addition, controlling the core temperature through the boron concentration can cause xenon toxicity to accumulate, further affecting the environment. Obviously, the traditional nuclear power peak-shaving strategy lacks flexibility, and it is difficult for it to cope with the increasing randomness and volatility of the current grid system.
In the grid system, the fluctuation on the power supply side directly affects the stability of the system, and certain measures are needed to accommodate this fluctuation. Studies have shown that the power grid needs the necessary flexibility to consume renewable energy when it accounts for 10% of the total generation [4]. Peak-shaving is required to maintain the balance between supply and demand in the grid system when renewable energy sources account for more than 20% of total generation [5]. Power generation adjustment flexibility and energy storage technologies are considered key to maintaining the power grid’s stability [6,7,8]. The combination of nuclear power and energy storage technologies can enhance the flexibility of the unit load response. Jenkins et al. [9] studied the advantages of nuclear energy flexibility in grid systems with the high penetration of wind power and solar photovoltaic power. The results show that the introduction of energy storage devices on the reactor side of nuclear power units can increase the flexibility of nuclear power operations, reduce operating costs, and increase overall revenue by 2~5% compared to the base-load operation. Jung Hwan Park et al. [10] investigated the synergy operation characters between compressed air energy storage and nuclear power units. The investigations showed that the use of compressed air energy storage systems can improve the economics of the system, and nuclear units play a role in consuming intermittent renewable energy sources. In addition, focusing on improving the operational flexibility and stability of nuclear power units, Carlson et al. [11] investigated the AP1000 nuclear power unit introduced with a heat storage device. When the power load demand is lower, part of the steam from the steam generator enters the high-pressure cylinder and the rest part enters the heat storage device. So, the power generation will be reduced. When the power load demand increases, the heat is released from the heat storage device, and the output of the low-pressure cylinder is increased. This enables a certain degree of load adjustment flexibility for the nuclear power generation under a base load operation.
As discussed previously, achieving the load adjustment flexibility of nuclear power units through frequently adjusting nuclear reactors would present potential safety risks. Although some studies have introduced a heat storage device into nuclear power units, they mostly focus on the feasibility of achieving an improvement in the flexibility of nuclear power, meaning that the benefits in terms of flexibility–environment–economy have not been comprehensively evaluated. In fact, the environmental and economic performances after integrating a heat storage device are of concern to the government and enterprises themselves, respectively. To fill this gap, a novel strategy was proposed to improve the load adjustment flexibility of the CHP nuclear unit via integrating TST without changing the output power of the nuclear reactor in this paper. In addition, the flexibility–environment–economy benefits of the strategy were evaluated.

2. Modeling of the CHP Nuclear Unit

2.1. Thermal Systems for the CHP Nuclear Unit

In this paper, the AP1000 CHP nuclear unit is taken as the reference unit, which supplies heat in the heating season by extracting steam from the Rankine cycle circuit system. The system schematic is shown as Figure 1. During the heating season, heating extraction steam of the CHP nuclear unit can be adjusted to follow the intra-day heating load demand. Therefore, there is a certain adjustment capacity for the intra-day power generation of the unit without changing the output power of the nuclear reactor. Table 1 shows the design parameters of the turbine part of the reference unit, and Table 2 shows the operating data of the relevant components of the turbine system under a 100% THA condition of the unit.

2.2. Thermodynamic Model

In this case, the main steam flow rate is set to be constant, and the vapor equation is used for the analysis and modeling of the system. The regenerative heat system of the reference nuclear unit consists of 7-stage regenerative heaters (RHs).
For the high-pressure regenerative heaters of No.1 and No.2, the calculation gives the following:
m f w h w , 1 h w , 2 = m a ( h a h d , 1 ) + m 1 ( h 1 h d , 1 )
m f w h w , 2 h w , 3 = m a + m 1 h d , 1 h d , 2 + m 2 ( h 2 h d , 2 )
For deaerator, the following conditions hold:
m f w h w , 3 m i w h w , 4 = ( m a + m 1 + m 2 ) h d , 2 + ( m 3 m h ) h 3 + m b h b
m i w = m f w m a m b i = 1 3 m i m h
For the low-pressure regenerative heaters of No.4, No.5, No.6, and No.7, the calculation is carried out, and the mass and energy conservation equations lead to the following:
m i w h w , 4 h w , 5 = m 4 h 4 h d , 4
m i w h w , 5 m c w h w , 6 = m 5 h 5 + m 4 h d , 4
m c w = m f w m a m b i = 1 5 m i m h
m c w h w , 6 h w , 7 = m 6 h 6 h d , 6
m c w h w , 7 h w , 8 = m 7 ( h 7 h d , 7 ) + m 6 ( h d , 6 h d , 7 )
where m f w is the feed water flow rate, t/h, m i is the mass flow rate of steam extraction to No.i regenerative heater, t/h, m a is the flow rate from the reheater to RH1 (No.1 regenerative heater), m b is the flow rate from the moisture separator to deaerator, m i w is the inlet flow rate of the deaerator, and m c w is the inlet flow rate of RH4 (No.4 regenerative heater).
The parameter h i is the enthalpy of the extraction steam to RHi, h w , i is the feed water enthalpy of RHi, h d , i is the hydrophobic enthalpy of RHi, h b is the enthalpy of water from the moisture separator to the deaerator, and h a is the enthalpy of water from the reheater to RH1.
Combined with the above Equations (1)–(9), the matrix equation can be obtained as follows:
[ m f w τ 1 m f w τ 2 m f w τ 3 m i w τ 4 m i w τ 5 m c w τ 6 m c w τ 7 ] = A [ m 1 m 2 m 3 m h m 4 m 5 m 6 m 7 ] + m a [ h a h d , 1 0 0 0 0 0 0 ] + m b [ 0 h b h w , 4 0 0 0 0 0 ]
where the expression of the A matrix is given by the following:
A = [ q 1 y 1 τ 1 τ 1 τ 1 τ 1 τ 1 0 q 2 τ 2 τ 2 τ 2 τ 2 τ 2 0 0 h 3 h w , 2 h d , 4 h w , 2 τ 3 τ 3 τ 3 0 0 0 q 4 τ 4 τ 4 τ 4 0 0 0 0 h 5 h w , 4 y 4 y 5 0 0 0 0 0 q 6 y 6 0 0 0 0 0 0 q 7 ]
In matrix A, qi is the enthalpy drop of extraction steam, τ i is the enthalpy rise of the feed water of RHi, and yi is the enthalpy drop of drainage. The relevant calculations are as follows.
{ q i = h i h d , i τ i = h w , i h w , ( i + 1 ) y i = h d , ( i 1 ) h d , i
By solving Equation (10), the mass flow rates into the RHs (regenerative heaters) are obtained.
The work equation of the Rankine cycle of the unit is shown in the following equation, by which the power of the unit under this condition can be calculated.
P = m f w h 0 + σ h e s i = 1 2 m i h i + σ h e s i = 3 7 m i h i h e s m h h h h e s m a h a h e s m b h b h e s
where h 0 is the main steam enthalpy, h e s is the enthalpy of exhaust steam from a low-pressure cylinder, and σ is the reheat heat section enthalpy rise.

2.3. Thermal Systems with Heat Storage Devices

2.3.1. Model of Heat Storage

In this paper, the thermal storage tank (TST) is selected as the heat storage device and liquid water is the storage medium for TST. The specific equipment parameters are shown in Table 3. The TST is connected to the heat network system and operates in either the heat storage mode or the exothermic mode as needed. In operation, thermal storage is achieved by increasing the amount of extraction steam of the nuclear unit Rankine cycle while reducing the unit’s power output. On the contrary, the unit’s power output is increased by reducing the extraction steam of the nuclear unit Rankine cycle while satisfying the heat supply demand for a certain time range through the exothermic process of TST.

2.3.2. Thermodynamic Model

In this paper, the CHP nuclear system with TST is shown in Figure 2; the TST is introduced into the nuclear unit Rankine cycle. Based on the abovementioned water vapor equation modeling, the following water vapor distribution equation is obtained for the CHP nuclear unit with the TST.
[ m f w τ 1 m f w τ 2 m f w τ 3 m i w τ 4 m i w τ 5 m c w τ 6 m c w τ 7 ] = A [ m 1 m 2 m 3 m h m t m 4 m 5 m 6 m 7 ] + m a [ h a h d , 1 0 0 0 0 0 0 ] + m b [ 0 h b h w , 4 0 0 0 0 0 ]
where m t is the extraction steam flow matched with the thermal storage in the TST; m h is the extraction steam flow for heating, t/h. A is the system matrix, and other variables are consistent with the above.
Based on the thermodynamic model established above, the flexibility of the unit power generation adjustment is enhanced by introducing the TST.

2.4. Model Validation

In this paper, the study is based on the constant output of the nuclear reactor unit, and the data selected are the unit design data at 100% THA operating conditions.
The data of each node in Table 2 are brought into Equations (1)–(9), the heating extraction steams are taken as 0 t/h, 342.5 t/h, 685 t/h, 1027.5 t/h, 1370 t/h, and 1500 t/h, the data under each working condition are calculated, and, finally, the error analysis is performed.
The model calculation data are compared with the design data and actual data separately as shown in Table 4, and the maximum relative error of the output power is less than 0.61%, which satisfies the requirements of calculation accuracy.

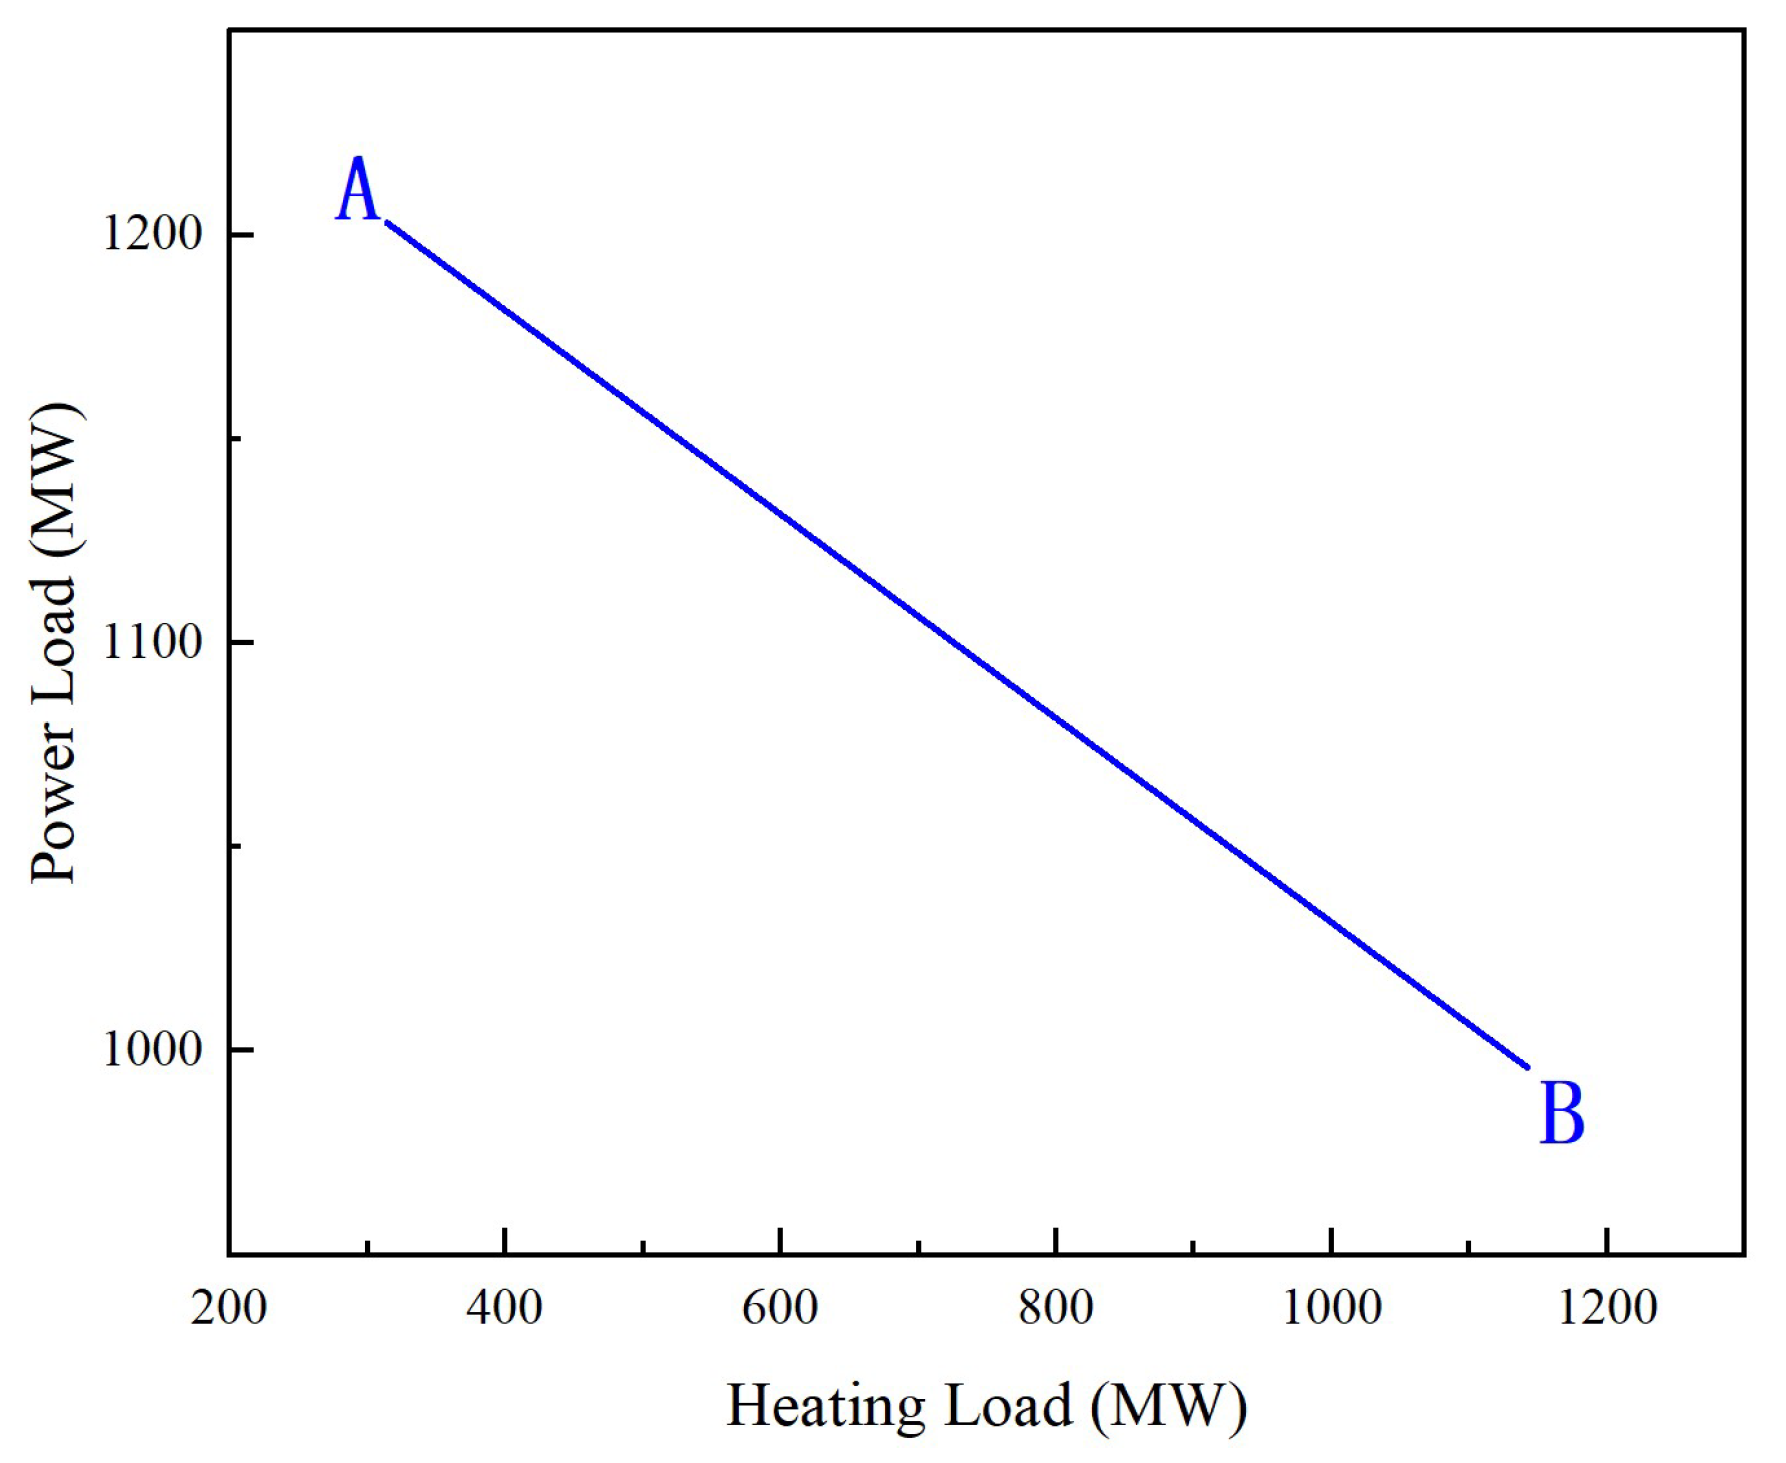
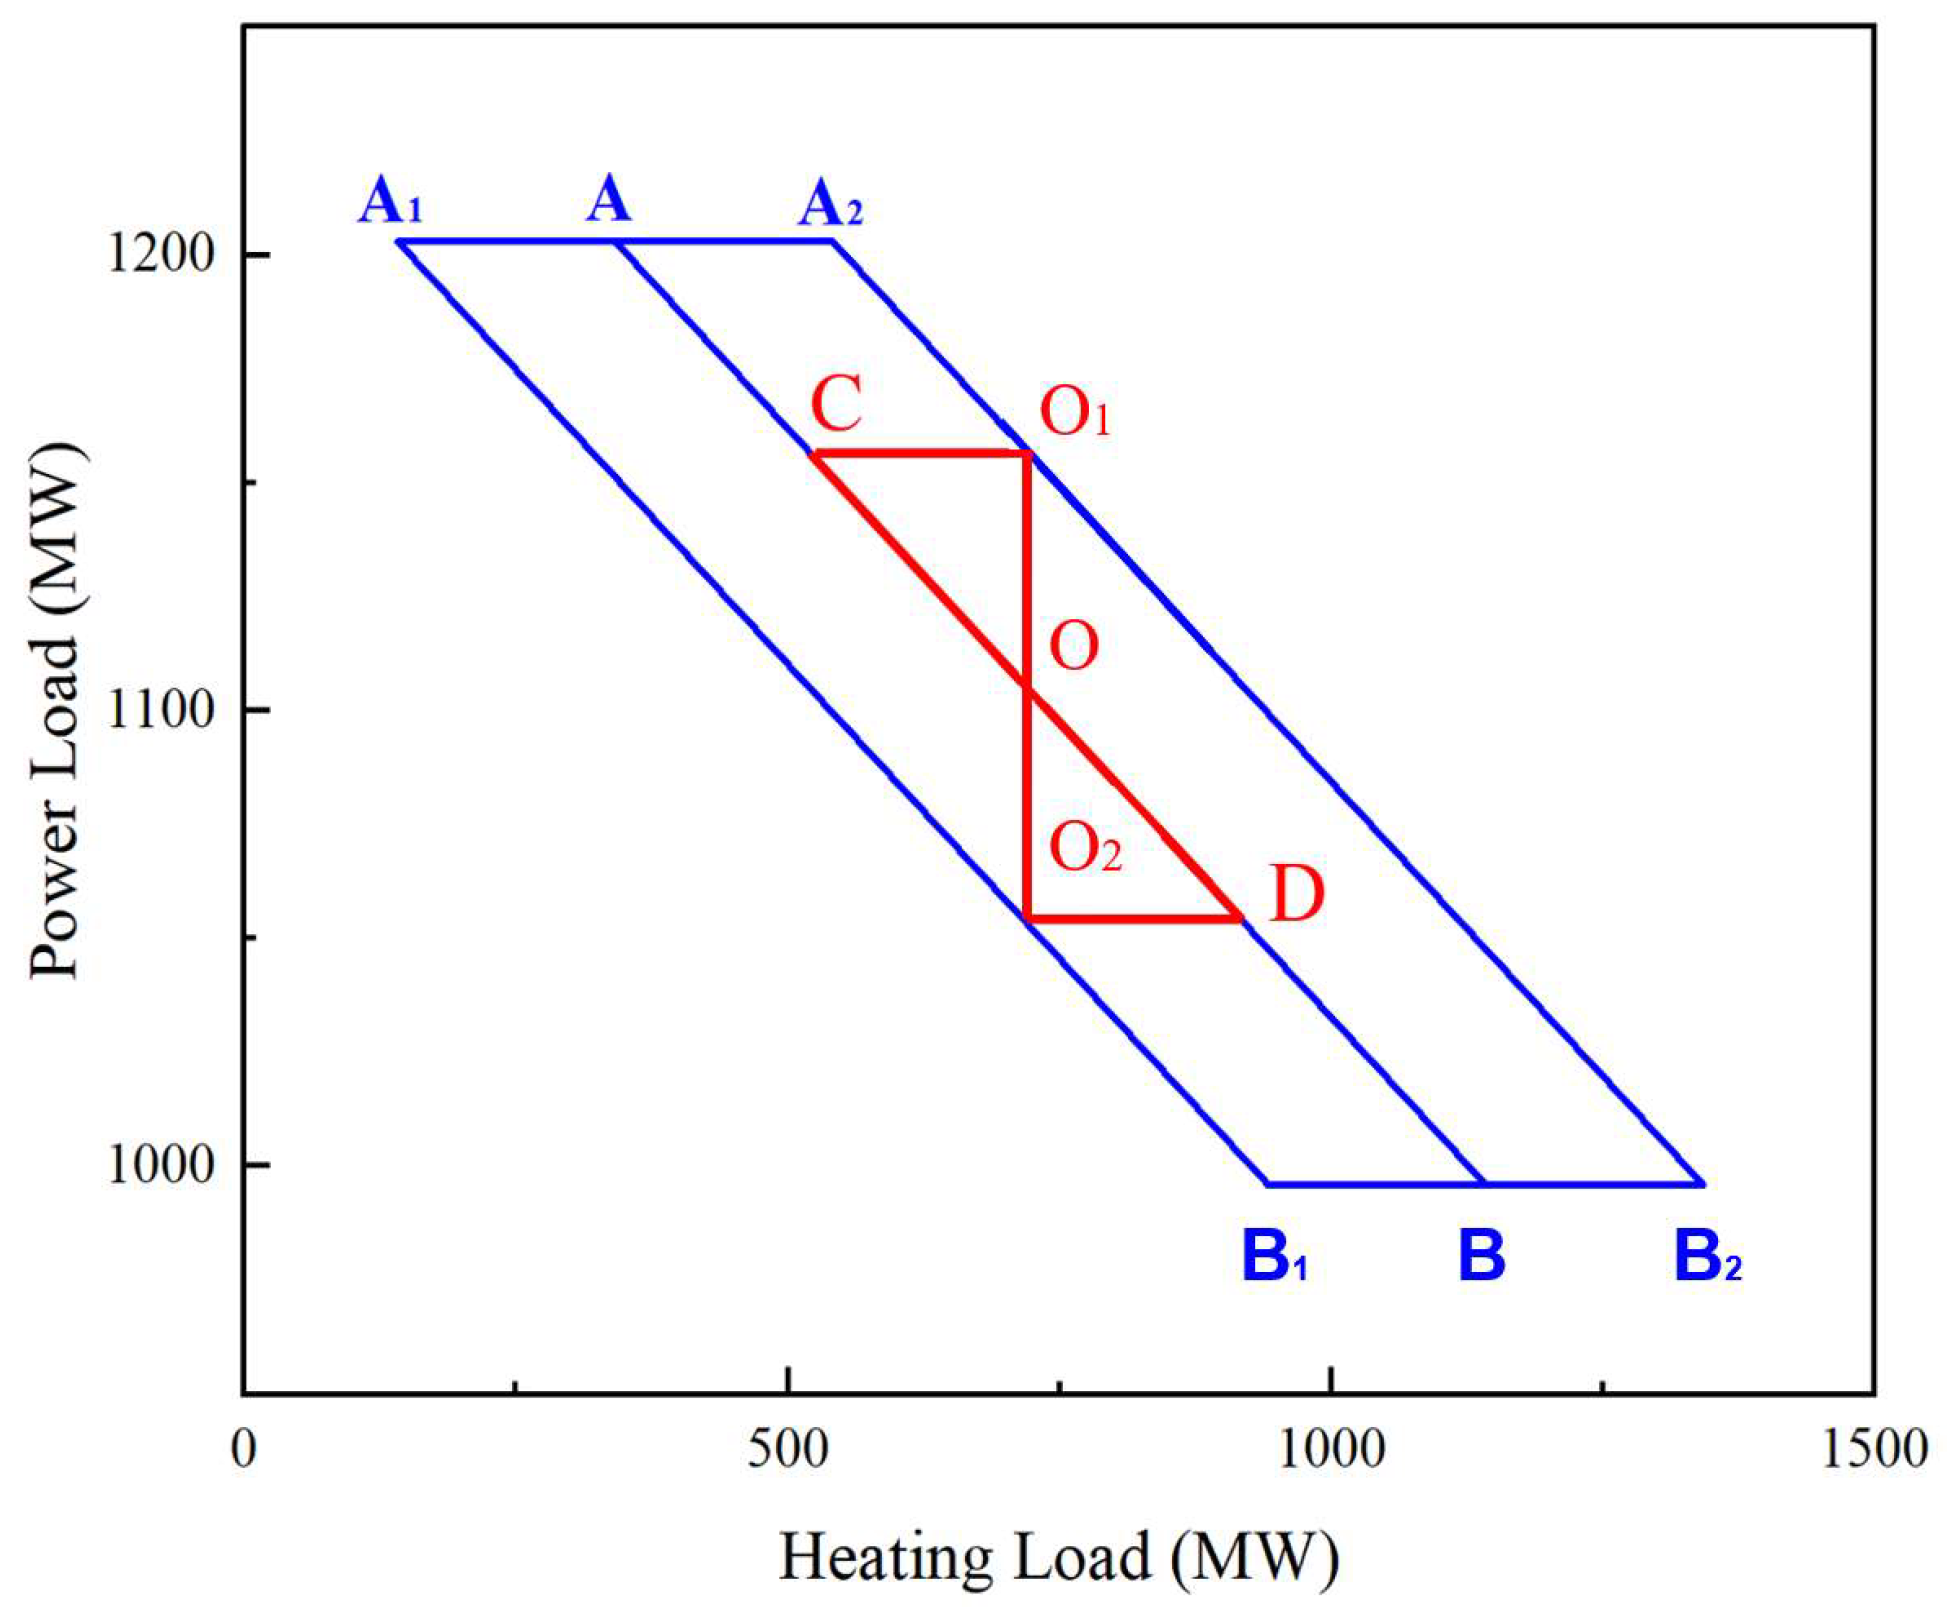
2.5. Feasible Operation Domain of the Nuclear CHP Unit

2.5.1. Without TST

For the CHP nuclear unit, the coupling relationship between the unit’s power load and heating load is the linear relationship on the premise of a constant main steam flow, as shown in Figure 3.
In the case of the CHP nuclear unit with constant output power of the nuclear reactor, the heating extraction steam of the nuclear unit Rankine cycle is constrained by the maximum design heating extraction steam and the minimum inlet steam of the low-pressure turbine, which can be expressed as the following constraint.
m h , m a x = m i n m h 1 , m h 2
where m h 1 is the maximum heating extraction steam design capacity of the nuclear power unit, and m h 2 is the heating extraction steam capacity corresponding to the minimum steam inlet condition of the low-pressure cylinder, both in t/h. The specific data are from the unit design parameter report; m h 1 is 1500 t/h and m h 2 is 2302 t/h.
Figure 3 shows that the power output adjustment of the CHP nuclear unit can be achieved within a certain range by changing the heating extraction steam of the nuclear unit without changing the nuclear reactor output power. It shows a linear relationship between the power load and heating load. Point A and Point B are the operating points with the minimum and maximum heating capacity of the reference unit, respectively.

2.5.2. Integrated TST

For the case of constant nuclear reactor output power, the CHP nuclear unit can achieve a certain degree of intra-day load adjustment according to the change in the heating load during one day. However, the adjustable domain of power generation is limited. The addition of a thermal storage device can achieve a certain degree of thermal–electrical decoupling, which increases the flexibility and domain for load adjustment without changing the reactor output power. In this paper, the reference CHP nuclear unit integrated a TST is analyzed as an example. The TST is within the capacity of 600 MWh. As shown in Figure 4, the adjustable domain of the heat–power load for the CHP nuclear unit, i.e., the operating domain A1A2B2B1A1, is shown after the introduction of the TST. Through the heat storage or release process of the TST, the corresponding operating state of the point A can reach point A1 or point A2, reducing heat load or increasing heat load without changing the power output of the reference unit. For the point B, the same effect can be achieved. So the heating load and power load coupling relationship of the reference unit changes from a single linear relationship to the operation domain with the introduction of TST.
As shown in Figure 4, taking point O as a case of working conditions, the power load is 1009 MW, and the heating load is 741.5 MW. When the power output of the unit needs to be reduced, the power load can be reduced to 959 MW according to increasing heating steam extraction, i.e., working condition of the point O2. At this point, the TST has reached its maximum heat storage capacity, reducing the power output by 50 MW. When the TST is not configured, the heat load will be increased to 941.5 MW with a reduction of 50 MW power out. This is the working condition corresponding to point D. Obviously, the TST can store an additional 200 MW of heat due to the increase in heating extraction capacity, achieving a certain degree of thermal–electrical decoupling for the unit. The power output of the reference unit is required to reach 1059 MW, i.e., the working condition of point O1. During this process, the TST releases heat to compensate for the reduction in the heating extraction. When the TST is not configured, the heating load can be reduced to 541.5 MW with the increase of 50 MW power out, i.e., the working condition of point C. The heat release process of the TST makes up for the 200 MW heat load gap. By this means of adding the TST, the operation domain is expanded, and the flexibility of the unit is improved.
In fact, the operating domain of the heating and power load of the reference unit can be improved in a certain period of time if cooperating with the thermal inertia of the large heating network.

3. Operation Strategy of the CHP Nuclear Unit

With the introduction of TST, the flexibility and domain for power load adjustment of CHP nuclear units are enhanced, achieving partial thermal–electrical decoupling. The heating load and power load coupling relationship changes from a single linear relationship to the operation domain. As the clean power generation, the peak regulation characteristics of the CHP nuclear power unit with TST was investigated for the purpose of increasing the generation capacity of the unit during peak hours of electricity consumption.
Usually, renewable energy sources, such as wind power and photovoltaic power generation, have the characteristics of randomness and uncontrollability. At the same time, the operation mode of determining power by heat in the heating season also leads to the limitation of the power output of CHP coal-fired units, thus causing the problem of an insufficient power supply during the corresponding period. In order to solve the above problems, the load adjustment capacity of the CHP nuclear unit was discussed for the heating season in this paper.
The energy system model studied consists of a wind power generation source, a solar photovoltaic power generation source, and a CHP nuclear power unit with TST. The real-time heating load and power load of the reference cogeneration unit on a typical day were selected as the boundary. Figure 5 shows the wind power data and the solar power data, and Figure 6 shows the real-time heating and power load of the reference unit.
Under the condition of constant nuclear reactor output, i.e., constant main steam flow, the load demand is evaluated for each time period, and the operation strategy is optimized by adjusting the heating extraction steam cooperating with the TST. The thermal–electrical load coupling relationship obtained in the above section are used to calculate the variation in heat load. Then, the heating extraction steam can be obtained by the following equation:
m h = Q h / ( h h h i s )
In this case, m h is the extraction steam flow rate, t/h; Q h is the real-time heating load, MW; h h is the extraction enthalpy; and h i s is the hydrophobic enthalpy, both in kJ/kg.
The imbalance between electricity supply and demand ( R ) can be considered as an indicator to assess the level of renewable energy adaptation of the integrated energy system, which should be minimized. Therefore, the objective function is defined as follows:
F = m i n R = min t = 0 96 | ( P · C H P , t + P · t ) + P · W P , t + P · S P , t P · D e m a n d , t | × 1 4
where P · C H P , t , P · W P , t , P · S P , t , are the power output directly supplied separately by the CHP nuclear unit, wind power generation source, and solar photovoltaic power generation source, where P · t is the power output change in the CHP nuclear power unit caused by the TST storing or releasing heat, and P · D e m a n d , t is the electric power demand of the integrated energy system, MW. The objective function is based on one day with a time step of 15 min.
Because the capacity of TST is limited, the thermal storage capacity of TST in a period of time cannot exceed the maximum thermal storage capacity of TST. Therefore, the constraint is as follows:
0 S t S m a x
where S m a x is the maximum thermal storage capacity of TST in MWh.
Q s r   m a x < Q s < Q s s   m a x
where Q s r   m a x is the maximum rate of TST in MW when operating in the heat storage mode, and Q s s   m a x is the maximum rate of TST in MW when operating in the exothermic mode.

4. Results and Discussion
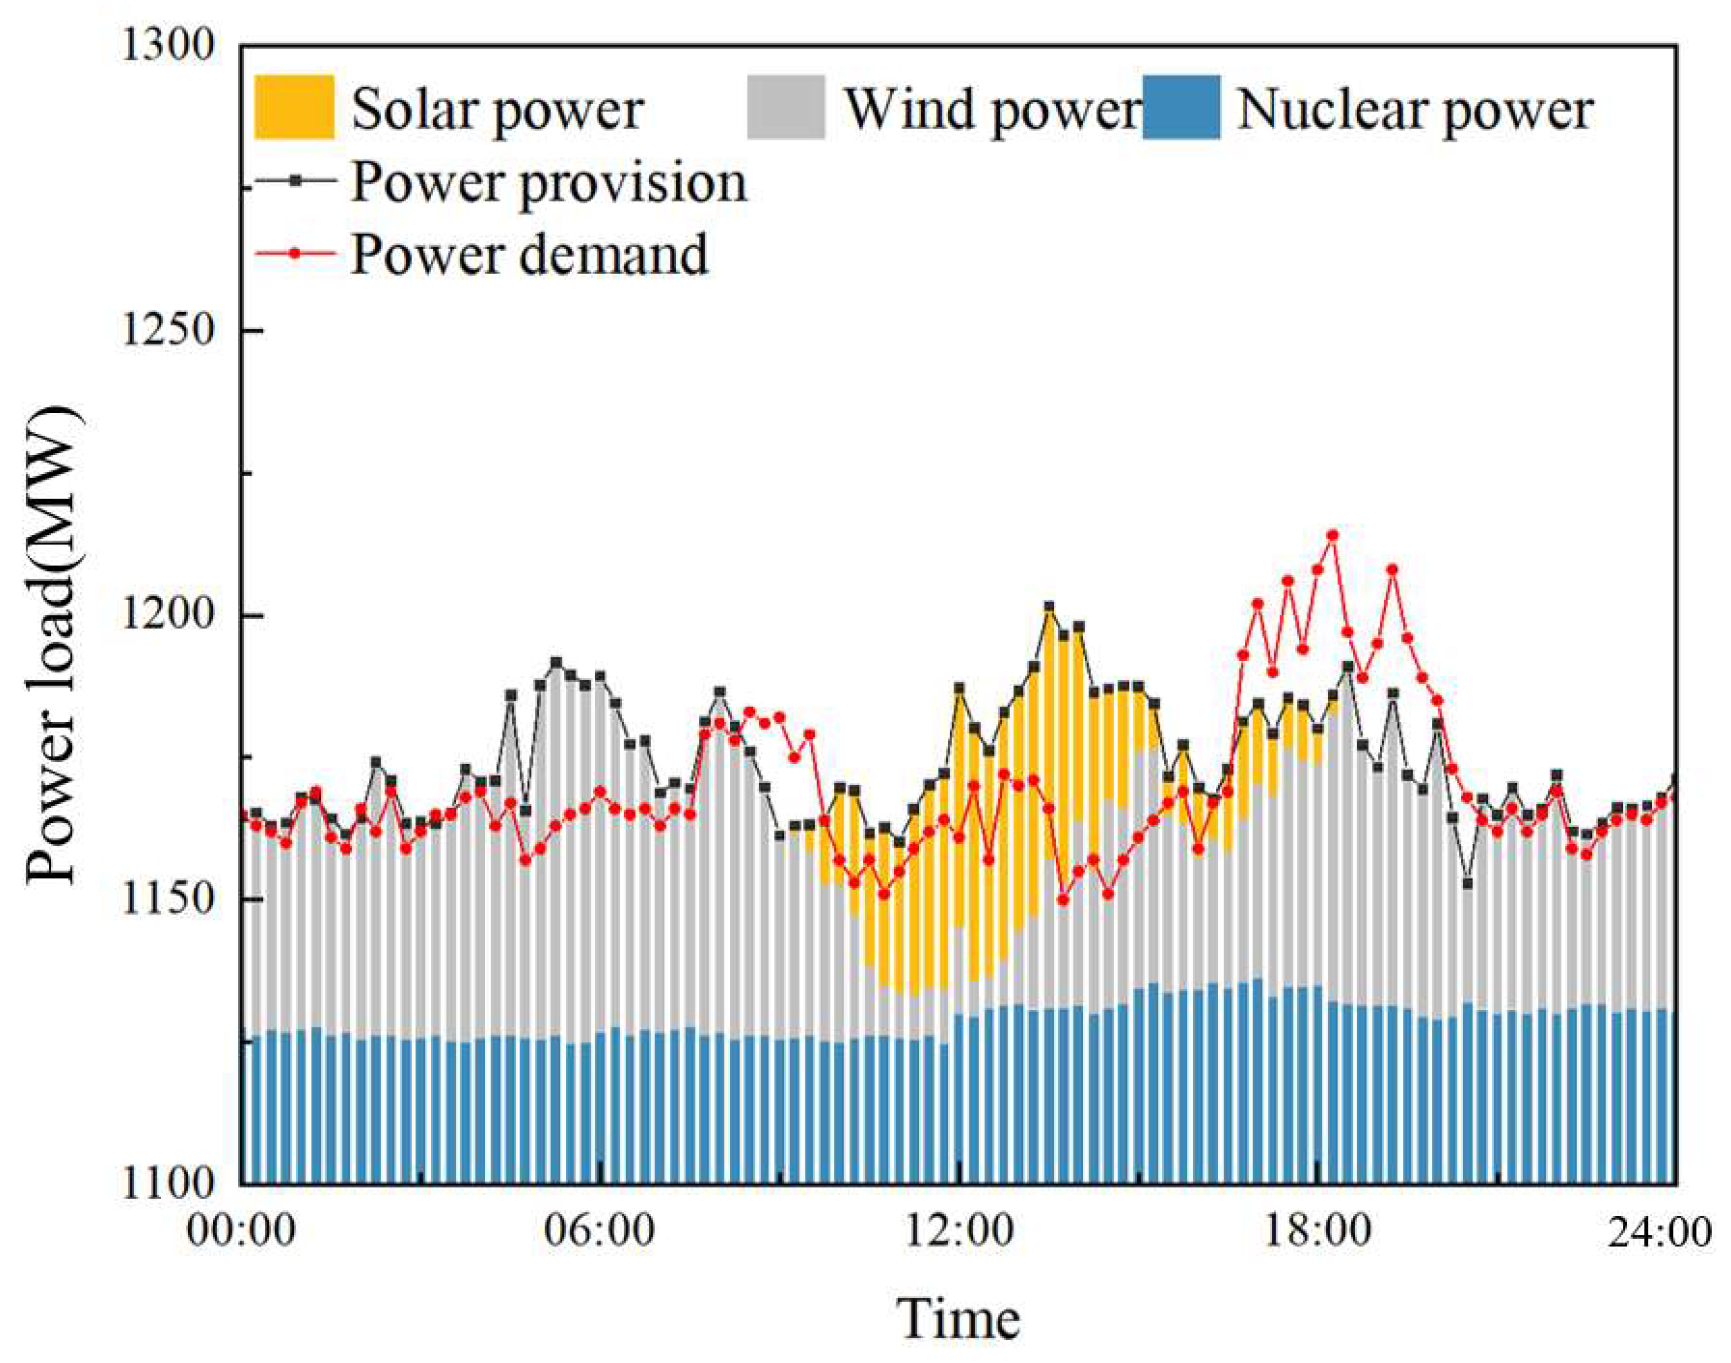
4.1. Flexibility

Figure 7 shows the power demand, supply, and corresponding power output of the various energy sources in the studied energy system. As shown in the figure, the energy system without TST has an imbalance between power demand and supply on the reference day with a value of R of 1107.99 MWh. The integration of the CHP nuclear unit with TST is able to reduce the imbalance between power supply and demand. The optimized scheduling strategy is obtained with the toolbox of MATLAB R2020a. The optimized scheduling results are shown in Figure 8a. After integrating the TST system, the R can be reduced from 1107.99 MWh to 457.24 MWh with a reduction of 58.73%, which indicates that a CHP nuclear unit with TST can balance the power demand and supply to some extent during the reference day. Thus, the TST provides greater flexibility for CHP and further improves the load balancing performance of the overall energy system. It is not difficult to see that the ability to balance power depends on the capacity of the TST.
In Figure 8, two types of strategies are also compared. The novel load adjustment strategy analyzed in this paper is shown in Figure 8a. The traditional nuclear peaking strategy, i.e., the “12-3-6-3” mode, is shown in Figure 8b. It is evident that the load adjustment strategy studied in this paper is more flexible compared to the traditional strategy, which can more effectively follow the change in the load demand. Figure 8c shows the detailed operation strategy of the TST. From the general trend, it can be seen that the TST performs several heat storage and discharge processes in the case day to reach the final optimization. It is shown that the heat storage processes are at 5:00–6:45 and 12:00–14:30, and the discharge processes are at 8:30–9:30 and 16:45–20:30, and the reference unit totally contributes 335 MWh of peak electricity within the reference day.

4.2. Environment

The operation of the TST enables the nuclear power unit to increase power generation when there is a shortage of renewable energy generation, which can be equivalent to replacing power output increases in coal-fired units in the energy system, and therefore CO2 emission reduction can be achieved.
The coal consumption rate of coal-fired units for power generation is calculated as [12,13]
B P = Q c Q P · L H V · η b η p = R L H V · η b η p
where Q c is the thermal power unit boiler cycle heat absorption, Q is the thermal power unit heating load, and P is the thermal power unit electric power, MW. L H V is the low-level heat yield of standard coal, kJ/kg. η b and η p are the thermal power unit boiler efficiency and pipeline efficiency, respectively, %. R is the heat consumption rate of coal-fired CHP units, kJ/kWh.
Referring to the literature [14], the heat consumption rate under the design condition of coal-fired units is taken as 7987 kJ/kWh. Referring to the literature [15], the low-level heat yield of standard coal is taken as 29,300 kJ/kg. According to the reference coal-fired power unit, the boiler efficiency and pipeline efficiency are taken as 92.14% and 99%, respectively. Substituting into the above equation, the standard coal consumption rate of the coal-fired unit for power generation is about 298.84 g/kWh.
According to the literature [15], the relationship between the coal consumption and carbon emissions of coal-fired units is as follows:
C O 2 = E F · M C O 2 M C · B
where E F is the emission factor taken as 0.714. M C O 2 and M C are divided into the relative atomic masses of C O 2 and C . C O 2 and B are the carbon dioxide emissions and coal consumption, respectively, per ton.
The above results show that by optimizing the operation of the TST, the CHP nuclear unit increased the overall power generation adjustment by 355 MWh in the time periods 8:30–9:30 and 16:45–20:30. According to the unit’s own thermoelectric characteristics, when the capacity of the TST is 600 MWh, it can bring 150 MWh of maximum power generation adjustment space of the unit for one time. The multiple charging and discharging process has increased the power generation adjustment of the unit by 355 MWh in a case day, improving the flexibility and economy of the unit. From the perspective of replacing coal-fired units to increase equal power generation, it is equivalent to a reduction of 106.09 tons of coal consumption, which means a reduction of 277.73 tons of carbon emissions.

4.3. Economy

Through the above discussion, the feasibility of flexible power output adjustment was explored with the introduction of TST for the CHP nuclear power unit. It can be seen that the flexibility of power output adjustment is achieved by the heat storage/exhaust process of TST under the condition of constant reactor output power.
With the reduction in coal-fired units in the future, there is wide scope for nuclear units participating in the electricity market to use their flexibility to enhance profit. Although the domestic nuclear power generation units are not yet integrated into the spot market, as the main force of new energy consumption in the future, integration into the spot market is the general trend. The standard of electricity price adopted in this paper is from the “Notice on Issues Related to Improving the Feed-in Tariff Mechanism of Nuclear Power” issued by the National Development and Reform Commission on 15 June 2013, which stipulates that new nuclear power generation units implement the benchmark feed-in tariff policy, and the national benchmark feed-in tariff for nuclear power is 0.43 RMB/kWh. The time-of-use (TOU) electricity price is one of the common pricing mechanisms and is currently being widely adopted in China. According to the document issued by Shandong Development and Reform Commission (Lu Development and Reform Price [2021] No. 893), the TOU electricity price of Shandong Province is shown in Figure 9, which is used in this study.
It is necessary to explore the benefits on this tariff basis. The relevant tariff revenue can be calculated as follows (Appendix A):
M i = p c × p i
where M i is the tariff revenue and p c is the real-time tariff following TOU electricity price. The profit calculated is shown in Figure 10. Red represents increased profit and blue represents decreased profit.
It can be seen that the integration of the TST improves the profit of the nuclear unit. As shown in Figure 10, the profit of the reference nuclear unit could be improved by CHY 70,125 in the reference day, according to participation in the load adjustment outlined in the case above.

5. Conclusions

In this paper, a novel power load adjustment method is proposed to increase the load adjustment flexibility of the CHP nuclear power unit while keeping the main steam unchanged. The overall conclusions are as follows.
(1)
In contrast to the traditional load adjustment strategy of nuclear power units, a novel strategy is proposed, which performs load tracking through adjusting the heating extraction steam of the nuclear Rankine cycle. The introduction of TST enhances the flexibility and domain of the power load adjustment of the reference unit.
(2)
By introducing the 600 MWh capacity TST, the flexibility of the reference CHP nuclear unit can be improved to a certain extent. Combined with the reference energy system data to calculate and analyze, the optimization operation of the TST can make the power supply and demand imbalance reduced from 1107.99 MWh to 457.24 MWh, a reduction of 58.73%.
(3)
The introduction of the 600 MWh TST can enable the reference unit to contribute 335 MWh of peak electricity within the reference day. From the perspective of replacing the load adjustment capacity of coal-fired power units with equal amounts, it is equivalent to a reduction of 106.09 tons of coal consumption in the reference day, which means a reduction of 277.73 tons of carbon emissions. Furthermore, the profit of the reference unit can be improved by CHY 70,125 in the reference day according to power load adjustment, benefiting from the time-of-use electricity price.
With the construction and continuous improvement in the new power system, as a clean energy source, the comprehensive utilization of nuclear energy should be realized, partly replacing the traditional coal CHP. Compared with the traditional load adjustment strategy of nuclear power, the novel strategy of nuclear power is safe, convenient, flexible, amongst others. In the future, in-depth research into the plant-level scheduling mode is needed to further expand the load adjustment capacity of a nuclear power plant and improve economic benefits, which is of great significance. Similarly, the study of heat storage device characteristics is also important to optimize dynamic performance, e.g., heat stratification studies of thermal storage tanks. And it is worth conducting in-depth analysis for the evaluation and calculation of the integration of different heat storage devices with nuclear CHP units, e.g., molten salt heat storage, etc. The above issues will be the focus of future research.

Author Contributions

L.Z.: writing—original draft. W.Z.: writing—review and editing. W.W.: writing—review and editing, software. Z.Z.: writing—review and editing. J.G.: writing—review and editing. J.S.: writing—review and editing, supervision. All authors have read and agreed to the published version of the manuscript.

Funding

This research was financially supported by the Science and Technology Project of State Grid Shandong Electric Power Research Institute (ZY-2023-04).

Data Availability Statement

Data are contained within the article.

Conflicts of Interest

Author Lingkai Zhu was employed by the company State Grid Shandong Electric Power Research Institute. The remaining authors declare that the research was conducted in the absence of any commercial or financial relationships that could be construed as a potential conflict of interest.

Nomenclature

SymbolMeaning
P Power load (MW)
Q Heat load (MW)
η g Generator efficiency (%)
η m Mechanical efficiency (%)
η b Thermal power unit boiler efficiency (%)
η p Thermal power unit pipeline efficiency (%)
h 0 Main steam enthalpy (kJ/kg)
h i Enthalpy of the extraction steam to No.i regenerative heater (kJ/kg)
h w , i Feed water enthalpy of No.i regenerative heater (kJ/kg)
h d , i Hydrophobic enthalpy of No.i regenerative heater (kJ/kg)
h e s Enthalpy of exhaust steam from low-pressure cylinder (kJ/kg)
h h Extraction enthalpy (kJ/kg)
h i s Hydrophobic enthalpy (kJ/kg)
h a Enthalpy of water from the reheater to No.1 regenerative heater (kJ/kg)
h b Enthalpy of water from the moisture separator to the deaerator (kJ/kg)
qiEnthalpy drop of extraction steam (kJ/kg)
τ i Enthalpy rise of the feed water of No.i regenerative heater (kJ/kg)
yiEnthalpy drop of drainage of No.i regenerative heater (kJ/kg)
σ Reheat heat section enthalpy rise (kJ/kg)
SCapacity of the thermal storage tank (MWh)
Q S Storage and exothermic rate of the thermal storage tank (MW)
m f w Feed water flow rate (t/h)
m i Mass flow rate of steam extraction to No.i regenerative heater (t/h)
m i w Inlet flow rate of deaerator (t/h)
m c w Inlet flow rate of No.4 regenerative heater (t/h)
m a Flow rate from the reheater to No.1 regenerative heater (t/h)
m b Flow rate from moisture separator to deaerator (t/h)
m t Extraction steam flow matched with the thermal storage in the TST (t/h)
m h Extraction steam flow for heating (t/h)
m h Extraction steam flow rate (t/h)
P · C H P , t Power output directly supplied separately by the CHP nuclear unit (MW)
P · W P , t Power output directly supplied separately by wind power generation source (MW)
P · S P , t Power output directly supplied separately by solar photovoltaic power generation source (MW)
P · t Power output change in the CHP nuclear power unit caused by the TST storing or releasing heat (MW)
R Imbalance between electricity supply and demand (MWh)
L H V Low level heat yield of standard coal (kJ/kg)
B Coal consumption (t)
Abbreviations
TSTThermal storage tank
CHPCombined heat and power
RHRegenerative heater

Appendix A. Additional Case Studies

Objective Function

In order to complete the study, calculation and analysis are also carried out with the purpose function of maximizing the revenue of the CHP nuclear power units in this paper, and the objective function is shown in Equation (22).
The results on the premise of maximizing returns are shown in Figure A1. After integrating the TST system, the R can be reduced from 1107.99 MWh to 809.45 MWh. Actually, the reduction in the power imbalance of the reference energy system is only 26.89%, which is less than the v a l u e gained for the purpose of minimizing R .
Figure A1. The novel load adjustment strategy at maximum profit.
Energies 17 01357 g0a1
Figure A2 shows the detailed operation strategy of TST with maximum gains. The figure shows that the heat storage process is performed at 0:00–5:15, and the heat release process is performed at 8:30–9:30 and 18:45–20:30. The reference unit contributes a total of 282 MWh of peak electricity.
Figure A2. Operation status of TST.
Energies 17 01357 g0a2
The gains are shown in Figure A3. The profit of the reference nuclear unit could be improved by CHY 120,470 in the reference day according to participating in load adjustment in the case above. Red represents increased profit and blue represents decreased profit.
Figure A3. Profit of the reference unit.
Energies 17 01357 g0a3

References

  1. The Fourteenth Five-Year Plan for Energy Development of Shandong Province. August 2021. Available online: http://fgw.shandong.gov.cn/art/2021/8/19/art_250630_10361220.html (accessed on 17 February 2024).
  2. Yezhen, Q. China’s nuclear power development after Fukushima Nuclear Power Station accident. Proc. Chin. Soc. Electr. Eng. 2012, 32, 1–8. [Google Scholar]
  3. Eliasi, H.; Menhaj, M.B.; Davilu, H. Robust nonlinear model predictive control for nuclear power plants in load following operations with bounded xenon oscillations. Nucl. Eng. Des. 2011, 241, 533–543. [Google Scholar] [CrossRef]
  4. Gowrisankaran, G.; Reynolds, S.S.; Samano, M. Intermittency and the Value of Renewable Energy. J. Politi-Econ. 2016, 124, 1187–1234. [Google Scholar] [CrossRef]
  5. Denholm, P.; Margolis, R.M. Evaluating the limits of solar photovoltaics (PV) in electric power systems utilizing energy storage and other enabling technologies. Energy Policy 2007, 35, 4424–4433. [Google Scholar] [CrossRef]
  6. Denholm, P.; Hand, M. Grid flexibility and storage required to achieve very high penetration of variable renewable electricity. Energy Policy 2011, 39, 1817–1830. [Google Scholar] [CrossRef]
  7. Traber, T.; Kemfert, C. Gone with the wind?—Electricity market prices and incentives to invest in thermal power plants under increasing wind energy supply. Energy Econ. 2011, 33, 249–256. [Google Scholar] [CrossRef]
  8. Van den Bergh, K.; Delarue, E. Cycling of conventional power plants: Technical limits and actual costs. Energy Convers. Manag. 2015, 97, 70–77. [Google Scholar] [CrossRef]
  9. Jenkins, J.; Zhou, Z.; Ponciroli, R.; Vilim, R.; Ganda, F.; de Sisternes, F.; Botterud, A. The benefits of nuclear flexibility in power system operations with renewable energy. Appl. Energy 2018, 222, 872–884. [Google Scholar] [CrossRef]
  10. Park, J.H.; Heo, J.Y.; Lee, J.I. Techno-economic study of nuclear integrated liquid air energy storage system. Energy Convers. Manag. 2022, 251, 114937. [Google Scholar] [CrossRef]
  11. Carlson, F.; Davidson, J.H. Parametric study of thermodynamic and cost performance of thermal energy storage coupled with nuclear power. Energy Convers. Manag. 2021, 236, 114054. [Google Scholar] [CrossRef]
  12. Liu, Z.; Guan, D.; Wei, W.; Davis, S.J.; Ciais, P.; Bai, J.; Peng, S.; Zhang, Q.; Hubacek, K.; Marland, G.; et al. Reduced carbon emission estimates from fossil fuel combustion and cement production in China. Nature 2015, 524, 335–338. [Google Scholar] [CrossRef] [PubMed]
  13. Wang, Z.; Gu, Y.; Liu, H.; Li, C. Optimizing thermal–electric load distribution of large-scale combined heat and power plants based on characteristic day. Energy Convers. Manag. 2021, 248, 114792. [Google Scholar] [CrossRef]
  14. Wang, C.; Song, J. Optimal dispatch of the cascade heating CHP plants integrating with the high back-pressure technology. Case Stud. Therm. Eng. 2022, 38, 102330. [Google Scholar] [CrossRef]
  15. Wang, C.; Song, J.; Zhu, L.; Zheng, W.; Liu, Z.; Lin, C. Peak shaving and heat supply flexibility of thermal power plants. Appl. Therm. Eng. 2021, 193, 117030. [Google Scholar] [CrossRef]
Figure 1. CHP nuclear unit without TST configuration.
Energies 17 01357 g001
Figure 2. CHP nuclear unit with TST.
Energies 17 01357 g002
Figure 3. Coupling relationship of the CHP nuclear unit without TST.
Energies 17 01357 g003
Figure 4. Operating domain of the reference CHP nuclear unit with TST.
Energies 17 01357 g004
Figure 5. Wind power and the solar power.
Energies 17 01357 g005
Figure 6. Real-time heating load and power load.
Energies 17 01357 g006
Figure 7. Output power of the reference energy system.
Energies 17 01357 g007
Figure 8. Comparison of different strategies. (a) Flexible load adjustment strategy after introducing TST. (b) Load adjustment strategy with the “12-3-6-3” mode. (c) Operation of TST according to the flexibility strategy.
Energies 17 01357 g008
Figure 9. TOU electricity price.
Energies 17 01357 g009
Figure 10. Profit of the reference unit under the flexible load adjustment strategy.
Energies 17 01357 g010
Table 1. Parameters of AP1000 nuclear turbine unit turbine part.
Category NameUnitValue
Main steam parametersPressureMPa5.530
EnthalpykJ/kg2783.7
Flowt/h6789.61
Generator efficiency η g %98.95
Mechanical efficiency η m %99.0
Power generationWkW1,203,648
Table 2. Thermodynamic parameters of the state points in the CHP components (kJ/kg).
Enthalpy of
Vapor Extraction
Enthalpy of
Water Supply
Enthalpy of DrainageEnthalpy of
Hydrophobicity
RH12657.1973.0852.4875.2
RH22519.2852.4745.1766.3
Deaerator2513.2763.5565.10
RH42781.4565.1 459.4482.2
RH52650.2458.4333.41055.4
RH61890.5333.4275.5298.0
RH72101.0275.5124.2151.4
Table 3. Parameters of the TST.
CategoryNameUnitValue
CapacitySMW·h600
Storage and exothermic rate Q S MW200
Inlet temperature T 1 °C175.3
Outlet temperature T 2 °C70
Table 4. Model validation results for the power out.
Model Calculation Data/MWDesign Data/MWRelative Error
Compared to the
Design Data (%)
Actual Data/MWRelative Error
Compared to the
Actual Data (%)
123512390.3212410.57
119211940.1711960.33
113111350.3511380.61
107210740.1910750.27
100810110.2910130.49
9849870.309890.50
Disclaimer/Publisher’s Note: The statements, opinions and data contained in all publications are solely those of the individual author(s) and contributor(s) and not of MDPI and/or the editor(s). MDPI and/or the editor(s) disclaim responsibility for any injury to people or property resulting from any ideas, methods, instructions or products referred to in the content.

