Article

Dynamic Modeling and Control of Supercritical Carbon Dioxide Power Cycle for Gas Turbine Waste Heat Recovery

1
College of Mechanical and Electrical Engineering, Beijing University of Chemical Technology, Beijing 100029, China
2
Department of Electrical and Computer Engineering, Baylor University, Waco, TX 76798, USA
*
Authors to whom correspondence should be addressed.
Energies 2024, 17(6), 1343; https://doi.org/10.3390/en17061343
Submission received: 2 February 2024 / Revised: 27 February 2024 / Accepted: 8 March 2024 / Published: 11 March 2024
(This article belongs to the Special Issue Waste Heat Recovery Optimization in Gas Turbines)

Abstract

:
The gas turbine is a crucial piece of equipment in the energy and power industry. The exhaust gas has a sufficiently high temperature to be recovered for energy cascade use. The supercritical carbon dioxide (S-CO2) Brayton cycle is an advanced power system that offers benefits in terms of efficiency, volume, and flexibility. It may be utilized for waste heat recovery (WHR) in gas turbines. This study involved the design of a 5 MW S-CO2 recompression cycle specifically for the purpose of operational control. The dynamic models for the printed circuit heat exchangers, compressors, and turbines were developed. The stability and dynamic behavior of the components were validated. The suggested control strategies entail utilizing the cooling water controller to maintain the compressor inlet temperature above the critical temperature of CO2 (304.13 K). Additionally, the circulating mass flow rate is regulated to modify the output power, while the exhaust gas flow rate is controlled to ensure that the turbine inlet temperature remains within safe limits. The simulations compare the performance of PI controllers tuned using the SIMC rule and ADRC controllers tuned using the bandwidth method. The findings demonstrated that both controllers are capable of adjusting operating conditions and effectively suppressing fluctuations in the exhaust gas. The ADRC controllers exhibit a superior control performance, resulting in a 55% reduction in settling time under the load-tracking scenario.

1. Introduction

Novel thermoelectric power cycle systems that utilize substitute fluid have demonstrated notable benefits concerning thermodynamic and economic efficiency. The primary substitute fluids in the industrial domain include organics, ammonia, helium, carbon dioxide, and their mixtures [1]. The thermal cycle utilizing supercritical carbon dioxide (S-CO2) demonstrates remarkable adaptability, allowing for operation in situations with quickly fluctuating load circumstances. This feature is especially beneficial for maintaining equilibrium in varied renewable energy systems. Sandia National Laboratories [2] in the United States were the pioneers in identifying the potential of S-CO2 for power conversion systems. They found that these systems have significantly greater thermal efficiency compared to the steam Rankine cycle and the helium Brayton cycle, namely in the temperature range of 500–700 °C. Tokyo Institute of Technology [3], Korea Advanced Institute of Science and Technology (KAIST), Korea Atomic Energy Research Institute (KAERI) [4], and Becker Ship Propulsion (BSP) have individually undertaken an array of experimental setups and tests. In contrast, a limited number of research institutions have accomplished the intricate processes of designing and experimenting with experimental systems at the megawatt scale. The supercritical v power system has higher efficiency, compactness, and adaptability benefits in comparison to conventional coal-fired power generation. Its primary applications include waste heat recovery [5], geothermal energy utilization, marine propulsion, concentrated solar power (CSP) generation, and advanced nuclear reactors.
Significant amounts of waste heat are produced in various industrial sectors, including iron and steel, chemical, power plant, cement, and textile industries. The utilization of these waste heat sources, enabled by heat transfer and other advanced technologies, can generate electricity, provide heating for various applications, or support other industrial procedures. The strategic utilization of waste heat in industrial production not only has economic benefits but also conforms with the principles of sustainable development, making a substantial contribution to the reduction of greenhouse gas emissions. Olumide [6] formulated a dynamic model for the S-CO2 recompression cycle with the intention of investigating the dynamic performance and control strategies for waste heat recovery within the cement industry. The dynamic performance of the system was then analyzed while subject to varying heat source mass flow rates and temperatures, assuming the system was operating stably. Ty Neises and Craig Turchi [7] investigated the design, performance, and cost of different setups—simple cycle, recompression Brayton cycle, and partially cooled cycle—within an S-CO2 power cycle integrated into a molten-salt/solar-power system. The results indicated that the recompression Brayton cycle configuration was the most efficient, while the partially cooled cycle configuration had a minor economic advantage over the recompression cycle. Khan [8] et al. conducted a comparative analysis of two S-CO2 Brayton cycle multiproduction configurations: regenerative and recompression. The study examined these configurations from both thermodynamic and energy-economic perspectives. The findings demonstrated the superiority of the recompression type over the regenerative type in terms of net power output, thermal efficiency, and economic performance. Song et al. [9] introduced a hybrid system that combines S-CO2 and Organic Rankine Cycle (ORC) to recover the waste heat generated by internal combustion engines. The study implemented the S-CO2 cycle system as the primary method for directly recovering waste heat, while the bottom ORC system transformed the recovered heat into extra energy. The study also examined the highest achievable power output of the independent S-CO2 cycle in comparison to the combined S-CO2 and ORC cycle. The results showed a significant 18% improvement in thermal efficiency when the bottom cycle was included, although it was accompanied by a 4% increase in marginal cost. Li et al. [10] utilized a preheated system based on an S-CO2 cycle to capture and utilize the waste heat generated by diesel and engine exhaust gases. A regeneration branch was added to the preheated cycle, and a heat exchanger was integrated into the branch. The introduction of this novel arrangement resulted in a significant enhancement of 7.3% in the maximum net power when compared to the old system.
Gas turbines are widely used in power generation systems and have the advantages of low pollutant emissions from the combustion process, fast start–stop response, and high overall efficiency. To ensure high energy utilization efficiency, it is necessary to consider the cascaded utilization of energy, so many scholars have studied gas turbine waste heat recovery (GTWHR). Zare et al. [11] constructed a model for an ammonia–water power/cooling cogeneration system aimed at the recuperation of waste heat generated by a gas turbine. The study systematically assessed the performance of the gas turbine within the context of combined heat and power generation. Different optimization strategies were employed to discern the optimal parameters for the decision variables. The outcomes demonstrated a 5.94% enhancement in thermal efficiency and a 5.38% reduction in the overall operating costs when subjected to optimization by the principles of the second law of thermodynamics. Yoon et al. [12] conducted a study where they employed ORC and transcritical CO2 (t-CO2) cycles to recover flue gas heat from gas turbines. They compared the two systems and found that ORC produces approximately 5.5% more power than t-CO2. Additionally, they concluded that t-CO2 is better suited as a bottoming cycle when the gas turbine operates for extended durations at low loads. Najjar et al. [13] coupled a propane Organic Rankine Cycle (ORC) as the top cycle with a bottoming refrigeration cycle for the recovery of waste heat from a gas turbine. The cascaded utilization of waste heat was implemented to enhance the system’s electricity generation capacity and efficiency. The study included calculations of the system’s output power and energetic efficiency under different ambient temperatures. Nami et al. [14] designed both a cascade system and a series system to recuperate waste heat from the exhaust of an offshore gas turbine. They examined the influence of four distinct circulating agents on power generation efficiency. Additionally, the energetic effects of heat load and heat source temperature were analyzed. Cao et al. [15] presented a biomass gas turbine system where waste heat is employed for either power generation via an organic Rankine cycle or for cooling the compressor inlet through an absorption cooling cycle. This study utilized a genetic algorithm to optimize the objective function of both systems from a thermo-economic standpoint. The findings indicated that employing waste heat for compressor inlet cooling exhibits higher exergy efficiency compared to its use in electricity generation for thermal purposes.
The temperature of the exhaust gas from the gas turbine for power generation is within the range of 300–750 K, which can be effectively integrated with S-CO2 cycle systems. In pursuit of enhancing the waste heat efficiency of gas turbines, researchers have undertaken studies focusing on the GT-SCO2 combined cycle. Wang et al. [16] introduced a tri-generation system that integrates a gas turbine cycle, a regenerative S-CO2 cycle, an ORC cycle, and a bottom absorption refrigeration cycle (ARC) to generate hot water, cooling, and electricity. The system underwent a thorough analysis from exergoeconomic and thermodynamic perspectives, and the optimization of the system’s performance objective function was accomplished using the particle swarm optimization algorithm. Du et al. [17] introduced a novel three-stage series WHR system for effectively harnessing the high-temperature exhaust gas waste heat produced by the gas turbine. The system’s performance was evaluated using thermodynamic and economic models. Additionally, parameter sensitivity analysis and multi-objective optimization techniques were employed to attain the optimal performance of the system. Chen et al. [18] presented a technique to examine the performance of S-CO2 cycles under off-design conditions caused by variations in the heat source. The impact of the heat source fluctuations on the cycle was studied, and the thermodynamic efficiency and economic objective were optimized for four S-CO2 layouts. Bonalumi et al. [19] explored the performance of a partial heating supercritical CO2 cycle as the bottoming cycle for a small gas turbine and conducted a techno-economic optimization. Antonio et al. [20] enhanced waste heat recovery efficiency in the bottoming cycle of gas turbines in the 5–10 MW power range by analyzing the application of partial heating supercritical CO2 cycles. While maintaining the compactness of the gas turbine, they further increased the efficiency of waste heat recovery. The relationship between turbine outlet temperature and the efficiency of high-temperature and low-temperature heaters was investigated. Sicali et al. [21] explored a 5 MW gas turbine with the single heated cascade S-CO2 cycle through a parametric analysis. The findings revealed the potential recovery of approximately 1500 kW of net electrical power. Cao et al. [22] assessed the feasibility and economics of a cascaded S-CO2 combined cycle for typical gas turbine waste heat recovery through a techno-economic analysis. The study involved a comparison and optimization of eight types of gas turbines, revealing that the cascaded S-CO2 combined cycle demonstrated thermodynamic advantages in small gas turbines with high exhaust gas temperatures. Jin et al. [23] developed a model for a recompression S-CO2 Brayton cycle, taking into account finite temperature-difference heat transfer, irreversible expansion, and irreversible compression. The objective was to attain an optimal equilibrium point for net power output, isentropic efficiency, thermal efficiency, and ecological function through multi-objective optimization. Bian et al. [24] comprehensively reviewed four configurations and corresponding control strategies for the S-CO2 Brayton cycle (SCBC). This inclusive investigation encompassed a dynamic simulation of the system model, evaluation of the open-loop dynamic performance of SCBC, exploration of control methodologies for critical state parameters, and analysis of load tracking.
Hu et al. [25] devised a one-dimensional dynamic simulation model for the PCHE within the S-CO2 Brayton cycle. The model was utilized to compute the dynamic response of the PCHE under varying conditions. To enhance the precision in depicting the heat transfer characteristics of the Printed-Circuit Heat Exchanger (PCHE), this study develops a one-dimensional heat transfer model. Deng et al. [26] developed models for the main components of the S-CO2 recompression Brayton cycle, wherein the compressor and turbine were designed based on isentropic processes with fixed pressure ratios and efficiencies. Additionally, a mathematical model for the PCHE was established based on continuity and energy equations for heat transfer processes. Ma et al. [27] established a three-dimensional computational solid model for a straight-channel PCHE. They utilized the finite volume method to solve the flow and heat transfer equations of S-CO2. Under specified operating conditions, particular emphasis was placed on studying the dynamic response characteristics of the heat exchanger. Furthermore, the computed results were compared with reference values to validate the accuracy of the model. Felipe et al. [28] utilized working fluid storage system control in the re-compression Brayton cycle, conducting simulation experiments by adjusting the input flow rate and temperature of the entire system working fluid. Minh Tri Luu et al. [29] introduced control strategies for working fluid mass flow and re-compressor inlet throttling, incorporating two additional control combination methods based on Anton’s work. Zhang et al. [30] developed a novel waste heat-recovery power generation system based on a new type of supercritical carbon dioxide power cycle by independently controlling the outlet parameters of the recompression compressor and the main compressor obtaining superior off-design performance. Additionally, the study investigated the influence of exhaust gas temperature within a specific range on the performance of the main compressor. Dai [31] analyzed the dynamic performance of a 20 MW S-CO2 recompression cycle using Simulink software 2019a. A stable operating control scheme was proposed, and the effectiveness of the control was verified by reducing disturbances in the bypass ratio. Ding et al. [32] developed a transient model of the S-CO2 Brayton cycle using the Modelica language and compared the transient simulation results of different control methods, including single control methods and combined control methods. By studying the adjustment characteristics under different control strategies, the aim was to address issues such as low or excessive pressure fluctuations at the inlet of the main compressor and improve the performance and efficiency of the Brayton cycle.
Previous investigations have demonstrated the efficacy of the S-CO2 cycle in efficiently utilizing gas turbine exhaust gas. In this study, the dynamic model of the S-CO2 recompression cycle for GTWHR was established using MATLAB/Simulink 2020a. This model is used to assess the practicability of GTWHR and the corresponding control strategy. The mathematical models for the PCHE, turbine, compressor, and valves are systematically formulated. Steady-state simulations for each component are conducted to ascertain the cycle parameters under grid-connected operating conditions. Subsequently, dynamic simulations of the system cycle are carried out to investigate the transient characteristics, including variations in turbine inlet temperature, turbomachinery outlet pressure, and system output power concerning the fluctuations in the temperature and mass flow rate of gas turbine exhaust gas. To regulate the output power of the cycle and keep some key parameters stable and safe, different system control strategies were investigated, as well as the controller designs, namely the PI controller and the Active Disturbance Rejection Controller (ADRC). The simulations under different scenarios indicate that the proposed method can potentially enhance the power cycle’s operational flexibility.

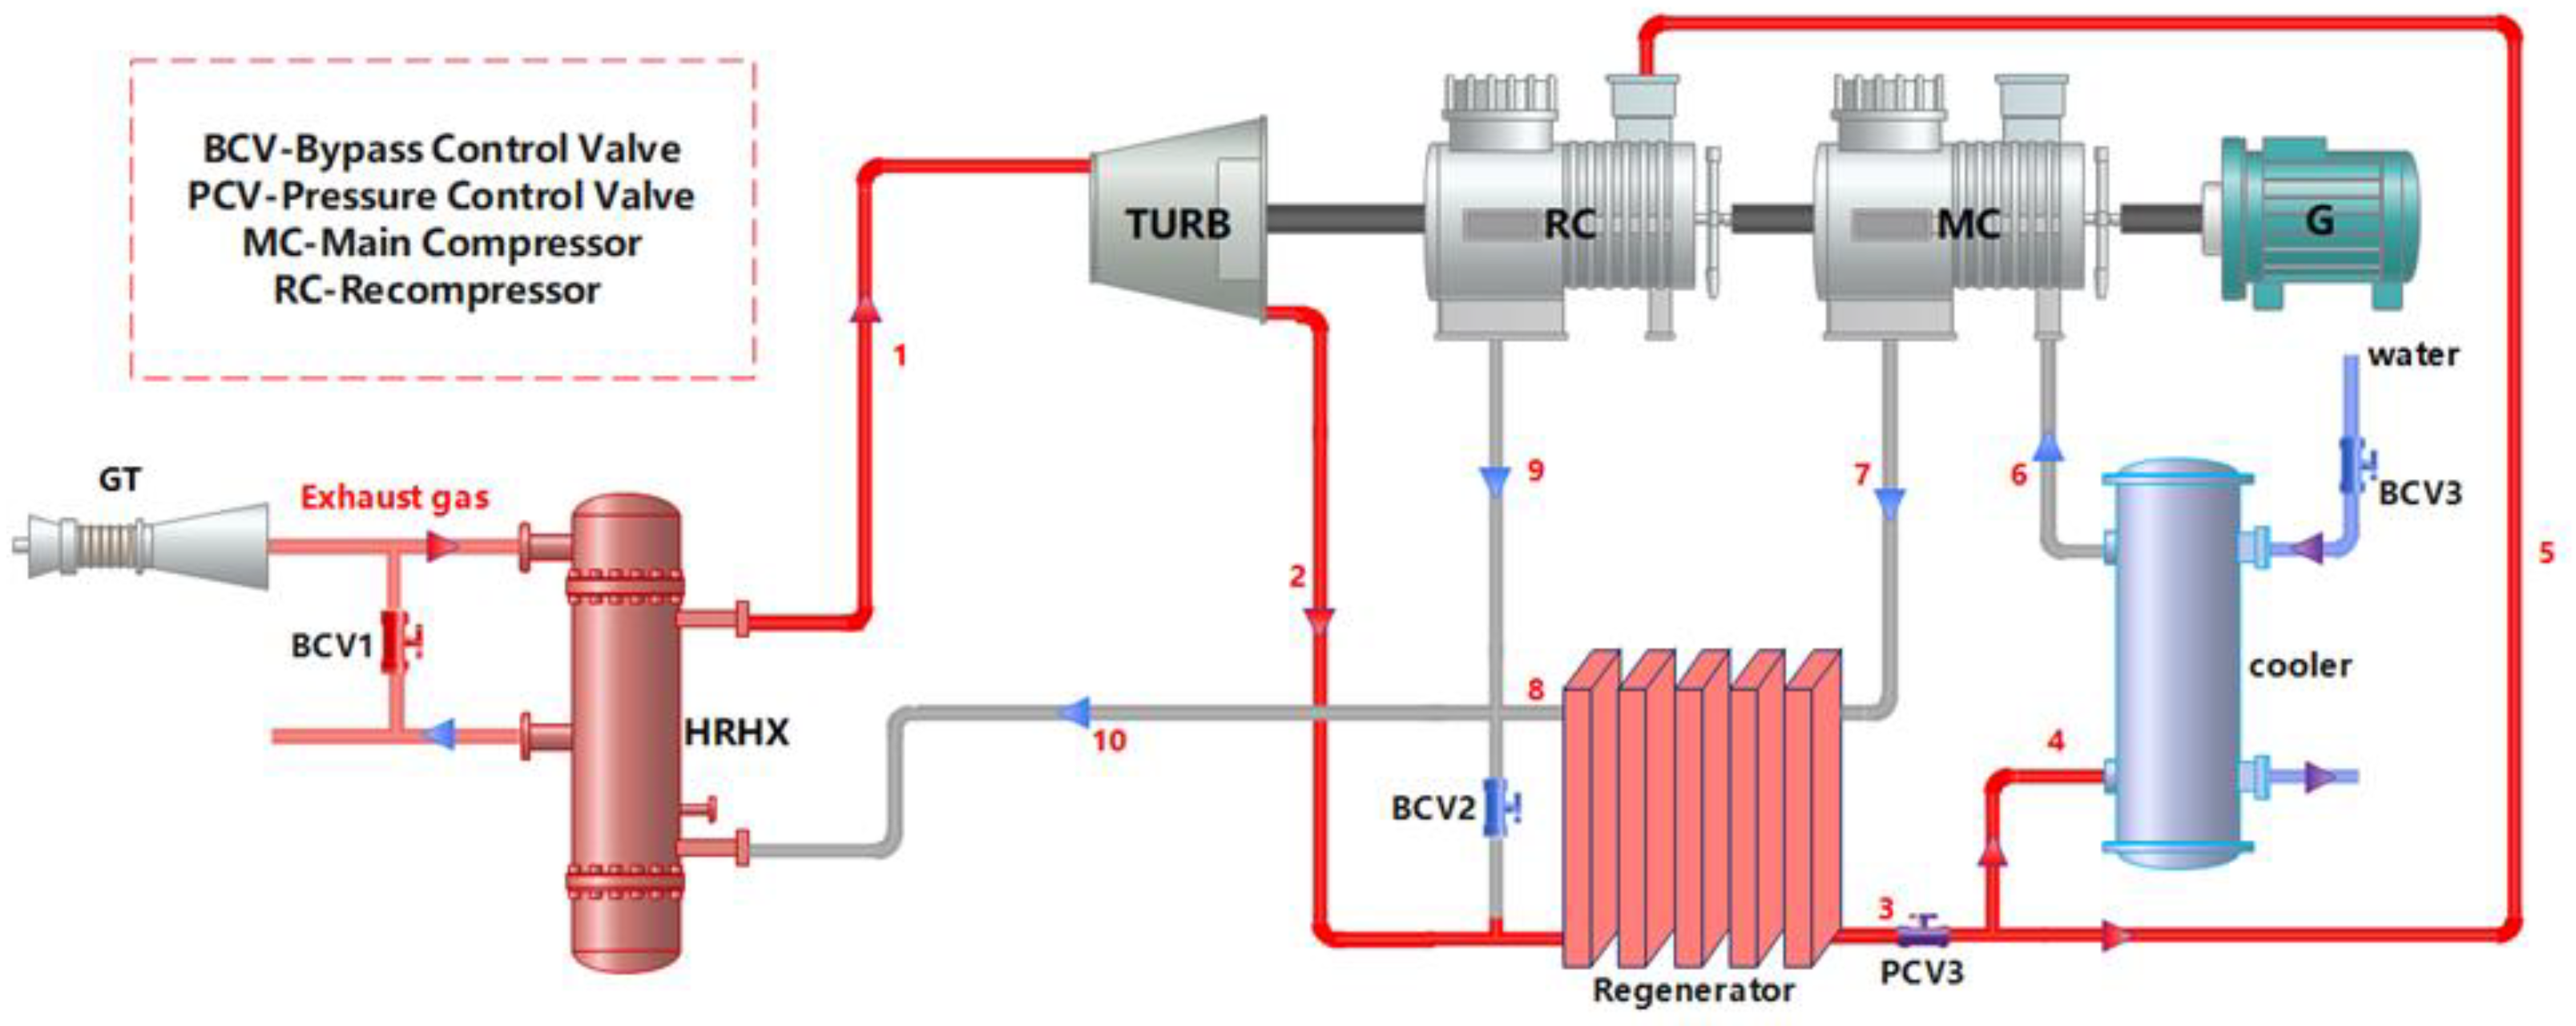
2. System Configuration and Description

The configuration of the recompression cycle, as established in this study, is depicted in Figure 1. The low-temperature S-CO2 mass undergoes pressurization by the main compressor before entering the regenerator. Within the regenerator, it undergoes heating facilitated by the high-temperature S-CO2 from the turbine outlet. Subsequently, this preheated S-CO2 enters the high-temperature heater, where it undergoes further heating through exposure to the exhaust gas from the gas turbine. This heated stream then propels the turbine to perform work. The S-CO2 emerging from the turbine outlet has an exothermic process upon entering the return heater, subsequently dividing into two streams. One segment is entered into the re-compressor for pressurization and subsequently mixed with the S-CO2 from the outlet of the cold side of the return heater, entering the heater. The remaining portion undergoes cooling in the pre-cooler before entering the main compressor, thereby completing the closed cycle.

2.1. Printed Circuit Heat Exchanger

The heat exchanger, as an integral component within the closed S-CO2 Brayton cycle, holds the highest proportion and occupies the largest volume among the thermal devices. Within the heat exchanger, the working fluid undergoes processes of reheating, absorption, and cooling, with key components, including the heat source heater, recuperator, and cooler. Due to the unique physical properties of supercritical carbon dioxide, the most prevalent heat exchanger utilized in practical applications is the PCHE. To formulate the dynamic model of the heat exchanger, it is commonly regarded as a counterflow heat exchanger comprising hot flow, cold flow, and metallic walls. The modeling approach involves applying conservation equations for energy, mass, and momentum to characterize the regions of hot and cold fluid flows. Furthermore, the energy conservation equation is employed to model the heat exchange within the metallic walls.
The general mass conservation equation for the control volume of hot and cold fluid flows is as follows:
V d ρ d t = m ˙ i n m ˙ o u t
The energy conservation equation for the hot flow side is as follows:
V d ( ρ h ) d t = m ˙ i n h i n m ˙ o u t h o u t Q h w
The energy conservation equation for the cold flow side is as follows:
V d ( ρ h ) d t = m ˙ i n h i n m ˙ o u t h o u t Q w c
The energy conservation equation for the metallic wall is as follows:
M w C w d T w d t = Q h w Q w c
The equation usually employed to evaluate transitory convection heat is the transient heat conduction equation. Within one dimension, the equation can be articulated as follows:
Q h w = k h A h ( t h t w )
Q w c = k c A c ( t w t c )
The variations in thermophysical properties impact the heat transfer characteristics and flow structure of S-CO2. Parameters such as fluid density, specific heat, thermal conductivity, and viscosity change, thereby indirectly influencing the fluid flow field and turbulent structures. To enhance the precision in depicting the heat transfer characteristics of the PCHE, this study developed a one-dimensional heat transfer model. The model takes into consideration the change in temperature and pressure along the length of the pipe. The density within each section of the heat exchanger varies with the fluid’s physical properties. In the multi-segment model, fluid density is calculated in two ways: using the average set and the outlet set. In this context, the outlet set is employed, implying that the density and temperature in each heat exchanger section prevail on the outlet. The assumption is made that the density of the working fluid in each pipe section remains constant.
R e = ρ u D h μ = m ˙ D h A μ
The calculation formula for pressure drop in the heat exchanger on the hot and cold sides of the fluid is as follows:
p = f L d ρ u 2 2
According to the principles of fluid dynamics, this pressure drop formula can also be applied to calculate the pressure drop in connecting pipelines. Table 1 presents equations of heat transfer correlations and pressure drop correlations summarized by some researchers.
When constructing a heat exchanger, different empirical formulas are applied to calculate Nusselt numbers (Nu) and friction factors (f) due to variations in structural design, as well as differences in the fluid properties and flow conditions on the hot and cold sides. In the establishment of heater and reheater models, empirical relationships proposed by researchers such as Ferrero [33] and Jiang [34] are employed. In the modeling process of the preheater, heat transfer correlations, and pressure drop correlations from the literature [25] are consulted. This methodology contributes to a thorough understanding of the intricate thermodynamic and fluidic characteristics associated with PCHE, thereby enhancing the accuracy of dynamic models.
The formulas for calculating the friction factor and Nusselt number for the heater and regenerator are as follows:
N u = ( f 8 ) × ( Re 1000 ) × Pr 1 + 12.7 × f 8 × ( Pr 2 3 1 )
f = 64 Re   Re < 2300 f = 0.06539 e Re 3516 1248 2   2300 Re 3400 1 f = 2.34 log ε 1.72 d 9.26 Re log ε 29.36 D h y d 0.95 + 18.35 Re 1.108   Re > 3400
As the preheater involves heat exchange between water and CO2, the dimensionless parameter calculations are expressed by the following formula:
N u = f 8 ( Re 1000 ) Pr ( 1.07 + 12.7 f / 8 ( Pr 2 3 1 ) )
f = 1.82 lg ( Re ) 1.64 2
The Nusselt number is typically defined as the ratio of convective heat transfer to conductive heat transfer, and it can be employed in heat exchangers to evaluate the convective heat transfer performance therein. By measuring parameters such as fluid velocity, density, viscosity, etc., the Nusselt number can be calculated; thus, the computation of convective heat transfer coefficients can be performed.
k = N u λ d
where N u is the Nusselt number, and λ is the thermal conductivity of the fluid.

2.2. Turbomachinery

Turbomachinery refers to mechanical equipment that utilizes the principles of turbines for energy conversion, including turbines and compressors.

2.2.1. Compressor

The modeling of turbomachinery typically encompasses two methodologies: one based on fundamental principles, incorporating the dimensions of the turbine rotor and blade parameters for modeling. The alternative approach relies on the simulation of characteristic curves derived from turbine experiments. This paper predominantly adopts the latter modeling method. The compressor is a crucial component of the GT-SCO2 system, as the properties of CO2 undergo a sudden change near the critical point, imposing higher demands on the compressor’s performance. Therefore, utilizing specific compressor performance curves in the modeling process can better reflect the characteristics of the compressor. In the modeling of the compressor, the isentropic process is a commonly employed approximation method. The isentropic process refers to the condition where the entropy of the system remains constant during the compression process of the compressor. Based on this benchmark, the pressure and enthalpy values at the compressor outlet can be calculated. This paper adopts the performance curves provided in Reference [35], from which the relationship between compressor flow rate, speed, pressure ratio, and enthalpy difference can be derived. The efficiency of the compressor can be obtained through table lookup. Subsequently, using the isentropic enthalpy difference and efficiency, the actual enthalpy difference of the turbine can be calculated, allowing for the determination of the compressor outlet temperature and pressure. Following the principle of energy conservation, the output power of the compressor is ultimately computed. To facilitate the establishment of a mathematical model in Simulink, the characteristic curves from the literature are fitted to corresponding characteristic polynomials.
The equations for compressor outlet pressure, outlet enthalpy value, and output power are as follows:
p o u t , c o m = P R c o m p i n , c o m h o u t , c o m = h i n , c o m + ( h o u t 0 , c o m h i n , c o m ) / η i n , c o m P c o m = D c o m ( h o u t , c o m h i n , c o m )

2.2.2. Turbine

Similar to the compressor, the turbine also calculates outlet pressure and enthalpy based on the isentropic process. The turbine characteristic curve reflects the expansion ratio and efficiency to mass flow rate and speed. By fitting polynomial characteristic curves, the outlet pressure and enthalpy values of the turbine can be calculated for different operating conditions.
p o u t , t u r b = p i n , t u r b P R t u r b h o u t , t u r b = h i n , t u r b ( h o u t 0 , t u r b h i n , t u r b ) η t u r b P t u r b = D t u r b ( h i n , t u r b h o u t , t u r b )
Using MATLAB 2020a to fit formulas for pressure ratios in different flow rate ranges, the efficiency of the compressor and turbine is set to specific values during the simulation process, as shown in Table 2.

3. Model Simulation and Validation

3.1. Steady-State Numerical Validation

The geometric parameters and operating conditions are set to match those in the reference literature for steady-state validation in the Table 3. The steady-state simulation results are compared with the data from the literature for a comparative analysis [6,33,36]. The outlet temperatures on both the hot and cold sides of the heat exchanger serve as benchmarks to achieve an error margin of less than 3%. The steady-state calculation errors fall within the acceptable range.
Connect the established component models, as shown in Figure 1. After stabilizing the operation under the specified operating conditions, obtain the parameters at each point, specific parameters are shown in Table 4.

3.2. Dynamic Response Experiment

The exhaust temperature of a gas turbine is subject to the influence of multiple factors. The elevated temperatures resulting from combustion play a direct role in determining the exhaust temperature. Simultaneously, the exhaust temperature is intricately linked to the intake airflow; higher rates of airflow can lead to increased exhaust temperatures. Other significant contributors to exhaust temperature variations encompass fuel composition and ambient environmental conditions. Moreover, the load level of the gas turbine directly dictates the exhaust flow rate, with elevated loads generally corresponding to larger exhaust flow rates. Consequently, fluctuations in both exhaust temperature and mass flow rate are inherent in the waste heat recovery process of gas turbine systems. Figure 2 and Figure 3 illustrate the dynamic response of the GT-SCO2 waste heat recovery system to alterations in exhaust temperature.
The dynamic response simulation results indicate that, when the exhaust temperature of the gas turbine suddenly increases by 10 K, the turbine inlet temperature (TIT) rises from 636.7 K to 645.6 K within 143 s and then stabilizes. Simultaneously, the main compressor inlet temperature (MIT) increases by 0.03 K, and the re-compressor inlet temperature increases by 1.41 K. The MIT remains relatively constant, primarily due to the cooling medium in the pre-cooler being water. The turbine outlet pressure, re-compressor outlet pressure, and main compressor outlet pressure decrease with the rise in exhaust temperature. The turbine outlet pressure exhibits a relatively small change, with a variation not exceeding 0.1%. The main compressor and re-compressor outlet pressures decrease by 9 KPa and 11 KPa, respectively. Output power is a critical parameter for the system, and the results illustrate that even slight changes in exhaust temperature significantly impact the system’s output power. The turbine output power experiences a notable increase, while the main compressor exhibits a comparatively smaller increase. This leads to an overall enhancement in system output power, escalating from 5.42 KW to 5.58 KW.
As shown in Figure 4 and Figure 5, when the exhaust mass flow rate undergoes a step decrease from 100 kg/s to 80 kg/s, the TIT, main compressor inlet temperature, and re-compressor inlet temperature all experience a decrease. The turbine inlet temperature decreases by 21.4 K within 164 s before reaching a new steady-state value. The main compressor inlet temperature remains essentially unchanged, while the re-compressor inlet temperature decreases by 2.8 K before stabilizing.

4. Control Strategy and Controller Design for the System

4.1. Control Strategy

This paper summarizes some control strategies related to S-CO2. Anton Moisseytsev [36,37] proposed turbine bypass, working fluid mass flow, compressor inlet throttling, and pre-cooler bypass control in previous experiments. A comparison was made between single control methods and multi-mode combination controls to assess their impact on various components’ parameters within the cycle system.
Through investigation, it can be observed that control methods can be broadly categorized into four types: bypass control, throttling control, working fluid mass flow control, and turbine mechanical speed control. Bypass control includes turbine bypass, pre-cooler bypass, and recuperator bypass. There are two types of turbine bypass: one involving only the bypass of the turbine and the other involving the bypass of both the turbine and the high-temperature heaters. Both bypass control methods effectively regulate the turbine’s output power, but their impact on other cycle parameters differs. A pre-cooler bypass can regulate the condensation amount, thereby adjusting the temperature and pressure at the compressor inlet. Throttling control can regulate the mass flow rates of the compressors and turbine, thus controlling the split ratio. In this study, an exhaust gas bypass valve is employed to control the turbine inlet temperature, ensuring a return to a safe temperature after the system output power reaches the set value. Additionally, a turbine/HAHX bypass valve control strategy is utilized to stabilize the system output power at a specific value or enable variable power operation. Furthermore, a cooling water throttle valve is employed to control the mass flow rate of water, thereby maintaining the CO2 temperature within the cycle consistently above the critical point.

4.2. Controller Design

4.2.1. The Design of PI Controller

The PI (Proportional–Integral) controllers operate based on feedback from the output variable of the controlled system. It is a control method that, upon detecting a deviation between the measured output and the desired output, applies corrective signals to the error signal. This aims to maintain the controlled variable approach to the desired setpoint.
u ( t ) = K p e ( t ) + K i 0 t e ( t ) d τ
The three gains, K p , and K i , represent the tuning parameters of the controller. The system model is identified as a transfer function using the MATLAB Identification Toolbox. The PID’s three parameter values are determined through parameter tuning, and in this study, the tuning method employed is the SIMC method. The tuning formula is as follows:
transfer   function   form :   G ( s ) = K ( τ 1 s + 1 ) e ( θ s ) K c = τ 1 K ( τ c + θ ) = 1 K 1 τ c + θ , T i = min { τ 1 , 4 ( τ c + θ ) } K i = K p T i
where τ c is the desired closed-loop time constant and the sole tuning parameter for the controller.

4.2.2. The Design of the ADRC Controller

In traditional ADRC, each part adopts a nonlinear form, and there are various selection methods for these forms. They can be flexibly applied based on practical situations. However, due to the complexity of the nonlinear ADRC structure and the need for tuning numerous parameters, Gao [38,39] proposed Linear ADRC (LADRC) to address these issues. The controller structure is illustrated in Figure 6.
The Extended State Observer (ESO) provides an estimate of the system state by observing the state variables and external disturbances. The objective of the observer is to accurately estimate the current state of the system, including the controlled variable and its derivatives. Moreover, b represents the critical gain, Z is the disturbance estimate output of the observer, and y denotes the controlled variable of the system.

5. Simulations and Results

In this section, simulations are conducted to control the system, using both PI and ADRC controllers. The following figures depict the dynamic responses of the system’s output power and bypass valve under different task objectives. For HRHX bypass controller, the parameters of SIMC-PI are K p = −0.0156 and K i = −6.62 × 10⁻⁴, and the parameters of the ADRC are K p = 1, b0 = −50, β 1 = 8, and β 2 = 16. For the Gas-TIT loop, the parameters of SIMC-PI are K p = −0.04 and K i = −0.035, and the parameters of the ADRC are K p = 1, b0 = −6, β 1 = 1, and β 2 = 0.25. For the water-MIT loop, the parameters of SMIC-PI are K p = −9 and K i = −1.15, and the parameters of the ADRC are K p = 6, b0 = −1, β 1 = 2.4, and β 2 = 1.5.

5.1. Case 1

In the application of waste heat recovery in gas turbine systems, achieving variable load operation is often necessary. To further investigate the performance of power output variation in the system, experiments are conducted with the gas turbine exhaust temperature and mass flow rate maintained at stable levels. PI controllers and ADRC controllers are separately employed to regulate the bypass valve on the heat source turbine side and the throttling valve on the cooling water side. A comparative analysis is performed to assess the control effectiveness of the two controllers on the system’s output power. Additionally, the results are compared with the steady-state response time of adjusting only the opening of the heat source/turbine bypass valve. The objective is to observe which control design could more expeditiously stabilize the system’s output power at the setpoint under varying load conditions.
The simulation results in Figure 7 indicate that both the PI controller and the ADRC controller are capable of accomplishing the task of variable power in the system, reducing the set output power from 5000 KW to 4500 KW. However, the performance characteristics of the two controllers differ. Under the control of the PI controller, the system output power undergoes a transition from the initial steady state to the new steady state in 103 s, while with ADRC, it takes only 46 s, reducing the steady-state response time by 55%. The control rates of cooling water flow are essentially consistent, primarily due to the narrow range of water flow variations. As can be seen from Figure 8 and Figure 9, the opening of the bypass valve for the HAHX/turbine increases from 0.068 to 0.134, and the cooling water mass flow rate finally stabilized at 96.9 kg/s.

5.2. Case 2

The simulation conditions were configured for a constant exhaust gas temperature and varying mass flow rate. The heat source/turbine bypass valve and cooling water flow were sequentially adjusted using the PI and ADRC controllers to maintain the system output at the target point.
The conclusion drawn from Figure 10 indicates that, with a constant heat source temperature and fluctuating mass flow rate, both the PI and ADRC control can maintain the system output power at the target point. Under PI control, the system output power reverts to stability approximately 171 s after the onset of fluctuations, whereas, with ADRC control, this stabilization is achieved in 98.2 s, reducing the steady-state time by 42.6%. As depicted in Figure 11, the lowest point of the S-CO2 cycle system remains essentially stable at 305 K, demonstrating the ability to sustain temperatures above the critical point.
To attain stable power output operation under grid-connected conditions, the system output power remains steady for the majority of the operational time. In simulation conditions with a consistent exhaust gas mass flow rate and fluctuating temperature, both PI and ADRC controllers were utilized, respectively. They were responsible for regulating the heat source/turbine bypass valve and cooling water flow rate, thereby ensuring that the system output power stays aligned with the predefined setpoint.
The simulation results indicate that, in the presence of fluctuations in the exhaust temperature of the gas turbine, both the PI and ADRC controllers can maintain the system output power at a stable level of 5 MW (Figure 12). The variation in cooling water mass flow rate is relatively small, essentially staying around 97 kg/s. When temperature fluctuations occur, the system output power stabilizes with PI after 118.9 s, whereas ADRC achieves this in 70.6 s, demonstrating a 40.6% reduction in steady-state response time. This suggests that the performance of the ADRC controller in stabilizing system output power is superior to that of the PI controller. In terms of MIT control, the performance of both PI and ADRC controllers is essentially consistent. As depicted in Figure 13, the trends in the variation in cooling water mass flow rates are approximately identical, with control errors remaining within a margin of 0.5%.

5.3. Case 3

Critical components of a turbine, such as blades and bearings, are highly susceptible to elevated temperatures. Exceeding the designated safety range for inlet temperatures may compromise the equipment’s lifespan. Maintaining the turbine inlet temperature within the established safety parameters serves to safeguard crucial components, enhancing equipment reliability. Additionally, the performance of turbines is intricately linked to operating temperatures. Operating within the designated temperature range ensures optimal utilization of the equipment’s design capabilities, consequently improving energy conversion efficiency. Elevated inlet temperatures may lead to a decline in thermal efficiency, reducing overall energy conversion efficiency and, as a result, impacting the overall system performance. Therefore, ensuring the stability of the turbine inlet temperature within a safe range is a critical consideration for the cyclic system, under the precondition of maintaining system output power. Utilizing both PI controllers and ADRC controllers respectively, the regulation of exhaust flow entering the cyclic system is implemented. The stabilization of system output power is accomplished through precise control of the mass flow rates of the working fluid and cooling water. This strategy ensures the maintenance of the turbine inlet temperature within the specified safe range.
The simulation results in Figure 14, Figure 15 and Figure 16 reveal that, in the presence of exhaust temperature fluctuations, the utilization of three controllers for system control ensures the stability of system output power. It also maintains the turbine inlet temperature within a safe range, while keeping the CO2 temperature above the critical point. From Figure 14, it can be observed that ADRC, in stabilizing the system output power, achieves a 34.4% reduction in steady-state response time compared to PI. Additionally, the variation trend is more stable, which holds significant implications for the normal operation of power systems and the reliability of electrical energy supply.

6. Conclusions

This paper, based on the S-CO2 recompression Brayton cycle, establishes mathematical models for components such as printed circuit heat exchangers, turbines, and compressors. A mathematical model for the S-CO2 cycle system is developed, and an analysis and validation of the steady-state and transient characteristics of the system are conducted. At both the component and system levels, different operating conditions were set to ensure that the steady-state output values matched the numerical values published in the previous literature. On this basis, dynamic models were validated, and dynamic response curves were obtained under fluctuating flue gas temperature and flow conditions. To maintain the system’s power output at 5 MW and ensure that the turbine inlet temperature is within a safe range, PI controllers and ADRC controllers were coupled with the S-CO2 cycle system, respectively.
Employing precise control measures, the cooling water flow was regulated to prevent the compressor inlet temperature from dropping below the critical threshold. Simultaneously, the flow of the S-CO2 cycle’s working fluid was adjusted to uphold the system output power at a predetermined target value. Additionally, the flow of the gas turbine exhaust into the heater was tuned to guarantee the safe inlet temperature of the turbine. The SIMC method was employed for parameter tuning of the PI controller, while the bandwidth method was utilized for parameter design of the ADRC controller. A comparative analysis of the control performance of these two controllers on the system was conducted. The simulation results indicate that both controllers effectively regulate the dynamic operation of the power system. Specifically, the ADRC exhibits a superior performance in controlling the system’s power generation and turbine inlet temperature. In both scenarios of system load variation and stabilizing system output power, the performance of ADRC surpasses that of the PI control.
The study developed a dynamic model for a MW-scale supercritical carbon dioxide recompression Brayton cycle, referencing actual system component parameters, thereby enhancing the comprehension of the supercritical carbon dioxide recompression Brayton cycle. The innovation lies in proposing a control method for the S-CO2 system output parameters using an ADRC controller. The study analyzed the impact of coupling the turbine heat source bypass valve, flue gas throttle valve, and cooling water throttle valve on various output parameters of the system. This analysis provides simulation support and control strategy guidance for the simulation and analysis of waste heat recovery in the gas turbine–S-CO2 recompression Brayton cycle. The future work encompasses two main aspects. Firstly, employing Epsilon software13.2 to construct thermodynamic system models for various cycle configurations. This involves calculating the firing efficiency and operational costs of different cycle layouts, comparing the advantages and disadvantages of each, and selecting an appropriate design based on specific circumstances. The second aspect involves establishing a dynamic model for the gas turbine, coupling it with the model developed in this paper, and further investigating the dynamic characteristics of the GT-SCO2 co-generation system.

Author Contributions

Conceptualization, F.Z. and T.W.; funding acquisition, F.Z.; methodology, B.M. and H.H.; software, B.M.; supervision, F.Z. and B.Z.; visualization, B.M.; writing—original draft, B.M.; writing—review and editing, F.Z. and K.Y.L. All authors have read and agreed to the published version of the manuscript.

Funding

This work was supported by the National Natural Science Foundation of China (NSFC), under Grant Nos. 52006006 and U22B20112.

Data Availability Statement

Data are contained within the article.

Conflicts of Interest

The authors declare that there are no conflicts of interest; we do not have any possible conflicts of interest.

Nomenclature

Abbreviations
GTgas turbine
HRHXHeat Recovery Reat Exchanger
MCmain compressor
RCre-compressor
Ggenerator
PCHEprinted circuit heat exchanger
S-CO2supercritical carbon dioxide
ORCorganic Rankine cycle
BCVbypass valve controller
FCVflow control valves
WHRwaste heat recovery
PIProportional–Integral
ADRCActive Disturbance Rejection Control
ESOExtended State Observer
Symbols
A heat transfer area, m2
D h hydraulic diameter, m
m ˙ mass flow rate, kg/s
N u Nusselt number
P r Prandtl number
f Darcy’s resistance
μ Kinematic viscosity, cm2/s
R e Reynolds number
P R Pressure ratio
η efficiency
k convective heat transfer coefficient, W/(m2, K)
Subscripts
comcompressor
turbturbine
ininlet
outoutlet
hhot-side fluid
ccold-side fluid
wwall

References

  1. Moisseytsev, A.; Sienicki, J.J.; Lv, Q. Dry Air Cooler Modeling for Supercritical Carbon Dioxide Brayton Cycle Analysis; ANL-ART-50, 1342159; Argonne National Lab. (ANL): Argonne, IL, USA, 2016. [Google Scholar]
  2. Pasch, J.; Conboy, T.; Fleming, D.; Rochau, G. Supercritical CO2 Recompression Brayton Cycle: Completed Assembly Description; SAND2012-9546, 1057248; Sandia National Laboratories (SNL): Albuquerque, NM, USA, 2012. [Google Scholar]
  3. Utamura, M.; Hasuike, H.; Ogawa, K.; Yamamoto, T.; Fukushima, T.; Watanabe, T.; Himeno, T. Demonstration of Supercritical CO2 Closed Regenerative Brayton Cycle in a Bench Scale Experiment. In Proceedings of the Volume 3: Cycle Innovations; Education; Electric Power; Fans and Blowers; Industrial and Cogeneration; American Society of Mechanical Engineers: Copenhagen, Denmark, 2012; pp. 155–164. [Google Scholar]
  4. Ahn, Y.; Lee, J.; Kim, S.G.; Lee, J.I.; Cha, J.E.; Lee, S.-W. Design Consideration of Supercritical CO2 Power Cycle Integral Experiment Loop. Energy 2015, 86, 115–127. [Google Scholar] [CrossRef]
  5. Neises, T.; Turchi, C. A Comparison of Supercritical Carbon Dioxide Power Cycle Configurations with an Emphasis on CSP Applications. Energy Procedia 2014, 49, 1187–1196. [Google Scholar] [CrossRef]
  6. Olumayegun, O.; Wang, M. Dynamic Modelling and Control of Supercritical CO2 Power Cycle Using Waste Heat from Industrial Processes. Fuel 2019, 249, 89–102. [Google Scholar] [CrossRef]
  7. Neises, T.; Turchi, C. Supercritical Carbon Dioxide Power Cycle Design and Configuration Optimization to Minimize Levelized Cost of Energy of Molten Salt Power Towers Operating at 650 °C. Sol. Energy 2019, 181, 27–36. [Google Scholar] [CrossRef]
  8. Khan, M.N.; Zoghi, M.; Habibi, H.; Zanj, A.; Anqi, A.E. Waste Heat Recovery of Two Solar-Driven Supercritical CO2 Brayton Cycles: Exergoeconomic Analysis, Comparative Study, and Monthly Performance. Appl. Therm. Eng. 2022, 214, 118837. [Google Scholar] [CrossRef]
  9. Song, J.; Li, X.; Wang, K.; Markides, C.N. Parametric Optimisation of a Combined Supercritical CO2 (S-CO2) Cycle and Organic Rankine Cycle (ORC) System for Internal Combustion Engine (ICE) Waste-Heat Recovery. Energy Convers. Manag. 2020, 218, 112999. [Google Scholar] [CrossRef]
  10. Song, J.; Li, X.; Ren, X.; Gu, C. Performance Improvement of a Preheating Supercritical CO2 (S-CO2) Cycle Based System for Engine Waste Heat Recovery. Energy Convers. Manag. 2018, 161, 225–233. [Google Scholar] [CrossRef]
  11. Zare, V.; Mahmoudi, S.M.S.; Yari, M. An Exergoeconomic Investigation of Waste Heat Recovery from the Gas Turbine-Modular Helium Reactor (GT-MHR) Employing an Ammonia–Water Power/Cooling Cycle. Energy 2013, 61, 397–409. [Google Scholar] [CrossRef]
  12. Yoon, S.Y.; Kim, M.J.; Kim, I.S.; Kim, T.S. Comparison of Micro Gas Turbine Heat Recovery Systems Using ORC and Trans-Critical CO2 Cycle Focusing on off-Design Performance. Energy Procedia 2017, 129, 987–994. [Google Scholar] [CrossRef]
  13. Najjar, Y.S.H.; Abubaker, A.M.; El-Khalil, A.F.S. Novel Inlet Air Cooling with Gas Turbine Engines Using Cascaded Waste-Heat Recovery for Green Sustainable Energy. Energy 2015, 93, 770–785. [Google Scholar] [CrossRef]
  14. Nami, H.; Ertesvåg, I.S.; Agromayor, R.; Riboldi, L.; Nord, L.O. Gas Turbine Exhaust Gas Heat Recovery by Organic Rankine Cycles (ORC) for Offshore Combined Heat and Power Applications–Energy and Exergy Analysis. Energy 2018, 165, 1060–1071. [Google Scholar] [CrossRef]
  15. Cao, Y.; Mihardjo, L.W.W.; Dahari, M.; Tlili, I. Waste Heat from a Biomass Fueled Gas Turbine for Power Generation via an ORC or Compressor Inlet Cooling via an Absorption Refrigeration Cycle: A Thermoeconomic Comparison. Appl. Therm. Eng. 2021, 182, 116117. [Google Scholar] [CrossRef]
  16. Wang, S.; Liu, C.; Li, J.; Sun, Z.; Chen, X.; Wang, X. Exergoeconomic Analysis of a Novel Trigeneration System Containing Supercritical CO2 Brayton Cycle, Organic Rankine Cycle and Absorption Refrigeration Cycle for Gas Turbine Waste Heat Recovery. Energy Convers. Manag. 2020, 221, 113064. [Google Scholar] [CrossRef]
  17. Du, J.; Guo, J.; Zhang, Z.; Li, M.; Ren, F.; Liu, Y. A Triple Cascade Gas Turbine Waste Heat Recovery System Based on Supercritical CO2 Brayton Cycle: Thermal Analysis and Optimization. Energy Convers. Manag. X 2022, 16, 100297. [Google Scholar] [CrossRef]
  18. Chen, J.; Liu, L.; Liao, G.; Zhang, F.; Jiaqiang, E.; Tan, S. Design and Off-Design Performance Analysis of Supercritical Carbon Dioxide Brayton Cycles for Gas Turbine Waste Heat Recovery. Appl. Therm. Eng. 2023, 235, 121295. [Google Scholar] [CrossRef]
  19. Bonalumi, D.; Giuffrida, A.; Sicali, F. Techno-Economic Investigations of Supercritical CO2-Based Partial Heating Cycle as Bottoming System of a Small Gas Turbine. Energy 2022, 252, 124066. [Google Scholar] [CrossRef]
  20. Giuffrida, A.; Akramieh, E. Analysis of Partial Heating Supercritical CO2 Cycles Bottoming Small-Power Gas Turbine Units. Energy Convers. Manag. X 2023, 17, 100341. [Google Scholar] [CrossRef]
  21. Bonalumi, D.; Giuffrida, A.; Sicali, F. A Case Study of Cascade Supercritical CO2 Power Cycle for Waste Heat Recovery from a Small Gas Turbine. Energy Convers. Manag. X 2022, 14, 100212. [Google Scholar] [CrossRef]
  22. Cao, Y.; Zhan, J.; Cao, Q.; Si, F. Techno-Economic Analysis of Cascaded Supercritical Carbon Dioxide Combined Cycles for Exhaust Heat Recovery of Typical Gas Turbines. Energy Convers. Manag. 2022, 258, 115536. [Google Scholar] [CrossRef]
  23. Jin, Q.; Xia, S.; Xie, T.; Huang, J. Multi-Objective Optimization of Recompression S-CO2 Cycle for Gas Turbine Waste Heat Recovery. Appl. Therm. Eng. 2023, 229, 120601. [Google Scholar] [CrossRef]
  24. Wang, X.; Wang, R.; Bian, X.; Cai, J.; Tian, H.; Shu, G.; Li, X.; Qin, Z. Review of Dynamic Performance and Control Strategy of Supercritical CO2 Brayton Cycle. Energy AI 2021, 5, 100078. [Google Scholar] [CrossRef]
  25. Hu, H.; Guo, C.; Cai, H.; Jiang, Y.; Liang, S.; Guo, Y. Dynamic Characteristics of the Recuperator Thermal Performance in a S–CO2 Brayton Cycle. Energy 2021, 214, 119017. [Google Scholar] [CrossRef]
  26. Deng, T.; Li, X.; Wang, Q.; Ma, T. Dynamic Modelling and Transient Characteristics of Supercritical CO2 Recompression Brayton Cycle. Energy 2019, 180, 292–302. [Google Scholar] [CrossRef]
  27. Ma, T.; Li, M.-J.; Xu, J.-L.; Cao, F. Thermodynamic Analysis and Performance Prediction on Dynamic Response Characteristic of PCHE in 1000 MW S-CO2 Coal Fired Power Plant. Energy 2019, 175, 123–138. [Google Scholar] [CrossRef]
  28. Battisti, F.G.; Delsoto, G.S.; da Silva, A.K. Transient Analysis and Optimization of a Recuperative sCO2 Brayton Cycle Assisted by Heat and Mass Storage Systems. Energy 2018, 150, 979–991. [Google Scholar] [CrossRef]
  29. Luu, M.T.; Milani, D.; McNaughton, R.; Abbas, A. Advanced Control Strategies for Dynamic Operation of a Solar-Assisted Recompression Supercritical CO2 Brayton Power Cycle. Appl. Therm. Eng. 2018, 136, 682–700. [Google Scholar] [CrossRef]
  30. Zhang, F.; Feng, M.; Dai, H.; Wu, Z.; Liao, G. Off-Design and Control Performance Analysis of a Novel Supercritical Carbon Dioxide Power Cycle for Waste Heat Recovery. Appl. Therm. Eng. 2023, 235, 121393. [Google Scholar] [CrossRef]
  31. Dai, C.; Song, P.; Ma, C.; Zhang, K.; Zheng, W.; Chen, L.; Guo, X.; Lin, Y.; Qiu, Z. Research on Response Characteristics and Control Strategy of the Supercritical Carbon Dioxide Power Cycle. Processes 2021, 9, 1943. [Google Scholar] [CrossRef]
  32. Ding, H.; Zhang, Y.; Hong, G.; Li, J. Comparative Study of the Supercritical Carbon-Dioxide Recompression Brayton Cycle with Different Control Strategies. Prog. Nucl. Energy 2021, 137, 103770. [Google Scholar] [CrossRef]
  33. Ferrero, S. Modelica Dynamic Modeling of a Supercritical CO2 Loop for Solar and Nuclear Applications. Master′s Thesis, Politecnico di Torino, Torino, Italy, 2020. [Google Scholar]
  34. Jiang, Y. Design and Dynamic Modeling of Printed Circuit Heat Exchangers for Supercritical Carbon Dioxide Brayton Power Cycles. Appl. Energy 2018, 231, 1019–1032. [Google Scholar] [CrossRef]
  35. Carstens, N.A.; Hejzlar, P.; Driscoll, M.J. Control System Strategies and Dynamic Response for Supercritical CO2 Power Conversion Cycles. Cent. Adv. Nucl. Energy Syst. 2006. Available online: https://corpora.tika.apache.org/base/docs/govdocs1/418/418386.pdf (accessed on 1 February 2024).
  36. Moisseytsev, A.; Kulesza, K.P.; Sienicki, J.J. Control System Options and Strategies for Supercritical CO2 Cycles; ANL-GENIV-081, 958037; Argonne National Lab. (ANL): Argonne, IL, USA, 2009. [Google Scholar]
  37. Moisseytsev, A.; Sienicki, J.J. Dynamic Control Analysis of the AFR-100 SMR SFR with a Supercritical CO2 Cycle and Dry Air Cooling: Part I—Plant Control Optimization. In Proceedings of the 2018 26th International Conference on Nuclear Engineering, London, UK, 22–26 July 2018; American Society of Mechanical Engineers Digital Collection: New York, NY, USA, 2018. [Google Scholar]
  38. Gao, Z. Active Disturbance Rejection Control: A Paradigm Shift in Feedback Control System Design. In Proceedings of the 2006 American Control Conference, Minneapolis, MN, USA, 14–16 June 2006; IEEE: Minneapolis, MN, USA, 2006; p. 7. [Google Scholar]
  39. Jin, H.; Song, J.; Lan, W.; Gao, Z. On the Characteristics of ADRC: A PID Interpretation. Sci. China Inf. Sci. 2020, 63, 209201. [Google Scholar] [CrossRef]
Figure 1. Schematic representation of supercritical CO2 waste heat recovery system for gas turbines.
Energies 17 01343 g001
Figure 2. Open-loop responses of turbomachinery temperature (step of exhaust gas temperature).
Energies 17 01343 g002
Figure 3. Open-loop responses of turbomachinery pressure/power and the net power output (step of exhaust gas temperature).
Energies 17 01343 g003
Figure 4. Open-loop responses of turbomachinery temperature (step of exhaust gas massflow rate).
Energies 17 01343 g004
Figure 5. Open-loop responses of turbomachinery pressure/power and the net power output (step of exhaust gas massflow rate).
Energies 17 01343 g005
Figure 6. The first-order LADRC.
Energies 17 01343 g006
Figure 7. Dynamic response of system output power under variable load conditions.
Energies 17 01343 g007
Figure 8. The opening of the HAHX/turbine bypass valve.
Energies 17 01343 g008
Figure 9. The cooling water flow with different control designs.
Energies 17 01343 g009
Figure 10. Simulated fluctuating mass flow rate of exhaust gas, the dynamic response of the system’s output power, and the opening of the bypass valve.
Energies 17 01343 g010
Figure 11. The MIT and the cooling water flow rate.
Energies 17 01343 g011
Figure 12. The simulated fluctuating temperature of exhaust gas and the dynamic response of the system’s output power.
Energies 17 01343 g012
Figure 13. The MIT and the cooling water flow rate (exhaust temperature fluctuation).
Energies 17 01343 g013
Figure 14. The simulated fluctuating temperature of exhaust gas and the dynamic response of the TIT.
Energies 17 01343 g014
Figure 15. Dynamic response of system output power and HRHX/turbine bypass valve opening.
Energies 17 01343 g015
Figure 16. Dynamic response of MIT and water mass flow.
Energies 17 01343 g016
Table 1. PCHE design parameters.
ParameterHRHXRegeneratorCooler
A   ( m 2 ) 173.01269.12153.78
M   ( kg ) 2808.603184.022729.16
V   ( m 3 ) 0.150.170.15
Number of modules9148
Table 2. Polynomial fitting of characteristic curves and efficiency for turbomachinery.
ComponentCompression/Expansion Ratio [6,35]Isentropic Efficiency [6]
Turbine P R = 7.407 e 7 m ˙ 3 + 4.921 e 5 m ˙ 2 + 0.02501 m ˙ + 2.507   90 < m ˙ < 120 0.005349 m ˙ 3 1.262 m ˙ 2 + 99.31 m ˙ 2601   75 m ˙ 90 2.9 m ˙ < 75 0.9
Main compressor P R = 1.5964 e 4 m ˙ 2 + 0.01158 m ˙ + 2.995 45 m ˙ 65 0.89
Re-compressor P R = 3.01 4 m ˙ + 0.0107 m ˙ + 3.0768 25 m ˙ 35 0.88
Table 3. Comparison of the PCHE simulation values at steady state with the literature value.
Data SourceReference [36]Reference [33]Literature [6]
Hot-side outlet temperature/K305.14388.15349.15
Relative difference1.36%0.76%0.56%
Cool-side outlet temperature/K305.87464.83633.15
Relative difference2.01%1.15%0.93%
Table 4. Results of steady-state simulation of the GT-SCO2 system.
Statem (kg/s)Pressure (KPa)T (K)
180.4024,975.33632.72
280.408082.63516.62
380.407982.91358.28
453.987982.91358.28
526.427982.91358.28
653.987936.48305.84
753.9825,111.03340.95
853.9825,095.39494.88
926.4225,046.36458.61
1080.4025,046.36482.96
Disclaimer/Publisher’s Note: The statements, opinions and data contained in all publications are solely those of the individual author(s) and contributor(s) and not of MDPI and/or the editor(s). MDPI and/or the editor(s) disclaim responsibility for any injury to people or property resulting from any ideas, methods, instructions or products referred to in the content.

