Article

Numerical and Experimental Study on Nonlinear Phenomena and Thermal Deviation Control in a 1000 MW Tower-Type Boiler

1
School of Energy and Power Engineering, University of Shanghai for Science and Technology, Shanghai 200093, China
2
Academic Affairs Office, Shanghai Jian Qiao University, Shanghai 201306, China
*
Author to whom correspondence should be addressed.
Energies 2024, 17(6), 1329; https://doi.org/10.3390/en17061329
Submission received: 31 January 2024 / Revised: 23 February 2024 / Accepted: 27 February 2024 / Published: 10 March 2024
(This article belongs to the Section J: Thermal Management)

Abstract

:
Numerical and experimental studies were conducted to study the nonlinear phenomena of a 1000 MW ultra-supercritical four-corner tangential pulverized coal boiler. In this paper, (1) a 3D model of a furnace with a symmetrical structure was established to analyze the asymmetric flow phenomenon and multi-solution phenomenon of flow for multiple timepoints under the same boundary conditions. (2) The visual experiment verified that the flow in the furnace also behaved asymmetrically. (3) On the basis of correctly predicting the nonlinear law, the “diagonal start up” method and the “sequential start up” method are proposed. (4) An uneven coefficient of velocity distribution M, deviation coefficient of flue gas mass flow rate Eq and gas temperature deviation coefficient ET are proposed to quantitatively analyze the degree to which the actual tangent circle deviates from the ideal tangent circle. The tangent circle under the “sequential start up” method is the closest to the ideal, which can reduce the thermal deviation of the furnace outlet from 67 K under the “simultaneous start up” method to 41 K. In this paper, the initial steady-state flow field in the furnace is established by using the initial value sensitivity of the nonlinear system through different burner-opening methods, so as to reduce the thermal deviation at the furnace outlet and achieve the purpose of accurate control.

1. Introduction

Four-corner tangential (FCT) pulverized coal boilers are widely used in thermal power stations due to the advantages of good flame filling and a wide adaptability of coal types. However, FCT boilers often have the problem of flue gas thermal deviation at the furnace outlet. Computational fluid dynamics (CFD) simulations have been successfully used to study coal combustion and flow behavior in this type of large-scale boiler [1,2,3,4,5,6,7,8].
According to Xu [9], the combustion mode of FCT fire boilers forms residual rotation at the outlet of the boiler, which leads to the asymmetry of the velocity field and the temperature field at the furnace outlet, resulting in thermal deviation. This view is widely accepted in the industry, and many research projects aiming to reduce thermal deviation have been carried out. Yin [10] studied flow characteristics in the upper part of a furnace which burned in a counterclockwise circular way and found that the residual vortex of the gas flow at the furnace outlet did indeed cause thermal deviation. In the higher part of the furnace, the heat exchanger reduces the effect of residual rotation and thermal deviation is reduced, but this reduction is limited, and thermal deviation still exists. Yin designed a furnace arch on the front wall of the furnace and redesigned the arrangement of the plate heat exchanger. Although gas flowed more evenly between the front and rear walls before the retrofit, thermal deviation inside the furnace is not completely eliminated and is intensified in the vertical direction. Liu [11] carried out the corresponding cold state experiments, cold-state simulations and hot-state simulations under the same deep-air-staged combustion conditions to study the flow characteristics of the horizontal flue of an FCT boiler. Their cold-state experiments and numerical simulations show that by adding reverse SOFA wind to reduce the residual rotation of flue gas in the horizontal flue, the thermal deviation at the furnace outlet can be reduced. However, the cold-state experiment and numerical simulation results in the cold and hot states also show that the thermal deviation is reduced but not eliminated. Liu proposed a method to reduce the airflow skew and temperature deviation by setting an arch angle below the furnace outlet. Through CFD simulations of a 1000 MW tangential combustion tower boiler under full load operation, Tan [12] proposed that there are two reasons for the thermal deviation of the left and right wall surfaces of the horizontal flue of the superheater: one is that the flue gas is deflected toward the back wall where the furnace outlet is located due to the suction action of the furnace outlet; and the other is that the air flow is obstructed by an overly dense screen superheater. Tan proposed a method to reduce the airflow skew and temperature deviation by setting an arch angle below the furnace outlet. Yao [13] investigated the effects of a secondary air deflection angle, SOFA air reverse-cutting angle, and burner up-swing angle through orthogonal experiments and numerical simulations of a 700 MW boiler and proposed that the reverse chamfer angle of SOFA wind has the greatest impact on the thermal deviation of flue gas. Based on a 660 MW tangential coal-fired furnace, Ma et al. [14] concluded that the residual rotation of the furnace outlet gas flow, the blocking of the heat exchanger interface, and the drag force of the induced draft fan on the furnace air flow caused the furnace outlet flue gas to tilt to one side of the furnace wall, which was one of the reasons for the thermal deviation of the furnace outlet. At the same time, they also believe that the thermal deviation of the same boiler varies under different furnace loads, and there exists an optimal load. In addition to adjusting the angle of the SOFA air, increasing the SOFA air volume is also an effective way to reduce thermal deviation at the furnace outlet. Xiang [15] combined the boiler cold-state experiment with numerical simulations to comprehensively analyze the flow characteristics, flue gas shear circle size, and tangent circle center position of each air duct in the furnace. Li [16] studied the velocity distribution of the gas–solid two-phase flow field in the furnace through the cold simulation of the three-dimensional fluidized bed boiler, analyzed the degree of wear of the furnace wall, and provided a solution for reducing the wear of the furnace wall and optimizing the air distribution in the furnace. The influence of the turbulence model on the flow simulation was evaluated through the comparison and analysis of the cold gas-phase flow field in the four-corner tangential coal-fired furnace by using different turbulence models in commercial numerical analysis software, and the influence of each turbulence model on flow simulation was evaluated through the comparative analysis of the experimental and different model simulation results. You [17] used commercial numerical analysis software to compare the cold gas-phase flow field in the four-corner tangential coal-fired furnace by using different turbulence models. After comparing experimental results with the simulation results from different models, the influence of turbulence models on flow simulation was evaluated. Zhou [18] proposed some new furnace arch structures and partitioned superheater arrangements to reduce the temperature deviation in the horizontal flue of large four-corner tangential combustion boilers. The numerical calculation conducted by Zhou are in good agreement with the experimental outcomes, effectively illustrating the flow characteristics in the upper part of the furnace This research also provides a detailed explanation of the formation mechanism behind flue gas velocity and thermal deviation in large-scale, four-corner tangential coal-fired furnaces. Shao [19] utilized numerical methods to analyze the combustion characteristics of the four-corner tangent circle combustion boiler. In Ref [19], Shao examined studied the effects of varying air distribution conditions on the flue gas temperature field, velocity field, component field, NOx, and carbon content within the furnace. Li [20] and Duan [21] regulated the deviation of flue gas temperature inside the furnace by changing the furnace air distribution method and reduced the temperature deviation of flue gas by using specific parameters of secondary air and anti-cyclone reverse cutting. Liu [22] studied the relationship between the swirl number within the furnace and the asymmetry of the temperature distribution across the high-temperature heating surface in the horizontal flue and found that the number of swirls in the furnace had an impact on the asymmetry of the temperature distribution between the reheaters. Utilizing actual operational and design data from ultra-supercritical boilers, Fan [23] analyzed how temperature and heating deviations affect the water walls in both spiral and vertical tubes. Zhao [24] proposed the introduced reverse stable combustion technology for the pulverized coal jet in four-corner rounded pulverized coal furnaces. This technology aims to extend the initial ignition residence time of coal particles in the primary pulverized coal jet, optimize the ignition conditions of the primary pulverized coal jet, and partially weaken the residual rotation of flue gas at the outlet of the furnace. Such advancements are beneficial for minimizing the thermal deviation on the flue gas side. Wu [25] pointed out that it is difficult to fully neutralize the flue gas rotation with a reverse cutting arrangement of a few nozzles. However, employing high-velocity ember air to disrupt the residual rotation has been effective in reducing the uneven velocity of flue gas at the furnace outlet. Zhou [26] analyzed the flue gas flow field and the residual rotation at the furnace outlet under four working conditions by varying the secondary air reverse chamfering angles and investigated the causes of excessive temperature deviation in the flue gas at the outlet. Furthermore, research by some scholars has shown that enhancing the level of air classification vertically within the furnace and modifying the burner combination mode [27,28,29] can also mitigate the heat deviation at the outlet to some extent.
The studies mentioned above either implemented completely symmetrical air distribution in the boiler, designed the furnace structure to be entirely symmetrical, or modified the wall structure to achieve a more uniform temperature distribution. These methods reflect a linear approach, attributing thermal deviation to structure symmetry and positing that symmetrical boundary conditions can lead to symmetrical solutions. However, most engineering problems, including those in boiler power systems, are nonlinear, characterized by nonlinear combustion, flow, and heat transfer dynamics within the boiler furnace. One of the important characteristics of nonlinearity is the existence of multiple solutions, which in the context of a furnace power system translates to various distinct operating states.
This viewpoint may seem at odds with traditional beliefs, yet it is supported by empirical evidence. In a smoke visualization experiment conducted by Wu [30] from Tsinghua University, two asymmetric solutions were observed—one veering left and the other right. From this experiment, it can be seen that the solution under the symmetric structure is not necessarily symmetrical. Furthermore, it suggests the presence of at least three possible outcomes: aside from the two asymmetric one, there exists at least one symmetric solution. Holtzman [31] conducted both numerical and experimental studies on natural convection heat transfer within a symmetrical structured triangular enclosure, heated at the bottom and cooled at the top, using the finite-element method. They found that when the Gr number exceeds a certain critical value, the flow and heat transfer will develop from symmetric to asymmetric, leading to a bifurcation solution. Experimental observations also confirmed asymmetric solutions. Marta [32] utilized the Chebyshev expansion method to investigate the transition from steady to unsteady thermal convection within a two-dimensional annular space at moderate Ra. He discovered that asymmetric oscillatory solutions remerge at high Ra, and he conducted analyses of the phase diagram and power spectrum to further explore the characteristics of periodic oscillations and chaotic states. Yang’s study [33] found that there are multiple solutions for flow and heat transfer in a boiler furnace with symmetric structures, encompassing both symmetric and asymmetric patterns. The purpose of designing the burner with a four-corner tangent circle arrangement in engineering is to ensure that the tangent circle, formed by the actual flow during operation, is centered geometrically, maintaining symmetry around the vertical central axis of the furnace. In actual operation, the center position of the flame’s tangential circle within the furnace often deviates from this geometric center. Even after furnace modification or condition parameter adjustment, the center position of the flame’s tangential circle will not remain stable at this intended position, but will be stable at a certain eccentric position or oscillate near that position. Therefore, this article proposes a new perspective: utilizing nonlinear methods to identify a solution that enables the boiler to operate continuously and stably in its design state, amidst multiple solutions for the furnace flue gas flow field. In practice, symmetric solutions are often elusive under symmetrical boundary conditions, with oscillations and asymmetric solutions frequently emerging in numerical calculations, alongside stable and symmetric ones.
Shen [34] conducted numerical simulations on the natural convection heat transfer problem of a slotted circular ring and found that, under specific geometric parameters, there will be two or more numerical solutions for convection heat transfer within a horizontally slotted circular ring, that is, bifurcation. As the Ra increases, the state of natural convection heat transfer evolves from stable and periodic oscillations to non-periodic oscillations and even chaos. Zhang K [35] studied the natural convection in a concentric circular tube under symmetric initial field and boundary conditions with different Ra values. It was found that as the Ra number in the tube gradually increased from small to large, the system obtained steady-state and symmetric solutions, asymmetric periodic solutions, and quasi periodic solutions, respectively. After many bifurcations, the oscillating flow in the tube eventually evolves into chaotic flow. Wang [36] simulated the cold flow field using laminar and turbulent models under physically symmetric two-dimensional flow conditions. In the laminar flow model, as the Re increases, the numerical results show a symmetric flow field, asymmetric flow field, and time-dependent oscillating flow field, respectively. This progression reveals both static and dynamic bifurcations within the solution for the two-dimensional symmetric flow system. Specifically, under the laminar flow model, the velocity field across the entire model becomes asymmetric and oscillates with an increasing Re. This indicates that the nonlinear characteristics of the actual flue gas flow within the furnace are one of the possible reasons of the thermal deviation in boilers. Shen [37] points out that due to the nonlinearity of flow and heat transfer in the furnace, asymmetric solutions can arise. This occurs even when the furnace’s geometric structure and boundary conditions are completely symmetrical during simulation. As a result, the fluid velocity and temperature distribution within the furnace may still become asymmetric, leading to thermal deviation in the flue gas at the furnace outlet. It improves the thermal deviation at the furnace outlet by changing the incident angle of the burner. Furthermore, Constenla’s research [38] revealed that the actual tangent circles within the furnace deviated from their ideal position. Despite identical boundary conditions at the four corners, symmetric solutions could not be obtained. Similarly, the flue gas velocity distributions obtained by Kuang [39] across different cross-sections also indicated that the actual tangent circles on the studied cross-sections are biased towards the front wall of the furnace to varying degrees. These findings further underscore that the furnace power system operates nonlinearly.
According to the existing research, there seems to be no scholarly study of the flow and heat transfer inside the furnace from a nonlinear perspective, especially regarding issues such as thermal deviation at the outlet of the boiler furnace. The current application of nonlinear perspectives to solve some problems in boiler operation is limited to pointing out certain phenomena, without conducting comprehensive and in-depth research. There are currently no publicly available research data on the issues of multiple solutions, precise control, and sequential start up in boiler operation.
In light of the shortcomings identified in the previous research, the main research objectives of this paper are as follows:
  • Establish a three-dimensional numerical model of the furnace with a symmetrical structure, solve it multiple times under the same working conditions, and analyze the asymmetric flow phenomena of asymmetric flow and multiple solutions in the symmetrical structure model;
  • The asymmetric flow phenomenon in the model is verified by visual experiments. Building on the accurate prediction of nonlinear behavior, this paper proposes the “diagonal start up” and “sequential start up” methods. These involve altering the initial flow field by varying the opening sequence of the nozzles at the four corners of the experimental model, leveraging the initial sensitivity of the nonlinear system. This approach aims to adjust the furnace’s flow tangent circle, thereby optimizing the flow field’s inhomogeneity and asymmetry;
  • Using numerical models, this study simulates the effects of three burner-opening methods, namely “simultaneous start up”, “diagonal start”, and “sequential start”, on the stable flow field in the furnace under hot conditions. From a quantitative analysis perspective, it is demonstrated that, compared to the “simultaneous start up” methods, both “diagonal start up” and “sequential start up” methods can obtain the tangential circle of the flue gas closer to the geometric center of the furnace. This adjustment effectively reduced the thermal deviation at the furnace outlet.
2. Physical Model and Numerical Method

2.1. Physical Model

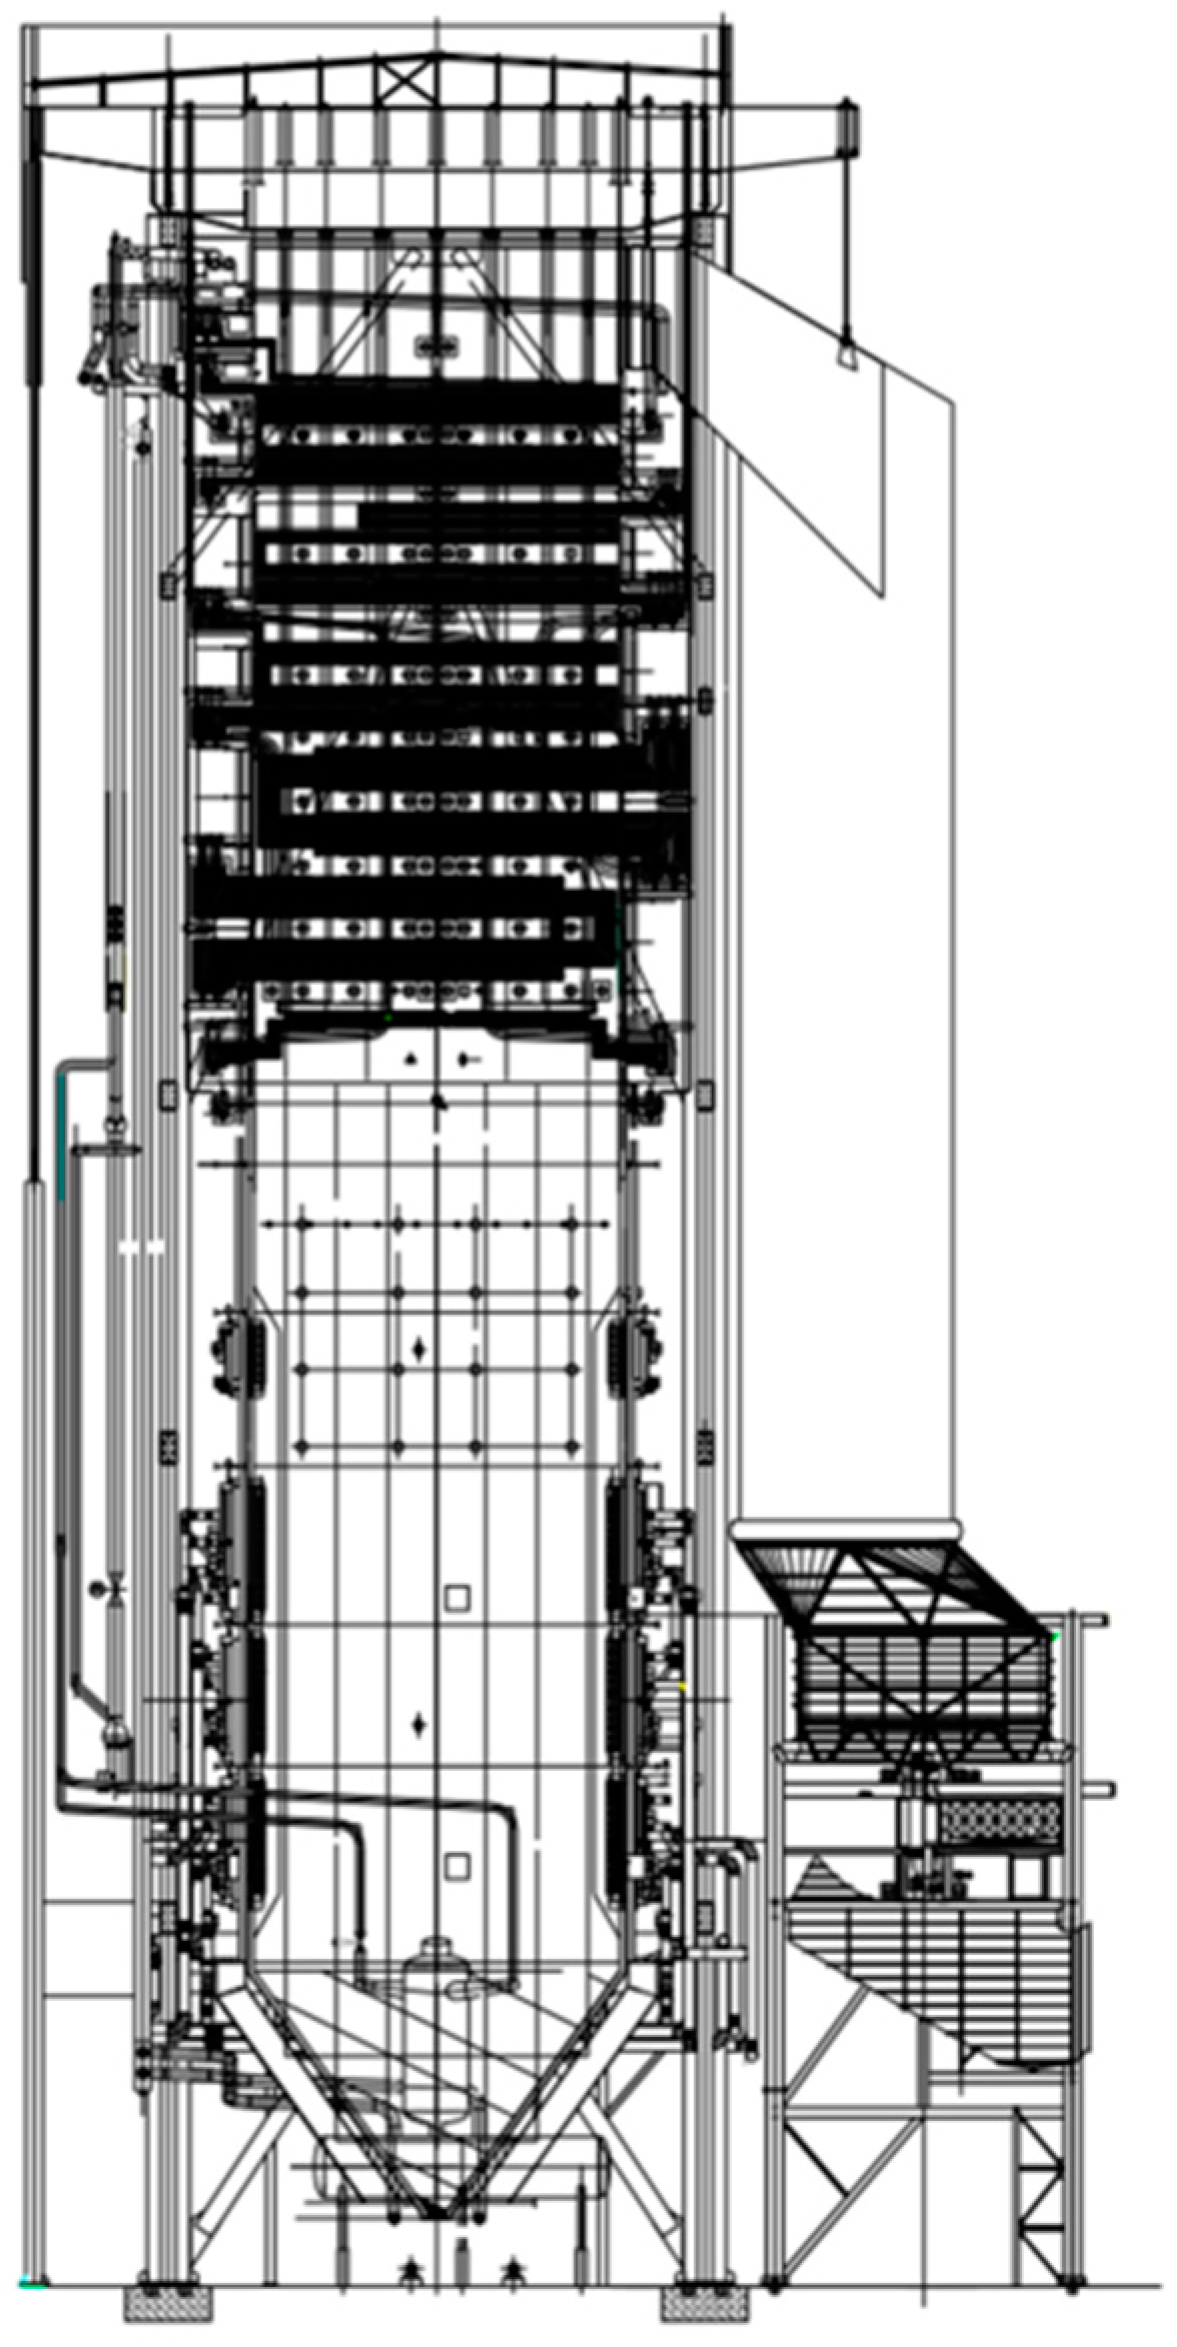
The overall arrangement of the boiler is shown in Figure 1, the boiler is a DC (direct current) tower furnace. The furnace’s height is 109 m and the cross-sectional size is 21.48 m × 21.48 m. There is no flame angle at the outlet of the upper furnace, and the whole furnace is completely symmetrical about the vertical centerline. The boiler combustion method is four corner tangential combustion, with a total of 48 burners, which are arranged at the four corners of the furnace. In the upper part of the furnace, the heat exchangers are located. The arrangement of the burner nozzle is shown in Figure 2, which mainly includes four areas: the lower burner area, the middle burner area, the upper burner area, and the SOFA area. Among them, the arrangement of the upper, middle, and lower burner areas is the same. Four layers of burners are arranged in each burner area, and two air ducts are provided in the burner for pulverized coal primary air and perimeter air. Additionally, a layer of fuel oil secondary air or offset secondary air is arranged between each layer of burner. Each burner zone features a layer of secondary air at both the end and the middle. Furthermore, two layers of compact burnout air are arranged in the upper part of the top burner area, and the SOFA air zone consists of six layers of the same SOFA.
This study takes the area from the bottom of the furnace ash hopper to the front of the boiler’s high-temperature superheater as the research area. Considering the influence of the heat exchange surface temperature on combustion products, and to balance computational accuracy with efficiency, we followed the approach of [40]. The simulation simplifies the heat exchange surface as a heat sink source with an internal emissivity of 0.6, reflective of the operating temperature range of the heat exchanger surfaces. Other heat exchangers, such as a reheater and economizer, were not included in this work.

2.2. Numerical Method

2.2.1. Numerical Model

The simulation of combustion in the furnace involves strong exothermic chemical processes and mixed gas–solid two-phase flow processes. For the simulation of turbulent flow in furnaces, there are many ways to simulate turbulent flow. Some scholars [41,42] adopted an SST k-ω model. To make it easier for the computation to reach convergence, other scholars [43] have successfully used RNG k-ε simulations to simulate turbulent flow in boiler furnaces. Based on our previous research [33,44], the realizable k-ε model has shown a good performance in dealing with flow in tangential boilers and turbulent flow in counter flow boilers, especially in the case of large changes in jet curvature and rotational flow. For the above reasons, the realizable k-ε model was chosen to simulate turbulence in the furnace.
The realizable k-ε model is well-suited for turbulence at a high Re and requires specific handling near the wall. In the problem studied in this paper, there is no large pressure gradient for near-wall flow, and the viscous bottom layer can be ignored at the scale of the furnace flow process, so the standard wall function of the constant shear stress and local equilibrium assumption is used in this paper.
The general governing equations of continuity, momentum, energy, and concentration in the Cartesian coordinates are
ρ t + ρ u i x i = S
The continuity equation, also known as the mass conservation equation, indicates that the increase in mass per unit per time is equal to its net inflow. S is the mass source term, usually S = 0. Each letter x has a subscript i or j, and when i takes different values, xi represents different Cartesian coordinates, where i = 1 means x1 = x; i = 2 means x2 = y; i = 3 means x3 = z. Similarly, different values of i and j in other equations represent different Cartesian coordinates. Moreover, the lower corner of the mark k takes different values to represent different particle items. The other letters in the lower corners also have their own meanings when they go to different values.
t ρ u i + x j ρ u j u i = p x i + τ j i x j + ρ g i + k ρ k τ i k u k i u i + u i S
where p is the static pressure, ρ g i is the gravitational term, k ρ k τ i k u k i u i is the frictional stress term between the pulverized coal particles and the gas, u i S is the stress term caused by the endogenous term of the control microelement, and the two terms can be expressed as the interphase interaction force term F M i , F M i = k ρ k τ i k u k i u i + u i S . τ j i is the stress tensor.
τ j i = μ u j x i + u i x j 2 3 μ u j x j δ i j
t ρ c p T + x j ρ u j c p T = x j λ T x j + w s Q s q r + k n k Q k + c p T S
Among them, c p T S is the energy source generated by the mass change in the fluid phase and the solid particle phase in the control body, q r is the heat of fluid radiation, w s is the reaction rate of the S component in the fluid phase, and w s Q s is the heat of the reaction per unit volume of the fluid phase. Similarly, n k is the reaction rate of the k component in the solid phase, where Q k is the heat of reaction per unit volume of the solid phase.
For non-adiabatic systems, the equation for the conservation of energy in the form of the total enthalpy of the PDF model is
t ρ h + x i ρ u i h = x i μ s σ h h x i S h
The mixture fraction f expresses the degree of mixing of the two components and is a conservation scalar, and the instantaneous value conservation equation for f is
t ρ f ¯ + x j ρ u j f ¯ = x j μ s σ f f ¯ x j
The rate of increase in the mass of a chemical component per unit volume is equal to the sum of its net increase rate caused by convection and diffusion and its rate of chemical reaction generation
t ρ m 1 = x i ρ u i m 1 + J 1 , j + R 1
where m 1 is the mass fraction of Component 1, J 1 , j is the diffusion flux of Component 1, and R 1 is the chemical reaction generation rate of Component 1, where 1 m 1 = 1 ,   1 J 1 = 1 ,   1 R 1 = 1 .
When modularized, the general form of the above governing equation can be written as
t ρ ϕ + X j ρ u j ϕ = X j Γ ϕ ϕ X j + S ϕ

2.2.2. Boundary Conditions

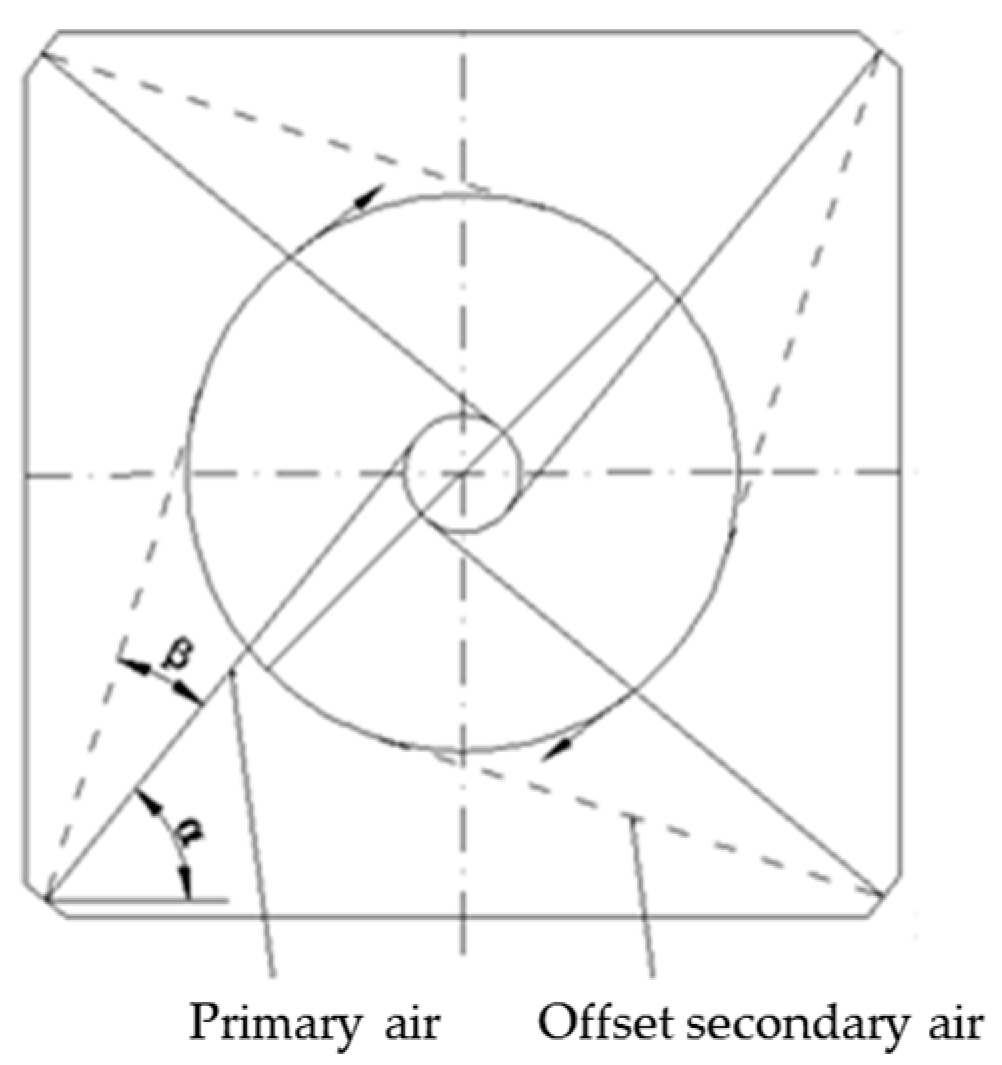
The boiler combustion simulation was conducted under the BMCR (boiler maximum continuous rating) condition. The outlet of each nozzle was configured as the velocity inlet boundary condition, where the velocity of each nozzle was converted from the air distribution parameters specified for the BMCR condition. The temperature of the primary air and the secondary air are listed in Table 1. The velocity direction of the primary air and the offset secondary air are shown in Figure 3, the angle α between the axis of the primary air nozzle and the wall surface is 51°, and the angle β between the axis of the offset secondary air nozzle and the axis of the primary air nozzle is 22°. The velocity direction for the remaining nozzles is perpendicular to the interface of the burner nozzle. The configuration of the velocity boundary is symmetrical with respect to the central axis.
The furnace outlet is configured as a pressure outlet boundary condition, with the assumption that the outlet flow in the computational domain is fully developed and the boiler furnace generally operates under slight negative pressure, and thus, the outlet pressure is set to −20 Pa. The wall surface is assumed to be non-slip, and the wall boundary layer is treated by the standard wall function. The temperature distribution on the walls of each region is different. The wall temperature in the cold ash hopper area is set to 680 K, while the wall temperature in other areas is set to 700 K. The design calorific value of the boiler Qnet,ar under the BMCR condition is 23.42 MJ/kg. The coal analysis is detailed in Table 2. Coal burning capacity under the BMCR condition is 355 t/h. In this condition, the first and second layout burners of the lower part do not inject pulverized coal. The mass flow rate at the outlet of other burner nozzles injects pulverized coal equally. The diameter of coal powder particles is given based on empirical values, where the particle size distribution follows the Rosin–Rammler distribution law.

2.3. Characteristic Quantities

The following concepts are introduced for the quantitative analysis of actual flue tangent circle.
The uneven coefficient of velocity distribution M is introduced into the quantitative analysis of the actual flue gas tangential velocity distribution.
M = U ¯ + 3 σ U ¯
where σ is the standard deviation of the velocity of each point of the study section, σ = 1 n 1 i = 1 n U i U ¯ 2 , and n is the number of monitoring points; U ¯ is the average velocity of the flue gas in each study section, m/s. The larger the M value, the stronger the asymmetry along the vertical center line of the actual hot flue gas circle, and the more uneven the distribution of the hot flue gas velocity field in the furnace. Reducing the irregularity of the actual tangential velocity distribution of flue gas can reduce or avoid flame sweeping [45].
A quantitative analysis of the uniformity of flue gas mass flow and flue gas temperature distribution in each study section of the furnace burner area was carried out, and the deviation coefficient of the flue gas mass flow rate E q and the flue gas temperature deviation coefficient E T were introduced.
E q = q m , mean l q m , mean r
E T = T mean l T mean r
where q m , mean l is the average mass flow rate of flue gas on the left side of the section taken; q m , mean r is the average mass flow rate of flue gas on the right side of the section taken; T mean l is the average flue gas temperature on the left side of the cross-section; T mean r is the average temperature of the flue gas on the right side of the section taken.
When the non-uniformity coefficient E q and E T is 1, it means that the flue field and temperature distribution on the left and right sides of the furnace are very evenly distributed. As the coefficient deviates from 1, it indicates that the uniformity of the flow field and temperature distribution of the flue gas on the left and right sides of the furnace is deteriorating. When the deviation coefficient is greater than 1, it means that the average mass flow rate or average temperature of the flue gas on the left side is higher than that on the right, and when the deviation coefficient is less than 1, it means that the average mass flow rate or average temperature of the flue gas on the left side is lower than that on the right.

2.4. Cases Setup and Start-Up Methods of Burners

All numerical models in this paper, including the mesh verification model, are simulated under BMCR conditions. Eleven cases, including eight mesh validation cases (Case 1 to Case 8) and one actual operation case (Case 9), were developed in this study. Case 9 employs the same grid number as Case 5, which has an optimal number of grids. Since the object of this study is a FCT (four-corner tangent) boiler, the tangent circle formed by the flue gas in the furnace is reflected in the horizontal section. Therefore, it is more meaningful to study the section of the model in the horizontal direction. Case 9, Case 10, and Case 11 were divided into six horizontal study sections along the height direction to explore the influence of different burner starting method on the steady-state flow of the boiler, as shown in Figure 4. L1–L5 are the centerlines of the P2–P6 sections, respectively. The locations and other detailed parameters of the different study sections are shown in Table 3.
In the same way that the actual boiler furnace starts the burners at the same time, the burners in all four corners of the furnace are opened simultaneously in Case 9. This article names this burner start-up method as the “simultaneous start up” method. Figure 5 shows the horizontal cross-sectional flow distribution of the FCT boiler under the “simultaneous start up” method. The velocity distribution of the tangential flow on these sections was analyzed under the sBMCR (boiler maximum continuous rating) condition, with all four corner burners of the boiler simulated to operate simultaneously. Several sets of simulations were performed independently. Each simulation was conducted independently. The presentation of the velocity distribution is given in velocity contours.
The analysis was based on several independent sets of simulations, and the velocity distribution results are presented as velocity contours.
The study section is divided into four parts according to the horizontal and the vertical centerline. As depicted in Figure 5, under identical working conditions, the steady-state flow’s tangent circle is not stable in the same position, but is observed in the upper left (Figure 5a), lower left (Figure 5b), upper right (Figure 5c), and lower right (Figure 5d) position. Additionally, at the geometric center, the flow must have a symmetrical tangent circle, indicating that there are at least five solutions in this flow process. In Case 10, the burners at the four corners of the furnace adopt the “diagonal start up” method. That is, when igniting the boiler, the method first opens multiple burner nozzles that are symmetrical about the vertical centerline on both sides of the furnace diagonal, as shown in Figure 6a, and then opens burner nozzles on the other diagonal of the furnace with symmetry on the vertical center line of the furnace, as shown in Figure 6b,c. A stable flow field in the furnace is simulated as shown in Figure 6.
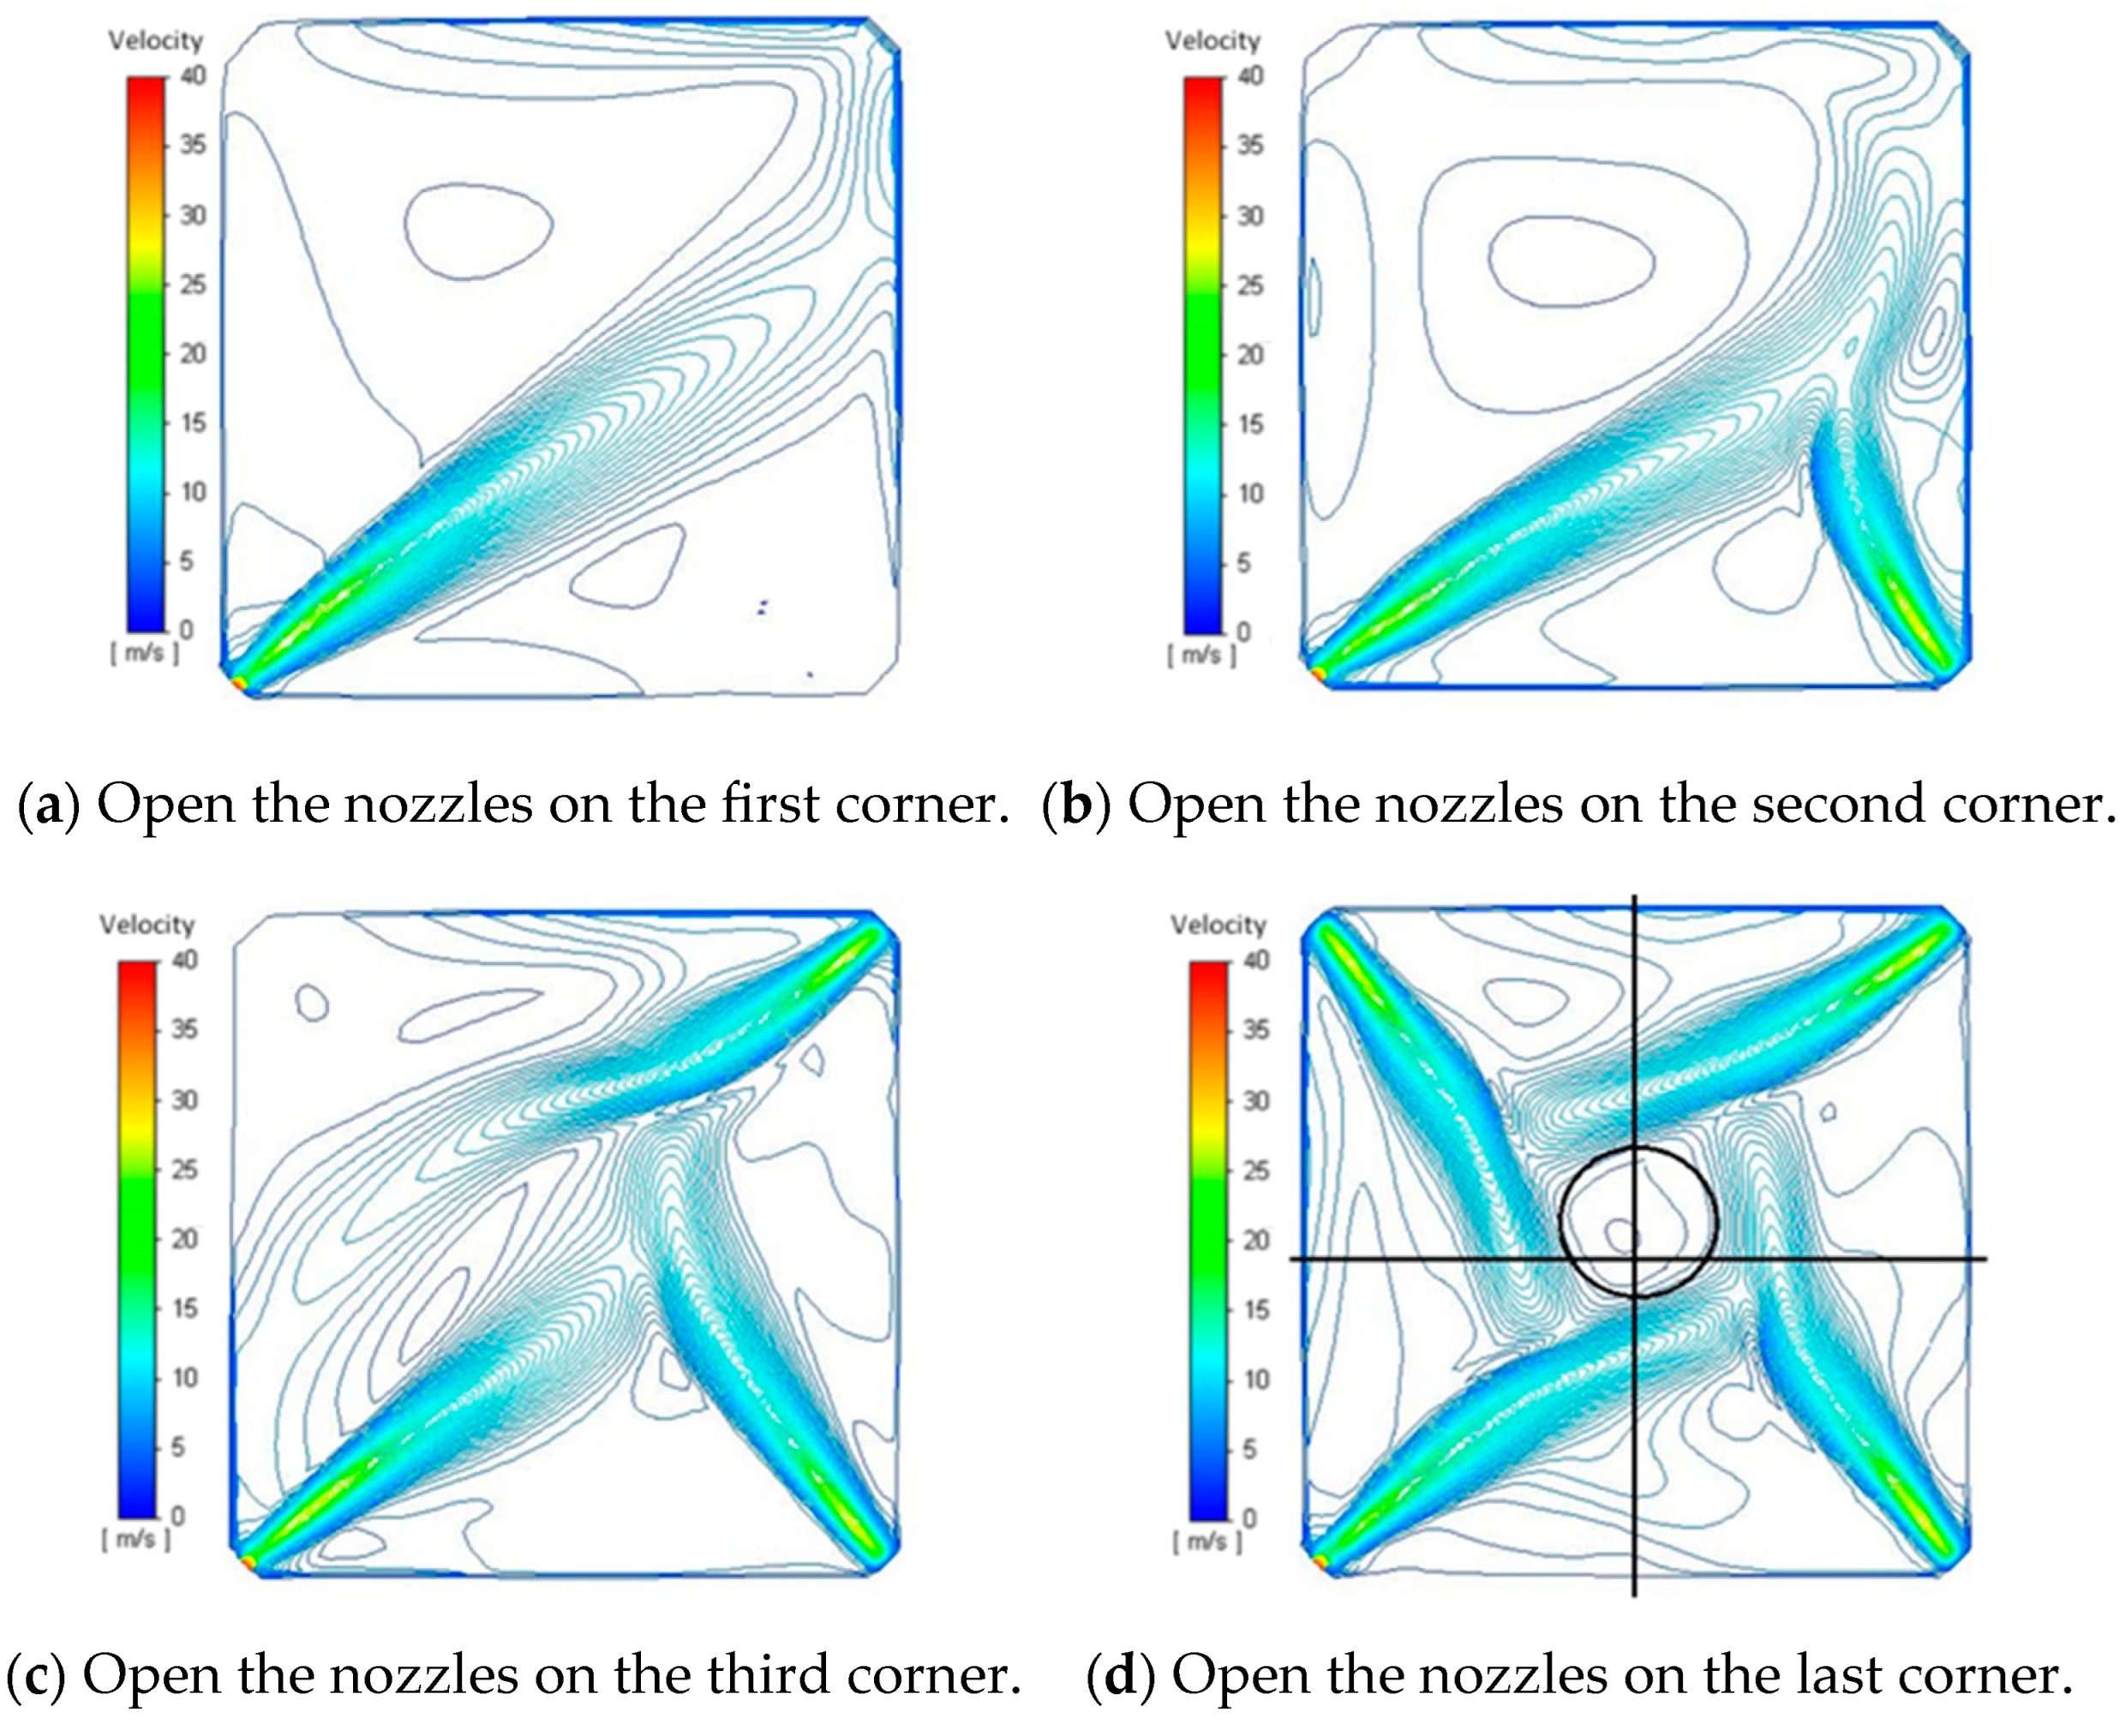
Under the same boundary conditions, the flow field in the model is independently simulated using the diagonal priming method, resulting in two sets of simulated tangent circle positions, as shown in Figure 6b,c. The diagonal starting method yields more stable outcomes than those obtained by starting the four corner nozzles at the same time. However, the precise position of the actual tangent circle remains variable. Case 11 and Case 12 implement the “sequential start up” method, where several burner nozzles at one corner of the furnace are activated first,, as shown in Figure 7a and Figure 8a. The nozzles at the other three corners are activated in a certain order after the flow in the furnace is stabilized. Case 11 first starts multiple burners at one corner of the furnace, and then turns on the burner at the other three corners one by one in counterclockwise order, as shown in Figure 7b–d. Case 12 first starts multiple burners at one corner of the furnace, and then turns on the burner at the other three corners one by one in clockwise order, as shown in Figure 8b–d. Figure 7 and Figure 8 show velocity contours of different start-up method in the order of clockwise and counterclockwise, respectively.
After performing multiple calculations under identical boundary conditions, the results depicted in Figure 7 and Figure 8 indicate that, upon reaching stable operation, the tangent circle formed by the flow stabilizes at a singular position. The result of these multiple calculations is consistent, demonstrating uniqueness. The above numerical simulations illustrate that nonlinear systems exhibit initial condition dependency. By activating the nozzles in a specific sequence, it is possible to control the outcome precisely, thereby achieving precise control.
As can be seen from Figure 5, Figure 6, Figure 7 and Figure 8, although the abstract simplified 3D furnace model is completely symmetrical in terms of geometry and boundary conditions, the outlet conditions set by the burners at the four corners are exactly the same, the simulation results show that the flow results are different, and the solution is not entirely symmetrical about the center line in the vertical direction of the model geometry. The flow within the furnace tends to skew towards the chamfer and the wall, deviating from central symmetry and differing from the ideal flow scenario. Combined with the conclusions obtained in the previous section, it can be seen that under the 3D simulation, the flow in the furnace chamber of the symmetrical structure boiler is inherently asymmetrical, and the flow in the furnace obtains an asymmetric solution under the symmetrical boundary condition, which shows that the flow in the 3D furnace has the characteristics of a nonlinear system.

2.5. Grid Independence Test and Results Validation

ICEM software was used for meshing. The overall grid is a mixed grid, as shown in Figure 9a, with the lower cold ash hopper area having a relatively small impact on the upper calculation area using unstructured tetrahedral grids, as shown in Figure 9b. The upper combustion area with drastic flow field changes using structured hexahedral grids. On the horizontal section, we refine the grid near the height of each nozzle, as shown in Figure 9c. In order to make the flow direction of the fluid at the outlet of the burner nozzle parallel or vertical to the grid as much as possible and reduce pseudo diffusion, the cross-section of the furnace is first diagonally divided and Y-shaped divided and then meshed, as shown in Figure 9d.
The grid independence verification is carried out under BMCR conditions. The initial number of grids selected for simulation is 816,235, with subsequent increases by a factor of 1.3, as shown in Table 4. With the grid number as the independent variable and the furnace outlet average temperature as the dependent variable, the furnace outlet average temperature curve is shown in Figure 10. When the number of grids is 3,015,557, the simulation results tend to be stable, and with the increase in the number of grids, the simulation results change little.
The flue gas temperature at the furnace outlet simulated by Case 5 corresponding to the grid is 1245 K, and the relative error obtained by the simulation is 2.9% compared with the measured data of 1282 K provided by the power plant under BMCR load. In addition, our previous work [33,43] has demonstrated that the selected method maintains a high degree of consistency between the simulation results and the test results. Therefore, the mesh and simulation models used in this paper are reliable for further research.

2.6. Visualize Experiment

In order to verify whether asymmetrical flow occurs in entities with perfectly symmetrical geometric structures, a simplified three-dimensional furnace model with nozzles arranged in four corners of the burner is designed to visualize the cold flow. The model is completely symmetrical about the vertical centerline, so that the ideal flow tangent circle is formed and stabilized at the vertical centerline position of the model. The experiment simulated the actual boiler furnace burners injecting pulverized coal in a certain sequence by controlling the opening of the nozzles located at the four corners. By observing the symmetrical and asymmetrical flow phenomena in the symmetry model in the experiment, the nonlinear principle of the flow process is qualitatively analyzed.
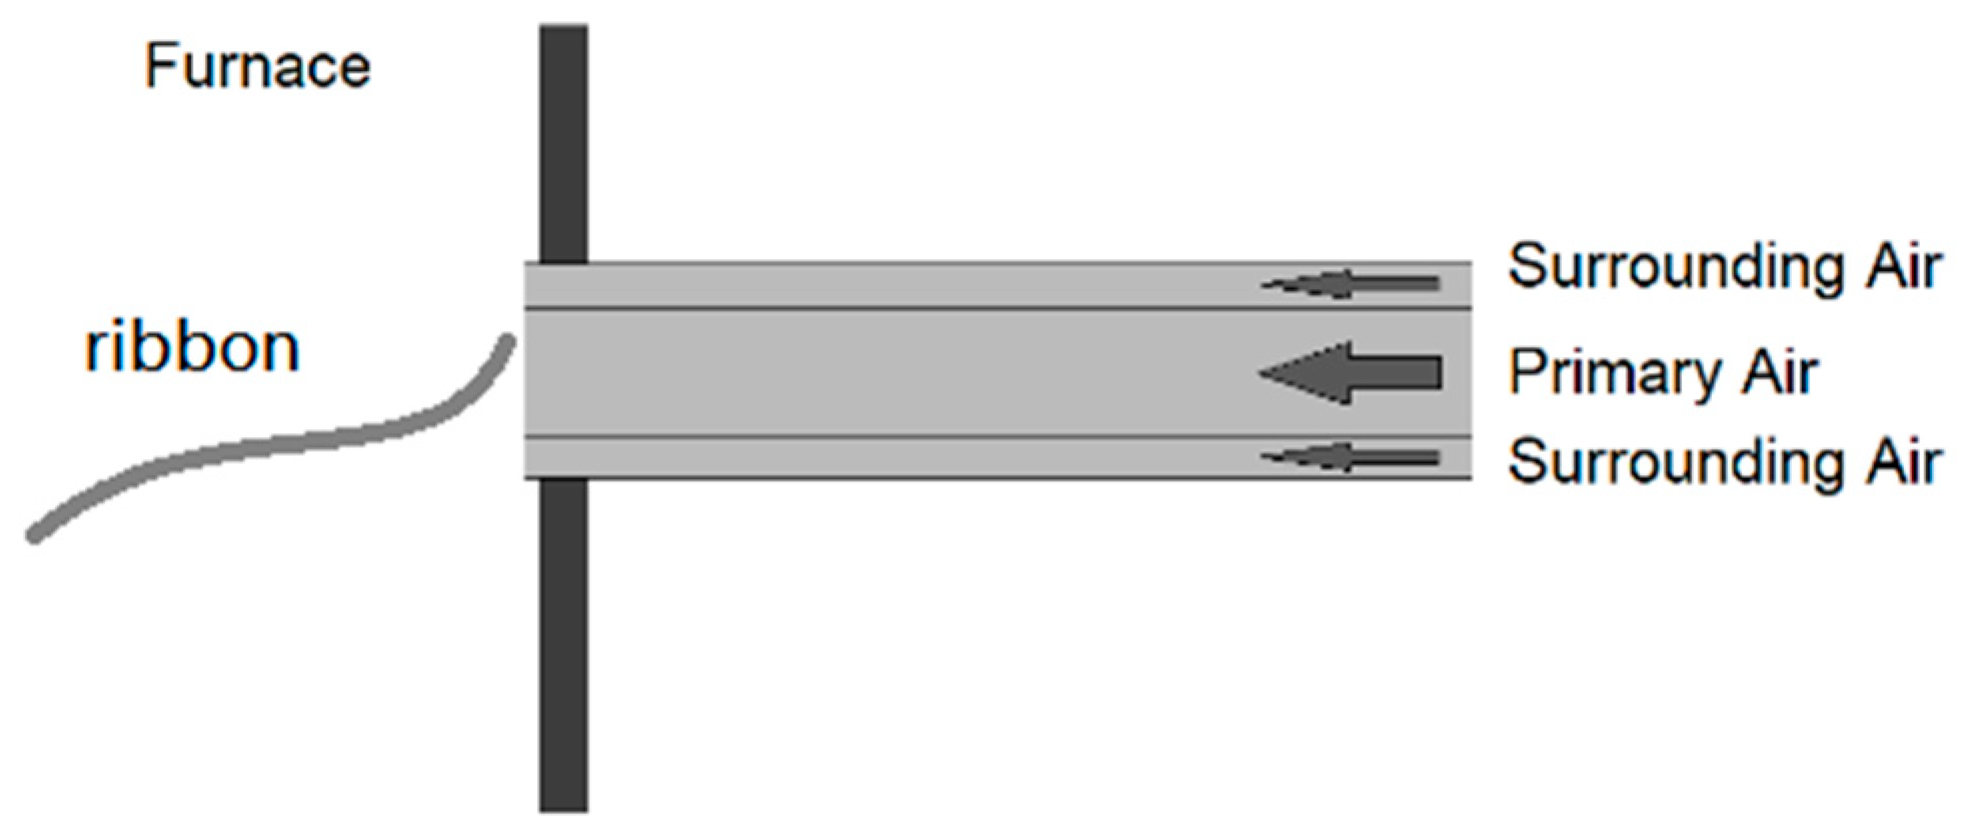
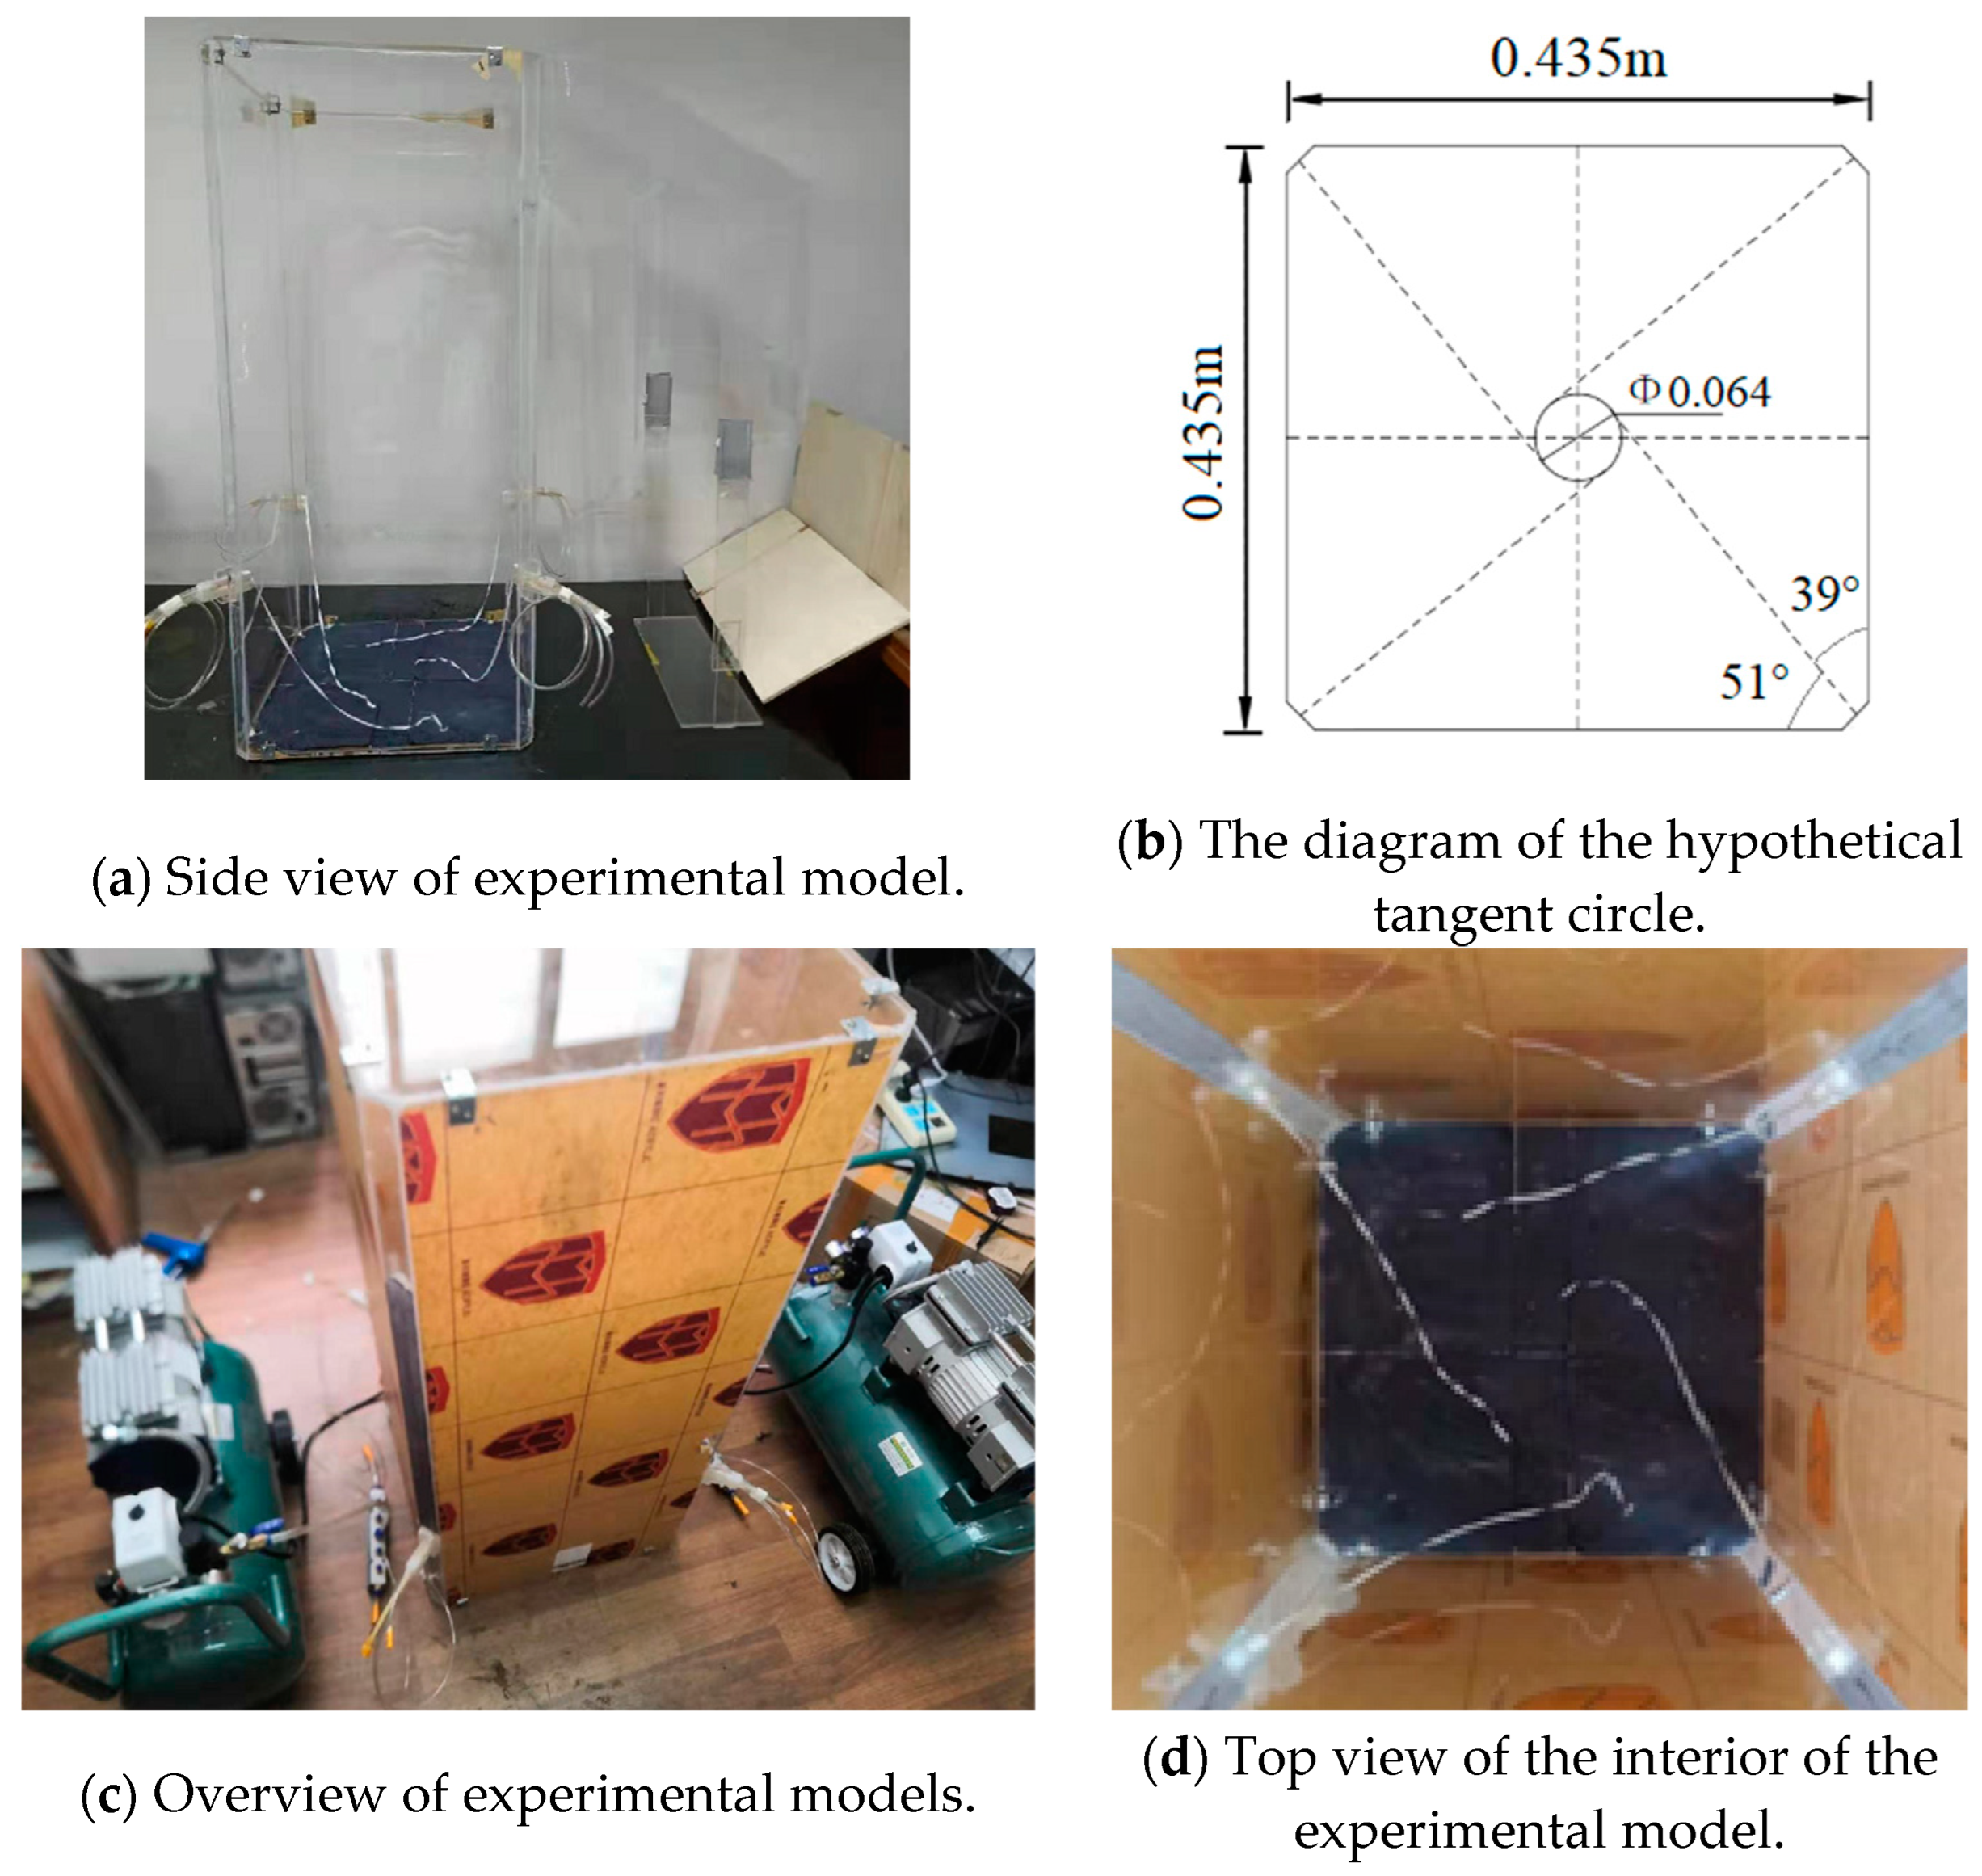
The furnace experimental model measures 0.435 m in width, 0.435 m in depth, and 1.042 m in height. Similarly, the nozzle is set at the chamfered corners of the wall. The size of the nozzle is 0.009 m in height and 0.015 m in width. The normal direction of the nozzle outlet is at an angle of 51° to the wall, and the theoretical diameter of the tangent circle is 0.064 m. The experimental flow fluid is air, which is supplied by two high-pressure pumps, each of which is responsible for the air supply of two adjacent nozzles, and the air supply flow is jointly controlled by the pump outlet valve and the nozzle inlet valve. The experimental flow field tracer device is a lightweight polyethylene streamer, and the width of the streamer is narrow enough to have a negligible influence on the air flow at the nozzle outlet. A schematic diagram of the nozzle structure of the experiment is shown in Figure 11.
The wall material of the experiment is thick acrylic plate, and the corners of the model are fixed with metal corners and bolts to ensure the rigidity of the model, as shown in Figure 12a. The diagram of the hypothetical tangent circle and the experimental setup is shown in Figure 12b. The external equipment for the experiment is shown in Figure 12c. The internal structure of the experimental apparatus is shown in Figure 12d.

3. Results

3.1. Experimental Results under Different Start-Up Methods

3.1.1. Visual Experiments under the “Simultaneous Start Up” Method

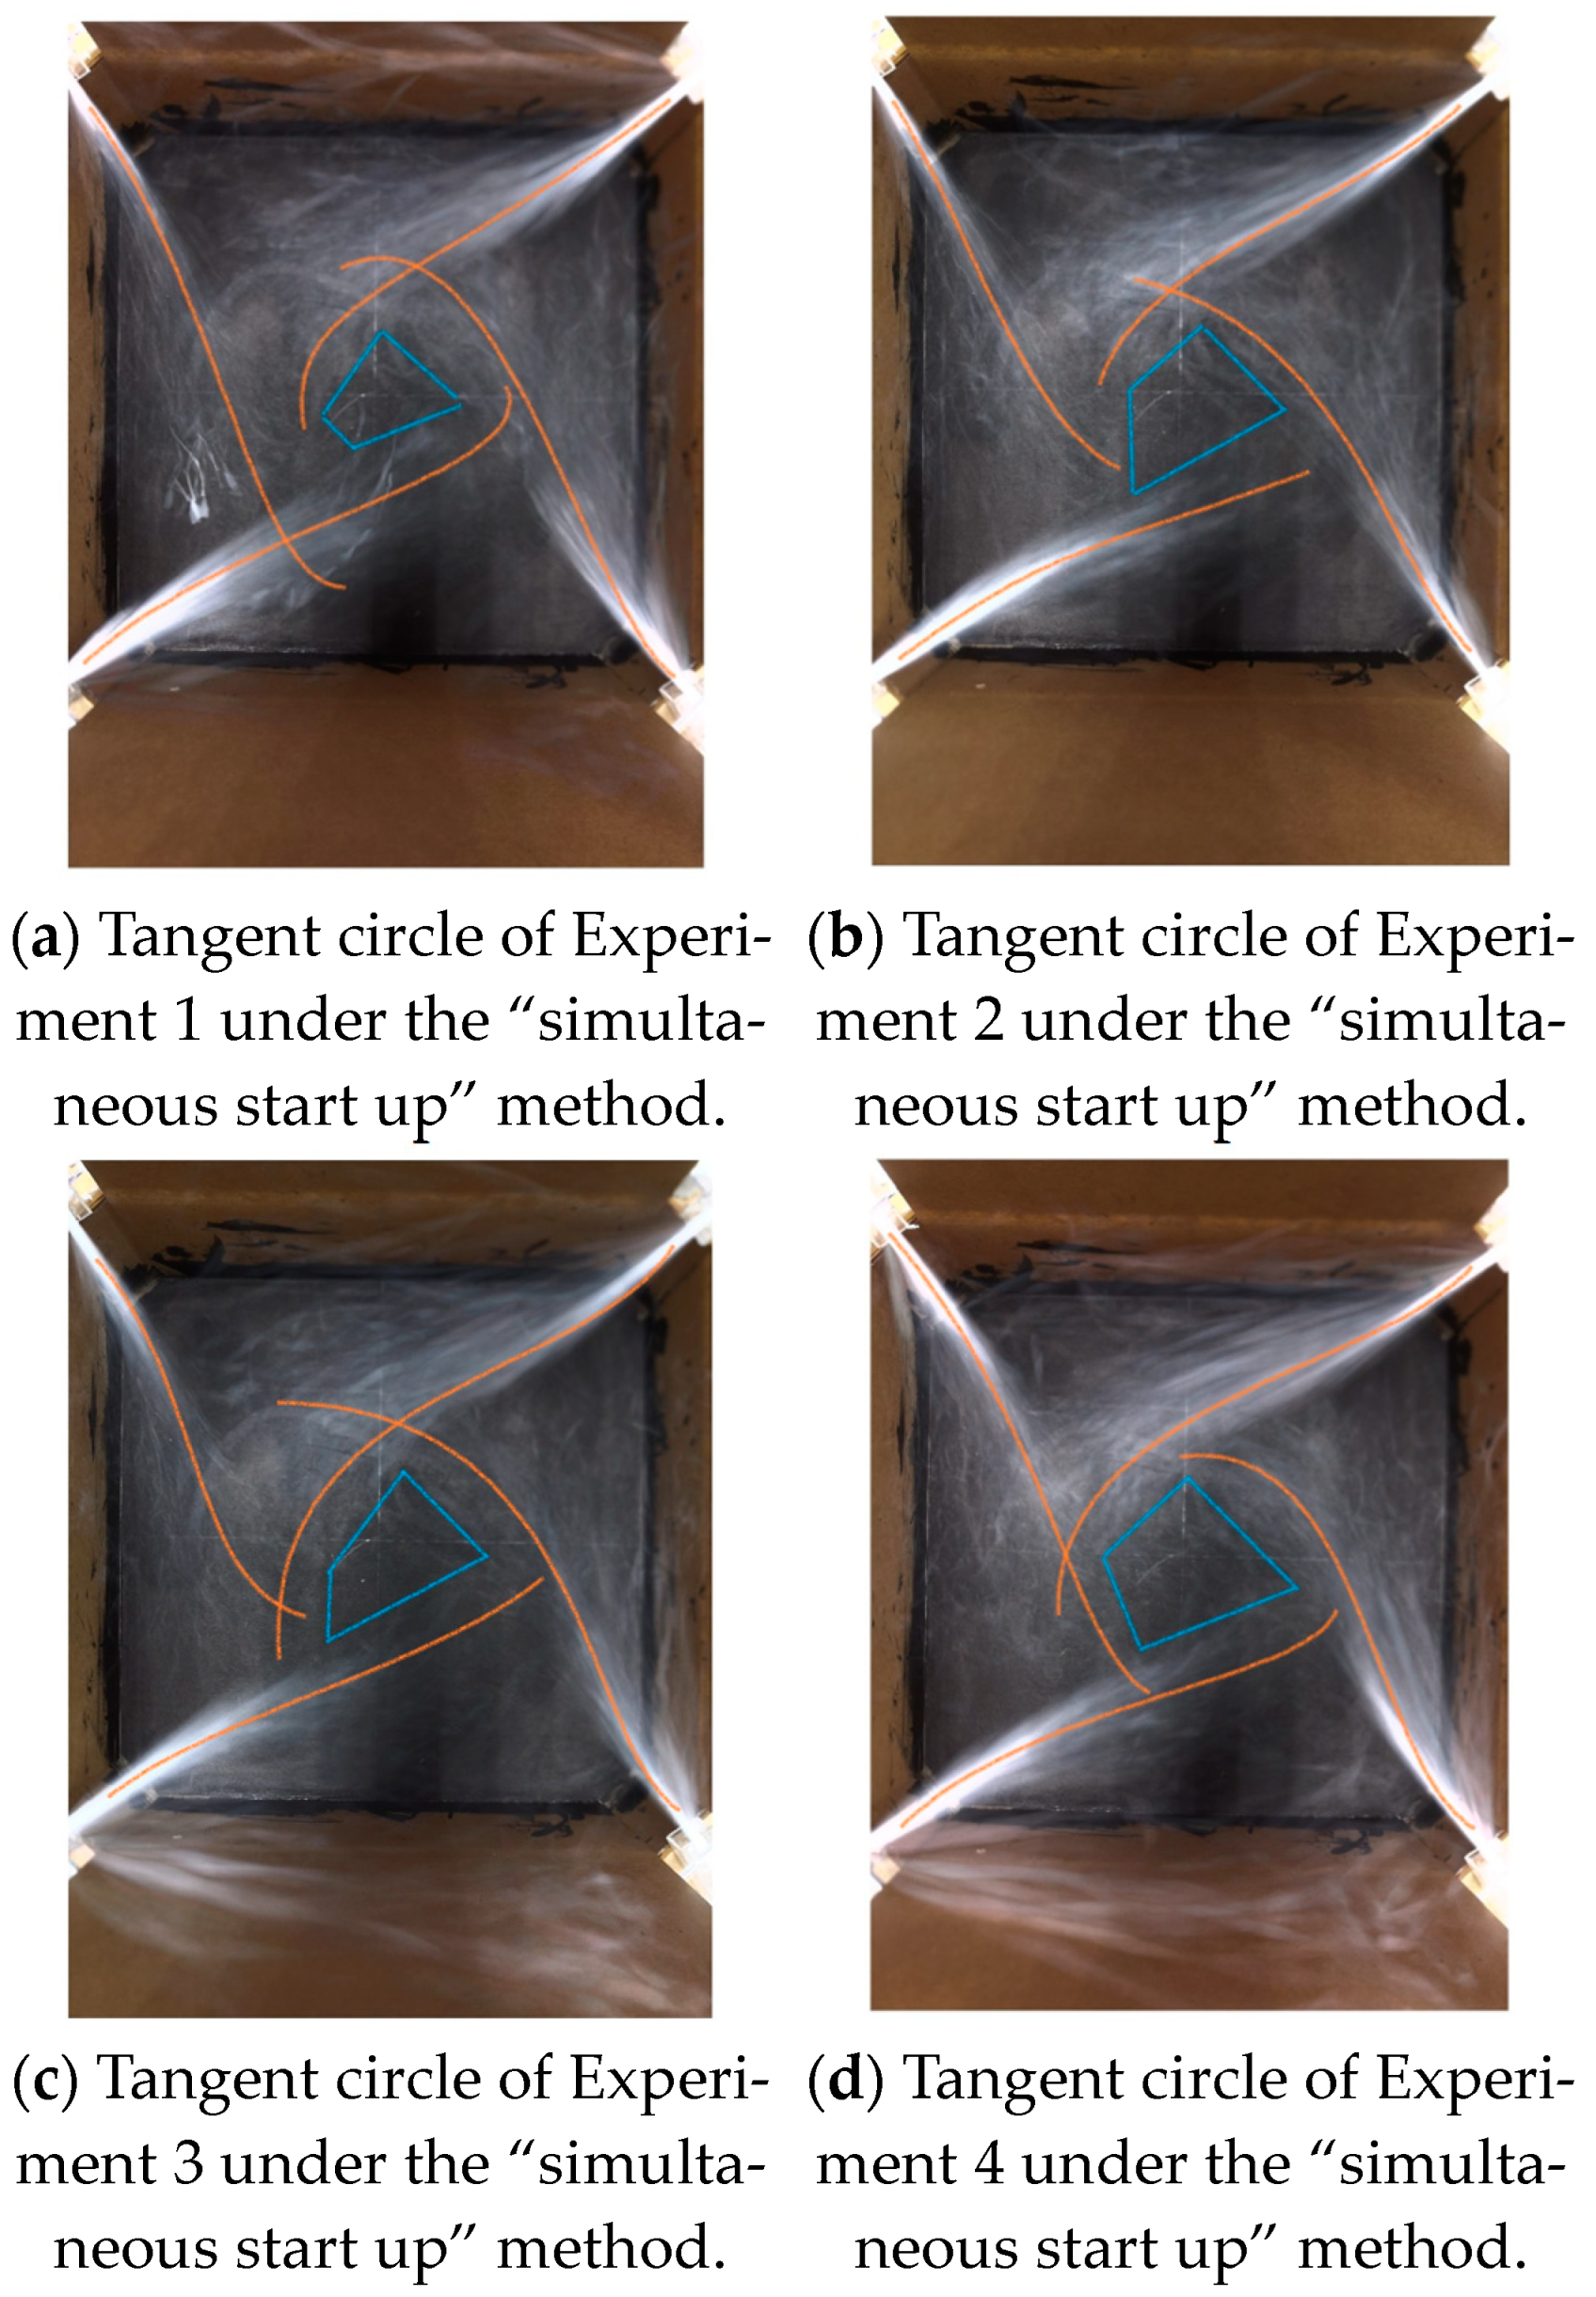
In the visualization experiment, a lightweight polyethylene streamer is used to show the trajectory of the flow tangent circle. In order to clearly see the degree to which the actual tangent position obtained from the cold flow experiment deviates from the ideal tangent circle, so as to qualitatively analyze the experimental flow field, a colored curve is depicted in the photograph to analyze the characteristics of the flow tangent circle.
Under the “sequential start up” method, after the flow field has stabilized, the actual flow tangent circle obtained by the cold-state experiment is shown in Figure 13.
Under the “simultaneous start up” method, the visualization of the tangent circle shows a similar phenomenon to the tangent circle obtained by numerical simulation; that is, in the experimental device with completely symmetrical geometric structure, the position of the actual tangent circle is deviated from the position of the ideal tangent circle, and the shape of the actual flue gas tangent circle shows randomness. Moreover, the center position of the tangent circle also exhibits randomness. The center of the tangent circle in Figure 13a is biased to the right, the center of the tangent circle in Figure 13b is biased to the lower right, the center of the tangent circle in Figure 13c is located downward but the radius is smaller than that of Figure 13b, and the center position of the tangent circle in Figure 13d is biased to the lower left. Excluding the minor experimental setup errors, it is shown that the asymmetric flow field in the flow model with perfectly symmetrical dimensions is not caused by physical geometric factors, but by the solution’s nonlinearity. The skew of the actual flow tangent circle is a bifurcation pattern that corresponds to a branch of the fork. At the same time, the flow field under the “simultaneous start up” method also verifies that the symmetrical solution of the flow tangent circle at the center position is unstable, and the actual state of the flow tangent circle will not be stable at this position, but will be stable at the position where the tangent circle deviates from the geometric center, which corresponds to the asymmetric solution.

3.1.2. Visual Experiments under the “Diagonal Start Up” Method

From repeated experiments under the “diagonal start up” method, it can be seen from Figure 14 that although the position of actual tangent circle was not in the geometric center, a relatively stable flow field tangent was obtained, which illustrated that in this start-up method, starting the nozzles at the four corners of the model in a specific sequence can effectively control the initial flow field in the furnace to stabilize. The center of the tangent circle in Figure 14a is located in the lower left, the center of the tangent circle in Figure 14b is directly below, and the center of the tangent circle in Figure 14c is located directly below but the radius is smaller than in Figure 14b.

3.1.3. Visual Experiments under the “Sequential Start Up” Method

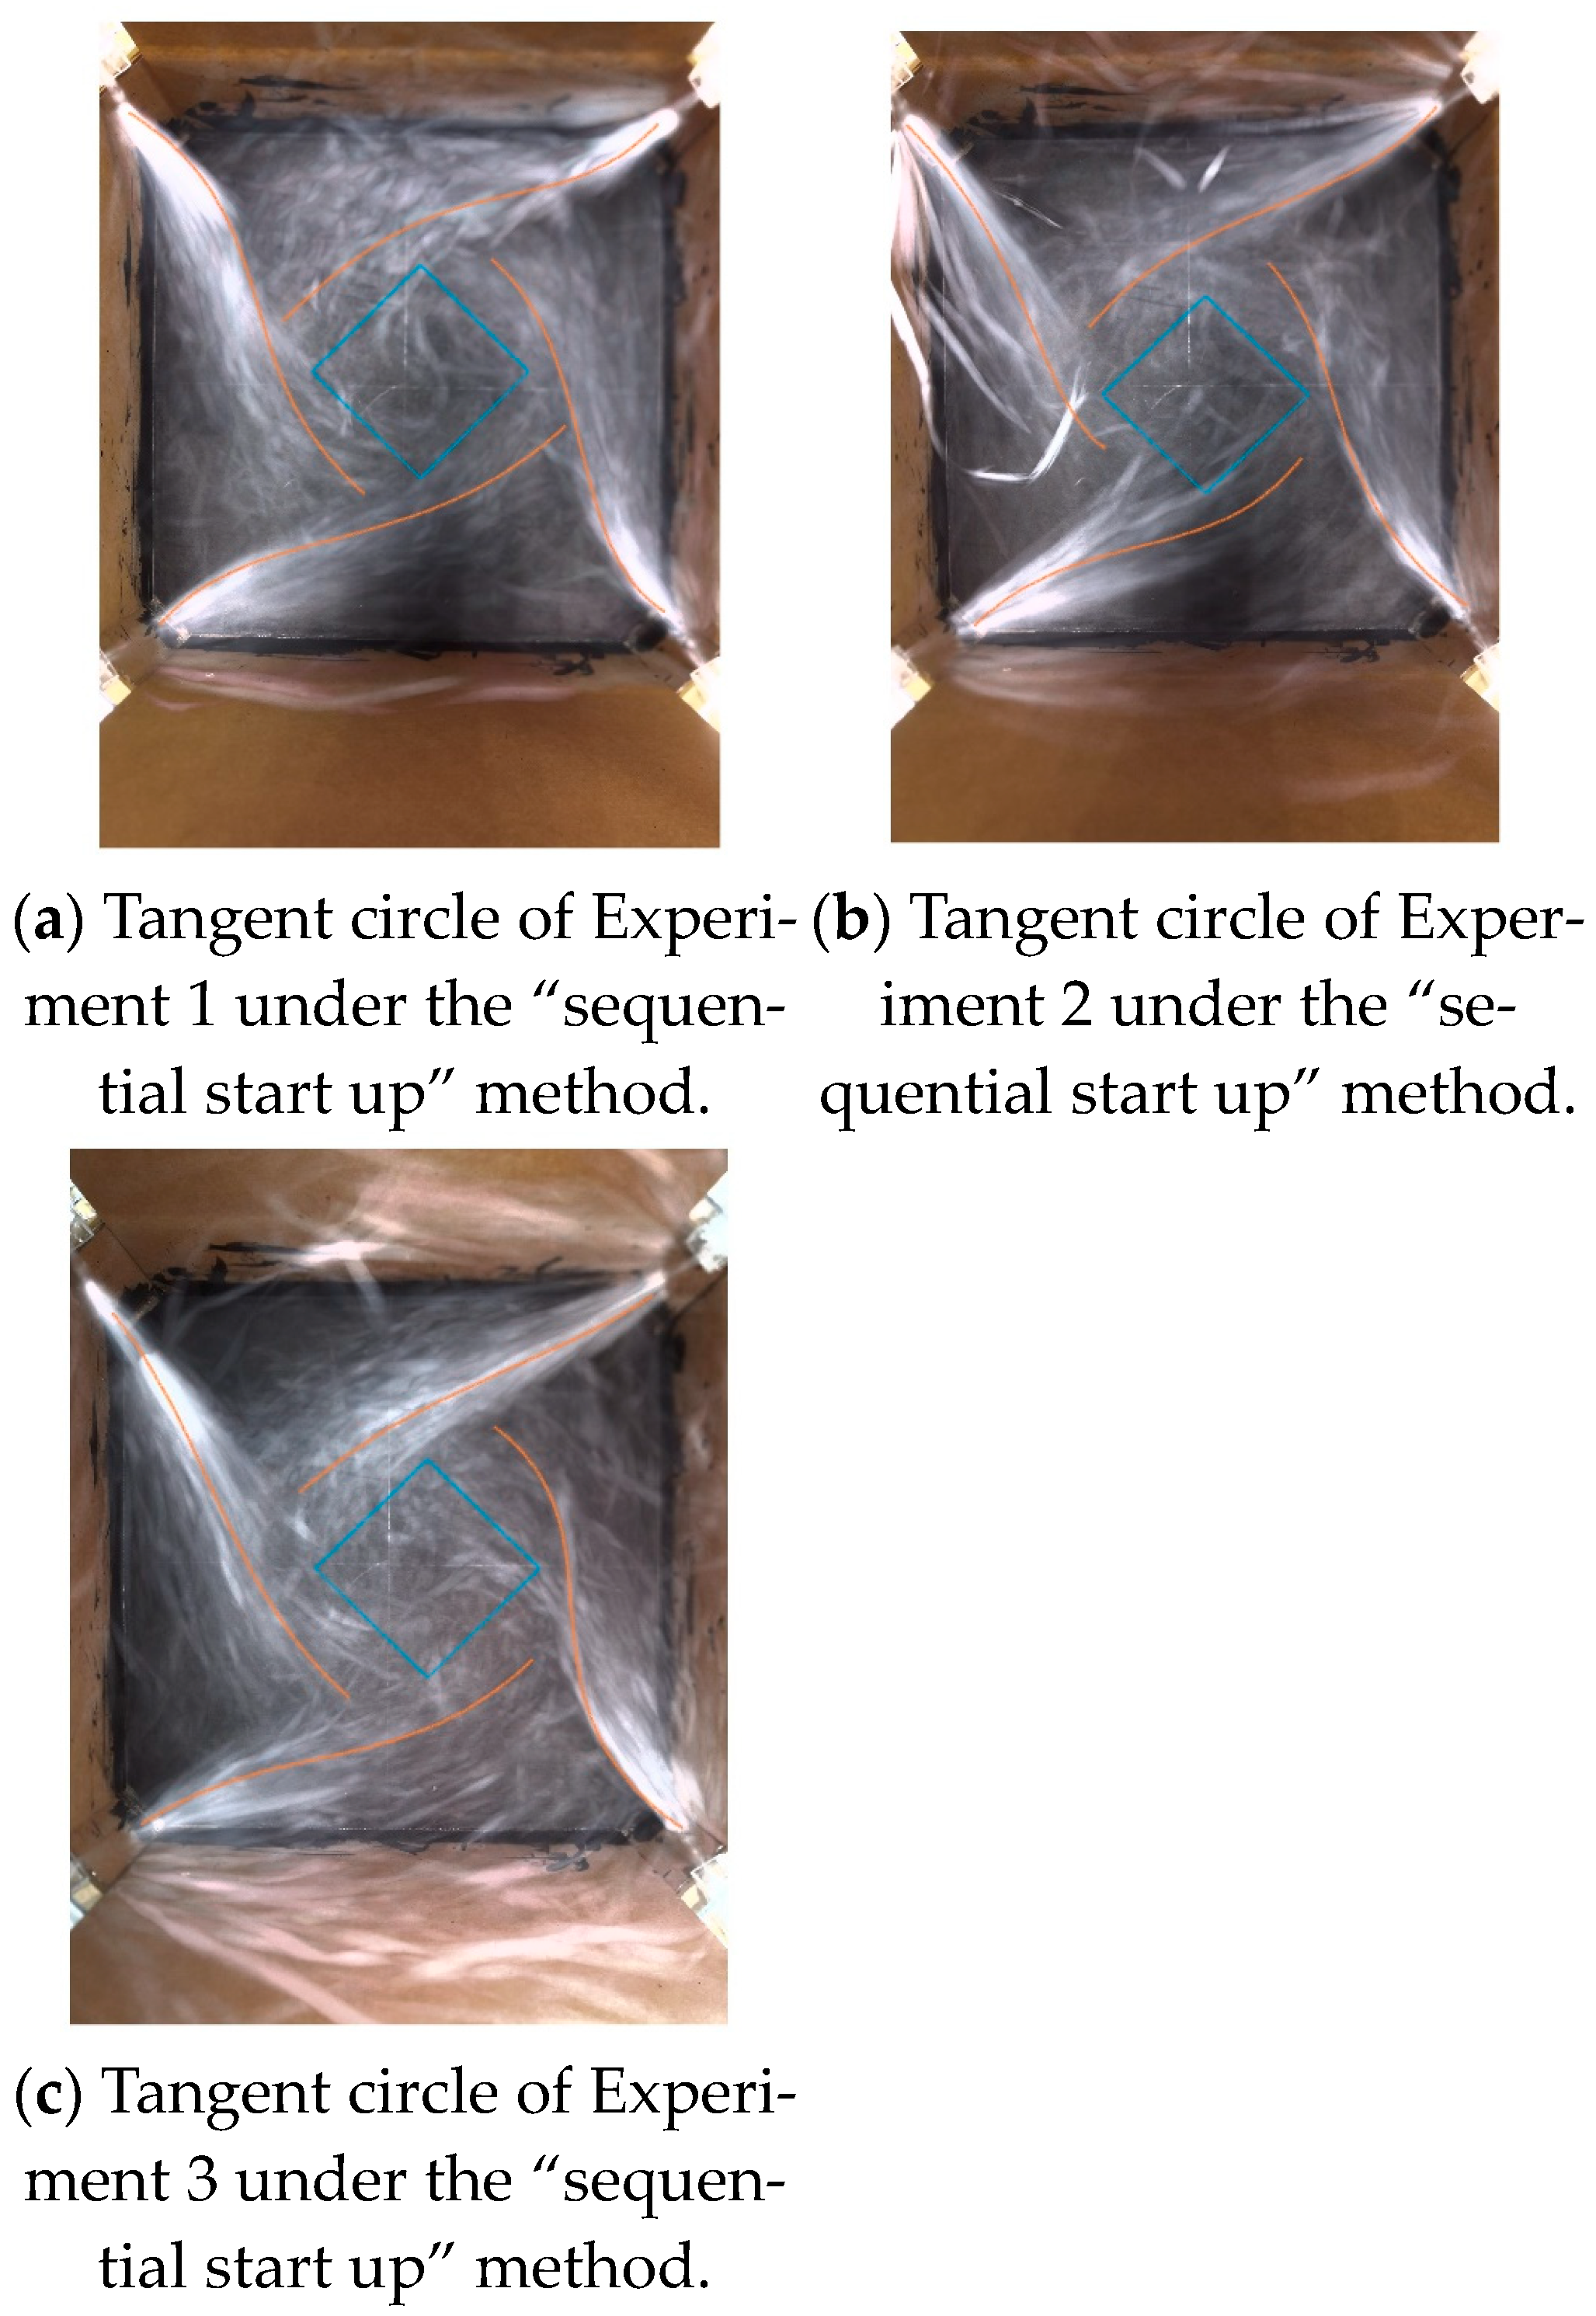
Keeping the nozzle inlet boundary conditions unchanged, the nozzles at the four corners were opened in the clockwise and counterclockwise sequences, respectively, and the tangent circle is obtained as follows. Figure 15a–c showcase the steady flow field tangent circle obtained by opening the nozzles at the four corners in a counterclockwise sequence. Figure 16a–c display the steady flow field tangent circle obtained by opening the nozzles at the four corners in a clockwise sequence.
As can be seen from Figure 15 and Figure 16, showing repeated experiments using the “sequential start up” method, a stable and unique tangent circle of the flow field was obtained in experiments, even though the actual position of tangent circle of the fluid is not in the geometric center, which explains that in this start-up method with nozzles started up from one corner to others one by one sequentially, the flow field can be controlled to obtain a unique result. That is, “precise control” is realized.

3.2. Numerical Simulation under Different Start-Up Methods

3.2.1. Effect of Different Start-Up Methods on Velocity Distribution of Furnace Flue Gas

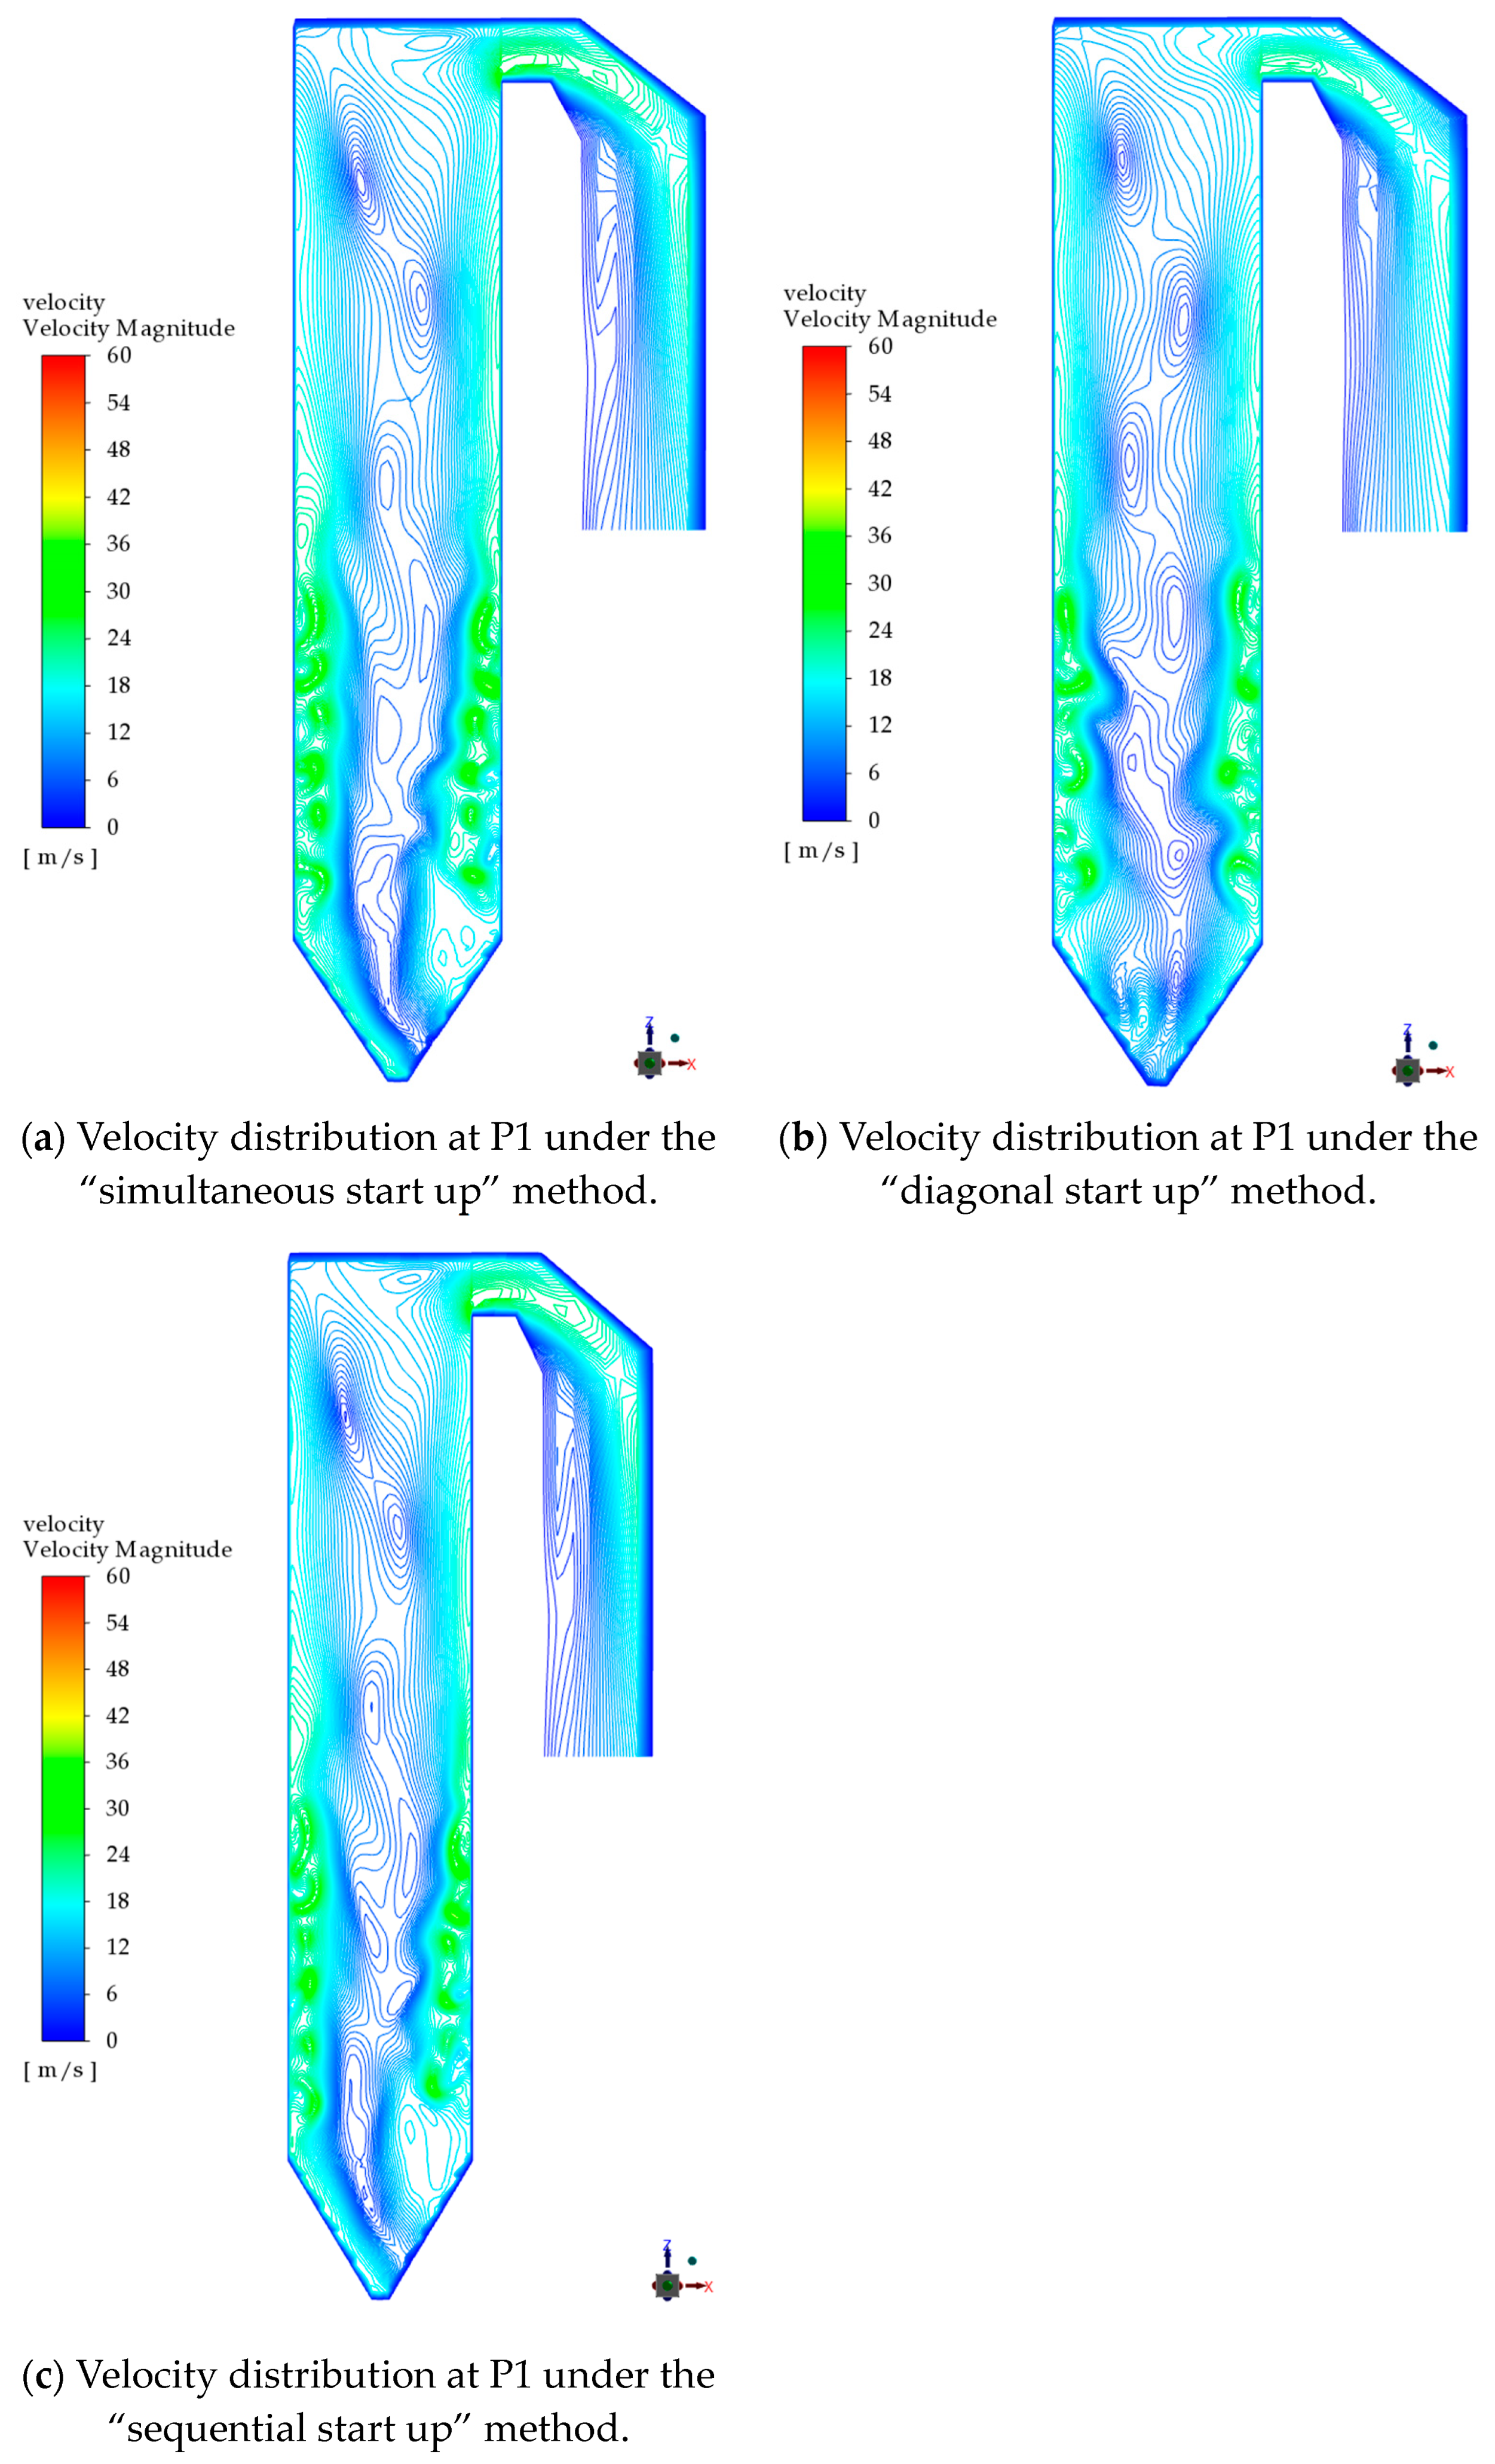
Figure 17, from left to right, presents the velocity simulation results obtained by start-up method of “simultaneous start up” (as shown in Figure 17a), “diagonal start up” (as shown in Figure 17b) and “sequential start up” (as shown in Figure 17c) under BMCR conditions. The P1 section was selected as the study section. It can be seen that the velocity distribution law under the three start-up methods is roughly the same in P1. The high-speed area is distributed near the wall face on both sides, corresponding to the tangent circle of gas flow on the horizontal section. The low-speed area is distributed near the center of furnace, corresponding to the velocity distribution at the center of the tangent circle of gas flow on the horizontal section.
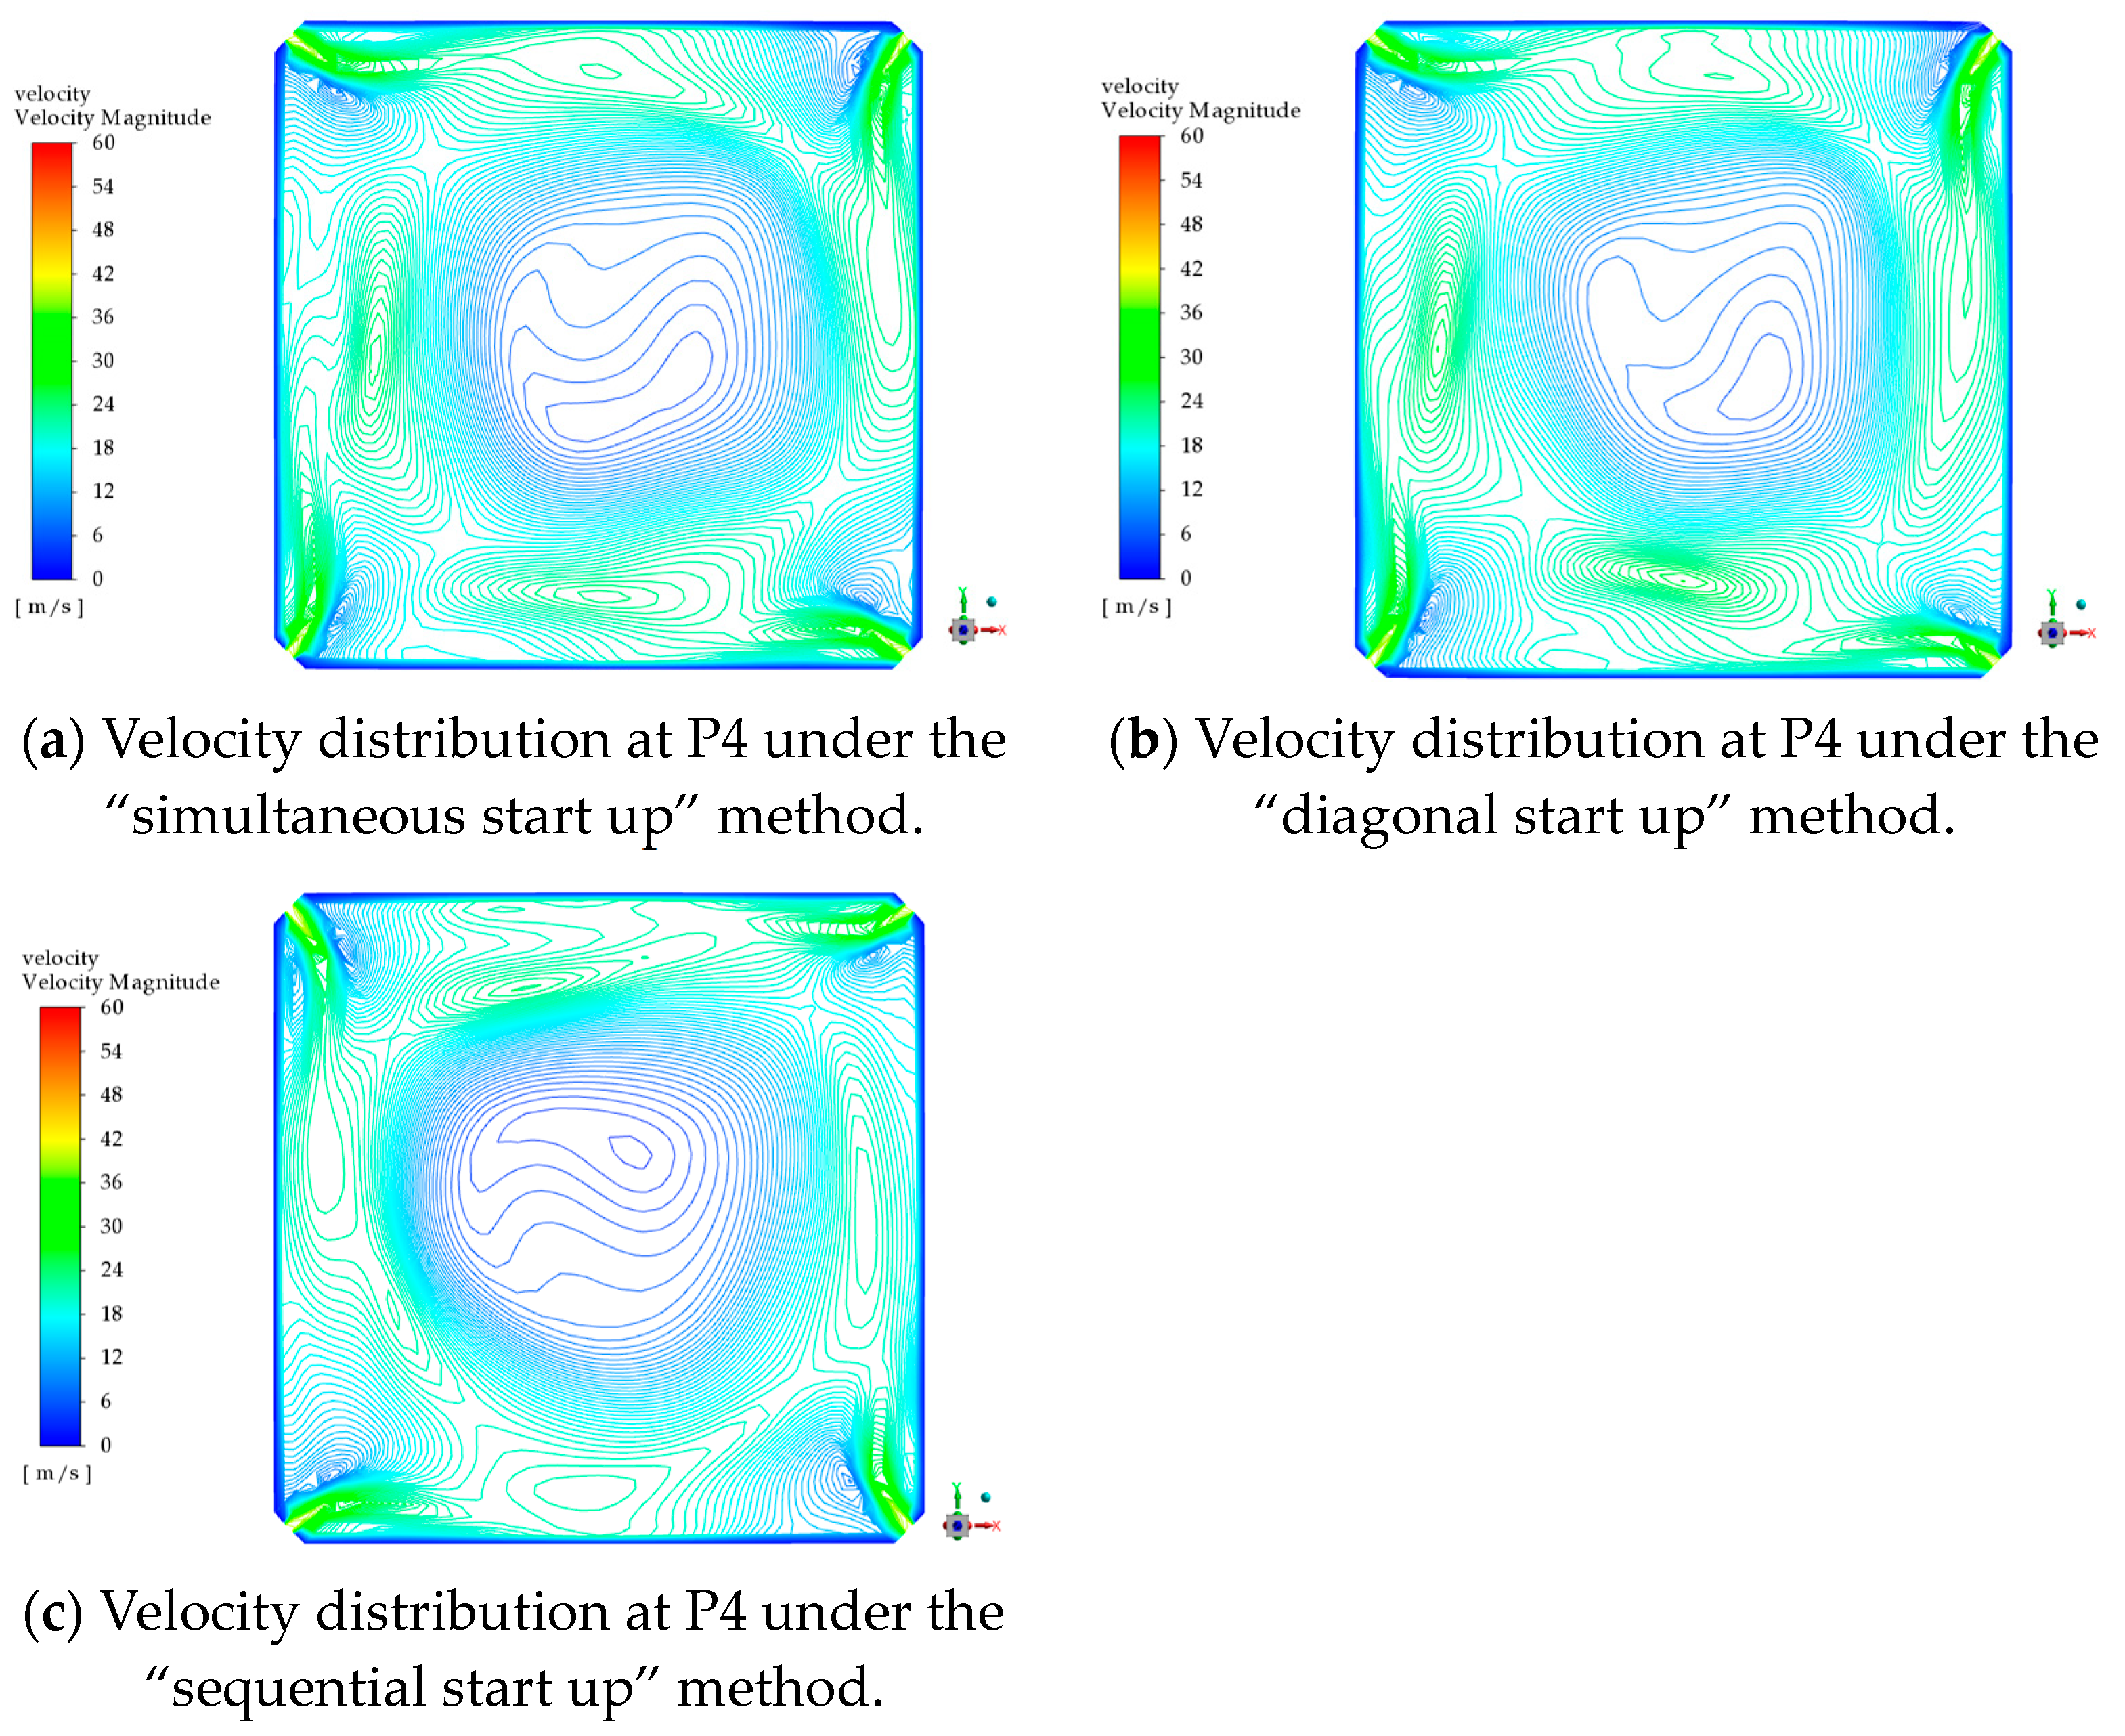
P2, P3, and P4 are the study sections of the lower, middle, and upper burner regions at the same corresponding positions, and the velocity and temperature distribution on these three study sections are similar. To simplify the research without losing generality, the horizontal cross-section P4 at the height of the upper burners was selected to qualitatively analyze the distribution law in the horizontal section of the burner area. As can be seen from Figure 18 and Figure 19, the coal powder airflows from the burner nozzles at the four corners of the furnace collide with each other violently. The air flow rotates in the furnace chamber and forms a circle pattern. The velocity is lower near the center of the circle and increases outward. By comparing Figure 18 and Figure 19, it can be seen that although the velocity distributions in the “diagonal start up” method (as shown in Figure 18b and Figure 19b) and the “sequential start up” method (as shown in Figure 18c and Figure 19c) still deviate from the ideal tangent circle to a certain extent in the main combustion zone, the velocity distributions obtained by the two simulations are more regular than those obtained in the “simultaneous start up” method (as shown in Figure 18a and Figure 19a). Both sets of velocity distributions are closer to the geometric center of study section, and the roundness of the flow field tangent is more circular than that obtained by the “simultaneous start up” method. With the injection of downstream SOFA air, the deflection of the air flow in the furnace chamber is further reduced, and the position of the tangent circle is shifted.
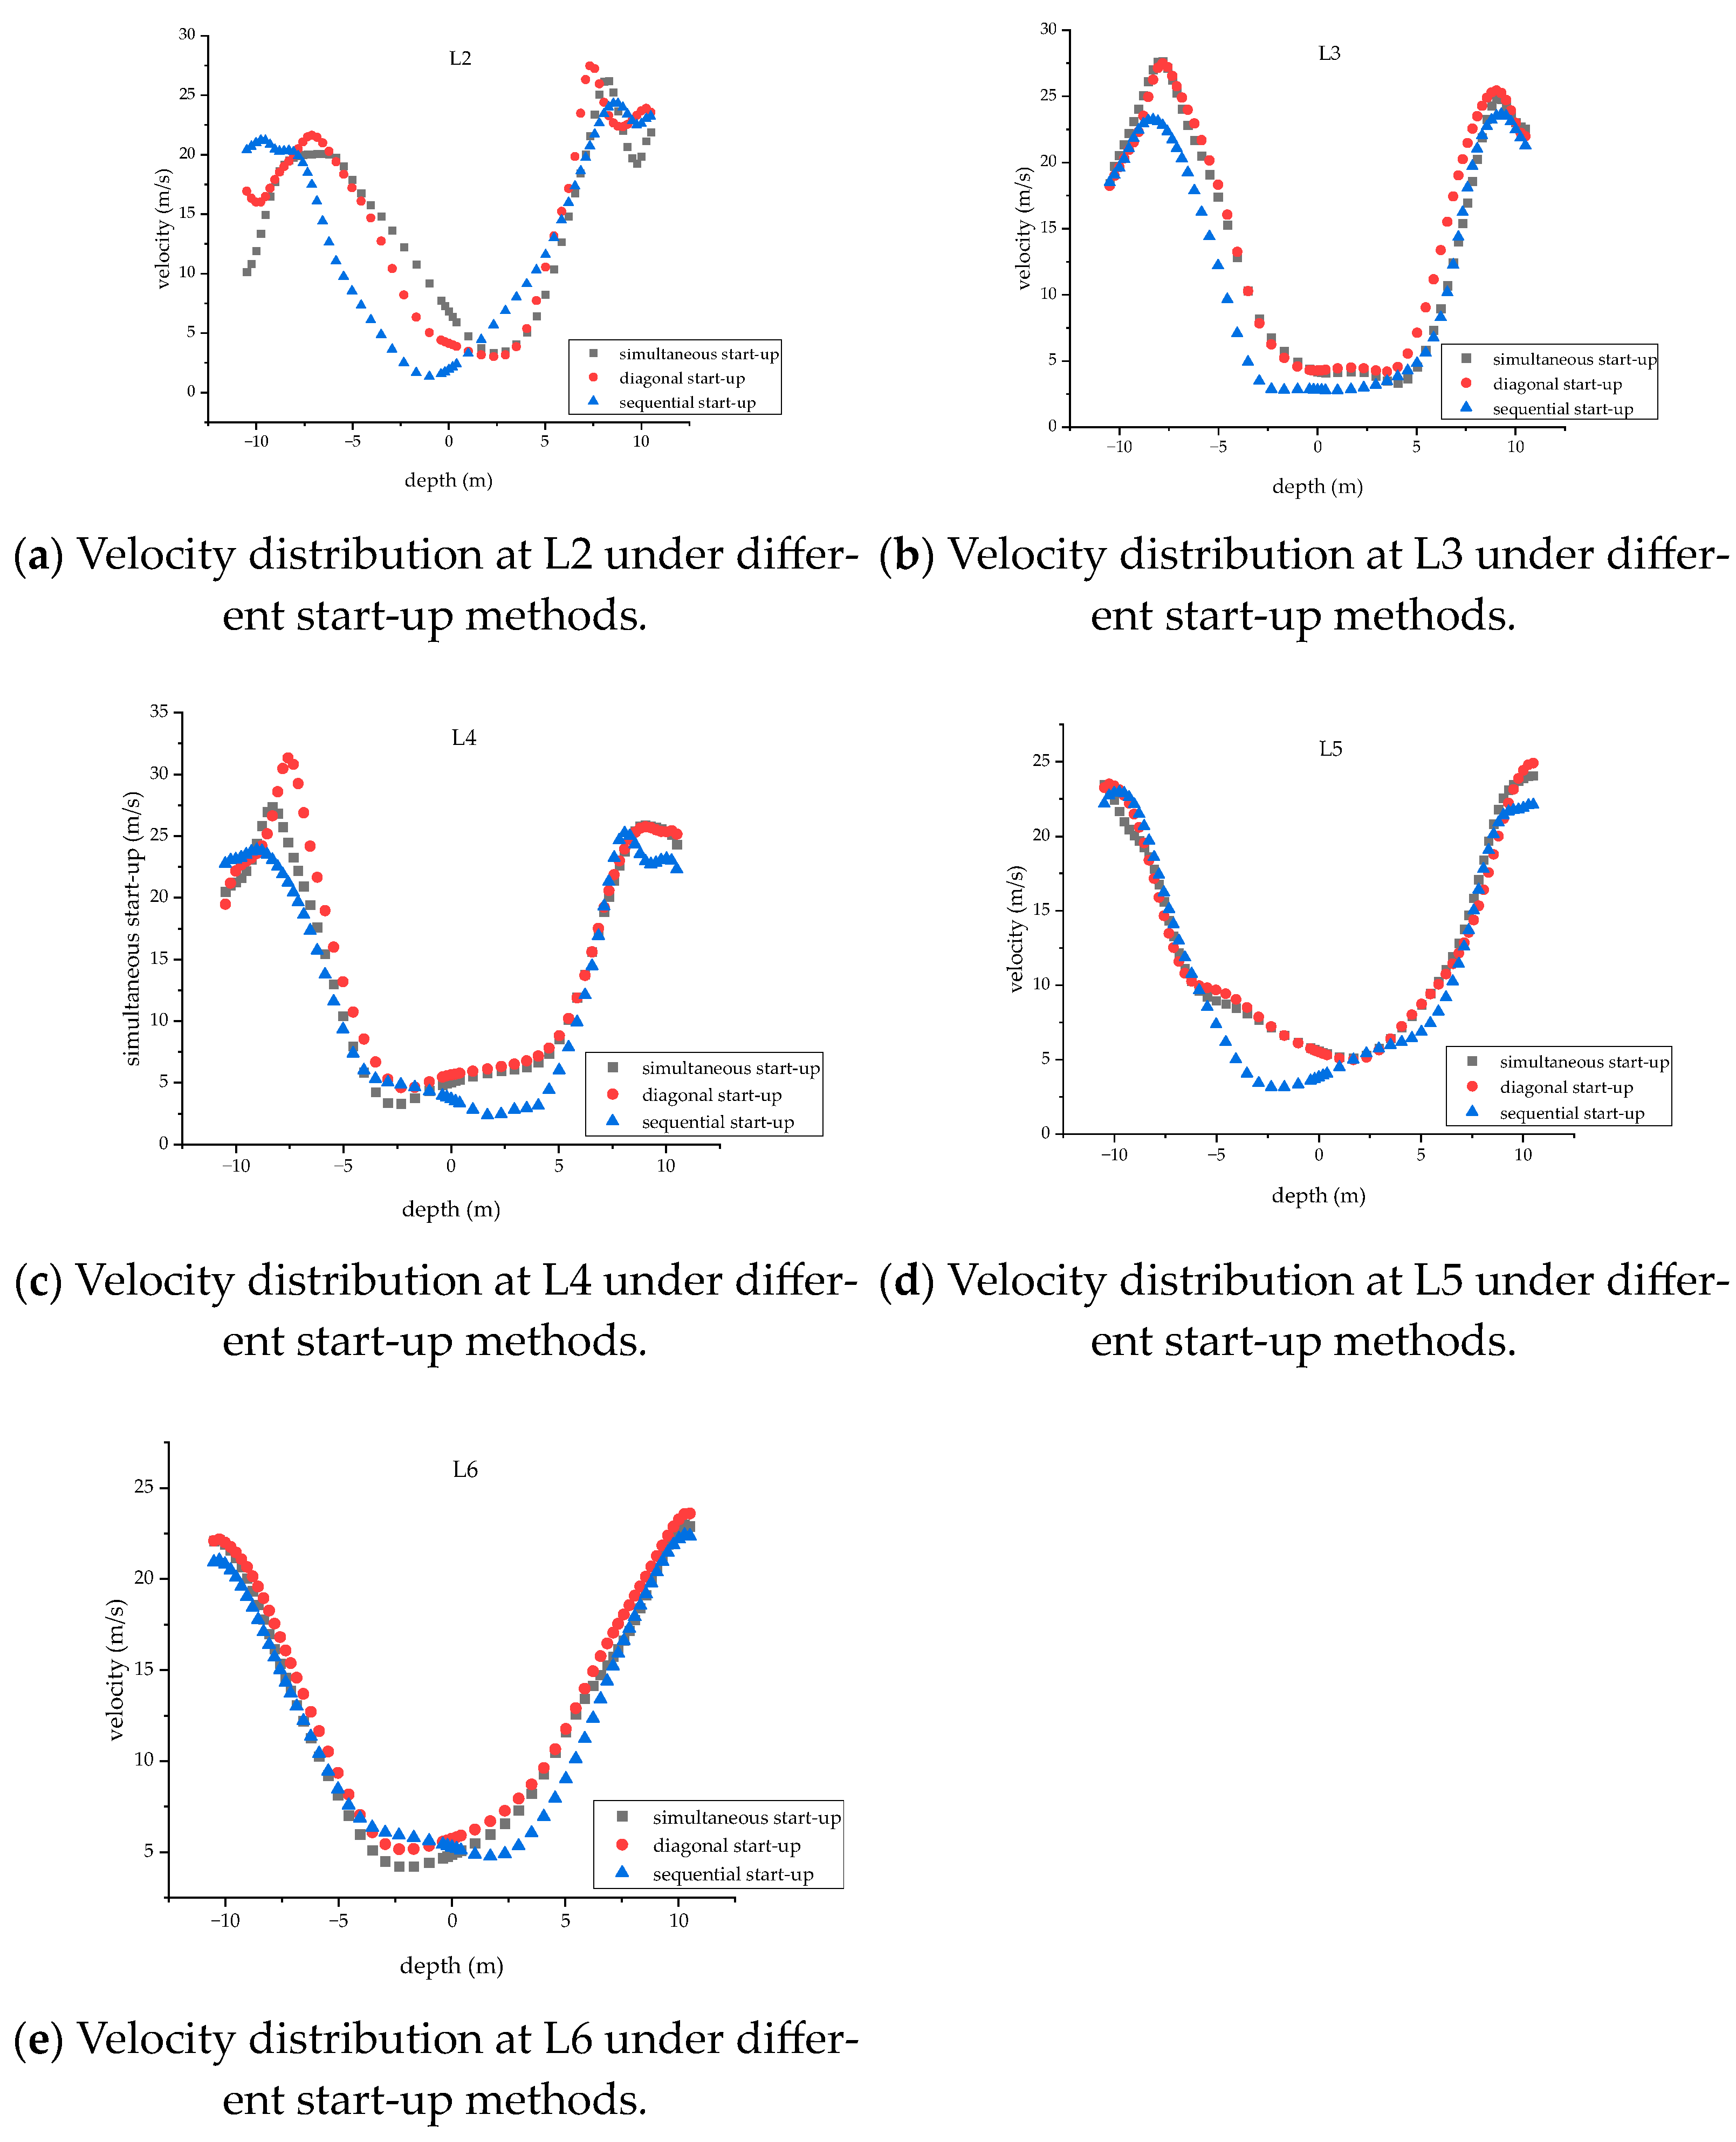
The velocity distribution on L2 (as shown in Figure 20a), L3 (as shown in Figure 20b), L4 (as shown in Figure 20c), L5 (as shown in Figure 20d), and L6 (as shown in Figure 20e) was selected to study the effect of “simultaneous start up”, “diagonal start up” and “sequential start up” on the flow field in the upstream region of the furnace, as shown in Figure 20.
For the velocity distribution obtained under the same start-up method, at the height of the lowest burner in the furnace, the rapid nozzle speed results in the initial formation of flue gas leading to violent mixing of the flue gas flow. The furnace velocity distribution under the three starting modes shows strong asymmetry, as shown in Figure 20a. Upward along the furnace height, in the middle burner area, the asymmetry of the furnace velocity distribution is reduced due to the formation of the upstream tangent circle, and the velocity distribution along the furnace width shows good symmetry under the three start-up methods, as shown in Figure 20b. Progressing further up, the burning in the upper burner area experiences the most intense burning, and the flue gas deflection is more severe due to the entrapment and impact on the airflow of the upstream adjacent nozzle, as shown in Figure 20c. At the L5 height, the injection of downstream SOFA slows down the velocity deflection of the three start-up modes, because the high wind speed and large air volume of the SOFA air increase the rigidity of the flow tangent circle, as shown in Figure 20d. At the height of the furnace outlet, as shown in Figure 20e, with no air flowing into the furnace, the influence of upstream SOFA air recedes, leading to an improved symmetry of the tangent circle.
Comparing the velocity distribution curves in Figure 20 across the same study cross-section, the velocity distribution of the flow field in the furnace obtained under the “sequential start up” method is the most symmetrical. The low-velocity areas are closer to the geometric center of the furnace, which is consistent with the velocity distribution law analyzed on the P1 section. The symmetry of the velocity distribution field obtained by the “diagonal start up” method ranks second, and the velocity distribution under the “simultaneous start up” method is the most asymmetrical, and the center of tangent circle deviates the farthest from the geometric center.

3.2.2. Effect of Different Start-Up Methods on Temperature Distribution of Furnace Flue Gas

Figure 21 from left to right represents the temperature simulation results obtained by the start-up methods of “simultaneous start up” (as shown in Figure 21a), “diagonal start up” (as shown in Figure 21b), and “sequential start up” (as shown in Figure 21c) under BMCR conditions. The P1 section was selected as the study section. It can be seen that in the height direction, the cold ash hopper area exhibits the lowest temperatures, whereas the main combustion zone records the highest temperatures, with the high temperature zone in the furnace chamber is also distributed in this area. The boiler studied in this paper uses staged combustion technology to reduce the temperature, and there are six layers of SOFA nozzles in the downstream of the combustion zone, and the temperature of the downstream of the combustion zone in the furnace is reduced by the injection of SOFA air at the beginning, and the temperature of the upper layer is slightly increased due to the SOFA air supplementing the air; and the incomplete coke particles in the flue gas are completely burned, and the temperature is slightly increased.
Similar to the qualitative analysis of the distribution characteristics of velocity in the furnace, only the temperature distribution on the horizontal cross-section P4 of the furnace is selected to qualitatively analyze the flue gas distribution in the horizontal cross-section of the burner area. From left to right, the simulation results of the hot state in the furnace are obtained under the three start-up methods of the “simultaneous start up” method, “diagonal start up” method, and “sequential start up” method. As can be seen from the figure, the temperature distribution skew on the P4 cross-section simulated with the “diagonal start up” method and “sequential start up” method is slower than that of the “simultaneous start up” method.
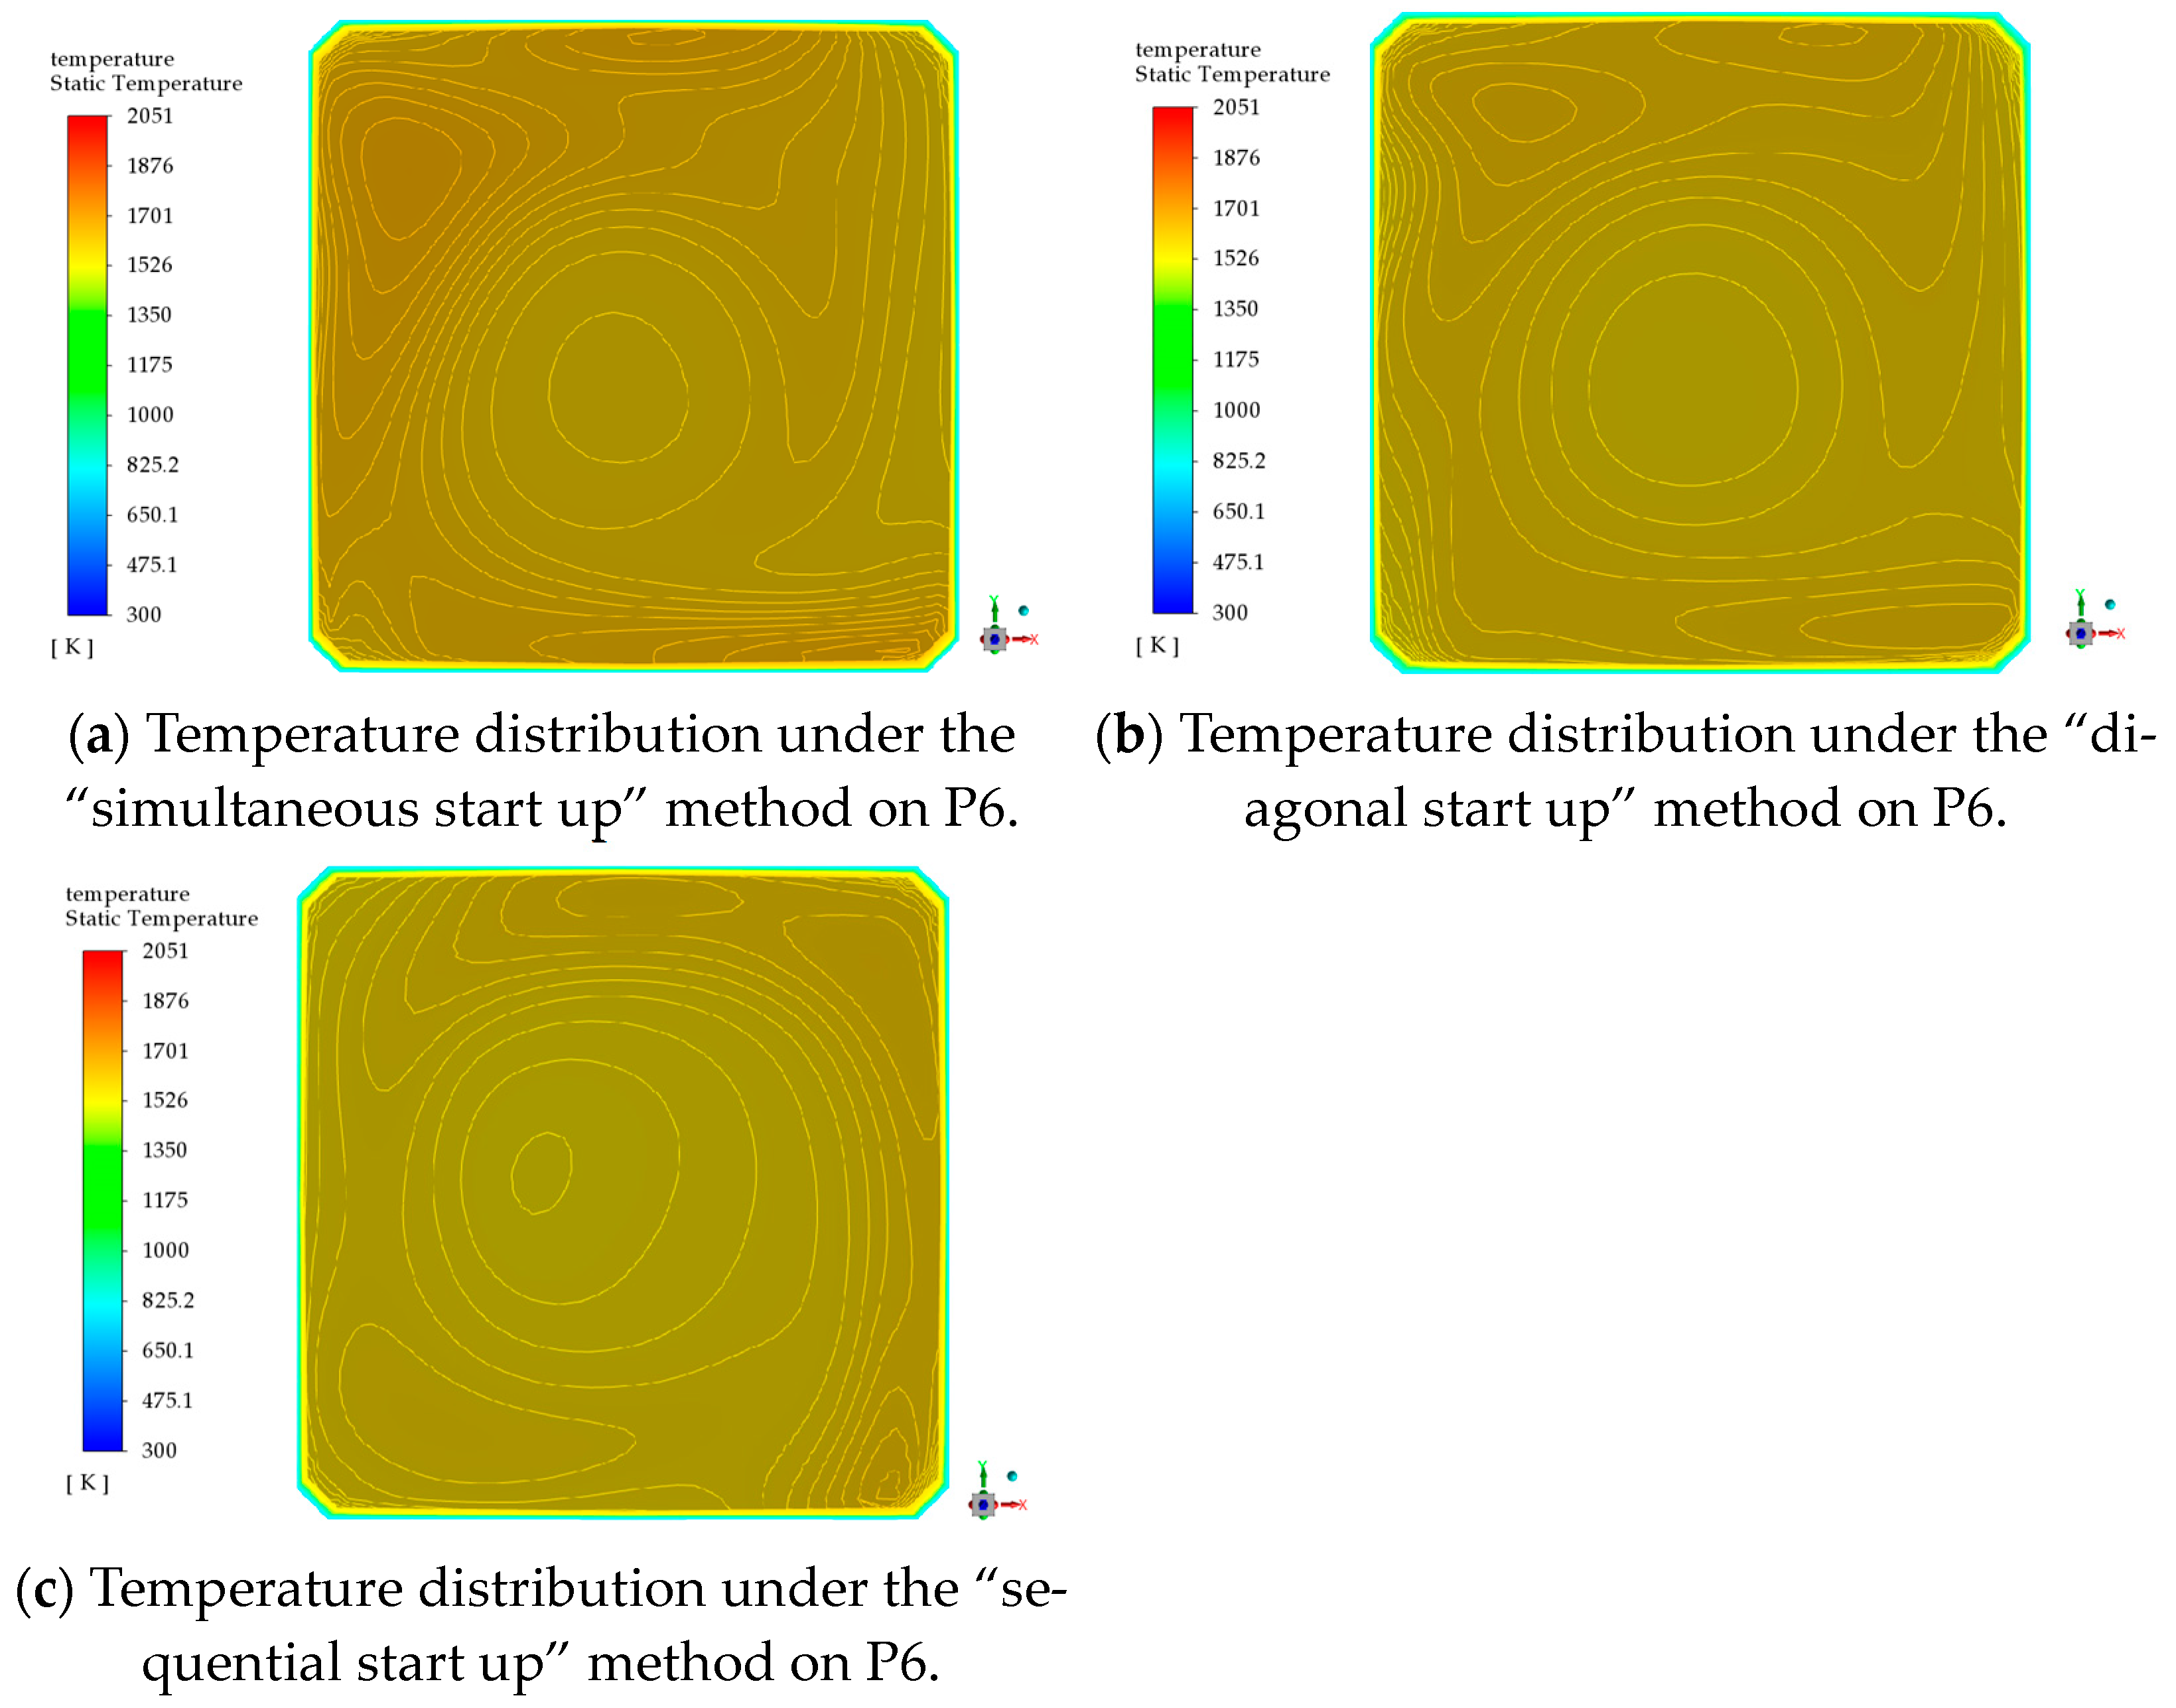
Figure 22 shows the temperature distribution on the horizontal section P4. Figure 23 shows the temperature distribution on the horizontal section P6 of the furnace outlet. The temperature distributions in Figure 22 and Figure 23 correspond to the velocity distributions in Figure 18 and Figure 19. When these findings are considered together, it can be seen that the temperature distribution and the thermal tangent circle simulated under the “diagonal start up” method (as shown in Figure 22b and Figure 23b) and “sequential start up” method (as shown in Figure 22c and Figure 23c) adopt a more “round” shape. Additionally, the position of the actual flue gas tangent circle center is closer to the position of the ideal tangent circle, compared to the temperature distribution and the thermal tangent circle simulated under the “simultaneous start up” method (as shown in Figure 22a and Figure 23a). Qualitatively, this reduces the thermal deviation of the flue gas at the outlet of the furnace in the P6 study cross-section.
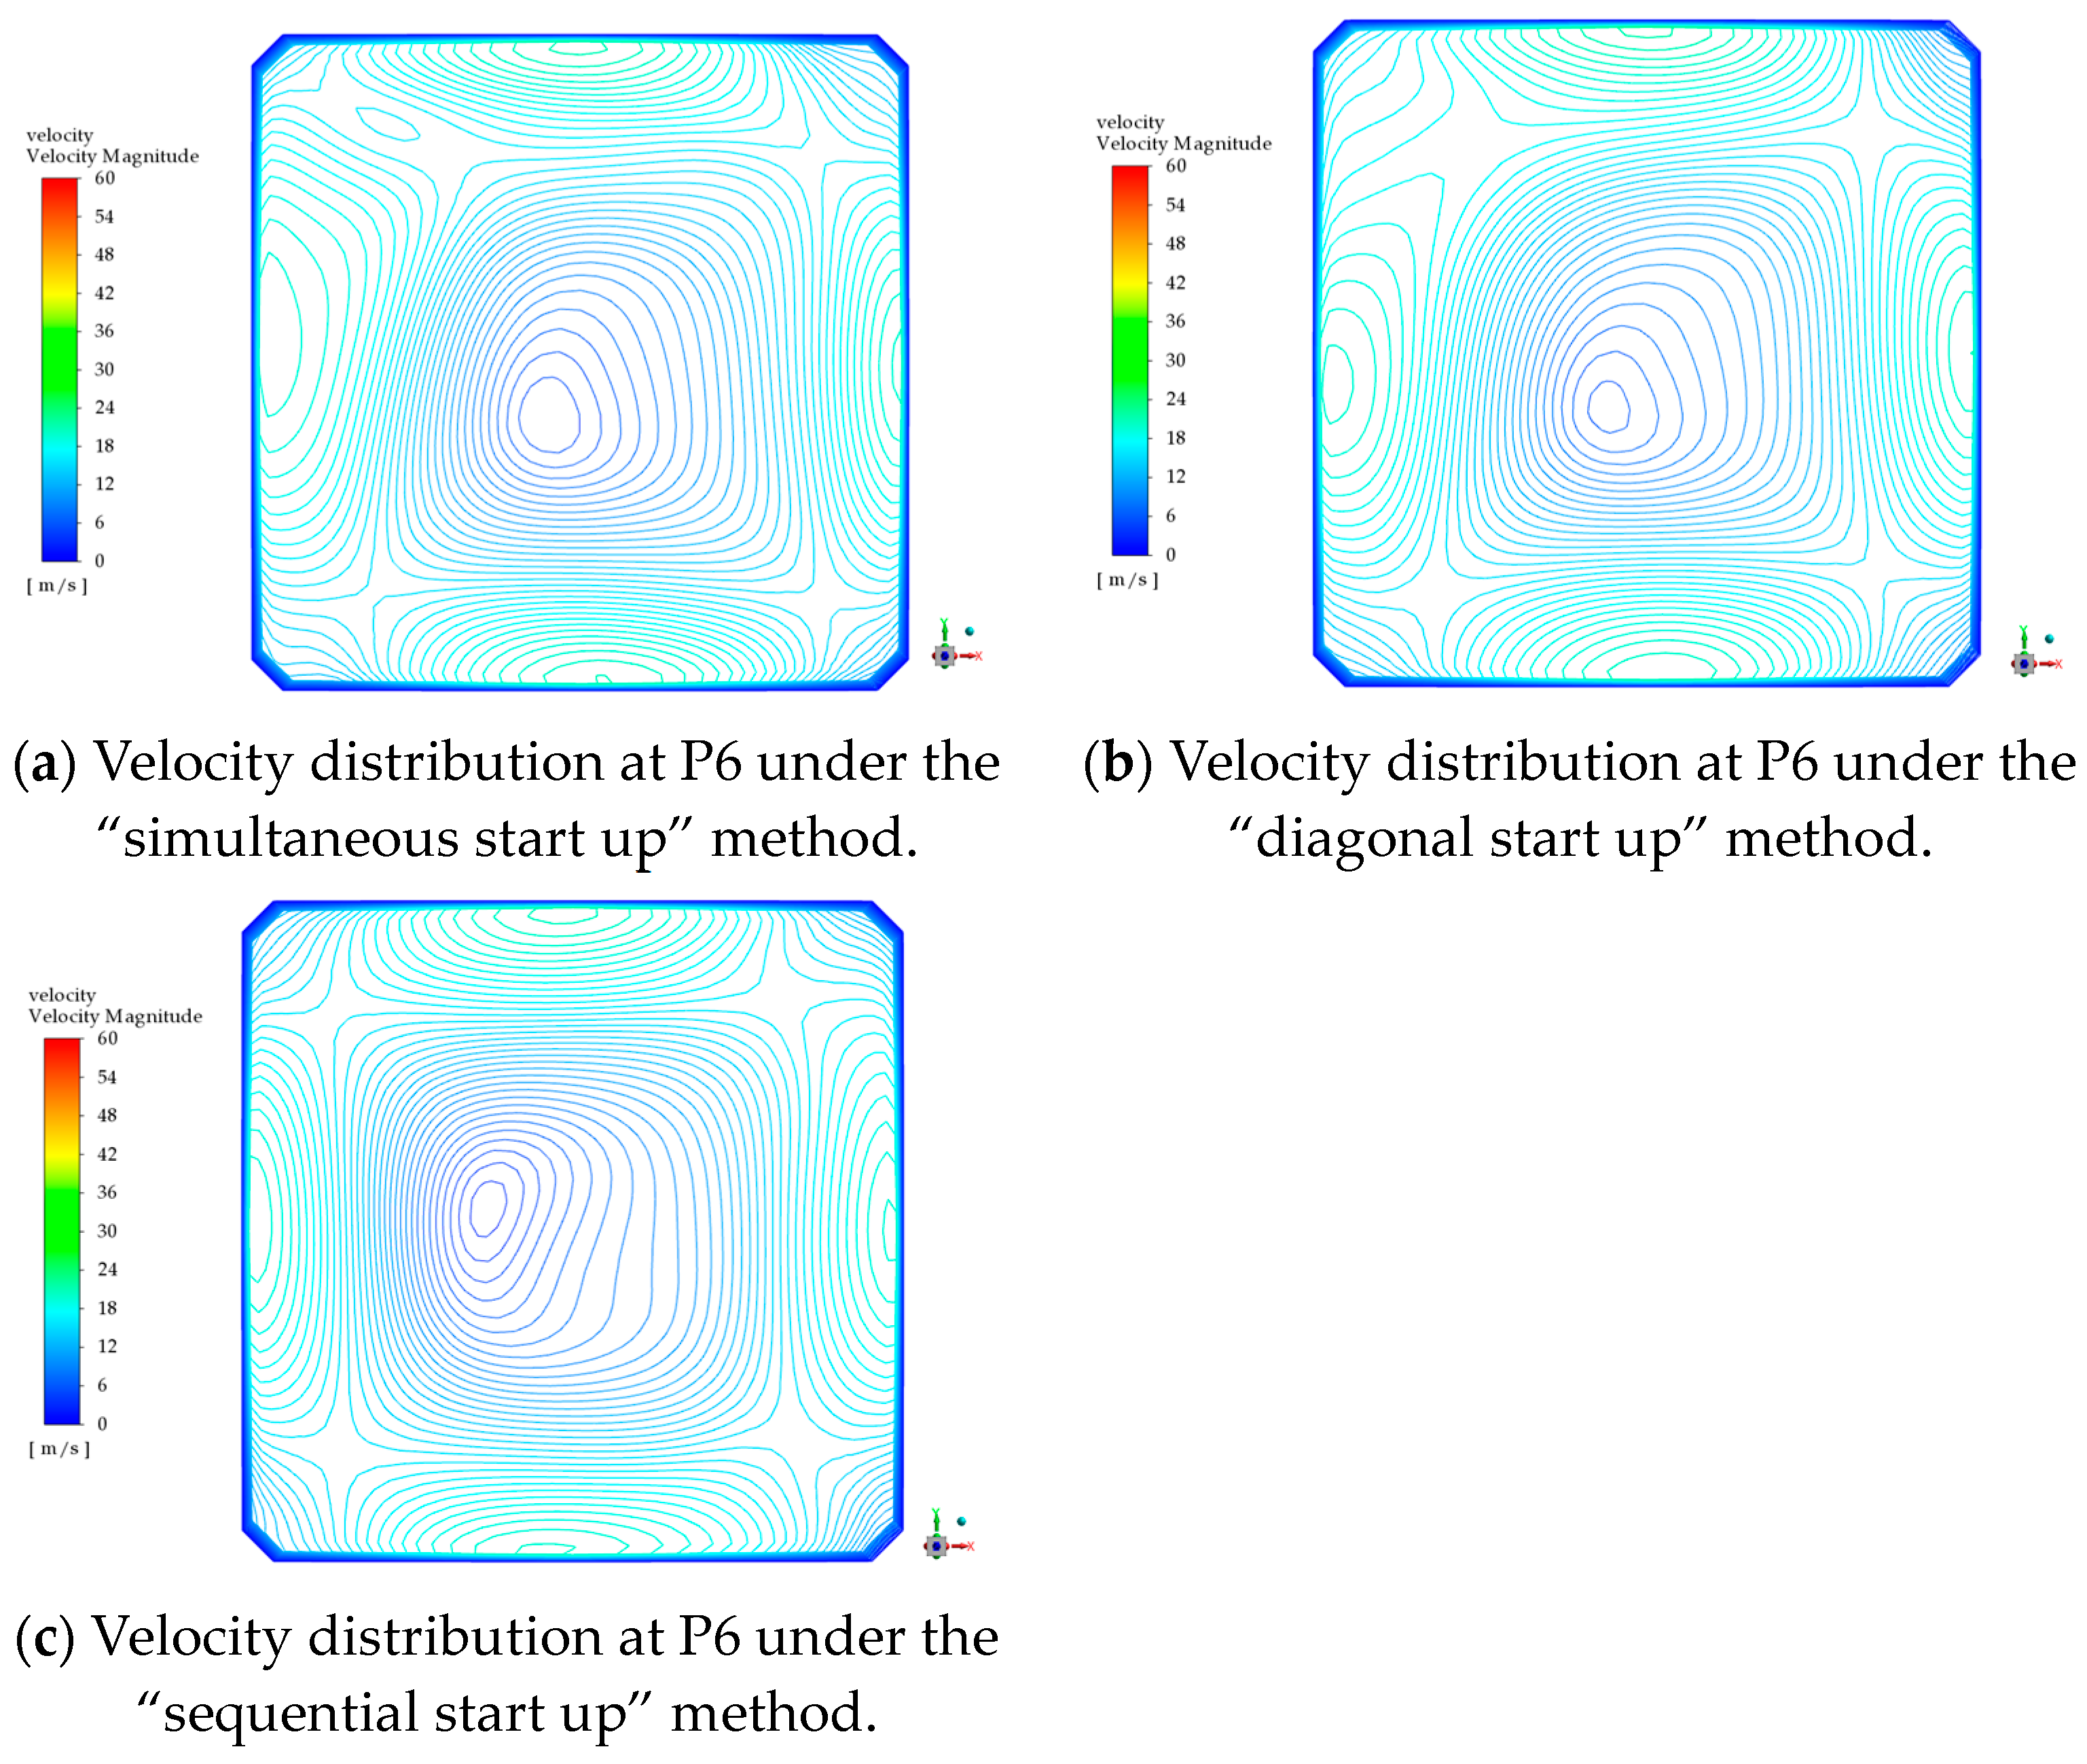
Figure 24 shows the temperature distribution simulated on L2 (as shown in Figure 24a), L3 (as shown in Figure 24b), L4 (as shown in Figure 24c), L5 (as shown in Figure 24d), and L6 (as shown in Figure 24e) under the three start-up methods of the “simultaneous start up” method, “diagonal start up” method, and “sequential start up” method. The temperature distribution under the three start-up methods on L2, L3, and L4 shows different degrees of asymmetry, which corresponds to the distribution law of the velocity distribution curve in Figure 20. On L5, the low temperature zone of the flue gas tangent circle of the furnace gas deviates from the center of the cross-section, and the temperature distribution deviation degree obtained under the “simultaneous start up” method shows the most significant deviation compared to the symmetry of the temperature distribution curves under the “diagonal star-up” method and “sequential start up” method. On L6, at the width direction of the furnace outlet, the variation law of the temperature distribution curve under the three start-up methods is basically the same, the high-temperature region is concentrated on both sides of the vertical center line, the middle is the low-temperature zone, and the peak value of the high-temperature zone on the right side is greater than that on the left, which is also coupled with the velocity distribution curve in Figure 20. Under the conditions of the “diagonal start up” method and “sequential start up” method, the peak value difference between the high-temperature zone on the left and right sides of the monitoring line is smaller, which also indicates that the thermal deviation of the initial flow field obtained by the “sequential start up” method and “diagonal start up” method on the furnace outlet section is smaller than that obtained by the “simultaneous start up” method.

3.3. Quantitative Analysis

This section quantitatively analyzes the effects of the “simultaneous start up” method, “diagonal start up” method, and “sequential start up” method on heat and mass transfer within the boiler furnace, mainly starting from the uneven coefficient of velocity distribution M, deviation coefficient of flue gas mass flow rate Eq, and the gas temperature deviation coefficient ET of the actual flue gas tangent circle of the furnace flue gas.
The uneven coefficient of velocity distribution M on the study sections P2~P6 is shown in Table 5.
It can be seen from Table 5 that the uneven coefficient of velocity distribution M on the study sections P2 and P5 of the main combustion zone is relatively large under the three starting modes. According to the previous analysis, it can be seen that the large coefficient of M on the section P2 was caused by the rapid speed of the burner nozzle at the bottom of the furnace and the violent mixing of the flue gas flow. At this time, the flue gas cutting circle in the furnace has just begun to form, and the flow rigidity of the flue gas cutting circle is small. And the significant coefficient of velocity distribution on the cross-section P5 is due to the sudden injection into SOFA, and the high wind speed and substantial air volume of SOFA air lead to the increase in flow tangential asymmetry.
For the same study section, the uneven coefficient of velocity distribution M obtained by the “sequential start up” method is the lowest, followed by the “diagonal start up” method. The uneven coefficient of velocity distribution M obtained by the “simultaneous start up” method is the largest. The variation law of the uneven coefficient of velocity distribution M in different study sections is the same as that shown in Figure 18, Figure 19 and Figure 20.
The deviation coefficient of the flue gas mass flow rate Eq on the study sections P2~P6 is shown in Table 6.
It can be seen from Table 6 that the deviation coefficient of the flue gas mass flow rate Eq on the study sections is similar to that of M under the three start-up methods. The non-uniform coefficient of mass flow distribution on the sections P2, P3, and P4 in the burner nozzle area is relatively significant, and the Eq value on section P5 decreases when entering the upper SOFA air area. Continuing up, there is no air flow into the furnace chamber in the height section P6 of the furnace outlet, and the influence of upstream SOFA air is weakened, and the tangent symmetry is better, so the Eq is small. This result is consistent with the velocity distribution of the flue gas field in the furnace. For the same study cross-section, the deviation coefficient of flue gas mass flow obtained under the “sequential start up” method is the smallest, followed by the flue gas mass flow deviation coefficient obtained under the “diagonal start up” method, and the deviation coefficient of flue gas mass flow obtained by the “simultaneous startup” method is the largest, which is consistent with the distribution law presented in Figure 18, Figure 19 and Figure 20.
The gas temperature deviation coefficient ET on the study sections P2~P6 is shown in Table 7.
Under three start-up methods, the variation law of the gas temperature deviation coefficient ET on the study section is also similar to the variation law of M. On the sections P2, P3, and P4 of the burner nozzle area, ET is relatively high, and the value of ET decreases when entering the upper SOFA air area, and the flue gas temperature deviation coefficient at the furnace outlet section further decreases. This result is also coupled with the velocity distribution of the flow field in the furnace. Similarly, for the same study section, the gas temperature deviation coefficient ET obtained under the “sequential start up” method is the smallest, followed by the flue gas temperature deviation coefficient obtained under the “diagonal start up” method, and the flue gas temperature deviation coefficient obtained by the “simultaneous start up” method is the largest.
The thermal simulation results also indicate that the “sequential start up” method can reduce the thermal deviation at the furnace outlet from 67 K under the “simultaneous start up” method to 41 K.

4. Conclusions

The results of this paper show that the flow and heat transfer processes in the furnace have the characteristics of a nonlinear dynamic system. The initial value dependence of the nonlinear problem causes the burner in the furnace to produce different initial flow fields under different opening modes, which in turn affects the formation of the initial stable flow field in the furnace. The burner start-up methods directly affect the distribution of the flow field in the furnace. Compared with the stable flow field formed in the furnace under the “simultaneous start up” method, the stable flow field formed under the “diagonal start up” method and “sequential start up” method can obtain a more symmetrical flow field in horizontal section. Since the flow and temperature fields in the furnace are coupled, the velocity and temperature distributions obtained under these two control methods also have more symmetrical flow field in the horizontal section. Consequently, the diagonal and sequential start-up methods effectively reduce the skew of the flow and temperature field distribution in the furnace. The calculation results show the following:
  • Analysis of the horizontal study sections in different height directions of the furnace shows that, across each study section, the velocity and temperature distribution of the actual flue gas tangent circle obtained through the “sequential start up” method is the most symmetrical, followed by the asymmetry of the velocity and temperature distribution obtained by the “diagonal start up” method. The velocity and temperature distribution of the actual flue gas tangent circle obtained by the “simultaneous start up” method exhibit the least symmetry. This indicates that the flue gas in the furnace is more evenly distributed in the “diagonal start up” method;
  • In each study section, when “sequential start up” method is used, both uneven coefficient of velocity distribution M and deviation coefficient of flue gas mass flow rate Eq decrease to varying degrees. From a quantitative point of view, it is proved that compared with the “simultaneous start up” method, the flue gas distribution on the left and right sides of the study section under the “sequential start up” method is more uniform, and the flue gas deflection in the furnace is improved. The flue gas distribution on the left and right sides of the study section under the “diagonal start up” method is more uniform than that under the “simultaneous start up” method, but it is not as good as that of the “sequential start up” method;
  • In each study section, when the “sequential start up” method is used, the gas temperature deviation coefficient ET decreases to varying degrees. This indicates that the “sequential start up” method and the “diagonal start up” method obtained better symmetry in the flue gas temperature field distribution in furnace. The data on the section P6 show that the thermal deviation at the furnace outlet is reduced to some extent by these two start-up methods. At the same time, compared with the “diagonal start up” method, the “sequential start up” method is superior;
  • The thermal simulation results also indicate that the “sequential start up” method can reduce the thermal deviation at the furnace outlet from 67 K under the “simultaneous start up” method to 41 K.

Author Contributions

Conceptualization, M.Y. and W.W.; methodology, M.Y. and W.W.; software, M.Y.; validation, W.W. and M.Y.; formal analysis, W.W. and M.Y.; investigation, W.W.; resources, M.Y.; data curation, W.W.; writing—original draft preparation, W.W.; writing—review and editing, W.W. and M.Y.; visualization, W.W.; supervision, M.Y.; project administration, M.Y.; funding acquisition, M.Y. All authors have read and agreed to the published version of the manuscript.

Funding

This research was funded by the National Natural Science Foundation of China, grant number 51736007, and the APC was funded by 51736007.

Data Availability Statement

The data that support the findings of this study are available from the corresponding author, Mo Yang, upon reasonable request.

Conflicts of Interest

The authors declare no conflicts of interest.

References

  1. Park, H.Y.; Baek, S.H.; Kim, Y.J.; Kim, T.H.; Kang, D.S.; Kim, D.W. Numerical and experimental investigations on the gas temperature deviation in a large scale, advanced low NOx, tangentially fired pulverized coal boiler. Fuel 2013, 104, 641–646. [Google Scholar] [CrossRef]
  2. Yeh, C.; Du, S.; Tsai, C.; Yang, R. Numerical analysis of flow and combustion behavior in tuyere and raceway of blast furnace fueled with pulverized coal and recycled top gas. Energy 2012, 42, 233–240. [Google Scholar] [CrossRef]
  3. Bris, T.L.; Cadavid, F.; Caillat, S.; Pietrzyk, S.; Blondin, J.; Baudoin, B. Coal combustion modelling of large power plant, for NOx abatement. Fuel 2007, 86, 2213–2220. [Google Scholar] [CrossRef]
  4. Jin, W.; Si, F.; Kheirkhah, S.; Yu, C.; Li, H.; Wang, Y. Numerical study on the effects of primary air ratio on ultra-low-load combustion characteristics of a 1050 MW coal-fired boiler considering high-temperature corrosion. Appl. Therm. Eng. 2023, 221, 119811. [Google Scholar] [CrossRef]
  5. Li, Z.; Miao, Z.; Han, B.; Qiao, X. Effects of the number of wall mounted burners on performance of a 660 MW tangentially fired lignite boiler with annularly combined multiple airflows. Energy 2022, 255, 124504. [Google Scholar] [CrossRef]
  6. Purnomo, F.; Setiyawan, A. Numerical Study on In-Furnace Blending Coal Combustion Characteristics in a 625 MW Tangentially Fired Pulverized Coal Boiler. In Proceedings of the International Conference on Mechanical Engineering, London, UK, 3–5 July 2019. [Google Scholar]
  7. Liu, Y.; Fan, W.; Li, Y. Numerical investigation of air-staged combustion emphasizing char gasification and gas temperature deviation in a large-scale, tangentially fired pulverized-coal boiler-ScienceDirect. Appl. Energy 2016, 177, 323–334. [Google Scholar] [CrossRef]
  8. Deng, L.; Dong, L.; Bai, Y.; Wu, Y.; Liu, H.; Belošević, S.; Tomanović, I.; Che, D. Effects of flue gas recirculation on combustion and heat flux distribution in 660MW double-reheat tower-type boiler. Fuel 2022, 321, 123988. [Google Scholar] [CrossRef]
  9. Xu, M.H.; Yuan, J.W.; Ding, S.F.; Cao, H.D. Simulation of the gas temperature deviation in large-scale tangential coal fired utility boilers. Comput. Methods Appl. Mech. Eng. 1998, 155, 369–380. [Google Scholar] [CrossRef]
  10. Yin, C.; Rosendahl, L.; Condra, T.J. Further study of the gas temperature deviation in large-scale tangentially coal-fired boilers. Fuel 2003, 82, 1127–1137. [Google Scholar] [CrossRef]
  11. Liu, Y.; Fan, W.; Wu, M.Z. Experimental and numerical studies on the gas velocity deviation in a 600 MWe tangentially fired boiler. Appl. Therm. Eng. 2017, 110, 553–563. [Google Scholar] [CrossRef]
  12. Tan, P.; Fang, Q.Y.; Zhao, S.N.; Yin, C.E.; Zhang, C.; Zhao, H.B.; Chen, G. Causes and mitigation of gas temperature deviation in tangentially fired tower-type boilers. Appl. Therm. Eng. 2018, 139, 135–143. [Google Scholar] [CrossRef]
  13. Yao, Z.; Liu, J.; Qiu, Z.; Pan, W.; Wu, Z. Numerical investigation of 700 C boiler flue gas thermal deviation based on orthogonal experiment. Fuel 2021, 295, 120510. [Google Scholar] [CrossRef]
  14. Ma, L.; Chen, X.; Liu, J.; Fang, Q.; Zhang, C.; Li, Y.; Mao, R.; Ren, L.; Zhang, P.; Chen, G. Insights into the causes and controlling strategies of gas temperature deviation in a 660 MW tangentially fired tower-type boiler. Appl. Therm. Eng. 2021, 196, 117297. [Google Scholar] [CrossRef]
  15. Xiang, Y.; Zhang, J.; Zhang, X. Cold state test of a four corner tangential combustion boiler based on numerical simulation. Therm. Power Gener. 2012, 41, 14–18. [Google Scholar]
  16. Li, D.; Song, J.; Xu, Q. Numerical simulation of three-dimensional cold flow and wear patterns in a 50 MW biomass circulating fluidized bed boiler. J. Power Eng. 2014, 34, 97-102127. [Google Scholar]
  17. You, C.; Qi, H.; Xu, X. Numerical simulation of cold flow field inside a tangential combustion coal powder boiler using different turbulence models and difference schemes. Power Eng. 2001, 21, 1128–1131. [Google Scholar]
  18. Zhou, Y.; Xu, T.; Hui, S.; Zhang, M. Experimental and numerical study on the flow fields in upper furnace for large scale tangentially fired boilers. Appl. Therm. Eng. 2009, 29, 732–739. [Google Scholar] [CrossRef]
  19. Shao, W.; Pan, W.; Wang, W. Study on numerical calculation of combustion characteristics of tangentially fired coal-fired boilers with different air distribution modes. Environ. Eng. 2017, 35, 73–77. [Google Scholar]
  20. Li, Y.; Zhang, Q.; Gu, F.; Xu, Y.Q. Numerical study on the effect of secondary air reverse cutting on flue gas deviation in large capacity tangential combustion boilers. Chin. J. Electr. Eng. 2001, 21, 33–37. [Google Scholar]
  21. Duan, Y.; Cai, X.; Wu, W. Numerical simulation of changing the air distribution mode for a 980t/h four corner tangential combustion boiler. Power Plant Syst. Eng. 2011, 27, 8–10. [Google Scholar]
  22. Liu, T.; Shen, L.; Yao, B.; Xu, J. Theoretical and experimental research on the effect of swirl number on thermal deviation in furnaces. Therm. Power Eng. 2003, 18, 356–360. [Google Scholar]
  23. Fan, Q. Research on Water Wall Temperature Deviation of Supercritical and Ultra Supercritical Boilers. China Electr. Power 2006, 39, 59–63. [Google Scholar]
  24. Zhao, Z.; Zhang, M. Research and development of coal powder jet reverse stable combustion technology for tangential combustion boilers at four corners. Combust. Sci. Technol. 1997, 3, 88–96. [Google Scholar]
  25. Wu, S.; Bi, Z. Discussion on Four Corner Tangential Combustion Technology for Power Plant Boilers. China Electr. Power 1999, 32, 15–21. [Google Scholar]
  26. Zhou, J.; Song, G.; Chen, Y.; Cao, X.; Liu, J.; Cen, K. Experimental study on the outlet flue gas temperature deviation of a 2008 t/h four corner tangential combustion boiler. J. Eng. Thermophys. 2013, 3, 2162–2165. [Google Scholar]
  27. Li, Z.; Qiao, X.; Miao, Z. Low load performance of tangentially-fired boiler with annularly combined multiple airflows. Energy 2021, 224, 120–131. [Google Scholar] [CrossRef]
  28. Li, Z.; Qiao, X.; Miao, Z. A novel burner arrangement scheme with annularly combined multiple airflows for wall-tangentially fired pulverized coal boiler. Energy 2021, 222, 119912. [Google Scholar] [CrossRef]
  29. Chen, S.; He, B.; He, D.; Cao, Y.; Ding, G.; Liu, X.; Duan, Z.; Zhang, X.; Song, J.; Li, X. Numerical investigations on different tangential arrangements of burners for a 600 MW utility boiler. Energy 2017, 122, 287–300. [Google Scholar] [CrossRef]
  30. Wu, Q.; Liang, X.; Chen, Z.; Ren, J.; Guo, Z. Numerical study on the bifurcation phenomenon of convective heat transfer in a square cavity with oblique inlet. J. Tsinghua Univ. (Nat. Sci. Ed.) 2000, 40, 102–105. [Google Scholar]
  31. Holtzman, G.A.; Hill, R.W.; Ball, K.S. Laminar Natural Convection in Isosceles Triangular Enclosures Heated from Below and Symmetrically Cooled from Above. ASME J. Heat Transf. 2000, 122, 485–491. [Google Scholar] [CrossRef]
  32. Net, M.; Alonso, A.; Sánchez, J. From stationary to complex time-dependent flows at moderate Rayleigh numbers in two-dimensional annular thermal convection. Phys. Fluids 2003, 15, 1314–1326. [Google Scholar] [CrossRef]
  33. Yang, M.; Shen, Y.; Xu, H.; Zhao, M.; Shen, S.; Huang, K. Numerical investigation of the nonlinear flow characteristics in an ultra-supercritical utility boiler furnace. Appl. Therm. Eng. 2015, 88, 237–247. [Google Scholar] [CrossRef]
  34. Shen, C. Numerical Simulation and Nonlinear Study of Flow and Heat Transfer Dynamic Systems. Ph.D. Thesis, University of Shanghai for Science and Technology, Shanghai, China, 2018. [Google Scholar]
  35. Zhang, K.; Yang, M.; Zhang, Y. Two- and three-dimensional numerical simulations of natural convection in a cylindrical envelope with an internal concentric cylinder with slots. Int. J. Heat Mass Transf. 2014, 70, 434–438. [Google Scholar] [CrossRef]
  36. Wang, H.; Yang, M.; Wang, Z.; Lu, J.; Huang, K. Asymmetric Flow Mechanism Analysis of Symmetrical Boiler Furnace. J. Eng. Thermophys. 2013, 3, 2162–2165. [Google Scholar]
  37. Shen, Y.; Yang, M.; Xu, H.T.; Shen, S.-W. Investigation of the Forming Mechanism of Flue Gas Side Heat Deviation and Improvement Measures in the Boiler Furnace with a Symmetrical Structure. J. Eng. Thermophys. 2015, 36, 2178–2182. [Google Scholar]
  38. Constenla, I.; Ferrín, J.L.; Saavedra, L. Numerical study of a 350 MWe tangentially fired pulverized coal furnace of the as Pontes Power Plant. Fuel Process. Technol. 2013, 116, 189–200. [Google Scholar] [CrossRef]
  39. Kuang, M.; Li, Z.; Zhu, Q.; Wang, Y.; Chen, L.; Zhang, Y. Experimental gas/particle flow characteristics of a down-fired 600 MWe supercritical utility boiler at different staged-air ratios. Energy 2012, 42, 411–423. [Google Scholar] [CrossRef]
  40. Hu, Y.; Li, H.; Yan, J. Numerical investigation of heat transfer characteristics in utility boilers of oxy-coal combustion. Appl. Energy 2014, 130, 543–551. [Google Scholar] [CrossRef]
  41. Brazhenko, V.; Qiu, Y.; Mochalin, I.; Zhu, G.; Cai, J.-C.; Wang, D. Study of hydraulic oil filtration process from solid admixtures using rotating perforated cylinder. J. Taiwan Inst. Chem. Eng. 2022, 141, 104578. [Google Scholar] [CrossRef]
  42. Brazhenko, V.; Mochalin, I. Numerical simulation and experimental tests of the filter with a rotating cylindrical perforated filter element. Proc. Inst. Mech. Eng. Part C J. Mech. Eng. Sci. 2021, 235, 2180–2191. [Google Scholar] [CrossRef]
  43. Shen, C.; Yang, M. Effects of nonlinear characteristics on flow and combustion in the core-fired boiler. Numeric. Heat Transf. Part A Appl. 2021, 79, 437–449. [Google Scholar] [CrossRef]
  44. Liu, W.; Yang, M.; Zhang, Y.; Li, Y.; Ying, X.; Huang, W. Improving the asymmetric phenomenon effects on the combustion characteristics in an opposed-fired pulverized coal boiler. Numer. Heat Transf. Part A Appl. 2023, 83, 790–813. [Google Scholar] [CrossRef]
  45. Wang, Q.; Wang, C. Simulation study on the reverse tangential combustion mode of exhaust air in a four corner tangential combustion boiler. J. N. China Univ. Water Resour. Hydropower (Nat. Sci. Ed.) 2015, 36, 79–83. [Google Scholar]
Figure 1. Overall layout of the boiler.
Energies 17 01329 g001
Figure 2. Burner nozzle layout.
Energies 17 01329 g002
Figure 3. Velocity direction of the primary air and the biased secondary air.
Energies 17 01329 g003
Figure 4. Research sections.
Energies 17 01329 g004
Figure 5. Flow distribution on P4 under the “simultaneous start up” method. (The red circle qualitatively indicates the position of the tangent circle).
Energies 17 01329 g005
Figure 6. Flow distribution on P4 under the “diagonal start up” method.
Energies 17 01329 g006
Figure 7. Flow distribution on P4 under the “sequential start up” method in clockwise.
Energies 17 01329 g007aEnergies 17 01329 g007b
Figure 8. Flow distribution on P4 under the “sequential start up” method in counterclockwise.
Energies 17 01329 g008
Figure 9. Meshing.
Figure 9. Meshing.
Energies 17 01329 g009
Figure 10. Temperature at furnace outlet under different grid numbers.
Energies 17 01329 g010
Figure 11. Schematic diagram of nozzle for visual experiment.
Energies 17 01329 g011
Figure 12. Theoretical tangent circles and experimental setup.
Energies 17 01329 g012
Figure 13. Tangent circle under the “simultaneous start up” method. (The orange line represents the tracer ribbon, while the blue line represents the shape and position of the tangent circle).
Energies 17 01329 g013
Figure 14. Tangent circle under the “diagonal start up” method. (The orange line represents the tracer ribbon, while the blue line represents the shape and position of the tangent circle).
Energies 17 01329 g014
Figure 15. Tangent circle under the “sequential start up” method in counterclockwise order. (The orange line represents the tracer ribbon, while the blue line represents the shape and position of the tangent circle).
Energies 17 01329 g015
Figure 16. Tangent circle under the “sequential start up” method in clockwise order. (The orange line represents the tracer ribbon, while the blue line represents the shape and position of the tangent circle).
Energies 17 01329 g016
Figure 17. Velocity distribution under different start-up methods on P1.
Energies 17 01329 g017
Figure 18. Velocity distribution at P4 under different start-up methods.
Energies 17 01329 g018
Figure 19. Velocity distribution at P6 under different start-up methods.
Energies 17 01329 g019
Figure 20. Velocity distribution at L2, L3, L4, L5, and L6 under different start-up methods.
Energies 17 01329 g020
Figure 21. Temperature distribution under different start-up methods on P1.
Energies 17 01329 g021
Figure 22. Temperature distribution under different start-up methods on P4.
Energies 17 01329 g022
Figure 23. Temperature distribution under different start-up methods on P6.
Energies 17 01329 g023
Figure 24. Temperature distribution at L2, L3, L4, L5, and L6 under different start-up methods.
Energies 17 01329 g024
Table 1. Air distribution parameters.
ProjectUnitValue
Total air volumekg/s920.9
Primary air volumekg/s158
Secondary air volumekg/s762.9
Primary air temperature°C75
Secondary air temperature°C334
Table 2. Coal analysis.
Element%
Elemental analysisCar61.45
Har3.61
Oar7.8
Nar0.71
Sar0.43
Industrial analysisMad10
Aar12
Var27
FCar47
Table 3. Details of study sections.
Research SectionLocations (m)Details
P1Y = 0Section along the vertical direction of the furnace
P2Z = 29.2Section of the 4th layer nozzle of the lower coal burner
P3Z = 38.2Section of the 4th layer nozzle of the middle coal burner
P4Z = 47.17Section of the 4th layer nozzle of the upper coal burner
P5Z = 56Section of second layer SOFA air nozzle
P6Z = 71Section of furnace outlet
Table 4. Grid number.
Case 1Case 2Case 3Case 4Case 5Case 6Case 7Case 8
816,2351,053,2571,370,7761,785,6202,312,4833,015,5573,909,4055,080,191
Table 5. Uneven coefficient of velocity distribution M under different start-up methods.
Study SectionSimultaneous Start UpDiagonal Start UpSequential Start Up
P21.5091.4991.365
P31.0571.0111.010
P41.2161.1461.142
P51.3991.3451.344
P61.1741.1731.132
Table 6. Deviation coefficient of flue gas mass flow rate Eq under different start-up methods.
Study SectionSimultaneous Start UpDiagonal Start UpSequential Start Up
P21.7681.7411.402
P31.4811.3361.040
P42.0641.9011.201
P52.1302.0341.597
P62.0682.0111.914
Table 7. Gas temperature deviation coefficient ET under different start-up methods.
Study SectionSimultaneous Start UpDiagonal Start UpSequential Start Up
P21.1891.1241.044
P31.0461.0361.031
P41.0311.0181.011
P51.0381.0231.015
P61.0291.0091.008
Disclaimer/Publisher’s Note: The statements, opinions and data contained in all publications are solely those of the individual author(s) and contributor(s) and not of MDPI and/or the editor(s). MDPI and/or the editor(s) disclaim responsibility for any injury to people or property resulting from any ideas, methods, instructions or products referred to in the content.