
Optimized Design of a H2-Powered Moped for Urban Mobility

 , ,
, ,  ,
,  and
and
Abstract
1. Introduction
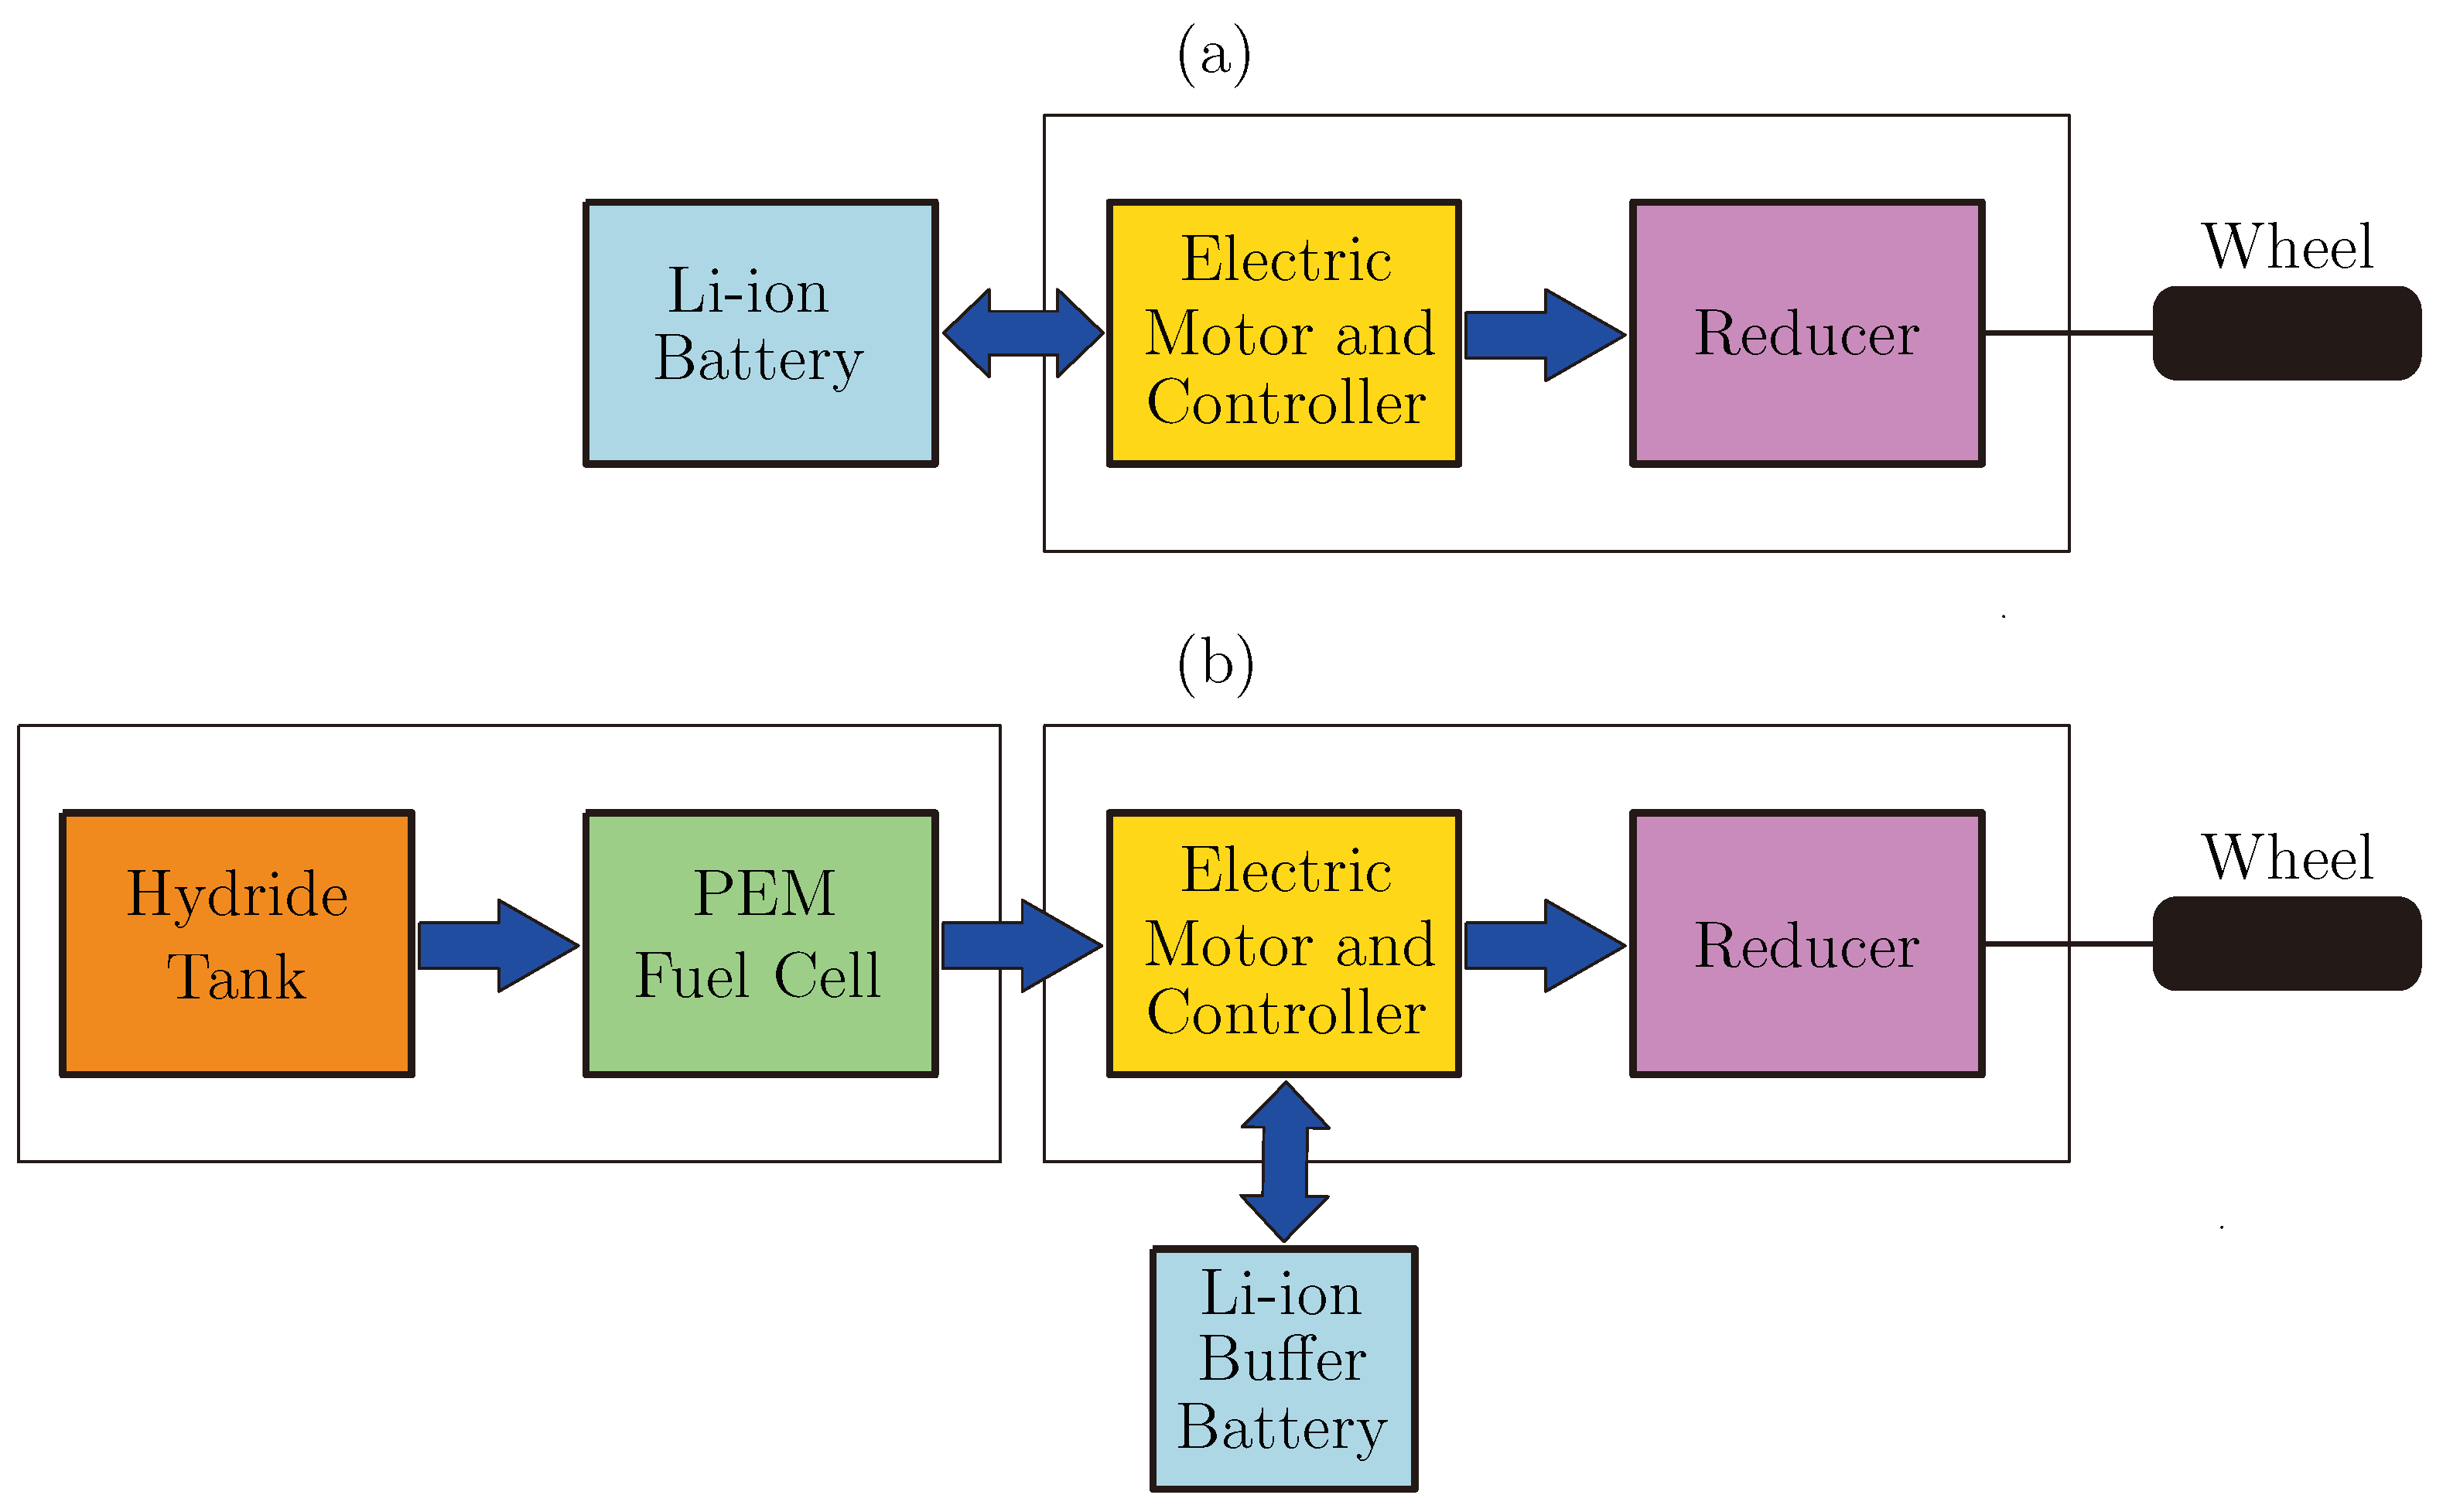
2. System Description
Vehicle Selection and Description
3. Methods
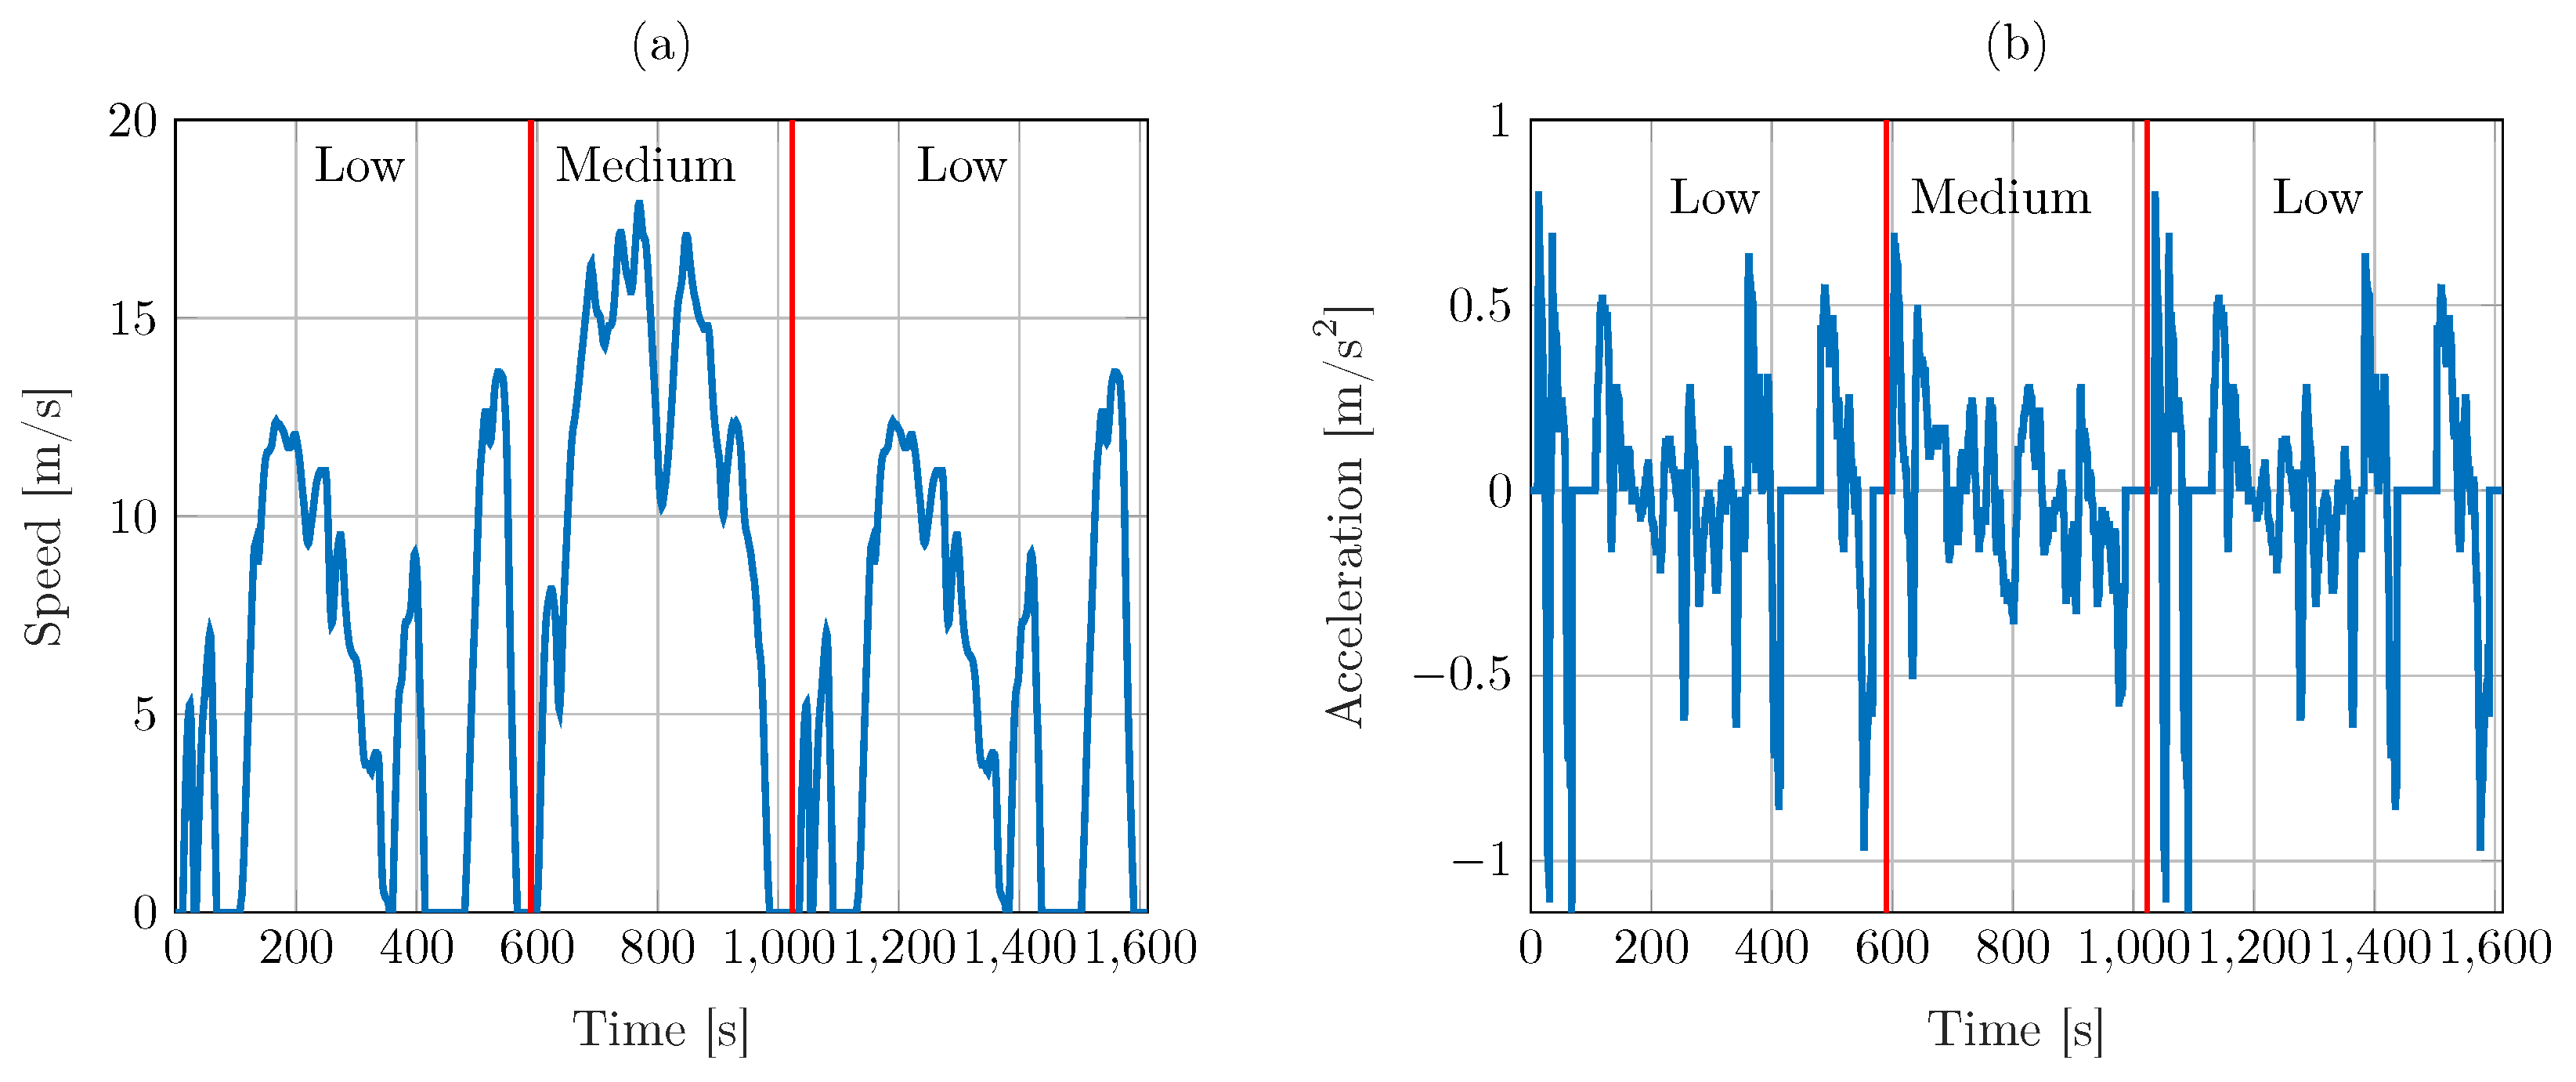
3.1. Driving Cycle
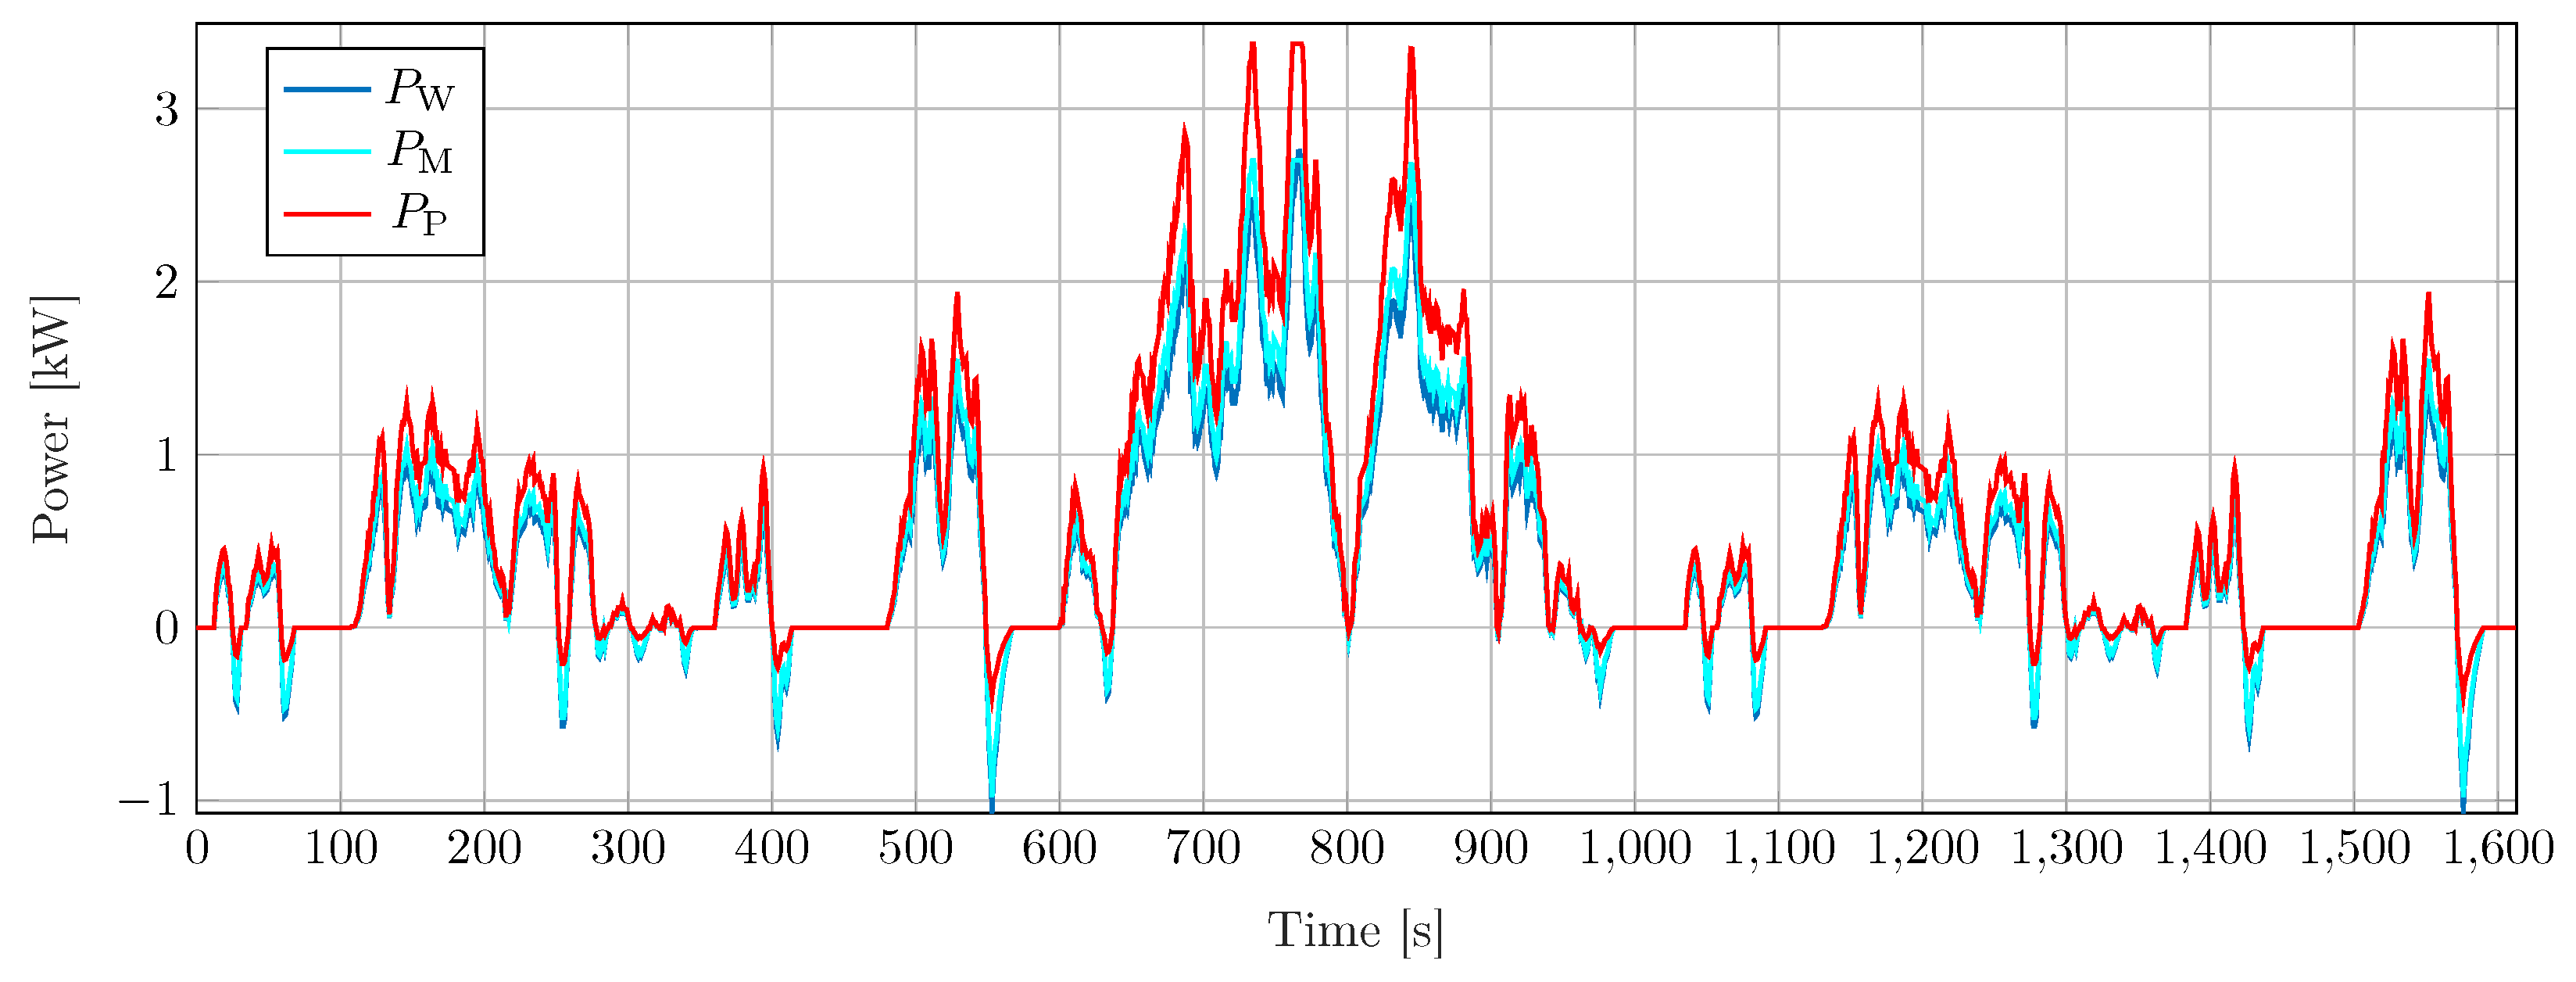
3.2. Vehicle Modeling
3.3. Optimized Control and Design
3.4. Rules-Based Control and Design
3.5. Powertrain Component Modeling and Design
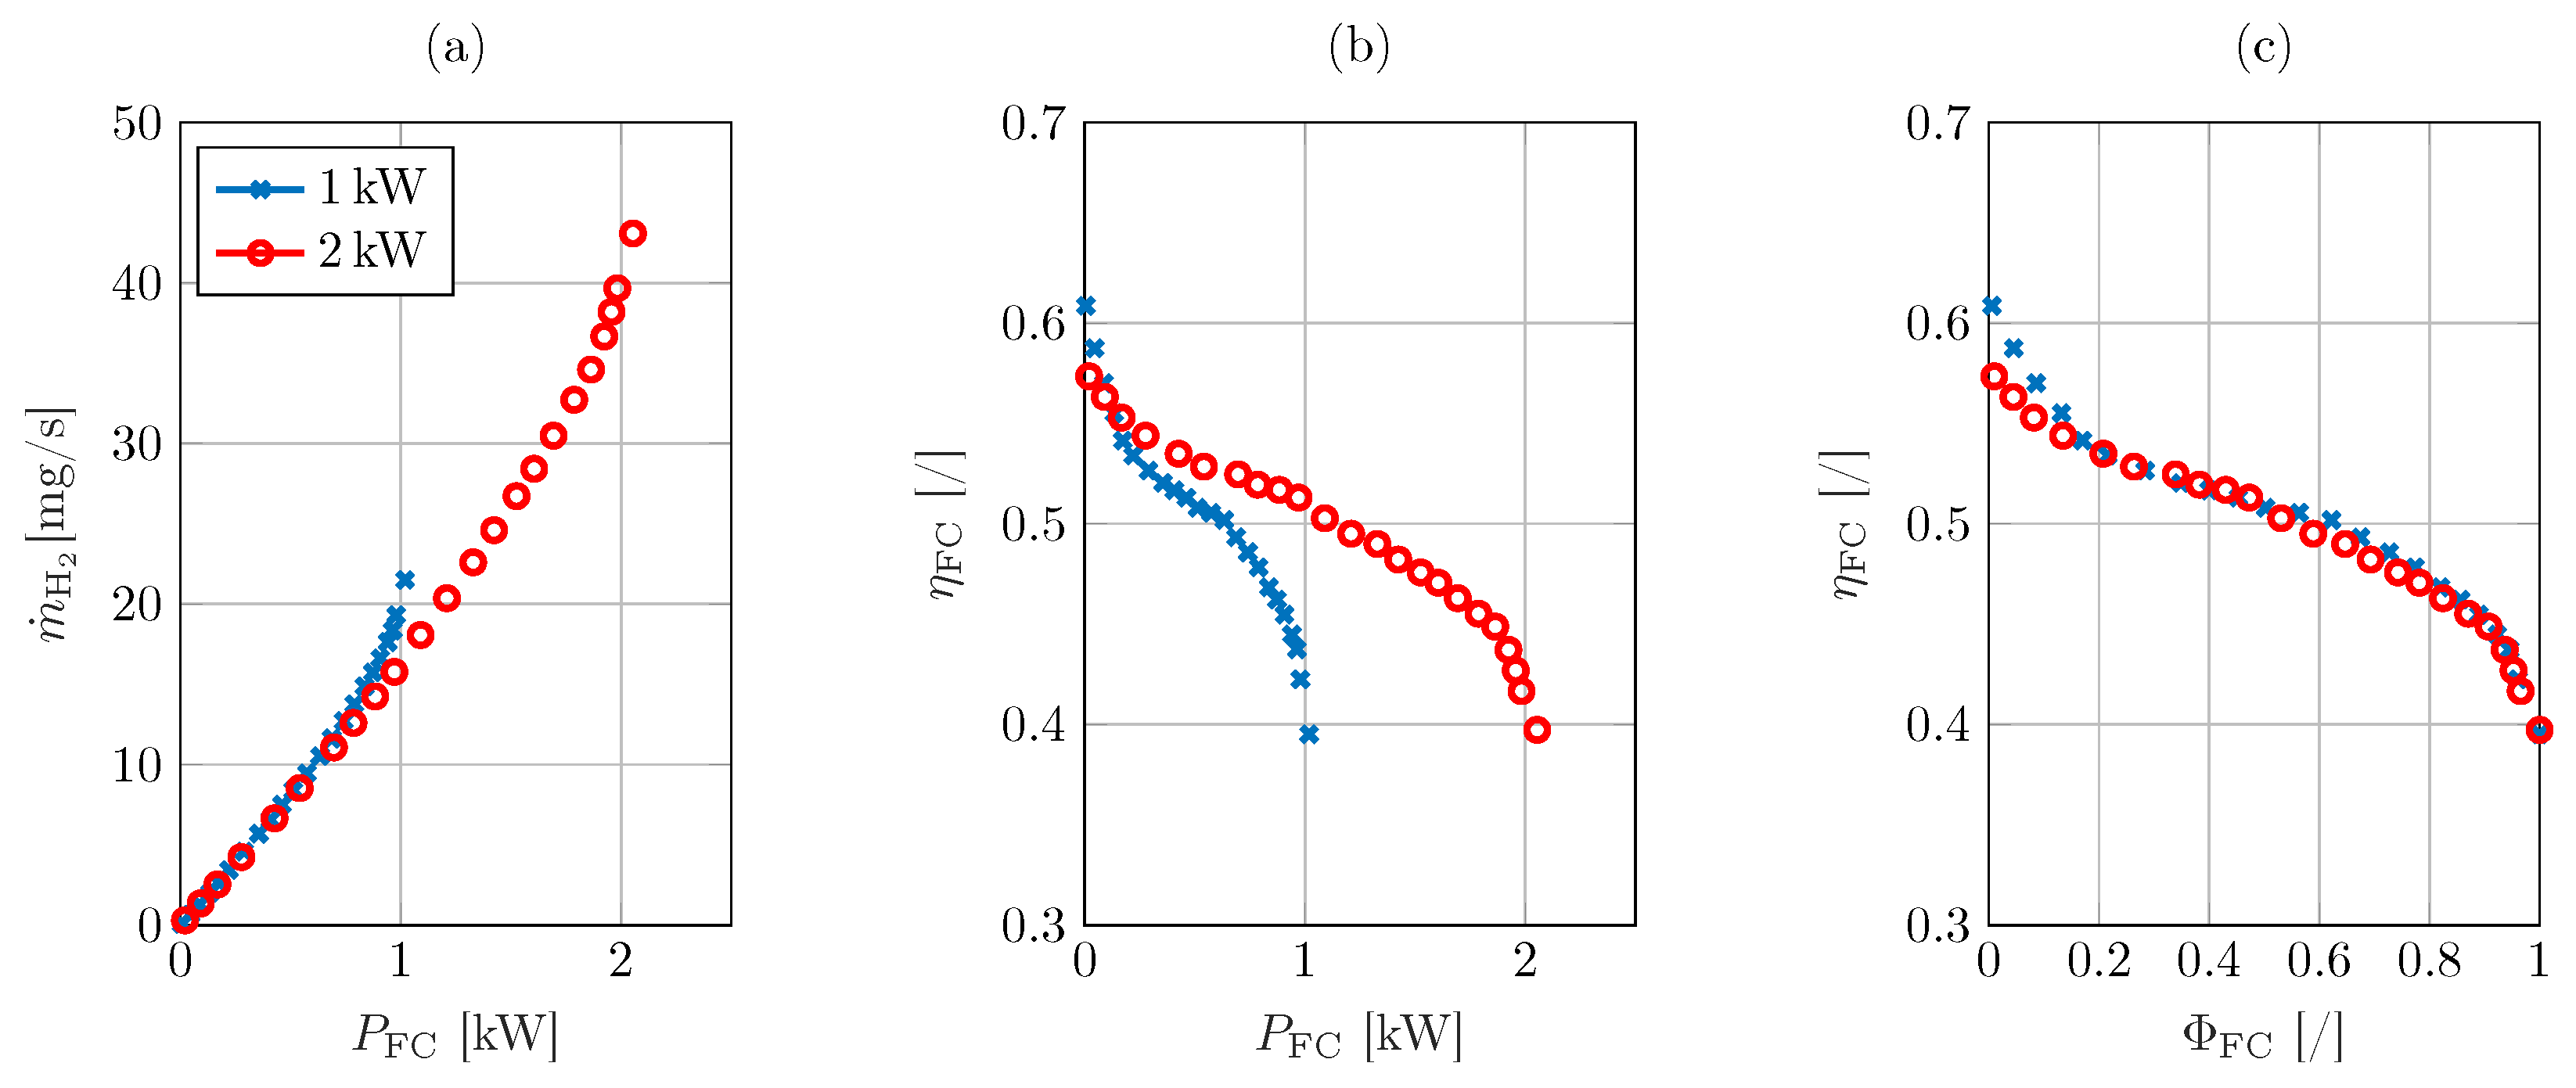
3.5.1. Fuel Cell
3.5.2. Metal Hydrides
3.5.3. Buffer Battery
4. Results and Discussion
Impact on Mobility Systems
5. Conclusions
Author Contributions
Funding
Data Availability Statement
Conflicts of Interest
References
- State of the Union: Commission Raises Climate Ambition and Proposes 55% Cut in Emissions by 2030. Technical Report, European Commission. Available online: https://ec.europa.eu/commission/presscorner/detail/en/IP_20_1599 (accessed on 10 November 2021).
- Committing to Climate-Neutrality by 2050: Commission Proposes European Climate Law and Consults on the European Climate Pact. Technical Report, European Commission. Available online: https://ec.europa.eu/commission/presscorner/detail/en/ip_20_335 (accessed on 10 November 2021).
- A European Strategy for Low-Emission Mobility. Technical Report, European Commission. 2016. Available online: https://ec.europa.eu/clima/eu-action/transport-emissions_en (accessed on 10 November 2021).
- Karaca, A.E.; Dincer, I.; Nitefor, M. Development and analysis of new pneumatic based powering options for transit buses: A comparative assessment. Energy Convers. Manag. 2022, 256, 115399. [Google Scholar] [CrossRef]
- Fuel Types of New Cars: Petrol 52.3%, Diesel 29.9%, Electric 6.8% Market Share First Quarter of 2020. Technical Report, ACEA: Driving Mobility for Europe. 2020. Available online: https://www.acea.auto/fuel-pc/fuel-types-of-new-cars-petrol-52-3-diesel-29-9-electric-6-8-market-share-first-quarter-of-2020/ (accessed on 10 November 2021).
- Pfeifle, S.; Ley, C.; Tauschek, F.; Enderle, P. Fleet Management in Europe: Growing Importance in a World of Changing Mobility. Technical Report, Deloitte. 2016. Available online: https://www2.deloitte.com/content/dam/Deloitte/us/Documents/consumer-business/us-fleet-management-europe.pdf (accessed on 10 November 2021).
- Piraino, F.; Fragiacomo, P. A multi-method control strategy for numerically testing a fuel cell-battery-supercapacitor tramway. Energy Convers. Manag. 2020, 225, 113481. [Google Scholar] [CrossRef]
- Fragiacomo, P.; Piraino, F. Vehicle-to-grid application with hydrogen-based tram. Energy Convers. Manag. 2021, 250, 114915. [Google Scholar] [CrossRef]
- Das, H.S.; Tan, C.W.; Yatim, A. Fuel cell hybrid electric vehicles: A review on power conditioning units and topologies. Renew. Sustain. Energy Rev. 2017, 76, 268–291. [Google Scholar] [CrossRef]
- Kordesch, K.V.; Simader, G.R. Environmental impact of fuel cell technology. Chem. Rev. 1995, 95, 191–207. [Google Scholar] [CrossRef]
- Depcik, C.; Cassady, T.; Collicott, B.; Burugupally, S.P.; Li, X.; Alam, S.S.; Arandia, J.R.; Hobeck, J. Comparison of lithium ion Batteries, hydrogen fueled combustion Engines, and a hydrogen fuel cell in powering a small Unmanned Aerial Vehicle. Energy Convers. Manag. 2020, 207, 112514. [Google Scholar] [CrossRef]
- Oeschger, G.; Carroll, P.; Caulfield, B. Micromobility and public transport integration: The current state of knowledge. Transp. Res. Part D Transp. Environ. 2020, 89, 102628. [Google Scholar] [CrossRef]
- Korzilius, O.; Borsboom, O.; Hofman, T.; Salazar, M. Optimal Design of Electric Micromobility Vehicles. arXiv 2021, arXiv:2104.10155. [Google Scholar]
- Silva, C. At what extent the benefits of introducing alternative light-duty vehicles offset those of increasing the buses average occupancy? Energy Convers. Manag. 2013, 70, 211–219. [Google Scholar] [CrossRef]
- Ewert, A.; Brost, M.; Eisenmann, C.; Stieler, S. Small and Light Electric Vehicles: An Analysis of Feasible Transport Impacts and Opportunities for Improved Urban Land Use. Sustainability 2020, 12, 8098. [Google Scholar] [CrossRef]
- Liao, F.; Correia, G. Electric carsharing and micromobility: A literature review on their usage pattern, demand, and potential impacts. Int. J. Sustain. Transp. 2022, 16, 269–286. [Google Scholar] [CrossRef]
- Hyvönen, K.; Repo, P.; Lammi, M. Light electric vehicles: Substitution and future uses. Transp. Res. Procedia 2016, 19, 258–268. [Google Scholar] [CrossRef]
- Schelte, N.; Severengiz, S.; Schünemann, J.; Finke, S.; Bauer, O.; Metzen, M. Life Cycle Assessment on Electric Moped Scooter Sharing. Sustainability 2021, 13, 8297. [Google Scholar] [CrossRef]
- Parliament, T.E.; The Council of the European Union. Directive 2007/46/EC of the European Parliament and of the Council of 5 September 2007 Establishing a Framework for the Approval of Motor Vehicles and Their Trailers, and of Systems, Components and Separate Technical Units Intended for Such Vehicles. Technical Report. 2007. Available online: https://eur-lex.europa.eu/legal-content/EN/TXT/PDF/?uri=CELEX:32007L0046&from=EN (accessed on 10 November 2021).
- Howe, E.; Jakobsen, F.J. Unu Global Scooter Sharing Market Report 2019. Technical Report, Unu. 2019. Available online: https://static1.squarespace.com/static/5f48eae7d382da597c212fc3/t/6026481f42e05472548f0cb8/1613121704120/Global+Scooter+Sharing+Market+Report+2019 (accessed on 5 March 2023).
- Howe, E.; Jakobsen, F.J. Unu Global Scooter Sharing Market Report 2020.Technical Report, Unu. 2020. Available online: https://static1.squarespace.com/static/5f48eae7d382da597c212fc3/t/60a767398fd43071e64f18f5/1621583686255/Global+Moped+Sharing+Market+Report+2020 (accessed on 5 March 2023).
- Fletcher, T.; Ebrahimi, K. The effect of fuel cell and battery size on efficiency and cell lifetime for an L7e fuel cell hybrid vehicle. Energies 2020, 13, 5889. [Google Scholar] [CrossRef]
- Zhai, C.; Luo, F.; Liu, Y. Cooperative power split optimization for a group of intelligent electric vehicles travelling on a highway with varying slopes. IEEE Trans. Intell. Transp. Syst. 2020, 23, 4993–5005. [Google Scholar] [CrossRef]
- Lombardi, S.; Villani, M.; Chiappini, D.; Tribioli, L. Cooling System Energy Consumption Reduction through a Novel All-Electric Powertrain Traction Module and Control Optimization. Energies 2021, 14, 33. [Google Scholar] [CrossRef]
- Sorrentino, M.; Cirillo, V.; Nappi, L. Development of flexible procedures for co-optimizing design and control of fuel cell hybrid vehicles. Energy Convers. Manag. 2019, 185, 537–551. [Google Scholar] [CrossRef]
- Ahmadi, S.; Bathaee, S.; Hosseinpour, A.H. Improving fuel economy and performance of a fuel-cell hybrid electric vehicle (fuel-cell, battery, and ultra-capacitor) using optimized energy management strategy. Energy Convers. Manag. 2018, 160, 74–84. [Google Scholar] [CrossRef]
- Hu, Z.; Li, J.; Xu, L.; Song, Z.; Fang, C.; Ouyang, M.; Dou, G.; Kou, G. Multi-objective energy management optimization and parameter sizing for proton exchange membrane hybrid fuel cell vehicles. Energy Convers. Manag. 2016, 129, 108–121. [Google Scholar] [CrossRef]
- Paladini, V.; Donateo, T.; De Risi, A.; Laforgia, D. Super-capacitors fuel-cell hybrid electric vehicle optimization and control strategy development. Energy Convers. Manag. 2007, 48, 3001–3008. [Google Scholar] [CrossRef]
- Facci, A.L.; Andreassi, L.; Ubertini, S. Optimization of CHCP (combined heat power and cooling) systems operation strategy using dynamic programming. Energy 2014, 66, 387–400. [Google Scholar] [CrossRef]
- Facci, A.L.; Andreassi, L.; Martini, F.; Ubertini, S. Comparing Energy and Cost Optimization in Distributed Energy Systems Management. J. Energy Resour. Technol. 2014, 136, 032001. [Google Scholar] [CrossRef]
- Hawkes, A.; Leach, M. Cost-effective operating strategy for residential micro-combined heat and power. Energy 2007, 32, 711–723. [Google Scholar] [CrossRef]
- Fabrizio, E.; Filippi, M.; Virgone, J. An hourly modelling framework for the assessment of energy sources exploitation and energy converters selection and sizing in buildings. Energy Build. 2009, 41, 1037–1050. [Google Scholar] [CrossRef]
- Chiappini, D.; Facci, A.L.; Tribioli, L.; Ubertini, S. SOFC management in distributed energy systems. J. Fuel Cell Sci. Technol. 2011, 8, 031015. [Google Scholar] [CrossRef]
- Tribioli, L.; Cozzolino, R.; Evangelisti, L.; Bella, G. Energy Management of an Off-Grid Hybrid Power Plant with Multiple Energy Storage Systems. Energies 2016, 9, 661. [Google Scholar] [CrossRef]
- Bartolucci, L.; Cordiner, S.; Mulone, V.; Santarelli, M.; Lombardi, P.; Wenge, C.; Arendarski, B.; Komarnicki, P. Grid service potential from optimal sizing and scheduling the charging hub of a commercial Electric Vehicle fleet. In Proceedings of the 2020 IEEE International Conference on Environment and Electrical Engineering and 2020 IEEE Industrial and Commercial Power Systems Europe (EEEIC/I&CPS Europe), Madrid, Spain, 9–12 June 2020; pp. 1–6. [Google Scholar]
- Alparone, M.; Minutillo, M.; Migliaccio, M.; Jannelli, E.; Massarotti, N. Hydrogen-based hybrid power unit for light vehicles: Assessment of energy performance and radiated electromagnetic emissions. Nuovo C. 2018, 41, 1–8. [Google Scholar]
- Buono, A.; Di Trolio, P.; Minutillo, M.; Migliaccio, M.; Jannelli, E.; Massarotti, N.; Conventi, F.; Di Donato, C.; Nunziata, F.; Vanoli, L.; et al. Hydrogen-Bike Equipped with Hybrid Power Unit: Energy Performance Analysis and Electromagnetic Emissions Test. In Proceedings of the EFC2019 European Fuel Cell Technology & Applications Conference—Piero Lunghi Conference, Naples, Italy, 9–11 December 2019. [Google Scholar]
- Di Giorgio, P.; Di Trolio, P.; Jannelli, E.; Minutillo, M.; Conte, F.V. Model based preliminary design and optimization of Internal Combustion Engine and Fuel Cell hybrid electric vehicle. Energy Procedia 2018, 148, 1191–1198. [Google Scholar] [CrossRef]
- Shmaryahu, A.; Amar, N.; Ivanov, A.; Aharon, I. Sizing Procedure for System Hybridization Based on Experimental Source Modeling for Electric Vehicles. Energies 2021, 14, 5275. [Google Scholar] [CrossRef]
- Di Ilio, G.; Di Giorgio, P.; Tribioli, L.; Bella, G.; Jannelli, E. Preliminary design of a fuel cell/battery hybrid powertrain for a heavy-duty yard truck for port logistics. Energy Convers. Manag. 2021, 243, 114423. [Google Scholar] [CrossRef]
- Suzuki. Met Police Trials Hydrogen Fuel Cell Burgman. Available online: https://bikes.suzuki.co.uk/news/suzuki-hydrogen-fuel-cell-burgman-trialled-by-met-police/ (accessed on 10 November 2021).
- Atena. The Hydrogen-Powered Electric Scooter. Available online: https://www.atenaweb.com/en/hyscooter/ (accessed on 10 November 2021).
- Facci, A.L.; Andreassi, L.; Ubertini, S.; Sciubba, E. Analysis of the influence of thermal energy storage on the optimal management of a trigeneration plant. Energy Procedia 2014, 45, 1295–1304. [Google Scholar] [CrossRef]
- Facci, A.L.; Ubertini, S. Meta-heuristic optimization for a high-detail smart management of complex energy systems. Energy Convers. Manag. 2018, 160, 341–353. [Google Scholar] [CrossRef]
- Loreti, G.; Facci, A.L.; Baffo, I.; Ubertini, S. Combined heat, cooling, and power systems based on half effect absorption chillers and polymer electrolyte membrane fuel cells. Appl. Energy 2019, 235, 747–760. [Google Scholar] [CrossRef]
- Uzunoglu, M.; Alam, M. Dynamic modeling, design and simulation of a PEM fuel cell/ultra-capacitor hybrid system for vehicular applications. Energy Convers. Manag. 2007, 48, 1544–1553. [Google Scholar] [CrossRef]
- Mekhilef, S.; Saidur, R.; Safari, A. Comparative study of different fuel cell technologies. Renew. Sustain. Energy Rev. 2012, 16, 981–989. [Google Scholar] [CrossRef]
- Askoll. Electric and Even More Energetic. Askol eS3. Available online: https://www.askollelectric.com/site/en/consumer-escooter-es3/ (accessed on 10 November 2021).
- Quotidiano Motori. Scooter Elettrici più Venduti in Italia: I Migliori 5. Available online: https://www.quotidianomotori.com/moto/scooter/scooter-elettrici-piu-venduti/2/ (accessed on 10 November 2021).
- Vaielettrico. Scooter Elettrici, Listino Facile: Oltre 90 Modelli. Available online: https://www.vaielettrico.it/moto-e-scooter-elettrici-il-listino-facile/ (accessed on 10 November 2021).
- Askoll. Electric Scooter: User Manual. Technical Report, Askoll EVA Spa. 2016. Available online: https://www.askollelectric.com/download/en/askoll_libretto_uso_manutenzione_scooter.pdf (accessed on 10 November 2021).
- Askoll. Battery for e-e-Scooter 1.410 Wh. Available online: https://shop.askollelectric.com/en/products/Battery-for-e-scooter-1410-Wh (accessed on 10 November 2021).
- Tutuianu, M.; Bonnel, P.; Ciuffo, B.; Haniu, T.; Ichikawa, N.; Marotta, A.; Pavlovic, J.; Steven, H. Development of the World-wide harmonized Light duty Test Cycle (WLTC) and a possible pathway for its introduction in the European legislation. Transp. Res. Part D Transp. Environ. 2015, 40, 61–75. [Google Scholar] [CrossRef]
- Walpole, S.C.; Prieto-Merino, D.; Edwards, P.; Cleland, J.; Stevens, G.; Roberts, I. The weight of nations: An estimation of adult human biomass. BMC Public Health 2012, 12, 1–6. [Google Scholar] [CrossRef]
- McConville, J.T.; Clauser, C.E.; Churchill, T.D.; Cuzzi, J.; Kaleps, I. Anthropometric Relationships of Body and Body Segment Moments of Inertia; Technical Report; Anthropology Research Project INC: Yellow Springs, OH, USA, 1980. [Google Scholar]
- CGM. 508A BERLINO MONO. Available online: https://cgmitalia.net/product/berlino/ (accessed on 10 November 2021).
- Tseng, C.Y.; Lue, Y.F.; Lin, Y.T.; Siao, J.C.; Tsai, C.H.; Fu, L.M. Dynamic simulation model for hybrid electric scooters. In Proceedings of the 2009 IEEE International Symposium on Industrial Electronics, Seoul, Republic of Korea, 5–8 July 2009; pp. 1464–1469. [Google Scholar]
- Khateeb, S.A.; Farid, M.M.; Selman, J.R.; Al-Hallaj, S. Mechanical–electrochemical modeling of Li-ion battery designed for an electric scooter. J. Power Sources 2006, 158, 673–678. [Google Scholar] [CrossRef]
- Onori, S.; Tribioli, L. Adaptive Pontryagin’s Minimum Principle supervisory controller design for the plug-in hybrid GM Chevrolet Volt. Appl. Energy 2015, 147, 224–234. [Google Scholar] [CrossRef]
- h2planet. Stack H 1000: The Ready to Use Fuel-Cell Stack! Technical Report. Available online: https://www.h2planet.eu/grk_files/catalogo/prodotti/brochure/Stack/Brochure_H-1000_EN.pdf (accessed on 10 November 2021).
- h2planet. Stack H 2000: The Ready to Use Fuel-Cell Stack! Technical Report. Available online: https://www.h2planet.eu/grk_files/catalogo/prodotti/brochure/Stack/Brochure_H-2000_EN.pdf (accessed on 10 November 2021).
- FuelCellStore. 1 kW Hydrogen Fuel Cell Power Generator. Available online: https://www.fuelcellstore.com/fuel-cell-stacks/high-power-fuel-cell-stacks/g-hfcs-1kw36v-1000w-hydrogen-fuel-cell-power-generator (accessed on 10 November 2021).
- FuelCellStore. 2 kW Hydrogen Fuel Cell Power Generator. Available online: https://www.fuelcellstore.com/fuel-cell-stacks/high-power-fuel-cell-stacks/g-hfcs-2kw25v-1kw-hydrogen-fuel-cell-power-generator (accessed on 10 November 2021).
- h2planet. MyH2®-Hydrogen Stored Simple: H2 Smart Metal Hydrides Storage System. Technical Report. Available online: https://www.h2planet.eu/grk_files/catalogo/prodotti/brochure/MyH2/Brochure_MyH2_ENG.pdf (accessed on 10 November 2021).
- Facci, A.L.; Lauricella, M.; Succi, S.; Villani, V.; Falcucci, G. Optimized Modeling and Design of a PCM-Enhanced H2 Storage. Energies 2021, 14, 1554. [Google Scholar] [CrossRef]
- Hollandbikeshop.com. E-Motion E-Bike Battery Shop the Largest and Most Affordable! Available online: https://hollandbikeshop.com/en-gb/bicycle-parts-electric-bicycle/e-motion-electric-bicycle-parts/e-motion-e-bike-battery-parts/e-motion-e-bike-battery (accessed on 10 November 2021).
- Zhang, Y.; Zhang, C.; Fan, R.; Huang, S.; Yang, Y.; Xu, Q. Twin delayed deep deterministic policy gradient-based deep reinforcement learning for energy management of fuel cell vehicle integrating durability information of powertrain. Energy Convers. Manag. 2022, 274, 116454. [Google Scholar] [CrossRef]
- Dirkes, S.; Leidig, J.; Fisch, P.; Pischinger, S. Prescriptive Lifetime Management for PEM fuel cell systems in transportation applications, Part I: State of the art and conceptual design. Energy Convers. Manag. 2023, 277, 116598. [Google Scholar] [CrossRef]
- Hollandbikeshop.com. E-Motion E-Bike Battery Li-ion 24S/10Ah - Black. Available online: https://hollandbikeshop.com/en-gb/bicycle-parts-electric-bicycle/e-motion-electric-bicycle-parts/e-motion-e-bike-battery-parts/e-motion-e-bike-battery/e-motion-e-bike-battery-li-ion-24s-10ah-black/ (accessed on 10 November 2021).
- h2planet. MyH2® SLIM 350-Slim Hydrogen Storage: H2 Slim and Smart Metal Hydrides Storage System. Technical Report. Available online: https://www.h2planet.eu/grk_files/catalogo/prodotti/brochure/MyH2/Brochure_MyH2_SLIM350_ENG.pdf (accessed on 10 November 2021).
- h2planet. Carbon Fiber Cylinder-X-Fiber S. Available online: https://www.h2planet.eu/en/products/professional/Hydrogenstorage/cilindri_in_fibra_di_carbonio/ (accessed on 10 November 2021).
- h2planet. X-Fiber S9. Available online: https://www.h2planet.eu/en/detail/xfiber_s9 (accessed on 10 November 2021).
- h2planet. X-Fiber S6.8. Available online: https://www.h2planet.eu/en/detail/xfiber_s68 (accessed on 10 November 2021).
- Commision, E. Photovoltaic Geographical Information System. Available online: https://re.jrc.ec.europa.eu/pvg_tools/it/#PVP (accessed on 10 November 2021).
- Crawley, D.B.; Lawrie, L.K.; Winkelmann, F.C.; Buhl, W.F.; Huang, Y.J.; Pedersen, C.O.; Strand, R.K.; Liesen, R.J.; Fisher, D.E.; Witte, M.J.; et al. EnergyPlus: Creating a new-generation building energy simulation program. Energy Build. 2001, 33, 319–331. [Google Scholar] [CrossRef]
- EnergyPlus. Available online: https://energyplus.net/ (accessed on 10 November 2021).
- Rosati, A.; Facci, A.L.; Ubertini, S. Techno-economic analysis of battery electricity storage towards self-sufficient buildings. Energy Convers. Manag. 2022, 256, 115313. [Google Scholar] [CrossRef]
- Laustsen, J. Energy Efficiency Requirements in Building Codes, Energy Efficiency Policies for New Buildings. IEA Information Paper. 2008. Available online: https://www.iea.org/reports/energy-efficiency-requirements-in-building-codes-policies-for-new-buildings (accessed on 30 January 2024).
- Kumar, S.S.; Himabindu, V. Hydrogen production by PEM water electrolysis–A review. Mater. Sci. Energy Technol. 2019, 2, 442–454. [Google Scholar]
- Andreassi, L.; Falcucci, G.; Facci, A.L.; Ubertini, S. Environmental and Health Impact of Electric and Hydrogen Light Vehicles: The Case of an Italian Small City. Technical Report, SAE Technical Paper. 2019. Available online: https://www.sae.org/publications/technical-papers/content/2019-24-0250/ (accessed on 30 January 2024).
- European Emission Standards. Technical Report, Wikipedia. Available online: https://en.wikipedia.org/wiki/european_emission_standards#Emission_standards_for_motor_cycles_(two_and_three_wheelers)_%E2%80%93_L-category_vehicles (accessed on 3 January 2024).
- Giechaskiel, B. Gaseous and particulate emissions of a Euro 4 motorcycle and effect of driving style and open or closed sampling configuration. Sustainability 2020, 12, 9122. [Google Scholar] [CrossRef]
- Climate Action Progress Report Country Profile 2022—Italy. Technical Report, European Union. Available online: https://climate.ec.europa.eu/system/files/2023-04/it_2022_factsheet_en.pdf (accessed on 3 January 2024).
- Portale dei Dati Dell’istruzione Superiore. Technical Report, Italian Ministry of University and Research. Available online: https://ustat.mur.gov.it/ (accessed on 3 January 2024).


| Power of electric motor | 2700 | W |
| Maximum speed | 66 | km/h |
| Maximum torque (to the wheel) | 130 | Nm |
| Range | 96 | km |
| Width | 1830 | mm |
| Seat height | 760 | mm |
| Maximum height | 1036 | mm |
| Weight (without battery) | 70 | kg |
| Permissible maximum weight | 245 | kg |
| Cost | 3790 | EUR |
| Battery | Li-ion | |
| Number of batteries | 2 | |
| Battery capacity (per battery) | 1410 | Wh |
| Battery Weight (per battery) | kg | |
| Cost | 900 | EUR |
| 1 kW | 2 kW | |
|---|---|---|
| Utilization factor | 0.83 | 0.8 |
| Number of cells | 48 | 48 |
| Weight with auxiliaries [kg] | 4.4 | 12.5 |
| Length [m] | 0.219 | 0.303 |
| Width [m] | 0.268 | 0.350 |
| Height [m] | 0.123 | 0.183 |
| Estimated cost [62,63] [EUR] | 5200 | 9500 |
| Nominal capacity | 2000 | Sl |
| Weight | 14 | kg |
| Height | 0.56 | m |
| Diameter | 0.11 | m |
| Charge pressure | 5–12 | bar |
| Stored H2 mass | 164 | g |
| Estimated cost | 4000 | EUR |
| Case | Storage Volume [m3] | Storage Mass [kg] | Range [km] | Storage Pressure [bar] |
|---|---|---|---|---|
| eS3 | 54 | 16.2 | 96 | / |
| A | 14.4 | 21.7 | 96 | 5–12 |
| B | 19.7 | 35.7 | 119 | 5–12 |
| C | 25 | 49.7 | 348 | 5–12 |
| D | 54 | 30.2 | 96 | 46 |
| E | 54 | 30.2 | 632 | 300 |
| F | 6.8 | 11.2 | 96 | 300 |
| Bus | Car | Petrol Moped | |
|---|---|---|---|
| PM2.5 [g] | 4.4–17.7 | 36.4–145.6 | / |
| PM10 [g] | 5.5–21.8 | 13–52 | / |
| NOx [g] | 221.3–885 | 124.8–499.2 | 93.6 |
| COV [g] | 12–47.8 | 39–156 | 176.8 |
| CO [g] | 46.8–187.2 | 358.8–1435.2 | 1185.6 |
| CO2 [kg] | 18.3–73.2 | 51.2–205 | 112.3 |
Disclaimer/Publisher’s Note: The statements, opinions and data contained in all publications are solely those of the individual author(s) and contributor(s) and not of MDPI and/or the editor(s). MDPI and/or the editor(s) disclaim responsibility for any injury to people or property resulting from any ideas, methods, instructions or products referred to in the content. |
© 2024 by the authors. Licensee MDPI, Basel, Switzerland. This article is an open access article distributed under the terms and conditions of the Creative Commons Attribution (CC BY) license (https://creativecommons.org/licenses/by/4.0/).
Share and Cite
Loreti, G.; Rosati, A.; Baffo, I.; Ubertini, S.; Facci, A.L. Optimized Design of a H2-Powered Moped for Urban Mobility. Energies 2024, 17, 1314. https://doi.org/10.3390/en17061314
Loreti G, Rosati A, Baffo I, Ubertini S, Facci AL. Optimized Design of a H2-Powered Moped for Urban Mobility. Energies. 2024; 17(6):1314. https://doi.org/10.3390/en17061314
Chicago/Turabian StyleLoreti, Gabriele, Alessandro Rosati, Ilaria Baffo, Stefano Ubertini, and Andrea Luigi Facci. 2024. "Optimized Design of a H2-Powered Moped for Urban Mobility" Energies 17, no. 6: 1314. https://doi.org/10.3390/en17061314
APA StyleLoreti, G., Rosati, A., Baffo, I., Ubertini, S., & Facci, A. L. (2024). Optimized Design of a H2-Powered Moped for Urban Mobility. Energies, 17(6), 1314. https://doi.org/10.3390/en17061314