1. Introduction
The main renewable source of energy is solar energy because it is a free resource and widely available [
1]. It can be exploited by means of many systems that differ from each other in terms of their conversion principle, technology and materials. Whatever the adopted integrated technology, the development of an efficient and economic solar system represents the future challenge. In particular, solar technology presents two basic parameters to be optimized: production cost and energy conversion efficiency. In recent years, an interesting solution is represented by concentrating photovoltaic (CPV) systems [
2], which are able to match increasing energy demand with more efficient and cheaper solar solutions. In these systems, the sunlight is concentrated on Multi-Junction (MJ) solar cells [
3], presenting smaller photovoltaic area. A CPV system presents an optics system that allows the sunlight to focus on receiver to maximize the incident solar radiation. The receiver, where the photovoltaic cells are located, can assume different configurations [
4] according to optics adopted. The optics is generally conventional and economical, and is made up of lenses or mirrors or both [
5]. The photovoltaic area is proportionally decreased with the concentration level that the optics can allow. Hence, the concentration factor (C), which defines how many times the incident radiation is focused by the optics onto the cell [
6], is a key parameter of CPV systems.
It is basic to identify innovative solutions that allow higher efficiency values and lower energy production costs [
7]. Therefore, the fundamental parameter of CPV system is its global efficiency. Although CPV systems are a complex apparatus due to different technologies involved [
8], two basic elements that affect their efficiency are the photovoltaic cells and the optical devices. The cell efficiency depends mainly on its intrinsic characteristics and is therefore limited by present technology [
9]. Consequently, the main parameters of CPV system to be considered are the optical ones: concentration factor and optical efficiency. In literature, many papers have studied MJ cell conversion efficiency [
10,
11] and its improvement [
12]; in contrast, with regard to optical analysis [
5], specific apparatus [
13] are generally evaluated. Hence, in order to compare technological solutions, to determine the best operation conditions and to size the most convenient setup, it is necessary to standardize the optical variables definition, the measuring tools and the methodologies. For this, the development of a methodology able to study optical performances of CPV systems is fundamental.
In literature, there are few papers that evaluate the optical performance of CPV systems by directly calculating these parameters by means of experimental analysis. In fact, the main parameter affecting a CPV system is the concentration factor linked to optical efficiency, whose measure is always indirect. In contrast, in this paper, the measurement of the concentration factor is directly calculated by means of an experimental procedure and based on the concentrated solar flux on receiving area. The concentrated solar flux is not often evaluated in the literature when CPV system performances are estimated. Hence, because in literature there are few direct methodologies for the evaluation of the concentrated solar flux, as explained in the next section, the methodology presented in this paper exploits the experience in the heat flux microsensors field [
14] to evaluate the optical performances of CPV systems. Generally, indirect methods of measurement are used to evaluate the concentrated solar flux because tools with a linear response in a wide range of measurements that are usable for each CPV system are not available. The possibility of determining directly the concentrated solar flux is a crucial step in the development of concentrated photovoltaic technology.
Hence, the aim of this paper is to define the steps of a methodology able to study the optical parameters of a CPV system. The main contribution of this study is to indicate a procedure allowing the evaluation of the concentrated solar flux in order to evaluate all the optical parameters, including the concentration factor. The experimental procedure allows the definition of some curves, which can be standardized for different CPV systems. First, it is necessary to identify a measurement tool able to estimate the concentrated solar flux, and successively to develop an experimental methodology adoptable for different CPV systems. For this purpose, it is important to first analyse the main optical parameters of CPV systems that affect the system efficiency, and then to realize a literature review of the indirect and direct methods adopted for the evaluation of the concentrated solar flux and the optical parameters. Finally, the different steps of the methodology are presented (sensor choice, methodology of proposed calculation, etc.) together with the results related to different CPV system configurations. This analysis allows to introduce in this paper a direct procedure of measurement, based on experimental tests, which investigates the optical performances of the CPV system adopted. The direct optical characterization of a point-focus CPV system, usable for similar systems under the same operation conditions, is presented.
2. Optical Parameters of CPV Systems
The energy production unit cost of solar systems must decrease in order to be competitive with that of traditional systems; hence, it is important to increase the system efficiency. The principal components of CPV systems are TJ solar cells and optics, whose efficiencies affect the CPV system global performance.
The CPV system global efficiency (η
syst) is equal to the ratio between the produced electric power (P
el,out) and the radiant power incident on the optics (P
in). Moreover, considering the two components involved in the system energy production, the CPV system efficiency is given by the product of the electrical (η
el) and optical (η
opt) efficiencies of the CPV system [
15]:
The TJ cell efficiency depends on the TJ cell material characteristics. Therefore, the optical efficiency is the only parameter that directly depends on the CPV system configuration and it is a basic parameter for system evaluation. The optical efficiency is defined as the fraction of radiant power on the primary optics aperture (P
in) that reaches the receiving area (P
out) where the TJ cells are located [
3]:
The CPV system efficiency depends on the electrical and optical efficiencies (Equation (1)). So, in order to produce more electricity with the same cell area, the global efficiency can be raised by increasing the electric efficiency or the solar radiation intensity incident on the TJ cells, because the generated current is proportional to the incident irradiance on the receiver. Hence, the solar concentration raises the electric energy, increasing the direct normal irradiance (DNI). Because this increase is proportional to the optical concentration factor (C), the concentrated solar flux (I
conc) on TJ cells can be defined as:
C is directly linked to the geometric concentration factor (C
geo), equal to the ratio between the aperture area of the primary optics and the receiver area, by means of optical efficiency [
3]:
Finally, the optical efficiency limits the CPV system electrical performance and links C
geo to the irradiance increase on the receiver [
15]. Hence, the main parameters that characterize the optical performance of a CPV system are C and η
opt; the parameter that links C and η
opt is I
conc.
3. Literature Review on Measurement Methods for CPV System Optical Performances
An effective energy transfer from optics to TJ cells is required in CPV systems. Hence, the fraction of incident radiative power transmitted to the receiver is an important property. This transmission function, integrated on the angular, spatial and spectral range of solar radiation, allows the optical efficiency linked to C to be calculated. The optical performances of CPV system can be evaluated by means of several methods that differ according to how Iconc is technically obtained.
The measurement of Iconc can be realized using direct and indirect methods. In the first case, a direct measure of the concentrated solar irradiance is provided, while the indirect methods measure physical quantities linked to Iconc. In literature, indirect methods are adopted much more widely than direct methodologies that use experimental tests. In this section, a literature review about the existing methods, measured physical quantities and technical instrument used is reported.
The optical efficiency can be evaluated in this way [
14]:
where I
in and I
out are, respectively, the average irradiance at optics aperture and at receiver. In [
3] the intuitiveness of this definition is evidenced, but several aspects related to the light source characteristics have to be considered from the practical point of view. In the case of indoor measurements, the light source has to be angularly and spectrally equivalent to the real sun to have a representative value. The irradiance (I) is function of the angular (θ) and spectral (λ) distribution. With regard to outdoor measurements, the light spectral distribution of the sun has to be monitored. The choice of sensors is extremely important for the I
in and I
out measurement, because these instruments must present a flat spectral response and cosine angular response for each solar spectrum wavelength. I
in and I
out can only be directly measured using thermal irradiance sensors with a flat spectral response [
3]. I
in is evaluated using a pyrheliometer. As for I
out, it is difficult to find an appropriate sensor able to support a wide range of flux, ensuring linearity in measurement, and with cross-calibration to a pyrheliometer. The only thermal irradiance sensors that allow this measure are radiometers. The most used radiometers are the Gardon [
16], heat flux microsensors (HFMs) and Kendall radiometers [
14]. The heat flux microsensors are used above all for experimental tests and some examples are present in literature, such as the characterization of the SSPS-CRS tower at Plataforma Solar de Almería [
17]. Another example is the characterization of a parabolic collector and a Dish/Stirling system in [
16,
18]. An alternative to thermal irradiance sensors for the I
in and I
out analysis is the measurement of light power in narrow bands of wavelength, or spectral irradiance [
19], and its integration on the solar spectrum. The spectral irradiance measure can be obtained using a spectroradiometer, but this is generally very expensive. Moreover, this method can be used only for constant light sources [
19], and outdoor or indoor measurements with constant simulators. In the literature, this approach is usually adopted to evaluate CPV system performances for different operational conditions and for the optimization of existing plants. In [
20], this method is used to measure the concentrated flux in a CPV system in order to evaluate optical efficiency and performance evolution during the module lifetime. In [
21], the spectral analysis to characterize the CPV system collectors, independently of any receiver used, is shown.
The optical efficiency definition reported in Equations (2) and (5) is used in a limited way in the literature. The most common method is based on a more practical definition of optical efficiency that, considering Equation (5) and a cell as the receiver, can be represented also in terms of I
cell and I
in:
Icell can be measured by photocurrent Iph, which is linearly dependent on the incident irradiance. Moreover, considering that the solar cell current does not change in the low voltage part of the I-V curve, the photocurrent can be approximated to a short-circuit current (Iph ≈ Isc).
The I
out and I
in values can be calculated with the same approximation, measuring the short-circuit current of a couple of identical cells illuminated by light at the entrance aperture of the concentrator and at its focus [
5]:
where I
sc,in (1) and I
sc,out (1) are the calibrated values of the solar cells short-circuit current at the reference irradiance, at 1 sun or 1000 W/m
2 under the reference spectrum AM1.5D-G173-03. The equation of the optical efficiency is:
The use of solar cells as irradiance sensors is a practical and economical method, but for providing an approximation, the cells are sensitive to changes in operational conditions. The characterizations reported in literature [
5,
21,
22,
23,
24] and based on this method are associated with CPV systems with a limited value of C. Generally, the irradiance sensors cannot be used for collectors with a high C. In other studies [
25,
26], this limit is overcome using apparatus for the attenuation of the concentrated solar flux as the integrating spheres.
Another approach is based on energy balance to evaluate the concentrated power P
out. The main limit of this approach is the use of an active heat dissipation system, while the advantage is the absence of upper limits in measuring the concentrated solar irradiance. In the literature [
26], the energy method is mostly used for point-focus CPV systems characterized by higher C values. Another method used for CPV systems with high C values is based on the use of charge-coupled devices (CCD) [
17]. They are not located in the focal position, and the measurement of concentrated solar flux is obtained by placing at a distance the CCD cameras equipped with appropriate filters; this method is usable only for indoor measurements.
The literature analysis shows that indirect methods are mostly studied to evaluate CPV systems optical performances [
27], while direct methods are not used much for optical parameter evaluation but are focused on limited aspects of the incident radiation. The methodology exploits heat flux microsensors [
14] to estimate the incident power on the TJ cell after the concentration has been obtained by optical devices. The direct estimation of the heat flux on the TJ cell for the CPV system optical analysis is not used much in the literature. The main aim of this paper is to provide an accurate and direct procedure for the measurement of concentrated solar flux in CPV systems. The proposed methodology is explained in the following section.
4. Methodology
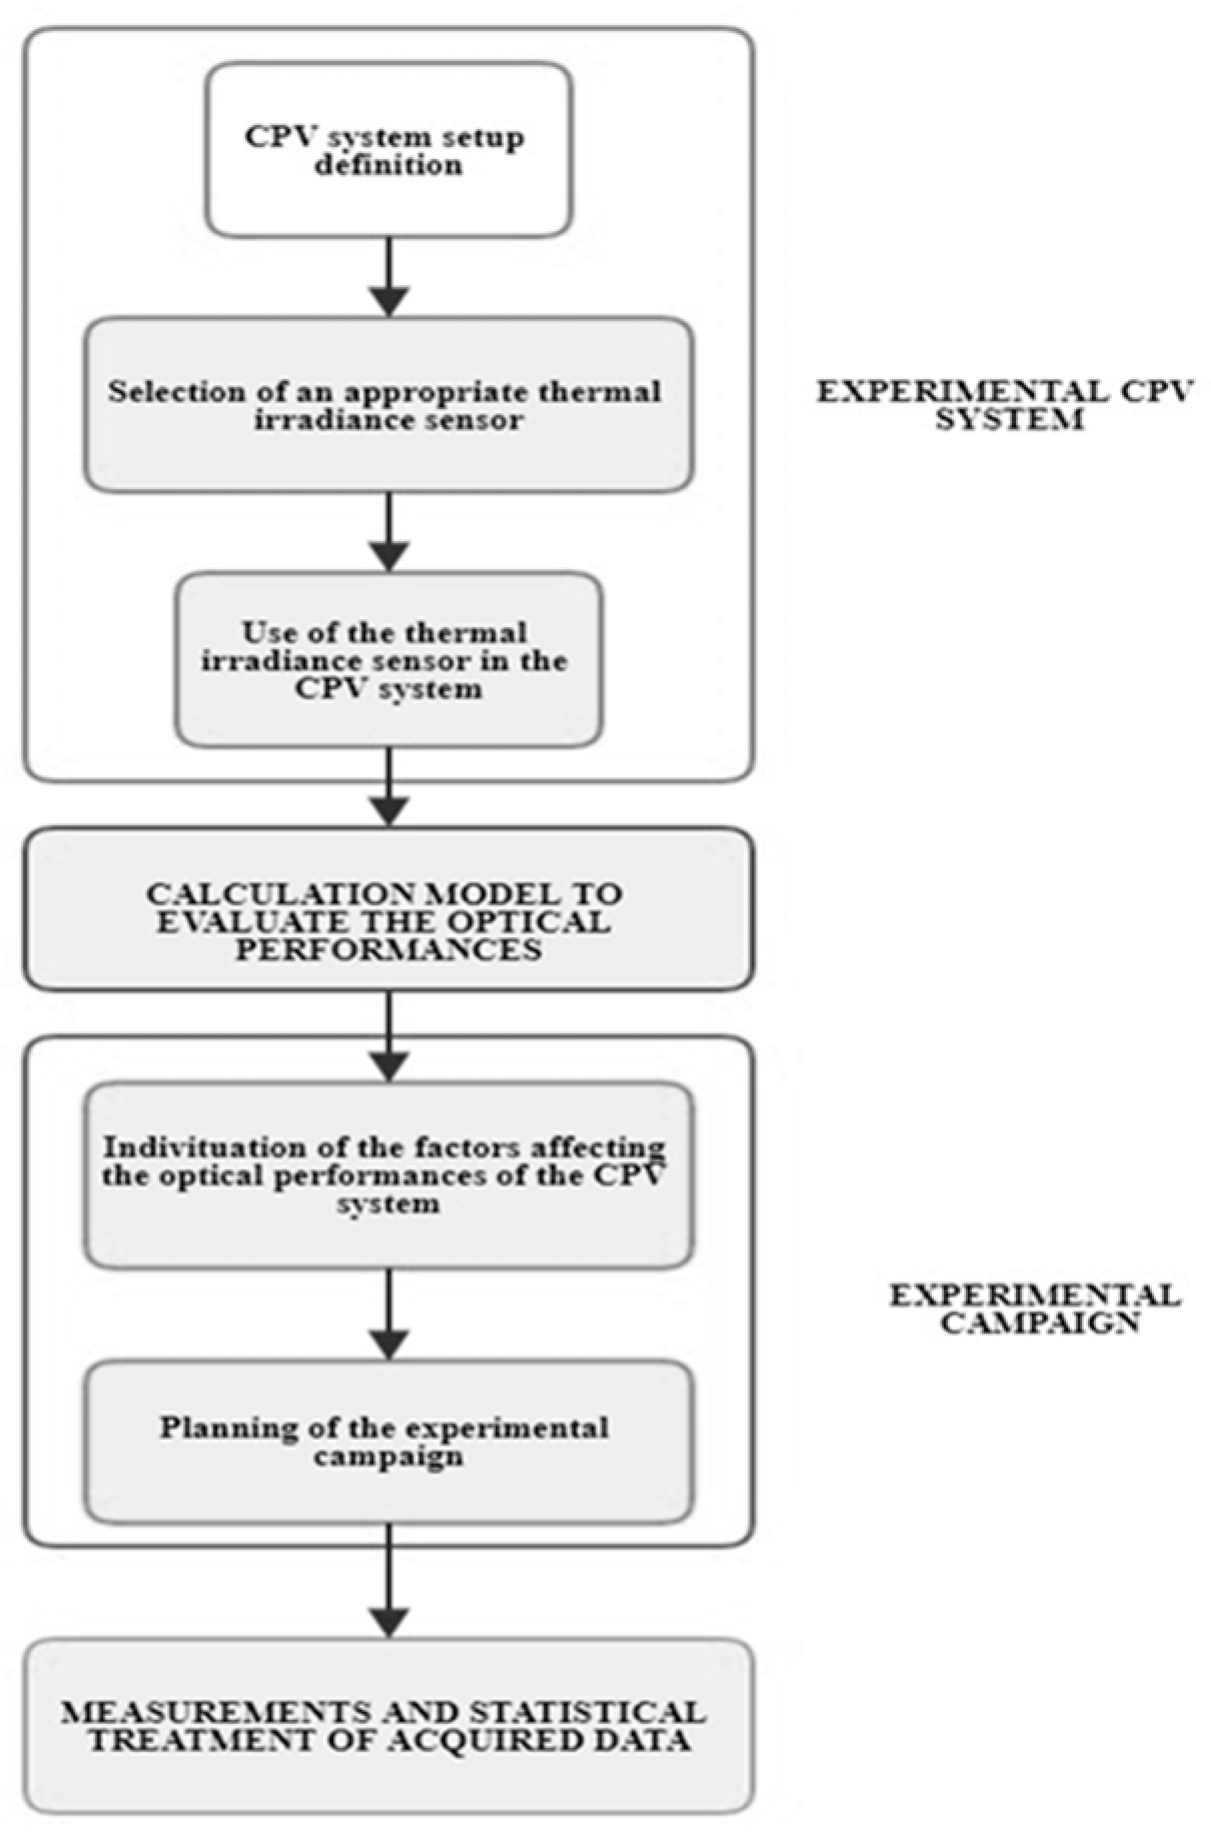
As said before, it is preferable to use a direct methodology to accurately characterize a CPV system from the optical point of view according to real operation conditions. The main steps of the methodology, developed for optical characterization, are shown in
Figure 1. In the first step, the experimental CPV system setup is defined related to the necessary components and the thermal instrument used to evaluate the concentrated solar flux. The second step determines the methodology to use the chosen instrument. In the third step, the parameters affecting the optical performances of the CPV system are identified and the experimental campaign is defined. The fourth step is related to data processing. Finally, the developed methodology mainly consists of two principal sections. The first involves the application of the designed measuring method and the second consists of the analytical treatment of the data acquired.
In the following sections, the first three steps are investigated. The fourth step, related to data processing, consists of an analytical study able to evaluate the optical performances for each configuration planned in the experimental campaign. The experimental tests for each configuration lasted two hours with a sampling range of 15 s. Hence, a high number of optical efficiency and optical concentration factor values were obtained. Finally, regression equations describing the optical concentration factor and optical efficiency trends in terms of selected inputs, were defined. These equations are valid in specific ranges and, with a distinctive coefficient of determination, allow us to evaluate the optical performances, giving only the chosen input value.
4.1. First Step: Definition of the Experimental CPV System
An experimental prototype of a CPV system is described in this section, together with the thermal irradiance sensor selected. Moreover, the modifications made to the original system to use the sensor and to correctly realize the optical characterization are reported.
4.1.1. CPV System Setups and Components
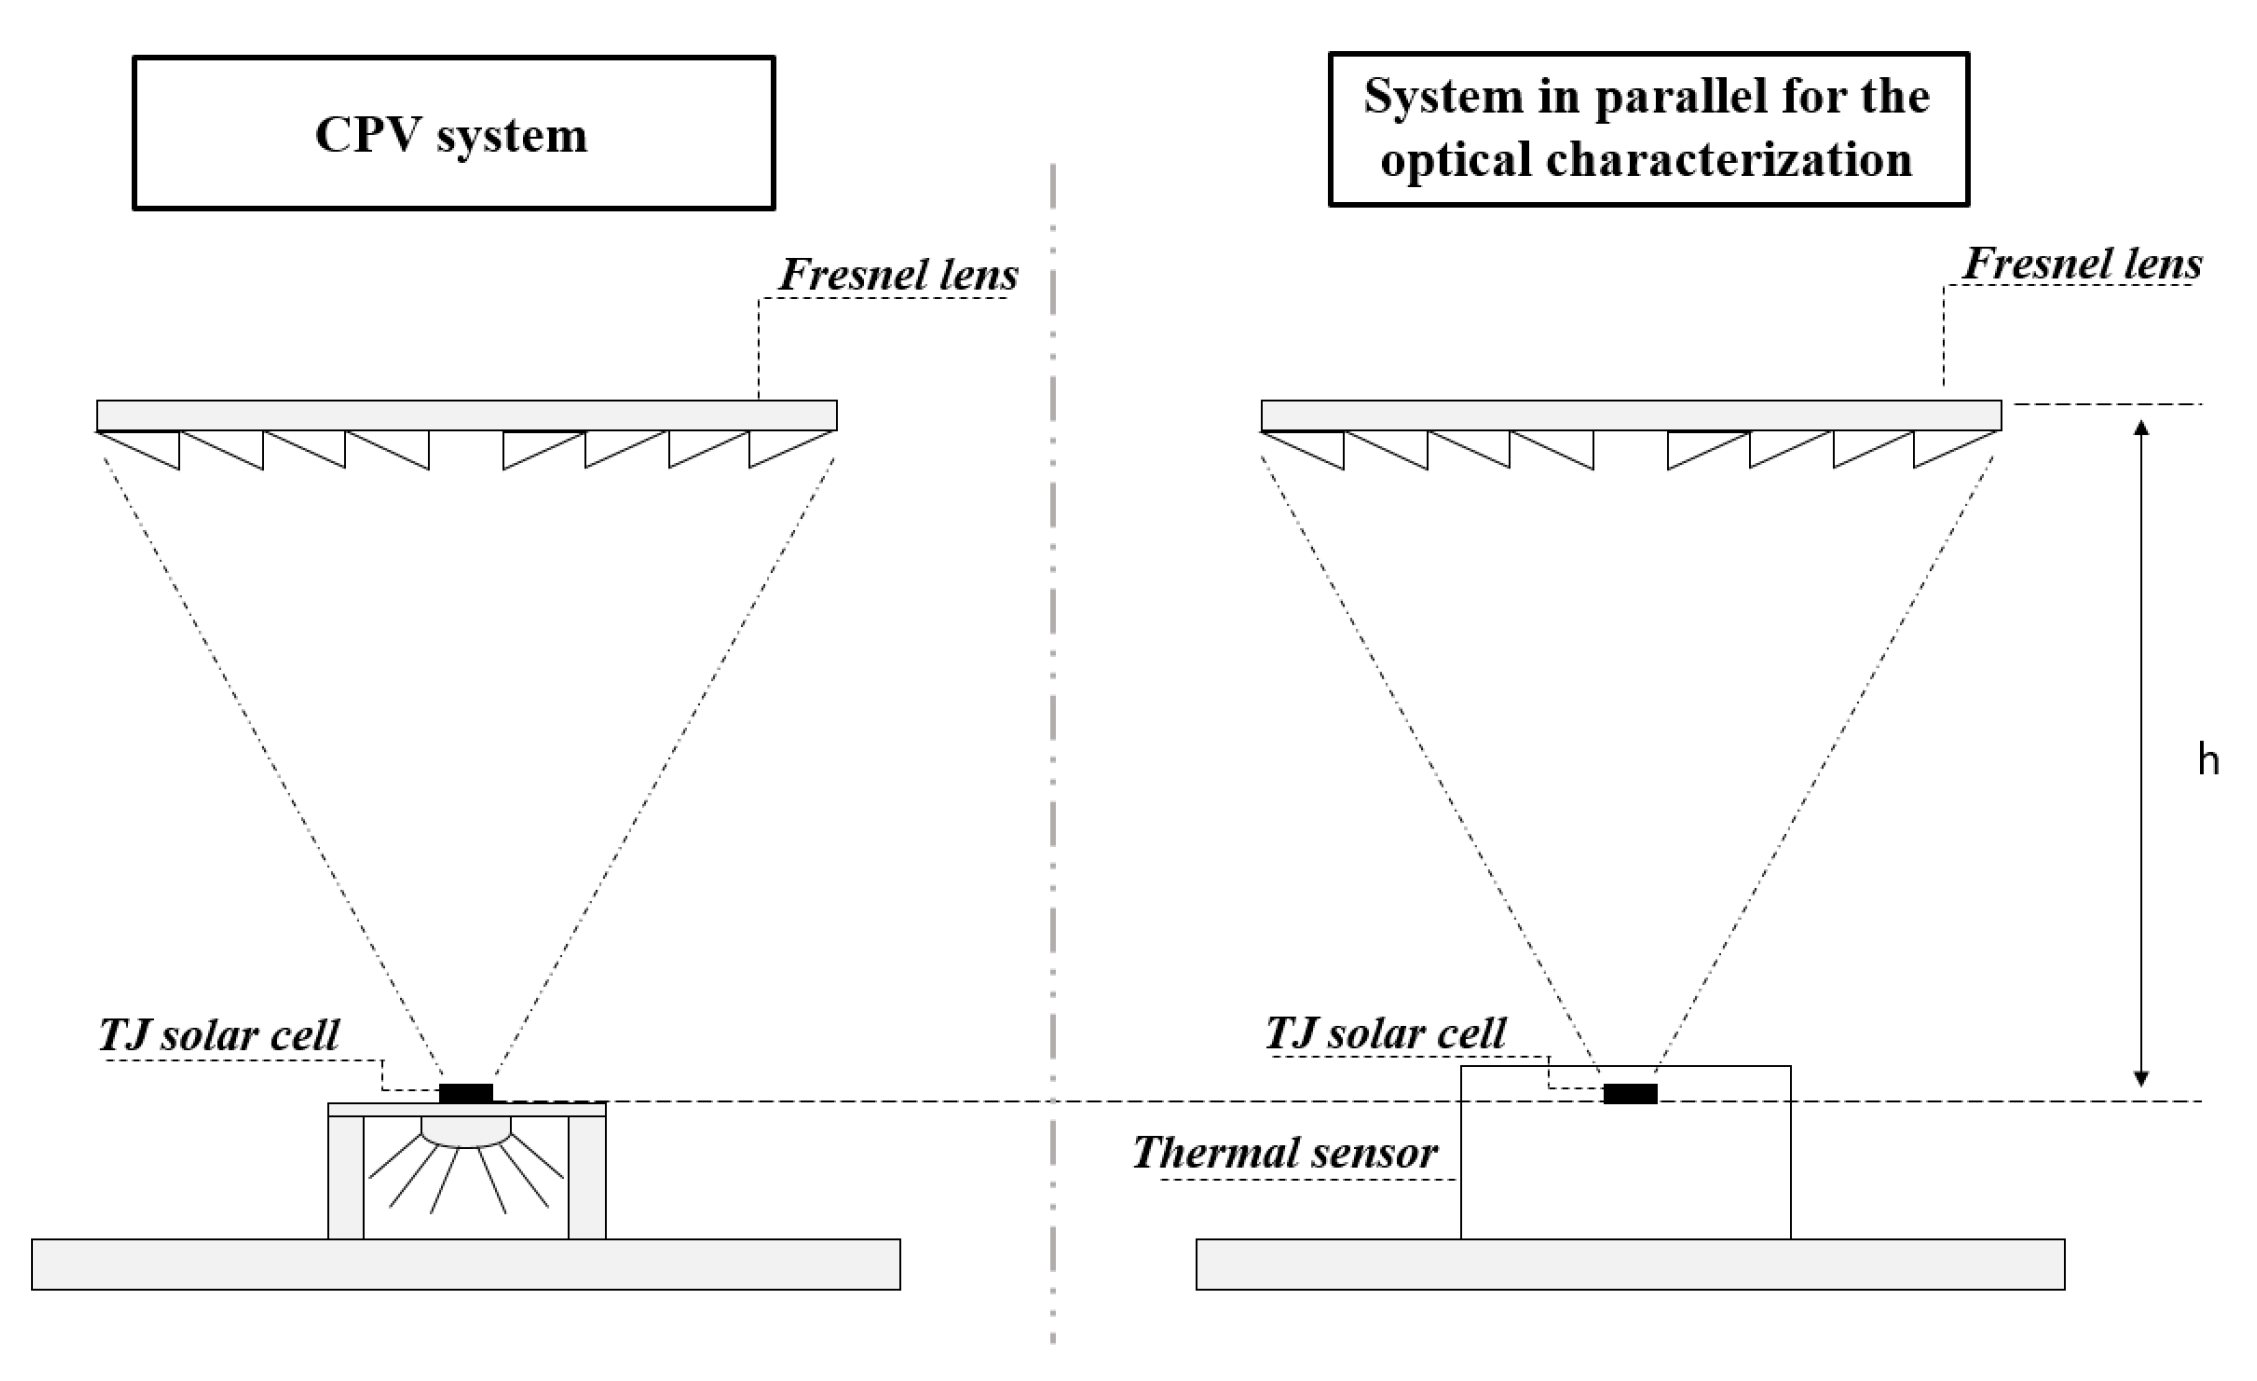
The point-focus CPV system was built in the Laboratory of Applied Thermodynamics of the University of Salerno (
Figure 2). The prototype consists of primary and secondary optics and a TJ cell. A Fresnel lens, made of acrylic material, was used as the primary optics; it was a circular shape with a diameter of 28 cm. TJ cells (InGaP/GaAs/Ge) with areas of 10 × 10 mm
2 and 5.5 × 5.5 mm
2 and C
geo values equal to 616 and 2036, respectively, were adopted. As the secondary optics, a kaleidoscope in PMMA, following the physical principle of total internal reflection, was used to make the incident solar radiation per unit of active cell area uniform, to avoid chromatic aberration and to improve the optical efficiency. The experimental CPV system presents a tracking system able to keep the receiver plane perpendicular to solar rays at any time. The experimental plant allowed the lens–cell vertical distance to be changed during the tests. This distance is said focal height (h) and allows changes to the C values, on which the direct solar radiation reaching the TJ cell depends.
The experimental plant used for the CPV system optical characterization was related to several setups and operational conditions, obtained by modifying the combination of system elements and lens height. The experimental plant presents different sensors. A pyrheliometer with an accuracy of 2% was used to measure the direct normal irradiance. PT100 Thermoresistances with an accuracy of ±0.2 °C were used to measure the TJ cell and outdoor temperatures.
4.1.2. Selection of Thermal Irradiance Sensor
Thermal irradiance sensors are the only type of instruments that allow the concentrated solar flux to be measured directly. The main problem with these devices is the maximum value of irradiance that they can measure. In the market currently, there are no instruments for solar application able to measure the flux over a wide range from one to several hundreds of suns, depending on the CPV system. In this paper, an unconventional choice was made, selecting a device used above all in the laser field. The applicability of this type of sensor to the solar field is related to the operational physical principle. This device is a power thermal sensor that measures a wide range of wavelengths, including those of the solar spectrum. In [
18], the same type of thermal irradiance sensor was used for a solar application; in fact, it was used in order to measure the concentrated solar flux in the Dish/Stirling system.
In this paper, a thermal irradiance sensor (Ophir model 30A-BB-18) was chosen. It is cooled by convection with air, absorbs all of the solar spectrum, presents a rapid response and has an accuracy of ±3%. The instrument has a sensible aperture area with a diameter of 17.5 mm and it measures power in the range 10 mW–30 W. Both the sensible area and power range were carefully evaluated for the CPV system considered, in order to have an instrument with an area that reproduces two solar cells used in the characterization and that is able to detect the maximum solar flux reachable.
4.1.3. Use of Thermal Irradiance Sensor in CPV System
The chosen thermal irradiance sensor needed to be integrated into the CPV system to have accurate optical characterization. The sensor had to measure the concentrated solar irradiance by Equation (5). Hence, it was placed in the receiving zone to exactly reproduce the solar cell. To adequately integrate the thermal irradiance sensor into the CPV system, the experimental plant was partially modified.
As shown in
Figure 3 and
Figure 4, some supports for the Fresnel lens and sensor were adopted to have a secondary experimental system on the same plane as the primary system that included the TJ cell. The system moves in parallel with the original, and this structure allowed us to simultaneously move the two systems in such a way that the electrical measures and optical characterization occurred in the same operational conditions.
4.2. Second Step: Optical Performance Calculation Model
The main aim is to determine the optical performances of the CPV system independently of the receiver used. This evaluation depends on optical efficiency and the optical concentration factor, which are mutually dependent. The methodology allows the direct measurement of the variables included in η
opt (Equation (2)) and the definition of C:
where P
out and I
out are the concentrated power and irradiance on receiver, respectively, while P
in and I
in are the power and irradiance at the lens aperture area.
The direct solar radiation at the lens aperture area was measured by the pyrheliometer, a sensor suitable for outdoor measurements. The power and irradiance values on receiver were measured with the thermopile Ophir sensor, ensuring linearity in measurements. As said before, a second parallel system was realized to correctly characterize the CPV system in terms of optical performance. This system included the same Fresnel lens as the other one, but instead of a TJ cell, there was a thermal irradiance sensor. To evaluate the correct amount of concentrated solar radiation on receiver, in the second plant the TJ cell size in terms of area was recreated on the thermal device. In particular, the sensor sensible area was adapted with a mask made of insulating material that did not affect the operating conditions. According to the proposed method, a summary of the measured parameters and the instruments used to characterize the CPV system optical performance is shown in
Table 1 and
Table 2.
4.3. Third Step: Experimental Analysis
The experimental analysis, which was conducted to characterize the point-focus CPV system from an optical point of view, was carefully planned. The experimental tests covered a period of 4 months (from 10 January to 30 April 2023) with a frequency of 2–3 days per week and a variable duration of 5–7 h per day. During the experimental data acquisition, the sampling interval was 15 s.
4.3.1. Individuation of Factors Affecting CPV System Optical Performance
In order to acquire all the data for a complete optical description of the CPV system, an accurate identification of the factors influencing the optical performance was achieved by planning a complete scheme of tests. The optical efficiency represents how effectively the incident direct irradiance is concentrated on the solar cell according to the concentration factor value.
The first parameter which influences the optical performance is Cgeo. To evaluate the optical performances according to this variable, the TJ cell size was modified, adopting in all cases the same Fresnel lens. The CPV system’s optical performances were definitely influenced by the same optics. The experimental CPV system consisted of a point-focus configuration with a Fresnel lens as the primary optics, and in the setup with the TJ cell, a secondary optics was adopted. Because the secondary optics influences the performance, another parameter evaluated was the primary and secondary optics composition. The third parameter considered was focal length or lens height (h). It was varied to experimentally evaluate the optimal distance between the lens and cell, and the optical performances in off-focused positions. The last variable taken into account was the tracking system, considering that a smaller acceptance angle (angle between the sun direction and that normal at optical system) determines a higher decline in optical performance, caused by tracking error.
The main aim of this analysis is to evaluate the optical performances by means of a direct measurement methodology, and not to improve them by evaluating different optics configurations. With these assumptions, the only variables which influence the CPV system’ optical performances are: cell size, composition of primary and secondary optics, lens height and tracking system.
4.3.2. Planning of Experimental Campaign
The variables that influence the optical performance were modified to characterize the CPV system from an optical point of view. Referring to the TJ cell size, the tests involved the use of the following two receivers: Cell 1 with area 5.5 × 5.5 mm2 and Cgeo equal to 2036; and Cell 2 with area 10 × 10 mm2 and Cgeo equal to 616.
As for the primary and secondary optics composition, three different setups were examined: Setup 1 (cell, kaleidoscope and Fresnel lens); Setup 2 (cell and Fresnel lens); and Setup 3 (cell and kaleidoscope). For Cell 2 without a kaleidoscope, only the setup with the cell and Fresnel lens was evaluated.
For Setup 1 and Setup 2, a variable number of lens heights were examined. Each setup was evaluated in the correct solar tracking conditions. For some lens heights, incorrect solar tracking conditions were also tested to experimentally estimate the acceptance angle, and to observe the performance’s decline when the tracking error increased over time; incorrect tracking means that the tracker has stopped.
In
Table 3 and
Table 4, the experimental tests planned, modifying and combining the aforementioned four influencing parameters, are reported. The optical performances for different setups were also evaluated considering the levels of DNI included in the range of 850–950 W/m
2.
5. Results
The results of the CPV system optical characterization obtained by in-depth experimental analysis are reported in this section. The results are evaluated considering the CPV system equipped with TJ solar cells both of size 5.5 × 5.5 mm2 (Cell 1) and 10 × 10 mm2 (Cell 2). Moreover, a comparison between the indirect and direct methods is realized under the same working conditions as those for Cell 1.
5.1. Optical Analysis of CPV System with Cell 1
The CPV system optical performances with Cell 1 were evaluated for different configurations and operational conditions.
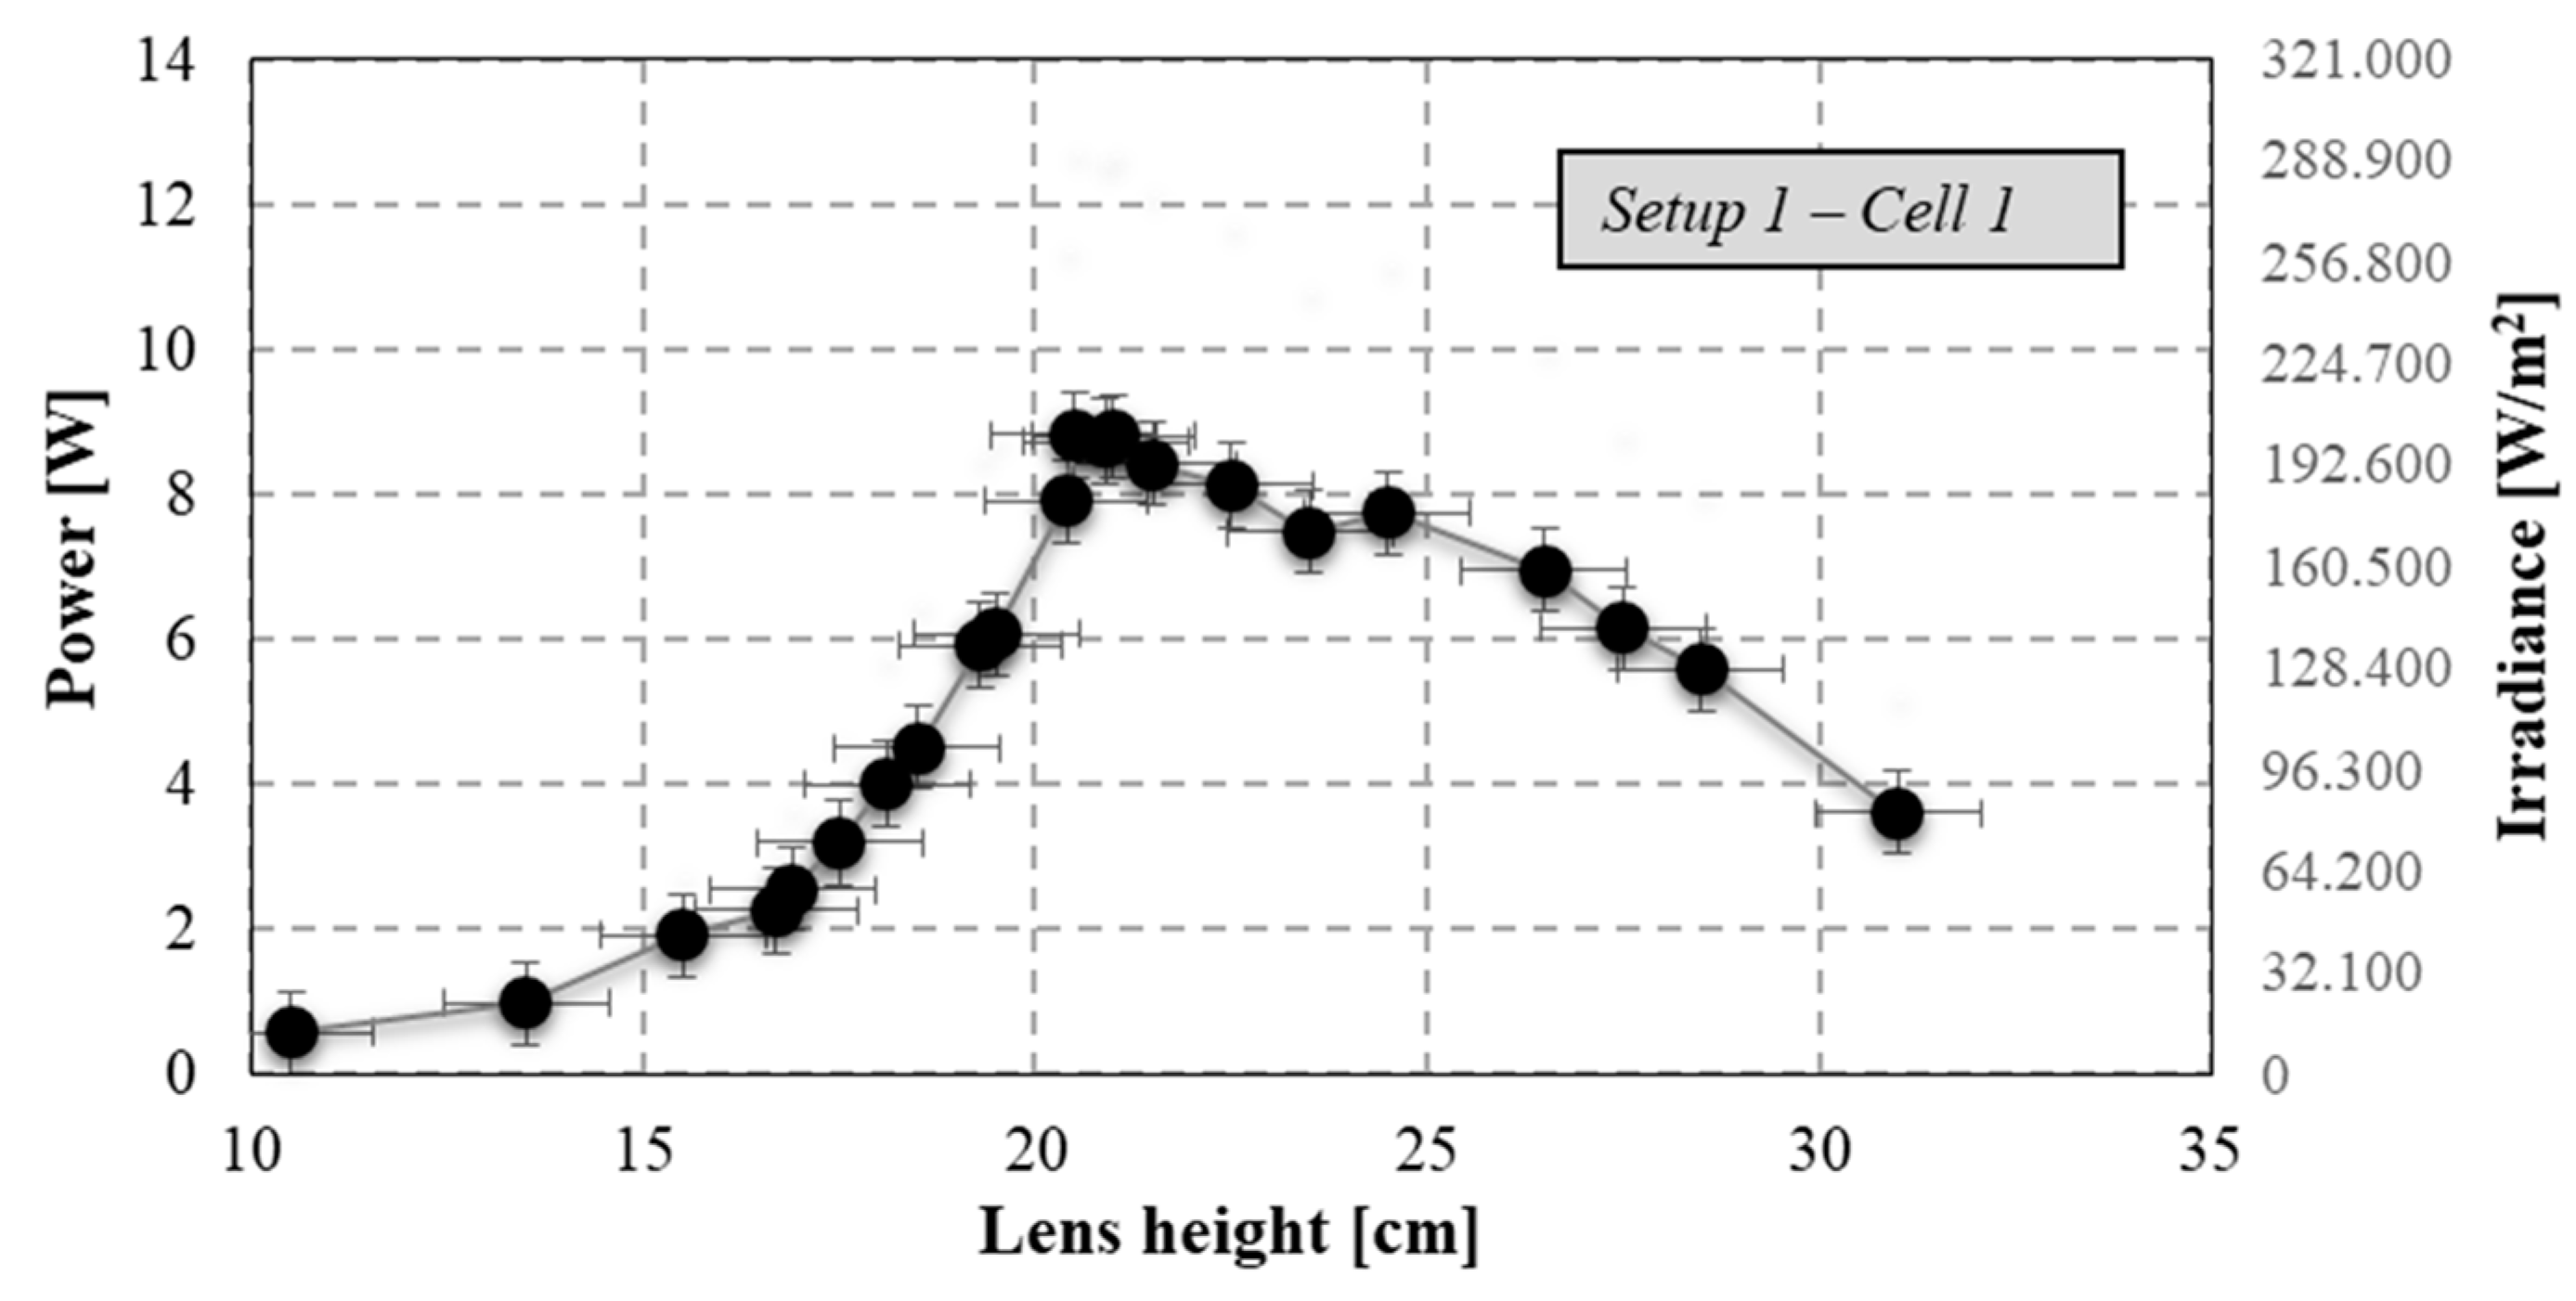
The first case considered is
Setup 1, related to the configuration with a Fresnel lens and a kaleidoscope (C
geo equal to 2036) and in correct tracking conditions. The measured values of concentrated power and irradiance on receiver are reported in
Figure 5 according to the different lens heights. The experimental values of optical efficiency and concentration factor were obtained.
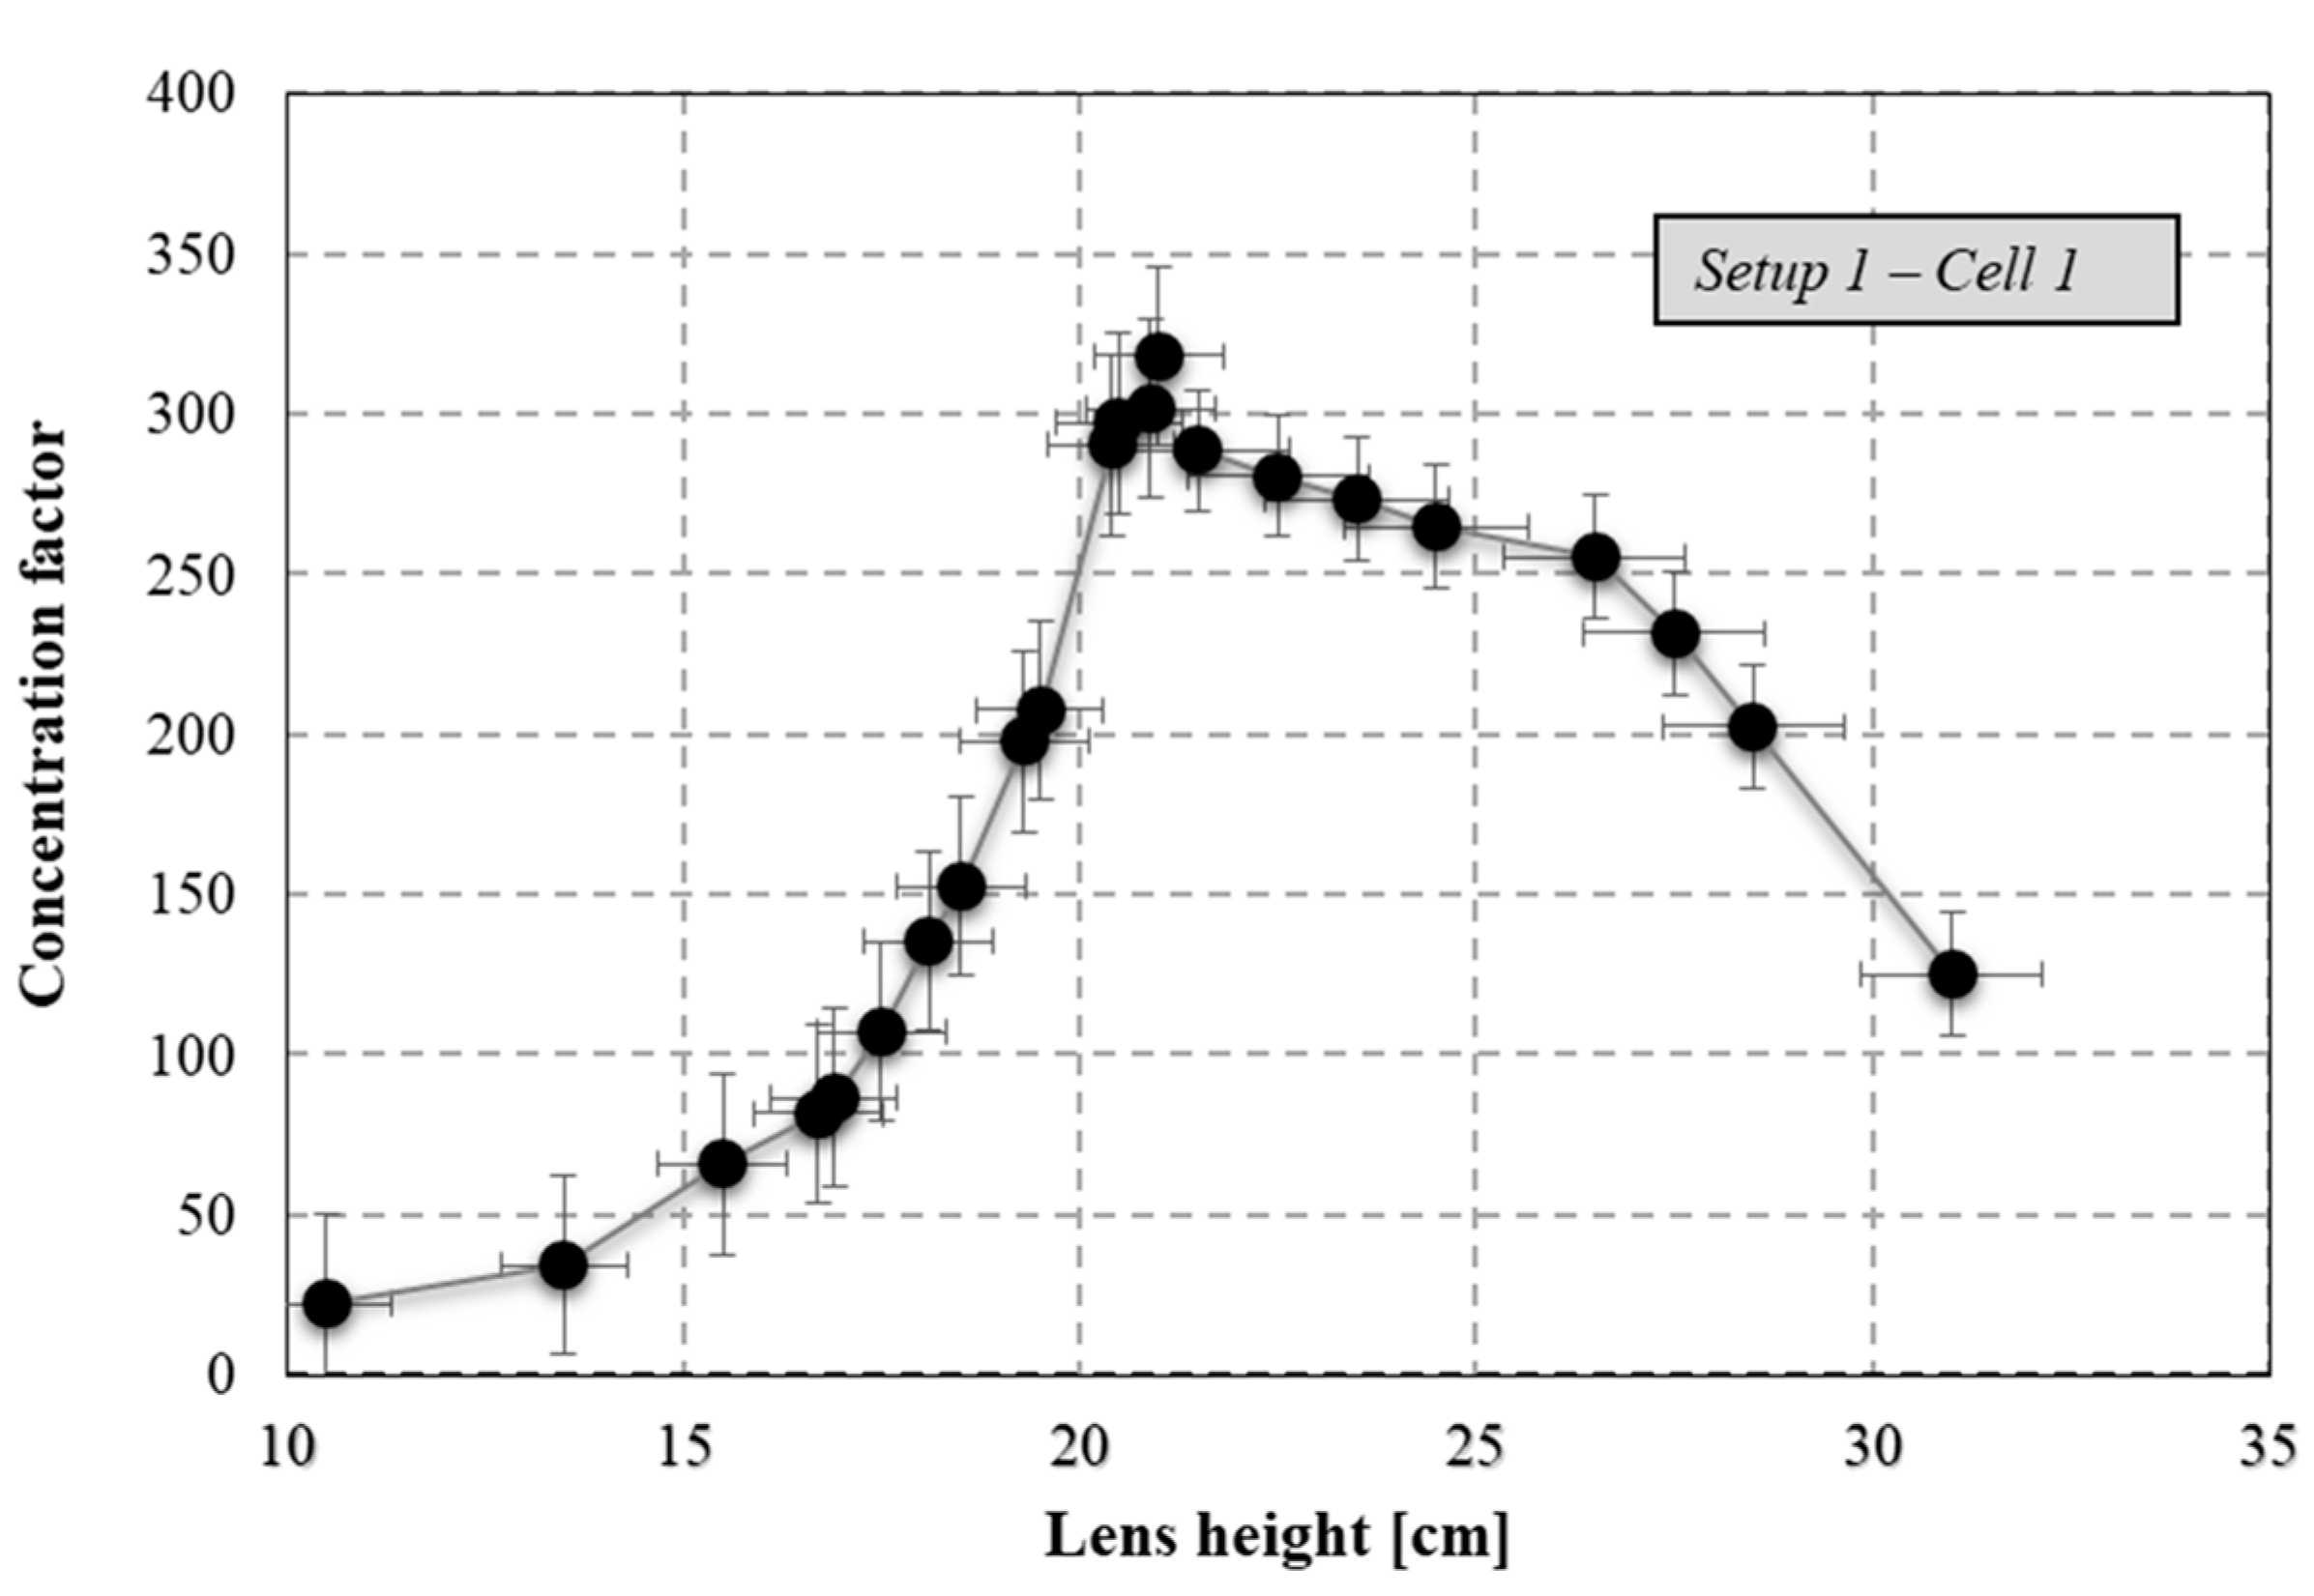
The concentration factor experimental values are reported in
Figure 6. An increase in cell–lens distance from 10.5 cm to 21 cm leads to a change in C from 22 to 315. The lens height of 21 cm represents the optimal positioning experimentally measured, and consequently the CPV system presents a maximum C value equal to 315. Increasing the lens height over the optimal distance resulted in a marked decrease in C. C decreased to 12 when the distance changed from 21.5 cm to 31 cm. Two equations, when C increases before the maximum and when C decreases after the maximum, respectively, were obtained by means of regression analysis. Before the maximum, the C trend is exponential with a coefficient of determination equal to 0.983:
The equation is valid for each height value included between 10.5 cm and 21 cm.
After the optimal distance, C decreases parabolically with a coefficient of determination equal to 0.987:
The equation is valid for each height value included between 21 cm and 31 cm.
It is possible to observe in
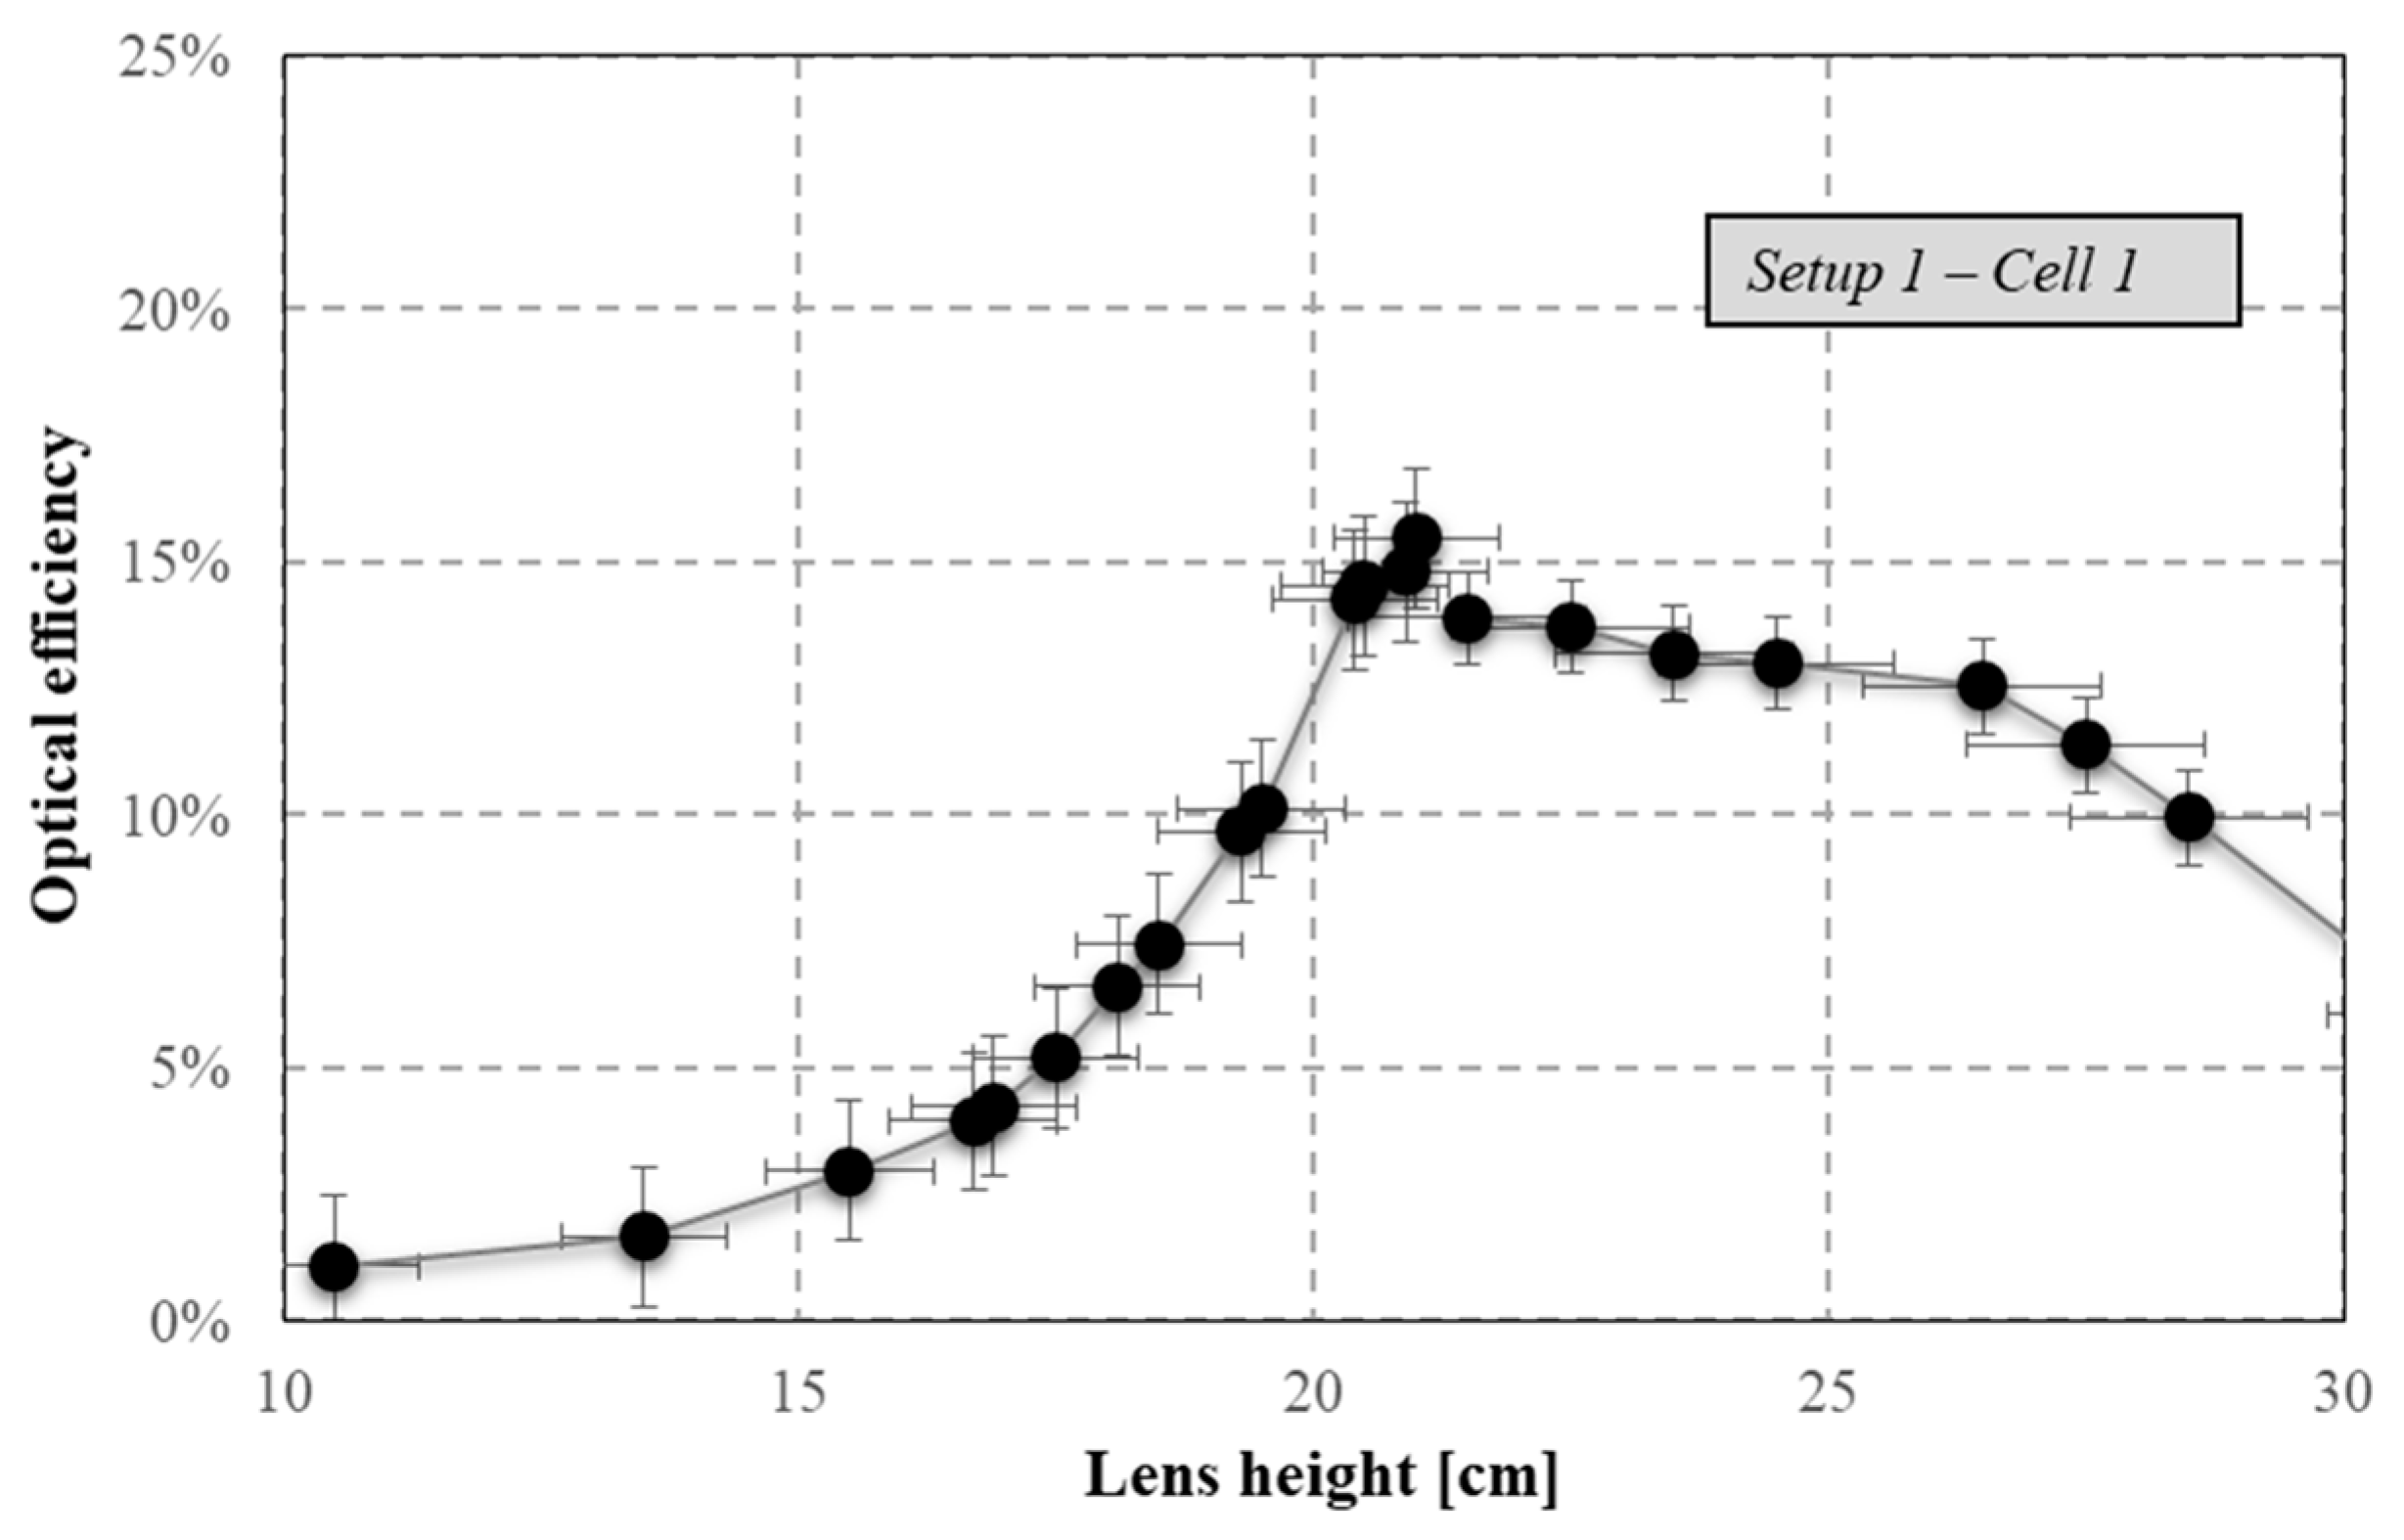
Figure 7 the same trend for optical efficiency by varying the lens height. In the range of lens heights from 10.5 cm to 21 cm, the trend of growth is exponential with a coefficient of determination equal to 0.981:
Between 21.5 cm and 31 cm, the performances decrease following a parabolic trend with a coefficient of determination equal to 0.986:
The best optical performances are obtained when all the concentrated solar irradiance reaches the receiver. In this condition, the spotlight is perfectly coincident with the external diameter of the kaleidoscope. For heights below the optimal point, part of the concentrated solar irradiance is lost because the spotlight exceeds the kaleidoscope aperture area. For this reason, increasing the height in this range results in a consequent increase in the concentrated solar irradiation, determining the fast increase in optical performances. In contrast, for heights higher than the optimal one, the spotlight is always included in the aperture area of the kaleidoscope, so the decline in optical performances is more gradual. The maximum point, where the best optical performances have been calculated, represents a discontinuity point in the trend in the two ranges. This is due to a different physical principle that regulates the operation in the two ranges. Calculating the absolute deviation of normalized heights, for a minimum deviation of 0.07 in the range of cell–lens distances under the optimal point, the C value is about 65% of maximum C. In the other range over the maximum point, the C value is about 89% of maximum C. Considering a maximum deviation of 0.5, the C value is 7% and 39% of the maximum value, respectively, in the ranges under and above the optimal point. The optical performance percentage decrease for several absolute deviation values is shown in
Figure 8.
Referring to
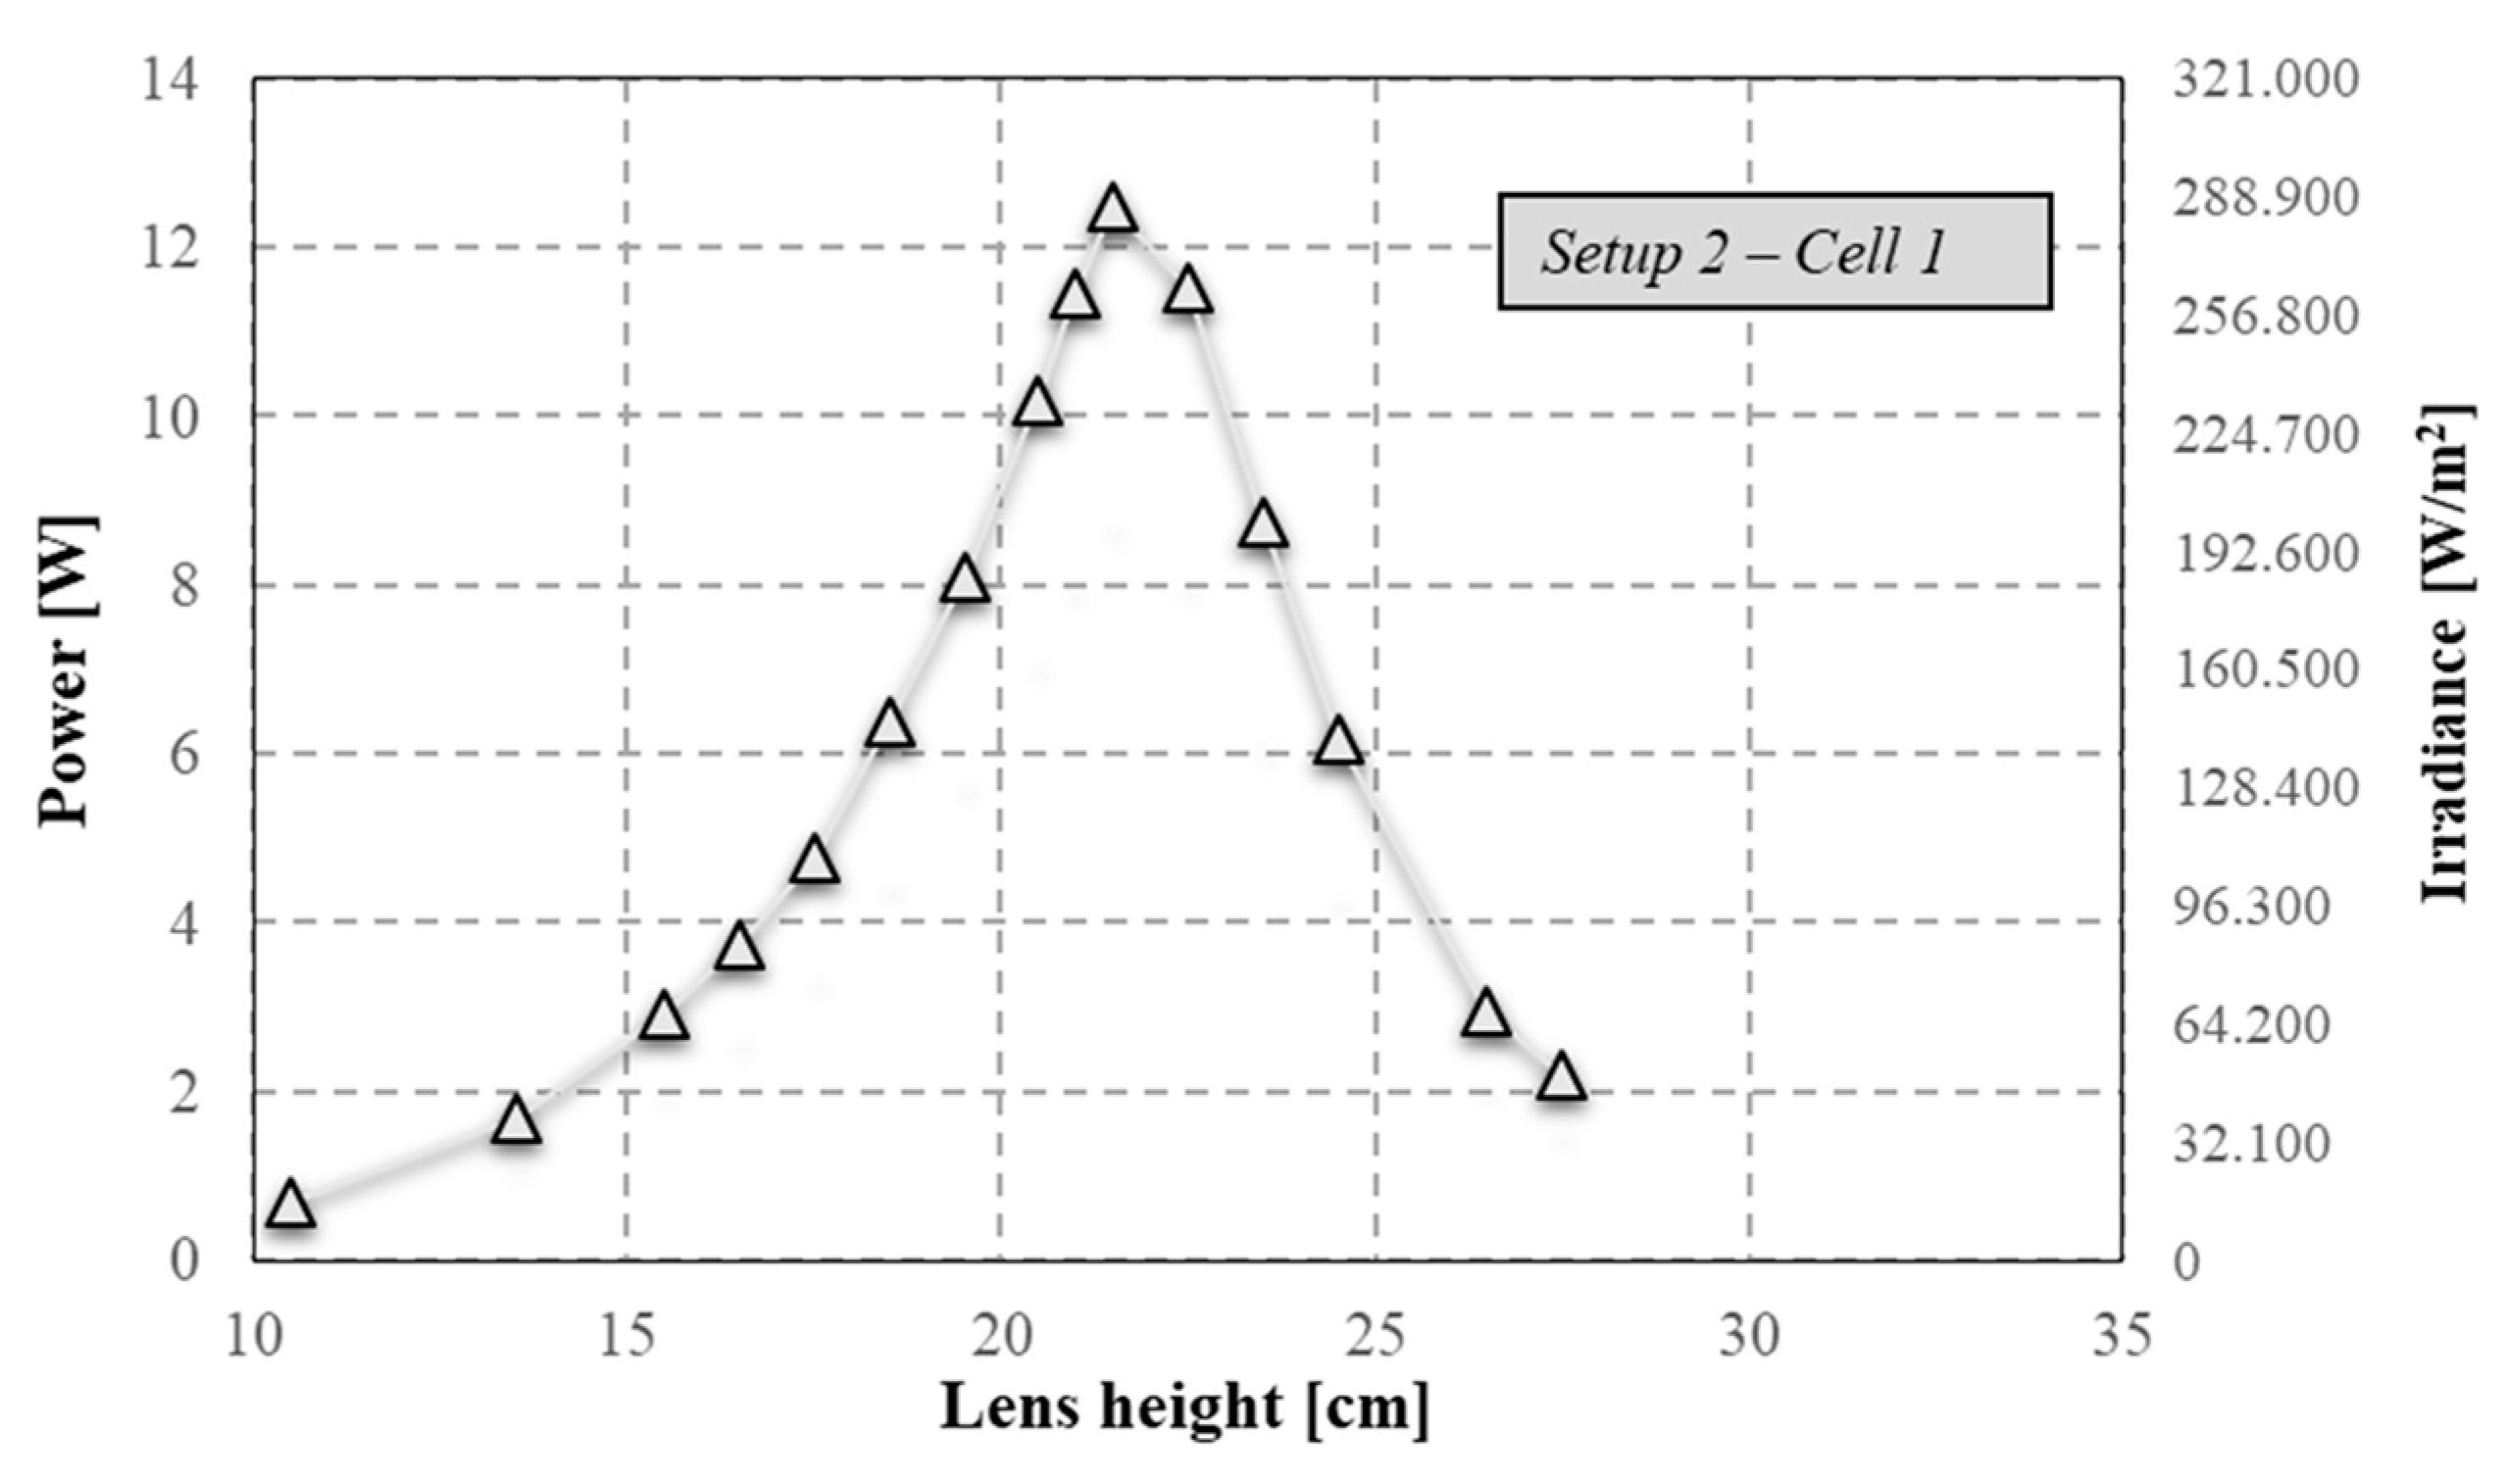
Setup 2, where the TJ cell and Fresnel lens were adopted, C
geo is always equal to 2036. The measured values of concentrated power and irradiance are reported in
Figure 9. Adopting the proposed measurement methodology, C and η
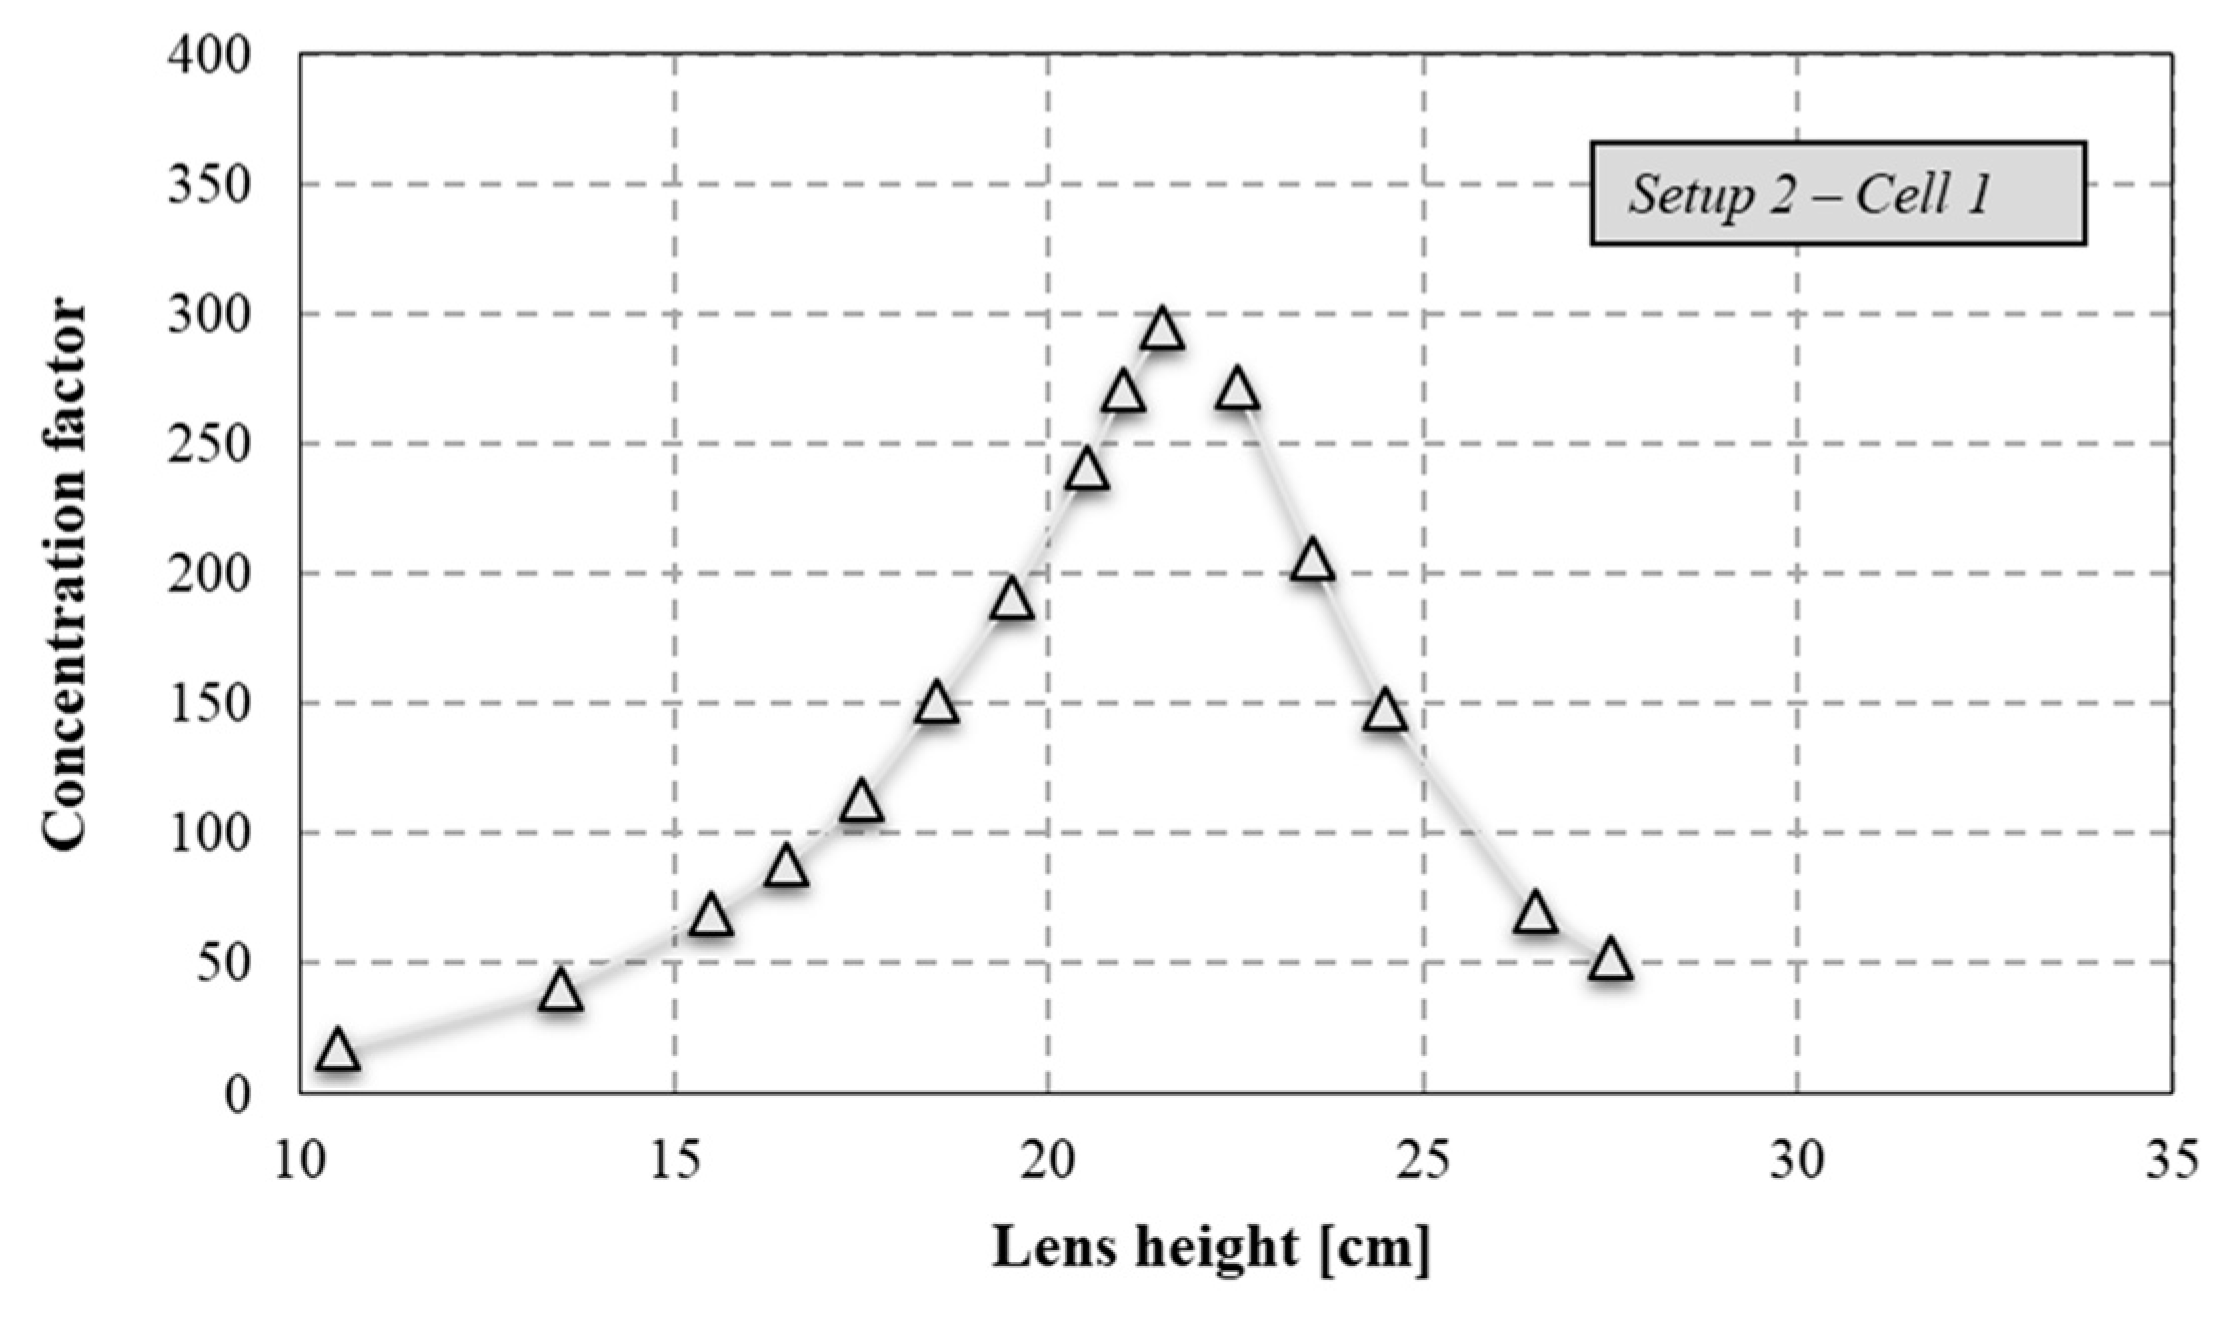
opt were calculated. The values of C, reported in
Figure 10, were determined under correct tracking conditions. When the lens height increases from 10.5 cm to 21.5 cm, the concentration factor varies between 17 and the maximum value of 295. In this range, the C trend is exponential with a determination coefficient of 0.998:
In a range of heights over the optimal point, including between 22.5 cm and 27.5 cm, C decreases from 272 to 52 with an exponential trend and a determination coefficient of 0.998:
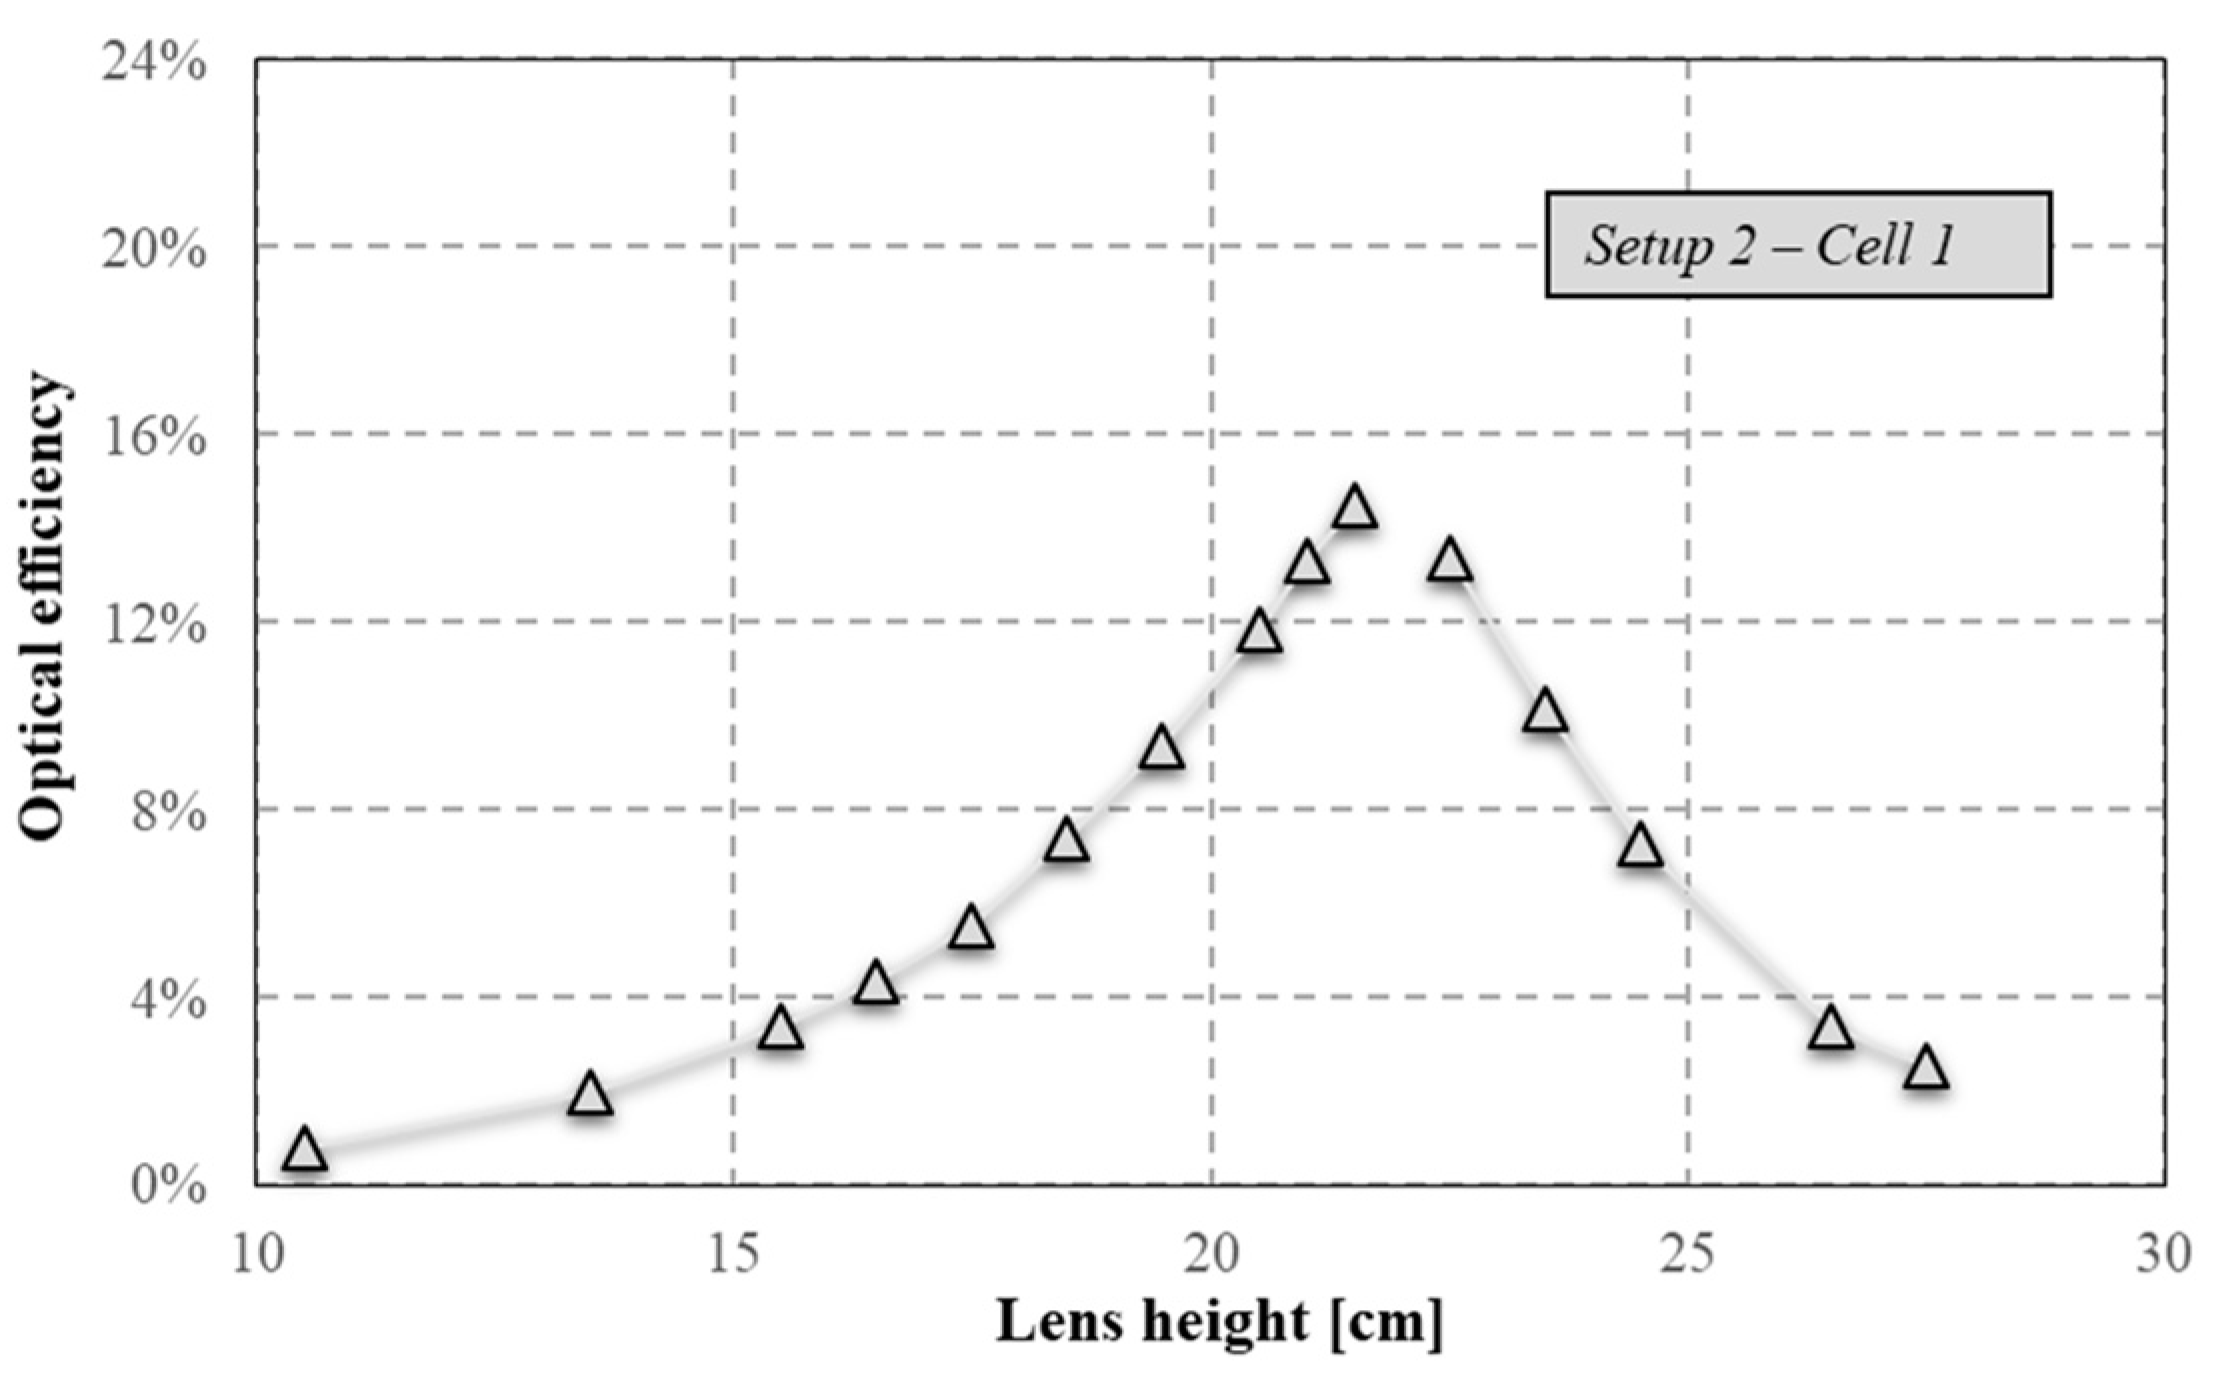
In this setup condition, the system presents a symmetric trend with respect to the optimal value of C, equal to 295. η
opt has the same trend as C (
Figure 11). In the range between 10.5 cm and 21 cm, η
opt exponentially increases:
In the range from 22.5 cm to 27.5 cm, η
opt exponentially decreases:
The experimental characterization with Setup 3 allowed us to evaluate the kaleidoscope optical performances. In particular, the secondary optics allowed us to obtain C and ηopt values equal to 10 and 94%, respectively. The experimental analysis with Setup 3 shows the kaleidoscope importance. In fact, referring to Setup 1, in the range of lens heights below the optimal point, the secondary optics allowed us to slightly increase the optical performance; in contrast, it determined wide advantages in the other range in terms of a more gradual decrease in C.
The optical performances evaluation for
Setup 1 and
2 corresponding to the optimal lens height, when tracking is incorrect, is reported in
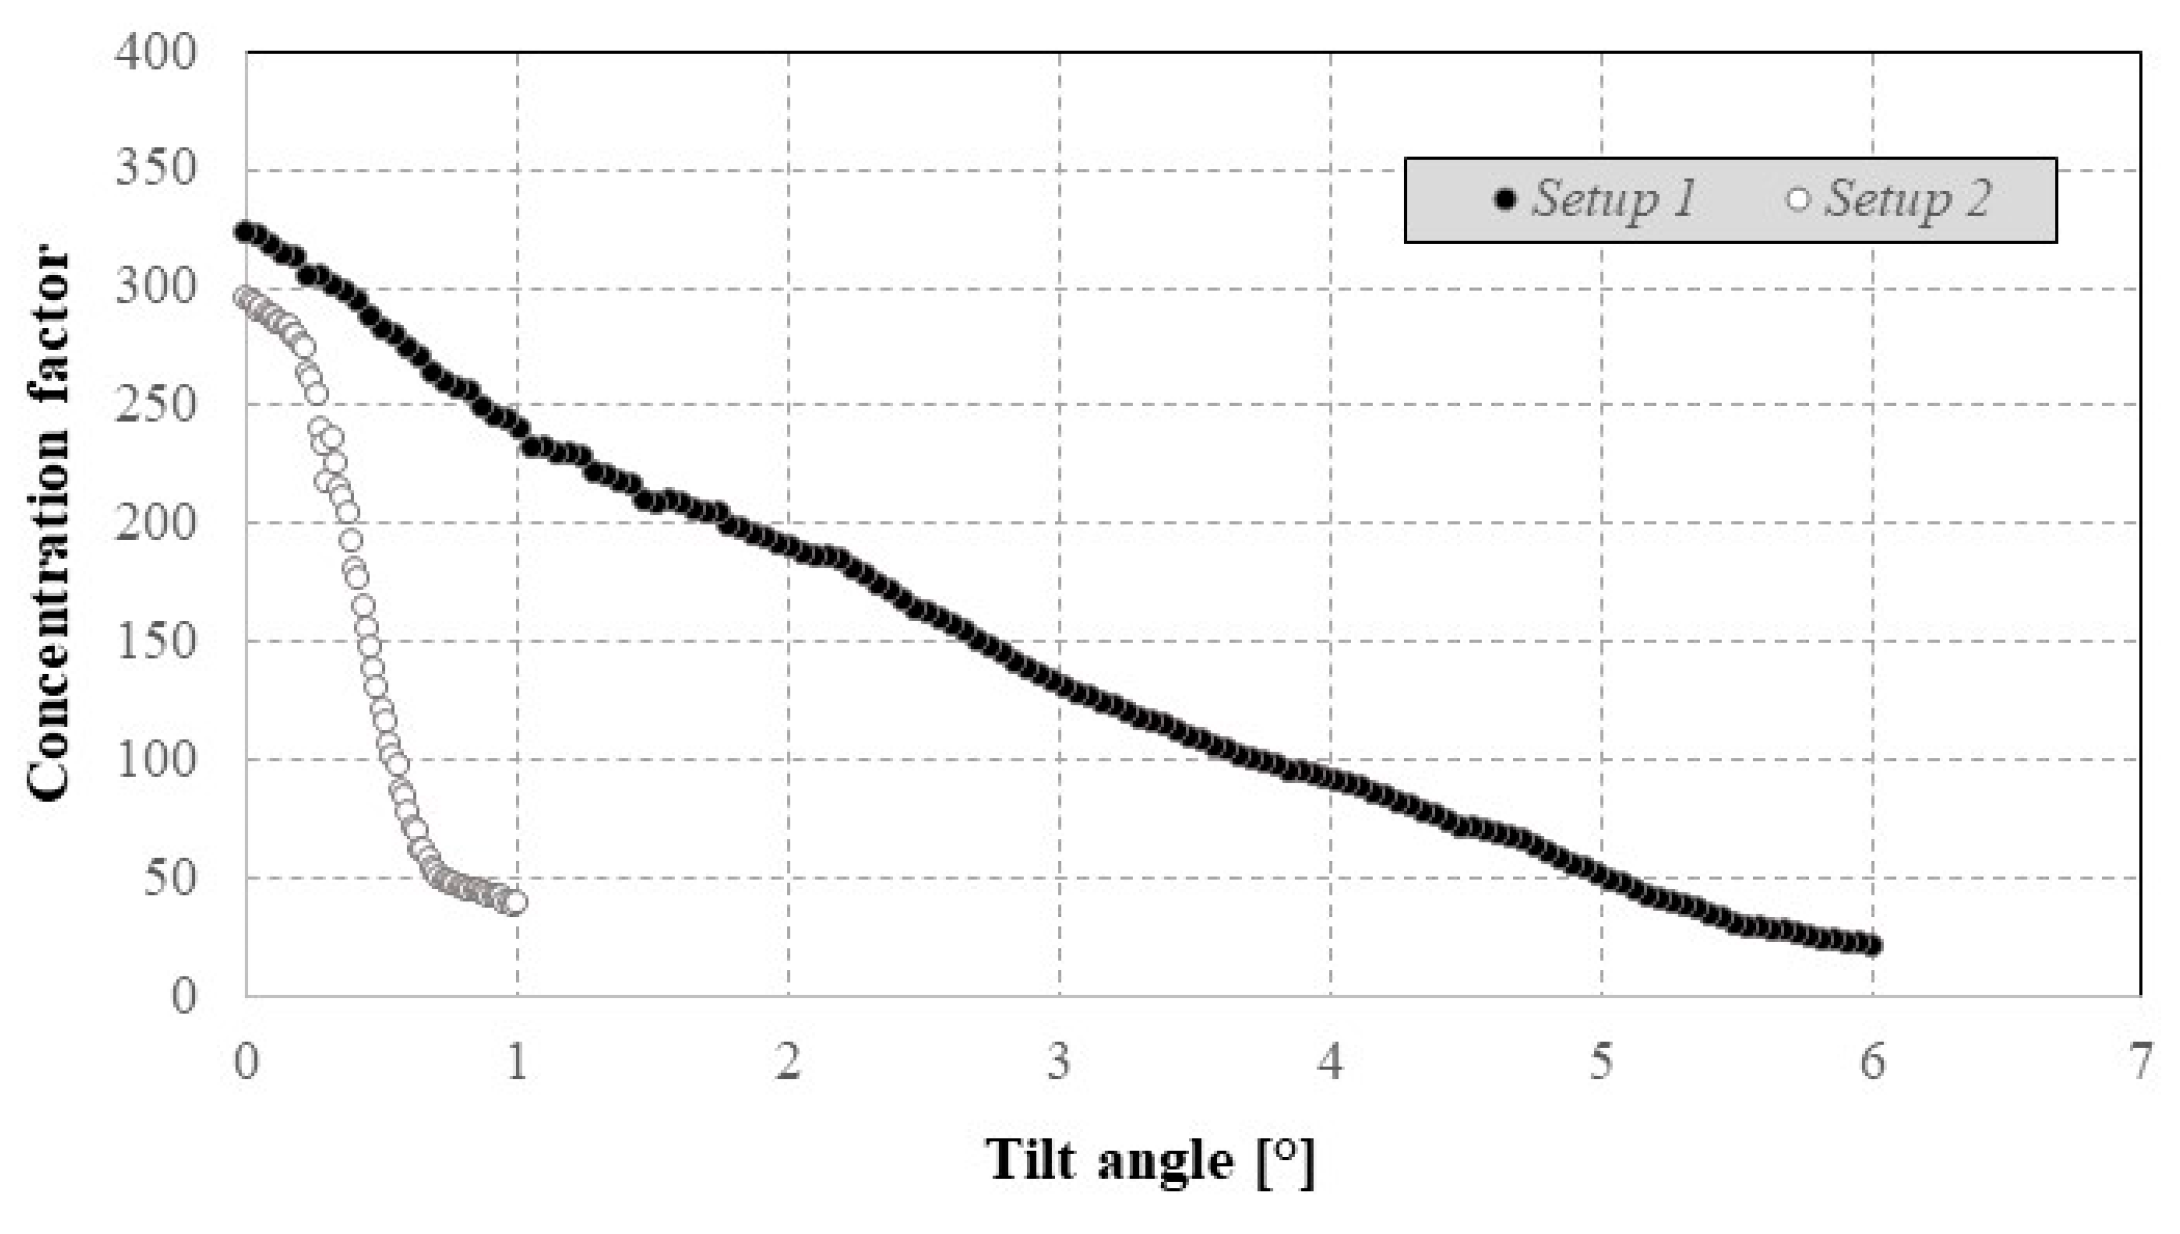
Figure 12. It is possible to observe that the secondary optics guarantees the linear decline in performance with an increase in tracking error over time. The kaleidoscope even allowed a higher acceptance angle to be obtained; in fact, in
Setup 1 the angle is ±0.46°, while in
Setup 2 it is ±0.21°. In
Figure 13, the decrease in C, when the tilt angle misalignment increases, is shown for
Setup 1 and
Setup 2.
5.2. Optical Analysis of CPV System with Cell 2
The CPV system optical performances with the receiver presenting
Cell 2 were evaluated in the setup with only the Fresnel lens; C
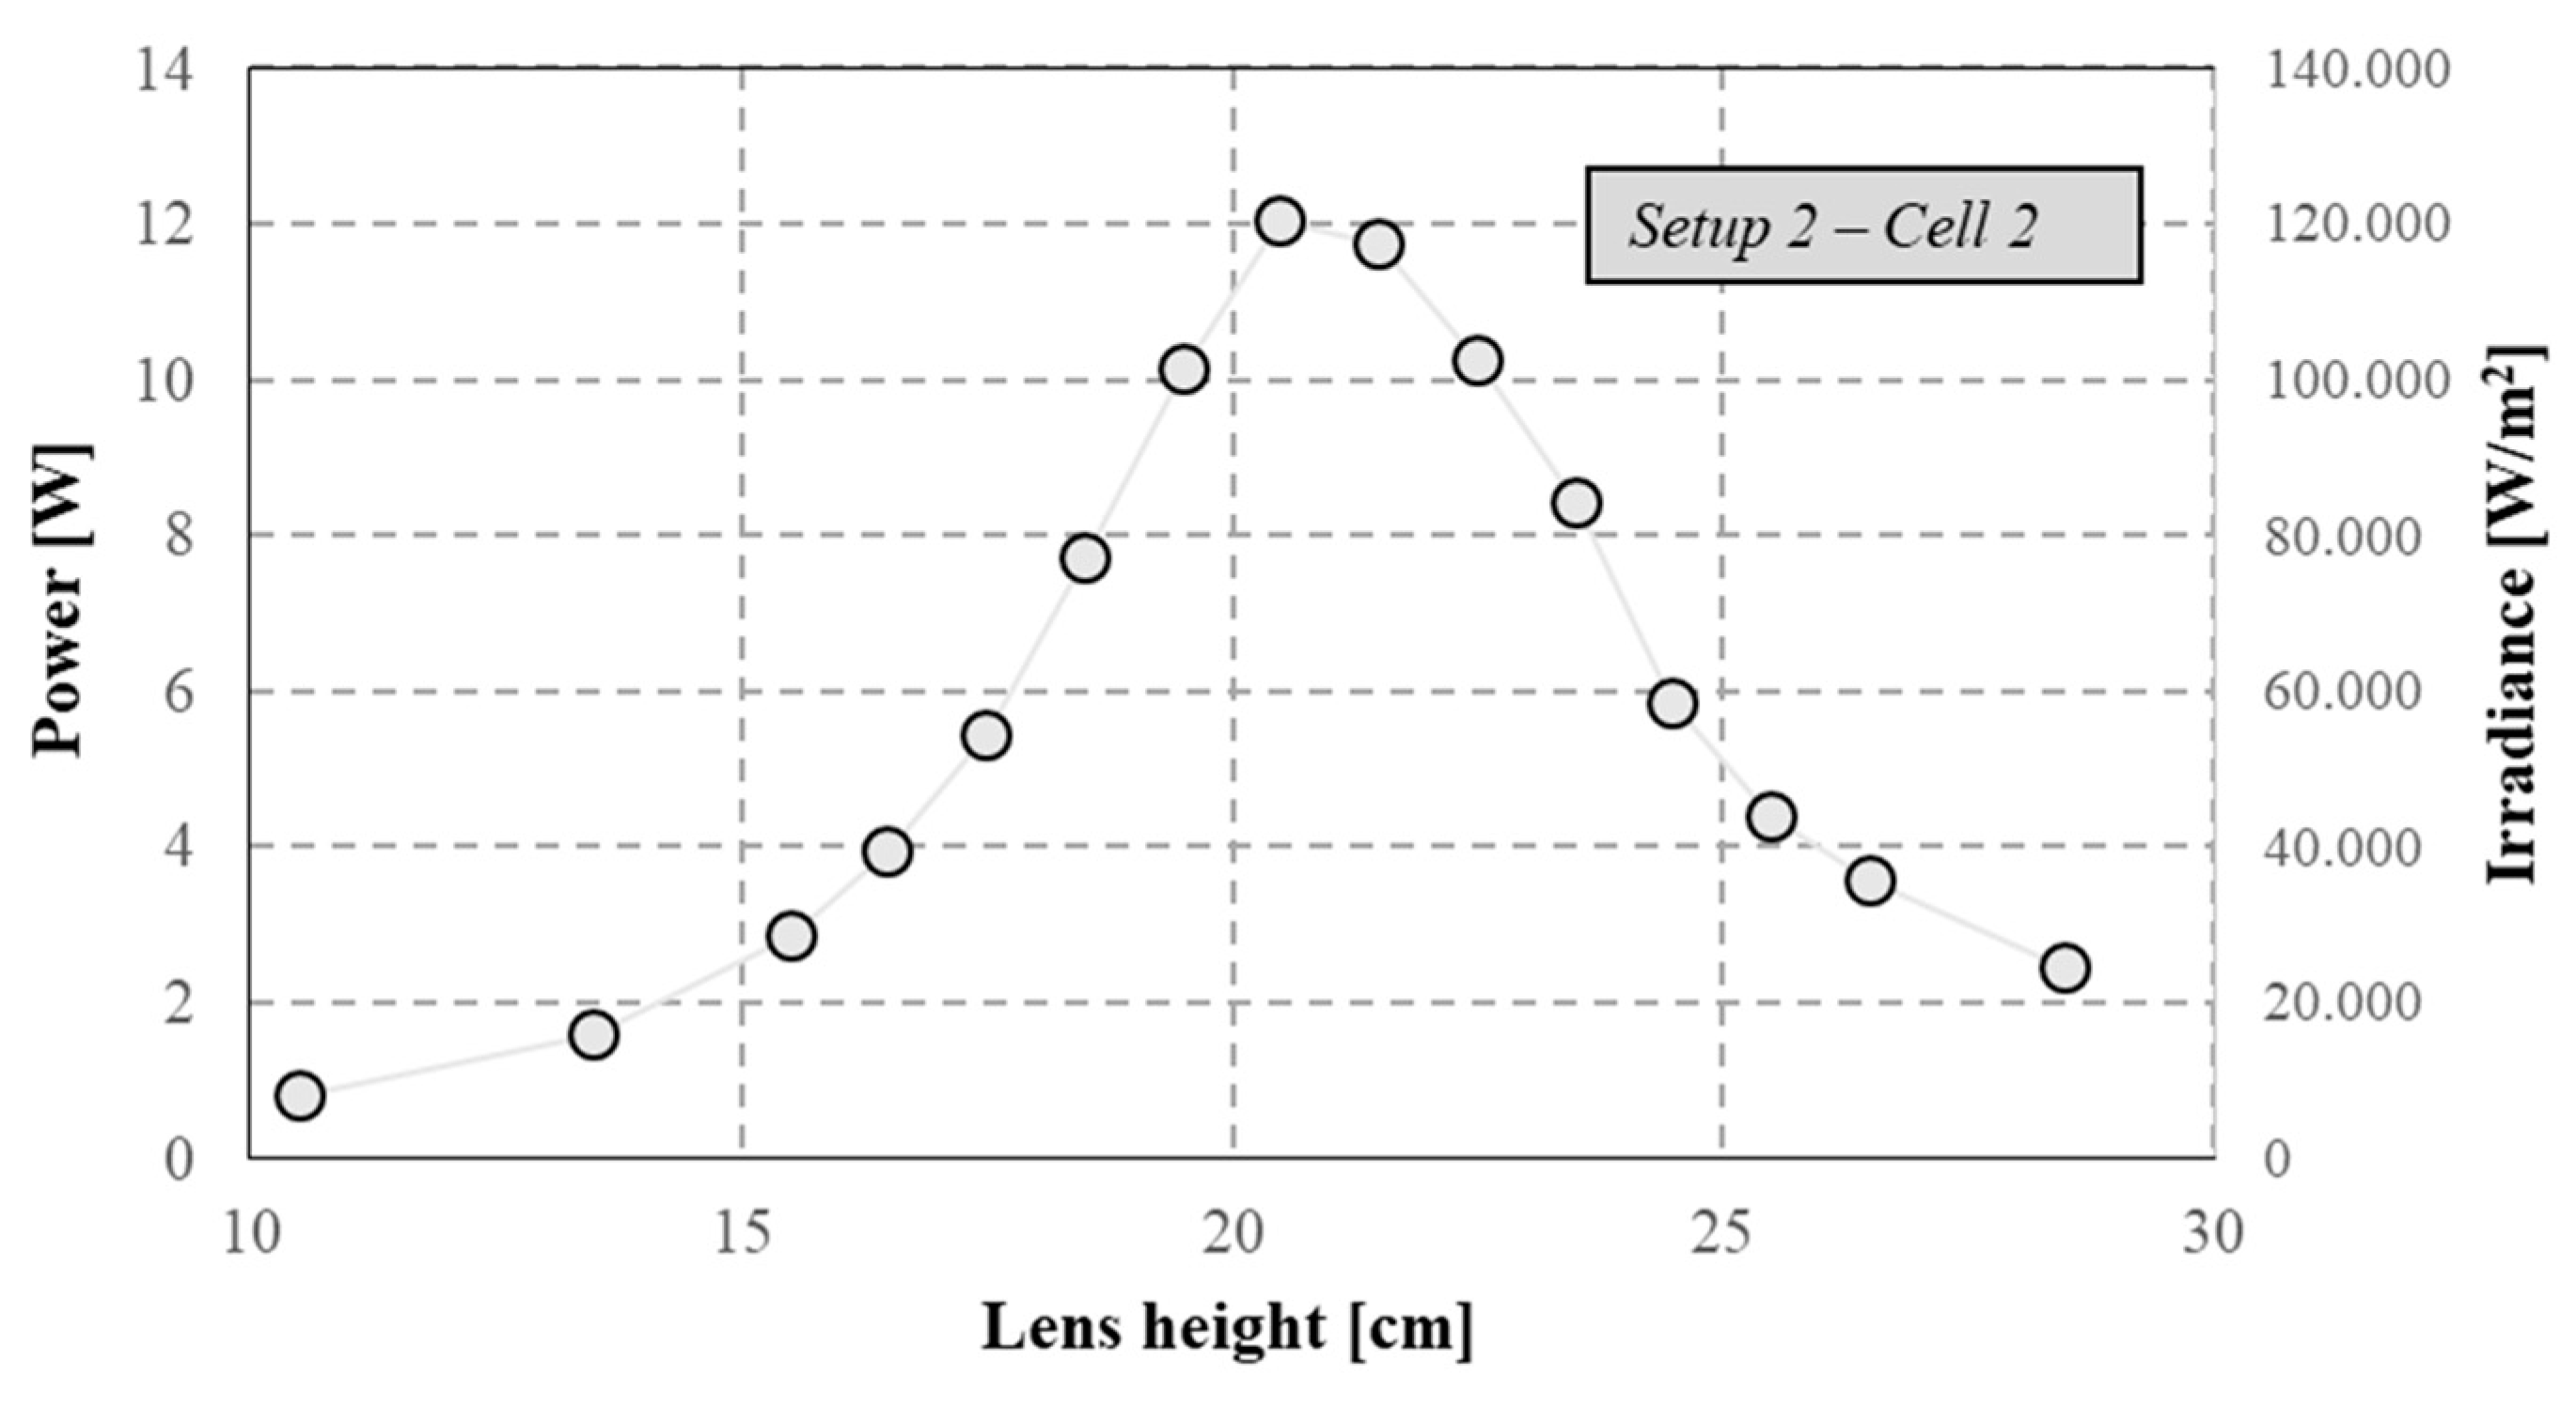
geo was equal to 616. The measured values of concentrated power and irradiance, for different lens heights and when the tracking was correct, are shown in
Figure 14. These measurements allowed the experimental values of η
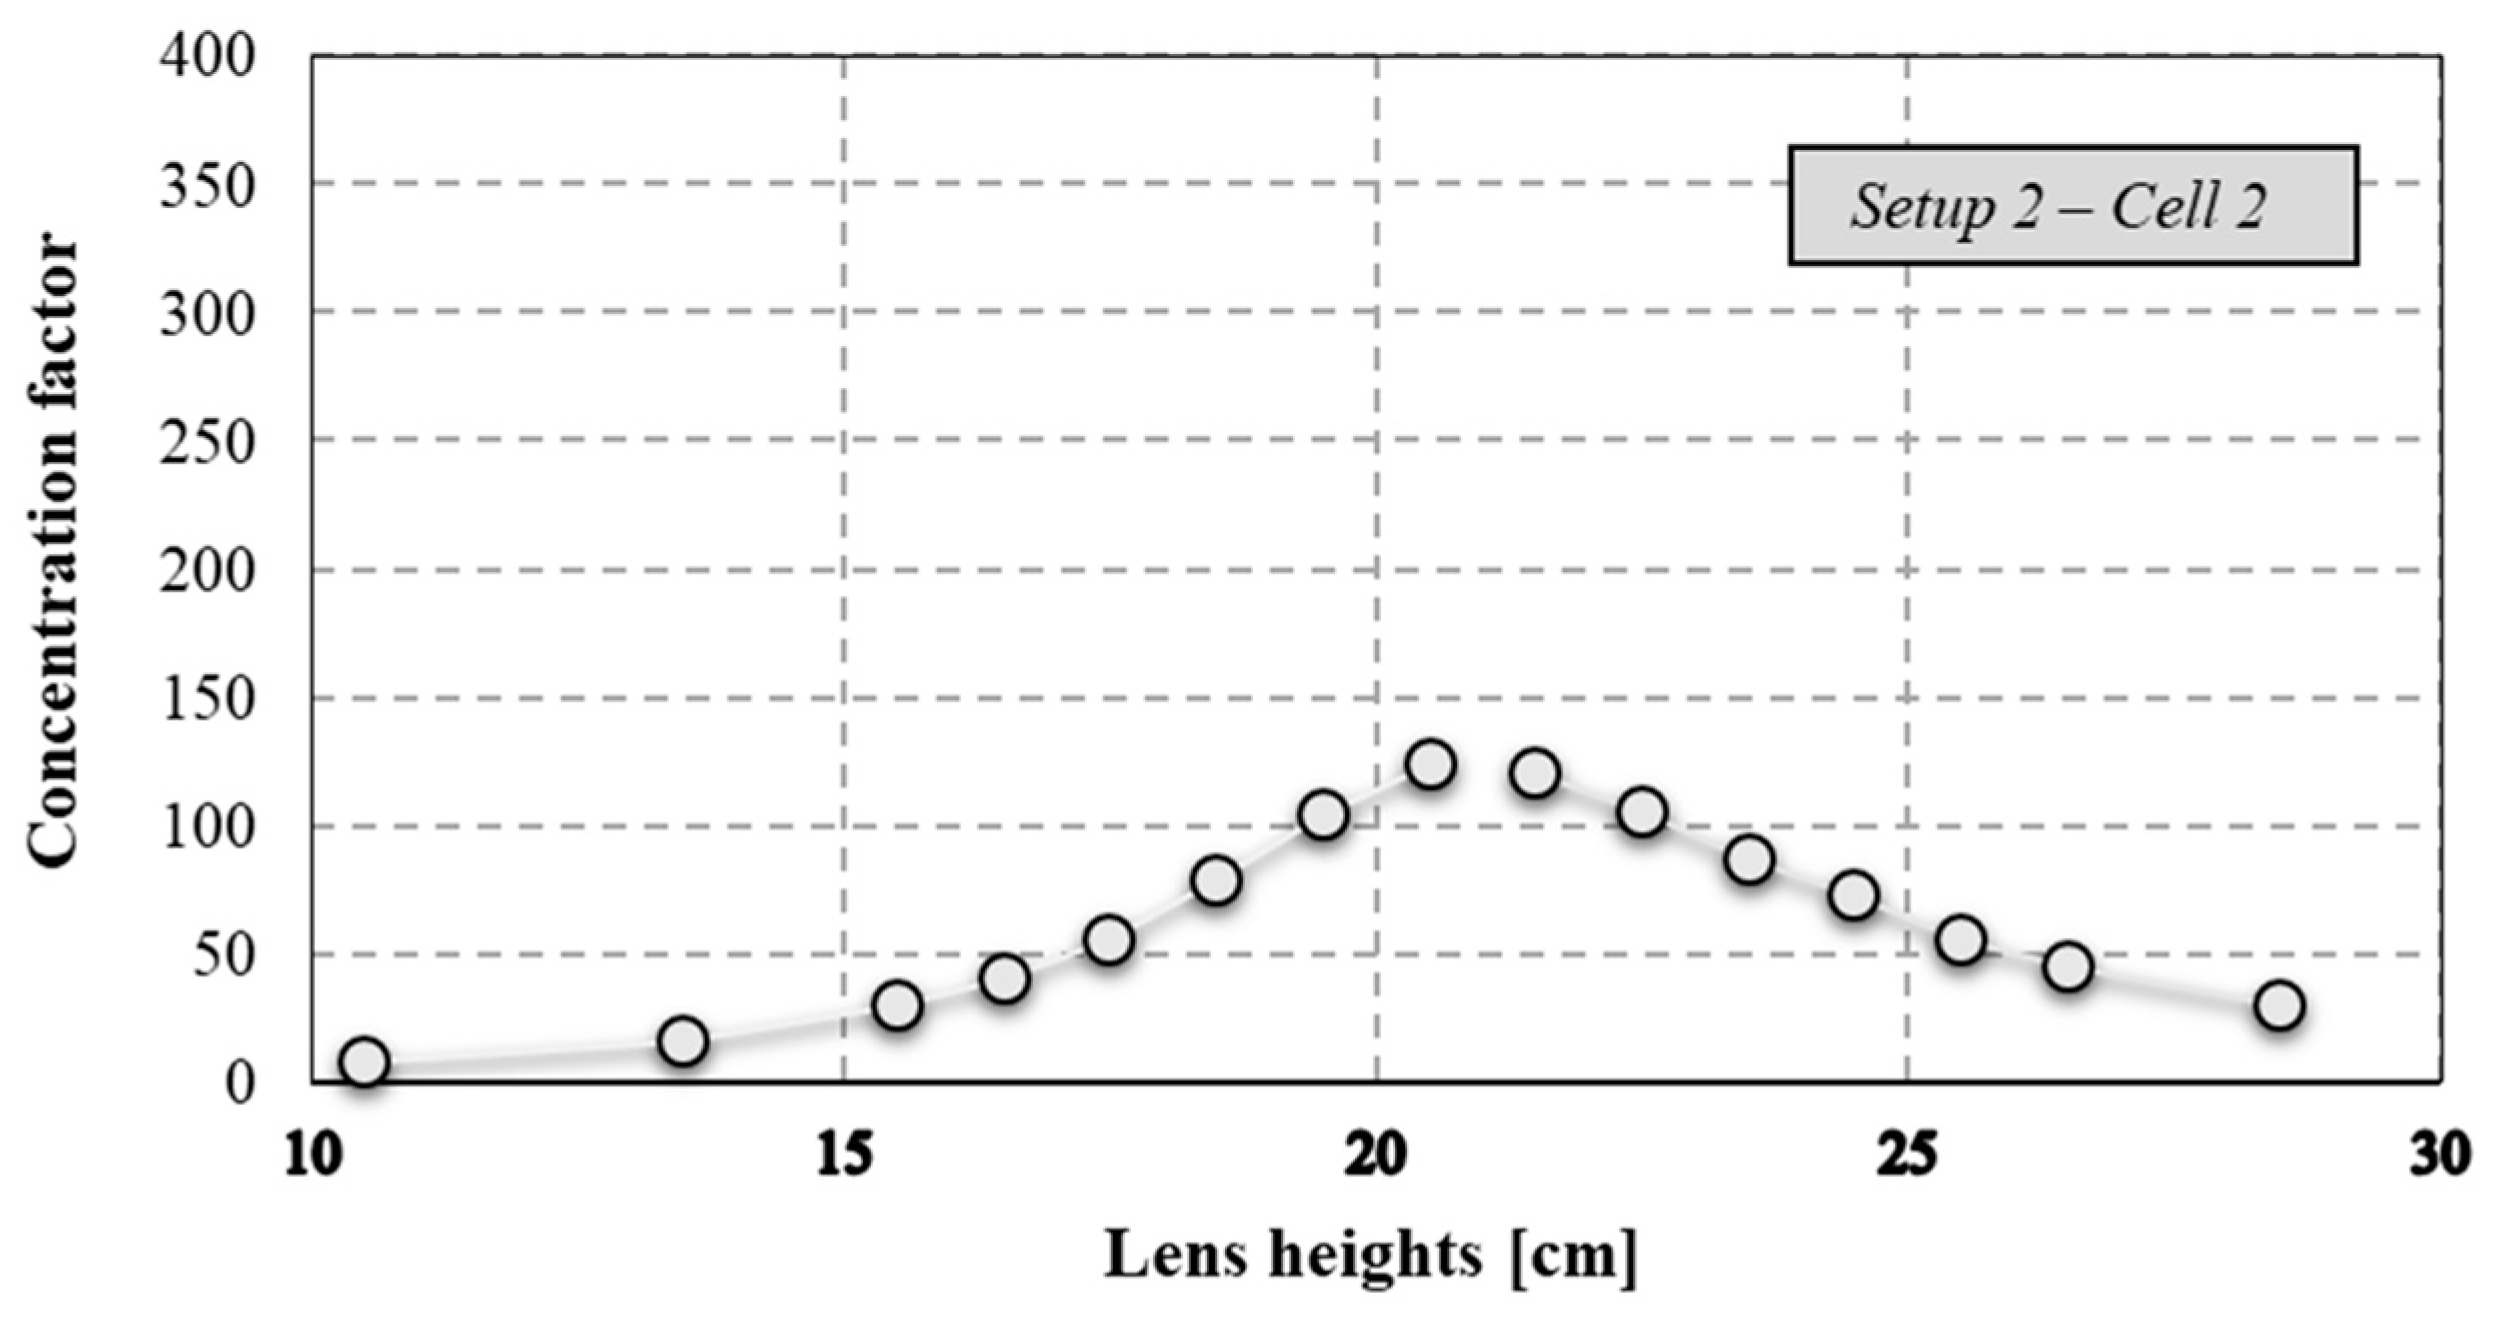
opt and C to be evaluated. Increasing the lens height from 10.5 cm to 20.5 cm resulted in a change in C from 8 to 125; on the contrary, C decreased from 121 to 31 when the height moved from 21.5 cm to 28.5 cm (
Figure 15). In both cases, C presents an exponential trend both below and above the optimal point, with a determination coefficient equal to 0.995. For lens heights below the maximum, the equation is:
For lens heights over the maximum, the equation is:
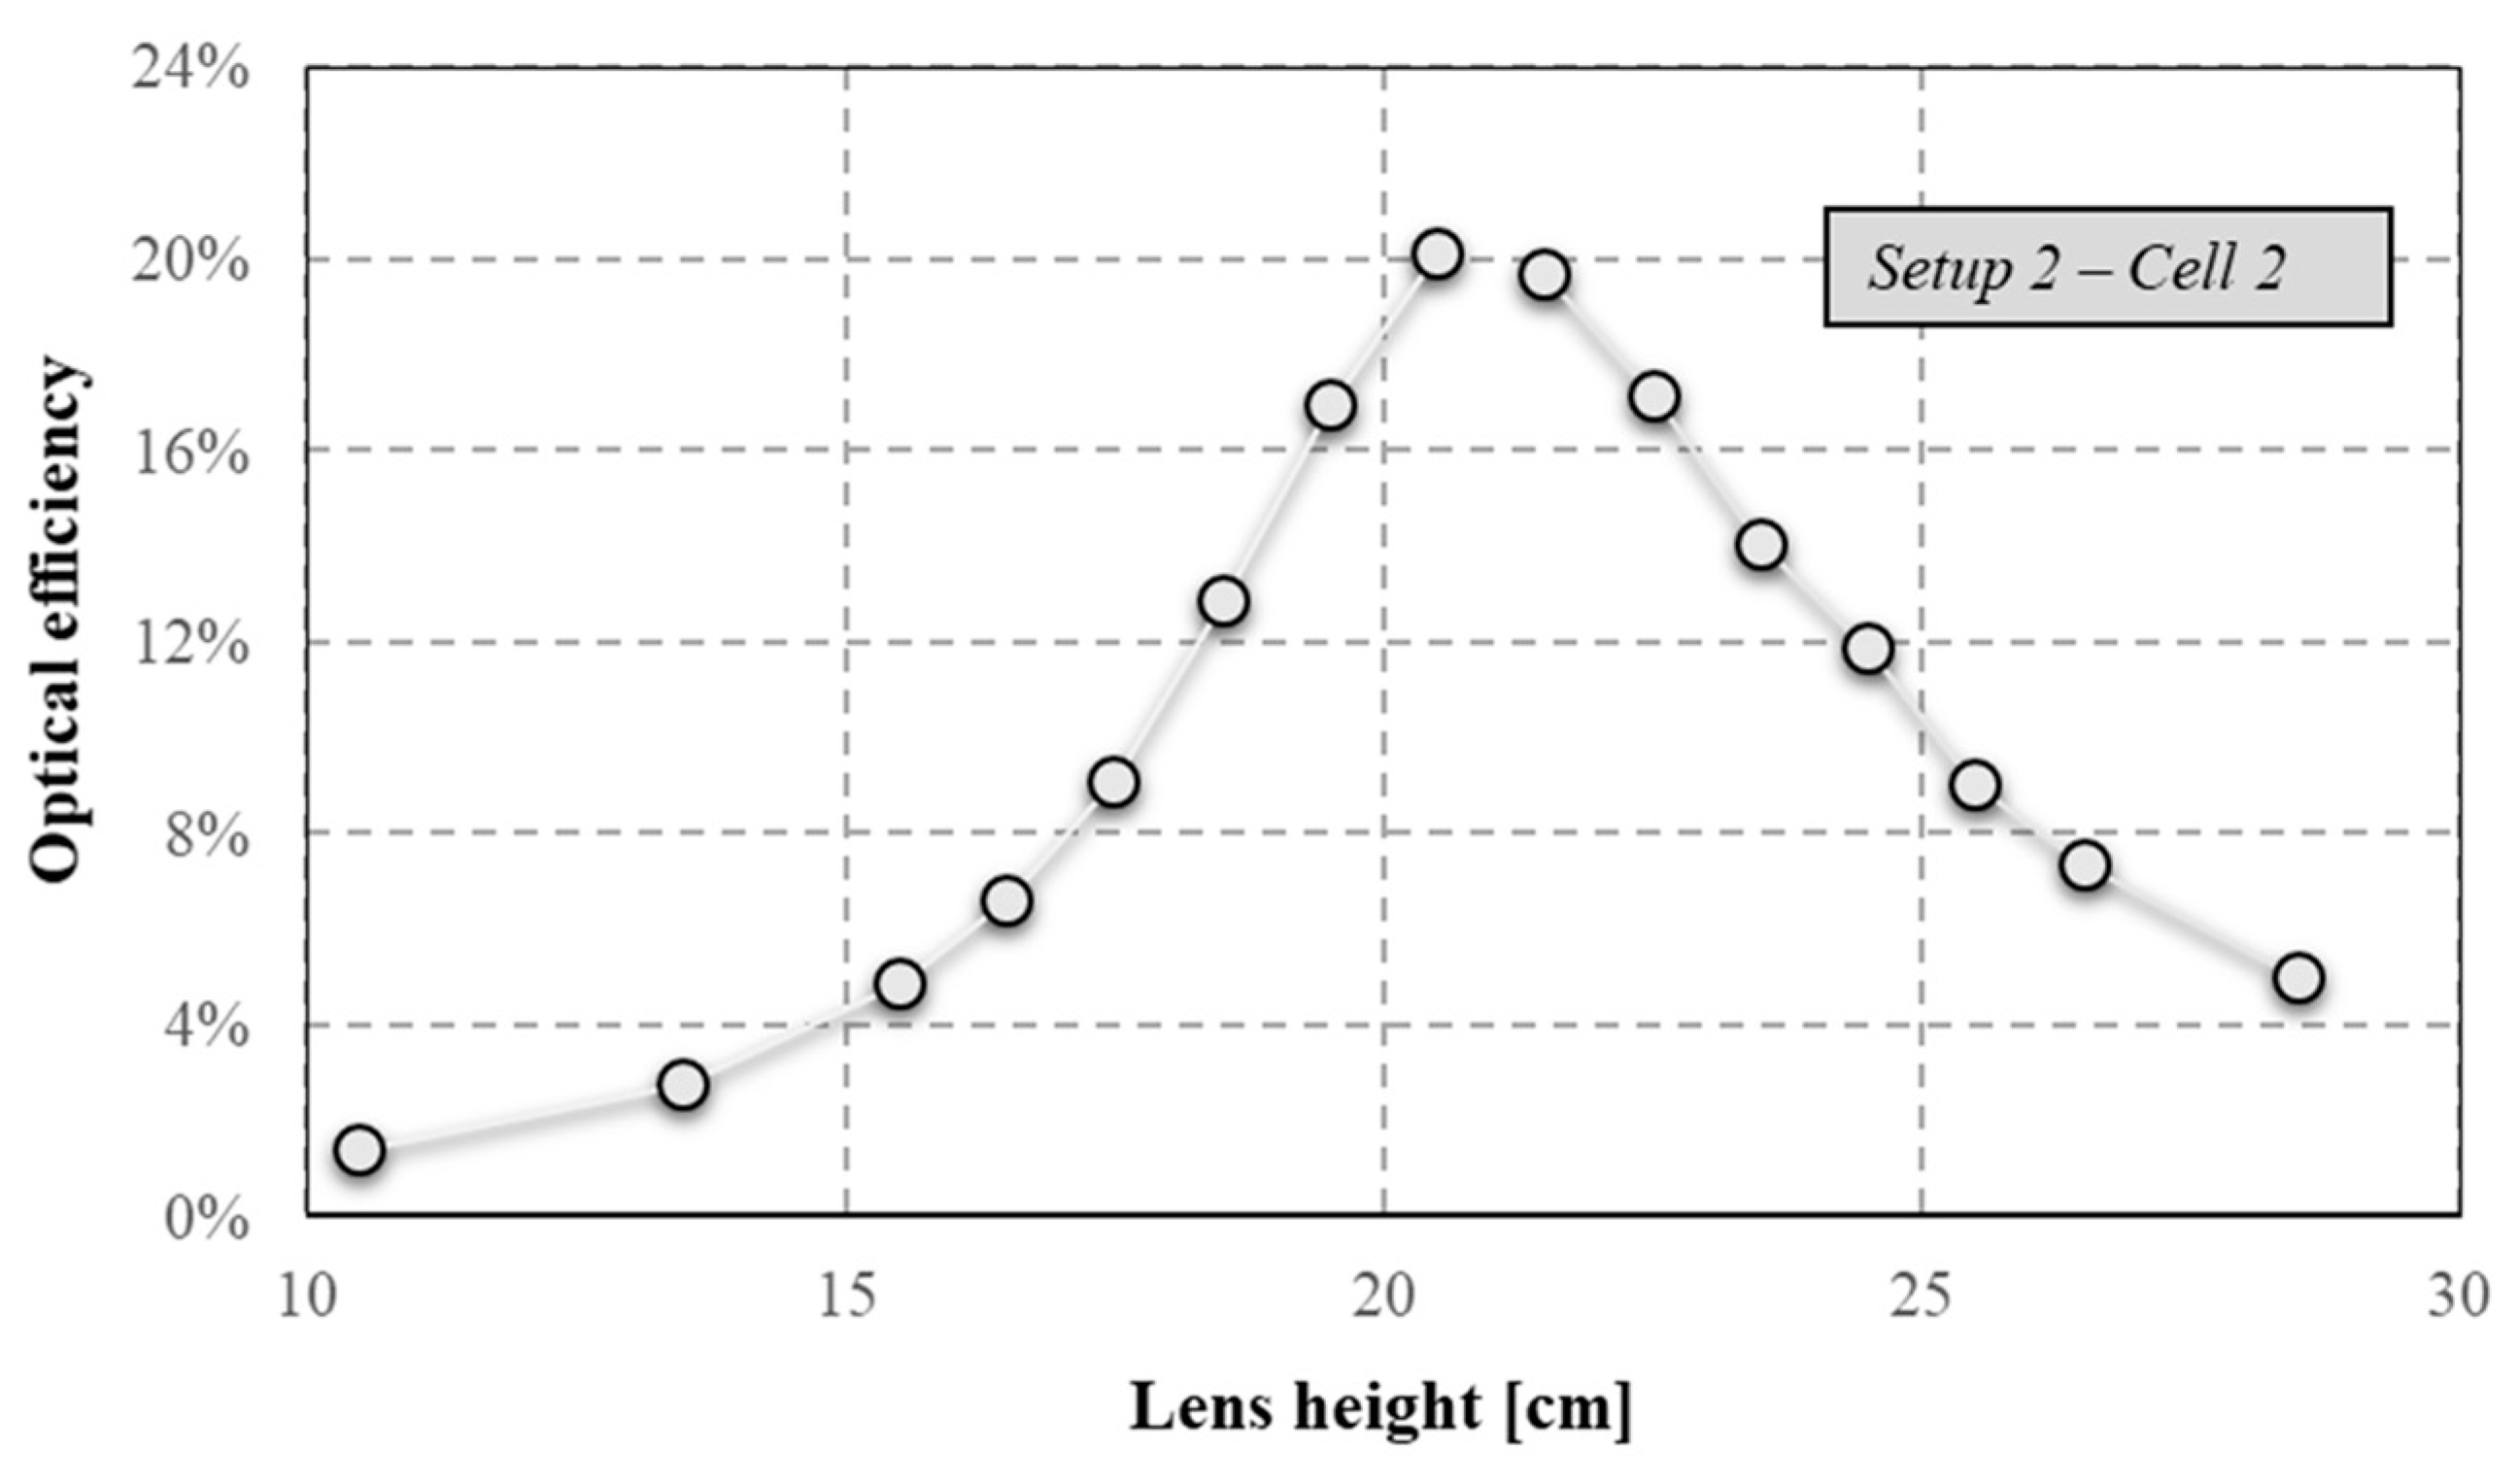
In
Figure 16, the optical efficiency is shown. In the range (10.5–20.5 cm) below the optimal point, the optical efficiency exponentially increased:
A similar trend was found in the range over the maximum (21.5–28.5 cm):
In particular, the optical performance analysis with Cell 2 and only the Fresnel lens has highlighted symmetrical behavior, as noted with the smaller receiver in the same setup. Considering the setup with only the Fresnel lens and using two TJ cells of different sizes, a smaller C value of about 40% was evaluated for Cell 2. On the contrary, in terms of optical efficiency, the CPV system with Cell 2 presented better performances for all the height ranges. Hence, a higher C value does not guarantee the best optical performance and this parameter needs to be always related to the Cgeo.
Finally, the experimental results are reported in
Figure 17, corresponding to the optimal point condition when the tracking is incorrect. The performance decay is slower in comparison with the CPV system with
Cell 1. The acceptance angle experimentally measured is equal to ±0.23°, corresponding to a C value of 112, and it is larger than that evaluated for the same setup and
Cell 1. The
Cell 2 results are more suited to the Fresnel lens dimensions and they result in better optical performances in terms of concentration, acceptance angle and tolerance to tracking errors.
5.3. Comparison between Direct and Indirect Methods
The experimental results of the direct method have been compared with those of the indirect method, adopting the same CPV system and under the same operational conditions. The indirect method, based on the generated photocurrent, adopts the TJ cell as a sensor and is described in [
24], where C values are experimentally evaluated by calculating the short-circuit currents under illumination. In particular, C is calculated by dividing the short-circuit current under concentrated light by the short-circuit current under light concentrated at one sun. In an experimental comparison,
Cell 1 and
Setup 1 have been analyzed. The experimental system allows the Fresnel lens to be moved on the vertical axis and then the focal length is considered as a variable in the characterization process [
28]. The incident direct radiation on the TJ cell can be modified by varying the C value. Adopting the experimental CPV system, the maximum C value can be evaluated by varying the Fresnel lens height. The C values experimentally determined can also be used to define the η
opt values under different conditions. However, the photocurrent increases linearly with irradiance, increasing the concentration, but the constant of proportionality changes with the concentration and temperature variation. Another source of error is represented by photocurrent approximation with the short-circuit current.
It can be deduced from the comparison results, reported in
Figure 18 with the error bar, that the two methods are comparable, and that the indirect method provides an underestimation of optical performances compared to the direct method. In the range of heights below the optimal one, the values calculated with the two methods are close because of the operational conditions. In fact, in this case, the kaleidoscope is globally illuminated and is able to transfer solar irradiance to the receiver with uniform spatial distribution and discrete spectral distribution. On the contrary, for heights above the optimal one, the light spot has a diameter smaller than the kaleidoscope aperture area. In this condition, the secondary optics is malfunctioning as the TJ cell [
29] and the generation of the short-circuit current are lower. The C value is the main parameter in the optical characterization of CPV systems affecting η
opt according to lens height.
Finally, the results obtained by means of the methodology presented in this paper can be adopted for similar point-focus configurations with TJ cells presenting the same dimensions, and when the same values of concentration factor and focal distance are considered.
6. Conclusions
A direct measurement methodology able to evaluate the main optical parameters of CPV systems has been defined in this paper. This procedure allowed us to experimentally determine the concentrated solar flux necessary to calculate parameters such as C and ηopt.
A direct optical characterization in terms of C and ηopt has been realized, adopting different TJ cells and setups of a point-focus CPV system. In particular, experimental curves that can be standardized under the same operational conditions for similar CPV systems have been obtained. The CPV system optical performances have been evaluated in relation to two different TJ solar cells. The lens height of 21 cm represented the optimal position experimentally measured for Cell 1 with Setup 1, and consequently the CPV system presents a maximum C value equal to 315. A lens height of 20.5 cm with a C value equal to 125 represented the maximum for Cell 2 and the same setup. As for ηopt, it was possible to observe the same trend by varying the lens height. The best optical performances were obtained when all the concentrated solar irradiance reached the receiver and the kaleidoscope was adopted. Referring to the setup with only the Fresnel lens and adopting TJ cells with different sizes, a smaller C value of about 40% was obtained. The CPV system with the greater TJ cell reported better performances in terms of ηopt for the whole range of heights. It can be deduced that a higher C value, obtained by the smaller Cell 1, does not ensure the highest optical performances linked also to the Cgeo value.
Finally, the results obtained by the methodology presented in this paper can be adopted for similar point-focus configurations when the same ranges of concentration factor and focal distance values are considered, and TJ cells presenting the same dimensions are chosen.
