Article

Adaptive Equivalent Factor-Based Energy Management Strategy for Plug-In Hybrid Electric Buses Considering Passenger Load Variations

School of Vehicle and Energy, Yanshan University, Qinhuangdao 066000, China
*
Author to whom correspondence should be addressed.
Energies 2024, 17(6), 1283; https://doi.org/10.3390/en17061283
Submission received: 19 January 2024 / Revised: 29 February 2024 / Accepted: 5 March 2024 / Published: 7 March 2024
(This article belongs to the Section F: Electrical Engineering)

Abstract

:
Energy management strategies (EMSs) are one of the key technologies for the development of plug-in hybrid electric buses (PHEBs). This paper addresses the issue of optimal energy distribution for PHEBs under significant variations in passenger load at different bus stations, which cannot be solved by a single equivalent factor equivalent fuel consumption minimization energy management strategy (ECMS). An adaptive equivalent factor equivalent fuel consumption minimization energy management strategy (A-ECMS) considering passenger load is proposed. First, the powertrain system of the PHEB is modeled, and the accuracy of the model is verified in a simulation environment. Then, the reference SOC descent trajectory of the battery is obtained using a dynamic programming (DP) algorithm, the recursive least squares (RLS) method is employed to identify the passenger load, and the influence of different loads on the state of charge (SOC) trajectory under a single equivalent factor is analyzed. Finally, a genetic algorithm (GA) is used to establish the correspondence between passenger load, bus station, and equivalent factor, enabling the actual SOC to follow the reference SOC descent trajectory, thereby achieving optimal energy distribution. Simulation results demonstrate that the A-ECMS reduces fuel consumption of the PHEB per 100 km by 2.59% and 10.10% compared to the ECMS and rule-based EMS, respectively, validating the effectiveness of the proposed strategy.

1. Introduction

1.1. PHEB Energy Management Strategy

With the gradual depletion of energy resources, the improvement of energy utilization has received attention from various industries [1]. In the automotive field, the ownership and annual production of internal combustion engine vehicles are growing rapidly worldwide, which leads to increasingly serious problems such as an energy crisis and urban air pollution [2]. Pure electric vehicles (EVs) are constrained by the current technology of power batteries and inadequate infrastructure, which greatly troubles consumers in terms of driving range and charging time [3]. Plug-in hybrid electric vehicles (PHEVs) combine the advantages of traditional hybrid vehicles (HEVs) and EVs. Compared to HEVs, PHEVs have a greater power battery capacity, longer driving range in pure electric mode, and can be charged via external power grids, offering better fuel economy and emission performance [4]. PHEVs have become a transitional choice for the widespread transition from fuel vehicles to EVs.
PHEVs use a nonlinear, multivariable, and time-varying complex system with powerplants that typically consist of an engine, motor, battery, etc. [5]. As a key technology for PHEVs, the EMS is aimed at deciding the optimal vehicle operating mode and torque distribution among various power sources, while meeting vehicle power demands, in order to enhance overall fuel economy and achieve energy conservation and emission reduction goals [6]. EMSs can be broadly categorized into rule-based and optimization-based approaches. Rule-based strategies are easy to implement with lower computational complexity but heavily rely on engineering experience and exhibit poor adaptability, thus failing to guarantee the vehicle’s optimal fuel economy [7]. Optimization-based strategies can be further divided into global and instantaneous optimization EMSs [8]. While global optimization strategies can theoretically achieve optimal control, they are impractical for online application due to the unpredictable driving conditions and high computational load during actual vehicle operation. As a result, the optimal results obtained from global optimization are often used as benchmarks for evaluating other EMS [9].
Rule-based energy management strategies determine the energy distribution of vehicles in different driving states by formulating different decision rules, mainly divided into two categories: deterministic rules and fuzzy rules [10]. Khayyam et al. [11] proposed a rule-based energy management strategy based on CD-CS (battery charge–depletion/battery charge–sustain). The SOC curve is divided into CD and CS zones. In the CD zone, the motor primarily operates with engine assistance, while in the CS zone, the engine primarily operates with electric motor assistance to achieve improved fuel economy. The energy management strategy based on CD-CS has become one of the most mature energy management strategies. The energy management strategy based on fuzzy rules is founded on fuzzy control theory. It typically takes parameters such as SOC, total vehicle power demand, and vehicle speed as inputs for the fuzzy controller, and then uses the fuzzy rules within the controller to conduct fuzzy inference and make appropriate energy allocations [12]. Won et al. [13] subdivided the operating modes of parallel hybrid electric vehicles, summarized historical data on energy distribution under different operating modes, designed fuzzy control rules for vehicle’s different operating modes, and validated the effectiveness of the designed rules using the FTP75 driving cycle. Ming et al. [14] used a fuzzy control rule strategy to improve the issue of rapid SOC decline during the CD phase in the CD-CS rule-based control strategy. Simulation results indicate that the fuzzy rule-based control strategy not only improves fuel economy but also extends the CD phase by 4.5%.
The instantaneous optimization method of model predictive control is also known as rolling or receding horizon control, consisting specifically of predictive models, rolling optimization, and feedback correction [15]. The predictive model specifically refers to predicting the system’s future dynamic behavior based on its historical and current information, providing the data foundation for the next optimization step; rolling optimization involves optimizing the control sequence using the predicted values within a finite future time horizon obtained from the predictive model; and feedback correction specifically refers to applying the first value of the optimized control sequence to the system and feeding back the system’s output value to the predictive model in order to correct the predicted values [16]. Chen et al. [17] proposed a model predictive control energy management strategy for intelligent connected hybrid electric vehicles using a neural network optimized by a particle swarm algorithm as the predictive model and sequential quadratic programming as the optimization algorithm. They separately developed model predictive control energy management strategies for single-vehicle driving scenarios and following-vehicle driving scenarios and finally validated the effectiveness of the proposed energy management strategy through simulation experiments.
The ECMS is a typical instantaneous optimization-based EMS derived from Pontryagin’s minimum principle (PMP). It utilizes equivalent factors to convert electrical energy consumption into equivalent fuel consumption and determines the optimal power distribution at each moment by optimizing instantaneous equivalent fuel consumption [18,19]. G. Paganelli et al. [20] first proposed an ECMS and applied it to the energy management problem of hybrid power systems. With further research, it was found that a single fixed equivalent factor ECMS is only applicable to specific driving conditions. Faced with the complex and varied driving conditions in reality, the fixed equivalent factor-based ECMS cannot achieve the desired fuel economy. Therefore, the application of an adaptive equivalent factor ECMS has emerged [21]. Zhang et al. [22], considering that a fixed equivalent factor ECMS cannot meet the fuel economy requirements of a PHEV, used a genetic algorithm to study the optimal equivalent factors corresponding to different initial SOCs and driving distances and developed a driving distance–SOC–equivalent factor mapping to meet power distribution under different driving conditions. Hou et al. [23] proposed an adaptive ECMS for the engine to operate in the high-efficiency region by using intelligent traffic systems to obtain future vehicle speed sequences, from which the overall power demand was derived. Sun et al. [24] combined a neural network-based vehicle speed prediction model with adaptive ECMS to adjust the equivalent factor by predicting changes in driving behavior, ensuring the fuel economy and stable SOC trajectory of the PHEV. Tian et al. [25] proposed an adaptive ECMS based on driving cycle recognition, establishing the correspondence between different driving cycles and equivalent factors to optimize energy distribution by identifying the corresponding equivalent factors for each recognized driving cycle.
The DP algorithm, as a representative global optimization algorithm, has been widely applied in solving energy management problems. Lin et al. [26] established two optimization models, one with fuel consumption as a constraint and the other with both fuel consumption and emissions as constraints. They used DP to solve these models, demonstrating the effectiveness and feasibility of the DP algorithm in solving energy management problems. Patil et al. [27] proposed an energy management strategy for series plug-in hybrid electric vehicles based on DP, balancing the vehicles’ use of grid charging and energy distribution during vehicle operation.
Compared to PHEVs, PHEBs have characteristics such as fixed driving routes, fixed bus stations, and significant variations in passenger numbers, providing new insights for the development of EMSs for PHEBs [28]. Yang et al. [29] divided the PHEB driving cycles into multiple segments based on the bus stations and used the particle swarm algorithm to optimize different bus stations and initial SOC values, establishing a mapping of the initial SOC–bus station–equivalent factor. Jiao et al. [30] established control grid points for typical urban bus routes and derived decision variables at grid points based on historical driving cycle information using DP, achieving global energy distribution for PHEBs. Zheng et al. [31], based on the driving characteristics of buses, calculated real-time power distribution schemes based on PMP using bus dwell time and developed an adaptive EMS for fuel cell hybrid electric buses that can be applied in real time. Li et al. [32] used vehicle historical information to predict the speed and passenger numbers of PHEBs using deep neural networks (DNNs) and proposed a prediction-based EMS using deep learning, analyzing the impact of passenger numbers on the overall vehicle fuel economy. Yan et al. [33] used a Markov chain model to predict future passenger numbers for pure electric buses and developed an EMS combined with model predictive control algorithms to achieve better economic performance. He et al. [34] established a sample database of passenger numbers for typical bus routes, used Monte Carlo methods and radial basis function neural networks to predict passenger numbers, and applied them to the air conditioning energy management of pure electric buses to reduce overall energy consumption.
Through research on a large number of studies related to adaptive ECMS for PHEBs, it has been found that most authors select factors such as driver’s driving style, initial SOC of the battery, bus travel distance, and driving cycles as the criteria for equivalent factors. In reality, urban buses have the characteristic of passengers boarding and deboarding at fixed bus stations, leading to variations in the bus’s mass between stations. The dynamic changes in the entire vehicle mass of PHEBs caused by the varying passenger numbers at different bus stations have a significant impact on energy distribution and exhaust emissions. Therefore, we propose an adaptive ECMS that takes into account the variation in passenger load.

1.2. Electric Bus Charging Technology

Charging technology, as one of the core technologies for electric buses, is an important research area that requires our attention. Electric bus charging technology refers to the techniques used to replenish the energy of the batteries or other on-board energy storage systems in electric buses. Existing electric bus charging technologies can be categorized into wired charging and wireless charging [35].
Wired charging refers to a charging technology in which the electric bus is physically connected to the power supply equipment via charging cables during the charging process, and the connection is disconnected when the charging is completed. Based on the speed of charging, it can be divided into a conventional charging mode and a fast charging mode. The conventional charging mode, also known as “slow charging”, mainly uses AC charging stations to charge the batteries, with lower charging currents and longer charging times. This charging mode has a relatively minor impact on battery life but exhibits low charging efficiency. The fast charging mode, also known as “rapid charging”, primarily involves using high-current DC charging stations to charge the on-board batteries. For electric buses, the fast charging mode allows the rapid replenishment of the battery during idle times at the terminal station after completing a single trip, preparing the bus for continued passenger service. This effectively shortens the charging time for electric buses and contributes to the efficient operation of electric bus routes. While the fast charging mode reduces charging time to a certain extent, the use of higher charging currents can have a significant impact on battery life [36].
Wireless charging technology primarily refers to the technique of using buried transmitting coils beneath the road surface to generate a high-frequency alternating magnetic field, thereby enabling the charging of on-board energy storage systems through receiving coils installed on vehicles. Based on the movement status of electric vehicles during charging, wireless charging can be further categorized into static wireless charging (SWC) and dynamic wireless charging (DWC). SWC technology involves charging stationary vehicles on the ground using transmitting coils installed beneath the surface. DWC technology, on the other hand, refers to the process of transferring electrical energy to the on-board energy storage systems of moving vehicles via high-frequency alternating magnetic fields from power supply rails buried beneath the road surface, allowing for charging while the vehicles are in motion [37]. Vehicles utilizing wireless charging technology do not require any physical connections, thus avoiding issues such as line aging and mechanical wear that occur during wired charging, as well as the generation of electrical sparks due to friction [38]. At present, wireless charging technology is still in the experimental research stage. Research institutions in countries such as China, the United States, Sweden, and Israel are dedicated to the study of wireless charging technology [39,40,41,42].
Electric vehicle charging management strategies are also a key area of research. Their primary objective is to plan the entire charging process for electric vehicles, eliminating the negative impacts of uncontrolled charging by a large number of electric vehicles and promoting the sustainable development of electric vehicles [43]. The implementation of charging management strategies mainly involves three steps. Firstly, it entails modeling and forecasting the charging load for electric vehicles. Subsequently, based on the forecasting results, it involves planning the siting of charging stations and the allocation of the number of charging piles. Finally, after the construction of charging facilities such as charging stations, it involves guiding the electric vehicles for charging, providing path planning schemes that align with expectations [44,45,46].
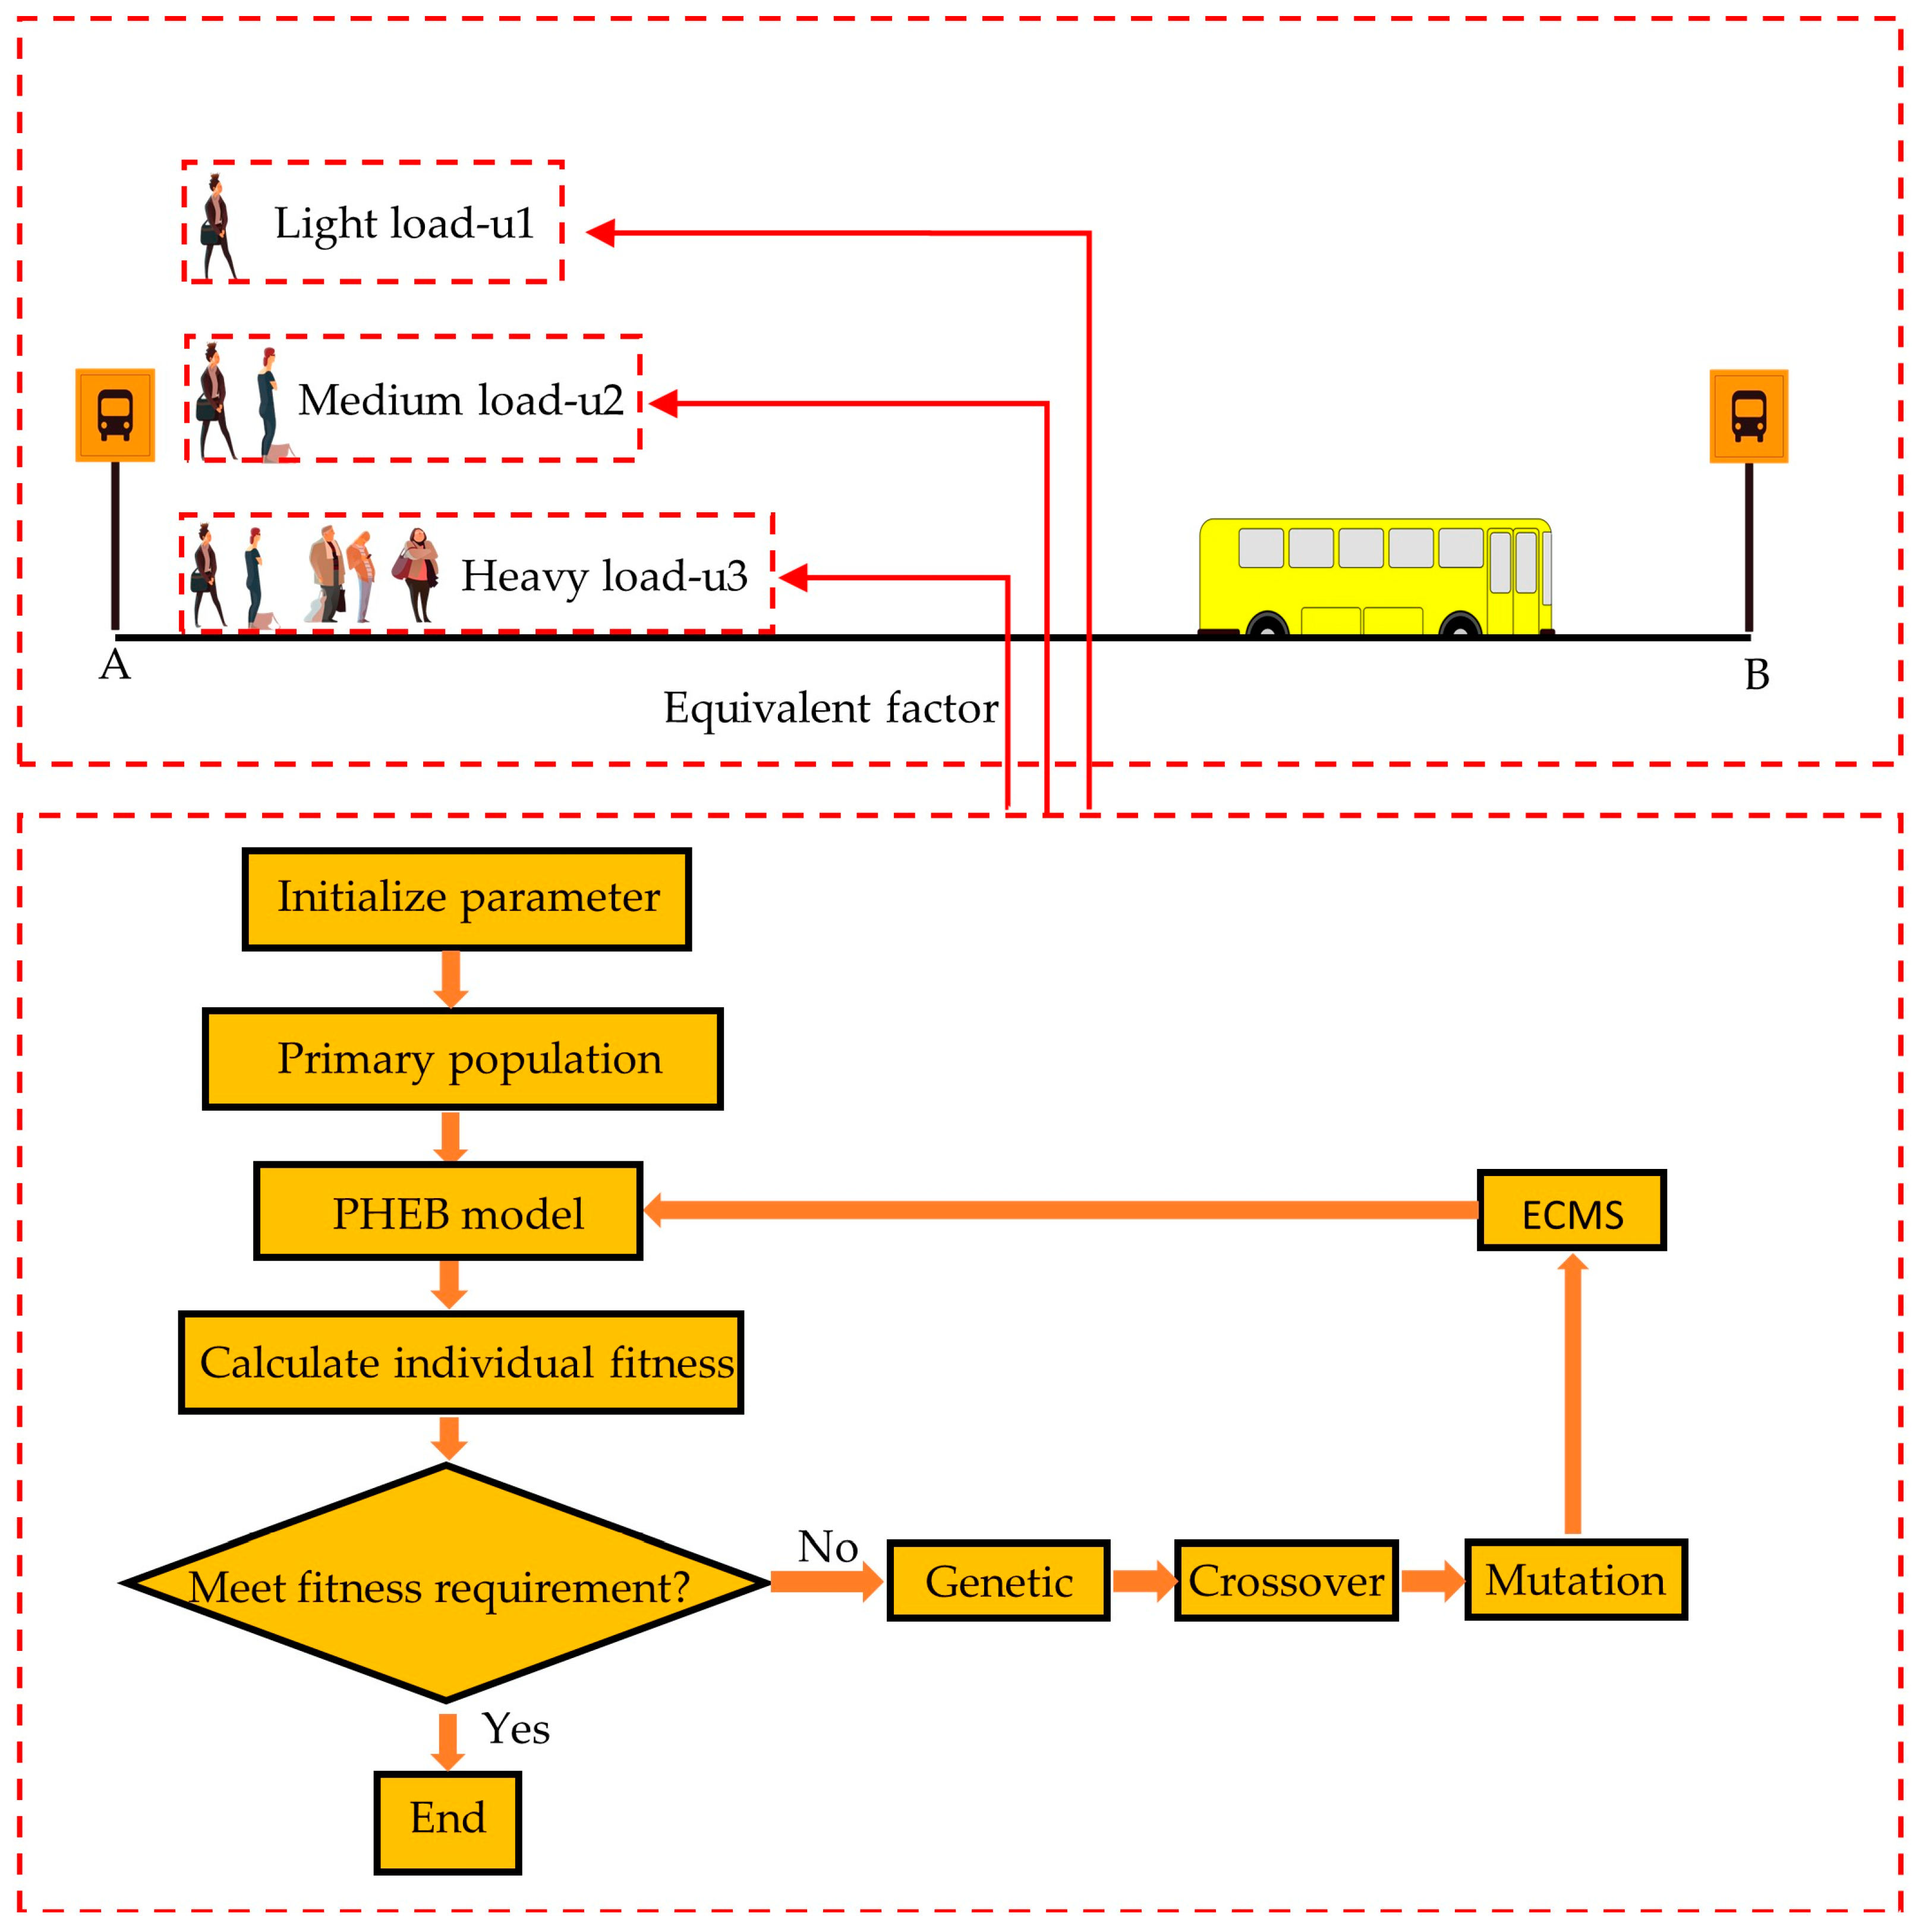
In the second section of this paper, a PHEB model is established based on the dynamic equations of various components of PHEBs, and the correctness of the model was verified. Subsequently, in the third section, DP, RLS load identification, ECMS, GA, and other algorithms are introduced. The fourth chapter presents the simulation results of the various algorithms and discusses the outcomes. Finally, the conclusion section of the article analyzes the innovation of the proposed A-ECMS considering passenger load variations and provides prospects for its future application. Figure 1 shows the interrelationships among the algorithms used in the article. Specifically, DP, RLS load identification, and GA are used as offline algorithms to build a passenger load–bus station equivalent factor map that can be utilized online. The ECMS serves as an online algorithm and can obtain the optimal equivalent factor for the current driving conditions by table lookup, thereby obtaining the best energy distribution scheme.

2. Modeling of the Powertrain System for PHEBs

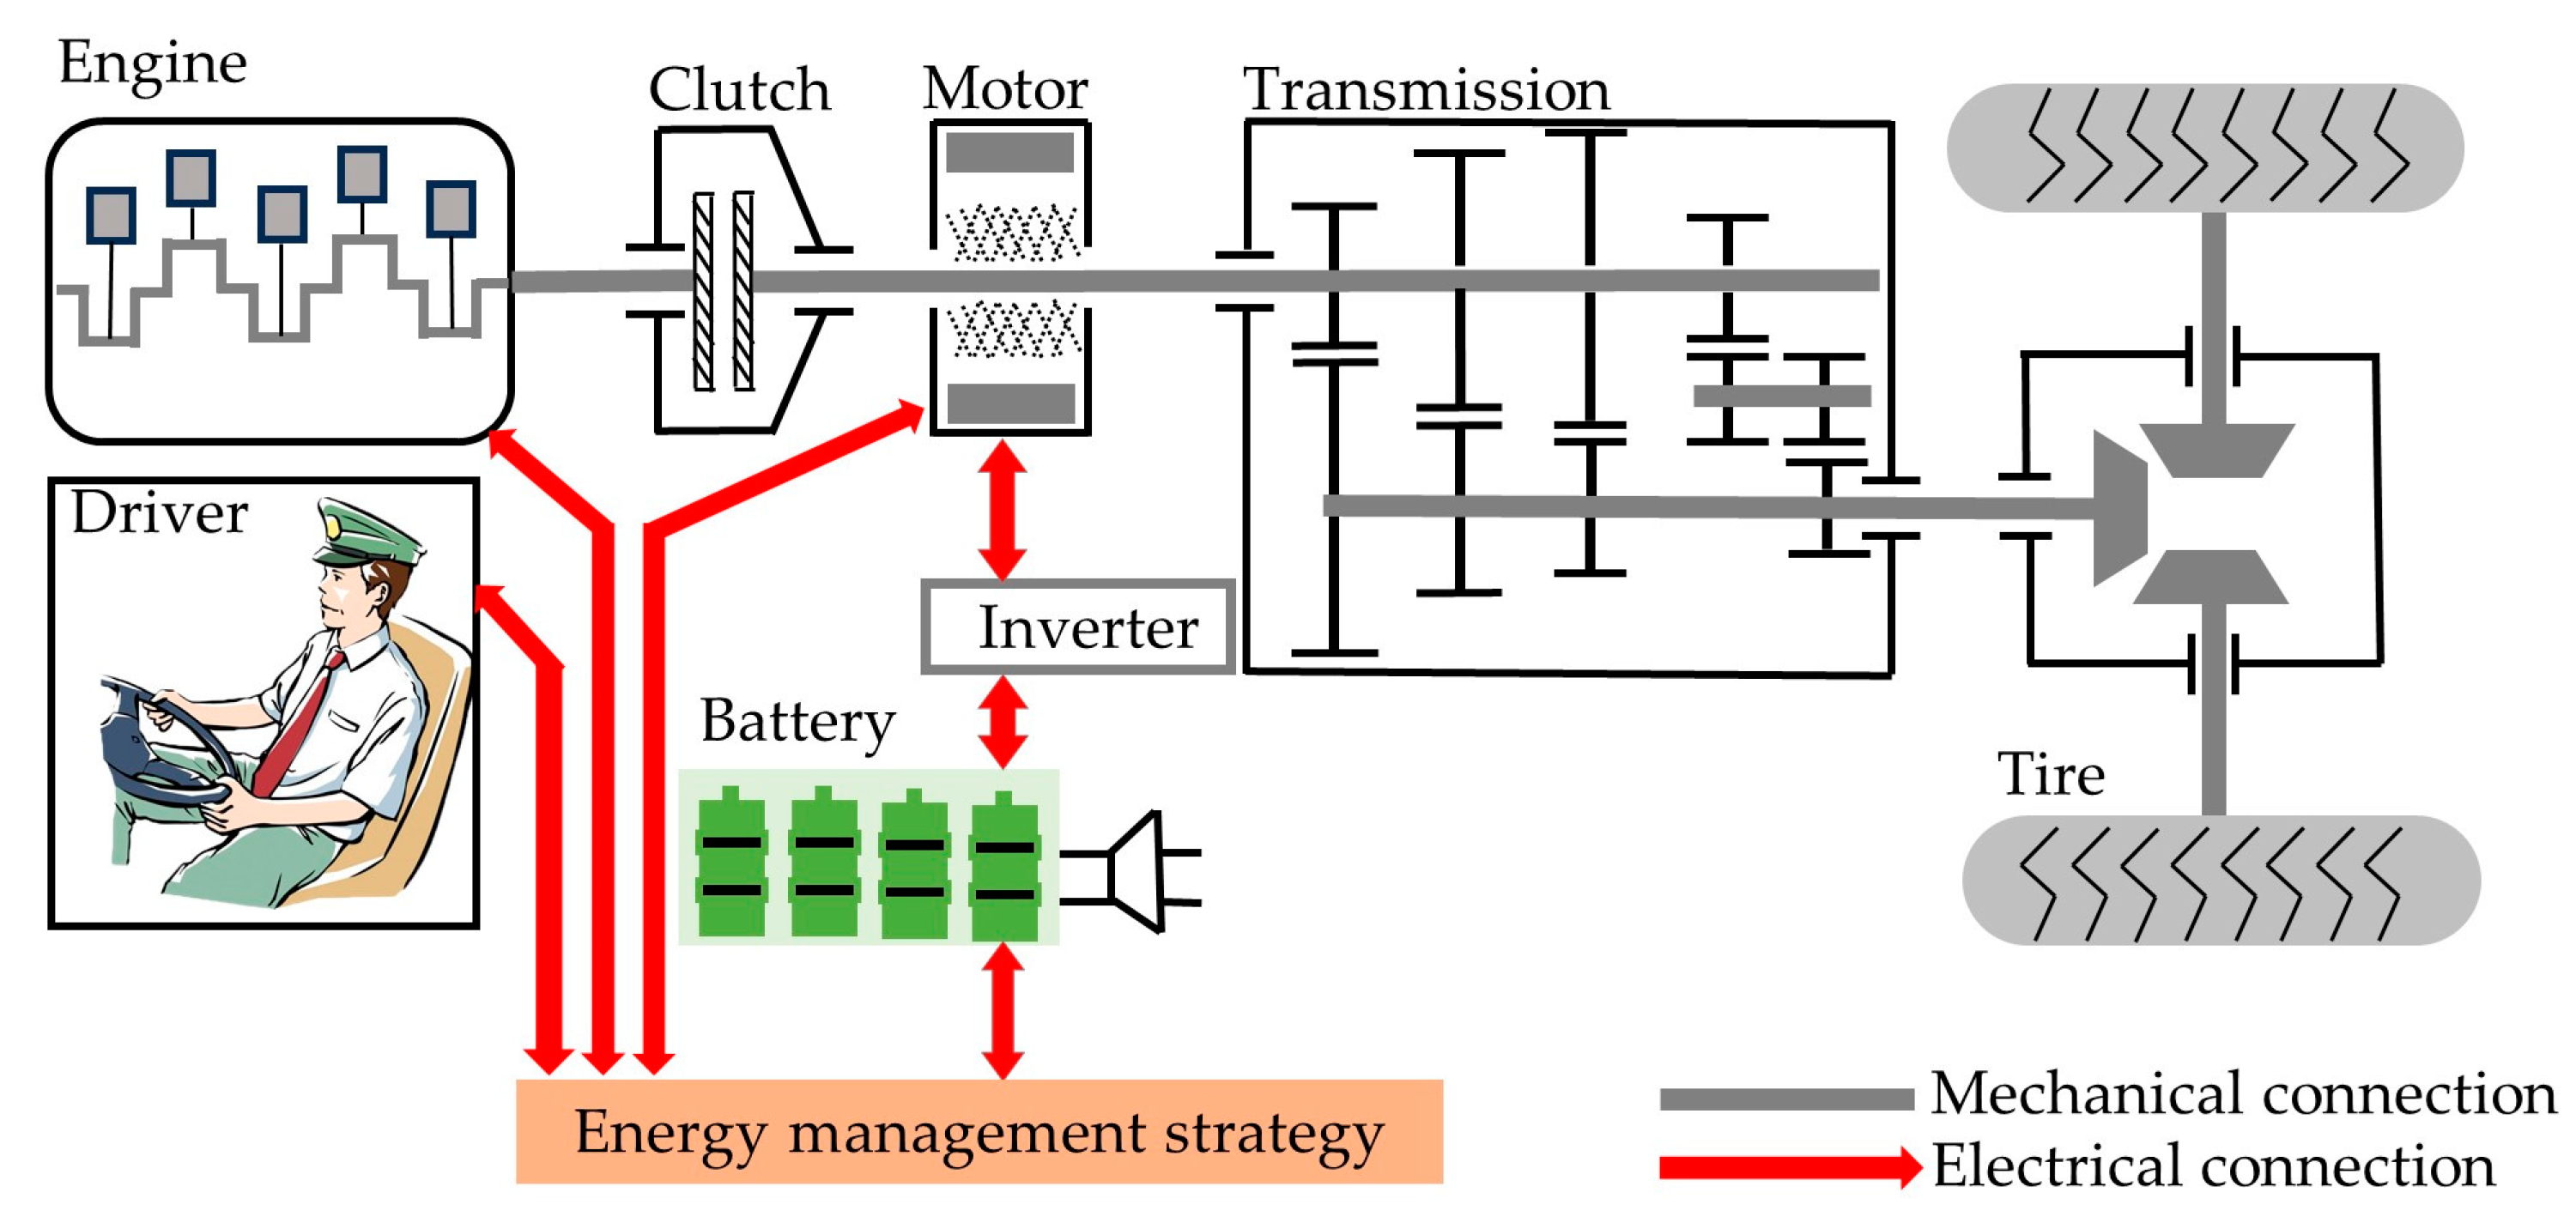
This paper focuses on the parallel PHEB, and its powertrain system structure and main vehicle parameters are shown in Figure 2 and Table 1, respectively. The system mainly consists of components such as the engine, motor, clutch, and externally rechargeable power battery pack. The vehicle controller achieves the switching of vehicle operating modes by controlling the engagement and disengagement of the clutch, including pure electric mode, engine drive mode, hybrid drive mode, driving charging mode, and regenerative braking mode.
In this paper, the forward modeling method is adopted to model the plug-in hybrid powertrain system, including specific models for the engine, motor, battery, vehicle longitudinal dynamics, and driver.

2.1. Engine Model

Due to the complex internal dynamic characteristics and overall operational process of the engine, its significant nonlinear features are difficult to describe using formulas. Therefore, this paper adopts an experimental modeling approach, which ignores the dynamic response of the engine and focuses on the input–output characteristics of the engine, using steady-state engine test data to model the engine [47]. The engine’s fuel consumption rate can be obtained through bench tests, as shown in Equation (1) [48].
b e = f T e , n e
where
  • b e —engine’s fuel consumption rate (g/kWh);
  • T e —engine torque (Nm);
  • n e —engine speed (rpm).
The fuel consumption rate of the engine per unit time is shown in Equation (2) [48].
m ˙ f = T e n e 9550 b e 3600
where
  • m ˙ f —fuel consumption rate of the engine per unit time (g/s).
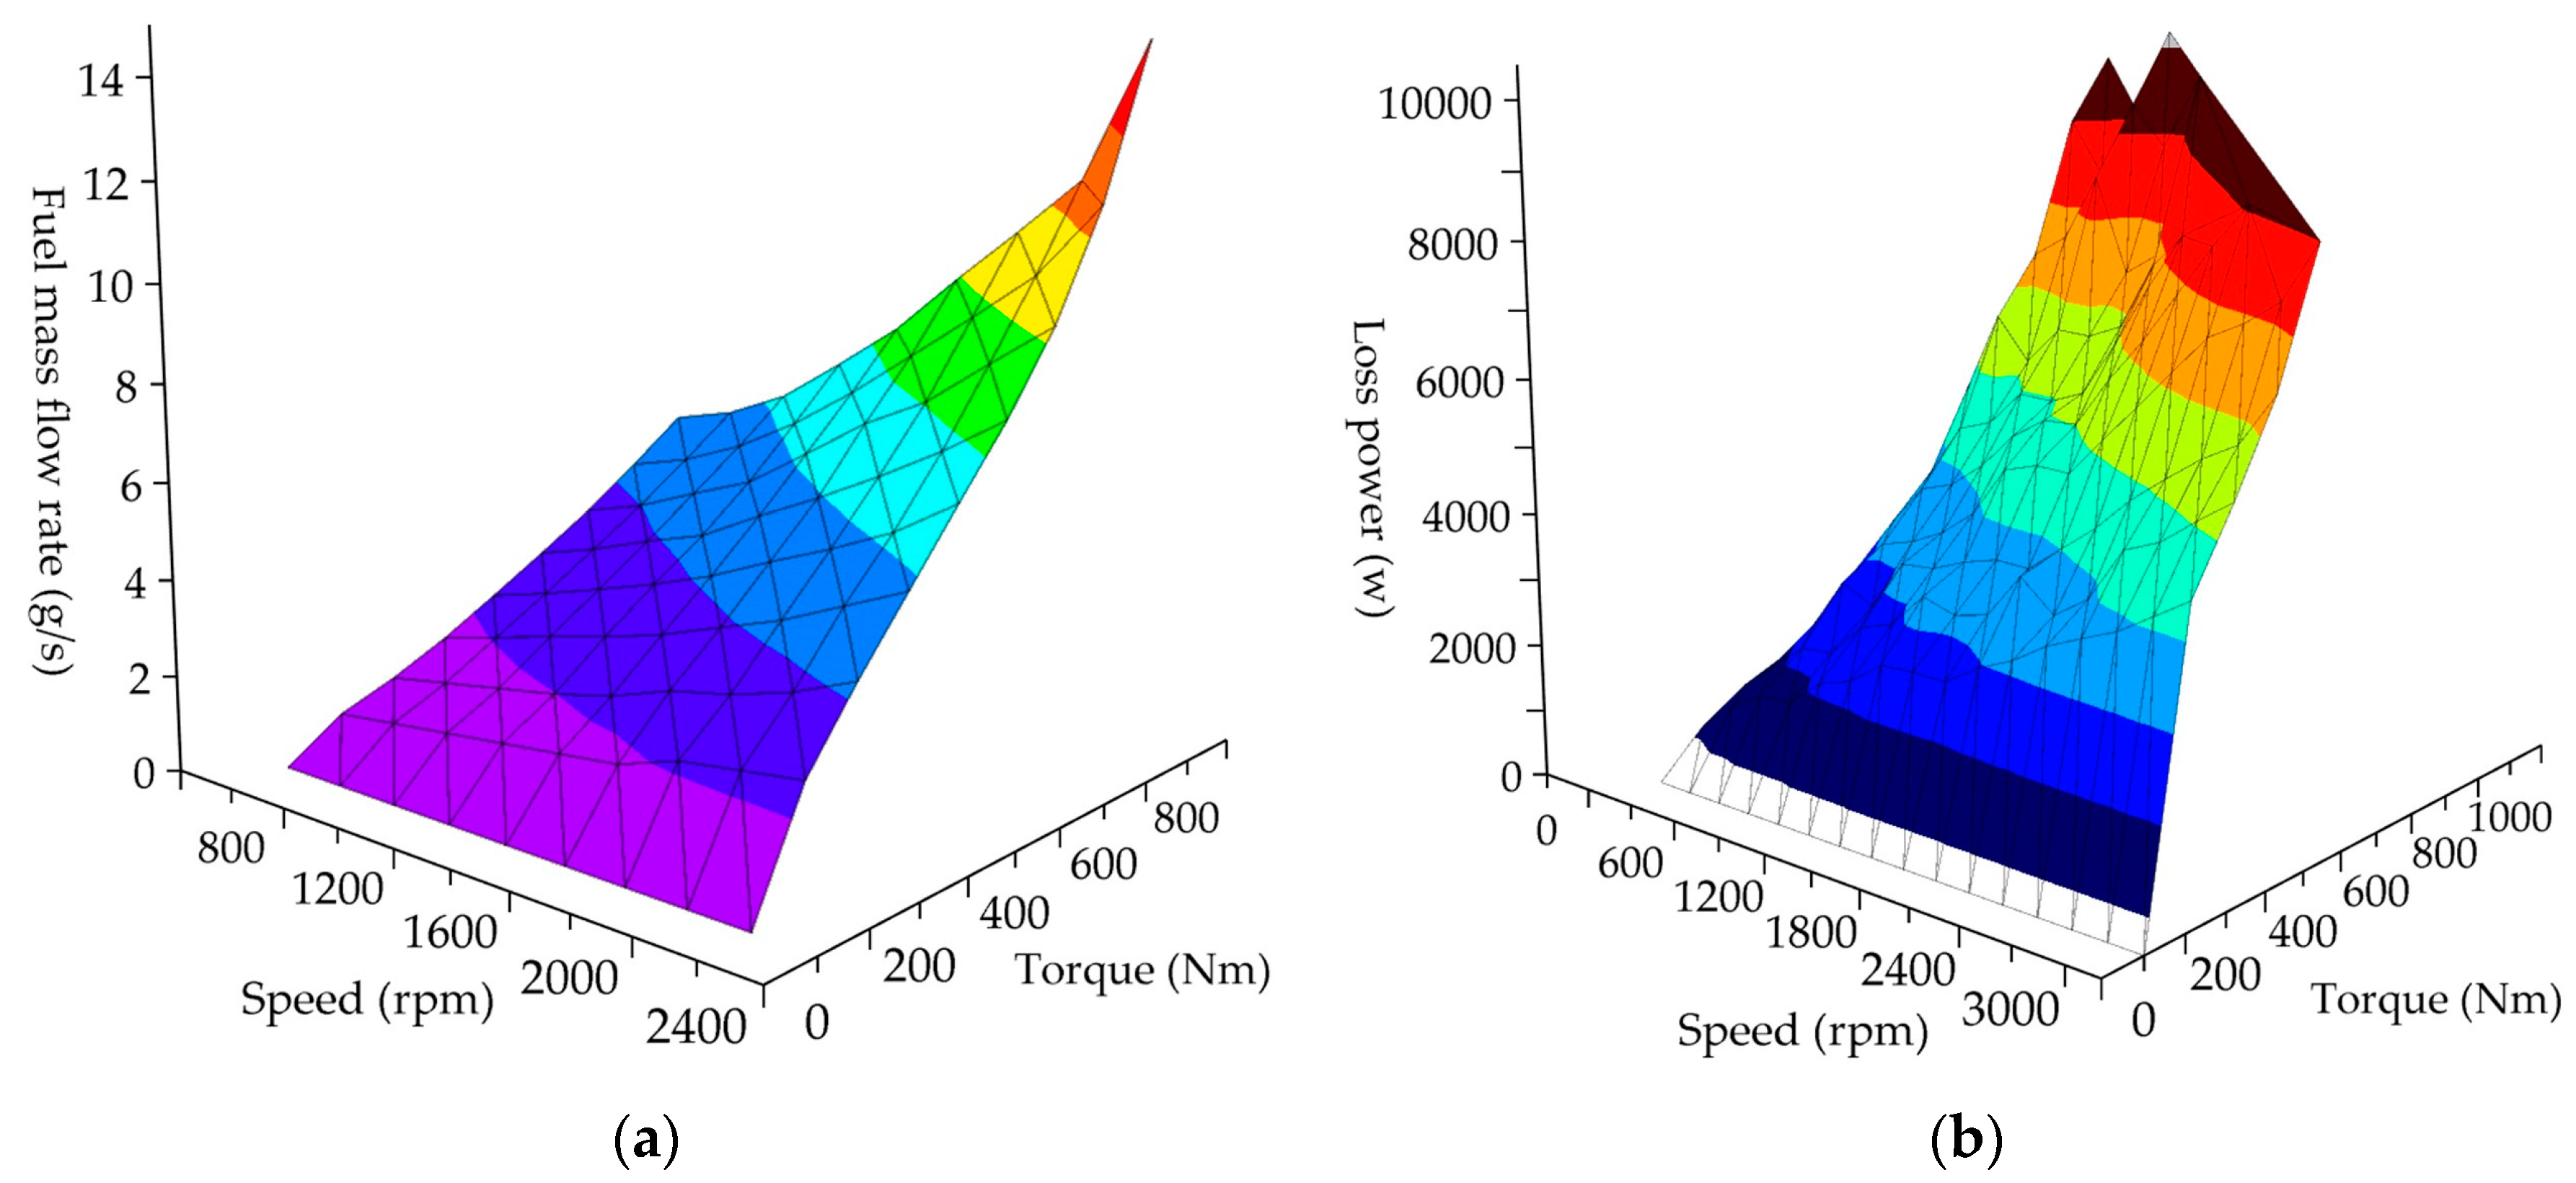
Therefore, the fuel consumption rate of the engine per unit time can be expressed as a function of torque and speed, as shown in Equation (3), with its map illustrated in Figure 3a.
m ˙ f = f T e , n e

2.2. Motor Model

Modeling the motor is similar to the engine in that it ignores the motor’s electromagnetic and thermal effects and likewise utilizes the experimental modeling method. The motor is modeled based on steady-state test data, and the motor and its controller are considered as a whole.
The motor power loss can be obtained through steady-state test data, as shown in Equation (4), with its map illustrated in Figure 3b.
P l o s s = f T m , n m
where
  • P l o s s —motor power loss (w);
  • T m —motor torque (Nm);
  • n m —motor speed (rpm).
Therefore, the motor output power can be expressed by Equation (5).
P m = T m ω m + P l o s s T m 0 T m ω m P l o s s T m < 0
where
  • P m —motor output power (w);
  • ω m —motor speed (rad).

2.3. Battery Model

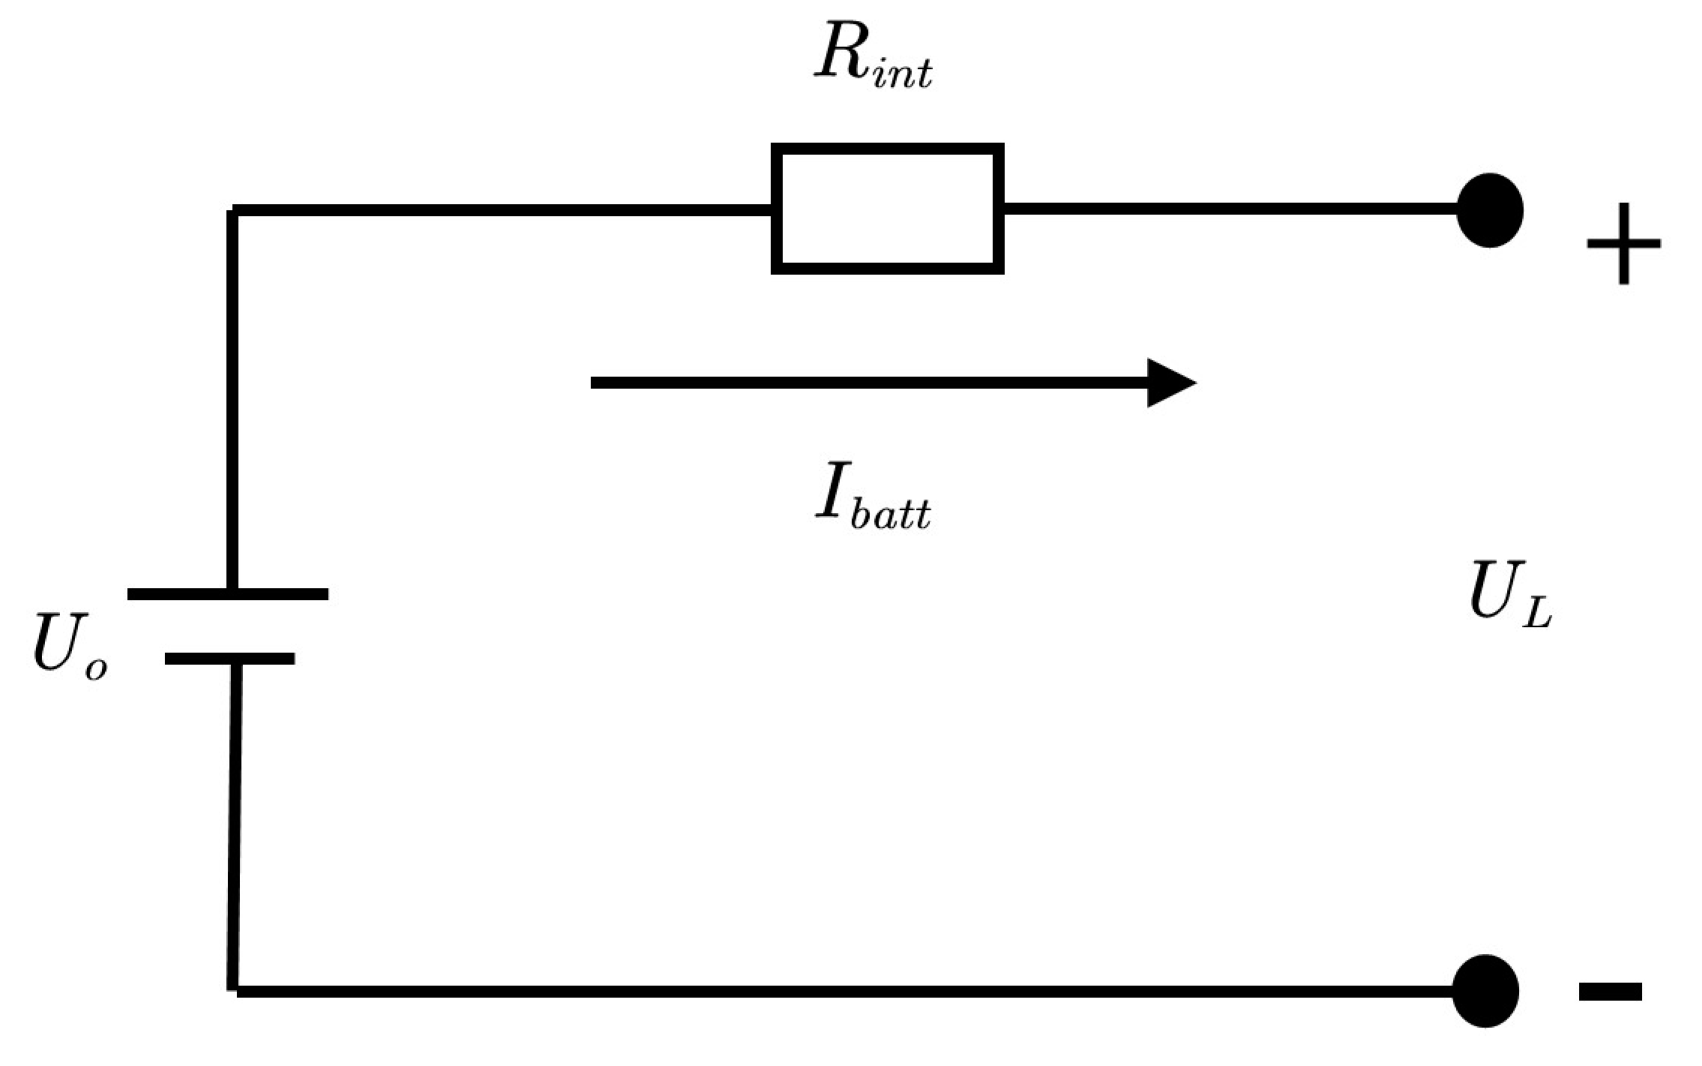
The charging and discharging process of the battery is a complex electrochemical reaction. Establishing an accurate electrochemical model involves considering a large number of relatively complex factors. Therefore, this paper simplifies the battery model and adopts the Rint model from the equivalent circuit model [49], as shown in Figure 4.
According to Kirchhoff’s law, Equation (6) [12] can be obtained.
U L = U O I b a t t R i n t
where
  • U L —battery load voltage (V);
  • U O —battery open-circuit voltage (V);
  • I b a t t —battery current (A);
  • R i n t —battery internal resistance ( Ω ).
Neglecting the effect of temperature on the battery, the open-circuit voltage and internal resistance can be expressed as a function of SOC, as shown in Equations (7) and (8) [12].
U O = f S O C
R i n t = f S O C
The power battery pack studied in this paper is composed of 72 individual batteries connected in series, with individual differences being ignored. The total pack’s load voltage is shown by Equation (9).
U b a t t = N s U L
where
  • U b a t t —total battery pack’s load voltage (V);
  • N s —number of series connected battery.
The battery SOC is calculated using the ampere–time integration method. It can be shown by Equation (10) [12].
S O C = S O C 0 I b a t t d t Q b a t t
where
  • S O C 0 —initial SOC value;
  • Q b a t t —battery capacity (Ah).

2.4. PHEB Longitudinal Dynamics Model

In this paper, the vertical and lateral motion of the vehicle are ignored, and a longitudinal dynamics model of the entire vehicle is established. The force analysis of the entire vehicle is shown in Figure 5.
The resistance of the vehicle during operation is shown by Equation (11).
F w = C D ρ A v 2 2 F f = f m g cos α F i = m g sin α F j = δ m a
where
  • F w —air resistance (N);
  • C D —coefficient of air resistance;
  • ρ —air density (g/m3);
  • A —frontal area of the entire vehicle (m2);
  • v —vehicle speed (m/s);
  • F f —rolling resistance (N);
  • f —coefficient of rolling resistance;
  • α —gradient angle (rad);
  • F i —gradient resistance (N);
  • F j —acceleration resistance (N)
  • δ —rotational mass conversion factor;
  • a —vehicle acceleration (m/s2).
The driving force of a PHEB during travel can be expressed by Equation (12).
F t = T e m i g i 0 η r
where
  • F t —driving force at the wheels (N);
  • T e m —combined torque provided by the engine and motor in the process of driving the vehicle (N·m);
  • i g —transmission ratio;
  • i 0 —main gearbox ratio;
  • η —driveline efficiency;
  • r —wheel radius (m).
Based on the longitudinal force equilibrium of the vehicle during travel, Equation (13) can be obtained by combining Equations (11) and (12).
F t = F w + F f + F i + F j T e m i g i 0 η r = C D ρ A v 2 2 + f m g cos α + m g sin α + δ m a

2.5. Driver Model

The driver model adjusts the accelerator and brake pedals to achieve speed tracking based on the deviation between the actual vehicle speed and the reference speed, thereby simulating the driver’s operational process. In this paper, the driver is modeled based on a proportional integral (PI) controller, which is shown by Equations (14) and (15) [50].
Δ v = v c y c v a c t
u P I = K P Δ v + K I Δ v d t
where
  • Δ v —difference between the actual vehicle speed and the reference speed (m/s);
  • v c y c —reference speed (m/s);
  • v a c t —actual vehicle speed (m/s);
  • u P I —pedal opening, u P I 1 , 1 ;
  • K P —proportional control coefficient;
  • K I —integral control coefficient.

2.6. Model Validation

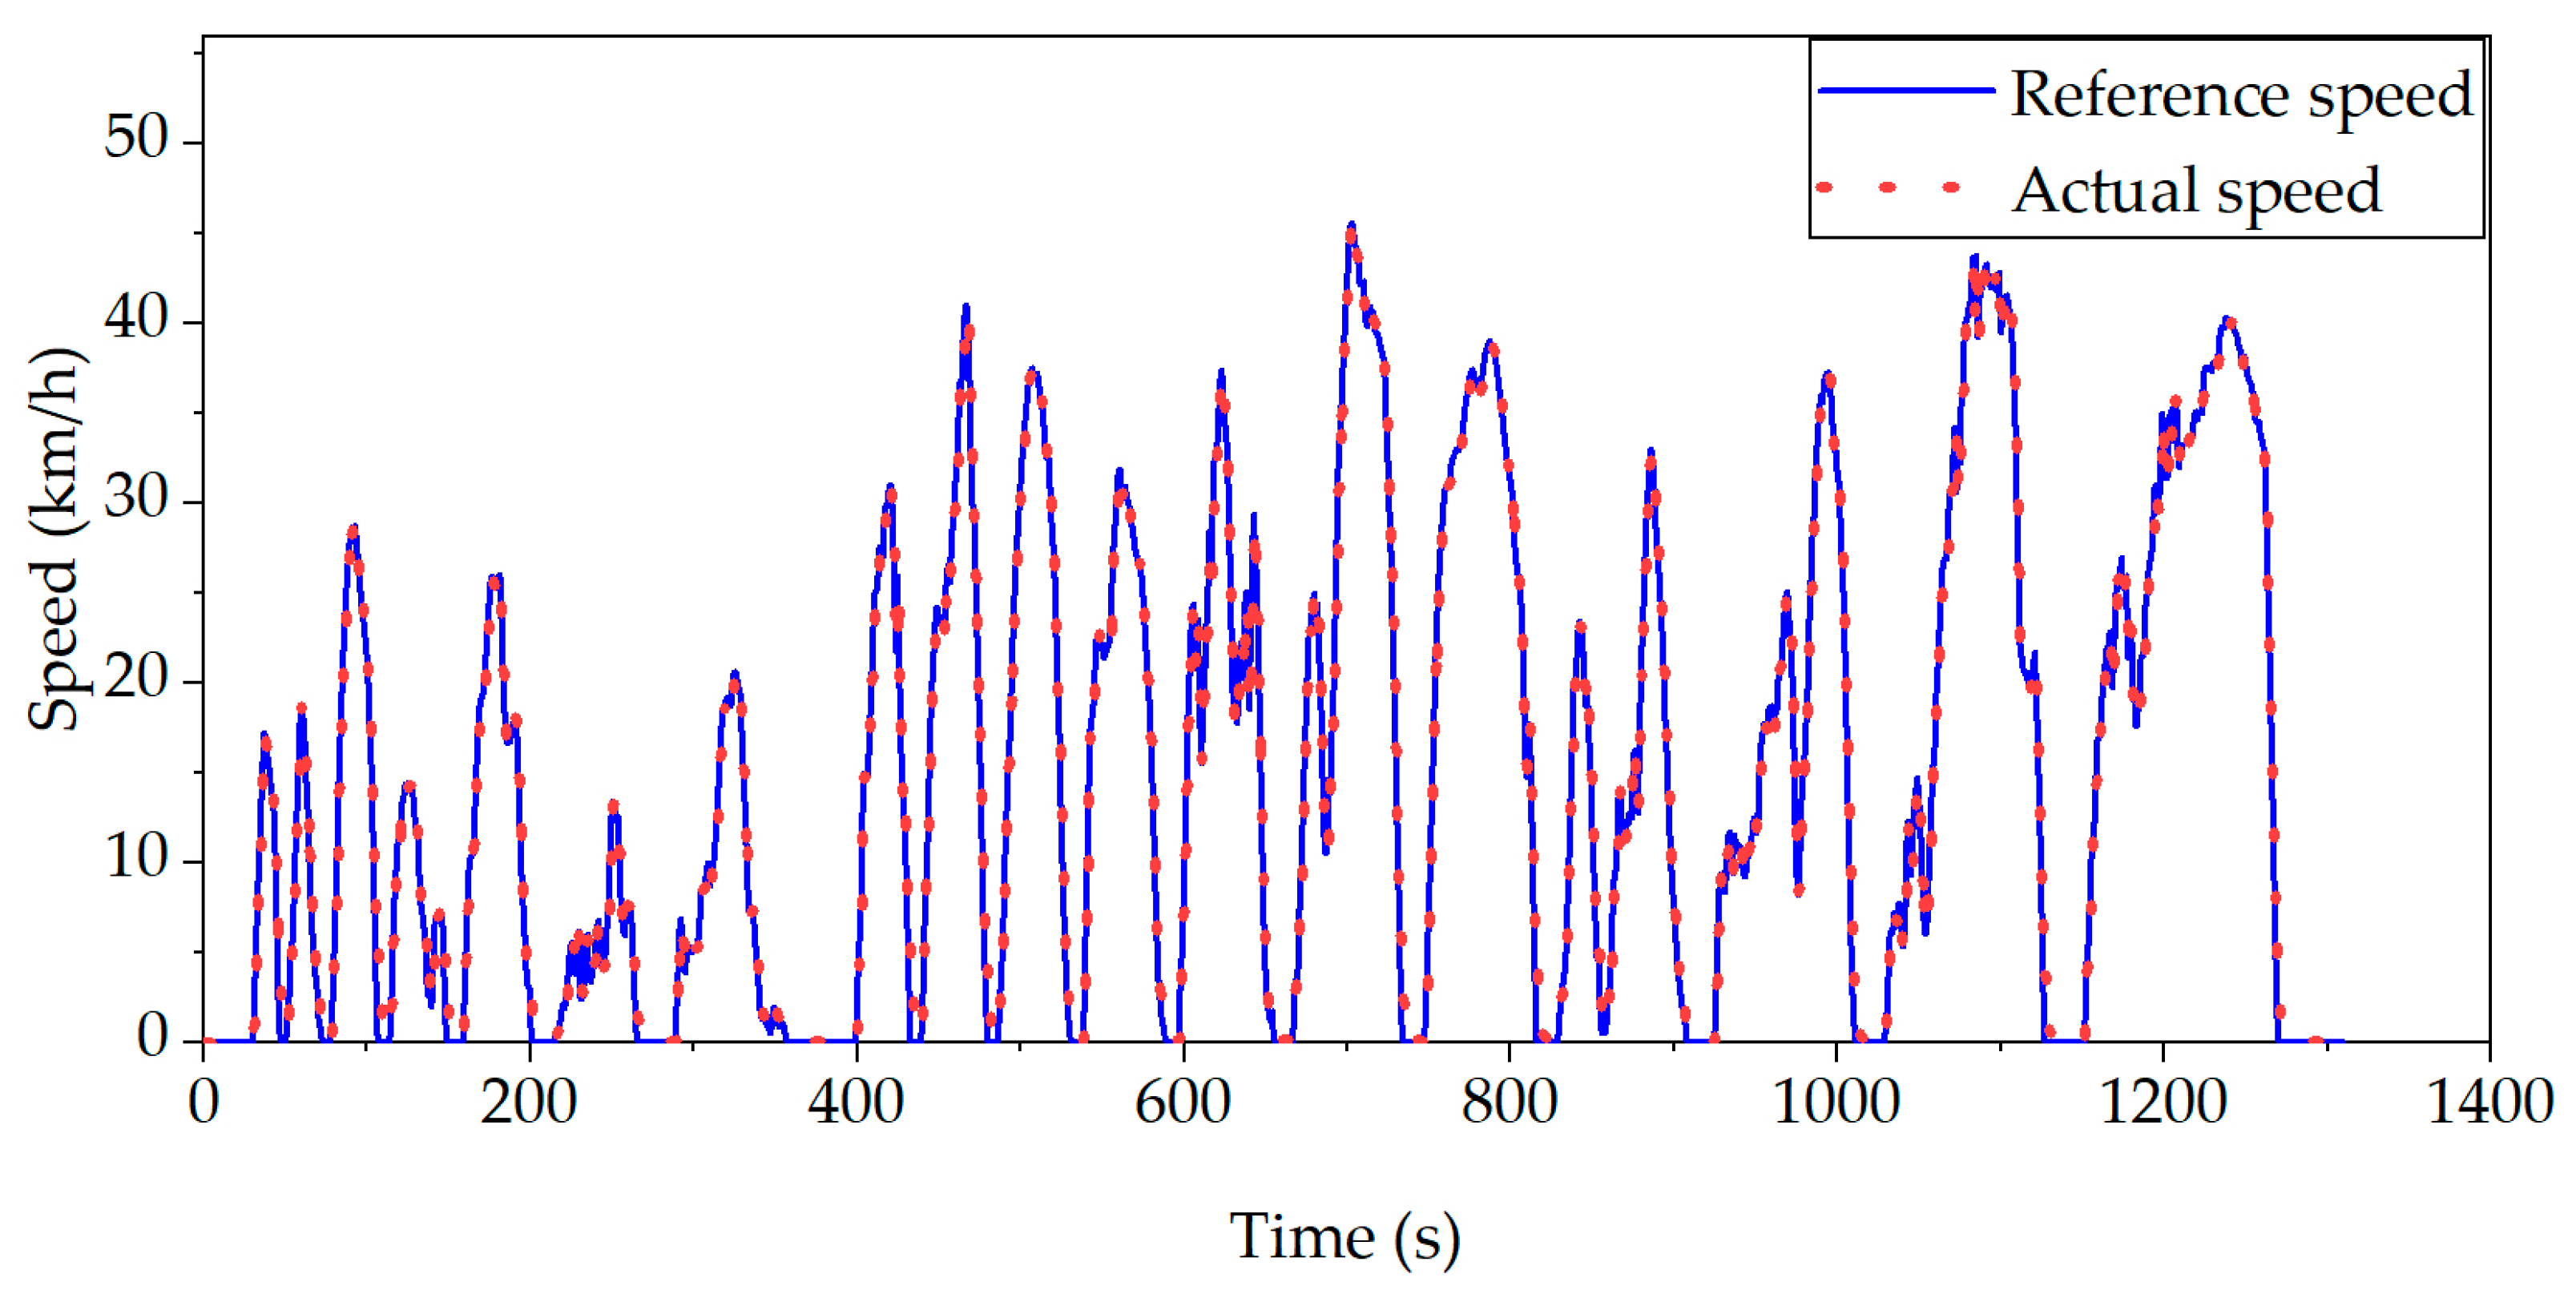
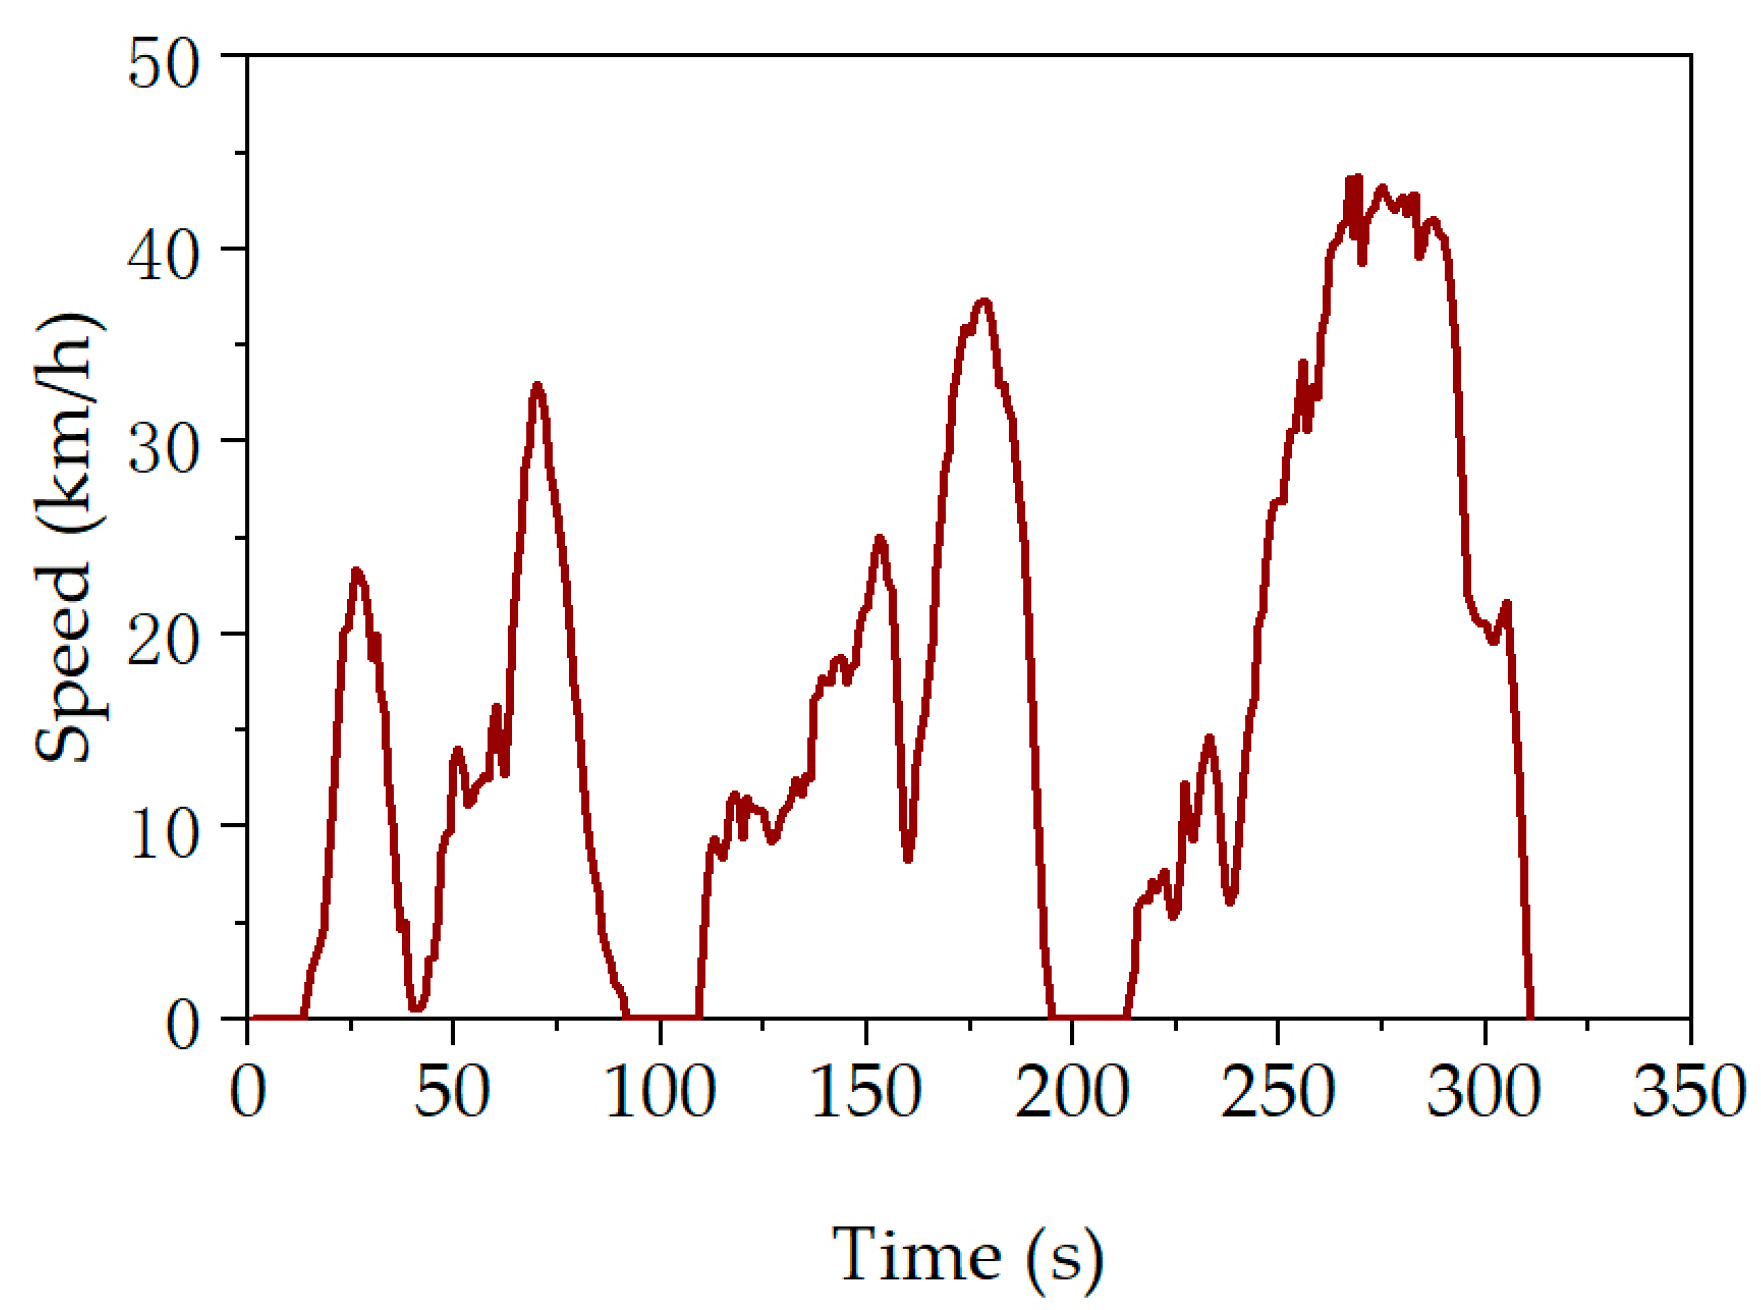
Based on the establishment of mathematical models for various components of PHEBs, this paper builds a PHEB simulation model in the Matlab/Simulink(R2020b) environment. To verify the effectiveness of the model, the simulation test is conducted using the CHTC-B, the cycle condition of the Chinese city bus. As shown in Figure 6, the simulation results indicate that the actual vehicle speed accurately follows the reference speed, thereby validating the correctness of the model.

3. Materials and Methods

3.1. Research on Dynamic Programming Algorithm

During the operation of a PHEB, factors such as weather, road conditions, and the driver’s driving style lead to significant uncertainty in its energy allocation [51]. The SOC trajectory of the battery pack reflects the energy allocation of the engine and the motor. Therefore, planning the SOC trajectory can achieve energy-optimized allocation for PHEBs. This paper obtains the reference trajectory of the battery pack SOC for a PHEB using a global optimal EMS based on the DP algorithm.
The DP algorithm, as a global planning algorithm, typically transforms multi-step optimal control problems into multiple single-step optimal control problems and computes them recursively. The plug-in hybrid powertrain system is a nonlinear system consisting of multiple subsystems. If the driving cycle is known, the rational allocation of power among the components of the powertrain system to achieve the best fuel economy is a typical multi-stage decision problem.
In this paper, the SOC of the power battery pack is selected as the state variable of the system, and the torque of the motor is selected as the control variable of the system, as shown specifically in Equations (16) and (17).
x k = S O C k
u k = T m k
where
  • x k —state variable;
  • u k —control variable.
The engine torque is as shown in Equation (18).
T e k = T r e q k T m k
where
  • T r e q —PHEB torque demand (Nm).
In this paper, the total fuel consumption is taken as the objective function of the system, as shown in Equation (19).
G = min k = 0 N 1 f u e l k
where
  • G—minimum total fuel consumption;
  • f u e l k —fuel consumption for the kth stage.
Combining the previous Equation (10), the system’s state transition equation can be obtained, as shown in Equation (20).
S O C k + 1 = S O C k I b a t t k d t Q b a t t
where
  • S O C k + 1 —state variable at the (k + 1)th stage.
After determining the system state variables, control variables, objective function, and state transition equation, the determination of the globally optimal energy allocation scheme mainly involves three steps: (1) Discretization of state variables and control variables: firstly, divide the SOC grid with a certain interval between the upper and lower limits of the SOC, and obtain the vehicle’s demand torque sequence based on the PHEB model and driving cycles while discretizing it at certain time intervals. (2) Reverse optimization: combining the discretized control variables from the first step, reverse solve for the optimal control variable values at each SOC grid point. (3) Forward solving: by reverse solving, obtain the optimal torque allocation strategy and the corresponding minimum total fuel consumption for each stage under each state. When the initial SOC value of the power battery is determined, the globally optimal motor and engine torque allocation strategy corresponding to it are already determined. Only by applying the recorded optimal torque sequence to the vehicle model in sequence, the globally minimum fuel consumption can be obtained.

3.2. Research on Load Identification Method

Due to the significant variations in passengers load during the operation of a PHEB, which consequently affect the optimal energy allocation, this paper employs the RLS method to identify the load of the PHEB.
The mathematical model of the least squares (LS) method is shown in Equation (21) [52].
y i = h τ i θ + e i
where
  • y i —process output;
  • h τ i —process input;
  • θ —estimated parameters;
  • e i —process noise, which is white noise.
The estimated parameter values are obtained from the observed values y i and h τ i , under the condition that the sum of squared process noise is minimized. This leads to the weighted least squares criterion function, as shown in Equation (22) [52].
J θ = i = 1 k y i h τ i θ 2
Assuming θ ^ represents the estimated parameter values obtained by minimizing J θ , using the extremum method, the θ ^ can be obtained, as shown in Equation (23) [52].
θ ^ = i = 1 k h i h τ i 1 i = 1 k h i y i
This paper adopts the RLS to identify the overall vehicle load, the mathematical model of which is shown in Equation (24) [52].
θ ^ k = θ ^ k 1 + e k
Equations (25) and (26) can be defined according to Equation (23) [52].
p k = i = 1 k h i h τ i 1
f k = i = 1 k h i y i
Finally, the recursive expression of the RLS method can be obtained, as shown in Equation (27) [53].
θ ^ ( k ) = θ ^ ( k 1 ) + γ ( k ) y ( k ) h τ ( k ) θ ^ ( k 1 ) γ ( k ) = p ( k ) h ( k ) = p ( k 1 ) h ( k ) h τ ( k ) p ( k 1 ) h ( k ) 1 p ( k ) = 1 γ ( k ) h τ ( k ) p ( k 1 )
Equation (28) can be derived from Equations (11)–(13).
F t F w = F f + F i + F j = m f g cos α + g sin α + δ a
It can be transformed into the least squares format, as shown in Equation (29).
F t F w = m f g cos α + g sin α + δ a + e k
where
  • F t F w  and ( f g cos α + g sin α + δ a )—observed parameters;
  • m —estimated parameter.

3.3. Research on Equivalent Fuel Consumption Minimization Strategy

The ECMS is an instantaneous optimal energy management strategy based on PMP, which equivalently converts electricity consumption into fuel consumption. It superimposes the engine fuel consumption to obtain equivalent fuel consumption and solves for the minimization of equivalent fuel consumption to achieve optimal control.
By setting the battery SOC as the state variable and the engine torque as the control variable, the Hamiltonian equation can be obtained, as shown in Equation (30).
H x t , λ t , u t , t = λ t x ˙ t + m ˙ f u e l u t , t
where
  • x t —state variable;
  • λ t —common state between power consumption and fuel, i.e., the equivalent coefficient;
  • u t —control variable;
  • x ˙ t —differential of the state variable;
  • m ˙ f u e l —engine fuel consumption (g/s).
According to PMP, we can obtain Equation (31).
λ ˙ t = δ H x t , λ t , u t , t δ x t = λ t δ x ˙ t δ x t
According to the ampere–hour method,  x ˙ t can be expressed as Equation (32).
x ˙ t = S O ˙ C t = I b a t t t Q b a t t
Based on Equations (31) and (32), we can derive Equation (33).
λ ˙ t = λ t Q b a t t δ I b a t t t δ x t = λ t 2 Q b a t t δ I b a t t t δ U b a t t t δ U b a t t t δ x t + δ I b a t t t δ R t δ R t δ x t
where
  • U b a t t —battery pack load voltage;
  • R —battery pack resistance ( Ω ).
Assuming that the battery pack load voltage and internal resistance are not affected by the change in SOC, we can obtain a constant equivalent coefficient assuming the equivalent factor, as shown in Equation (34).
s t = λ t H L H V Q b a t t U b a t t
where
  • s t —equivalent factor;
  • H L H V —calorific value of the fuel (J/kg).
Combining Equations (30) and (34), the Hamiltonian function transforms into a form associated with battery power, as shown in Equation (35).
H x t , λ t , u t , t = s t P b a t t x t , u t , t H L H V + m f u e l u t , t
where
  • P b a t t —battery output power (w).
The physical significance of the Hamiltonian equation in energy management problems is the instantaneous equivalent fuel consumption at the current moment. Therefore, we can obtain Equation (36).
m ˙ e q u t = m ˙ b a t t t + m ˙ f u e l t = s t P b a t t x t , u t , t H L H V + m ˙ f u e l u t , t
where
  • m ˙ e q u —total equivalent fuel consumption (g/s);
  • m ˙ b a t t —equivalent fuel consumption corresponding to the battery (g/s);
From Equation (36), it can be deduced that the larger the equivalent factor, the more the equivalent fuel consumption corresponding to the battery. Under the same power demand, the energy management strategy tends to favor the use of the engine. Conversely, the smaller the equivalent factor, the less the equivalent fuel consumption corresponding to the battery, indicating a greater inclination to use the motor. Therefore, by selecting an appropriate equivalent factor, the operating states of the engine and motor can be adjusted.

3.4. Research on Genetic Algorithm

The GA is an optimization algorithm based on biological evolution mechanisms. It simulates the natural selection process in nature, where organisms adapt to the environment through genetic inheritance, crossover, and mutation operations. This process is simulated in a set of binary numbers and iteratively solved. Based on the fitness function, individuals with superior performance are selected, while those with inferior performance are eliminated. Through multiple iterations, the algorithm ultimately identifies the optimal solution to the problem. Figure 7 illustrates the simulation of genetic, crossover, and mutation operations in the binary algorithm.
Similarly, when optimizing the equivalent factors using a GA, first convert the equivalent factors into binary numbers, and then perform the genetic, crossover, and mutation operations as shown in Figure 7. The solution process of the GA in this paper is illustrated in Figure 8.
In the GA, the fitness of an individual is represented as shown in Equation (37).
F i t = ω 1 ξ 1 S O C r e f S O C i + ω 2 ξ 2 S O C r e f e n d S O C i e n d
where
  • Fit—the fitness of individual;
  • ω 1 , w 2 —scale factor,  ω 1 + ω 2 = 1 ;
  • ξ 1 , ξ 2 —penalty functions, as shown in Equations (38) and (39);
  • S O C r e f —reference SOC value;
  • S O C i —actual SOC value;
  • S O C r e f e n d —reference SOC value at the end of the simulation;
  • S O C i e n d —actual SOC value at the end of the simulation.
    ξ 1 = 1   5 S O C r e f S O C i 5 ξ 1 = e S O C r e f S O C i S O C r e f S O C i < 5   o r   S O C r e f S O C i > 5
ξ 2 = 1 0.2 S O C r e f e n d S O C i e n d 0.2 ξ 2 = e 1 S O C r e f e n d S O C i e n d S O C r e f e n d S O C i e n d < 0.2   o r   S O C r e f e n d S O C i e n d > 0.2

3.5. Research on Division of Bus Stations

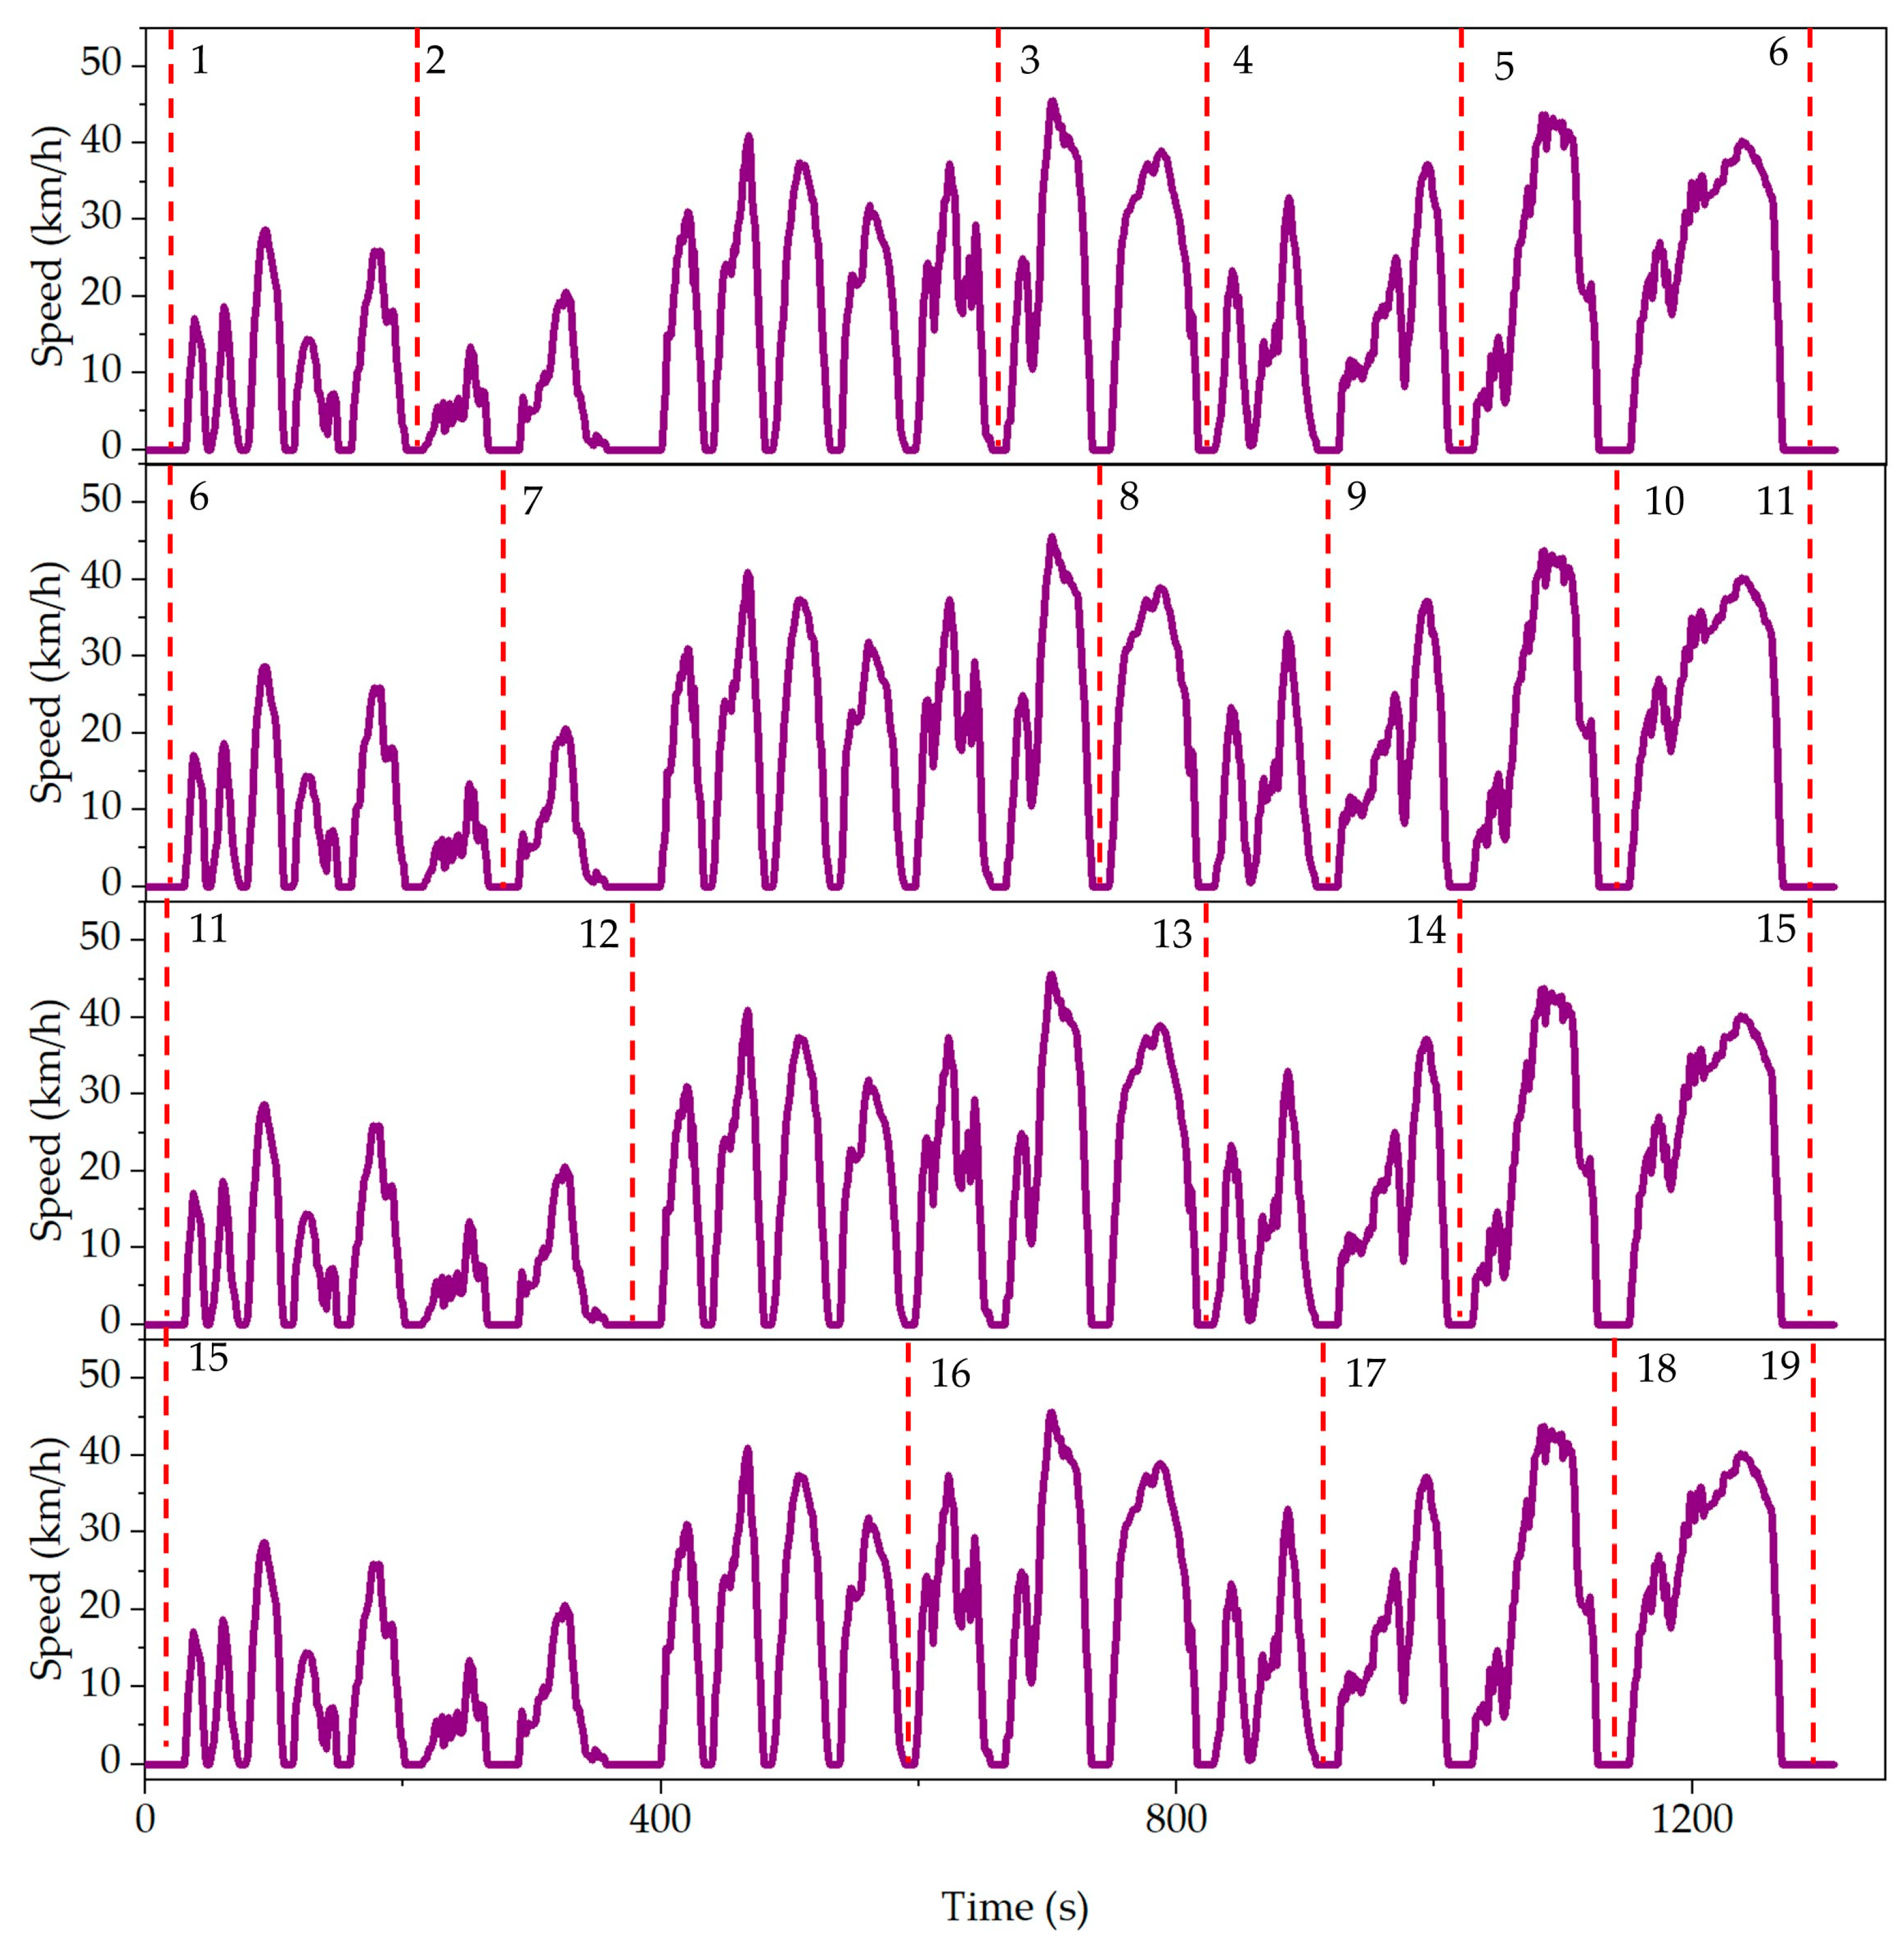
Proper planning of driving routes and bus stops is of great help in improving the energy utilization efficiency of the entire PHEB driving process [54,55]. The spacing between bus stations directly affects the convenience of people’s travel. If the spacing between bus stations is too large, it is not conducive to passenger travel. If the spacing is too small, it will affect the operation of buses and increase the operating costs. The distance between each bus station is generally determined based on the population density and commercial density of urban areas, with the distance between bus stations in densely populated areas typically ranging from 400 to 500 m, while in sparsely populated remote suburbs, the distance can reach 1000 to 2000 m. In this paper, CHTC-B cycle condition is used to select the appropriate distance to divide the bus stations where its speed is 0 and kept at 10 s, as shown in Figure 9.

4. Results and Discussion

4.1. Obtaining Reference SOC Trajectory Based on Dynamic Programming Algorithm

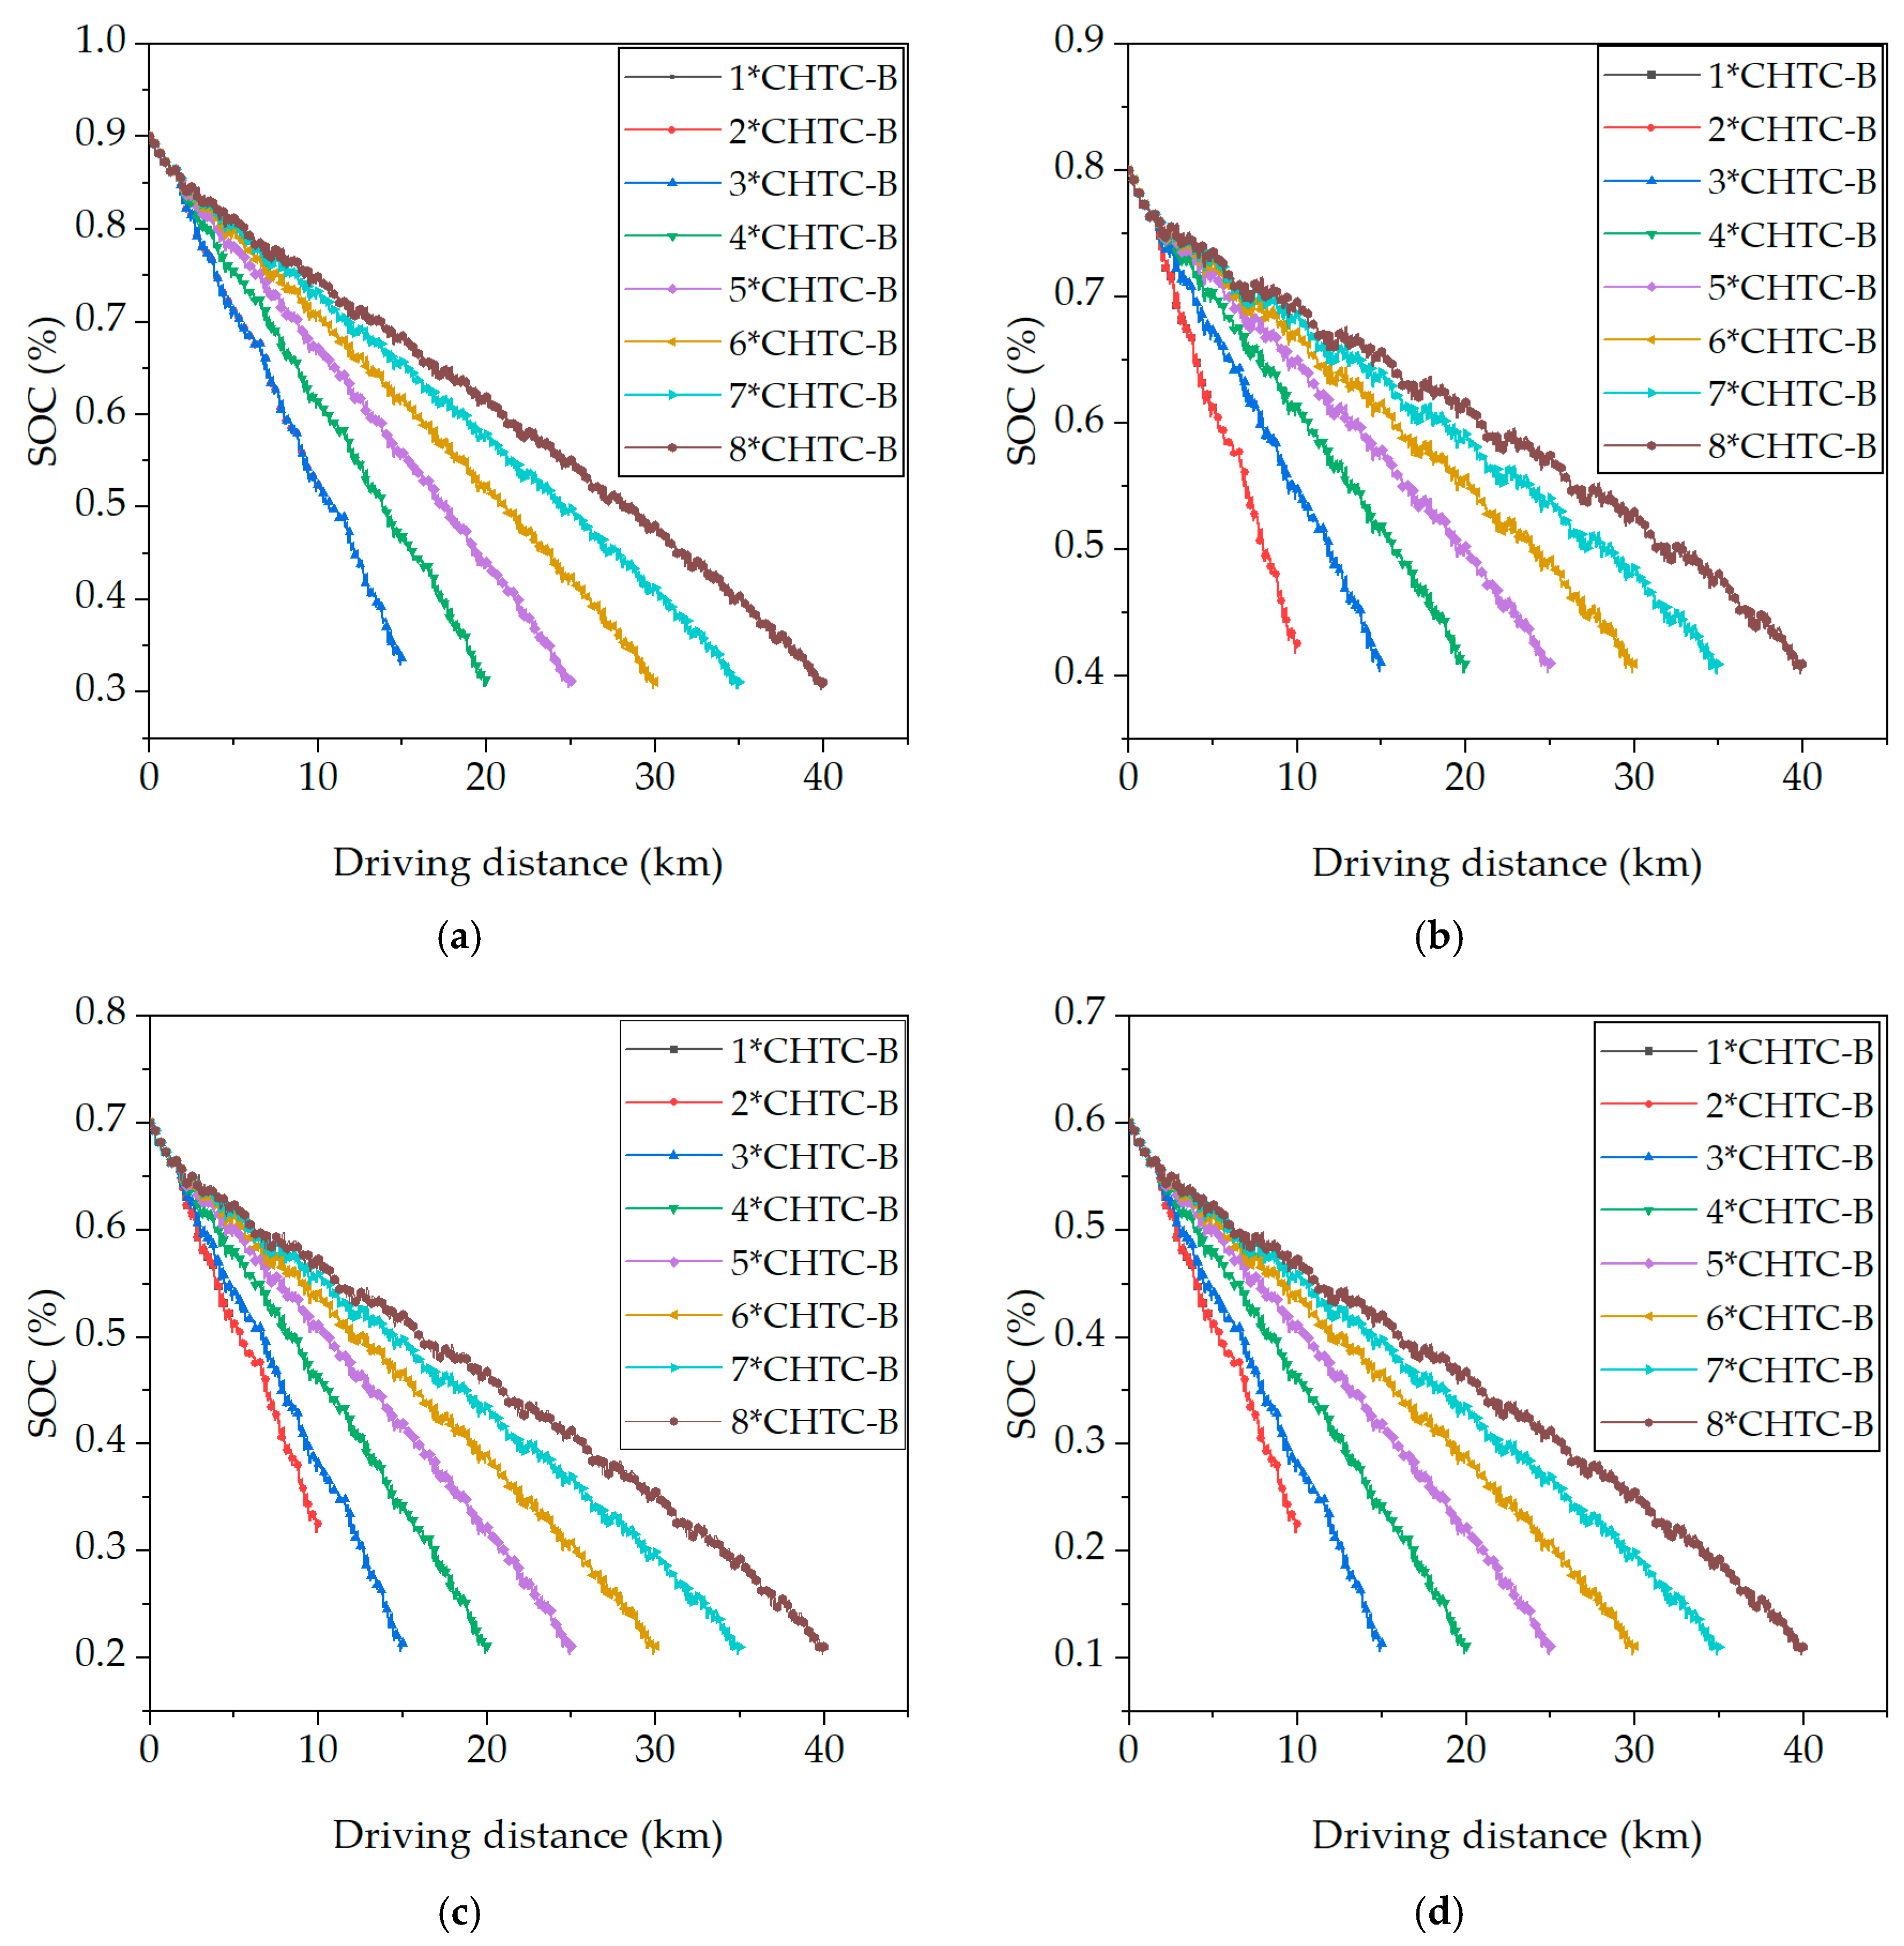
Through the introduction of the DP algorithm in Section 3.1, a simulation analysis of the DP is now conducted. In this paper, CHTC-B is selected as the simulation cycle condition, different SOC upper and lower limits are set, and the simulation is carried out under 1–8 rounds of cycle conditions. The specific simulation results are shown in Figure 10.
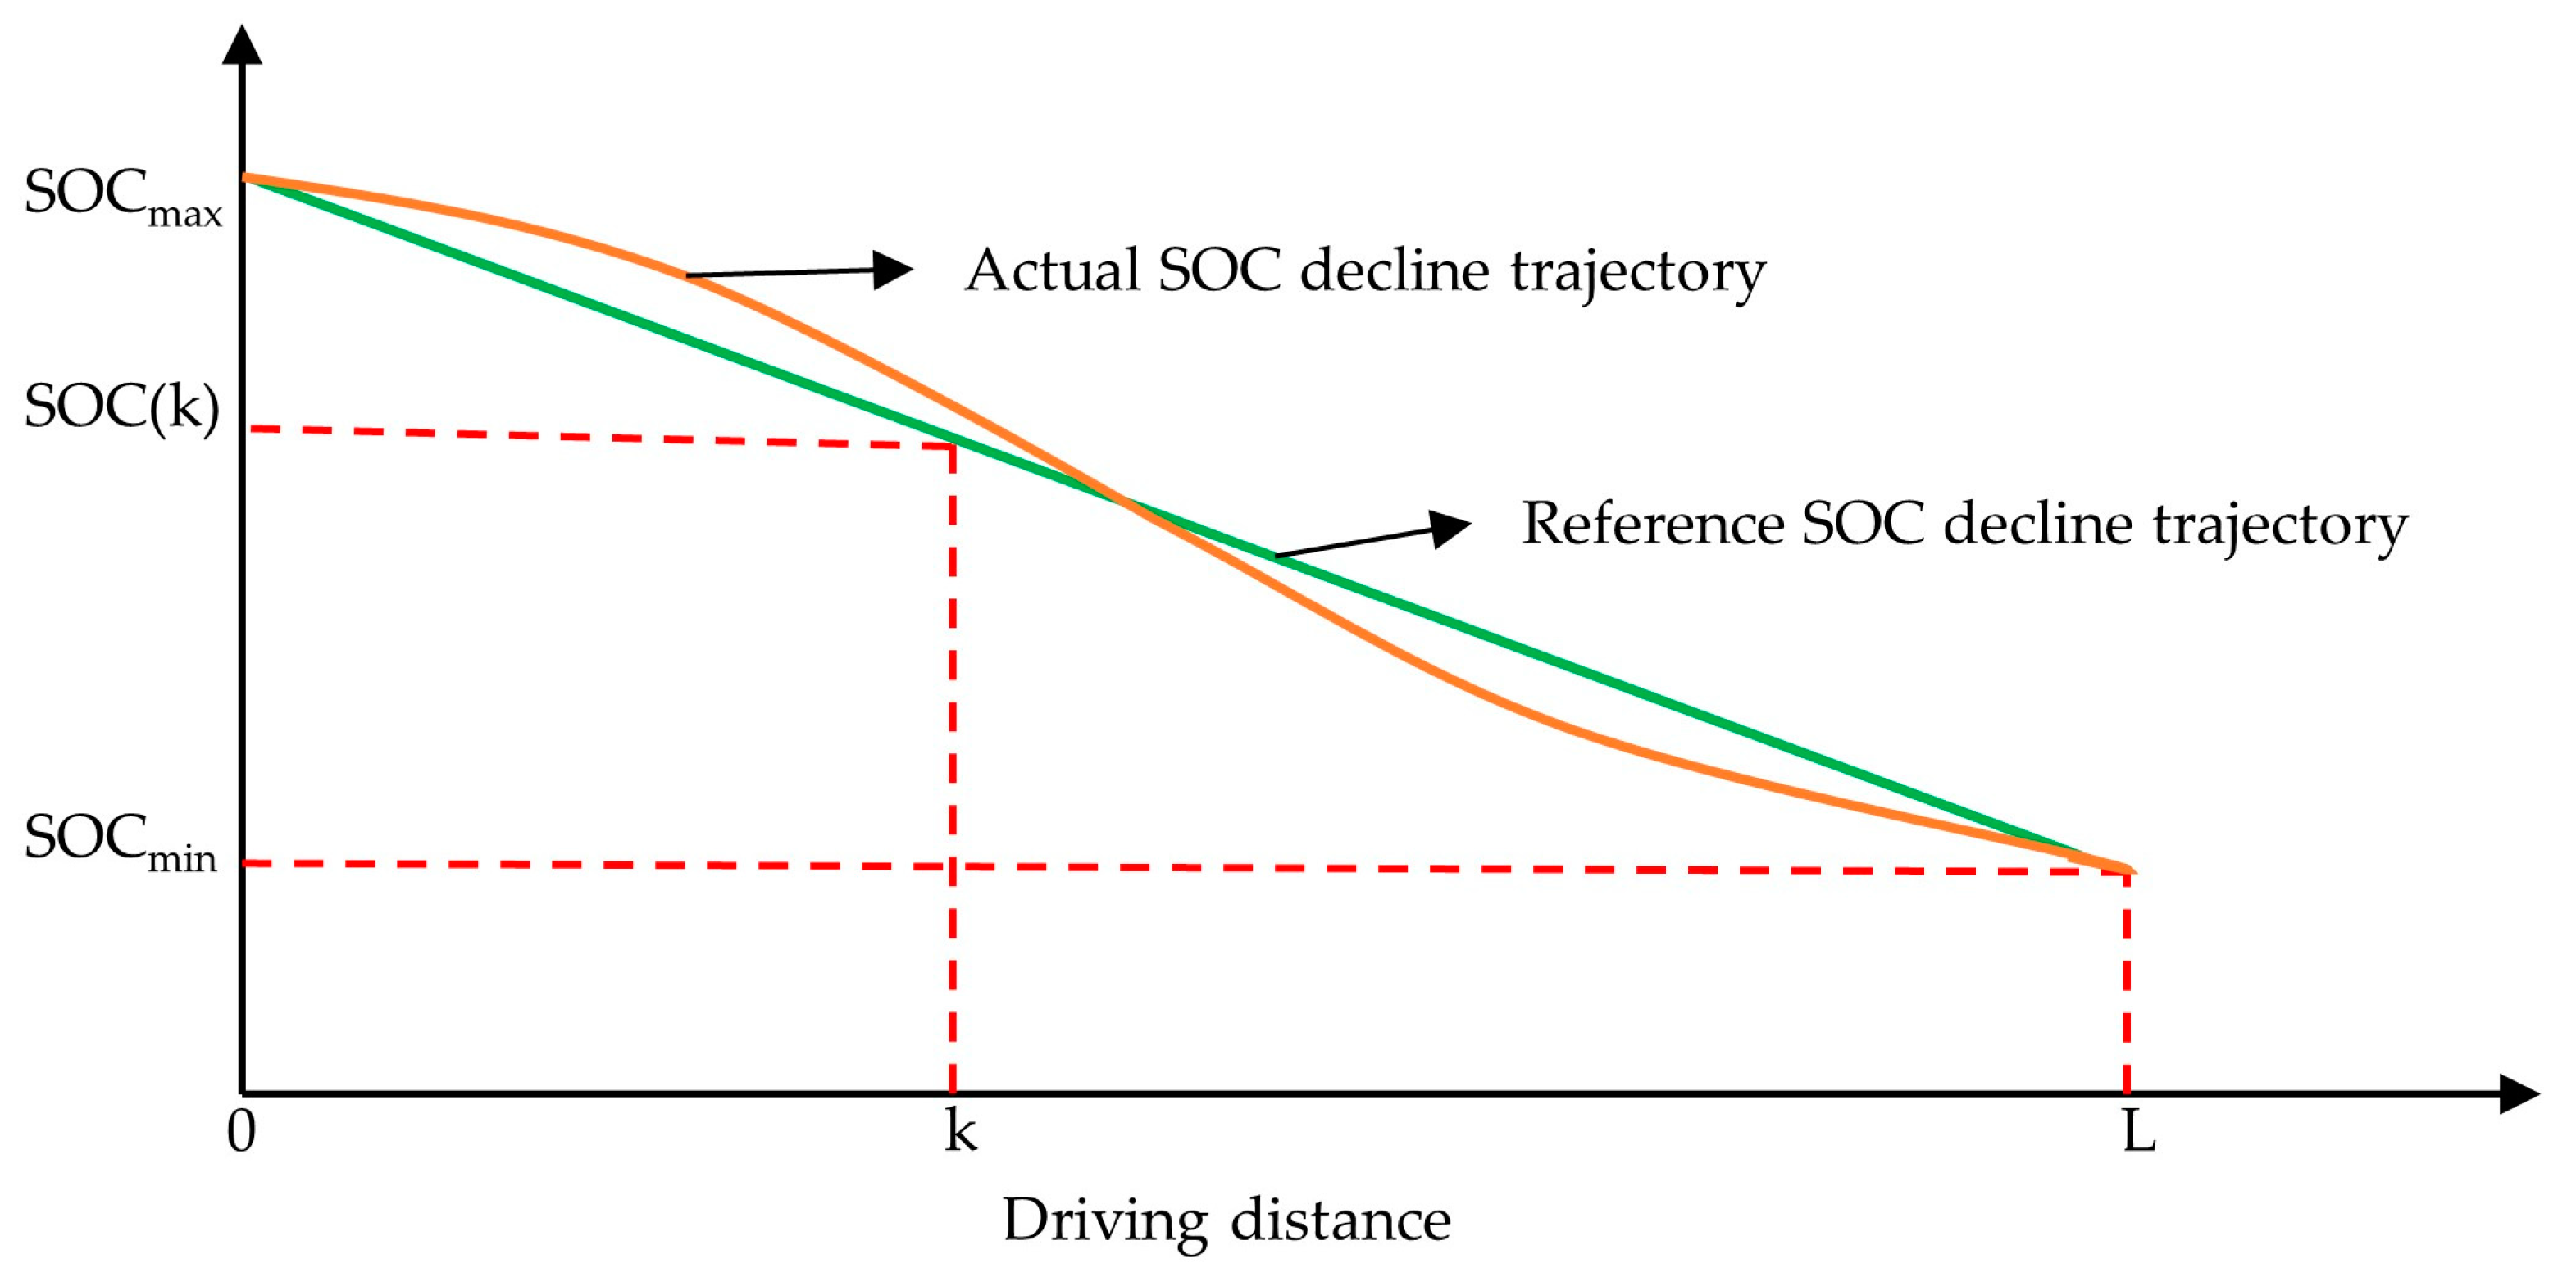
As can be seen in Figure 10, the DP algorithm can make the SOC of the battery pack drop to its final value at the end of the simulation under different driving distance (because of the short duration of some cycle conditions, the SOC does not reach the final value). The battery SOC decline trajectory as a whole shows a trend of uniform decline with driving distance; therefore, this paper takes the linear fitting curve of the optimal SOC decline trajectory obtained by DP as the ideal reference SOC decline trajectory, as shown in Figure 11.

4.2. Analysis of Load Identification Results Based on RLS

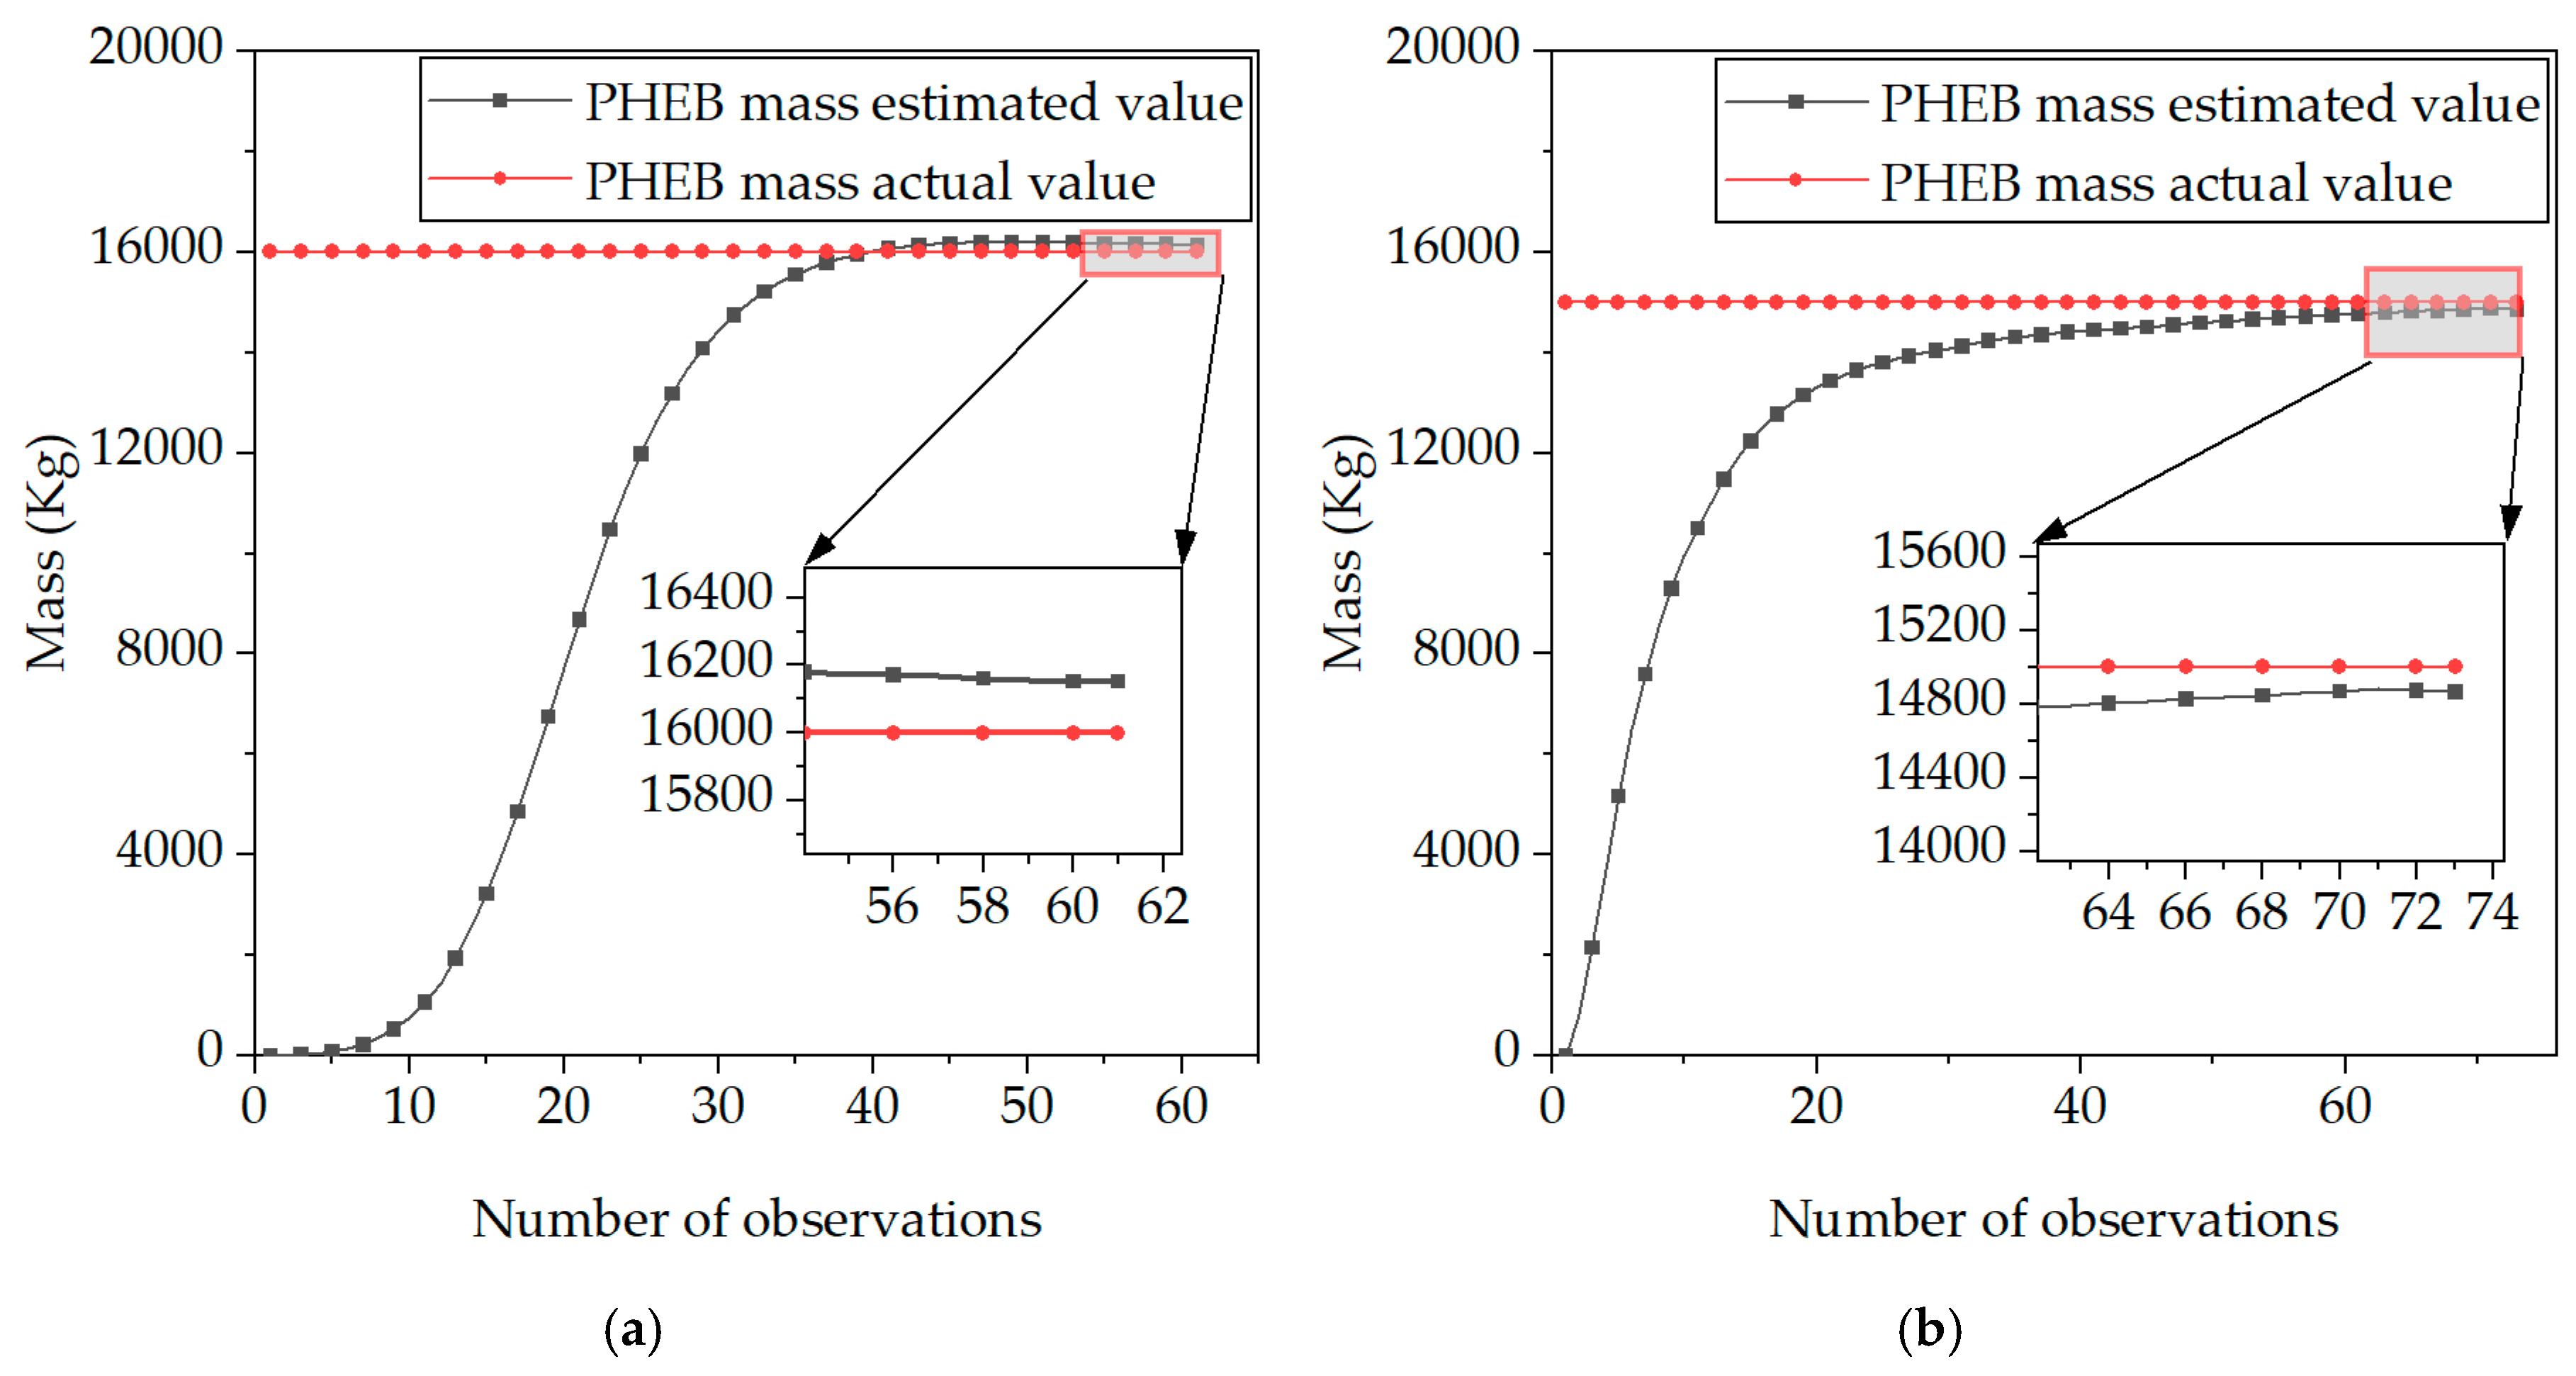
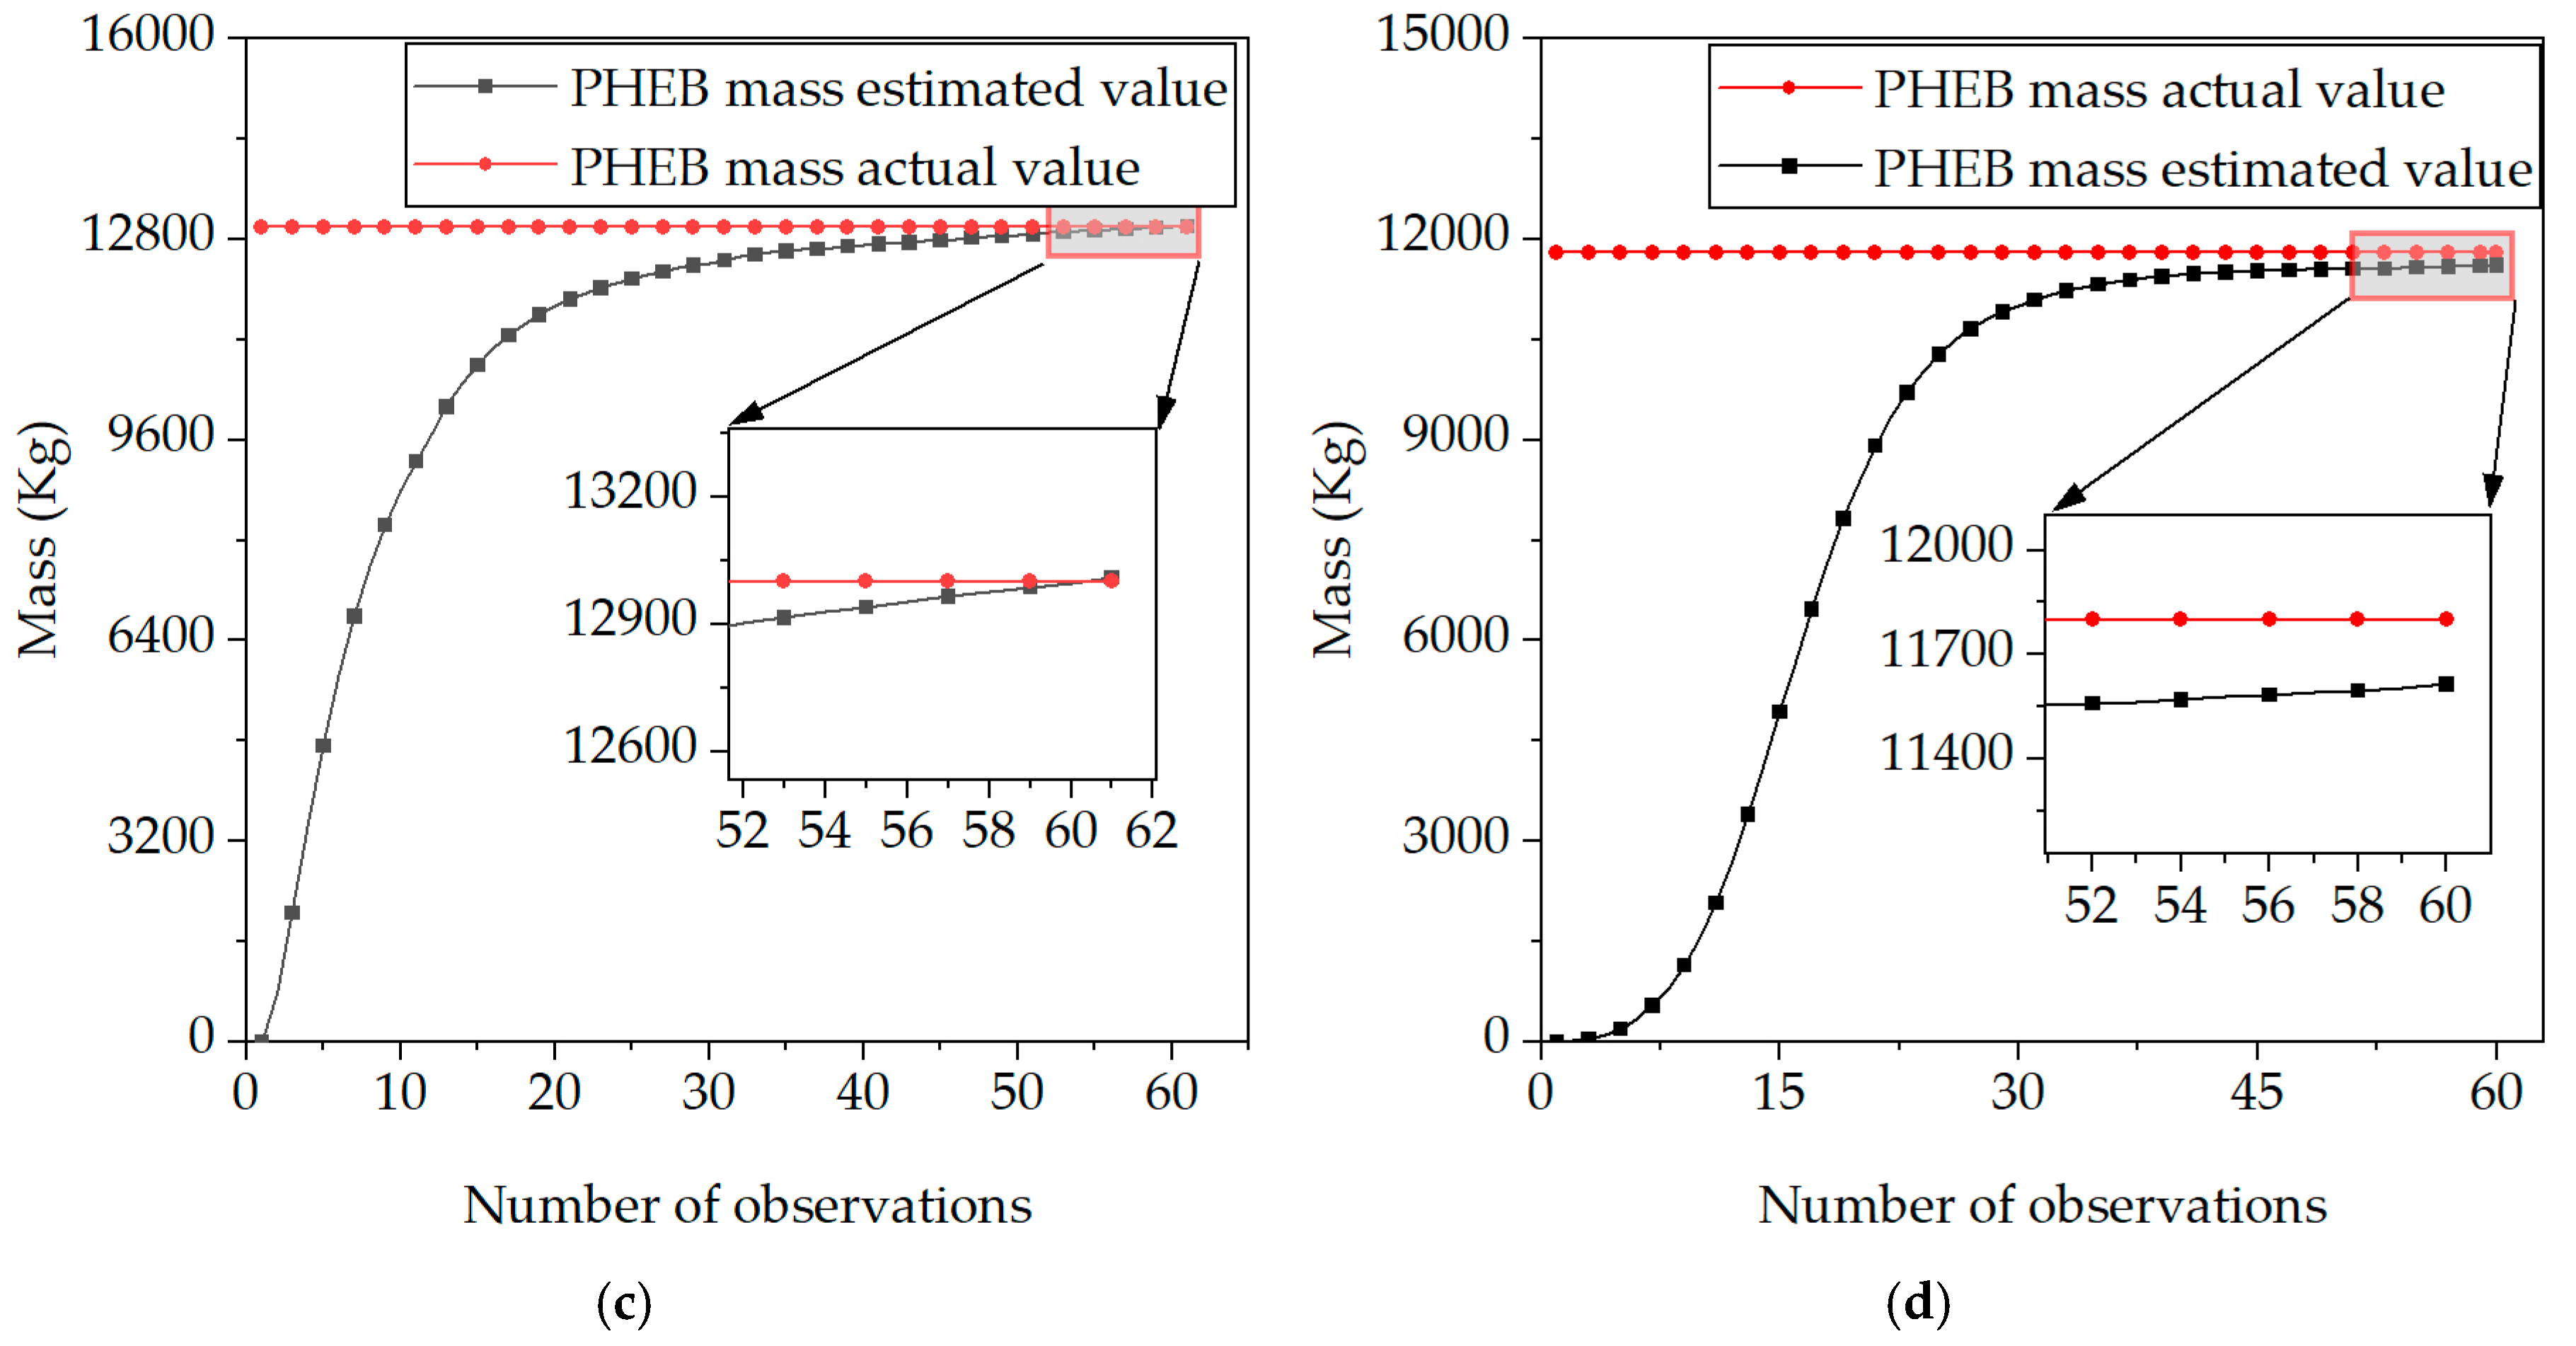
Based on the introduction of the RLS load identification method in Section 3.2, an analysis of its simulation results is now conducted. Multiple sets of observations of the PHEB start-up acceleration phase are extracted from the PHEB model constructed in the previous section to recognize the PHEB with different masses, and the results are shown in Figure 12.
From Figure 12a, it can be seen that the mass of the PHEB in the first identification process is 16,000 kg, the identification result finally converges near 16,200 kg, and the identification error fluctuates near 200 kg; from Figure 12b, it can be seen that the PHEB in the second identification process is 15,000 kg, the identification result converges near 14,800 kg, and the identification error fluctuates near 200 kg; from Figure 12c, it can be seen that the mass of the PHEB in the third identification process is 13,000 kg, the identification result finally converges near 12,900 kg, and the identification error fluctuates near 100 kg; from Figure 12d, it can be seen that the mass of the PHEB in the fourth identification process is 11,800 kg, the identification result converges near 11,500 kg, and the identification error fluctuates around 300 kg. According to the later analysis of the effect of load change on the change in SOC trajectory, the recognition errors are within the acceptable range. It can be seen that the RLS method identifies the PHEB mass more accurately, which supports the establishment of the map of the passenger load–bus station equivalent factors later.

4.3. Analysis of Influence of Load Variations on SOC

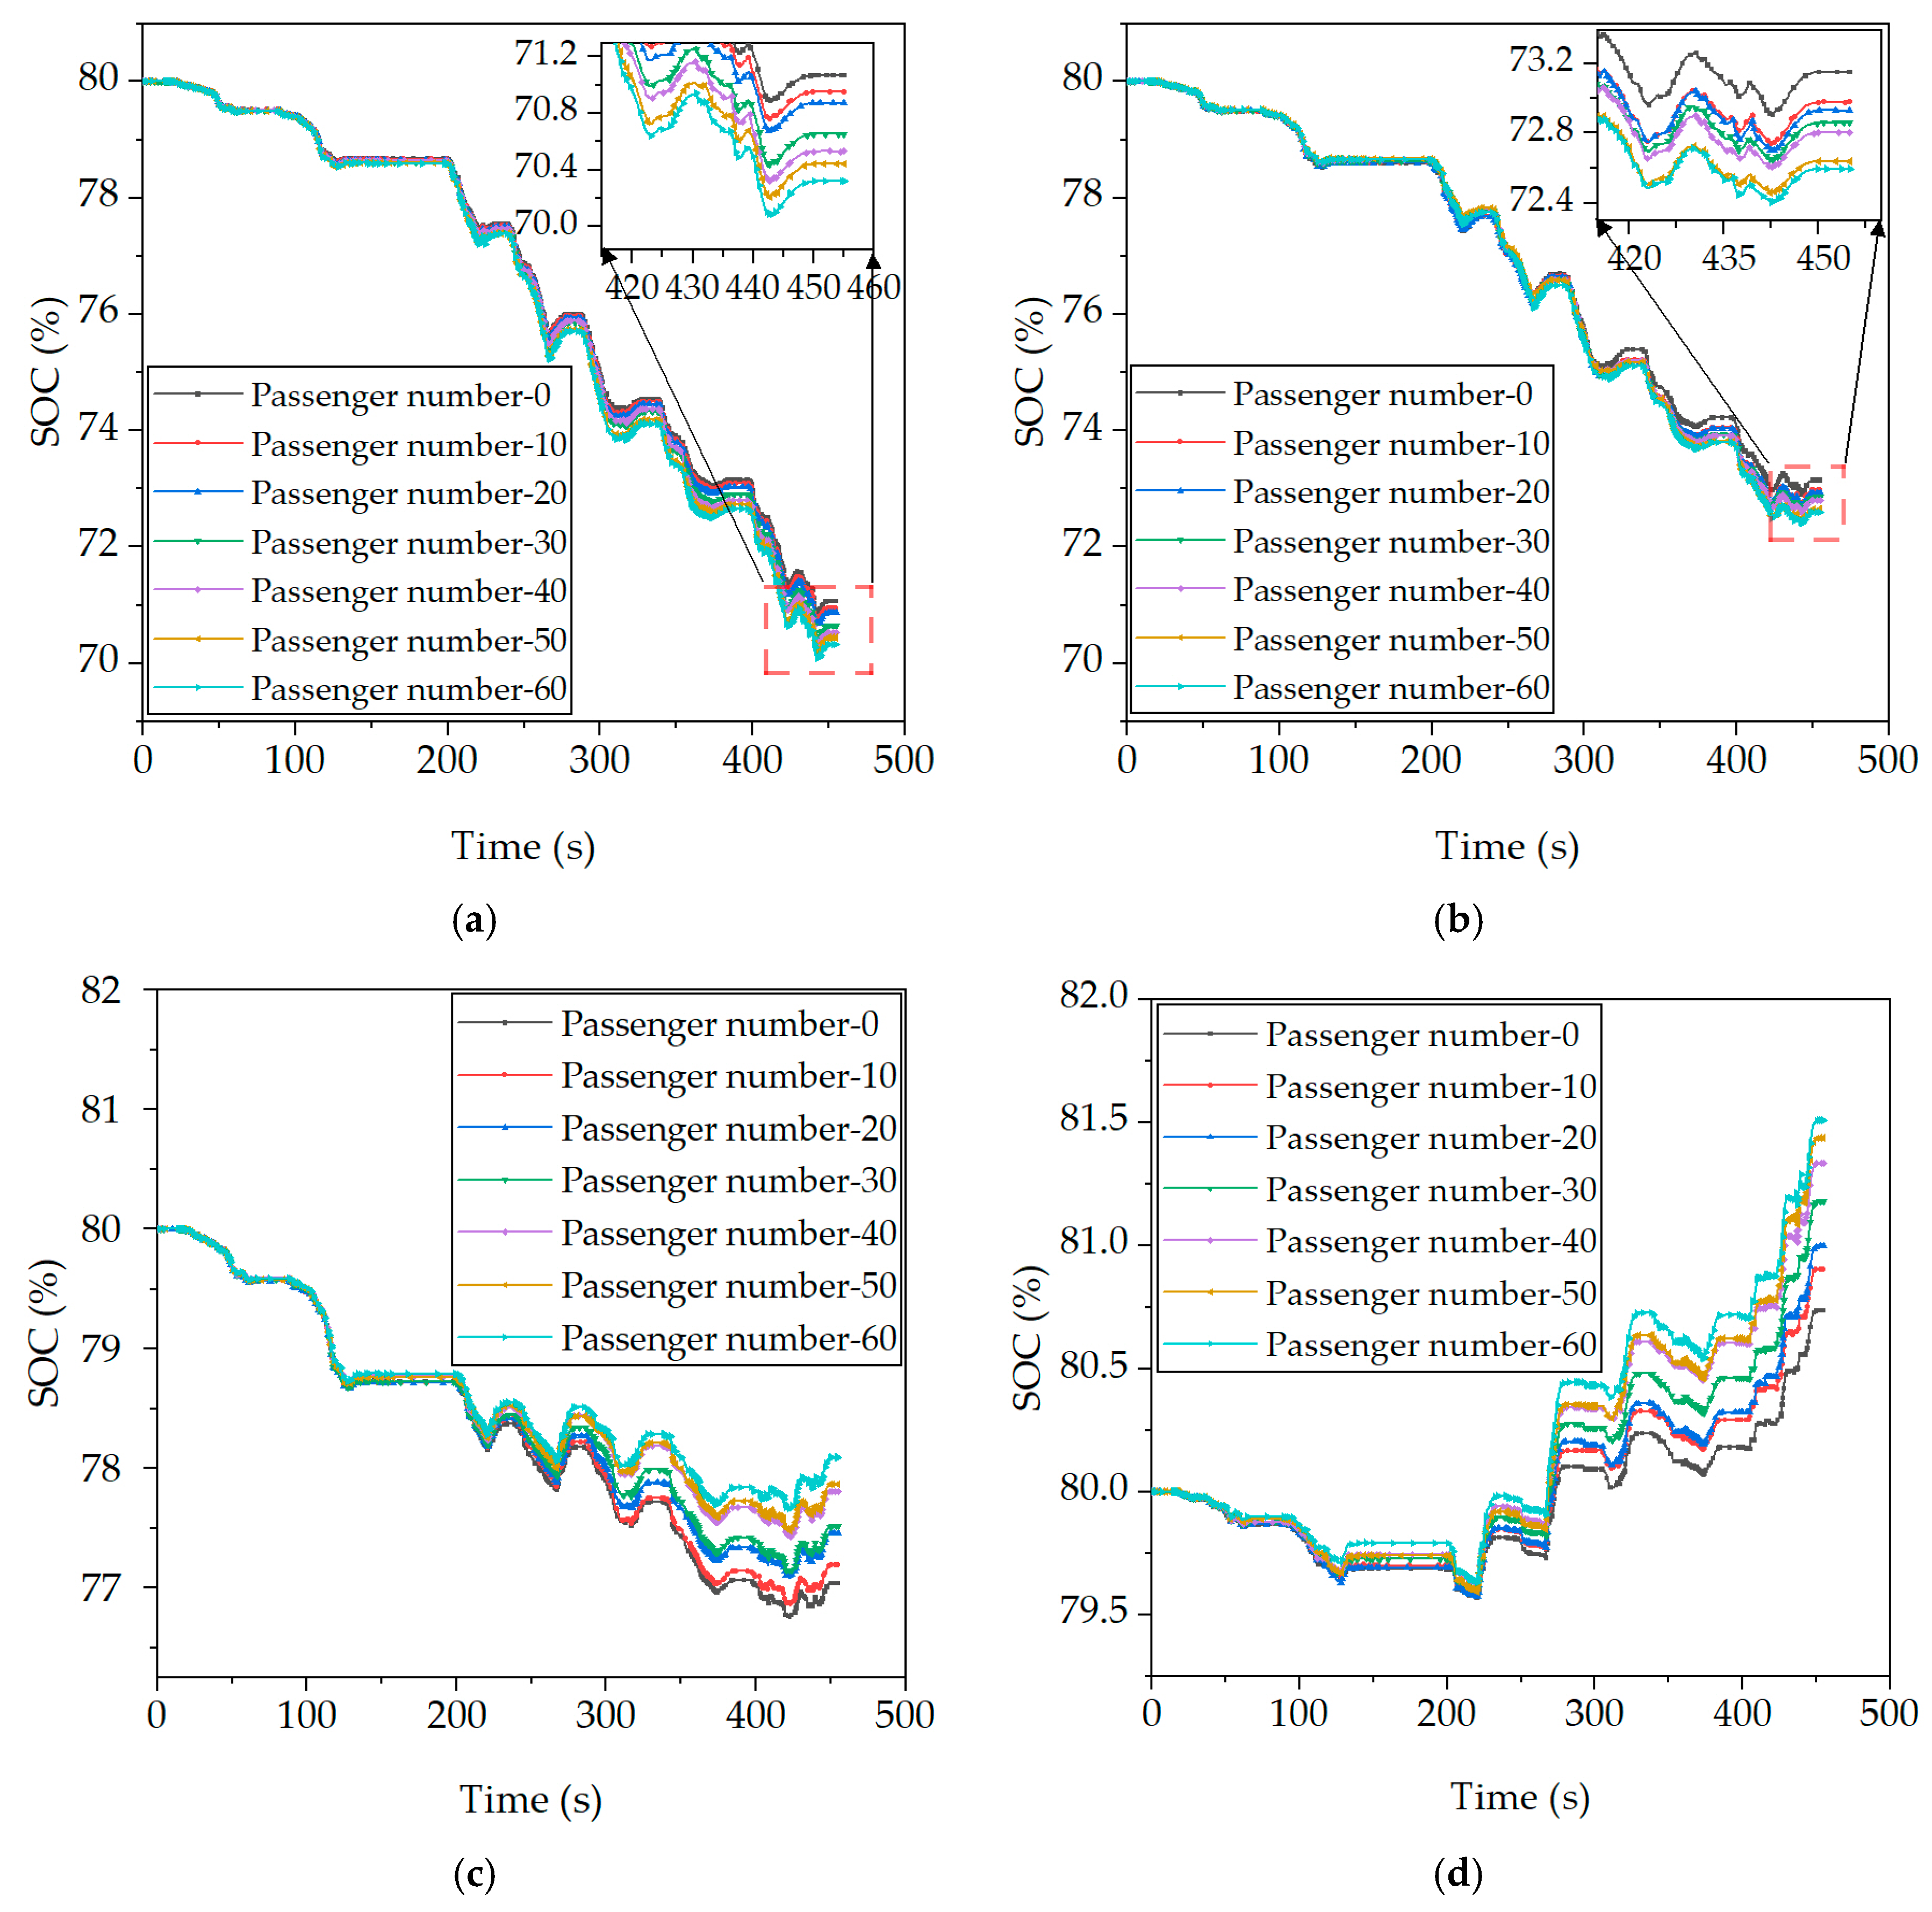
Based on the derivation of the ECMS in Section 3.3 and the partitioning of bus stations according to driving cycles in Section 3.5, an analysis is now conducted to investigate the impact of load variation on SOC under fixed equivalent factor conditions. In order to investigate the effect of load variations on the SOC, take a bus stop interval divided according to the cycling conditions with a fixed equivalent factor and a different number of passengers for simulation, where the mass of each passenger is 60 kg; the simulation results are shown in Figure 13.
From Figure 13a, it can be seen that when the equivalent factor is 3.5, almost all of the PHEB’s demand torque is provided by the motor, and compared to other equivalent factors, its battery consumption is the highest. As the number of passengers increases, although the bus requires more braking power, the energy recovered by motor braking also increases. However, the energy consumed by the motor drive is much greater than the energy recovered by braking, so as the number of passengers increases, SOC decreases more quickly, ultimately resulting in a difference of around 0.8 between 0 passengers and 60 passengers.
From Figure 13b, it can be seen that when the equivalent factor is 4.0, at this point, a portion of the demand torque is borne by the engine, resulting in a decrease in overall battery consumption. As the number of passengers increases, the energy recovered from braking also increases, and a noticeable reduction in the SOC difference between different passenger numbers is observed. Ultimately, there is a difference of approximately 0.6 between 0 passengers and 60 passengers.
From Figure 13c, it can be seen that when the equivalent factor is 4.5, the engine is more involved in torque distribution. Compared to equivalent factors of 3.5 and 4.0, there is a significant reduction in battery consumption. The difference in battery consumption corresponding to different passenger numbers further decreases, and as the number of passengers increases, the energy recovered from motor braking also increases, resulting in higher SOC values. At the end of the simulation, the battery consumption is minimal when there are 60 passengers, and it is maximal when there are 0 passengers.
From Figure 13d, it can be seen that when the equivalent factor is 5.0, almost all of the vehicle’s demand torque is provided by the engine, and the battery is involved in driving in very few instances. The battery consumption corresponding to different passenger numbers is basically the same. Similarly, as the number of passengers increases, the energy recovered from motor braking also increases, resulting in higher SOC values. At the end of the simulation, the battery consumption is minimal when there are 60 passengers, and it is maximal when there are 0 passengers.
Therefore, it can be concluded that under the same cycle condition, the SOC decline trajectories corresponding to different equivalent factors and passenger numbers are significantly different. This corresponds to different power distribution scenarios. It is therefore necessary to select an appropriate equivalent factor for different passenger numbers under specific cycle conditions in order to achieve rational energy distribution.

4.4. Establishment of Passenger Load–Bus Station Equivalent Factor Map

Based on the bus stations divided according to the cycle condition, different levels of passenger numbers are assigned using a GA to find the equivalent factors corresponding to different passenger numbers at different bus stations. A passenger load–bus station equivalent factor map is created to ensure that the actual SOC follows the reference SOC decline trajectory, thereby achieving optimized energy allocation.
The rated seating capacity of the PHEB used in this paper is 25. It is stipulated that when the PHEB carries 0–25 passengers, it is in a light load state; when it carries 25–50 passengers, it is in a medium load state; and when it carries 50–75 passengers, the bus is in a heavy load state.
Taking the fourth bus station from the segmented stations as an example and assigning the passenger load for this cycle condition segment as “light load” (selecting the median value within the range of light load passenger numbers with an average weight of 60 kg per passenger), the genetic algorithm is utilized to find its corresponding optimal equivalent factor. As shown in Figure 14, this is cycle condition for the fourth bus station.
When the equivalent factor is 3, the motor bears all the required torque, whereas when the equivalent factor is 6, the engine bears all the required torque. Therefore, the range of equivalent factors is set from 3 to 6. At the beginning of the GA optimization, 10 equivalent factors within the range of 3 to 6 are randomly generated. Based on the simulation results of each equivalent factor, their corresponding fitness is calculated, leading to the next step of GA optimization, which generates new equivalent factors, and so on, until the equivalent factor meets the fitness requirements. The ideal fitness function value is 0, but the actual result will only approach this value, so the absolute value of the fitness of each equivalent factor is used as the evaluation criterion, where a smaller value indicates a more ideal equivalent factor. The fitness of the first generation equivalent factors and the fitness of the last generation equivalent factors are shown in Table 2 and Table 3, respectively.
Using the aforementioned method for finding the equivalent factor, with the set upper limit of SOC as 0.8 and the lower limit as 0.4, assigning light, medium, and heavy load to each segmented bus station, the corresponding optimal equivalent factors are determined. This ultimately yields the passenger load–bus station equivalent factor map, as shown in Figure 15.

4.5. Effectiveness Simulation Analysis of A-ECMS

In this section, in order to validate the effectiveness of the A-ECMS, simulation analysis is conducted in the Matlab/Simulink environment, with a comparison against rule-based EMS, ECMS, and DP.
Different load levels are randomly assigned to each bus station, and the optimal equivalent factors corresponding to each load are determined through the passenger load–bus station equivalent factor map, as shown in Table 4.
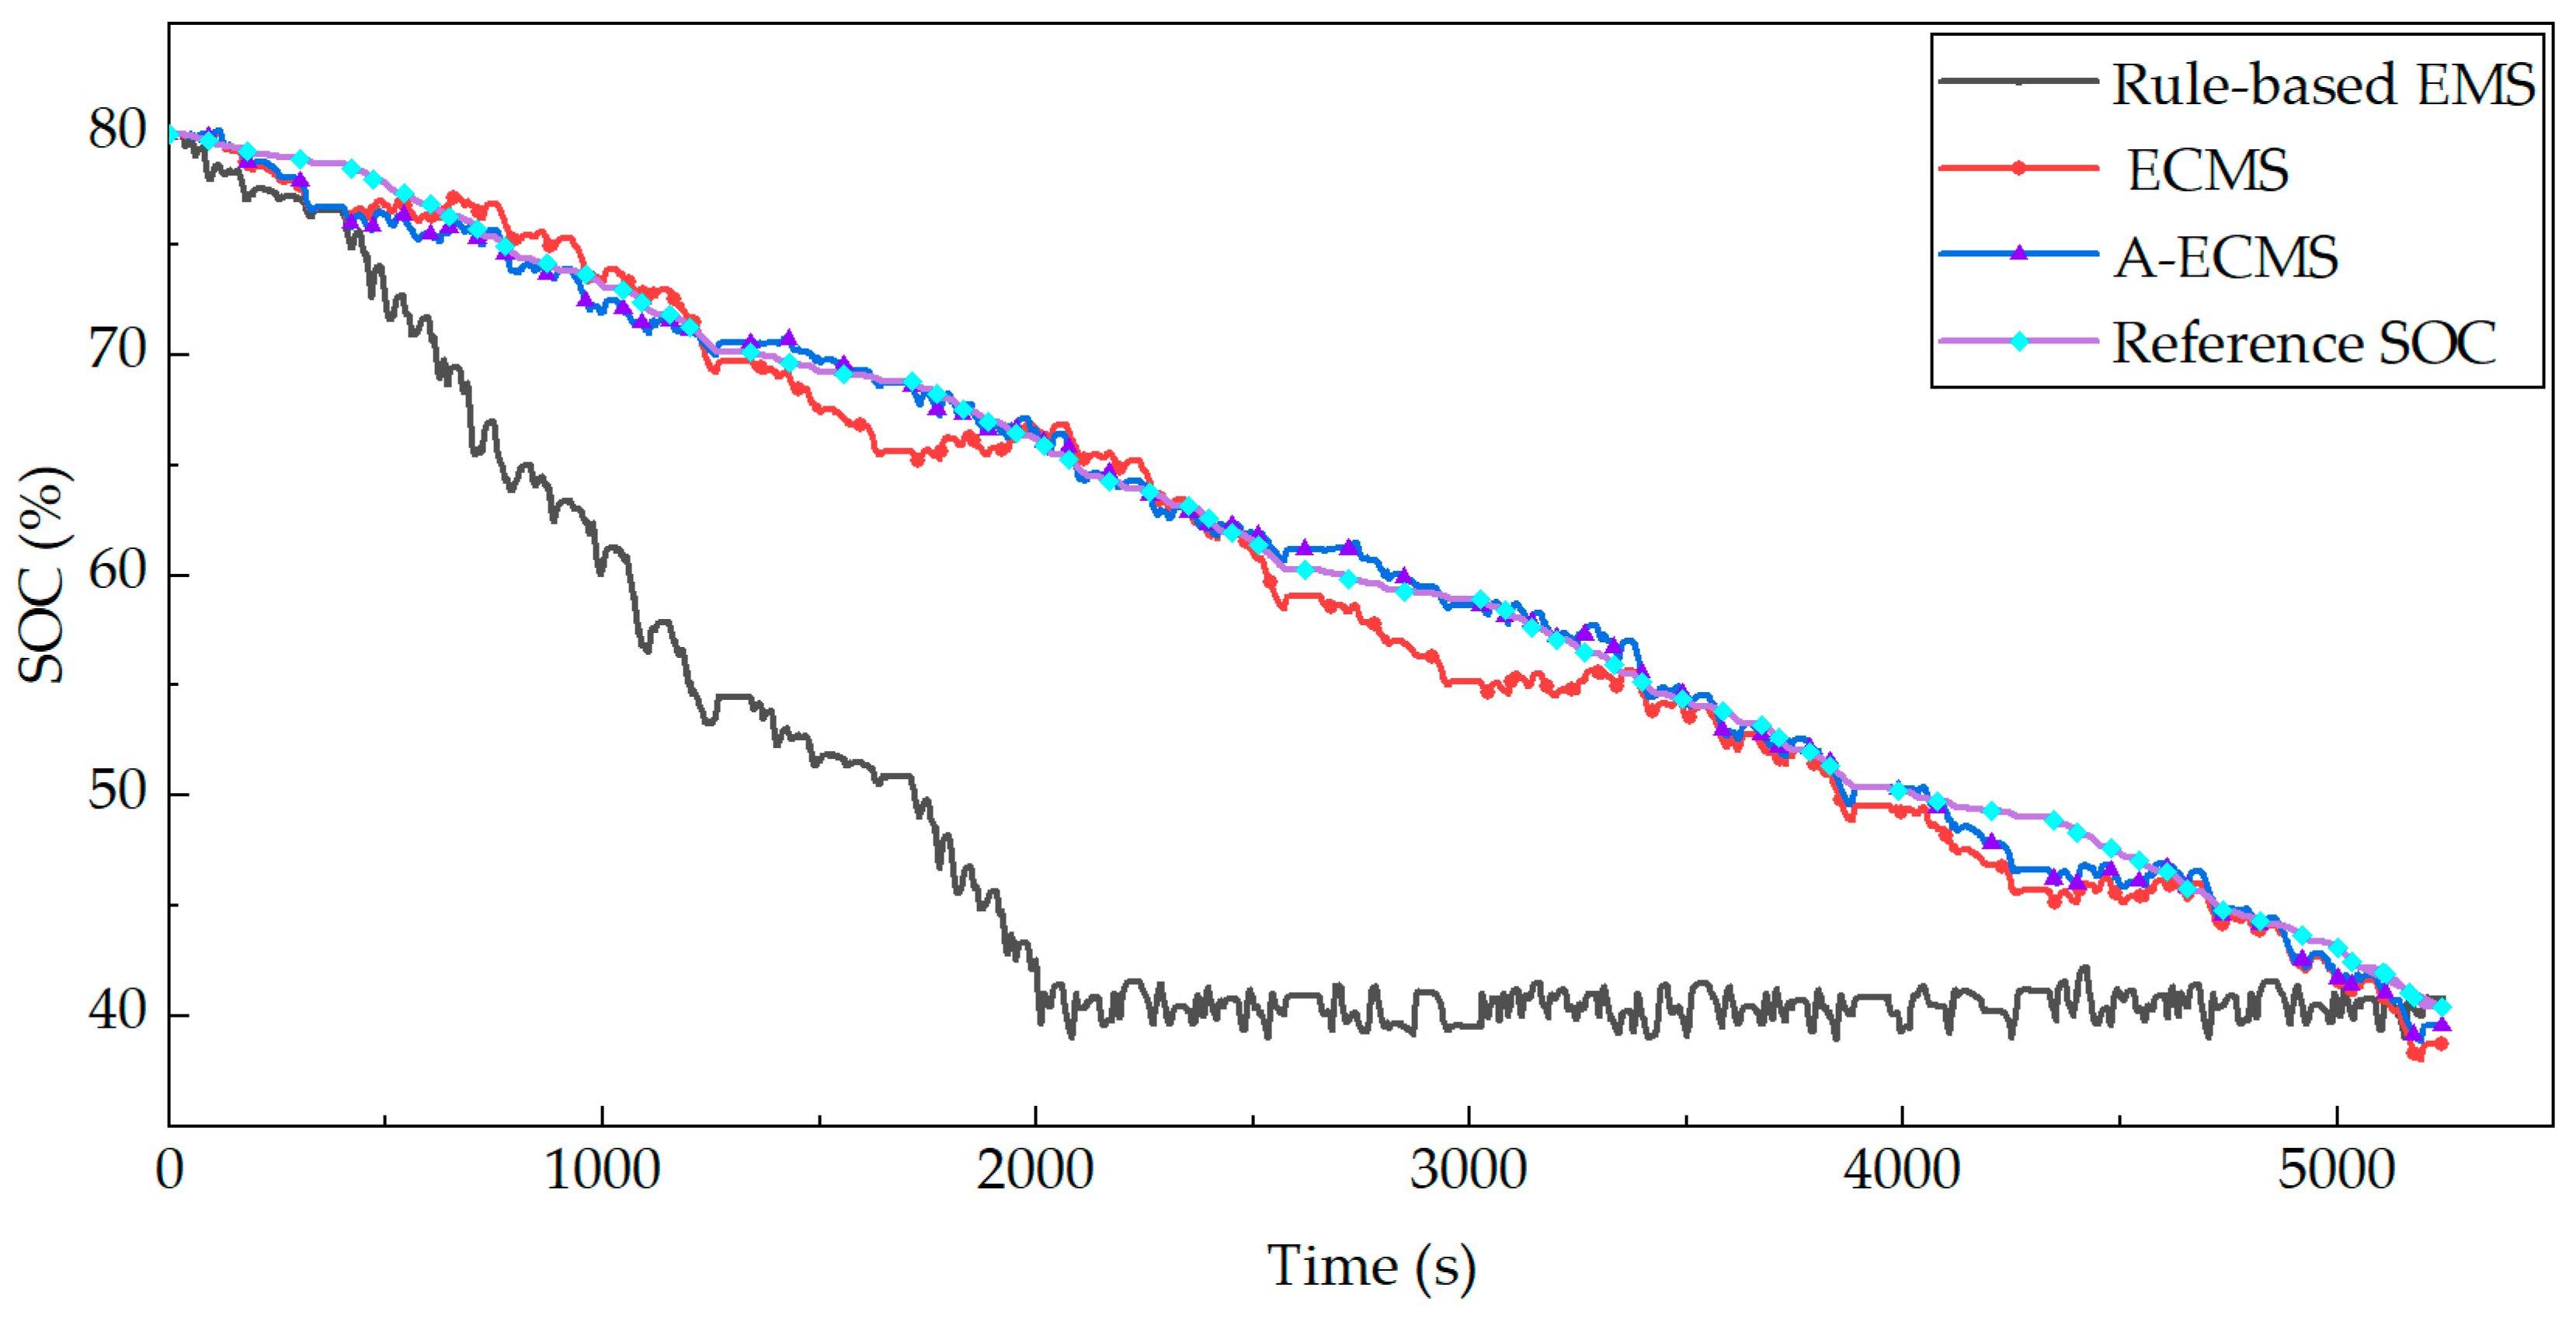
The decline trajectory of SOC for different EMSs, as shown in Figure 16 and Figure 17.
From Figure 16, it can be observed that compared to the rule-based EMS and the ECMS, the A-ECMS more accurately follows the reference SOC decline trajectory, demonstrating its capability to adapt to load variations. As regenerative braking occurs during PHEB operation, there is a partial upward trend in the actual SOC decline trajectory. This deviates from the consistent downward trend of the reference SOC decline trajectory, leading to significant errors in certain parts of the trajectory. However, the actual SOC decline trajectory consistently surrounds the reference SOC decline trajectory, thereby not significantly impacting the practical power optimization distribution.
From Figure 17, it can be observed that the SOC descent trajectory of the A-ECMS surrounds the SOC descent trajectory of the DP for most of the time, which indirectly reflects that the energy allocation strategy of the A-ECMS is close to optimal.
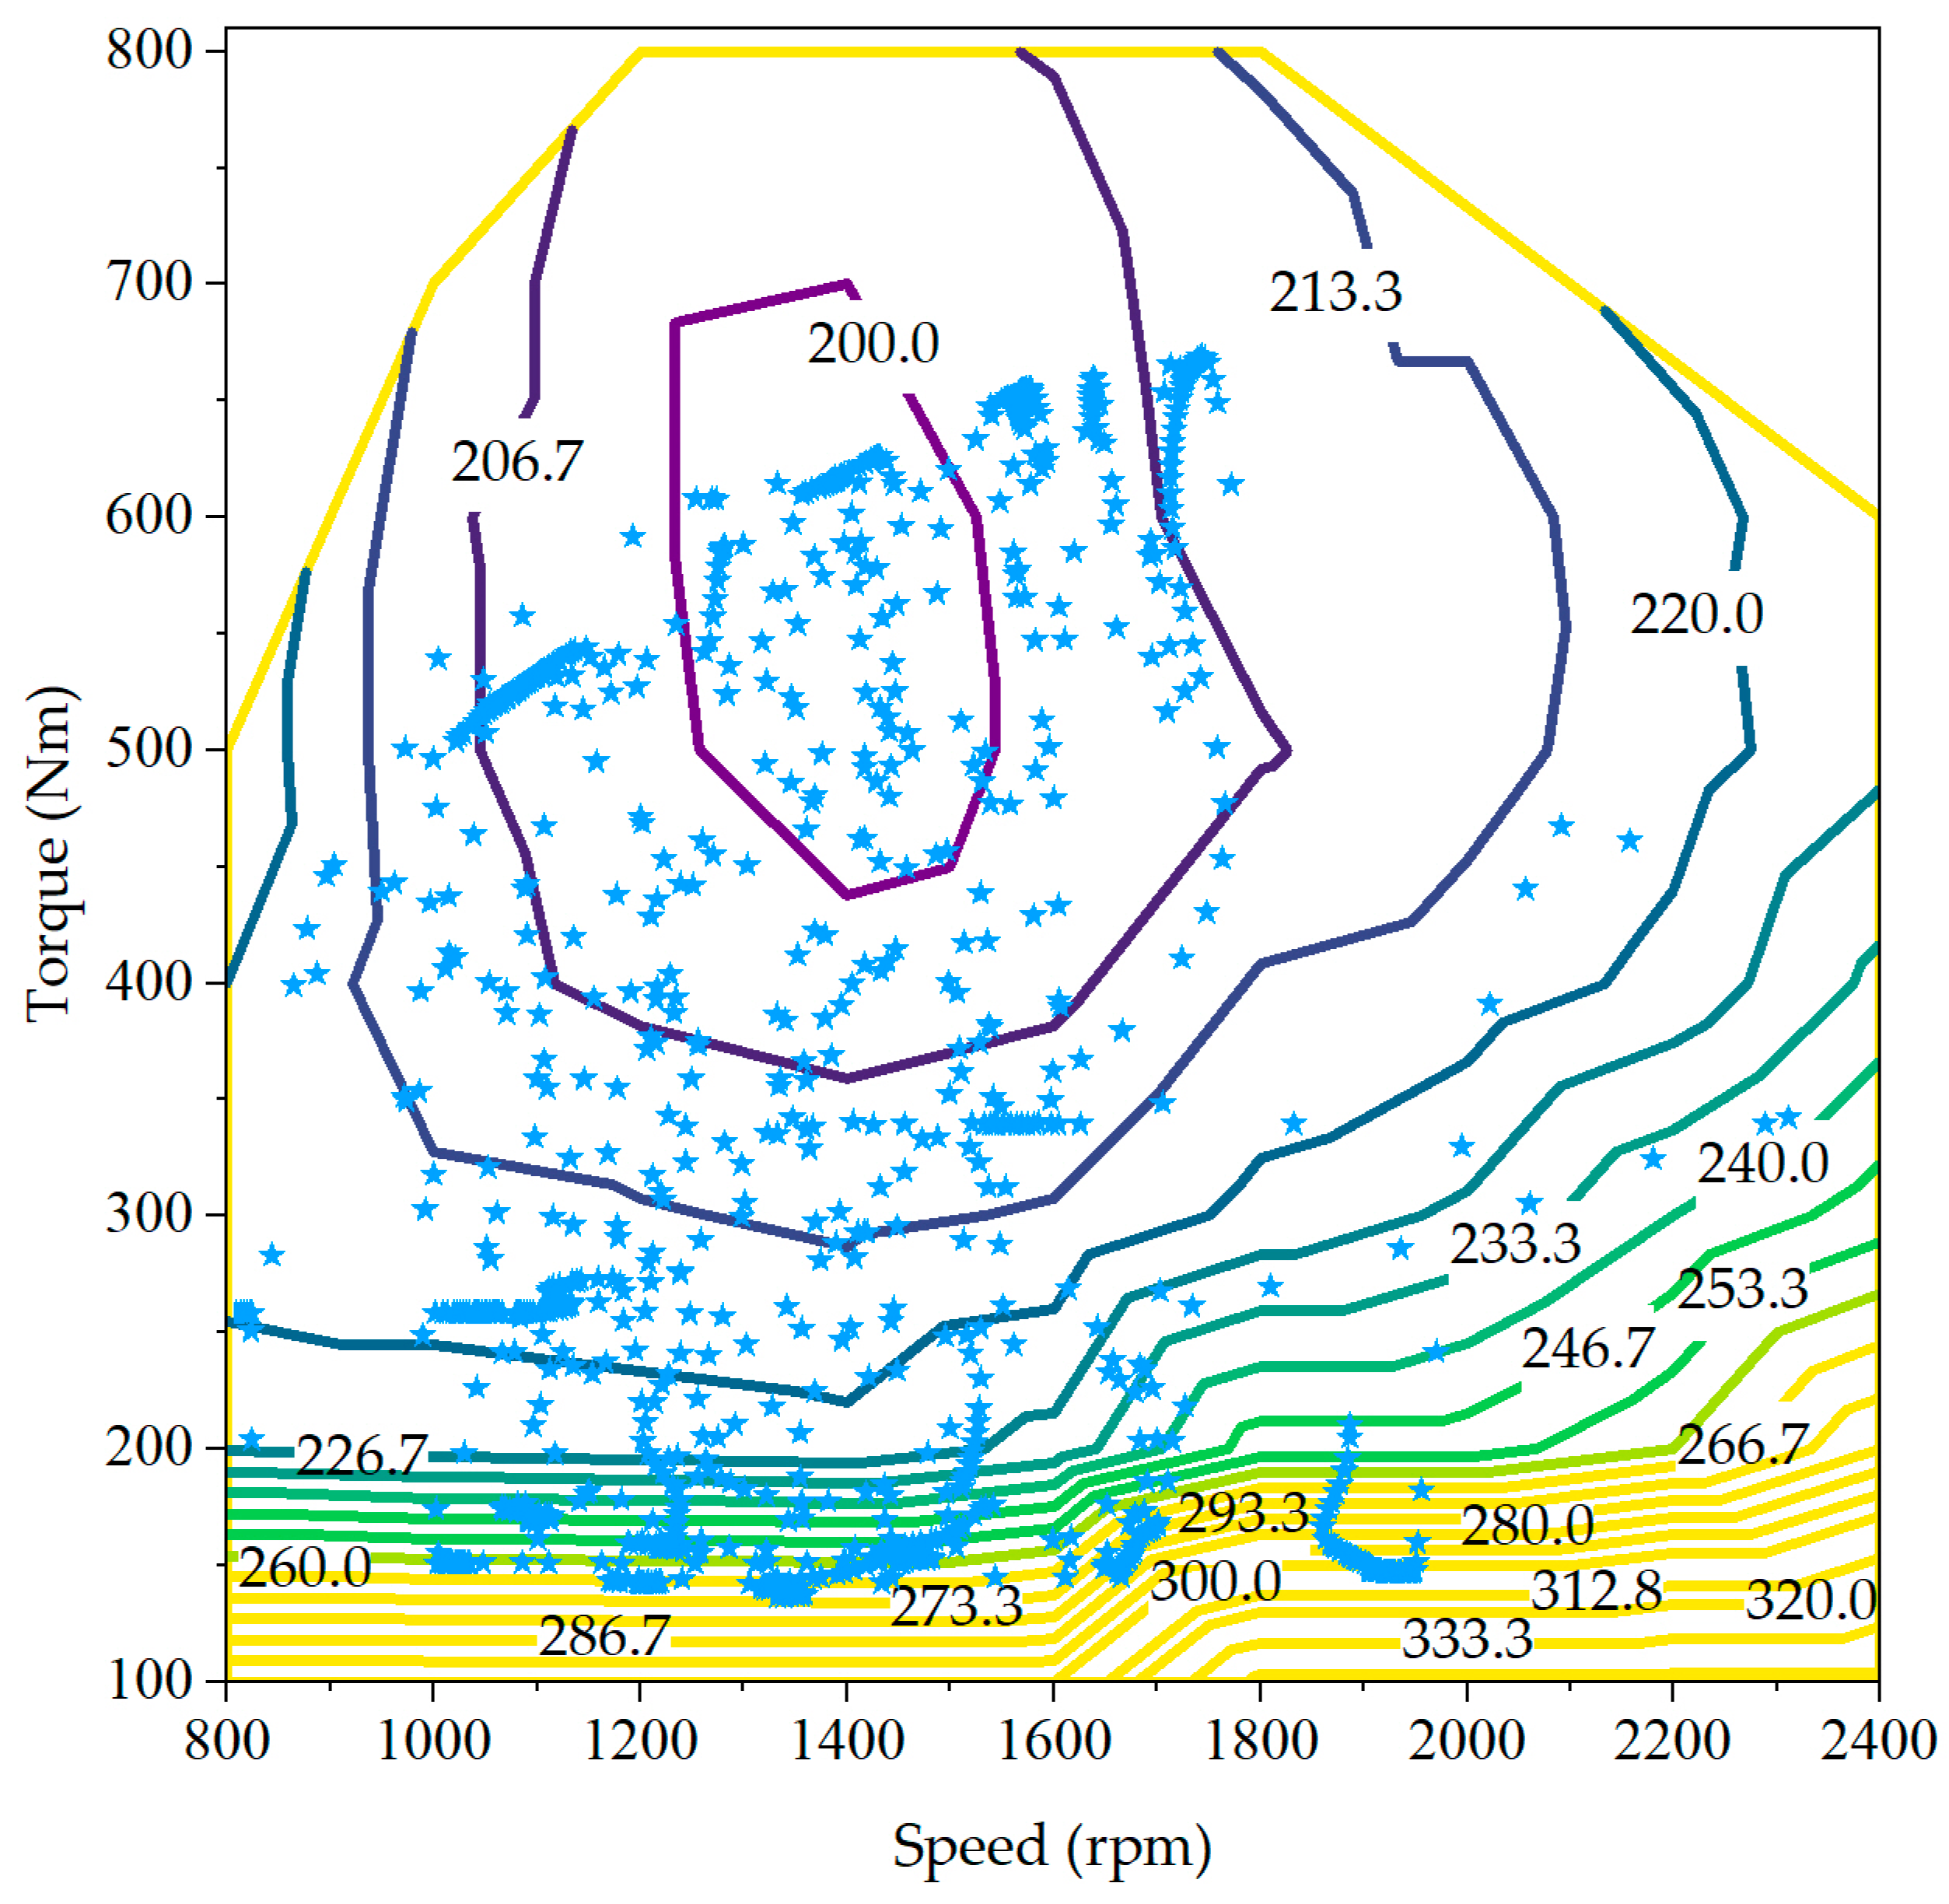
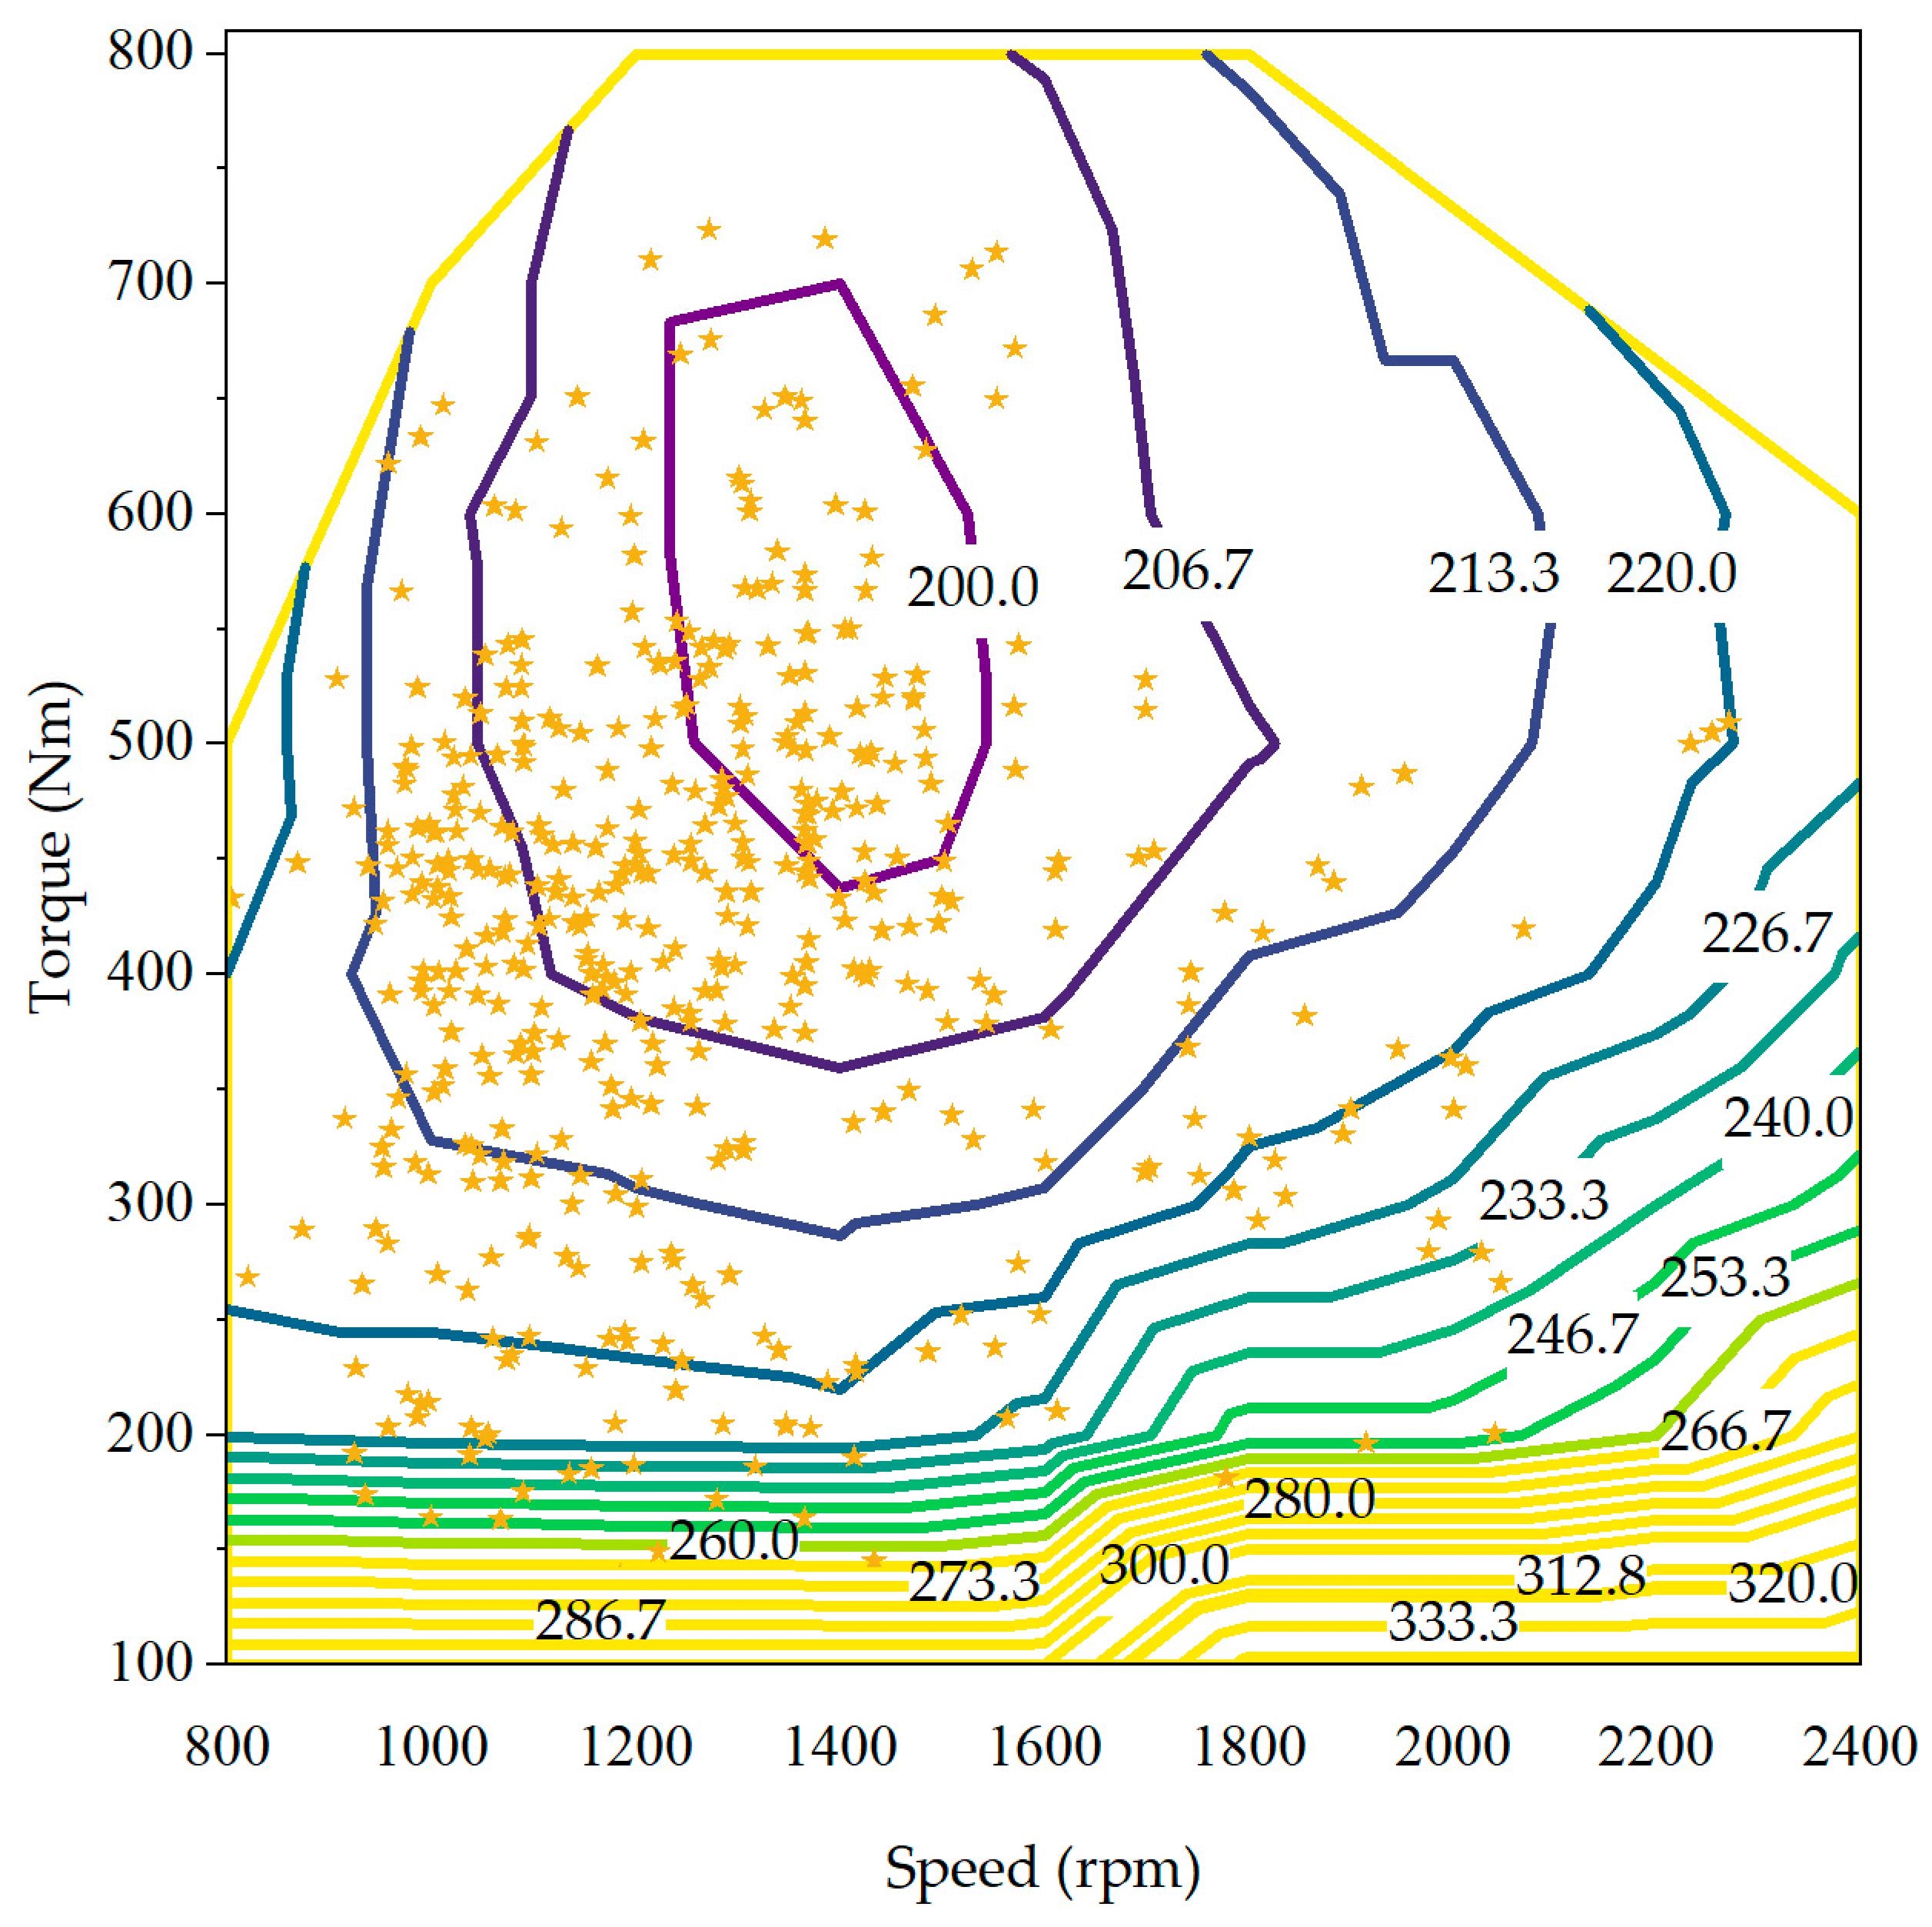
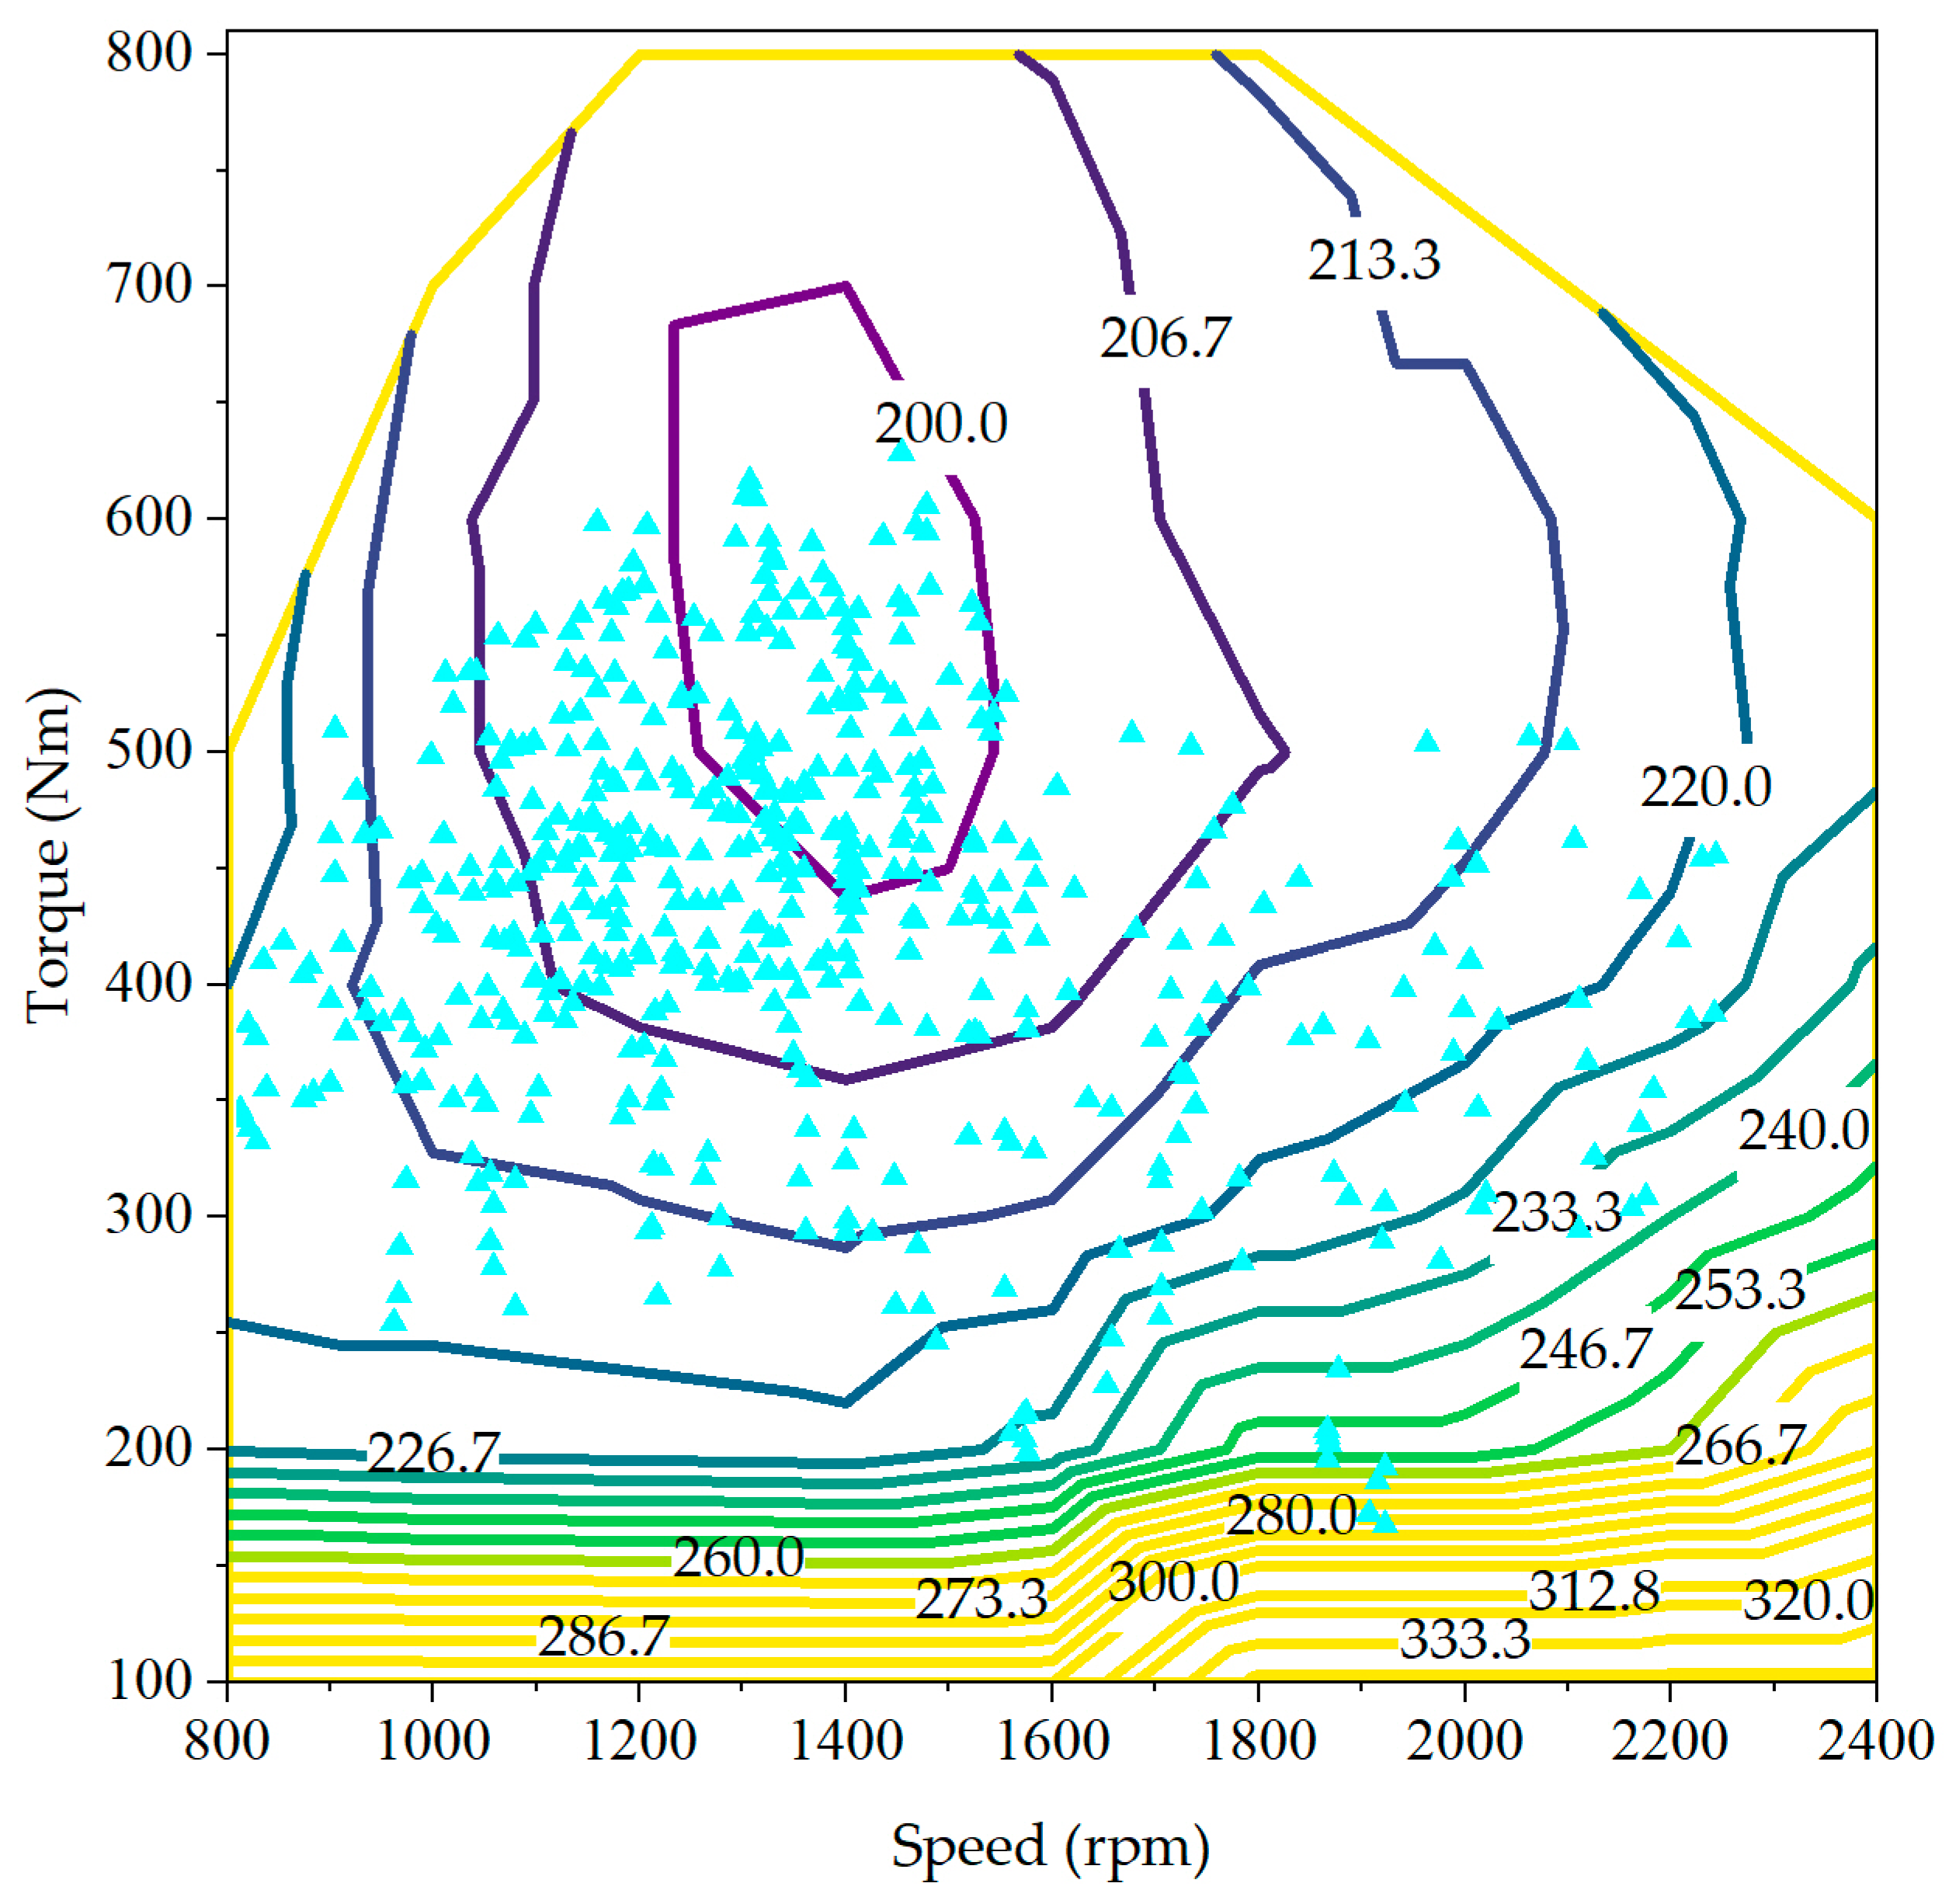
The operating points of the engine under different energy management strategies are illustrated in Figure 18, Figure 19 and Figure 20.
By comparing the operating points of the engine for the three EMSs, it can be observed that the rule-based EMS results in relatively uniform engine operating points, with only a few falling in the high-efficiency region. For the ECMS, the engine operating points are more concentrated, but the fixed equivalent factor cannot adapt to the impact of load changes on power distribution, resulting in most engine operating points slightly deviating from the high-efficiency region. In the case of the A-ECMS, the engine operating points are more concentrated, and with the adjustment of different equivalent factors, most engine operating points are distributed within the high-efficiency region. Therefore, it can be concluded that the A-ECMS improves the fuel economy of the vehicle during vehicle operation.
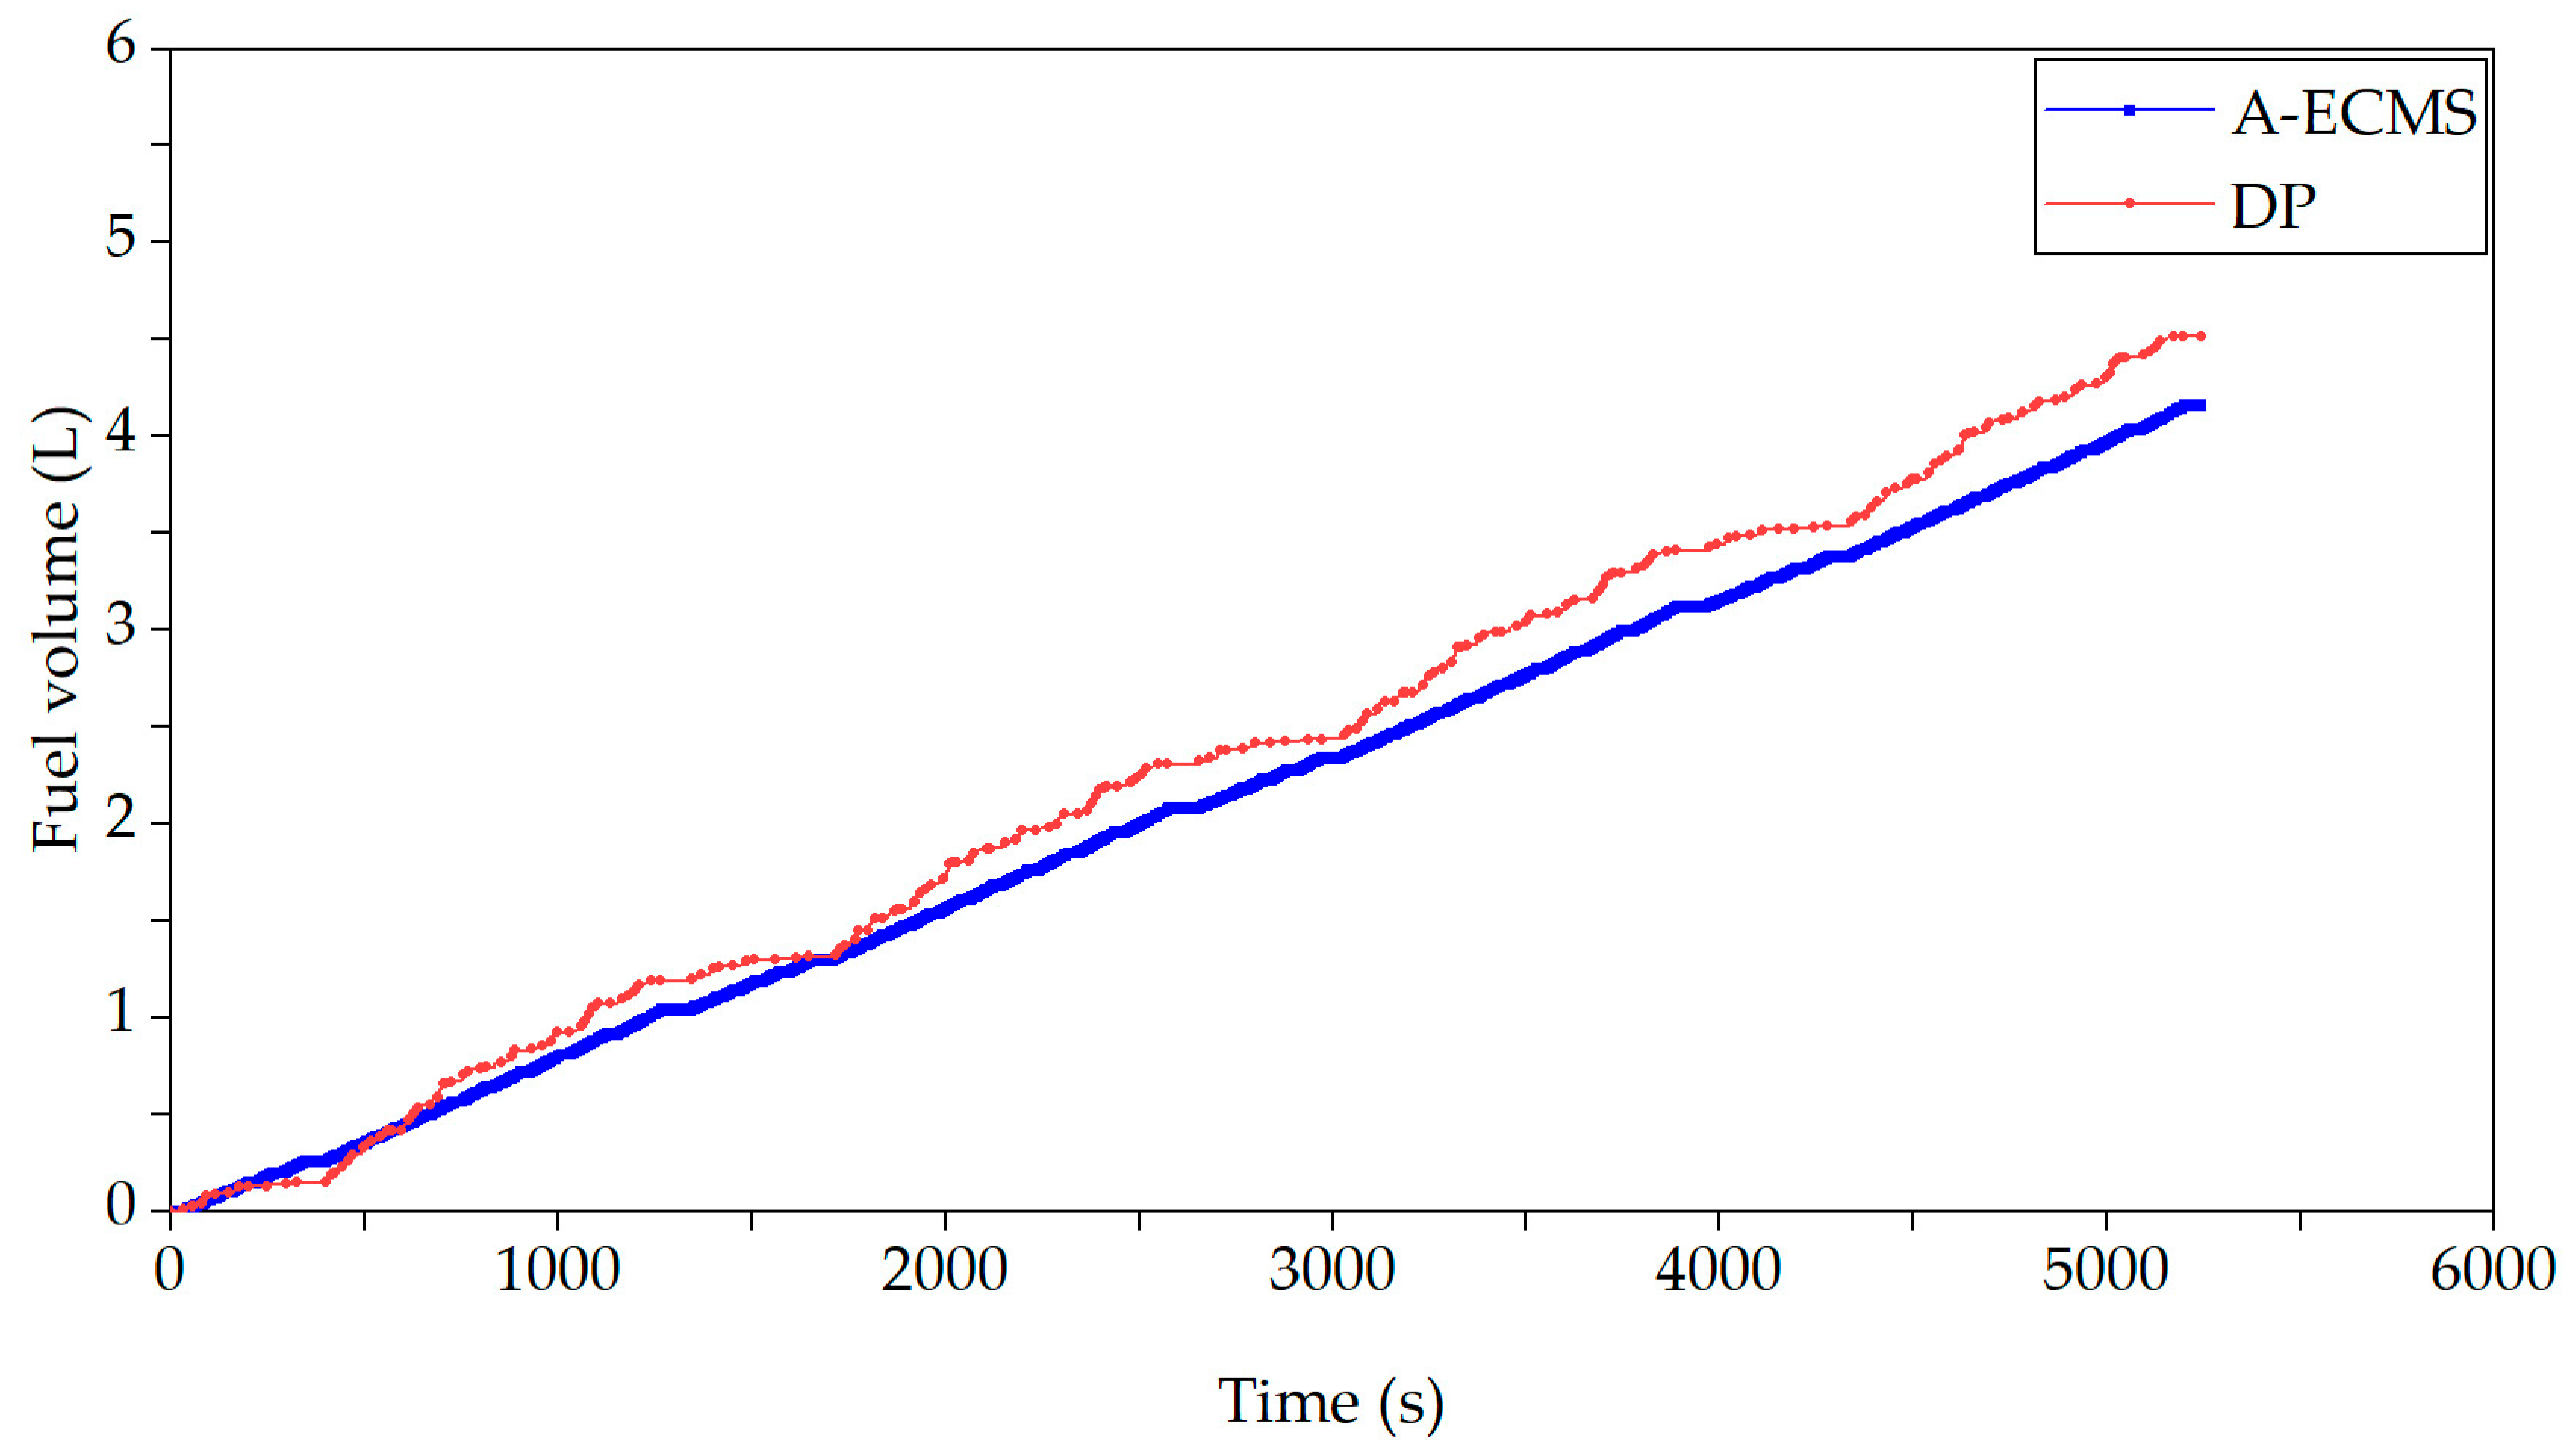
Energy consumption comparison of different EMSs, as shown in Figure 21 and Figure 22 and Table 5.
Through comparing the energy consumption of the three EMSs throughout the entire operating cycle, it can be observed that when the battery SOC has not reached its lower limit, the rule-based EMS exhibits almost zero fuel consumption, while electricity consumption rises steeply. When the battery SOC reaches its lower limit, fuel consumption increases sharply, while electricity consumption fluctuates near an equilibrium value. It is evident that the two energy sources are not being utilized in a complementary manner, resulting in poor fuel economy for the PHEB. Both ECMS and A-ECMS demonstrate relatively uniform changes in fuel and electricity consumption. When converted to fuel consumption and electricity consumption per 100 km, as shown in Table 5 above, the fuel consumption per 100 km for A-ECMS has increased by 2.59% and 10.1% compared to the ECMS and rule-based EMS, respectively. However, the A-ECMS still has nearly a 3% gap in fuel consumption per 100 km compared to the DP, and its fuel-saving performance still needs improvement.

5. Conclusions

Compared to the previous adaptive ECMS based on driver driving style, PHEB driving distance, battery initial SOC, and driving cycles, this paper considers the impact of passenger load variations in actual urban public transportation on PHEB power demand and power distribution. Innovatively integrating the passenger load variations at each bus station into the selection of ECMS equivalent factors, the paper proposes an A-ECMS that considers passenger load variations. Its aim is to enable the EMS to adapt to the impact of load changes on energy distribution issues, thereby improving the fuel economy during PHEB operation. In a group of simulations with an SOC upper limit of 0.8 and a lower limit of 0.4, compared to rule-based EMS and fixed equivalent factor ECMS, the proposed A-ECMS improved fuel economy by 10.1% and 2.59%, respectively.
However, in this study, passenger load was only divided into three levels based on the load identification results, with each load level representing a range of passenger numbers. The selection of equivalent factors within each range was based on the median value of passenger load in that range. However, actual passenger loads may deviate from the median value, leading to some errors in the resulting SOC. A future research direction would be to divide passenger load levels into smaller intervals to improve the accuracy of simulation results.
With the increasing environmental awareness and widespread adoption of new energy buses, more people will use public transportation in the future. Considering passenger load variations as one of the criteria for formulating energy management strategies for hybrid electric buses will significantly improve energy efficiency.

Author Contributions

Conceptualization, P.S. and W.S.; Software, W.S.; Writing-original draft, W.S. and H.L.; Writing-review and editing, A.M. All authors have read and agreed to the published version of the manuscript.

Funding

This research received no external funding.

Data Availability Statement

Data are contained within the article.

Conflicts of Interest

The authors declare no conflicts of interest.

Abbreviations

EMSenergy management strategy
PHEBplug-in hybrid electric bus
ECMSequivalent fuel consumption minimization energy management strategy
A-ECMSadaptive equivalent fuel consumption minimization energy management strategy
DPdynamic programming
RLSrecursive least squares
SOCstate of charge
GAgenetic algorithm
EVpure electric vehicle
PHEVplug-in hybrid electric vehicle
HEVhybrid vehicle
PMPPontryagin’s minimum principle
DNNdeep neural network
LSleast squares
Nomenclatures
b e engine’s fuel consumption rate (g/kWh)
T e engine torque (Nm)
n e engine speed (rpm)
m ˙ f fuel consumption rate of the engine per unit time (g/s)
P l o s s motor power loss (kW)
T m motor torque (Nm)
n m motor speed (rpm)
P m motor output power (w)
ω m motor speed (rad)
U L battery load voltage (V)
U O battery open-circuit voltage (V)
I b a t t battery current (A)
R i n t battery internal resistance (Ω)
U b a t t total battery pack’s load voltage (V)
Q b a t t battery capacity (Ah)
F w air resistance (N)
ρ air density (g/m3)
A frontal area of the entire vehicle (m2)
F f rolling resistance (N)
α gradient angle (rad)
F i gradient resistance (N)
F j acceleration resistance (N)
F t driving force at the wheels (N)
T e m combined torque provided by the engine and motor in the process of driving the vehicle (N. m)
r wheel radius (m)
Δ v difference between the actual vehicle speed and the reference speed (m/s)
v c y c reference speed (m/s)
v a c t actual vehicle speed (m/s)
T r e q PHEB torque demand (Nm)
R battery pack resistance ( Ω )
H L H V calorific value of the fuel (J/kg)
m ˙ e q u total equivalent fuel consumption (g/s)
m ˙ b a t t equivalent fuel consumption corresponding to the battery (g/s)

References

  1. Iris, Ç.; Lam, J.S.L. Optimal energy management and operations planning in seaports with smart grid while harnessing renewable energy under uncertainty. Omega 2021, 103, 102445. [Google Scholar] [CrossRef]
  2. Wang, Z.; Dridi, M.; El Moudni, A. Co-optimization of eco-driving and energy management for connected HEV/PHEVs near signalized intersections: A review. Appl. Sci. 2023, 13, 5035. [Google Scholar] [CrossRef]
  3. Li, Z.; Khajepour, A.; Song, J. A comprehensive review of the key technologies for pure electric vehicles. Energy 2019, 182, 824–839. [Google Scholar] [CrossRef]
  4. Pu, S.; Chu, L.; Hu, J.; Li, S.; Hou, Z. An Equivalent Consumption Minimization Strategy for a Parallel Plug-In Hybrid Electric Vehicle Based on an Environmental Perceiver. Sensors 2022, 22, 9621. [Google Scholar] [CrossRef] [PubMed]
  5. Guzzella, L.; Sciarretta, A. Vehicle Propulsion Systems, 1st ed.; Springer: Berlin/Heidelberg, Germany, 2007; p. 22. [Google Scholar]
  6. Martinez, C.M.; Hu, X.; Cao, D.; Velenis, E.; Gao, B.; Wellers, M. Energy management in plug-in hybrid electric vehicles: Recent progress and a connected vehicles perspective. IEEE Trans. Veh. Technol. 2017, 66, 4534–4549. [Google Scholar] [CrossRef]
  7. Li, Y.; Tao, J.; Xie, L.; Zhang, R.; Ma, L.; Qiao, Z. Enhanced Q-learning for real-time hybrid electric vehicle energy management with deterministic rule. Meas. Control 2020, 53, 1493–1503. [Google Scholar] [CrossRef]
  8. Wirasingha, S.G.; Emadi, A. Classification and review of control strategies for plug-in hybrid electric vehicles. IEEE Trans. Veh. Technol. 2011, 60, 111–122. [Google Scholar] [CrossRef]
  9. Hao, L.; Wang, Y.; Bai, Y.; Zhou, Q. Energy management strategy on a parallel mild hybrid electric vehicle based on breadth first search algorithm. Energy Convers. Manag. 2021, 243, 114408. [Google Scholar] [CrossRef]
  10. Khayyam, H.; Bab-Hadiashar, A. Adaptive intelligent energy management system of plug-in hybrid electric vehicle. Energy 2014, 69, 319–335. [Google Scholar] [CrossRef]
  11. Banvait, H.; Anwar, S.; Chen, Y. A rule-based energy management strategy for plug-in hybrid electric vehicle (PHEV). In Proceedings of the 2009 American Control Conference, St. Louis, MO, USA, 10–12 June 2009; pp. 3938–3943. [Google Scholar]
  12. Chaos, X. Research on Range-Extended Electric Vehicle Energy Management Strategy Based on Adaptive ECMS. Master’s Thesis, Zhejiang University, Hangzhou, China, 2021. [Google Scholar]
  13. Won, J.S.; Langari, R. Fuzzy torque distribution control for a parallel hybrid vehicle. Expert Syst. 2002, 19, 4–10. [Google Scholar] [CrossRef]
  14. Ming, L.V.; Ying, Y.; Liang, L.; Yao, L.; Zhou, W. Energy management strategy of a plug-in parallel hybrid electric vehicle using fuzzy control. Energy Procedia 2017, 105, 2660–2665. [Google Scholar] [CrossRef]
  15. Rault, J.; Richalet, A.; Testud, J.L.; Papon, J. Model predictive heuristic control: Application to industrial processes. Automatica 1978, 14, 413–428. [Google Scholar]
  16. Zhang, J. Research on Energy Management Strategy of Plug-In Hybrid Electric Bus Based on Model Predictive Control. Master’s Thesis, Beijing Institute of Technology University, Beijing, China, 2016. [Google Scholar]
  17. Chen, X.L. Model Predictive Control Based Energy Management for Connected Hybrid Electric Vehicles. Master’s Thesis, Yanshan University, Qinhuangdao, China, 2022. [Google Scholar]
  18. Xiaohu, Y.; Rong, Y.; Shenglan, T.; Xionghou, Y.; Liang, F. MPGA-based-ECMS for energy optimization of a hybrid electric city bus with dual planetary gear. Proc. Inst. Mech. Eng. Part D J. Automob. Eng. 2022, 236, 1889–1909. [Google Scholar]
  19. Chen, Z.; Liu, Y.; Zhang, Y.; Lei, Z.; Chen, Z.; Li, G. A neural network-based ECMS for optimized energy management of plug-in hybrid electric vehicles. Energy 2022, 243, 122727. [Google Scholar] [CrossRef]
  20. Gu, B.; Rizzoni, G. An adaptive algorithm for hybrid electric vehicle energy management based on driving pattern recognition. In Proceedings of the ASME 2006 International Mechanical Engineering Congress and Exposition, Chicago, IL, USA, 5–10 November 2006; pp. 249–258. [Google Scholar]
  21. Musardo, C.; Rizzoni, G.; Guezennec, Y.; Staccia, B. A-ECMS: An adaptive algorithm for hybrid electric vehicle energy management. Eur. J. Control 2005, 11, 509–524. [Google Scholar] [CrossRef]
  22. Zhang, S. Study on Adaptive Equivalent Fuel Consumption Energy Management Strategy for Plug-In Hybrid Electric Vehicles. Master’s Thesis, Jilin University, Changchun, China, 2017. [Google Scholar]
  23. Hou, S.; Yin, H.; Ma, Y.; Gao, J. Energy management strategy of hybrid electric vehicle based on ECMS in intelligent transportation environment. IFAC-PapersOnLine 2021, 54, 157–162. [Google Scholar] [CrossRef]
  24. Sun, C.; Sun, F.; He, H. Investigating adaptive-ECMS with velocity forecast ability for hybrid electric vehicles. Appl. Energy. 2017, 185, 1644–1653. [Google Scholar] [CrossRef]
  25. Tian, X.; Cai, Y.; Sun, X.; Zhu, Z.; Xu, Y. An adaptive ECMS with driving style recognition for energy optimization of parallel hybrid electric buses. Energy 2019, 189, 116151. [Google Scholar] [CrossRef]
  26. Lin, C.C.; Peng, H.; Grizzle, J.W.; Kang, J.M. Power management strategy for a parallel hybrid electric truck. IEEE Trans. Control Syst. Technol. 2003, 11, 839–849. [Google Scholar]
  27. Patil, R.M.; Kelly, J.C.; Filipi, Z.; Fathy, H.K. A framework for the integrated optimization of charging and power management in plug-in hybrid electric vehicles. IEEE Trans. Veh. Technol. 2013, 62, 2402–2412. [Google Scholar] [CrossRef]
  28. Zheng, C.; Xu, G.; Jeong, J.; Cha, S.W. A power management strategy for hybrid buses using measured driving route information. In Proceedings of the 2014 IEEE Vehicle Power and Propulsion Conference, Coimbra, Portugal, 27–30 October 2014; pp. 1–5. [Google Scholar]
  29. Yang, C.; Du, S.; Li, L.; You, S.; Yang, Y.; Zhao, Y. Adaptive real-time optimal energy management strategy based on equivalent factors optimization for plug-in hybrid electric vehicle. Appl. Energy 2017, 203, 883–896. [Google Scholar] [CrossRef]
  30. Zhang, Y.; Jiao, X.; Li, L.; Yang, C.; Zhang, L.; Song, J. A hybrid dynamic programming-rule based algorithm for real-time energy optimization of plug-in hybrid electric bus. Sci. China Technol. Sci. 2014, 57, 2542–2550. [Google Scholar] [CrossRef]
  31. Zheng, C.; Cha, S.W. Real-time application of Pontryagin’s Minimum Principle to fuel cell hybrid buses based on driving characteristics of buses. Int. J. Precis. Eng. Manuf.-Green Tech. 2017, 4, 199–209. [Google Scholar] [CrossRef]
  32. Li, M.; Yan, M.; He, H.; Peng, J. Data-driven predictive energy management and emission optimization for hybrid electric buses considering speed and passengers prediction. J. Clean. Prod. 2021, 304, 127139. [Google Scholar] [CrossRef]
  33. Yan, M.; He, H.; Jia, H.; Li, M.; Xue, X. Model predictive control of the air-conditioning system for electric bus. Energ. Procedia 2017, 105, 2415–2421. [Google Scholar] [CrossRef]
  34. He, H.; Yan, M.; Sun, C.; Peng, J.; Li, M.; Jia, H. Predictive air-conditioner control for electric buses with passenger amount variation forecast☆. Appl. Energy. 2018, 227, 249–261. [Google Scholar] [CrossRef]
  35. Zhou, X.; Zou, L.; Ma, Y.; Gao, Z.; Wu, Y.; Yin, J.; Xu, X. The current research on electric vehicle. In Proceedings of the 2016 Chinese Control and Decision Conference, Chengdu, China, 28–30 May 2016; pp. 5190–5194. [Google Scholar]
  36. Kuang, X. Management Strategy Research on Wired and Wireless Charging of Electric Vehicles. Ph.D. Thesis, University of Electronic Science and Technology, Chengdu, China, 2019. [Google Scholar]
  37. Hao, M.J. Method for Deployment of Wireless Charging Facilities for Electric Bus Routes under Bus-Only Lane Conditions. Master’s Thesis, Jilin University, Changchun, China, 2022. [Google Scholar]
  38. Li, S.; Mi, C.C. Wireless power transfer for electric vehicle applications. IEEE J. Emerg. Sel. Topics Power Electron. 2014, 3, 4–17. [Google Scholar]
  39. Zhang, M. Design of Dynamic Wireless Charging System for Electric Vehicles and Research on Charging Control Strategy. Master’s Thesis, Southeast University, Nanjing, China, 2021. [Google Scholar]
  40. Galigekere, V.P.; Pries, J.; Onar, O.C.; Su, G.J.; Anwar, S.; Wiles, R.; Wilkins, J. Design and implementation of an optimized 100 kW stationary wireless charging system for EV battery recharging. In Proceedings of the 2018 IEEE Energy Conversion Congress and Exposition, Portland, OR, USA, 23–27 September 2018; pp. 3587–3592. [Google Scholar]
  41. Dai, Z. Scania’s New Wireless Bus System to be Tested in Sweden. Commer. Veh. 2015, 1, 62. [Google Scholar]
  42. Nahum, O.E.; Hadas, Y. Multi-objective optimal allocation of wireless bus charging stations considering costs and the environmental impact. Sustainability 2020, 12, 2318. [Google Scholar] [CrossRef]
  43. Ahmadian, A.; Sedghi, M.; Aliakbar-Golkar, M. Fuzzy load modeling of plug-in electric vehicles for optimal storage and DG planning in active distribution network. IEEE Trans. Veh. Technol. 2016, 66, 3622–3631. [Google Scholar] [CrossRef]
  44. Schäuble, J.; Kaschub, T.; Ensslen, A.; Jochem, P.; Fichtner, W. Generating electric vehicle load profiles from empirical data of three EV fleets in Southwest Germany. J. Clean. Prod. 2017, 150, 253–266. [Google Scholar] [CrossRef]
  45. Zhu, Z.H.; Gao, Z.Y.; Zheng, J.F.; Du, H.M. Charging station location problem of plug-in electric vehicles. J. Transp. Geogr. 2016, 52, 11–22. [Google Scholar] [CrossRef]
  46. Chau, C.K.; Elbassioni, K.; Tseng, C.M. Drive mode optimization and path planning for plug-in hybrid electric vehicles. IEEE Trans. Intell. Transp. Syst. 2017, 18, 3421–3432. [Google Scholar] [CrossRef]
  47. Zhang, F. Research on Control Strategy Optimization of Parallel Hybrid Electric Bus in Vehicular ad Hoc Network Environment. Ph.D. Thesis, Beijing Institute of Technology, Beijing, China, 2018. [Google Scholar]
  48. Song, P.X. Research on Duty Cycle Prediction and Intelligent Energy Management Strategy for Plug-In Hybrid Electric Buses. Ph.D. Thesis, Jilin University, Changchun, China, 2021. [Google Scholar]
  49. Hu, X.; Li, S.; Peng, H. A comparative study of equivalent circuit models for Li-ion batteries. J. Power Sources 2012, 198, 359–367. [Google Scholar] [CrossRef]
  50. Wang, X.M. Research on Powertrain Matching and Control Optimization of Plug-In Hybrid City Buses. Ph.D. Thesis, Beijing Institute of Technology University, Beijing, China, 2015. [Google Scholar]
  51. Pelletier, S.; Jabali, O.; Laporte, G. The electric vehicle routing problem with energy consumption uncertainty. Transp. Res. Part B Methodol. 2019, 126, 225–255. [Google Scholar] [CrossRef]
  52. LI, Y.F. Research on Heavy Vehicle Mass Identification and Road Grade Estimation Method. Master’s Thesis, Jilin University, Changchun, China, 2012. [Google Scholar]
  53. Chen, W.M. Research on Online Parameter Identification of Permanent Magnet Synchronous Motors. Master’s Thesis, Beijing Jiaotong University, Beijing, China, 2020. [Google Scholar]
  54. Wehbi, L.; Bektaş, T.; Iris, Ç. Optimising vehicle and on-foot porter routing in urban logistics. Transp. Res. Part D Transp. Environ. 2022, 109, 103371. [Google Scholar] [CrossRef]
  55. Basso, R.; Kulcsár, B.; Sanchez-Diaz, I. Electric vehicle routing problem with machine learning for energy prediction. Transp. Res. Part B Methodol. 2021, 145, 24–55. [Google Scholar] [CrossRef]
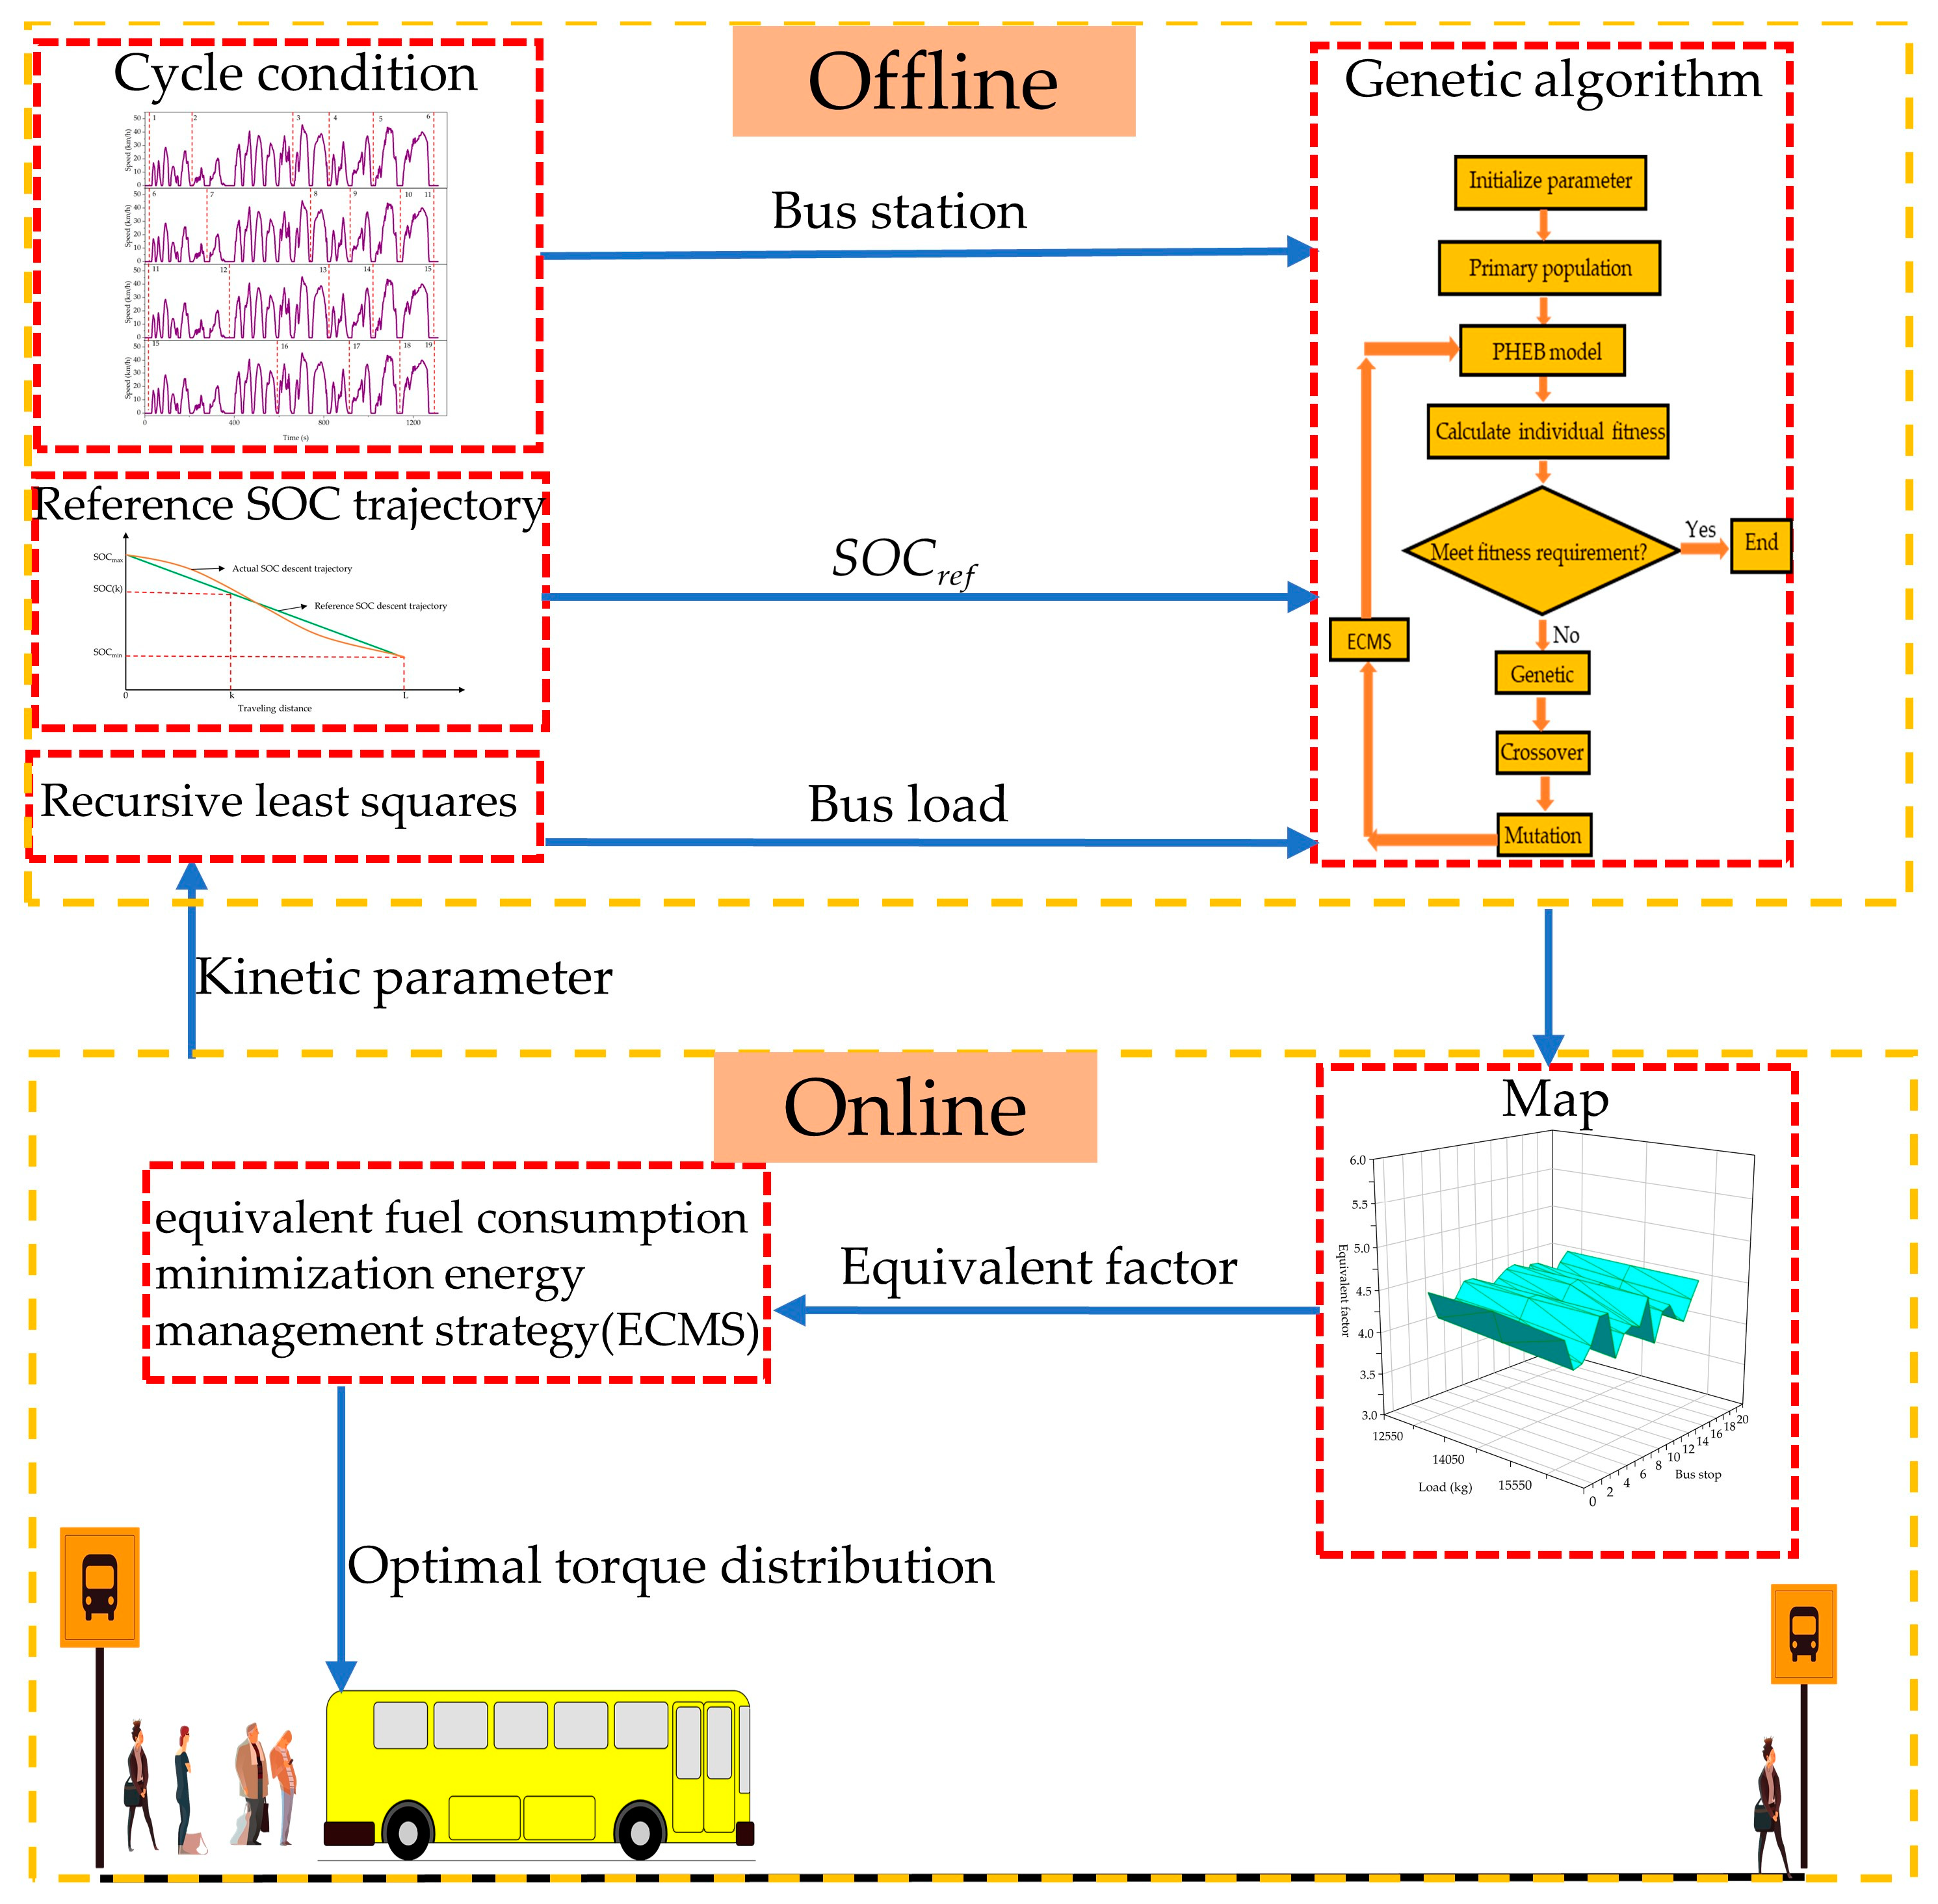
Figure 1. The interrelationships among the algorithms used in the article.
Energies 17 01283 g001
Figure 2. Schematic diagram of the parallel PHEB model.
Energies 17 01283 g002
Figure 3. (a) Fuel consumption per unit time of the engine map; (b) motor power loss map.
Energies 17 01283 g003
Figure 4. Equivalent circuit of battery internal resistance model.
Energies 17 01283 g004
Figure 5. Force diagram of the PHEB.
Energies 17 01283 g005
Figure 6. Speed tracking under CHTC-B cycle conditions.
Energies 17 01283 g006
Figure 7. The simulation of genetic, crossover, and mutation operations in the binary algorithm.
Energies 17 01283 g007
Figure 8. Schematic diagram of GA optimization.
Energies 17 01283 g008
Figure 9. Division of bus stations based on driving cycle condition.
Energies 17 01283 g009
Figure 10. SOC decline trajectory under DP algorithm. (a) Upper and lower limits of 0.9 and 0.3, respectively. (b) Upper and lower limits of 0.8 and 0.4, respectively. (c) Upper and lower limits of 0.7 and 0.2, respectively. (d) Upper and lower limits of 0.6 and 0.1, respectively.
Energies 17 01283 g010
Figure 11. Reference SOC trajectory based on a linear decrease in driving distance.
Energies 17 01283 g011
Figure 12. Different PHEB mass identification results. (a) Identification results at an actual mass of 16,000 kg. (b) Identification results at an actual mass of 15,000 kg. (c) Identification results at an actual mass of 13,000 kg. (d) Identification results at an actual mass of 11,800 kg.
Energies 17 01283 g012aEnergies 17 01283 g012b
Figure 13. (a) SOC decline trajectory for different passenger loads at an equivalent factor of 3.5. (b) SOC decline trajectory for different passenger loads at an equivalent factor of 4.0. (c) SOC decline trajectory for different passenger loads at an equivalent factor of 4.5. (d) SOC decline trajectory for different passenger loads at an equivalent factor of 5.0.
Energies 17 01283 g013
Figure 14. The cycle condition at the fourth bus station.
Energies 17 01283 g014
Figure 15. Passenger load–bus station equivalent factor map.
Energies 17 01283 g015
Figure 16. The SOC decline trajectory under different EMSs.
Energies 17 01283 g016
Figure 17. The SOC decline trajectory under A-ECMS and DP.
Energies 17 01283 g017
Figure 18. Engine operating points under a rule-based EMS.
Energies 17 01283 g018
Figure 19. Engine operating points under an ECMS.
Energies 17 01283 g019
Figure 20. Engine operating points under an A-ECMS.
Energies 17 01283 g020
Figure 21. (a) Comparison of fuel consumption for different EMS. (b) Comparison of electricity consumption for different EMS.
Energies 17 01283 g021
Figure 22. Comparison of fuel consumption for the A-ECMS and DP.
Energies 17 01283 g022
Table 1. Vehicle Parameters.
ParametersValues
Over mass/kg11,800
Full load mass/kg16,300
Peak engine power/kW150
Peak engine torque/Nm800
Peak motor power/kW160
Peak motor torque/Nm1000
Battery capacity/Ah50
Table 2. Fitness of the first generation of equivalent factors.
Equivalent FactorFitness
4.9629.11
5.6740.35
5.0935.35
3.33217.9
4.4119.66
4.6224.46
5.4637.66
5.4838.88
4.7422.25
5.0935.35
Table 3. Fitness of the last generation of equivalent factors.
Equivalent FactorFitness
4.513.145
4.513.145
4.513.145
4.513.145
4.513.145
4.513.145
4.513.145
4.513.145
4.513.145
4.513.145
Table 4. Distribution of load at each bus station platform and their corresponding optimal equivalent factors.
Bus StationLoadOptimal Equivalent Factor
1Heavy4.38
2Medium4.10
3Light4.23
4Medium4.30
5Light4.52
6Light4.51
7Heavy3.96
8Light4.34
9Light4.44
10Light4.52
11Heavy4.52
12Medium4.02
13Heavy4.29
14Heavy4.33
15Medium4.22
16Light4.22
17Medium4.35
18Heavy4.50
Table 5. Comparison of electricity consumption and fuel consumption per 100 km for different EMSs.
EMSFuel Consumption
(L/100 km)
Electricity Consumption
(kWh/100 km)
Rule-based EMS25.132.75
ECMS23.1535.5
A-ECMS22.5536.55
DP21.83--
Disclaimer/Publisher’s Note: The statements, opinions and data contained in all publications are solely those of the individual author(s) and contributor(s) and not of MDPI and/or the editor(s). MDPI and/or the editor(s) disclaim responsibility for any injury to people or property resulting from any ideas, methods, instructions or products referred to in the content.