Abstract
Shale pore structure characterization is key to shale reservoir evaluation, sweet spot selection, and economic exploitation. It remains a challenge to accurately characterize shale micro-nano pores. Common experimental characterization methods for shale pore systems are listed, and advantages and weaknesses of each method are analyzed. An improved pore structure characterization method for shale is proposed by combining Helium and NMR. The new method does not affect shale samples and has a higher accuracy. The affecting factors for shale pore evolution for shale are also discussed, showing that organic matter content and maturity are key factors in total porosity development. Furthermore, a shale porosity–TOC maturity relationship chart is developed based on the experimental data of shale samples selected from six shale reservoirs. The application of this chart in Well X in the Gulong field of Songliao Basin proves its utility in evaluating shale reservoirs.
1. Introduction
Shale has drawn increasing attention in recent years and has become an important successor field for oil and gas exploration and development [1]. Avalon Shale in the Delaware Basin, Chang 73 Shale in the Ordos Basin, Da’anzhai Shale in the Sichuan Basin, the Qingshankou Formation in the Songliao Basin, and the Fengcheng Formation in the Junggar Basin have entered exploration and development stages [2,3,4,5]. Shale reservoirs have complex mineral composition and diverse pore styles, and their porosity evolution is closely related to organic matter content and maturity. In addition, oil and gas usually exist in an adsorption state on the pore surfaces. Therefore, accurate pore structure characterization is crucial for predicting and developing shale oil and gas resources.
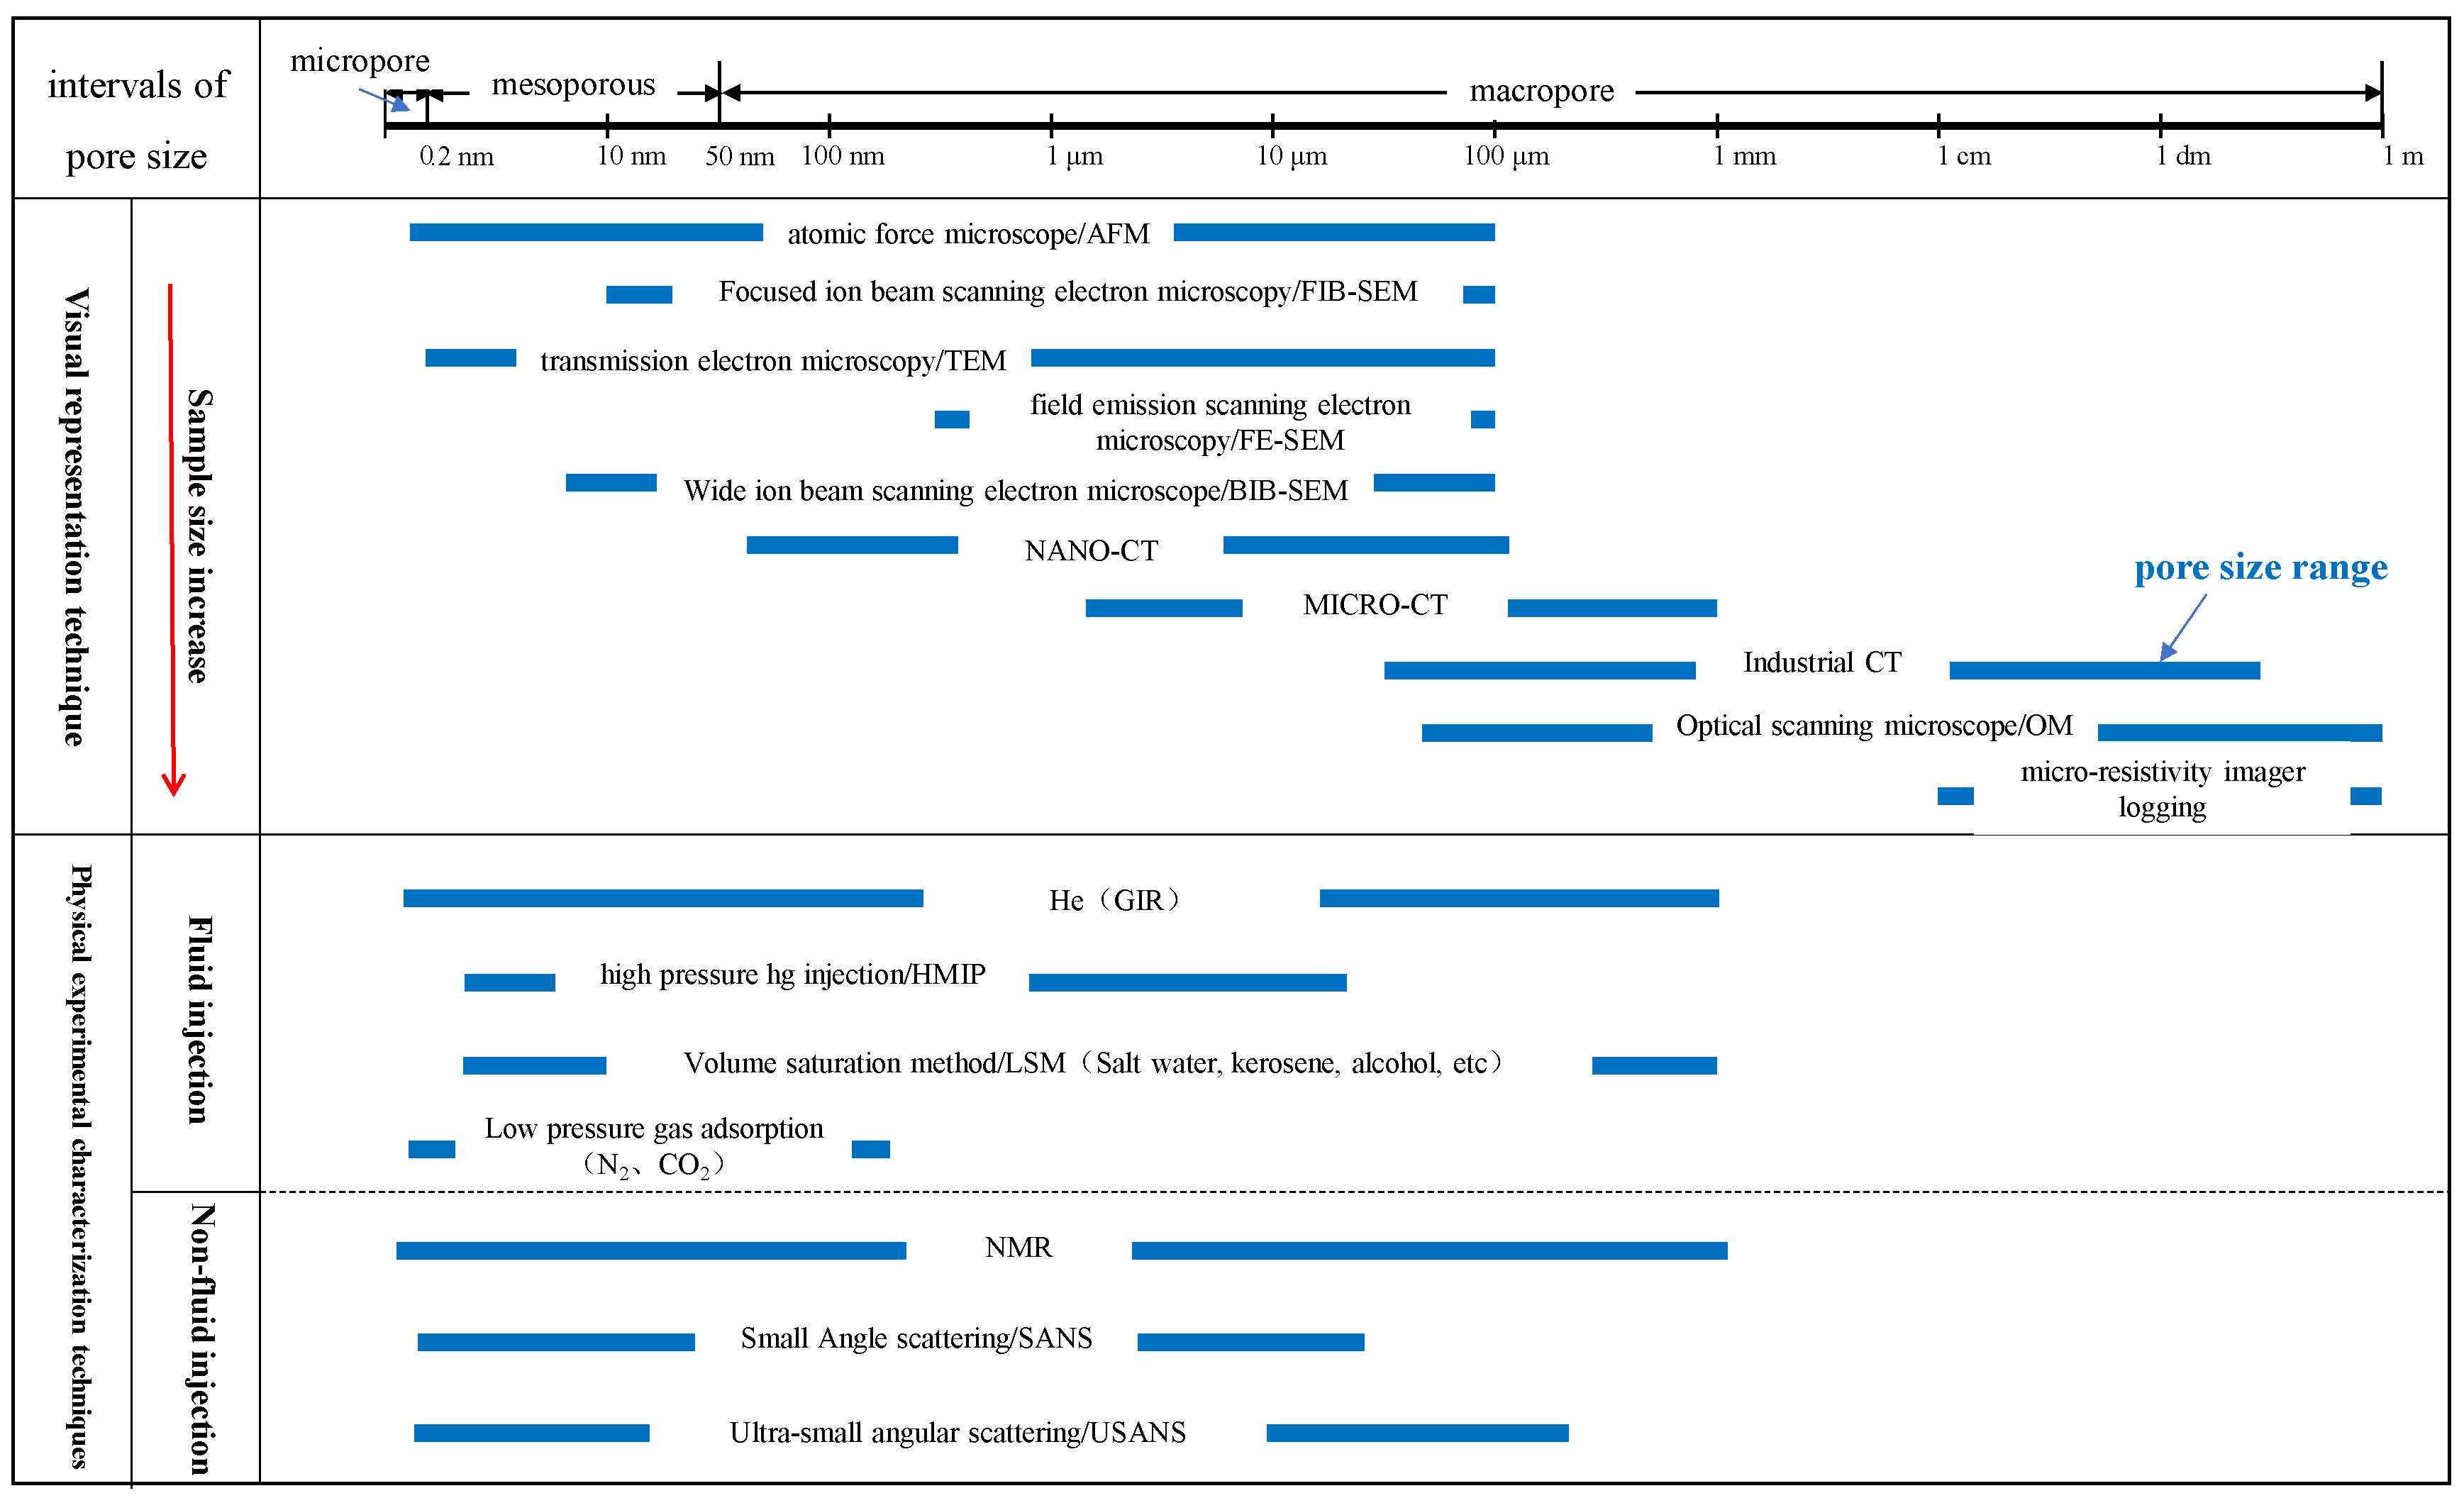
At present, the micro-nano pore structure characterization of shale samples mainly relies on experimental methods [6,7]. Due to differences in principles, operating procedures, and handling methods, the characterization accuracy of the pore structure varies so much, significantly depending on the selected measurement methods [8,9]. Table 1 shows the features and principles of different methods. Figure 1 shows the range of pore sizes for various experiment types. According to the size, shale pores are divided into micropores (pore size ≤ 2 nm), mesopores (pore size between 2 and 50 nm), and macropores (pore size > 50 nm).

Table 1.
A list of physical experimental methods.
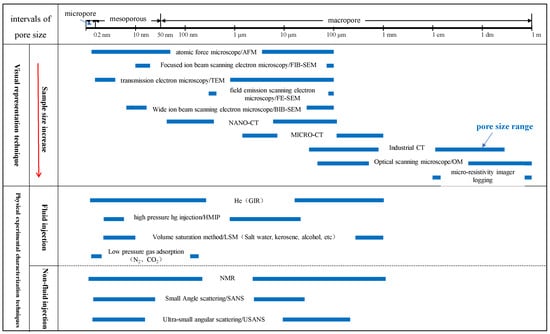
Figure 1.
Comparison of pore size range characterized by various methods.
Numerous influential factors in shale pore evolution have been studied in recent years [21]. Gao et al. have found that inorganic and organic diagenesis jointly control shale pore evolution [22]. Liang et al. have analyzed the influence of geological stress on shale porosity [23]. Yu et al. have developed a function depicting the relationship between porosity and kerogen content [24,25]. Curtis et al. have graded the porosity development using the maturity of organic matter [26,27]. Tan et al. have calculated shale kerogen content based on the core NMR experiment [28]. Iqbal and Rezaee have estimated the porosity and water saturation of shale reservoirs based on a revised Archie model [29]. Chen et al. have developed a revised expulsion efficiency method for organic porosity estimation in shale reservoirs [30]. Lots of studies show that shale pore evolution is closely related to the content and maturity of organic matter. However, there is a shortage of research on quantitative evaluation methods for the relationship of porosity to TOC (total organic carbon, unit: %) maturity.
In this paper, we systematically analyze and summarize the main properties of various micro-nano shale pore characterization methods. These methods can be divided into visual methods and physical experimental methods. To improve the accuracy of shale pore structure evaluation while minimizing damage to shale samples, integrating the advantages of multiple methods is a promising research direction. To achieve this goal, an improved pore structure characterization method for shale is proposed by combining helium and NMR pore structure characterization methods. Twenty-eight shale samples from the Fengcheng Formation in the Junggar Basin have demonstrated that the new method has higher accuracy. Influential factors of shale pore evolution are also discussed. With the increase in organic maturity, oil- and gas-generating pores develop. At the end of the hydrocarbon generation state, a high content of brittle minerals is beneficial for the preservation of organic pores. In addition, organic matter content and maturity are key factors for shale pore evolution. Furthermore, a quantitative evaluation method for the porosity–TOC maturity relationship is developed based on experimental data of shale samples in Montney shale of the Lower Triassic in Canada, the Longmaxi Formation and Qiongzhusi Formation in Sichuan Basin, the Ganchaigou Formation in Qaidam Basin, and the Qijia Gulong of Daqing. Finally, the new porosity–TOC maturity method is applied to Well X in Gulong field in the Songliao Basin, and the result shows consistency with geological laws, and the new method provides a new idea for studying the porosity–TOC-R0 relationship using logging data.
2. An Improved Pore Structure Characterization Method for Shale
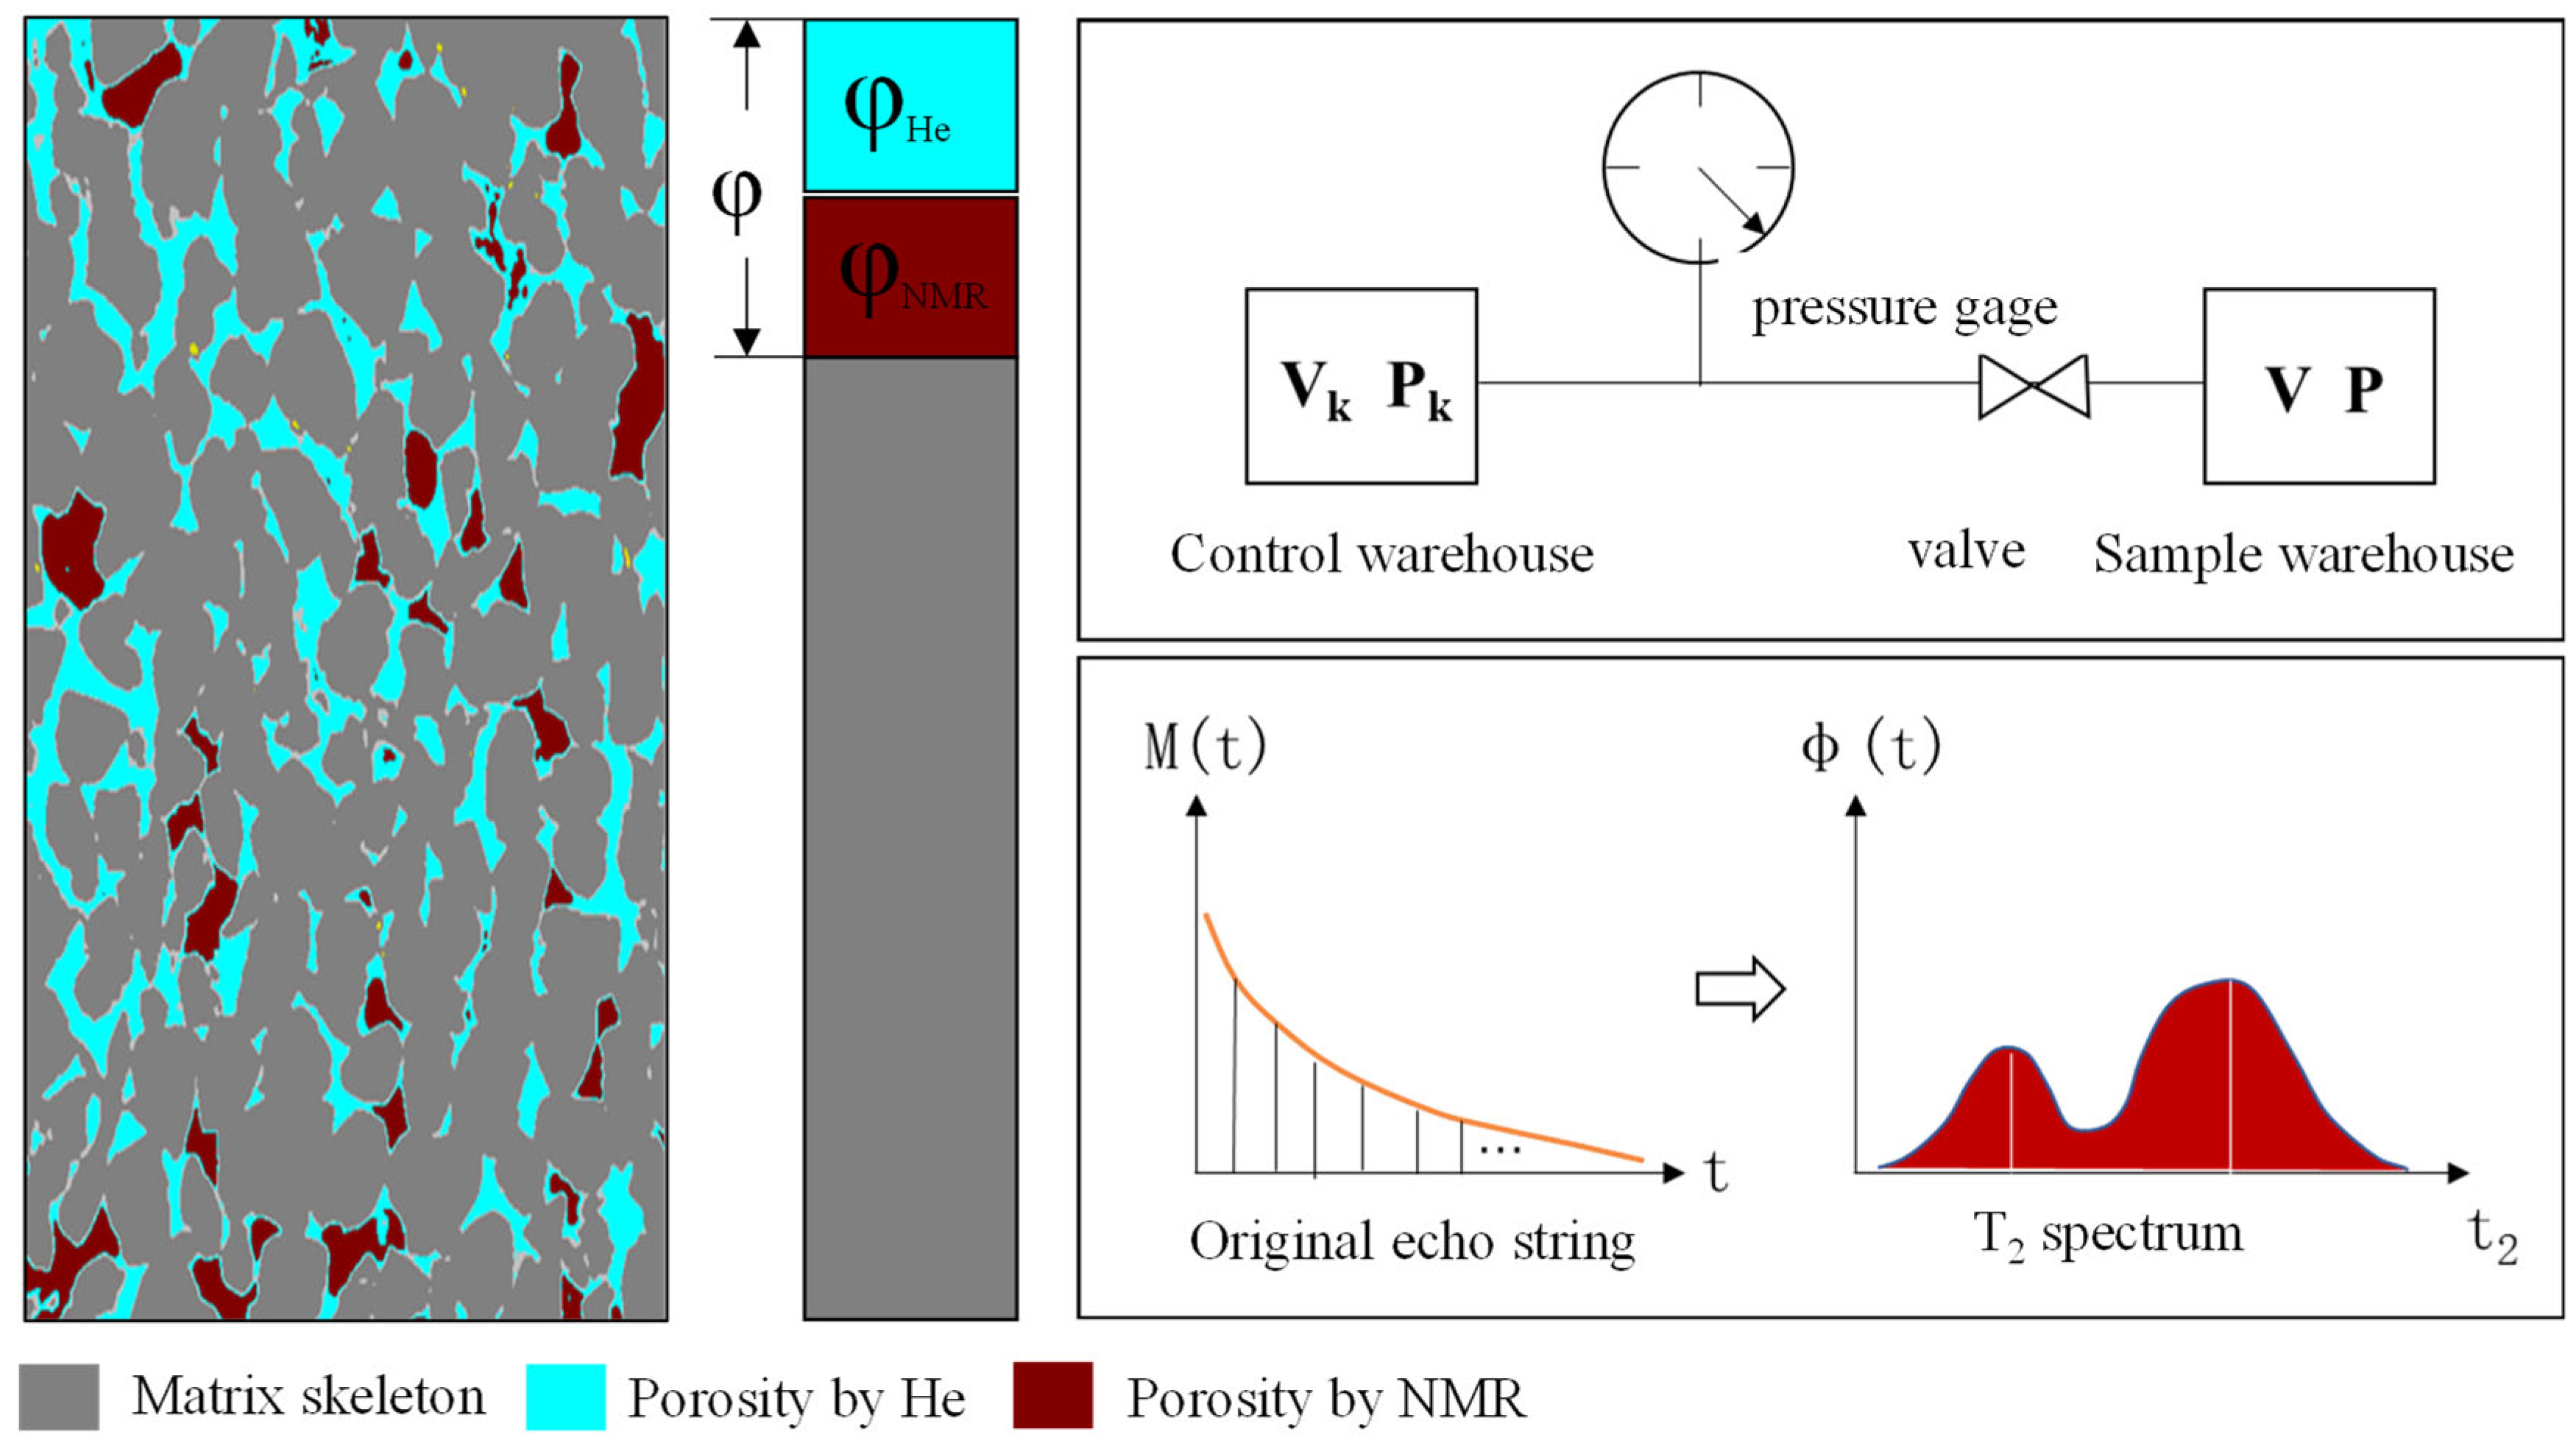
To improve the pore structure characterization accuracy of shale samples, achieve wide ranges of pore distribution, and avoid time wasting and the effects of residual hydrocarbon, a combination of nuclear magnetic resonance and helium porosity is proposed. Figure 2 shows the measurement diagram. Pore space occupied by hydrocarbons (commonly oil and gas) can be obtained through NMR testing, and pores without hydrocarbons are measured by the helium expansion method; by combining NMR and helium porosity, the accuracy of shale pore structure characterization is improved.

Figure 2.
A measurement principal diagram of the improved shale pore structure characterization method. (v/v) is total porosity, (v/v) is helium porosity, (v/v) is NMR porosity, t (ms) is time, M(t) is echo string, (v/v) is T2 porosity of specific T2 time, (ms) is T2 time, (mL) is gas volume of the control warehouse, (psi) is the gas pressure of control warehouse, V(mL) is the gas volume of sample warehouse, and P (psi) is gas pressure of a sample warehouse.
Experimental steps are as follows:
- (1)
- Put shale samples into an oven with a constant temperature of 60 °C until the cores’ weight changes little (generally, core weight variance is less than 5%). Then, place dry samples into a sample warehouse. Vacuum the sample warehouse and control the warehouse to ensure that the residual gas in the pores of the shale sample is evacuated.
- (2)
- Fill the control warehouse with helium to a certain pressure. Open the connecting valve between the sample warehouse and control warehouse to let shale samples become fully saturated with helium gas. When the pressure gauge stabilizes, the skeleton volume of shale samples () can be obtained according to Boyle’s law.
- (3)
- The total volume of shale samples () (unit: v/v) can be measured through the caliper measurement method and the Archimedes immersion method. The helium porosity can be calculated as (unit: v/v).
- (4)
- is obtained by integrating the NMR T2 spectrum, the resonance frequency is 4.52 MHz, the waiting time is 3000 ms and echo spacing is 0.35 ms, and the number of scans was 128.
- (5)
- Then, the total porosity of shale samples is (unit: v/v).
3. Shale Porosity–TOC Maturity Relationship Based on the New Pore Structure Characterization Method
3.1. Effect Factors for Shale Pore Evolution
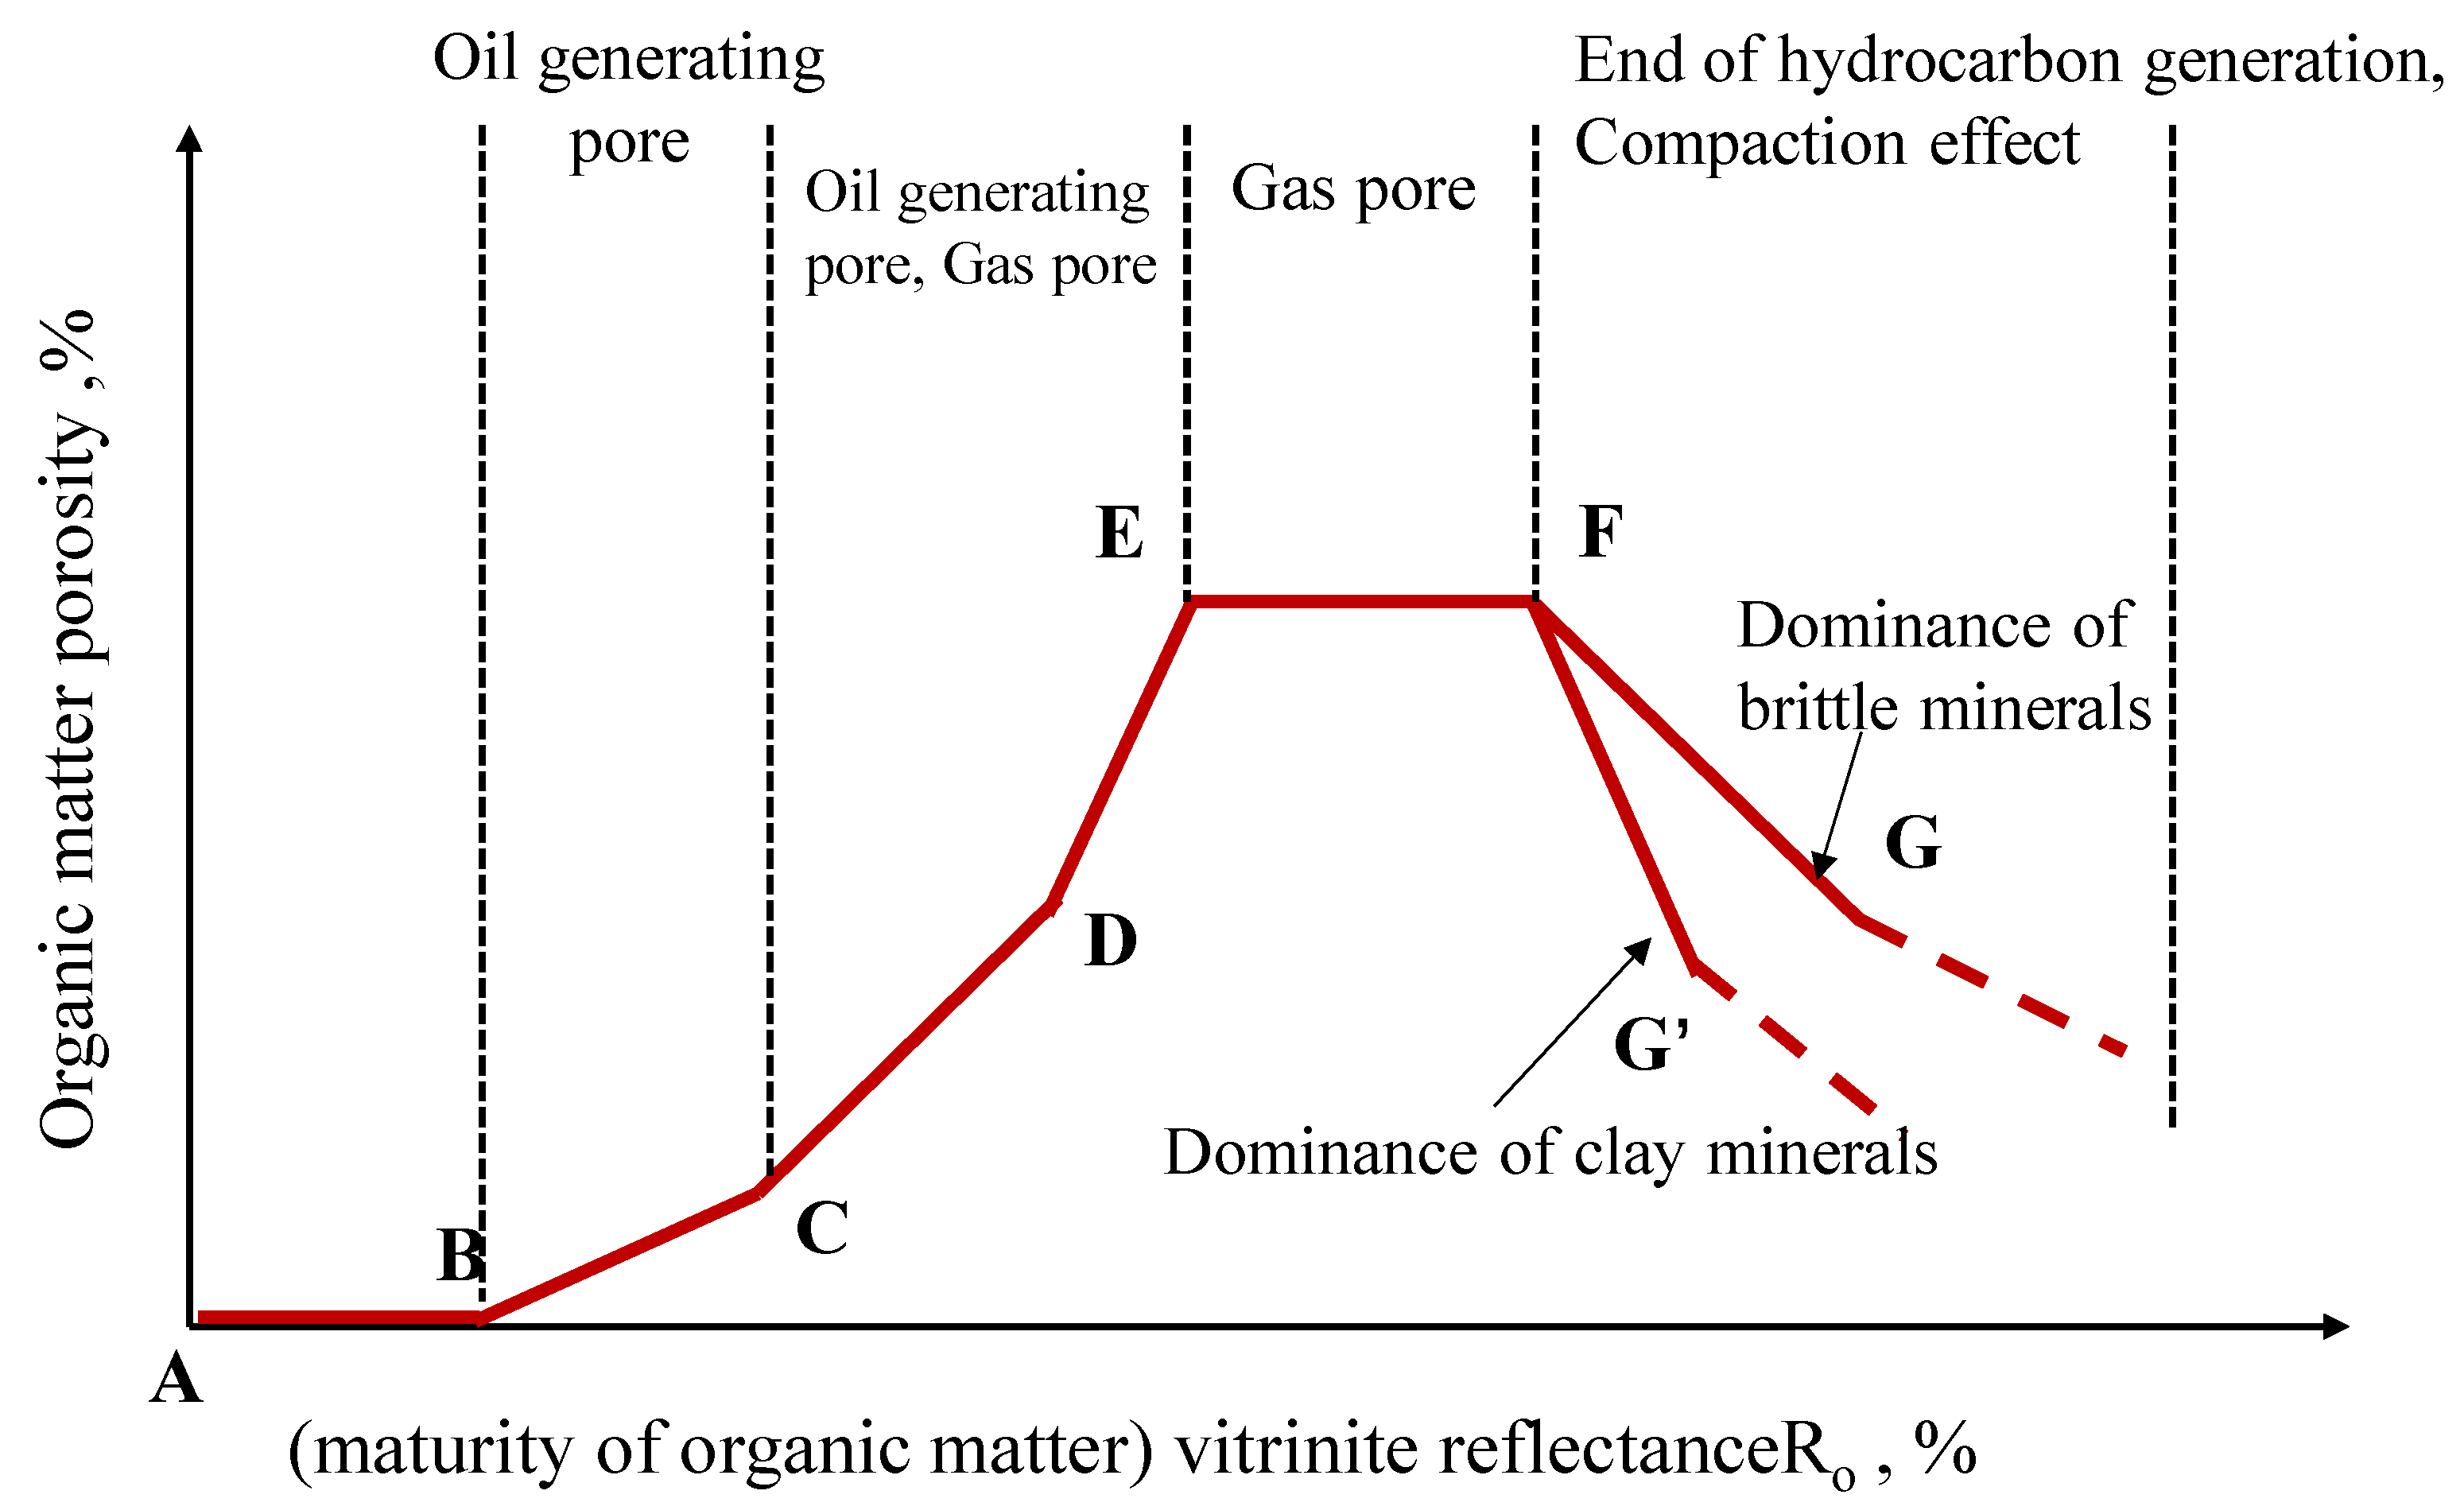
Shale pore evolution is a combined result of permeability, fluid pressure, formation temperature, thermal maturity, etc. It has a vital influence on geophysical response parameters, such as formation velocity, density, resistivity, and the NMR T2 spectrum [31,32]. Inorganic pores of shale are mainly controlled by diagenesis and fluid interaction [33,34], while organic pores are influenced by different factors during different stages. Figure 3 shows the evolution of organic pores.

Figure 3.
Evolution of organic pores.
At stage A, the pore structure of immature shale is mainly controlled by mechanical compaction, and organic porosity is low. As the organic matter maturity increases, oil- and gas-generating pores develop successively. From stage B to E, organic pores develop and porosity exhibits a positive correlation with organic matter content (TOC) [35,36,37,38,39]. From stage E to F, when the maturity of organic matter reaches its peak and enters the dry gas stage, organic matter gradually transforms from a liquid to solid state. At this time, the organic pore volume reaches its maximum. From stage F to G (G’), at the end of hydrocarbon generation, organic pores even disappear due to mechanical compaction [40], and the organic porosity reduction rate is correlated to mineral composition, and brittle minerals can resist the decrease in porosity. On the other hand, mineral composition is also controlled by organic maturity. With the increase in organic maturity, the conversion rate of the clay mineral component increases, which has significant effects on pore structure [41].
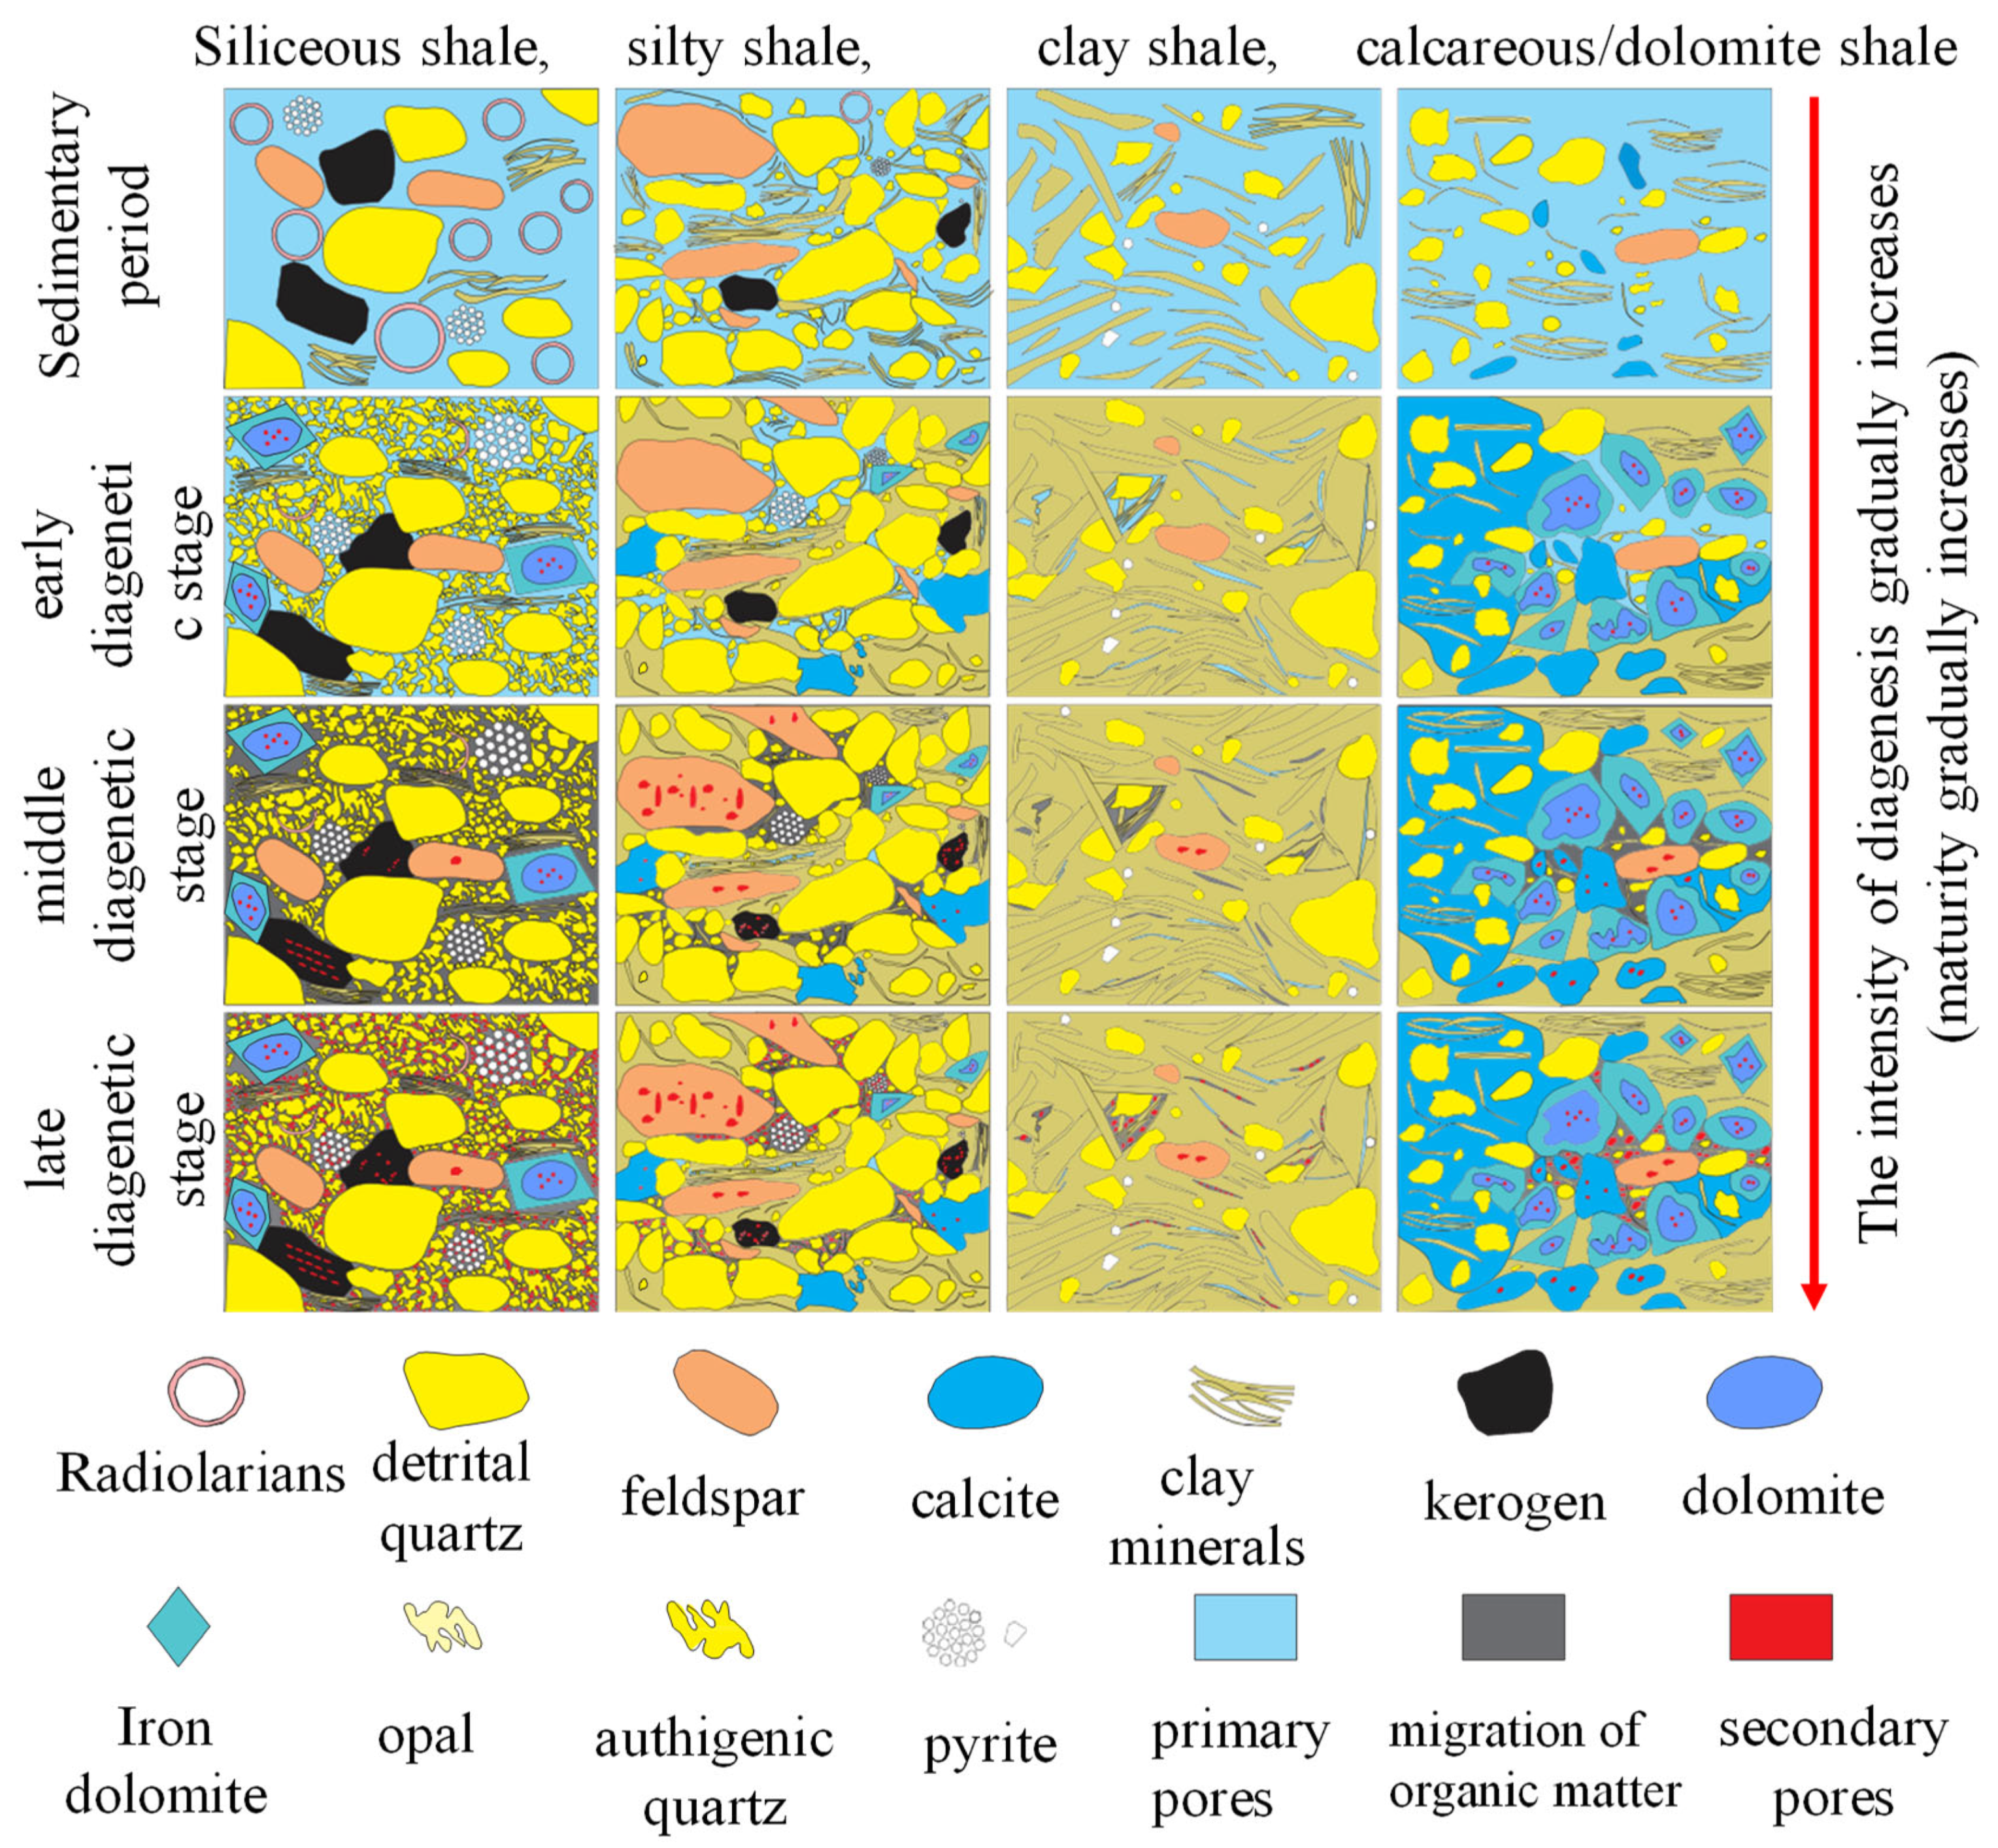
Figure 4 shows that pore evolution is influenced by the clay composition of rocks. It shows that from the early to late diagenetic stage, kerogen and organic pores increase, while primary pores gradually decrease. During the sedimentary period, before organic matter produces hydrocarbons, clay minerals converse slowly and organic pores are rare, corresponding to stages A to B in Figure 3. And as the diagenetic stage develops from early to late, with increasing hydrocarbons, secondary pores that are formed by clay mineral conversion appear and organic pores increase gradually, and the porosity in the high-over maturity stage is positively correlated with the increase of illite [42,43], corresponding to stages B to E in Figure 3. At the end of the late diagenetic stage, the maturity of organic matter had reached its peak, with the cessation of hydrocarbon generation, and clay mineral conversion ended and organic pores tended to stabilize, corresponding to stages E to F in Figure 3 [44].

Figure 4.
Pore evolution is influenced by the clay composition of rocks (modified according to Zhao et al. 2017 [43]).
3.2. The Shale Porosity–TOC Maturity Relationship
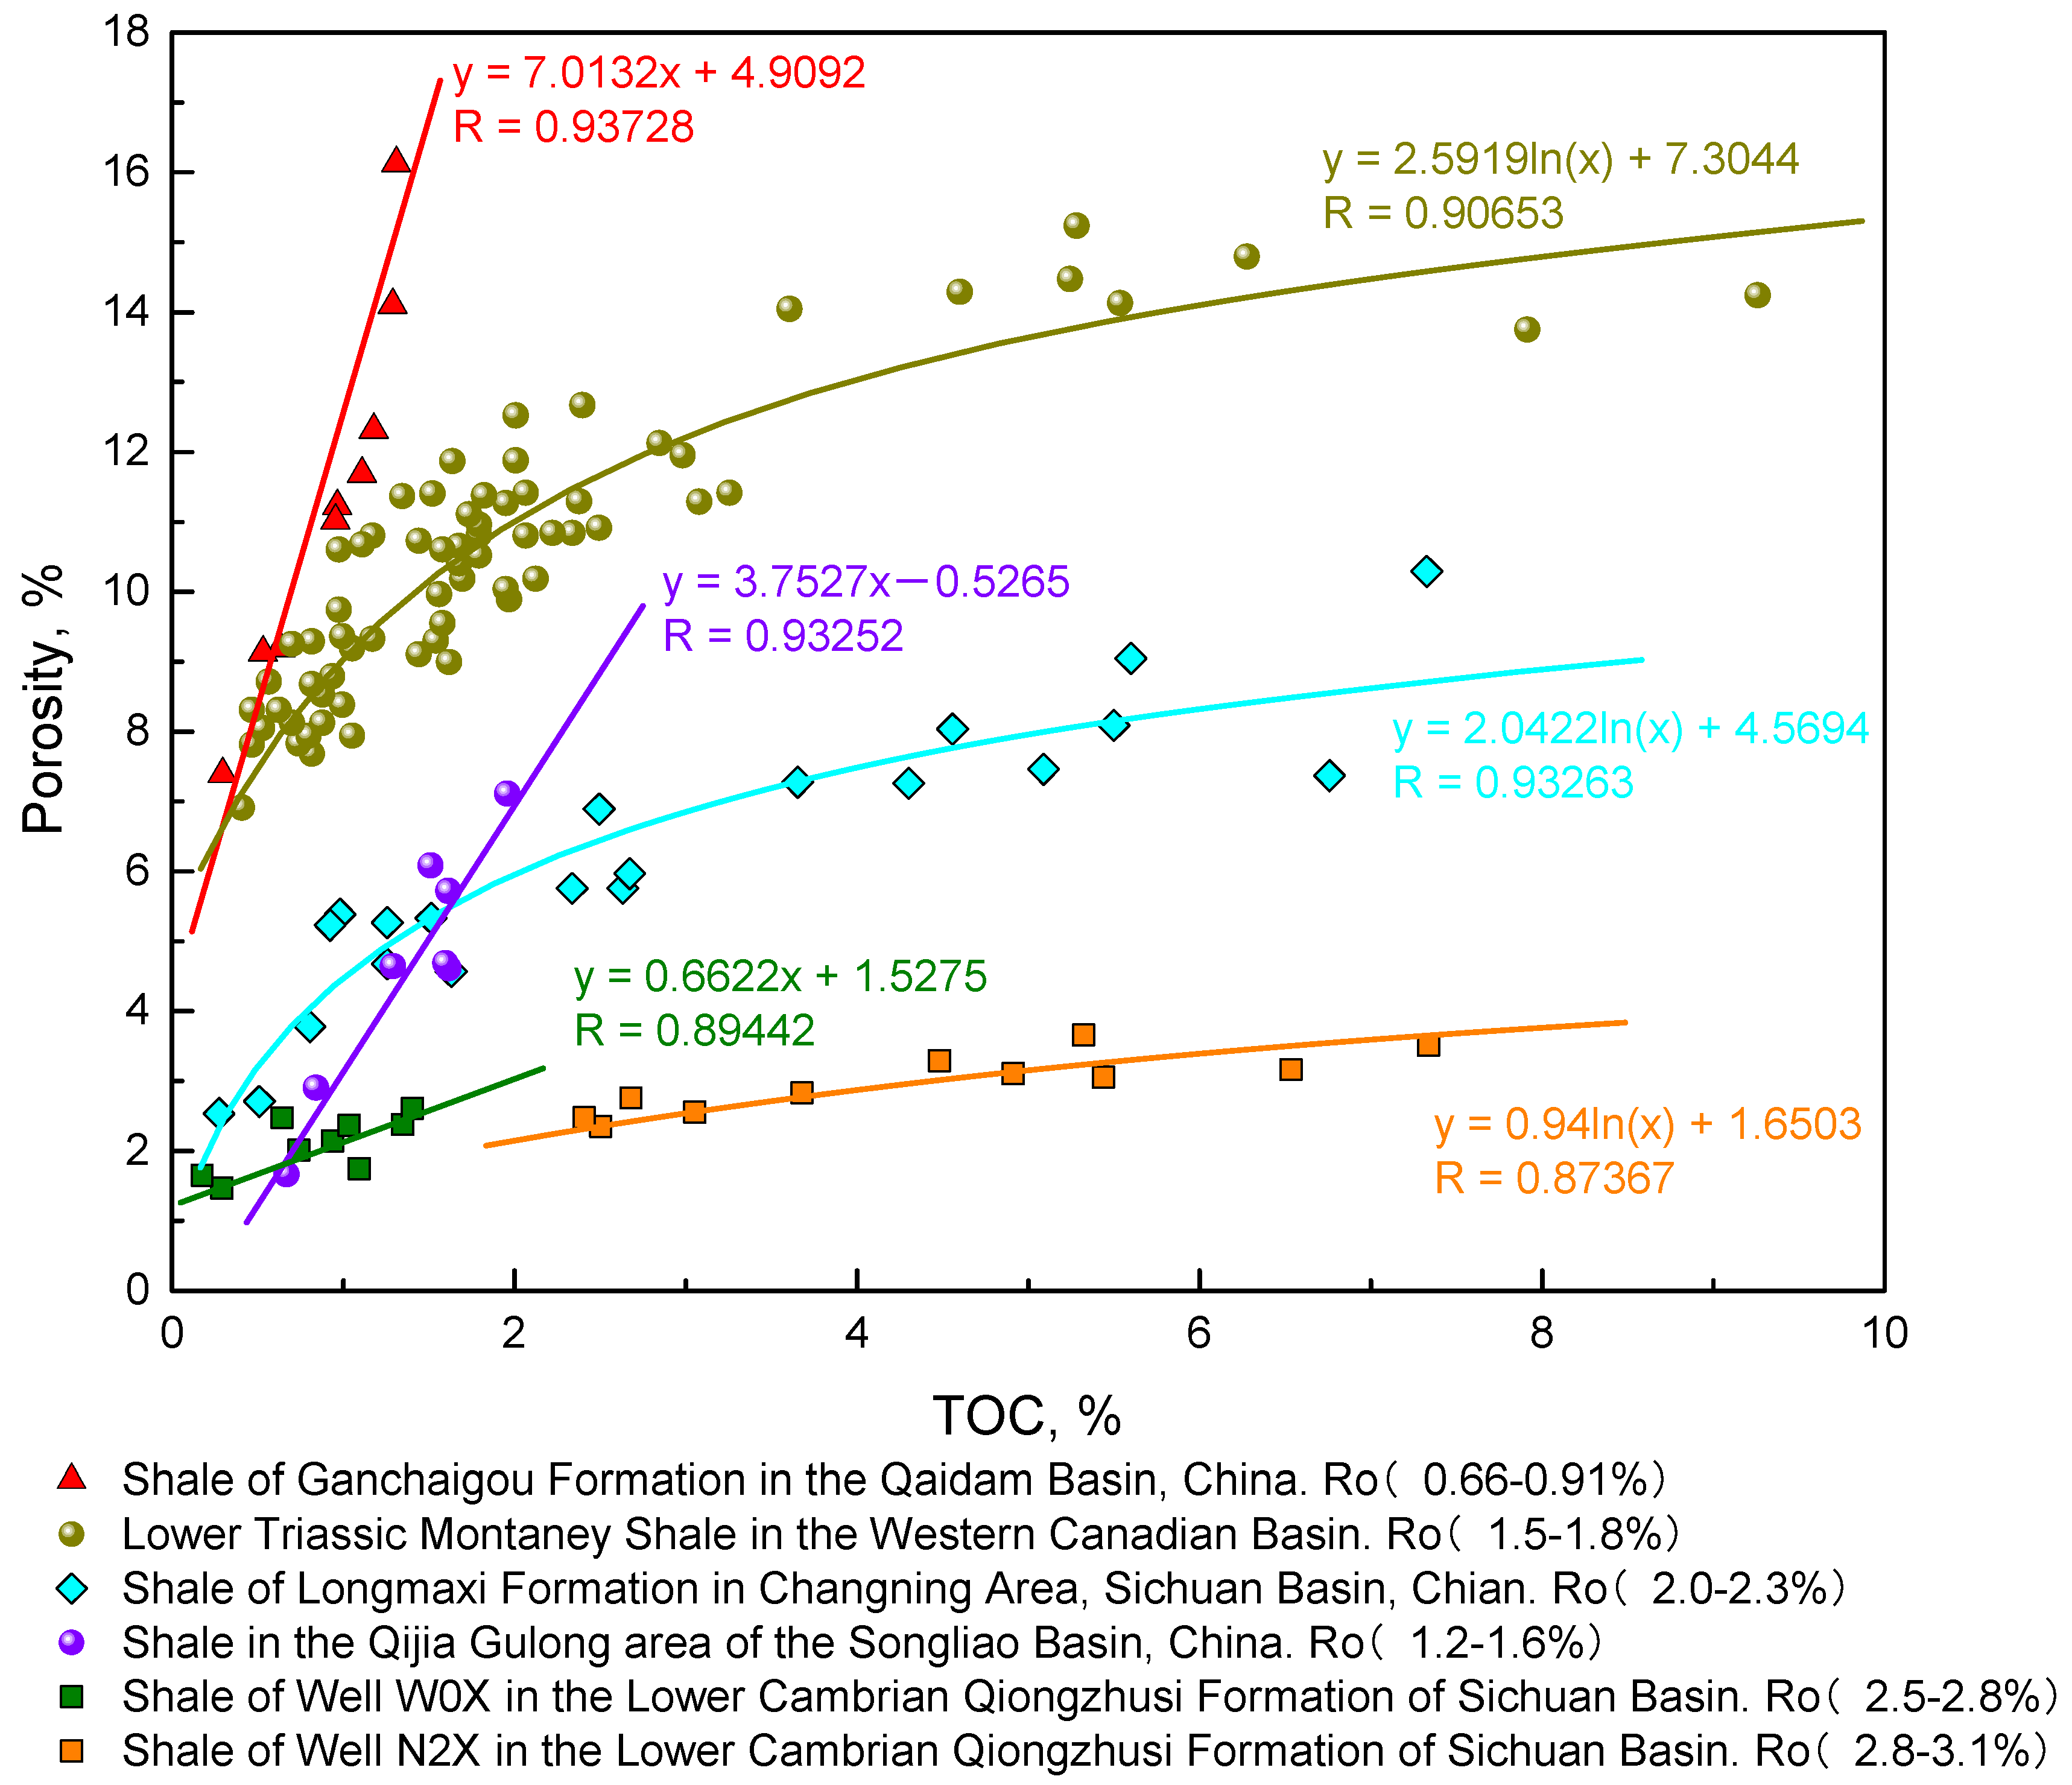
According to the analysis above, the content and maturity of organic matter are key parameters influencing pore evolution. In order to study the shale porosity–TOC maturity relationship, shale samples selected from Montney shale of the Lower Triassic in Canada, the Longmaxi Formation and Qiongzhusi Formation in the Sichuan Basin, the Ganchaigou Formation in the Qaidam Basin, and the Qijia Gulong of Daqing were taken to experiment to obtain the total porosity, TOC, and maturity. The total porosity was measured using the new method mentioned in Section 2. The vitrinite reflectance Ro is a common parameter reflecting organic maturity; it is the intensity percentage of the reflected light and vertical incident light of the vitrinite polishing surface at a wavelength of 546 nm, measured with a microscope photometer.
The experimental total porosity and TOC were put into a porosity–TOC chart, and the result is shown in Figure 5; it can be seen that the total porosity had a positive correlation with TOC, with the increase in TOC; total porosity increased first and then stabilized. When the TOC was smaller than 2%, the porosity–TOC relationship tended towards linearity, but when TOC exceeded 2%, the relationship shifted to become logarithmic.
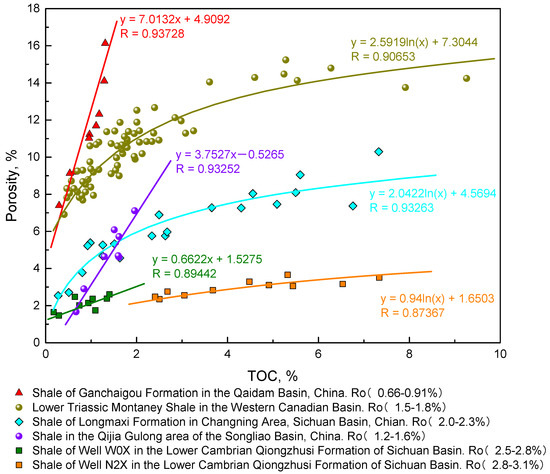
Figure 5.
The experimental total porosity and TOC relationship.
The follow formula can be used to fit the shale porosity–TOC relationship.
where φ is the total porosity (%), a, b are undetermined coefficients, and b is the original porosity unaffected by organic matter. a and b are determined by the least square method with experimental TOC and porosity according to Equation (1).
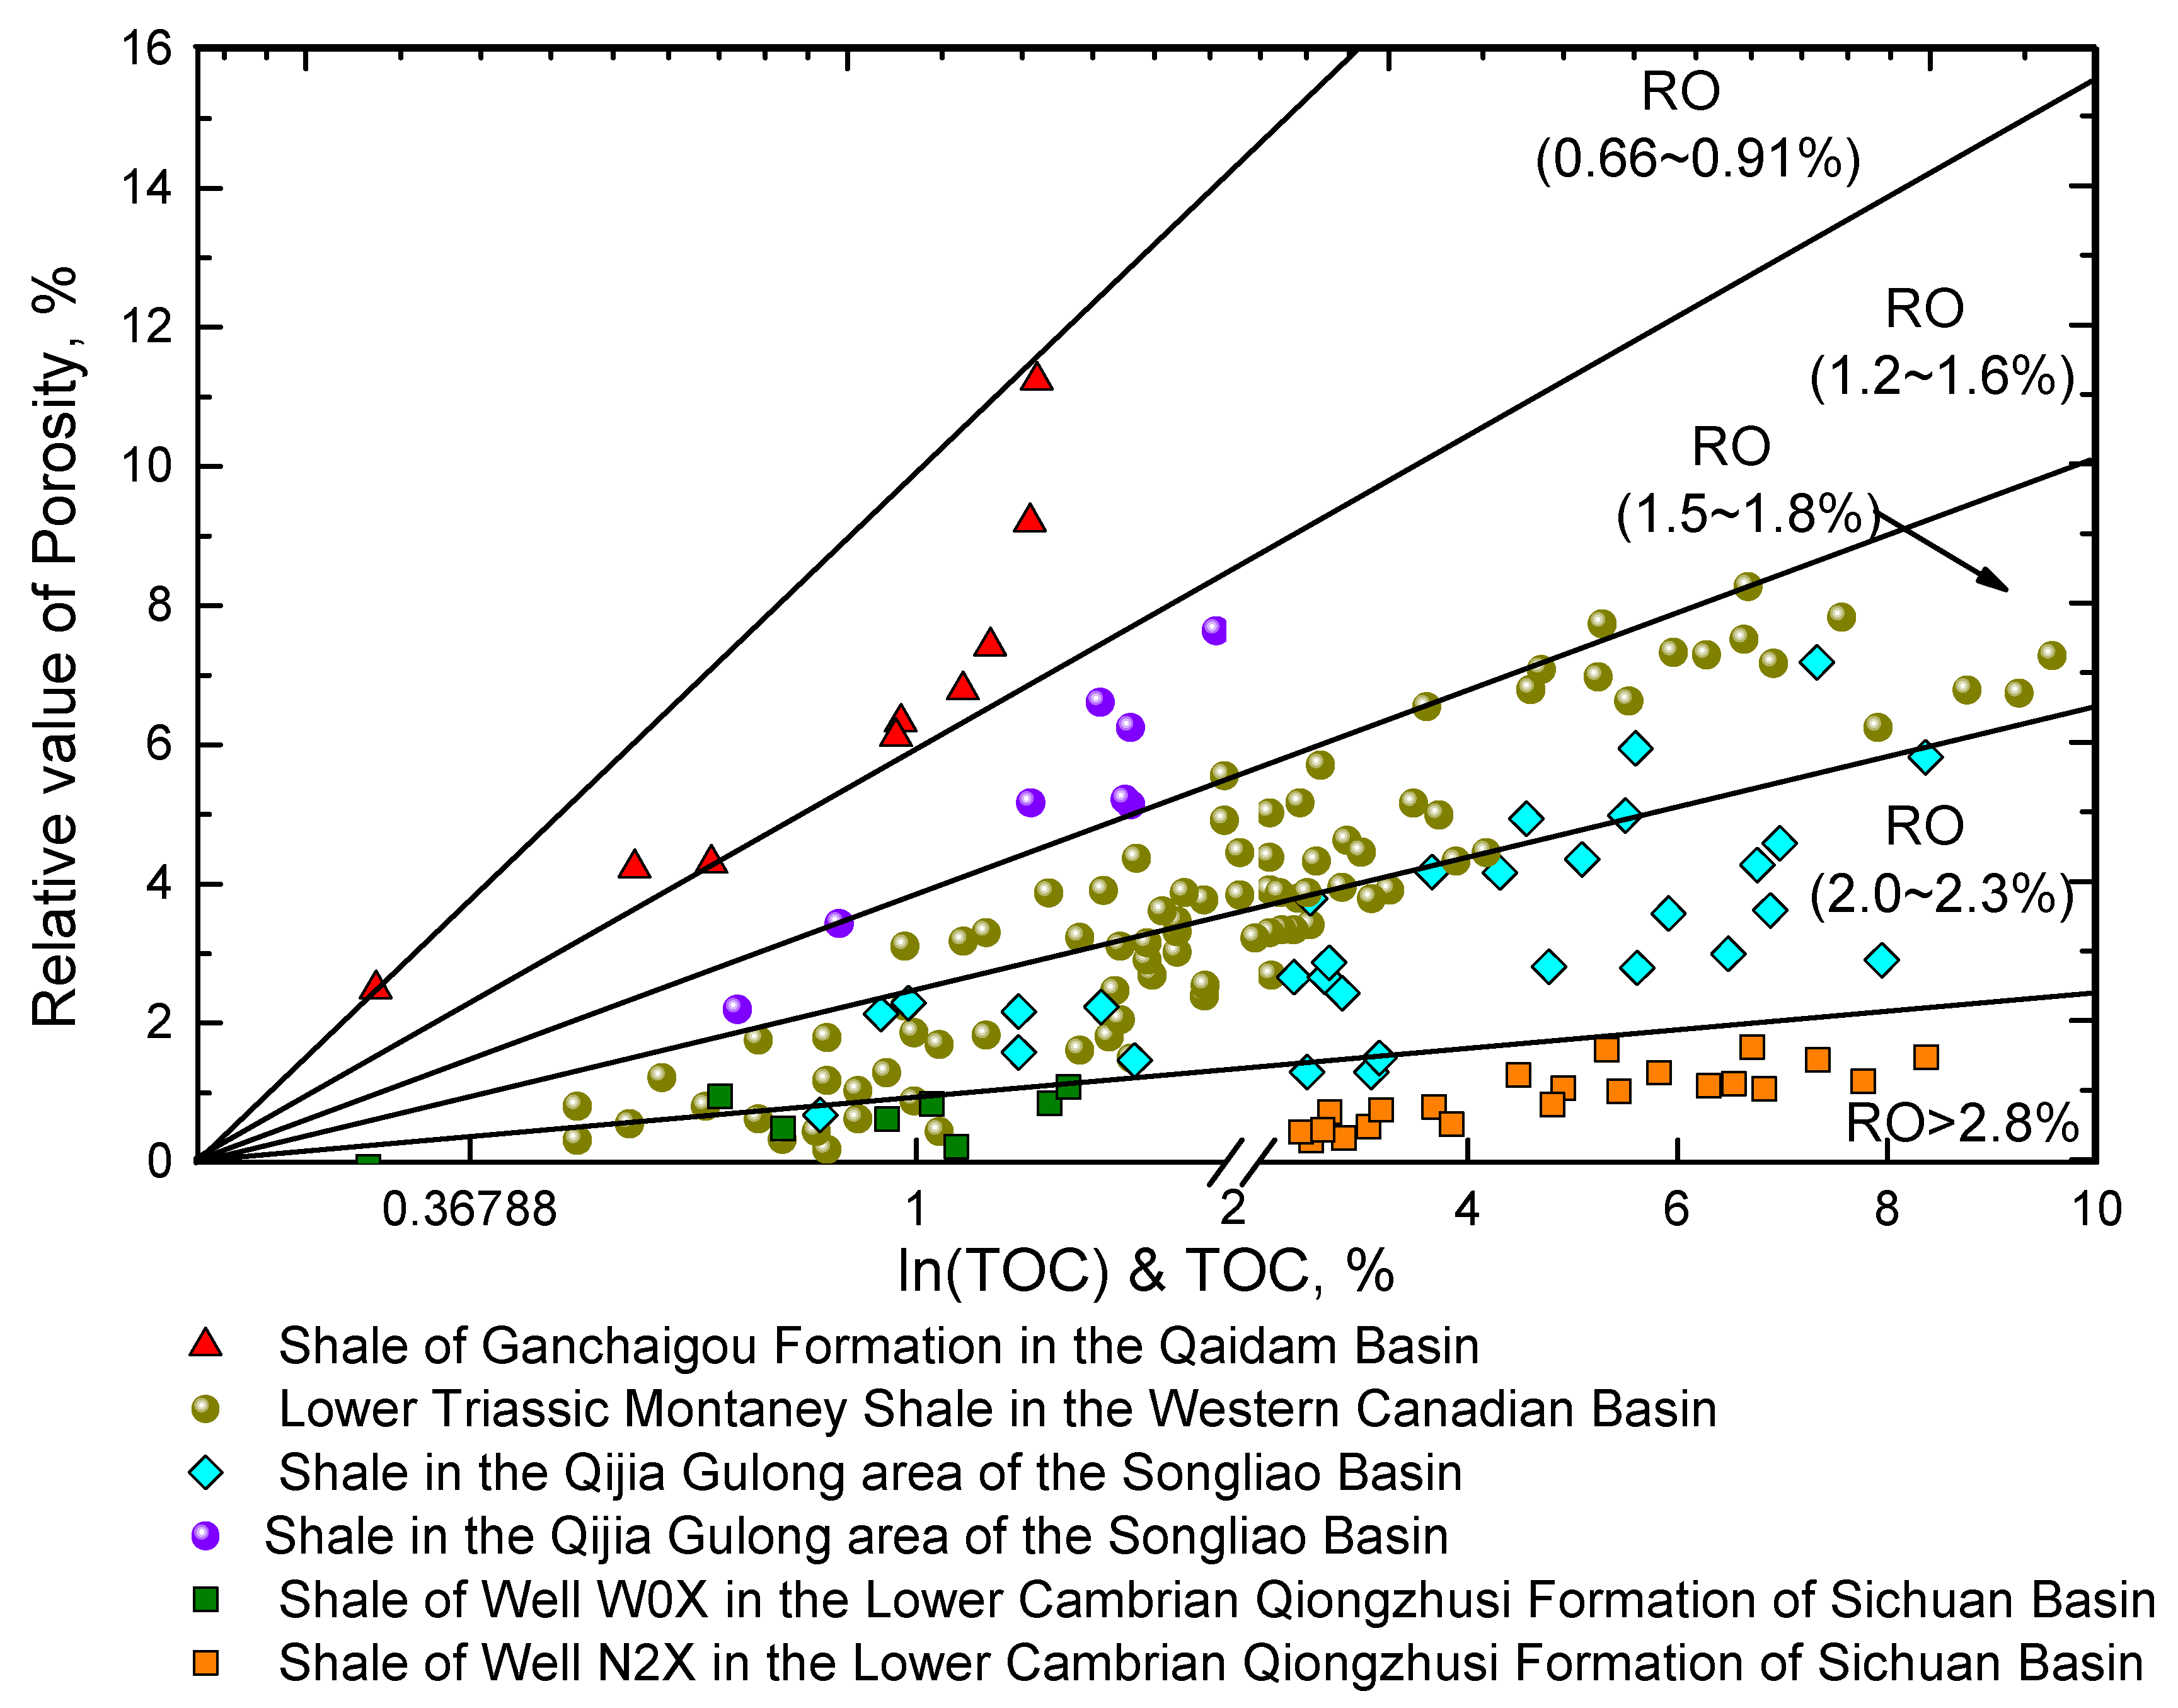
Further, it can be seen that the slope value a is in inverse proportion to Ro, which means that as organic maturity increases, the porosity increasing rate reduces. To qualitatively characterize the effects of organic maturity on the total porosity, parameter can be introduced as the pore increasing efficiency of organic matter. It is expressed as follows:
In Equation (2), is the relative value of porosity (unit: v/v), and is the porosity eliminating the original porosity.
According to Equation (2), the shale porosity–TOC maturity relationship chart is developed, as shown in Figure 6. It helps to evaluate organic maturity with known TOC and total porosity φ.
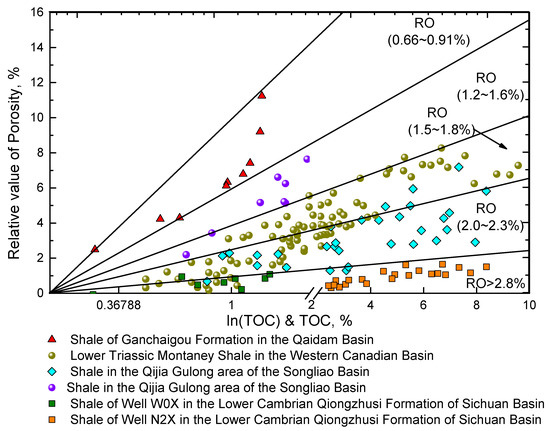
Figure 6.
Shale porosity–TOC maturity relationship chart.
4. Application
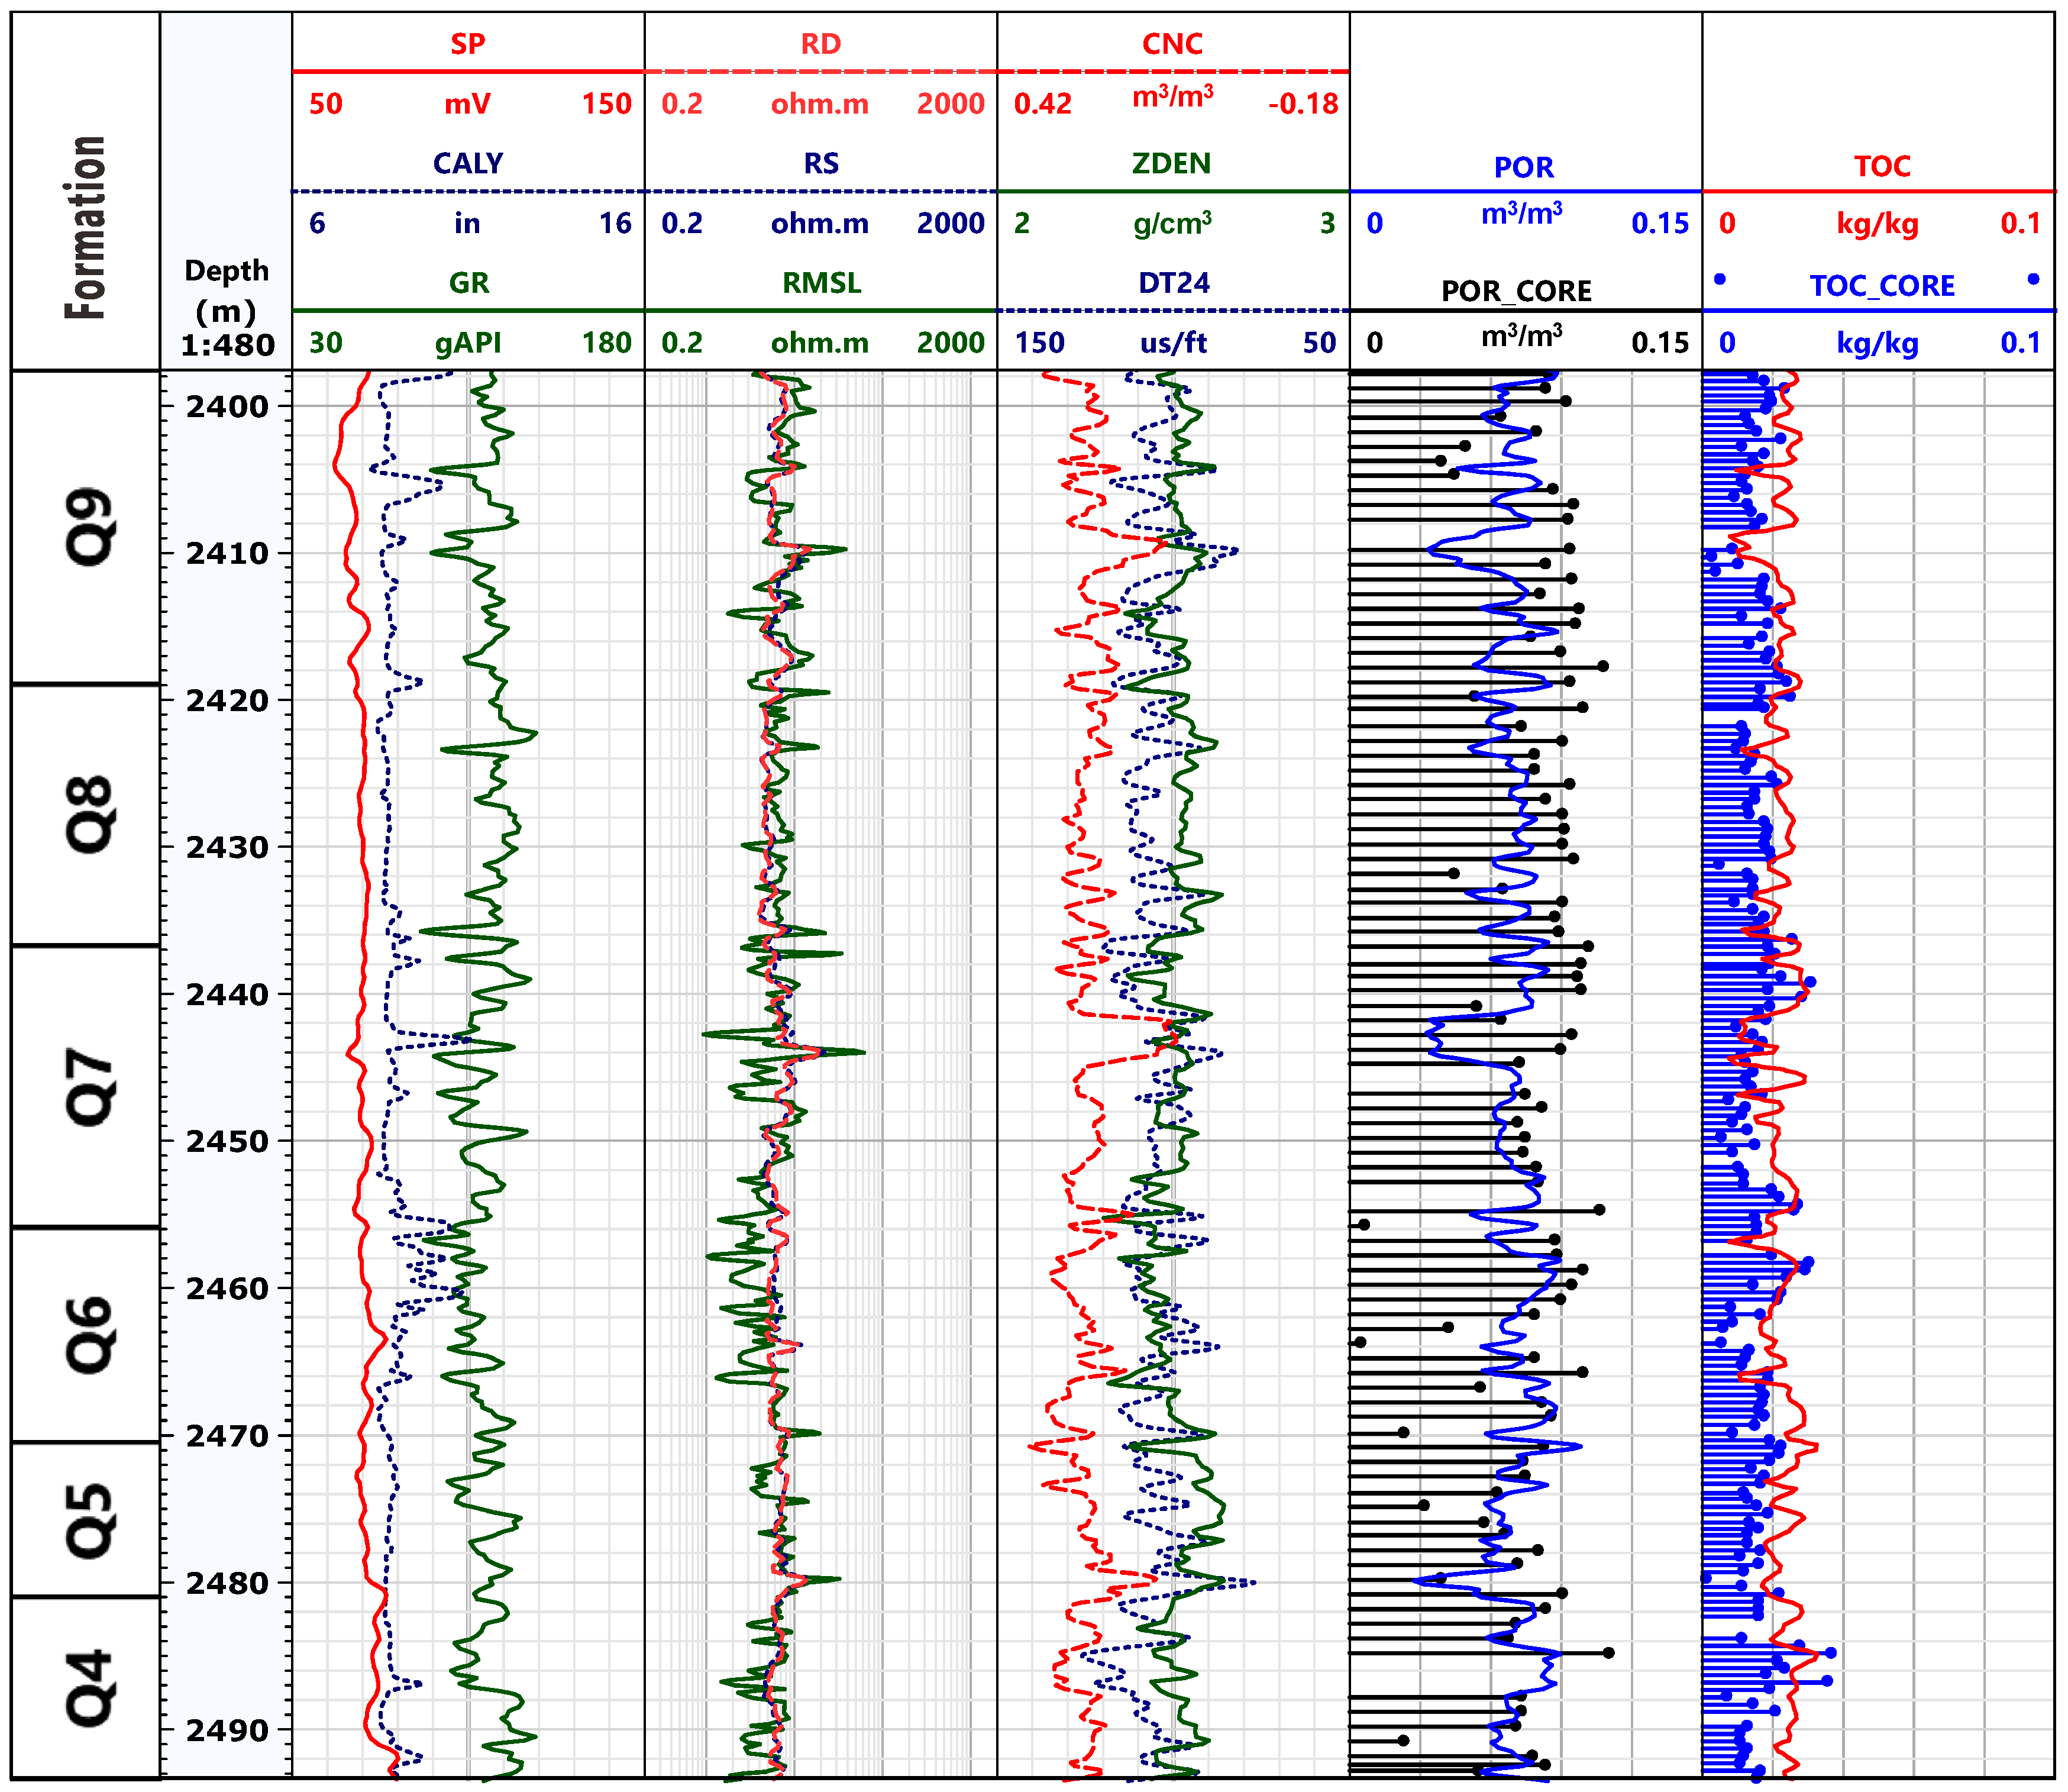
The shale porosity–TOC maturity relationship chart is applied to Well X in Gulong field in the Songliao Basin. The total porosity and TOC are calculated from loggings using the empirical formula [45,46,47], as shown in Figure 7. The evaluation result of maturity through the shale porosity–TOC maturity relationship chart is shown in Figure 8 and listed in Table 2. It shows that the average pore-increasing efficiency of the organic matter is 4.34 and that the range of vitrinite reflectance Ro is 1.2~2.0%. The maximum of Q4 is 6.04, and is relatively low compared with other sections, indicating that this section is in the hydrocarbon generation. The organic acid dissolution of unstable inorganic minerals will have positive effects on pore structure improvement. And for Section Q6, Ro is relatively high, which means that Section Q6 is in the mature to over-mature stage, and both hydrocarbon generation and its effect on pore structure declines. The application result shows that the porosity–TOC maturity relationship chart can be used in the evaluation of shale reservoirs.
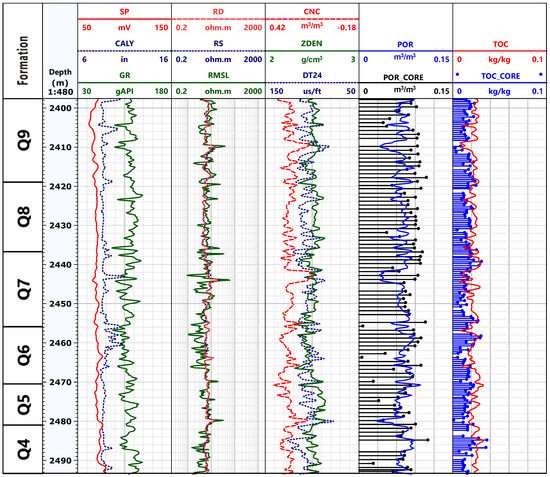
Figure 7.
Logging evaluation results of well X in Gulong, Daqing.
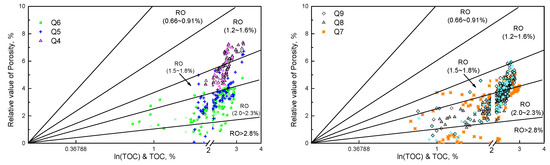
Figure 8.
Shale porosity–TOC maturity relationship chart of Well X.
Table 2.
The evaluation result of maturity through the shale porosity–TOC maturity relationship chart.
Tracks from left to right include Tracks 1–7, with Section No. (Formation), depth (meters), natural gamma-ray logging (GR: Gapi)/spontaneous potential logging (SP:mv)/Caliper logging (CAL:in), apparent resistivity logs (RLLD/RLLS: OHMM)/Microspherical focused logging (RMSL: OHMM), acoustic-wave slowness logs (DT24:us/ft)/bulk density (ZDEN: g/cm3)/neutron porosity (CNC:v/v), logging calculated porosity(POR:v/v)/experimental porosity (POR_CORE:v/v), and logging calculated TOC(TOC:kg/kg)/experimental TOC(TOC_CORE: kg/kg).
5. Discussion and Future Work
5.1. Discussion
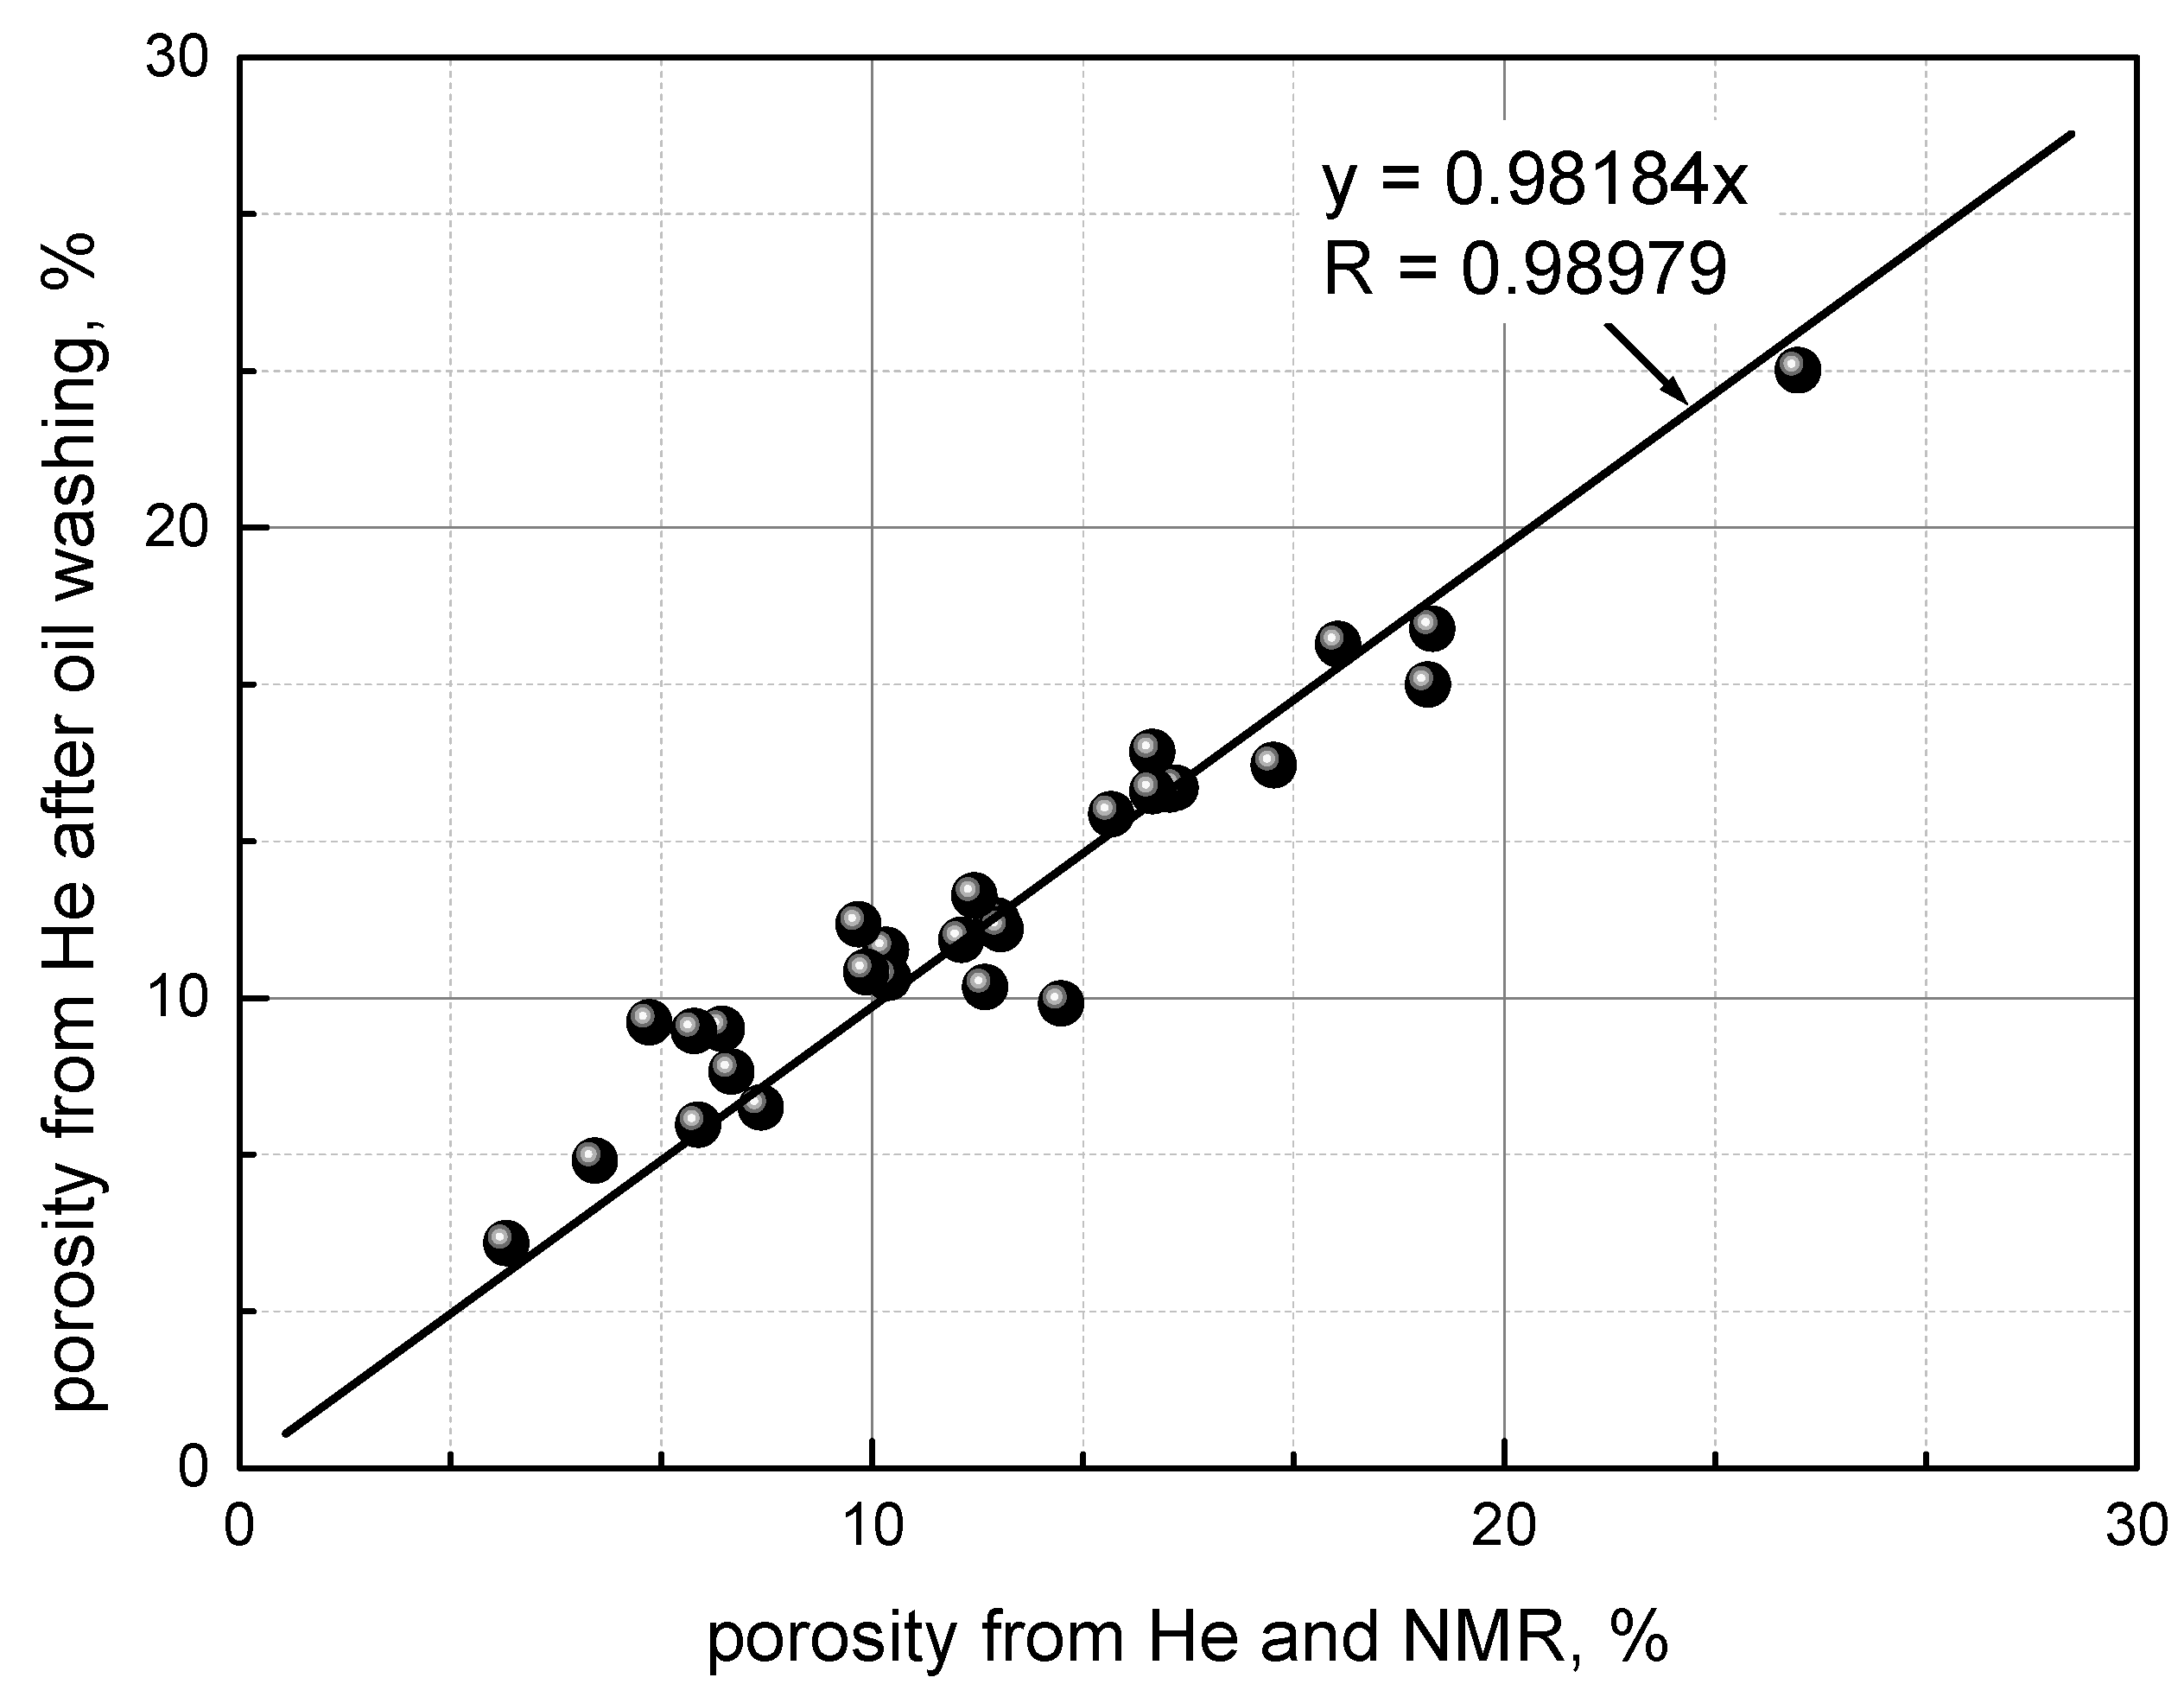
Twenty-eight shale samples from the Fengcheng Formation in the Junggar Basin were tested using the improved pore structure characterization method mentioned in Section 1. The results are shown in Figure 9 and Table 3, and the porosity calculated using the new method had good consistency with the helium porosity tested after oil and salt washing; the goodness-of-fit was 0.98979 and the average relative error was 4.92%. Compared with the helium porosity method tested after oil and salt washing, the improved pore structure characterization method is more accurate, time-saving, and has no damage to rock samples.

Figure 9.
Comparison between the new method for calculated porosity and the helium porosity tested after oil and salt washing.
Table 3.
Specific parameters of 28 rock samples.
B The calculation error of Figure 8 is mainly derived from I, and the actual porosity–TOC maturity relationship is far more complex than linear or logarithmic functions; II is the measurement errors of experimental parameters of shale.
5.2. Future Work
- A.
- The theoretical functions of the porosity–TOC maturity relationship need to be further improved to meet the accuracy of shale reservoir evaluation [48].
- B.
- The diagenetic evolution of a specific study area can be further analyzed using the porosity–TOC maturity relationship [49].
- C.
- Shale maturity can be predicted using the porosity–TOC maturity relationship, as TOC and porosity are calculated from logging data; this will improve the understanding of shale oil-rich mechanisms and sweet spot prediction [50].
- D.
- Kerogen type has a significant influence on physical properties, and the relationship between kerogen type and porosity–TOC maturity function has geochemical significance [51,52].
- E.
- Shale pore controlling factors and evolution vary significantly among regions, and the most suitable porosity measurements need to be tested for a specific region. The full-scale pore structure characterization method, combining multiple experimental methods, is a worthy study area for shale resource evaluation [53].
6. Conclusions
- (1)
- Based on measurement advantages analysis, a new method combining helium and NMR is proposed: the new method does not need to wash oil and salt, it does no damage to shale core samples, and experimental data of 28 rock samples has verified that the new method has higher accuracy.
- (2)
- Sorting out the pore evolution of organic and inorganic matter during geological periods, the organic matter content and maturity are key factors for total porosity development.
- (3)
- The shale porosity–TOC maturity relationship chart is developed based on shale samples from six formations, and the application of the new chart in Well X in the Gulong field of the Songliao Basin demonstrates that the method can be used in the evaluation of shale reservoirs.
Author Contributions
Conceptualization, J.Z. and W.X.; methodology, J.Z. and W.X.; formal analysis, S.K., Z.Z. and B.W.; investigation, J.W., D.C. and Z.L.; data curation, C.F.; writing—original draft preparation, J.Z. and W.X.; writing—review and editing, S.K.; supervision, J.W.; funding acquisition, J.Z. and W.X. All authors have read and agreed to the published version of the manuscript.
Funding
This article was supported by the Research Foundation of Karamay, China (No. 20222023hjcxrc0014) and the “Tianchi Talent” Introduction Plan Foundation of Xinjiang, China, the Research Foundation of China University of Petroleum-Beijing at Karamay (No. XQZX20230012), the Scientific Research and Technological Development Project of Petroleum China (No.2021DJ4003), the Scientific Research and Technological Project of CNPC (No.2023ZZ05), and the Project of China Petroleum Logging Co., Ltd. (No.CNLC2022-8BO1).
Data Availability Statement
The data that support the findings of this study are available from the corresponding author upon reasonable request (email: gareth123@126.com).
Conflicts of Interest
J.Z., Z.Z., B.W., J.W., D.C., Z.L. and C.F. were employed by China Petroleum Logging Co., Ltd. The remaining authors declare that the research was conducted in the absence of any commercial or financial relationships that could be construed as a potential conflict of interest. The authors declare that this study received funding from China Petroleum Logging Co., Ltd. The funder was not involved in the study design, collection, analysis, interpretation of data, the writing of this article or the decision to submit it for publication.
References
- Liu, G. Challenges and countermeasures of log evaluation in unconventional petroleum exploration and development. Pet. Explor. Dev. Online 2021, 48, 1033–1047. [Google Scholar] [CrossRef]
- Liu, G.; Liu, R.; Du, J.; Zhang, K.; Yu, J.; Liu, Q.; He, X. Study on Pore Structure and Fractal Characterization during Thermal Evolution of Oil Shale Experiments. ACS Omega 2022, 7, 12922–12936. [Google Scholar] [CrossRef] [PubMed]
- Li, Q.; Wu, S.; Zhai, X.; Pan, S.; Lin, S. Micro/Nanopore Systems in Lacustrine Tight Oil Reservoirs, China. J. Nanosci. Nanotechnol. 2021, 21, 599–607. [Google Scholar] [CrossRef] [PubMed]
- He, W.; Wang, M.; Wang, X.; Meng, Q.; Wu, Y.; Lin, T.; Li, J.; Zhang, J. Pore Structure Characteristics and Affecting Factors of Shale in the First Member of the Qingshankou Formation in the Gulong Sag, Songliao Basin. ACS Omega 2022, 7, 35755–35773. [Google Scholar] [CrossRef]
- HUO, J.; ZHI, D.; ZHENG, M.; Tang, Y.; Wang, X.; Chang, Q.; GAO, Y. Characteristics and main controls of shale oil reservoirs in Lucaogou Formation, Jimsar Sag, Junggar Basin. Pet. Geol. Exp. 2020, 42, 506–512. [Google Scholar]
- Wang, M.; Li, M.; Li, J.B.; Xu, L.; Zhang, J.X. The key parameter of shale oil resource evaluation: Oil content. Pet. Sci. 2022, 19, 1443–1459. [Google Scholar] [CrossRef]
- Garum, M.; Glover, P.W.; Lorinczi, P.; Drummond-Brydson, R.; Hassanpour, A. Micro-and nano-scale pore structure in gas shale using Xμ-CT and FIB-SEM techniques. Energy Fuels 2020, 34, 12340–12353. [Google Scholar] [CrossRef]
- Yang, L.; Dou, N.; Lu, X.; Zhang, X.; Chen, X.; Gao, J.; Wang, Y. Advances in understanding imbibition characteristics of shale using an NMR technique: A comparative study of marine and continental shale. J. Geophys. Eng. 2018, 15, 1363–1375. [Google Scholar] [CrossRef]
- Odusina, E.; Sigal, R.F. Laboratory NMR measurements on methane saturated Barnett Shale samples. Petrophysics 2011, 52, 32–49. [Google Scholar]
- Harris-Lowe, R.F.; Smee, K.A. Thermal expansion of liquid helium ii. Phys. Rev. A 1970, 2, 158. [Google Scholar] [CrossRef]
- Yuan, Y.; Rezaee, R. Comparative porosity and pore structure assessment in shales: Measurement techniques, influencing factors and implications for reservoir characterization. Energies 2019, 12, 2094. [Google Scholar] [CrossRef]
- Clarkson, C.R.; Solano, N.; Bustin, R.M.; Bustin, A.M.M.; Chalmers, G.R.; He, L.; Melnichenko, Y.B.; Radliński, A.P.; Blach, T.P. Pore structure characterization of North American shale gas reservoirs using USANS/SANS, gas adsorption, and mercury intrusion. Fuel 2013, 103, 606–616. [Google Scholar] [CrossRef]
- Kuila, U.; McCarty, D.K.; Derkowski, A.; Fischer, T.B.; Prasad, M. Total porosity measurement in gas shales by the water immersion porosimetry (WIP) method. Fuel 2014, 117, 1115–1129. [Google Scholar] [CrossRef]
- Yuan, Y.; Rezaee, R.; Verrall, M.; Hu, S.Y.; Zou, J.; Testmanti, N. Pore characterization and clay bound water assessment in shale with a combination of NMR and low-pressure nitrogen gas adsorption. Int. J. Coal Geol. 2018, 194, 11–21. [Google Scholar] [CrossRef]
- Lizhi, X. Nuclear Magnetic Resonance Imaging Logging and Rock NMR and Its Application; Science Press: Beijing, China, 2011. [Google Scholar]
- Xie, W.; Yin, Q.; Wang, G.; Yu, Z. Variable dimension fractal-based conversion method between the nuclear magnetic resonance T2 spectrum and capillary pressure curve. Energy Fuels 2020, 35, 351–357. [Google Scholar] [CrossRef]
- Brumberger, H. (Ed.) Modern Aspects of Small-Angle Scattering; Springer Science & Business Media: Berlin/Heidelberg, Germany, 2013; Volume 451. [Google Scholar]
- Bahadur, J.; Ruppert, L.F.; Pipich, V.; Sakurovs, R.; Melnichenko, Y.B. Porosity of the Marcellus Shale: A contrast matching small-angle neutron scattering study. Int. J. Coal Geol. 2018, 188, 156–164. [Google Scholar] [CrossRef]
- Seiler, H. Secondary electron emission in the scanning electron microscope. J. Appl. Phys. 1983, 54, R1–R18. [Google Scholar] [CrossRef]
- Sarker, M.R.H.; Siddiqui, S. Advances in micro-CT based evaluation of reservoir rocks. In Proceedings of the SPE Saudi Arabia Section Technical Symposium, Al-Khobar, Saudi Arabia, 9–11 May 2009; p. SPE-126039. [Google Scholar]
- Wang, F.; Guo, S. Influential factors and model of shale pore evolution: A case study of a continental shale from the Ordos Basin. Mar. Pet. Geol. 2019, 102, 271–282. [Google Scholar] [CrossRef]
- Gao, Z.; Fan, Y.; Xuan, Q.; Zheng, G. A review of shale pore structure evolution characteristics with increasing thermal maturities. Adv. Geo-Energy Res. 2020, 4, 247–259. [Google Scholar] [CrossRef]
- Liang, M.; Wang, Z.; Gao, L.; Li, C.; Li, H. Evolution of pore structure in gas shale related to structural deformation. Fuel 2017, 197, 310–319. [Google Scholar] [CrossRef]
- Modica, C.J.; Lapierre, S.G. Estimation of kerogen porosity in source rocks as a function of thermal transformation: Example from the Mowry Shale in the Powder River Basin of Wyoming. AAPG Bull. 2012, 96, 87–108. [Google Scholar] [CrossRef]
- Yu, H.; Wang, Z.; Rezaee, R.; Zhang, Y.; Han, T.; Arif, M.; Johnson, L. Porosity estimation in kerogen-bearing shale gas reservoirs. J. Nat. Gas Sci. Eng. 2018, 52, 575–581. [Google Scholar] [CrossRef]
- Curtis, M.E.; Cardott, B.J.; Sondergeld, C.H.; Rai, C.S. The development of organic porosity in the Woodford Shale related to thermal maturity. In Proceedings of the SPE Annual Technical Conference and Exhibition, San Antonio, TX, USA, 8–10 October 2012; p. SPE-160158. [Google Scholar]
- Xu, H.; Yu, H.; Fan, J.; Xia, J.; Liu, H.; Wu, H. Formation mechanism and structural characteristic of pore-networks in shale kerogen during in-situ conversion process. Energy 2022, 242, 122992. [Google Scholar] [CrossRef]
- Tan, M.; Mao, K.; Song, X.; Yang, X.; Xu, J. NMR petrophysical interpretation method of gas shale based on core NMR experiment. J. Pet. Sci. Eng. 2015, 136, 100–111. [Google Scholar] [CrossRef]
- Iqbal, M.A.; Rezaee, R. Porosity and Water Saturation Estimation for Shale Reservoirs: An Example from Goldwyer Formation Shale, Canning Basin, Western Australia. Energies 2020, 13, 6294. [Google Scholar] [CrossRef]
- Chen, Z.; Jiang, C. A revised method for organic porosity estimation in shale reservoirs using Rock-Eval data: Example from Duvernay Formation in the Western Canada Sedimentary Basin. AAPG Bull. 2016, 100, 405–422. [Google Scholar] [CrossRef]
- Xie, W.; Yin, Q.; Guan, W.; Wang, G.; Lai, J. Estimating the relative permeability from the electrical parameters of sandstone with a complex pore structure. Energy Fuels 2020, 34, 14124–14131. [Google Scholar] [CrossRef]
- Xie, W.; Yin, Q.; Wu, L.; Yang, F.; Zhao, J.; Wang, G. A new nuclear magnetic resonance-based permeability model based on two pore structure characterization methods for complex pore structure rocks: Permeability assessment in Nanpu Sag, China. Geophysics 2024, 89, MR43–MR51. [Google Scholar] [CrossRef]
- Sun, L.; Tuo, J.; Zhang, M.; Wu, C.; Chai, S. Pore structures and fractal characteristics of nano-pores in shale of Lucaogou formation from Junggar Basin during water pressure-controlled artificial pyrolysis. J. Anal. Appl. Pyrolysis 2019, 140, 404–412. [Google Scholar] [CrossRef]
- Clarkson, C.R.; Haghshenas, B.; Ghanizadeh, A.; Qanbari, F.; Williams-Kovacs, J.D.; Riazi, N.; Debuhr, C.; Deglint, H.J. Nanopores to megafractures: Current challenges and methods for shale gas reservoir and hydraulic fracture characterization. J. Nat. Gas Sci. Eng. 2016, 31, 612–657. [Google Scholar] [CrossRef]
- Ross, D.J.K.; Bustin, R.M. The importance of shale composition and pore structure upon gas storage potential of shale gas reservoirs. Mar. Pet. Geol. 2009, 26, 916–927. [Google Scholar] [CrossRef]
- Ji, L.; Zhang, T.; Milliken, K.L.; Qu, J.; Zhang, X. Experimental investigation of main controls to methane adsorption in clay-rich rocks. Appl. Geochem. 2012, 27, 2533–2545. [Google Scholar] [CrossRef]
- Liu, B.; Schiieber, J.; Mastalerz, M. Combined SEM and reflected light petrography of organic matter in the New Albany Shale in the Illinois Basin: A perspective on organic pore development with thermal maturation. Int. J. Coal Geol. 2017, 184, 57–72. [Google Scholar] [CrossRef]
- Curtis, M.E.; Ambrose, R.J.; Sondergeld, C.H.; Rai, C.S. Investigation of the relationship between organic porosity and thermal maturity in the Marcellus Shale. In Proceedings of the North American Unconventional Gas Conference and Exhibition, The Woodlands, TX, USA, 14–16 June 2011. [Google Scholar]
- Jennings, D.S.; Antia, J. Petrographic characterization of the Eagle Ford Shale, south Texas: Mineralogy, common constituens, and distribution of nanometer-scal pore types. In Electron Microscopy of Shale Hydrocarbon Reservoirs: AAPG Memoir; Camp, W., Diaz, E., Wawak, B., Eds.; American Association of Petroleum Geologists: Tulsa, OK, USA, 2013; Volume 102, pp. 101–113. [Google Scholar]
- Zargari, S.; Wilkinson, T.M.; Packard, C.E.; Prasad, M. Effect of thermal maturity on elastic properties of kerogen. Geophysics 2016, 81, M1–M6. [Google Scholar] [CrossRef]
- Xi, Z.; Tang, S.; Zhang, S.; Sun, K. Pore structure characteristics of marine–continental transitional shale: A case study in the Qinshui Basin, China. Energy Fuels 2017, 31, 7854–7866. [Google Scholar] [CrossRef]
- Curtis, M.E.; Cardott, B.J.; Sondergeld, C.H.; Rai, C.S. Development of organic porosity in the Woodford Shale with increasing thermal maturity. Int. J. Coal Geol. 2012, 103, 26–31. [Google Scholar] [CrossRef]
- Zhao, J.; Jin, Z.; Jin, Z.; Hu, Q.; Hu, Z.; Du, W.; Geng, Y. Mineral types and organic matters of the Ordovician-Silurian Wufeng and Longmaxi Shale in the Sichuan Basin, China: Implications for pore systems, diagenetic pathways, and reservoir quality in fine-grained sedimentary rocks. Mar. Pet. Geol. 2017, 86, 655–674. [Google Scholar] [CrossRef]
- Wu, S.; Yang, Z.; Zhai, X.; Cui, J.; Bai, L.; Pan, S.; Cui, J. An experimental study of organic matter, minerals and porosity evolution in shales within high-temperature and high-pressure constraints. Mar. Pet. Geol. 2019, 102, 377–390. [Google Scholar] [CrossRef]
- Kamali, M.R.; Mirshady, A.A. Total organic carbon content determined from well logs using ΔLogR and Neuro Fuzzy techniques. J. Pet. Sci. Eng. 2004, 45, 141–148. [Google Scholar] [CrossRef]
- Zhao, P.; Mao, Z.; Huang, Z.; Zhang, C. A new method for estimating total organic carbon content from well logs. Aapg Bull. 2016, 100, 1311–1327. [Google Scholar] [CrossRef]
- Shi, X.; Wang, J.; Liu, G.; Yang, L.; Ge, X.; Jiang, S. Application of extreme learning machine and neural networks in total organic carbon content prediction in organic shale with wire line logs. J. Nat. Gas Sci. Eng. 2016, 33, 687–702. [Google Scholar] [CrossRef]
- Song, L.; Martin, K.; Carr, T.R.; Ghahfarokhi, P.K. Porosity and storage capacity of Middle Devonian shale: A function of thermal maturity, total organic carbon, and clay content. Fuel 2019, 241, 1036–1044. [Google Scholar] [CrossRef]
- Xie, W.; Chen, S.; Vandeginste, V.; Yu, Z.; Wang, H.; Wang, M. Review of the effect of diagenetic evolution of shale reservoir on the pore structure and adsorption capacity of clay minerals. Energy Fuels 2022, 36, 4728–4745. [Google Scholar] [CrossRef]
- Lu, Y.; Yang, F.; Bai, T.A.; Han, B.; Lu, Y.; Gao, H. Shale Oil Occurrence Mechanisms: A Comprehensive Review of the Occurrence State, Occurrence Space, and Movability of Shale Oil. Energies 2022, 15, 9485. [Google Scholar] [CrossRef]
- Craddock, P.R.; Haecker, A.; Bake, K.D.; Pomerantz, A.E. Universal curves describing the chemical and physical evolution of type II kerogen during thermal maturation. Energy Fuels 2020, 34, 15217–15233. [Google Scholar] [CrossRef]
- Shi, K.; Chen, J.; Pang, X.; Jiang, F.; Hui, S.; Zhang, S.; Pang, H.; Wang, Y.; Chen, D.; Pu, T.; et al. Average molecular structure model of shale kerogen: Experimental characterization, structural reconstruction, and pyrolysis analysis. Fuel 2024, 355, 129474. [Google Scholar] [CrossRef]
- Zhao, R.; Xue, H.; Lu, S.; Li, J.; Tian, S.; Dong, Z. Multi-scale pore structure characterization of lacustrine shale and its coupling relationship with material composition: An integrated study of multiple experiments. Mar. Pet. Geol. 2022, 140, 105648. [Google Scholar] [CrossRef]

Disclaimer/Publisher’s Note: The statements, opinions and data contained in all publications are solely those of the individual author(s) and contributor(s) and not of MDPI and/or the editor(s). MDPI and/or the editor(s) disclaim responsibility for any injury to people or property resulting from any ideas, methods, instructions or products referred to in the content. |
© 2024 by the authors. Licensee MDPI, Basel, Switzerland. This article is an open access article distributed under the terms and conditions of the Creative Commons Attribution (CC BY) license (https://creativecommons.org/licenses/by/4.0/).