Article

A New Method for Determining Economic Well Pattern Density and Infilling Time of Tight Gas Reservoirs

1
CNOOC Research Institute Co., Ltd., Beijing 100028, China
2
Key Laboratory of Improving Oil and Gas Recovery Efficiency of the Ministry of Education, Northeast Petroleum University, Daqing 163318, China
*
Authors to whom correspondence should be addressed.
Energies 2024, 17(5), 1223; https://doi.org/10.3390/en17051223
Submission received: 1 February 2024 / Revised: 26 February 2024 / Accepted: 1 March 2024 / Published: 4 March 2024
(This article belongs to the Section C: Energy Economics and Policy)

Abstract

:
Well pattern infilling optimization is a crucial measure to enhance gas recovery, especially in tight gas reservoirs with low permeability and small-scale sand bodies. Traditional methods of determining well pattern density rely on qualitative analysis from the perspective of gas blocks. However, these methods are challenging to apply to sand bodies with different properties, and there have been no studies conducted on infilling time, which significantly impacts production increment. In response to this situation, this paper establishes a series of evaluation indexes and proposes a numerical simulation of economic well pattern density and infilling time based on real parameters obtained from the Linxing–Shenfu gas field. To quantitatively determine the economic well pattern density and infilling time based on fine characterization of sand bodies, a sensitivity analysis is conducted, considering various permeability levels and reserve abundance. Two intersection charts of economic well pattern density and infilling time, relating to reserve abundance and permeability, are then drawn. Furthermore, a real well site is selected as an example, and the infilling effect analysis confirms the reliability of the charts. The new method of determining economic well pattern density and infilling time presented in this article can provide theoretical support for the economic and efficient development of the Linxing–Shenfu gas field, serving as a useful reference for the beneficial development of similar gas reservoirs.

1. Introduction

As an unconventional hydrocarbon resource, tight sandstone gas is stored in tight sandstone formations with low permeability (<2 mD), low porosity (<15%), and low gas saturation (<60%). Tight gas reservoirs are widely distributed and possess significant resource scale and development potential [1,2]. Notably, the proven recoverable tight gas in the Ordos Basin accounts for nearly 58% of the total proven recoverable tight gas in China [3,4]. However, due to low permeability and strong heterogeneity, tight gas wells experience minimal stable production periods. To maintain long-term stable production, infilled wells must be drilled to compensate for the decline [5,6]. Research and development practices, both in China and abroad, reveal that infilling well patterns are among the most effective measures influencing the reserve production degree and the recovery efficiency of tight sandstone gas reservoirs [7]. Characterizations of reservoirs directly affect the production scenario, economics, and field development strategies [8,9].
Numerous methods have been developed to optimize well pattern density in tight sandstone gas reservoirs. McCain et al. (1993) [10] described a powerful statistical method for dividing the reservoir into areas of productive behavior and provided an unbiased means of comparing well performance, selecting areas for advanced analysis, and determining well pattern density. Voneiff et al. (1996) [11] presented an approach, referred to as the “moving domain”, to optimize well pattern density by drawing statistical conclusions regarding well performance, depletion, and undrained acreage. However, both the statistical method and the “moving domain” approach have been found to be unsuitable for thin gas layers and lens-shaped sand bodies in China [12,13,14]. Li et al. (2015) [15] conducted a well interference analysis, elucidating the relationship between the probability of inter-well interference and well pattern density, and established a mathematical model for optimizing the development of the well pattern. Gao et al. (2020) [16] established a well interference probability curve by developing a calculation method for well interference probability and then devised a method tailored for optimizing well pattern density and evaluating recovery efficiency in tight sandstone gas reservoirs. Li et al. (2020) [17] computed the fuzzy prediction value of the single well dynamic control area and compared it with the geological well control area to determine the well pattern density under various reservoir physical conditions. These scholars introduced the concept of well interference probability to optimize well patterns, but they considered only a few influencing factors. Guo et al. (2022) [18] categorized the recoverable reservoirs into three types and analyzed the appropriate well pattern density, considering factors such as the inflection point of recovery factor enhancement, overall development effectiveness of the well groups, and the break-even point of the infilling well. Cheng et al. (2023) [19] argued that to achieve long-term stable production in the gas field, it is imperative to advance refined reservoir description technology and enhance production through various measures such as infilling wells, thereby improving the reserve utilization degree. Taking into account remaining reserves and well pattern characteristics, these scholars proposed the economic limit well pattern method and gas well drainage radius conversion method; however, they did not incorporate sand body fine characterizations and infilling time into their considerations [20]. Consequently, there is an urgent need to conduct research on economic well pattern density and infilling time for sand bodies based on fine characterizations [21,22].
Building upon the aforementioned challenges, this paper focuses on the Linxing–Shenfu gas field in the Ordos Basin to explore a novel method for optimizing infilled wells. Initially, we identify several key factors influencing the development of tight gas reservoirs and establish evaluation criteria for economic well pattern density and infilling time. Subsequently, we conduct an in-depth analysis of the geological parameters of the Linxing–Shenfu gas field and construct a numerical model using Rubis in the KAPPA workstation software (V5.30). Following this, we delve into a sensitivity analysis of well pattern density and infilling time for a single sand body under various reserve abundance and permeability conditions. Subsequently, we generate an economic well pattern density chart and an infilling time chart. To validate the reliability of our new method, we select examples and applications from the Linxing–Shenfu gas field. What needs to be emphasized is that the terminology of “economic well pattern density” refers to the maximum well pattern density of sand bodies that can be profitable. In other words, the benefits brought by infilling a new well cannot cover the drilling cost under the condition of economic well pattern density. This study also introduces the concept of adjusting time, which is defined by the recovery of the sand body when a well is infilled. The latest adjusting time is defined as the infilling time, which refers to the maximum recovery of the sand body that meets the gas production increment standard. The terminology “reserve abundance” refers to the richness of natural gas reserves underground, which is usually used to describe the level of reserves in a particular region or specific natural gas storage. In this study, reserve abundance refers to the richness of tight gas in each sand body and it equals sand body reserve divided by sand body area.

2. Construction of Evaluation Standards and Numerical Model

2.1. Evaluation Standards

In the early development stage of tight gas reservoirs, well spacing was typically large, emphasizing high single well production and a low inter-well interference rate. However, this approach inevitably resulted in low reserve utilization and gas recovery. To address the production demand for enhancing gas recovery, it is imperative to shift the concept of infilling wells from avoiding inter-well interference to pursuing maximum output under a low production interference ratio. The following evaluation standards are proposed:
(1)
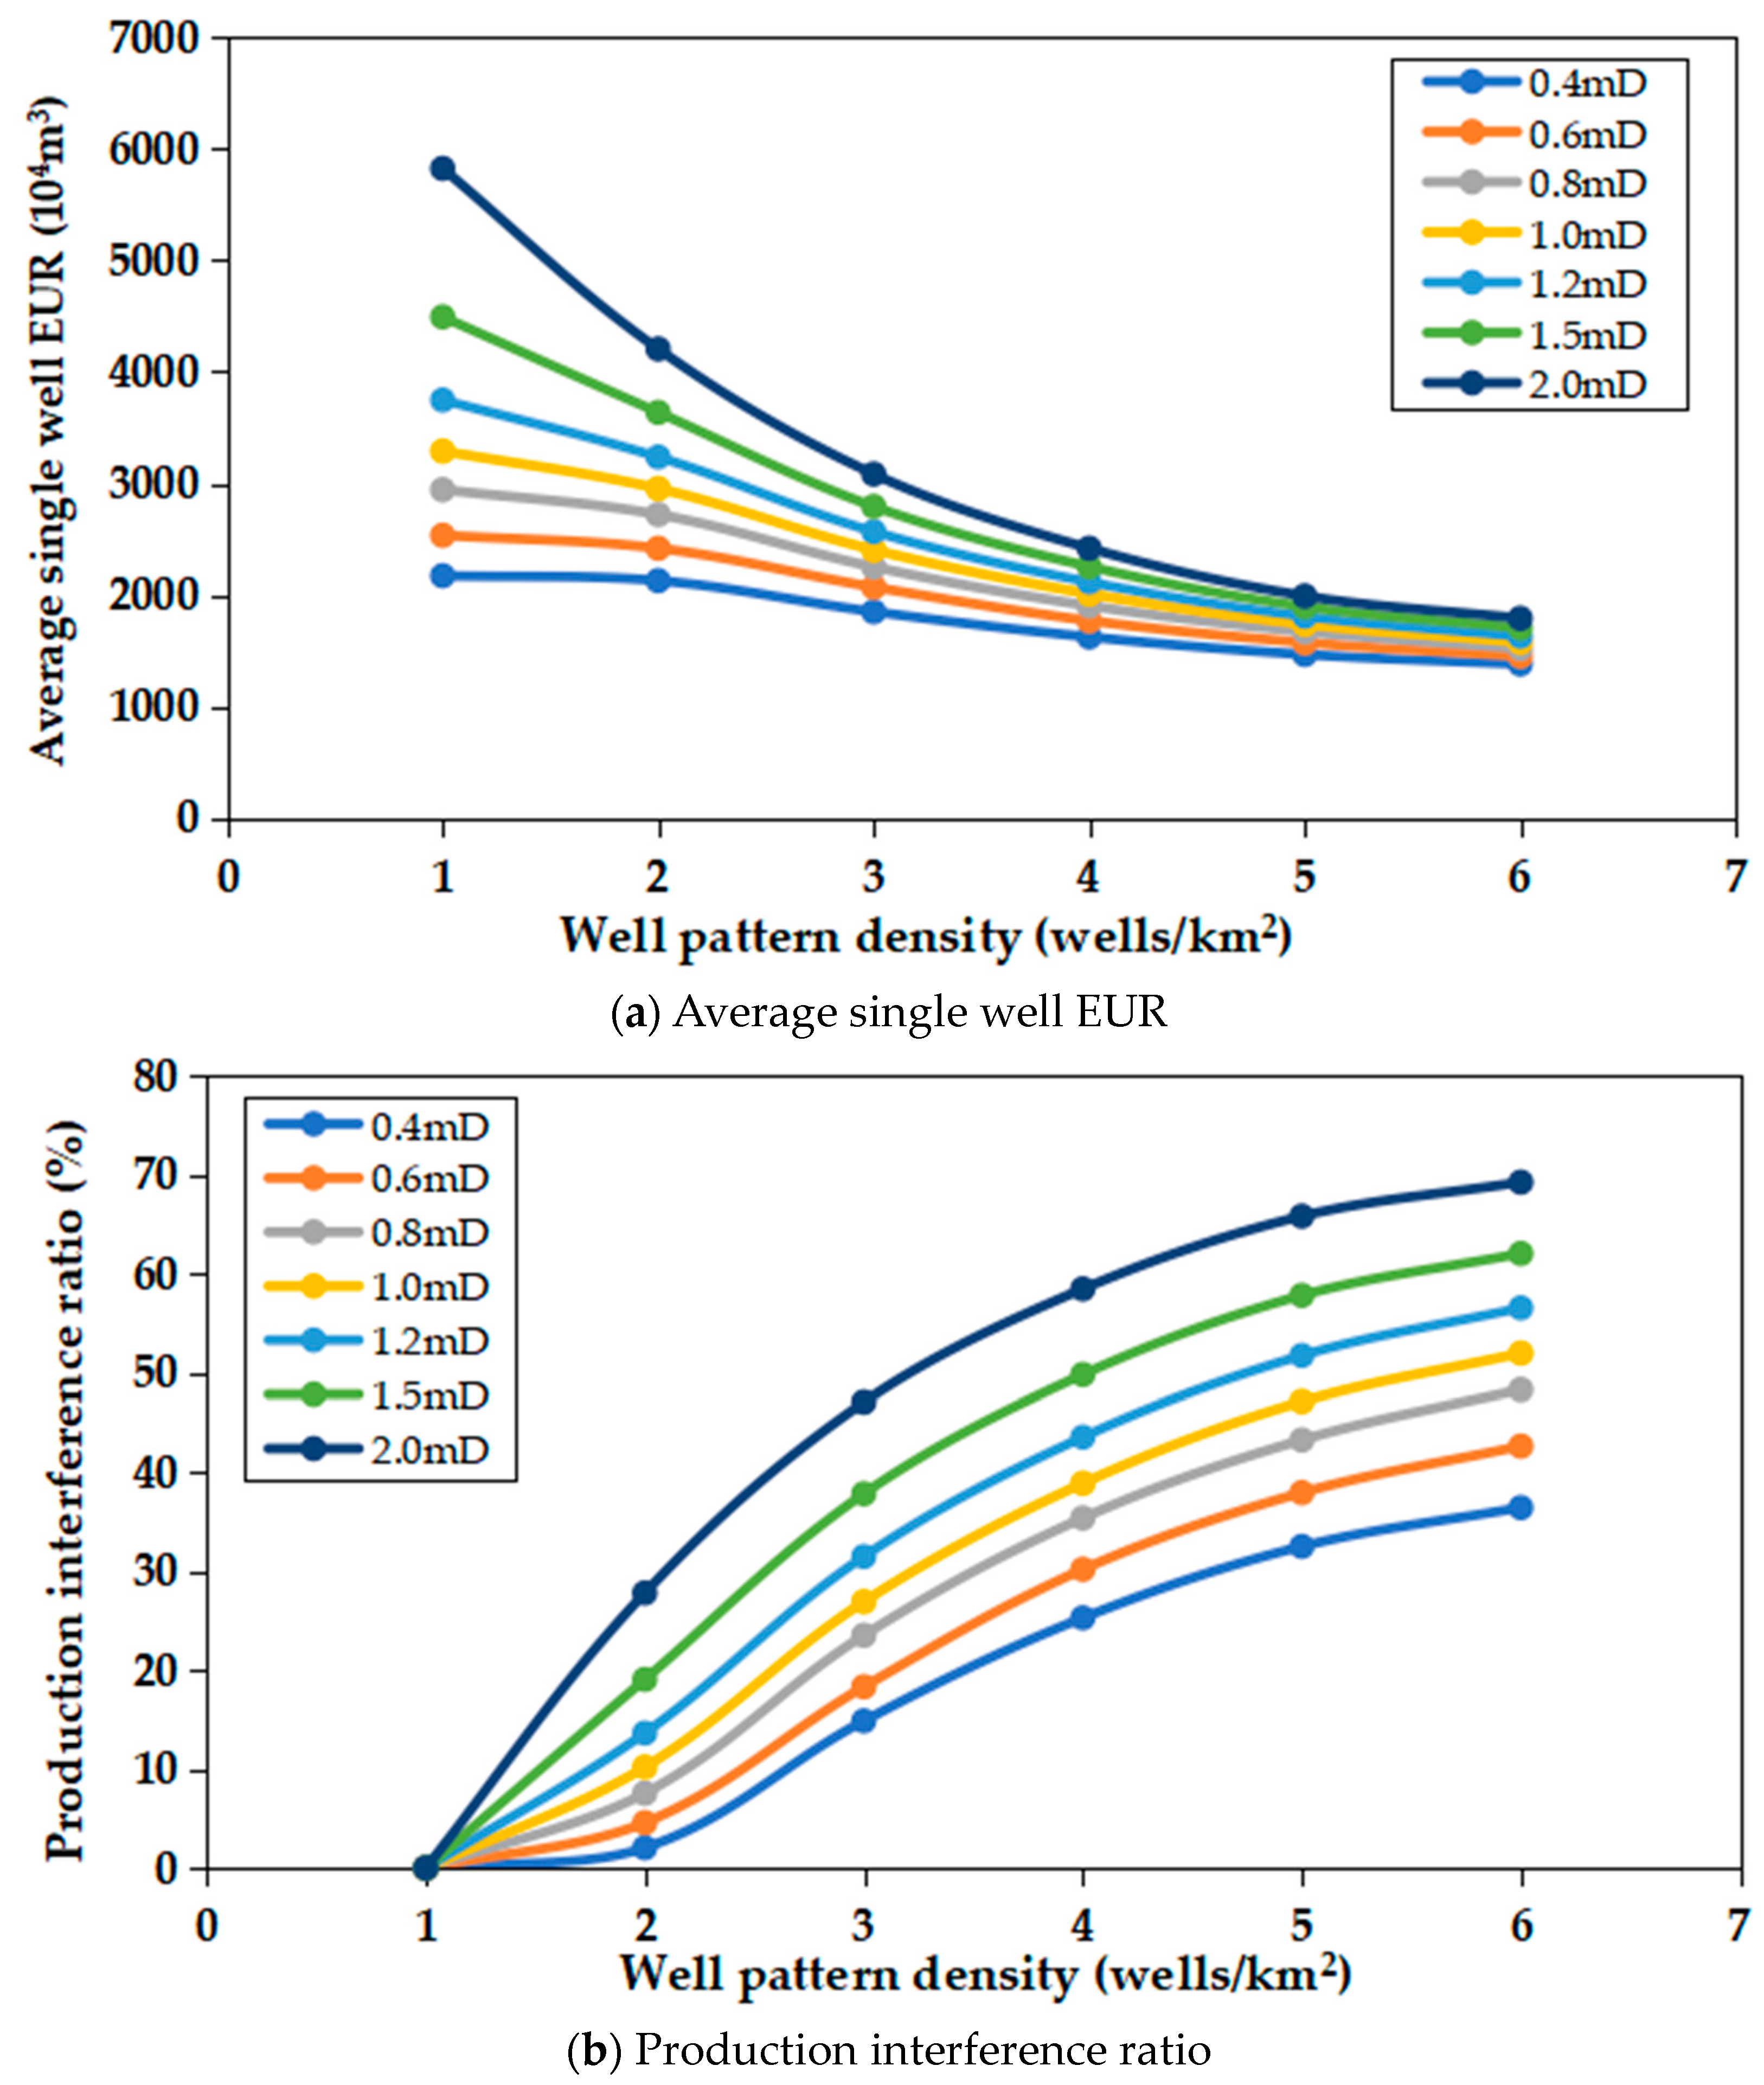
Average single well Estimated Ultimate Recovery (EUR): Calculated considering the cost of drilling, completion, and surface projects, the economic limit for the EUR of a basic well is 1600 × 104 m3.
(2)
Production interference ratio: I R = P P
where I R is the production interference ratio, %; P is the difference of the average single well EUR before and after infilling, 104 m3; and P is the average single well EUR before infilling, 104 m3.
Referring to the Sulige gas field and considering the conditions in the Linxing–Shenfu gas field [23], it is recommended to maintain a production interference ratio below 30%.
(1)
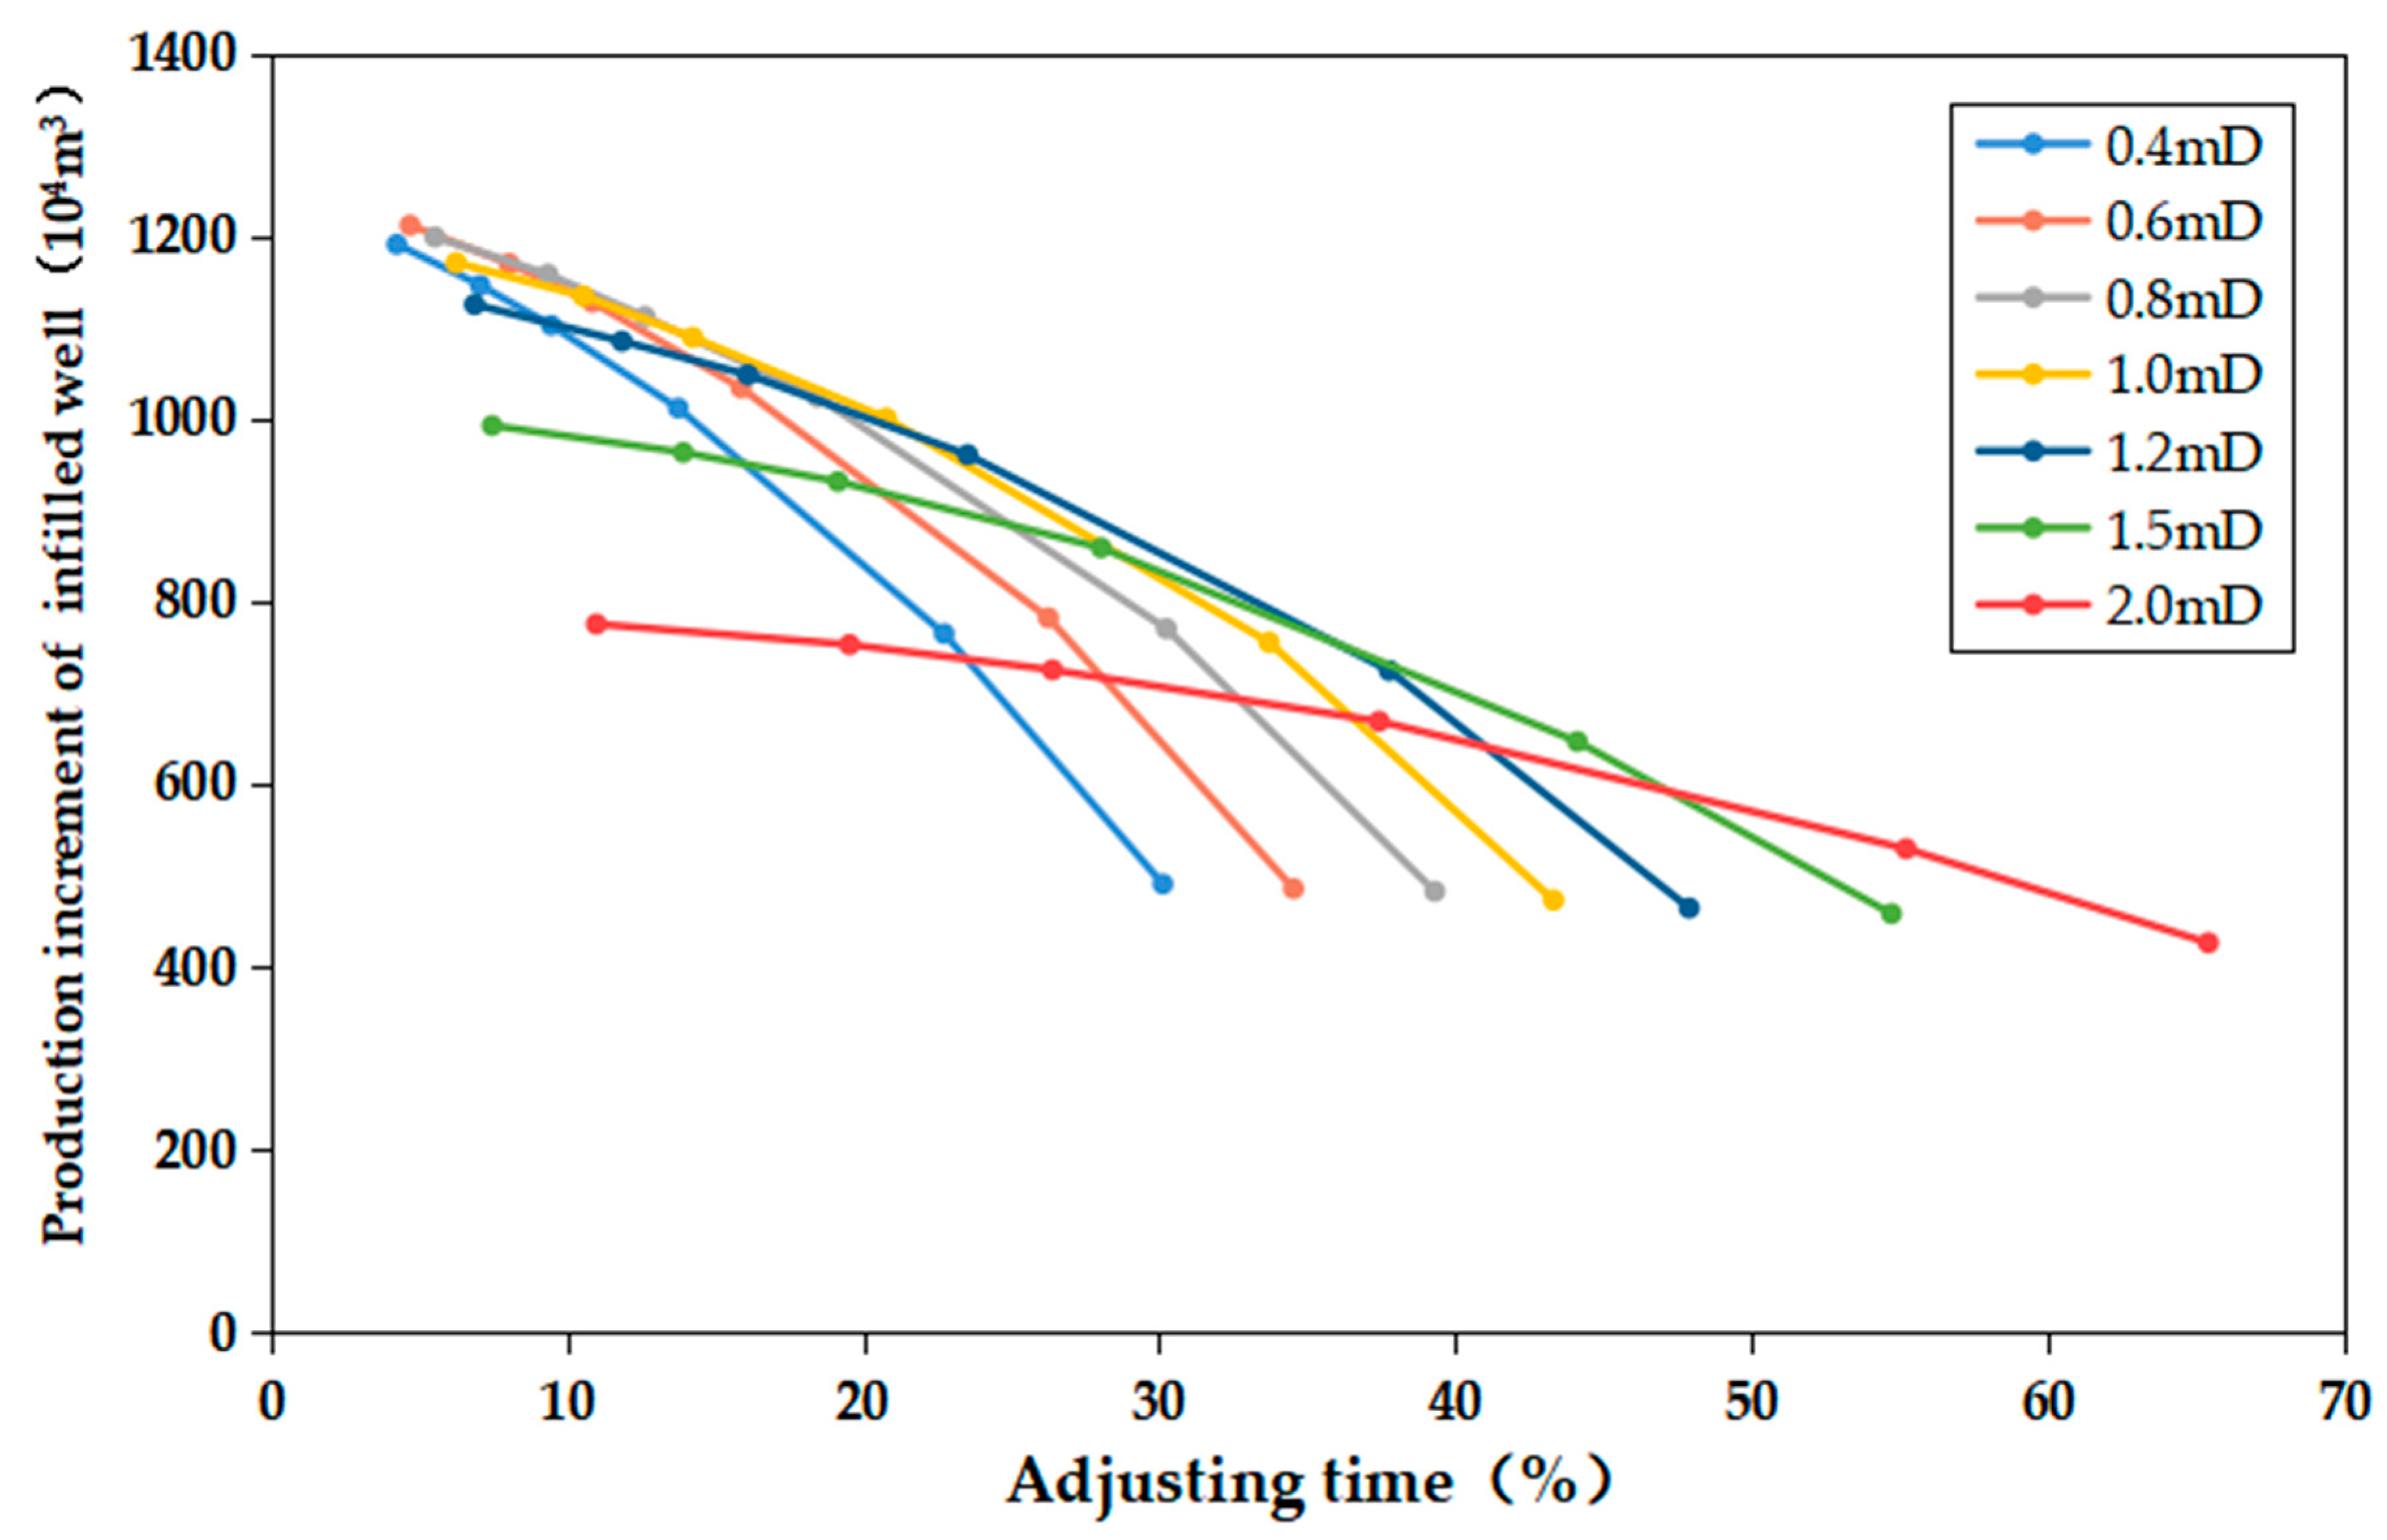
Production increment of an infilled well: Calculated with the cost of drilling and completion, which is independent of the surface projects, the economic limit production increment of an infilled well is 1100 × 104 m3.
(2)
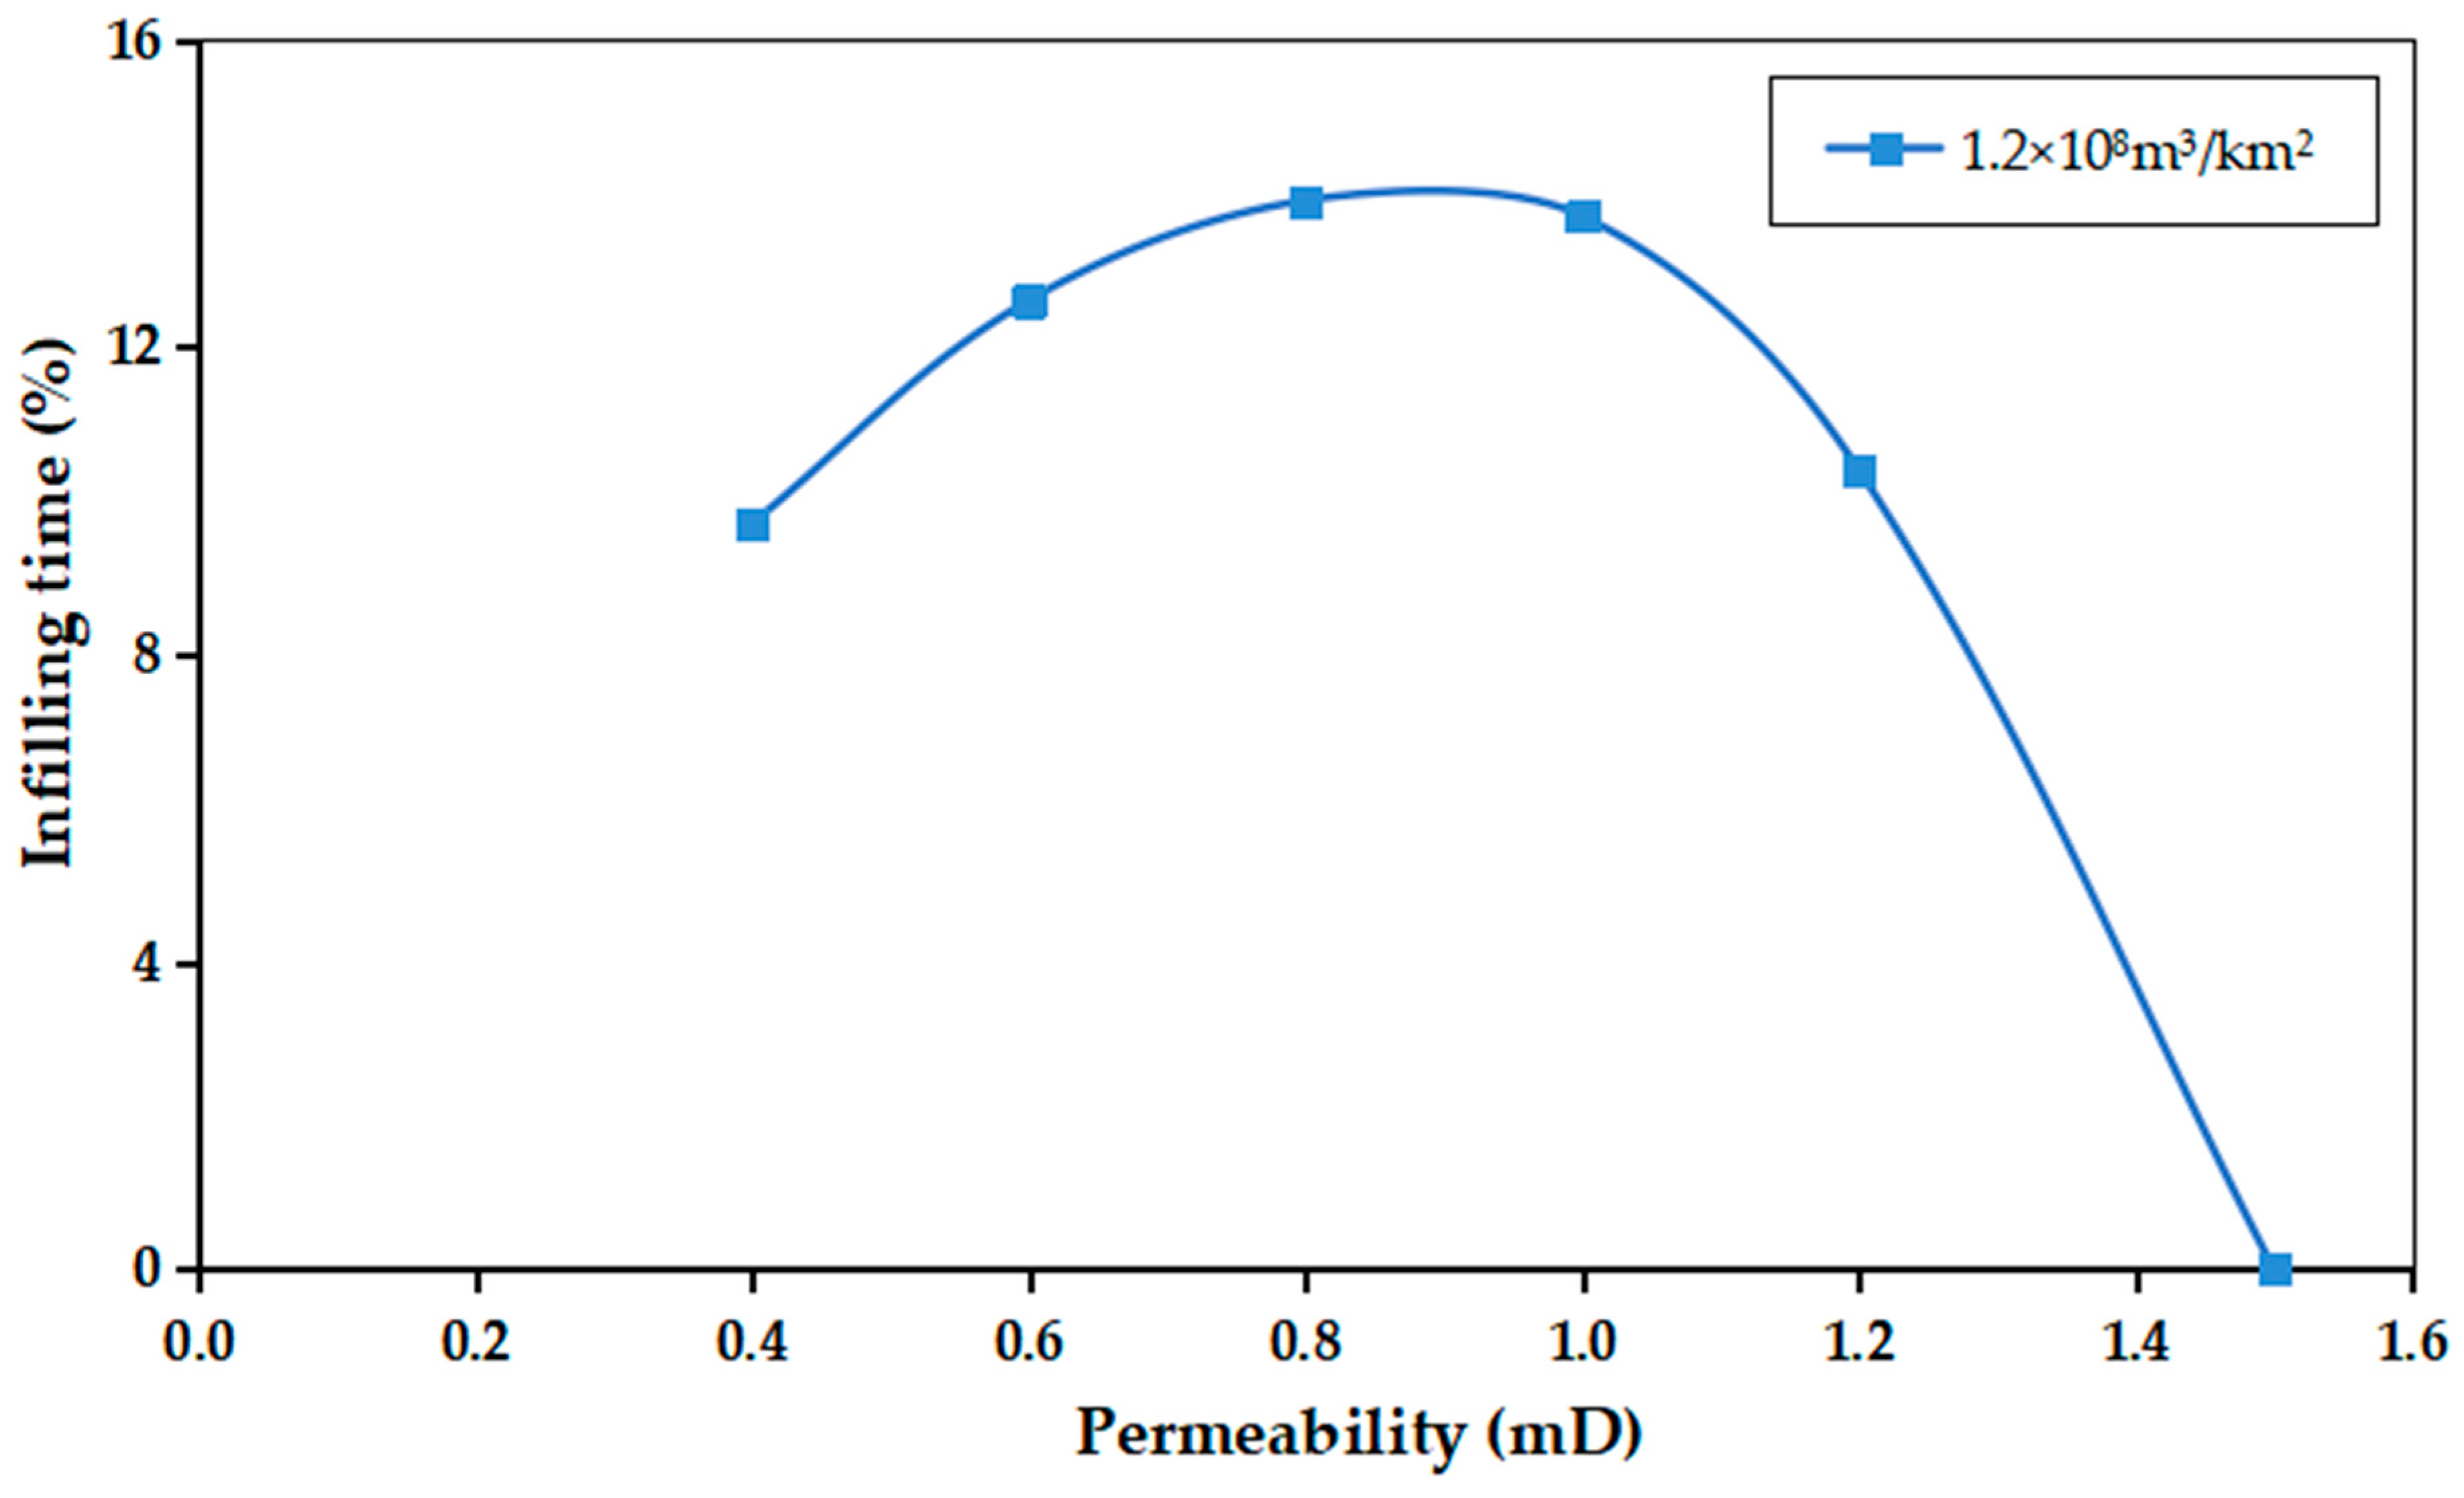
Infilling time standard: The adjustment time is defined by the recovery of the sand body following the infilling of a well. The infilling time, which marks the economically effective period, is determined by the maximum sand body recovery that meets the gas production increment standard. In other words, infilling a well before reaching this infilling time is considered economically effective.
On one hand, it is crucial to distinguish between the production increment of the infilled well and the infilled well EUR. The production increment is only a component of the EUR, as the infilled well EUR encompasses the production reduction per basic well after infilling. This reduction occurs because the infilled well grabs gas from the basic well, thereby improving production speed but not overall recovery. On the other hand, infilling wells does not always guarantee economic benefits. Assuming an economic well pattern density of 4 wells/km², where each well is economically viable, if the initial well pattern is 3 wells/km² and one well is infilled ten years later, the infilled well may not yield economic benefits. Despite the infilled well pattern density being 4 wells/km², if the sand body recovery exceeds the infilling time, and the remaining reserves are insufficient to meet the production increment standard, it indicates that infilling should occur before reaching the infilling time.

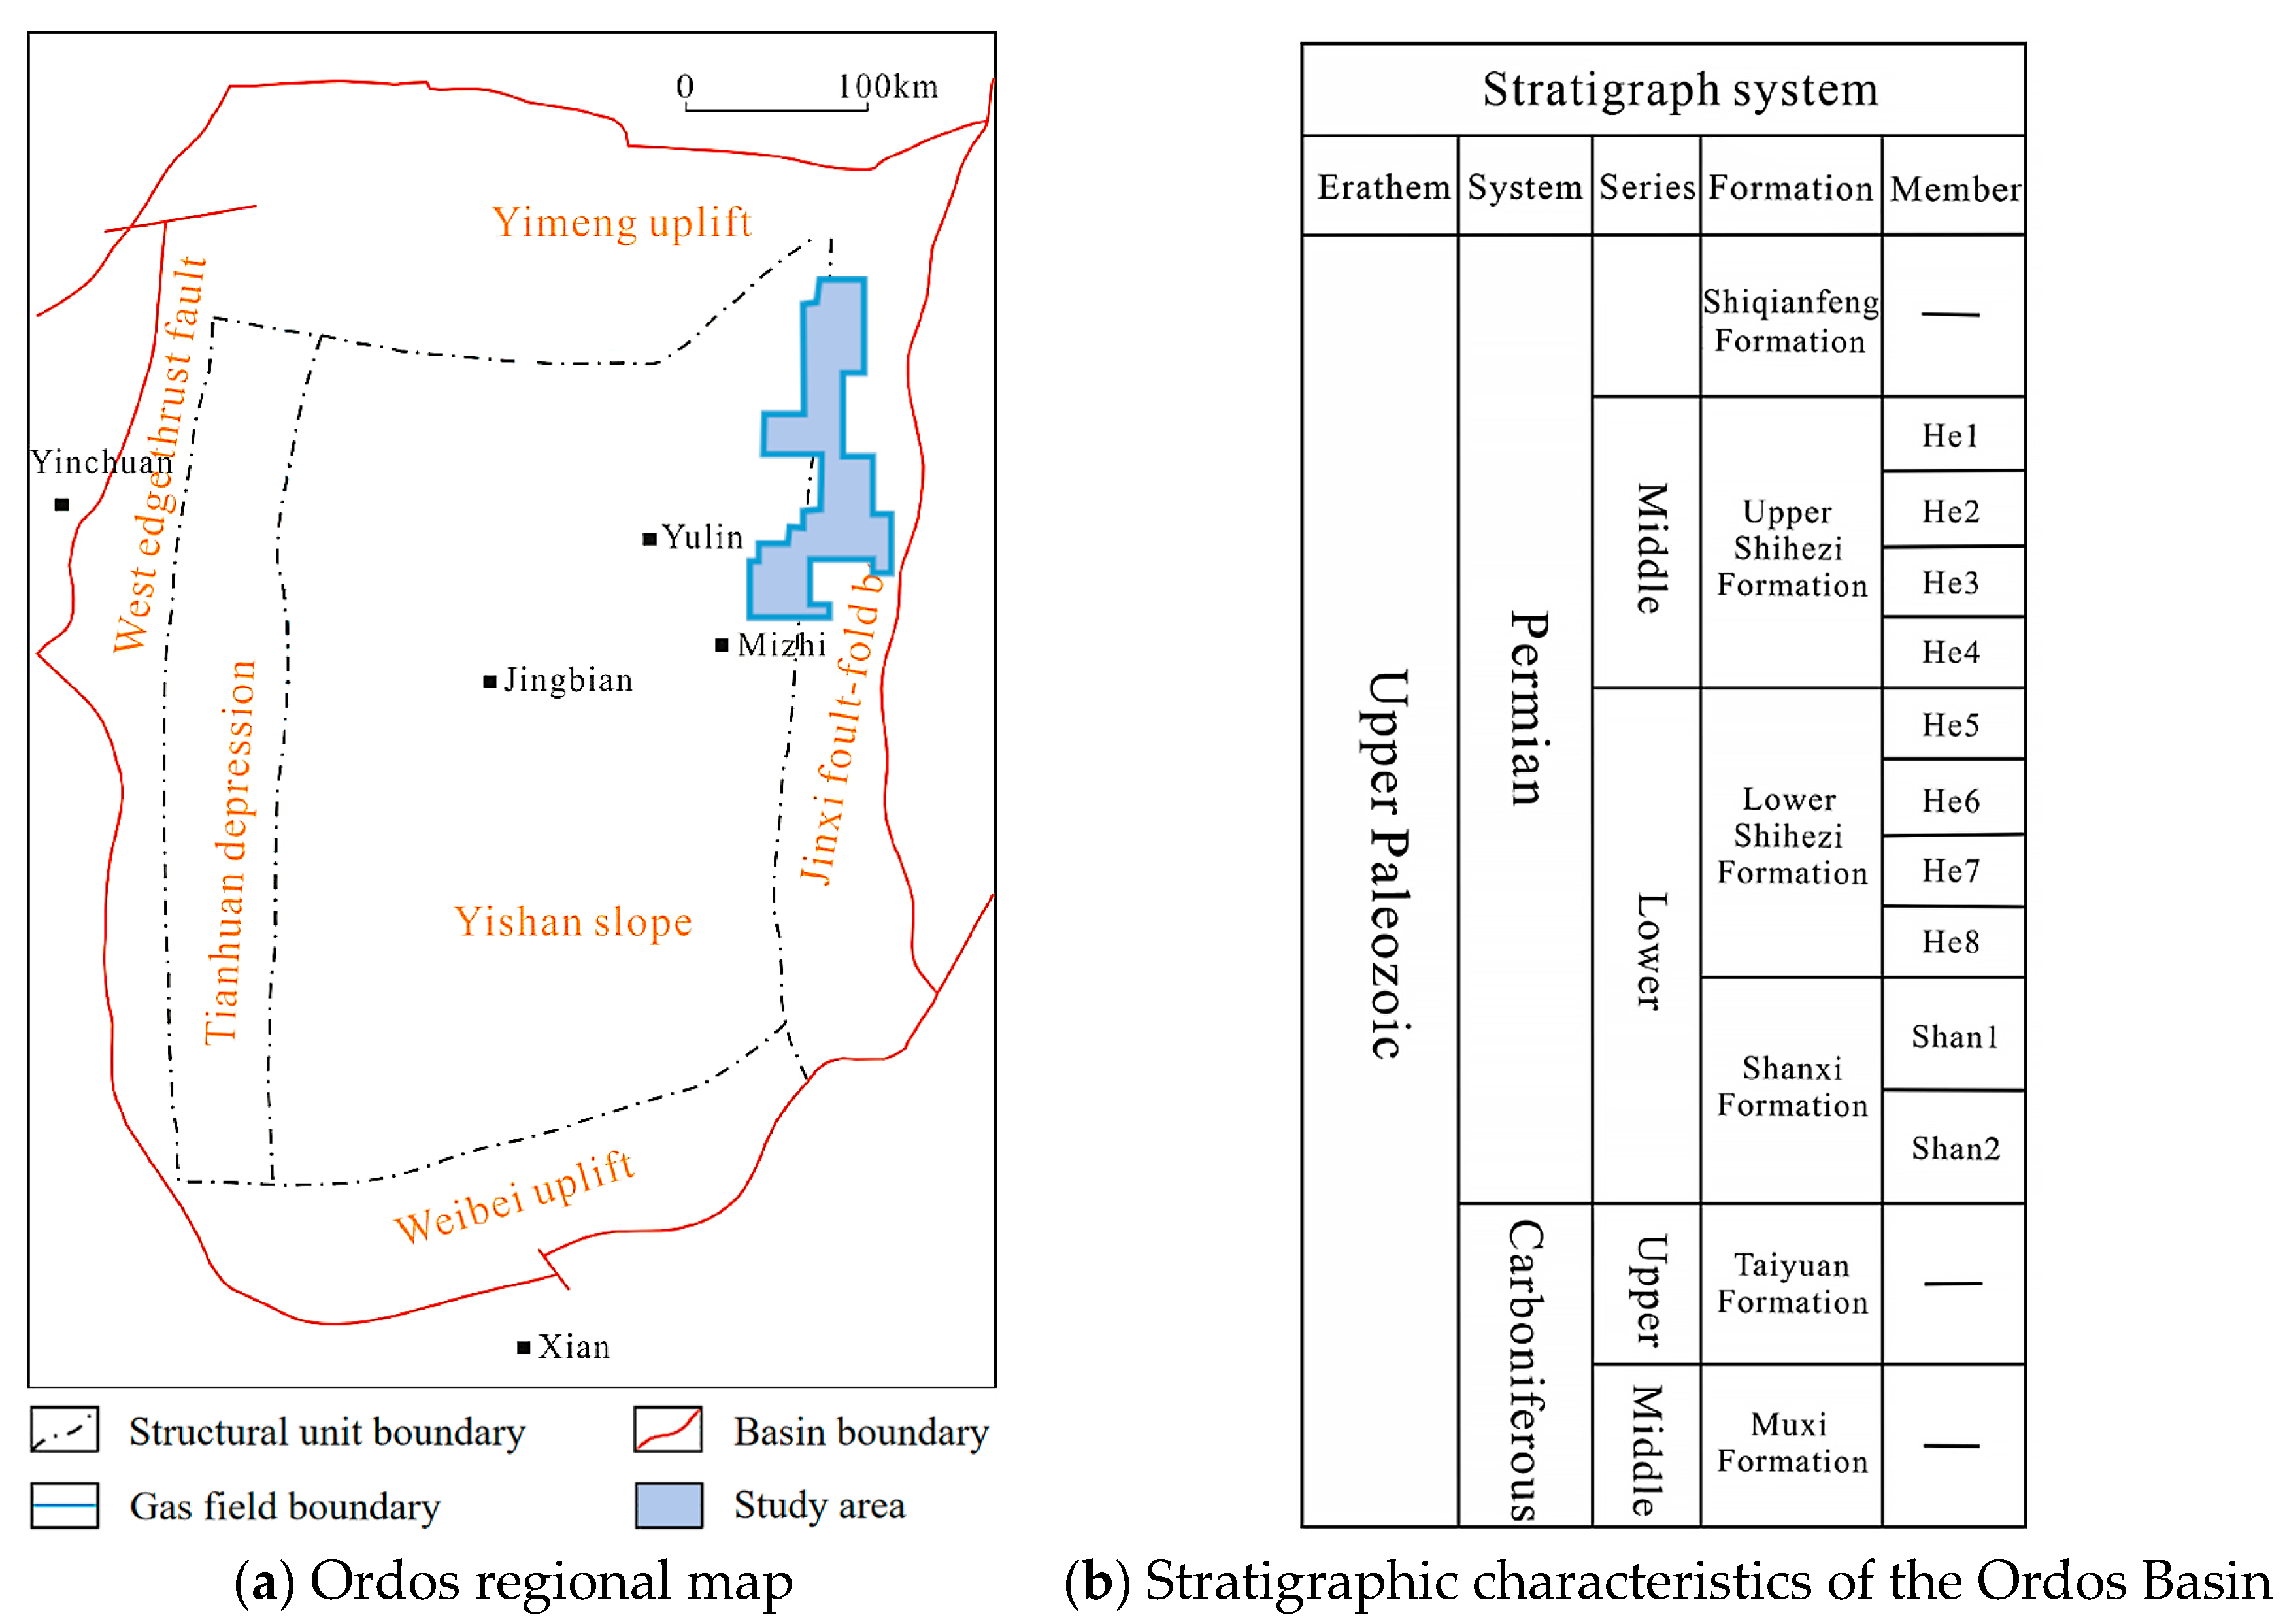
2.2. Geologic Setting

The Linxing–Shenfu gas field, a typical tight sandstone gas reservoir in China, is located in the eastern part of the Ordos Basin (Figure 1a). The depositional environment in this region was pericontinental marine during the early Ordovician to early Paleozoic periods. Connected to the Yimeng uplift, the Linxing–Shenfu gas field is situated on the Jinxi fault–fold belt, covering an exploration area of about 5802.5 km2. Six formations are developed from bottom to top (Figure 1b), including the Carboniferous Benxi Formation, Permian Taiyuan Formation, Shanxi Formation, lower Shihezi Formation, upper Shihezi Formation, and Shiqianfeng Formation, among which, the lower Shihezi Formation and the upper Shihezi Formation are main pay zones. The Linxing–Shenfu gas field is typically low in pressure, permeability, and reserve abundance, with a complex micro-pore structure, strong heterogeneity, and poor connectivity of effective sand bodies, and the fluid flow mechanism is obviously different from that of conventional middle-high permeability gas reservoirs. The targeted reservoir is deposited in a braided channel setting, with the channel bar being the primary gas-bearing sand. The characteristics of the channel bar suggest that the gas-bearing sands are small in scale and have an isolated distribution. The distribution of tight gas is mainly controlled by sand bodies and their physical properties. The effective sand bodies are lenticular, exhibiting poor continuity, and are distributed across all vertical layers. During the early stages of field development, the number of wells was limited, and well spacing was large, making it challenging to accurately describe the scale of the effective sand body. In recent years, there has been an increase in well pattern density, and well spacing has been reduced.

2.3. Data and Methods

The development of the Linxing–Shenfu gas field commenced in 2015, with the proved gas reserves, including basically proved reserves, totaling 3000 × 108 m3. The single well performance shows low production, rapid pressure decline, and slow, low-pressure recovery. By the end of 2023, in the Linxing–Shenfu gas field, over 1600 wells had been brought into production with a basic well pattern of 600 m × 800 m. The average daily production per well was approximately 0.77 × 10⁴ m3, contributing to an annual gas production of the entire gas field amounting to 34.6 × 10⁸ m3. Well logging and core sample investigation reveal that the average thickness of the sandstone layer is approximately 13.0 m. The variations in reserve abundance range mostly between 0.5 and 2.0 × 10⁸ m3/km2, with an average value of 1.2 × 10⁸ m3/km2. The variations in gas saturation range mostly between 48.0% and 65.0%, with an average value of 55.0%. The variations in initial pressure range mostly between 12.8 and 17.2 MPa, with an average value of 15.0 MPa. Core sample analysis reveals that the variations in porosity mostly range between 8.0% and 16.0%, with an average value of 11.0%. The variations in permeability range mostly between 0.4 and 2.0 mD, with an average value of 1.2 mD.
The average physical property values of the Linxing–Shenfu gas field were used to construct the basic numerical model. When studying economic well pattern density, the approach involves keeping the reserve abundance constant, altering the permeability, conducting numerical simulations to obtain the average single well EUR at different well pattern densities, and calculating the production interference ratio. Subsequently, the economic well pattern density under various permeabilities is determined by comparing and evaluating standards. Following that, while keeping the permeability constant, the reserve abundance is adjusted, and the steps mentioned above are repeated to determine the economic well pattern density under different reserve abundances. The steps for studying infilling time are identical to those for studying economic well pattern density.

2.4. Numerical Model

In this paper, the concept model of the tight gas reservoir in the Linxing–Shenfu gas field is established using Rubis in the KAPPA workstation software (V5.30). This software is a robust commercial numerical simulation tool that automatically constructs an unstructured Voronoi grid, providing finer grid cells in proximity to the wells. The geological parameters presented in Table 1 are the average values of the Linxing–Shenfu gas field.
Effective gas and water permeability reflect the expected fluid flow through the production process from hydrocarbon reservoirs. The increase in values of gas permeability means the reduction in water permeability to flow out from the reservoir (accordingly, the extracted fluid during production will be gas) and vice versa [24]. An accurate understanding of pore pressure distribution is crucial for casing design, mud optimization, and safe and successful drilling [25]. Due to the low permeability and strong heterogeneity of tight gas layers, their pressure conductivity is weaker compared with conventional gas layers [26]. Moreover, logging permeability may inadequately represent the effective permeability of sand bodies [27]. In the Linxing–Shenfu gas field, the logging permeability distribution for most gas layers falls within the range of 0.40–2.00 mD. Characteristic points within this range are selected to represent low, medium, and high permeability gas layers. The effective permeability for the model is determined by the permeability corresponding to the characteristic point obtained from well test interpretation. The corresponding relationship is outlined in Table 2.
The models with various well pattern densities are depicted in Figure 2.

3. Analysis of Numerical Simulation

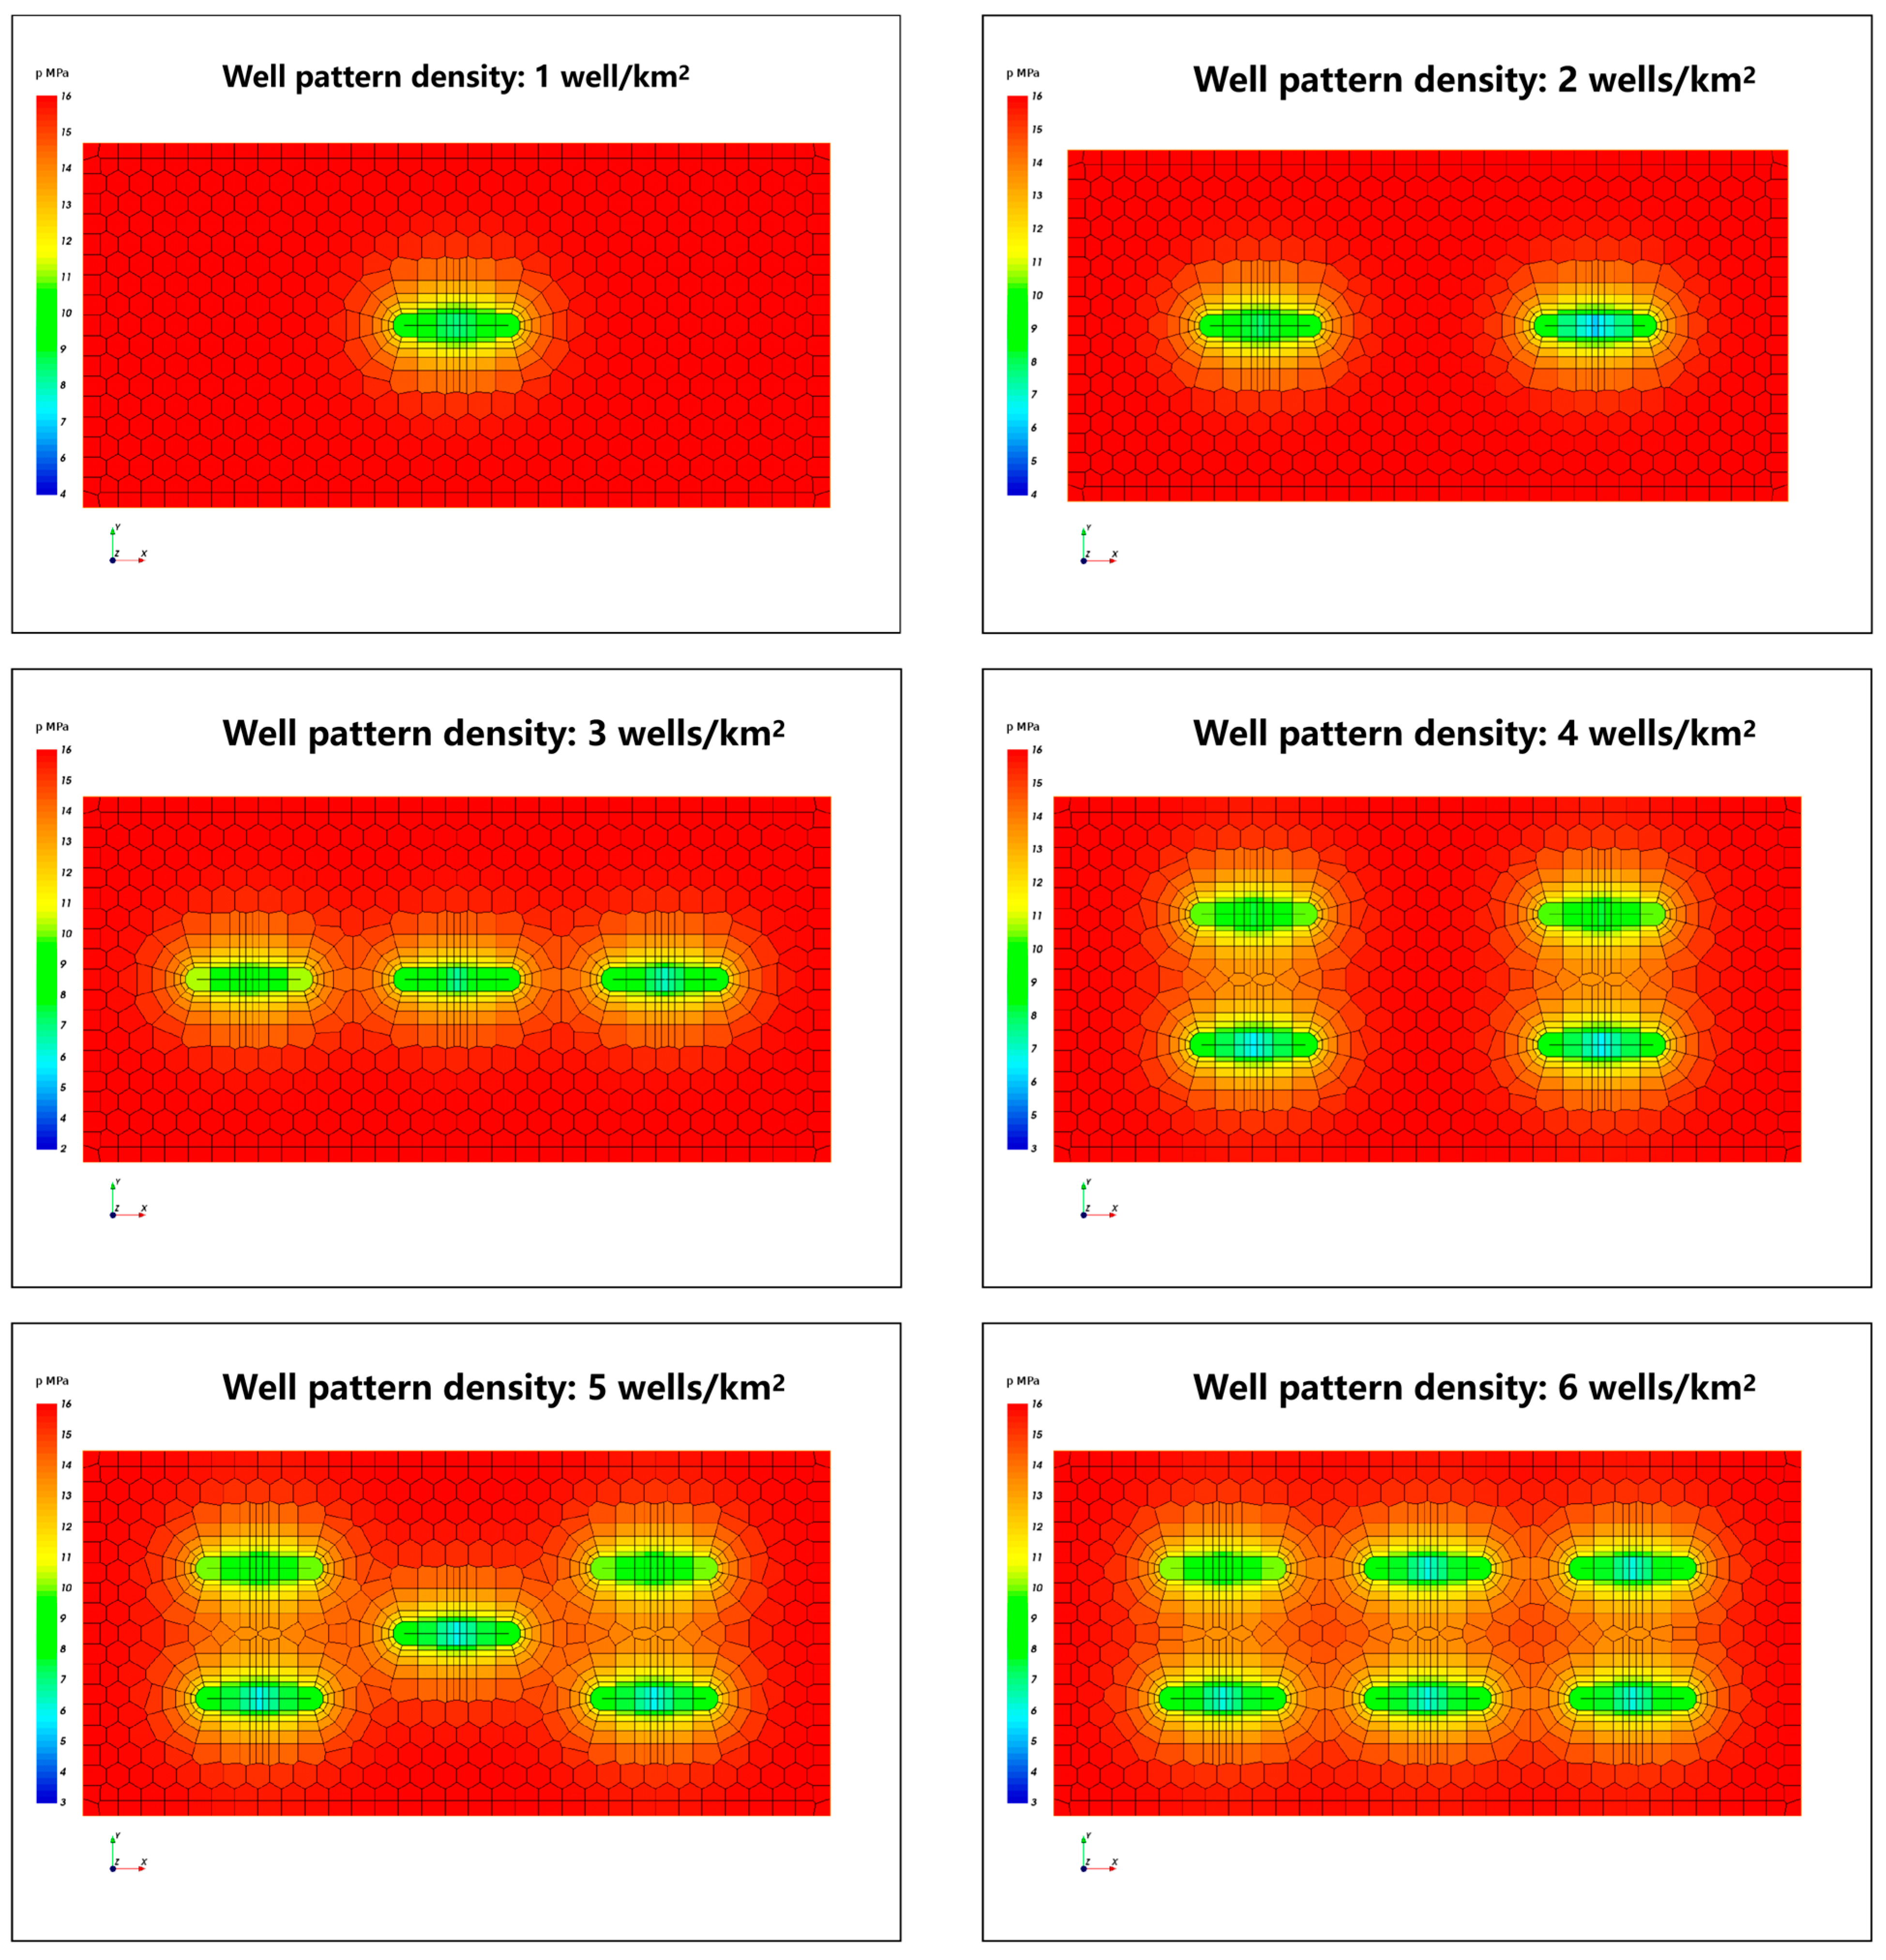
3.1. Simulation Results of Economic Well Pattern Density

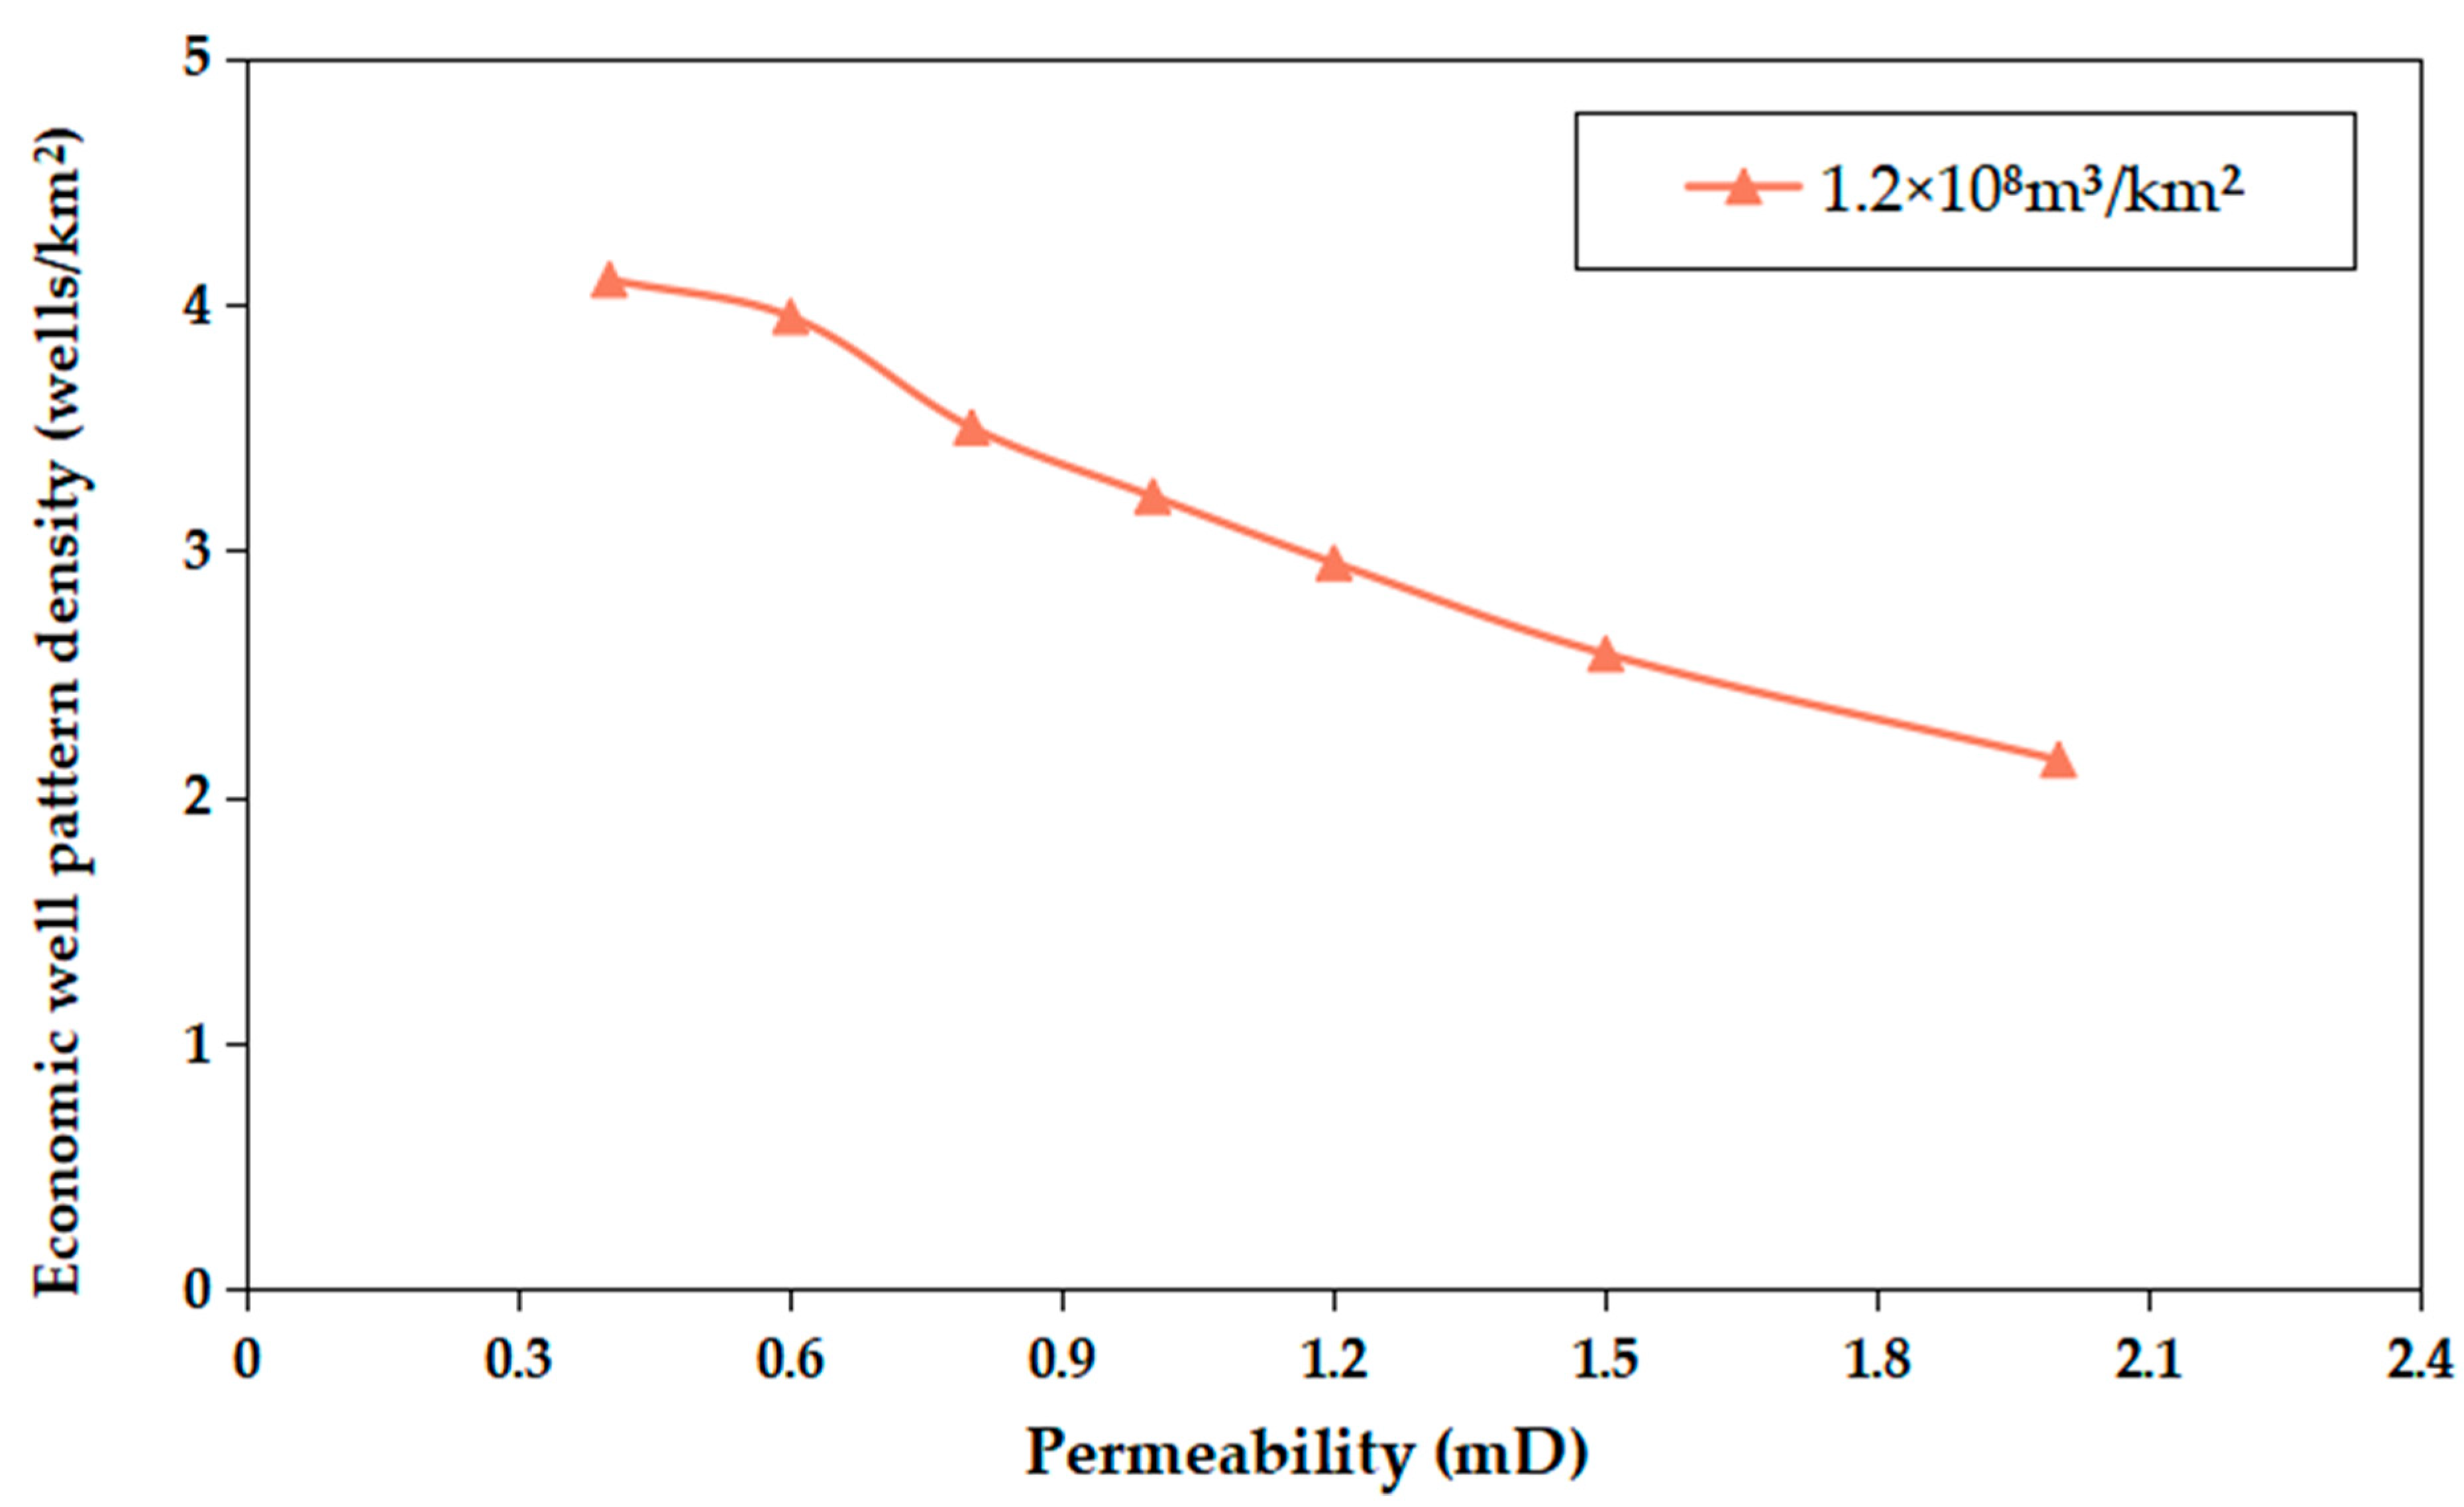
3.1.1. Sensitivity Analysis of Permeability and Economic Well Pattern Density

Based on the permeability variations outlined in Table 2, an analysis is carried out by calibrating the numerical model using a reserve abundance of 1.2 × 10⁸ m3/km2. Next, simulations are conducted to determine cumulative production under various permeability conditions and the fluctuations in the average single well EUR and the production interference ratio are subsequently calculated. These calculations are performed in conjunction with an increase in well pattern density, as illustrated in Figure 3.
It can be seen from Figure 3a that at low well pattern density, permeability significantly influences the average single well EUR. However, this influence diminishes as the well pattern density increases, indicating that the reserve control degree of sand bodies in low permeability gas layers approaches that in high permeability gas layers. As shown in Figure 3b, the production interference ratio experiences an increase with the escalation of well pattern density, albeit at a diminishing rate. Eventually, the ratio tends to be stable, indicating that further increases in well pattern density result in a more modest impact on production interference. The decreased rate of the average well EUR is the same as the increased rate of the production interference ratio, indicating that the decline in the average well EUR is mainly due to inter-well interference. By combining Figure 3 and considering the standards for the average single well EUR and the production interference ratio, the relationships between permeability, reserve abundance, and economic well pattern density are illustrated in Figure 4.
In Figure 4, it is evident that the economic well pattern density decreases with the increase in permeability. When the average reserve abundance of the sand body in the Linxing–Shenfu gas field is 1.2 × 10⁸ m3/km2, the economic well pattern density corresponding to different permeability ranges from 2.2 to 4.1 wells/km2.

3.1.2. Sensitivity Analysis of Reserve Abundance and Economic Well Pattern Density

The variations in reserve abundance in the Linxing–Shenfu gas field are mostly 0.5–2.0 × 10⁸ m3/km2, and characteristic points of 0.5, 0.7, 0.9, 1.2, 1.6, and 2.0 × 10⁸ m3/km2 are chosen for the numerical model. Repeating the above steps, the relationships between reserve abundance, permeability, and well pattern density are illustrated in Figure 5.
It can be seen from Figure 5 that, with low reserve abundance, the economic well pattern density initially rises and then declines as permeability increases. Differently, when the reserve abundance is high, the economic well pattern density consistently decreases with an increase in permeability. Generally, the larger the reserve abundance of the sand body, the more likely it is to cause production interference, and the earlier the inflection point appears. By determining both the reserve abundance and the permeability of the sand body, one can efficiently determine the economic well pattern density by using the curves shown in Figure 5.

3.2. Simulation Results of Infilling Time

With the present 600 m × 800 m main development well pattern in the Linxing–Shenfu gas field, the development area covered by each well is 0.48 km2, and the basic well pattern density is 2 wells/km2. To conduct the infilling time simulation, we selected the numerical model corresponding to a well pattern density of 3 wells/km2 from Figure 2 and defined the middle well as the infilled well, while the remaining two wells served as the basic wells. When the infilled well is put into production after 1, 2, 3, 5, 10, and 15 years of the basic well’s production, the recovery degree of the sand body at the time of the infilled well initiation is defined as the adjustment time.

3.2.1. Sensitivity Analysis of Permeability and Infilling Time

Maintaining a constant reserve abundance in the numerical model, the permeability varies from 0.4 to 2.0 mD according to Table 2. We conducted simulations to estimate the cumulative production under each permeability condition and concurrently calculated the production increment of the infilled well in tandem with the increasing adjusting time. The results are presented in Figure 6.
As can be seen, the later the infilling starts, the fewer the remaining reserves, the lower the production increment of the infilled well is and the production increment of the infilled well decreases with the increase in permeability. In the range of permeability between 1.5–2.0 mD, the production increment of the infilled well experiences a rapid decline, indicating that the basic well pattern controls the sand body completely, and making it challenging for the infilled well to yield benefits. Essentially, the economic well pattern density under the given reserve abundance and permeability of the sand body appears to be less than 3 wells/km², thus corroborating the earlier conclusion. Based on the preceding analysis and taking into account the economic constraints on the production increment of the infilled well, a comprehensive diagram is presented in Figure 7 to illustrate the relationships between permeability, reserve abundance, and infilling time.
Figure 7 reveals a distinctive trend where the infilling time initially increases and subsequently decreases with the rise in permeability. In instances of low permeability, the lower gas production rate permits a later infilling time. Conversely, with an increase in permeability, the elevated gas production rate facilitates easier control of the sand body by the basic well pattern, resulting in a decrease in infilling time.

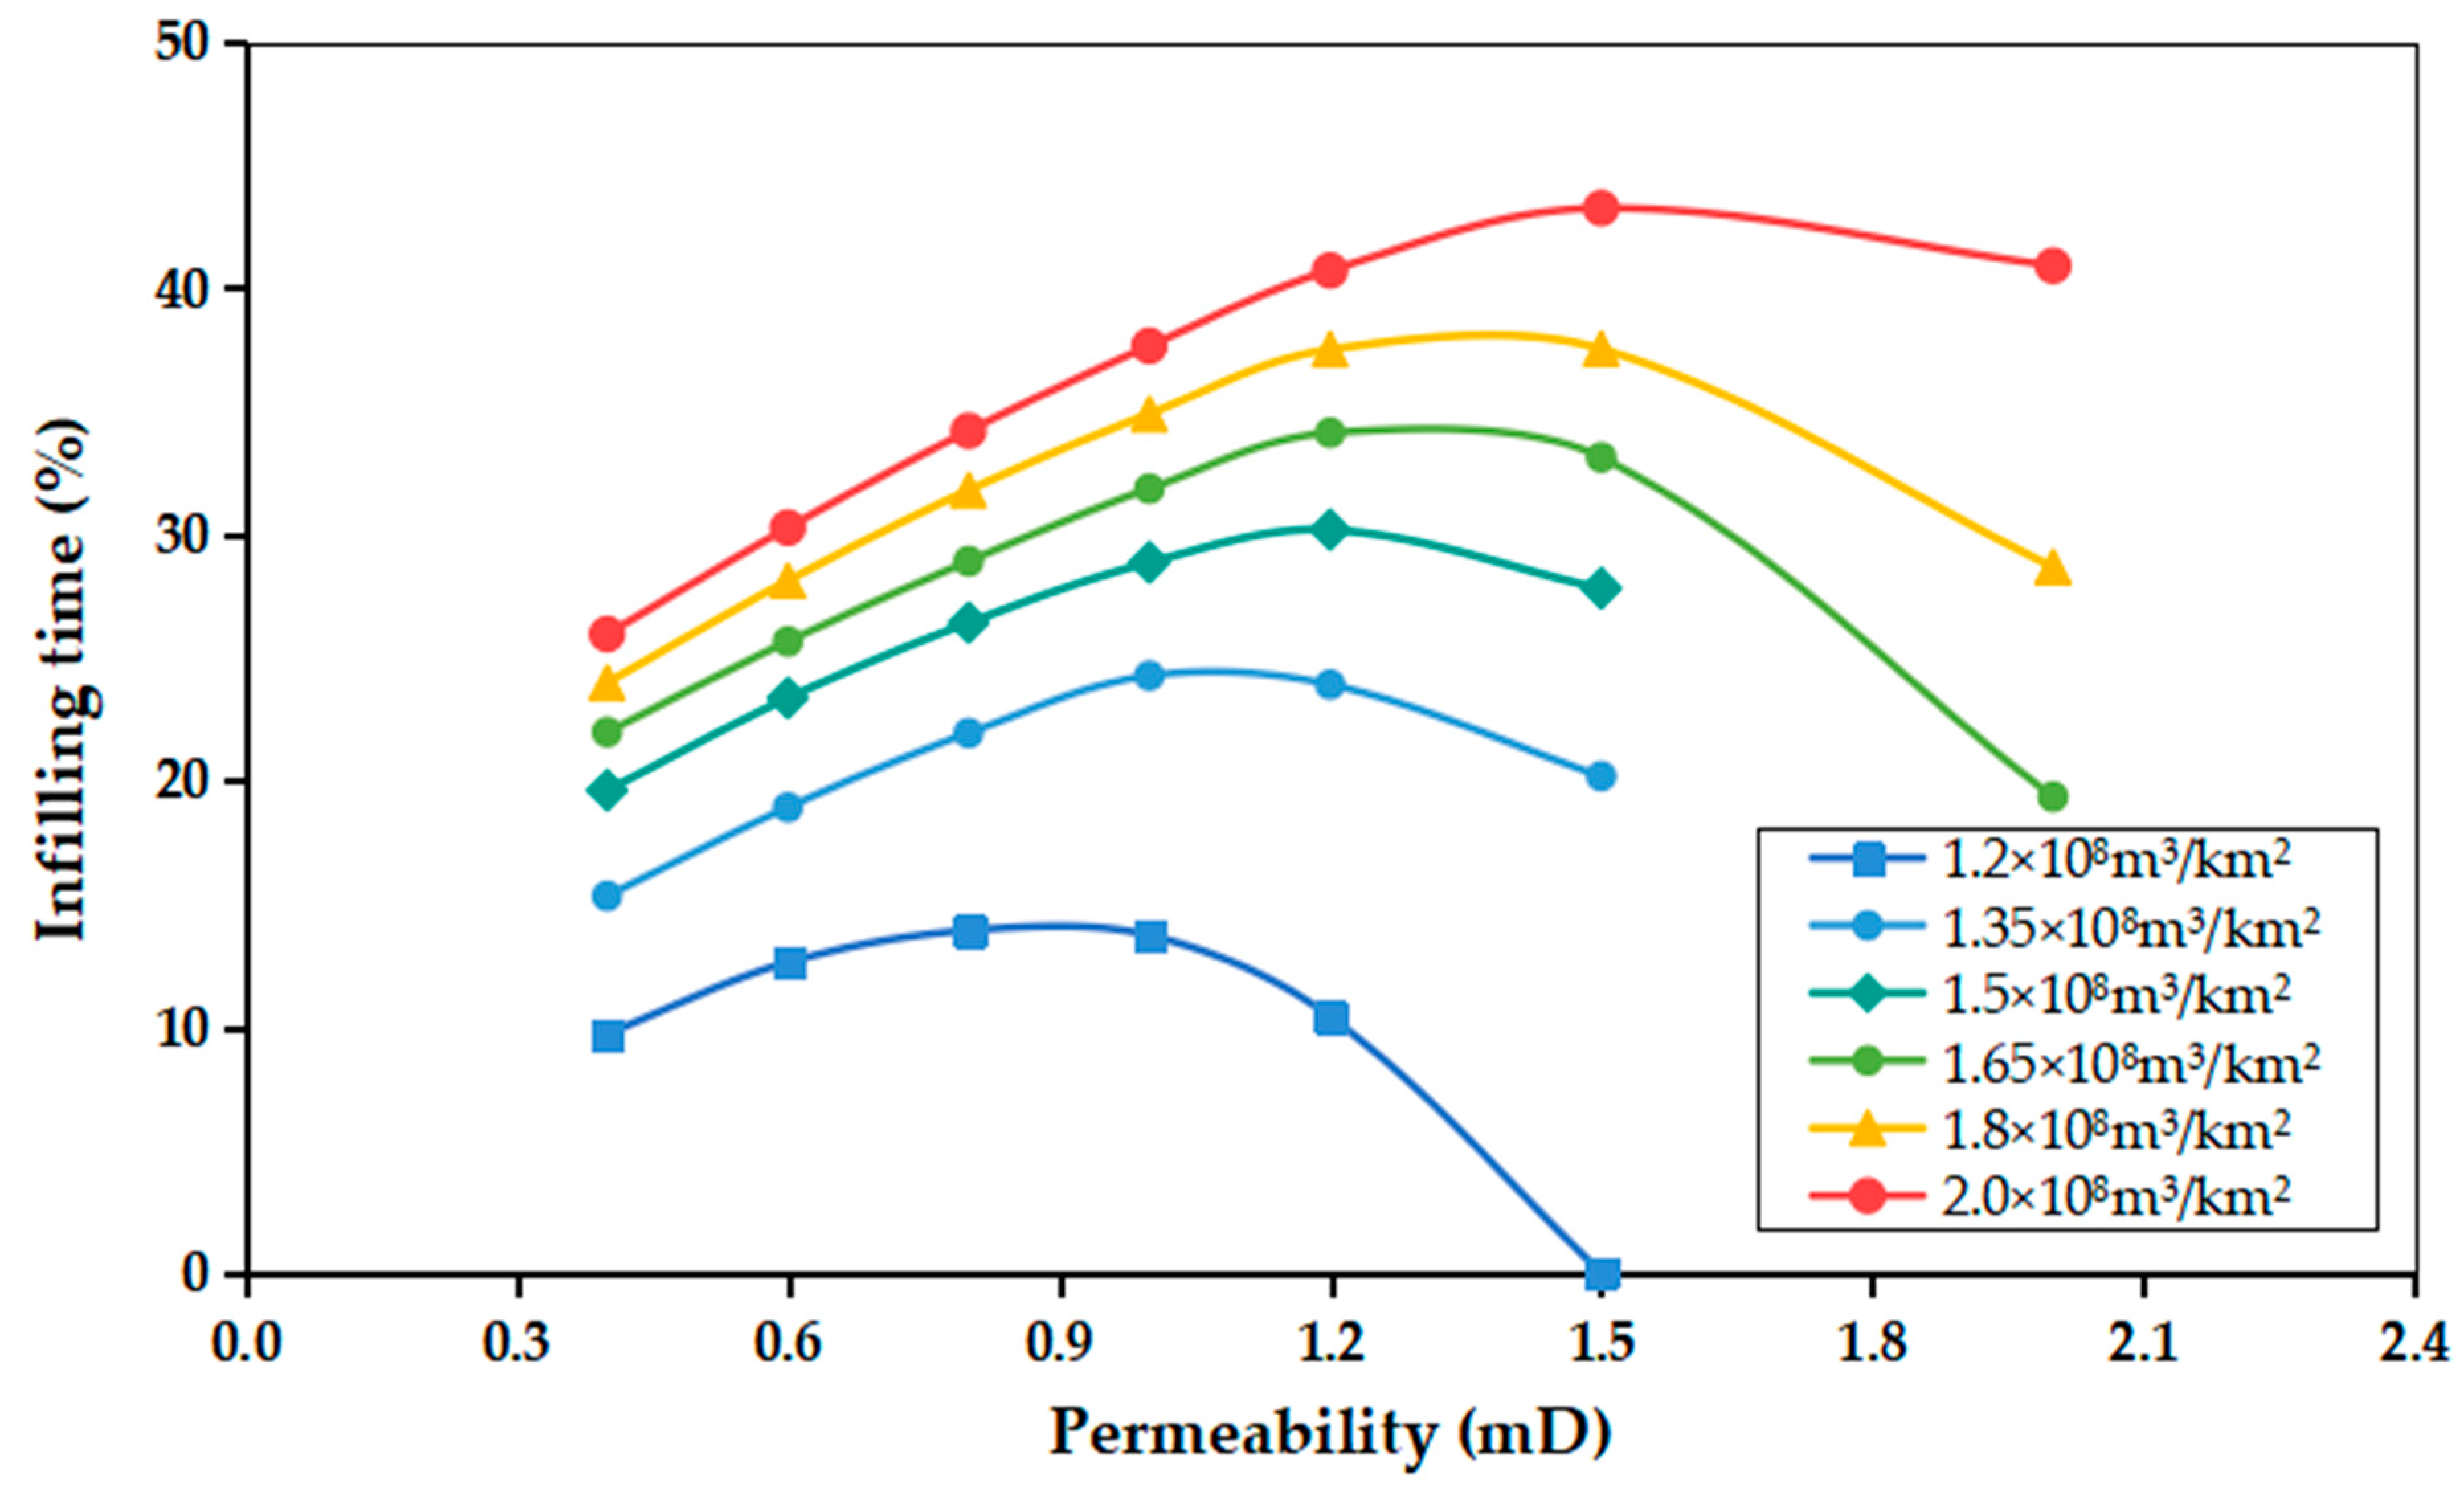
3.2.2. Sensitivity Analysis of Reserve Abundance and Infilling Time

As shown in Figure 5, when the reserve abundance is below 1.2 × 10⁸ m3/km2, the economic well pattern density in the Linxing–Shenfu gas field is less than 3 wells/km2, indicating that the infilling time of the wells is inaccurate. Consequently, characteristic points at reserve abundances of 1.2, 1.35, 1.5, 1.65, 1.8, and 2.0 × 10⁸ m3/km2 are selected for the numerical model. By repeating the above steps, relationships between reserve abundance, permeability, and infilling time are determined, as illustrated in Figure 8.
It can be seen from Figure 8 that the larger the reserve abundance, the greater the final cumulative output, and thus the infilling time is postponed further. When the reserve abundance is below 1.5 × 10⁸ m3/km2 and the permeability exceeds 1.5 mD, infilling a well is not recommended because the basic well pattern can meet the requirement of enhancing gas recovery. When the reserve abundance and permeability of the sand body are given, the infilling time can be promptly determined by referencing the curves depicted in Figure 8.
The curves in Figure 5 and Figure 8 are plotted by numerical simulations and sensitivity analysis, and based on this, a new method of determining economic well pattern density and infilling time suitable for tight gas reservoirs in the Linxing–Shenfu gas field is established.

4. Example and Application

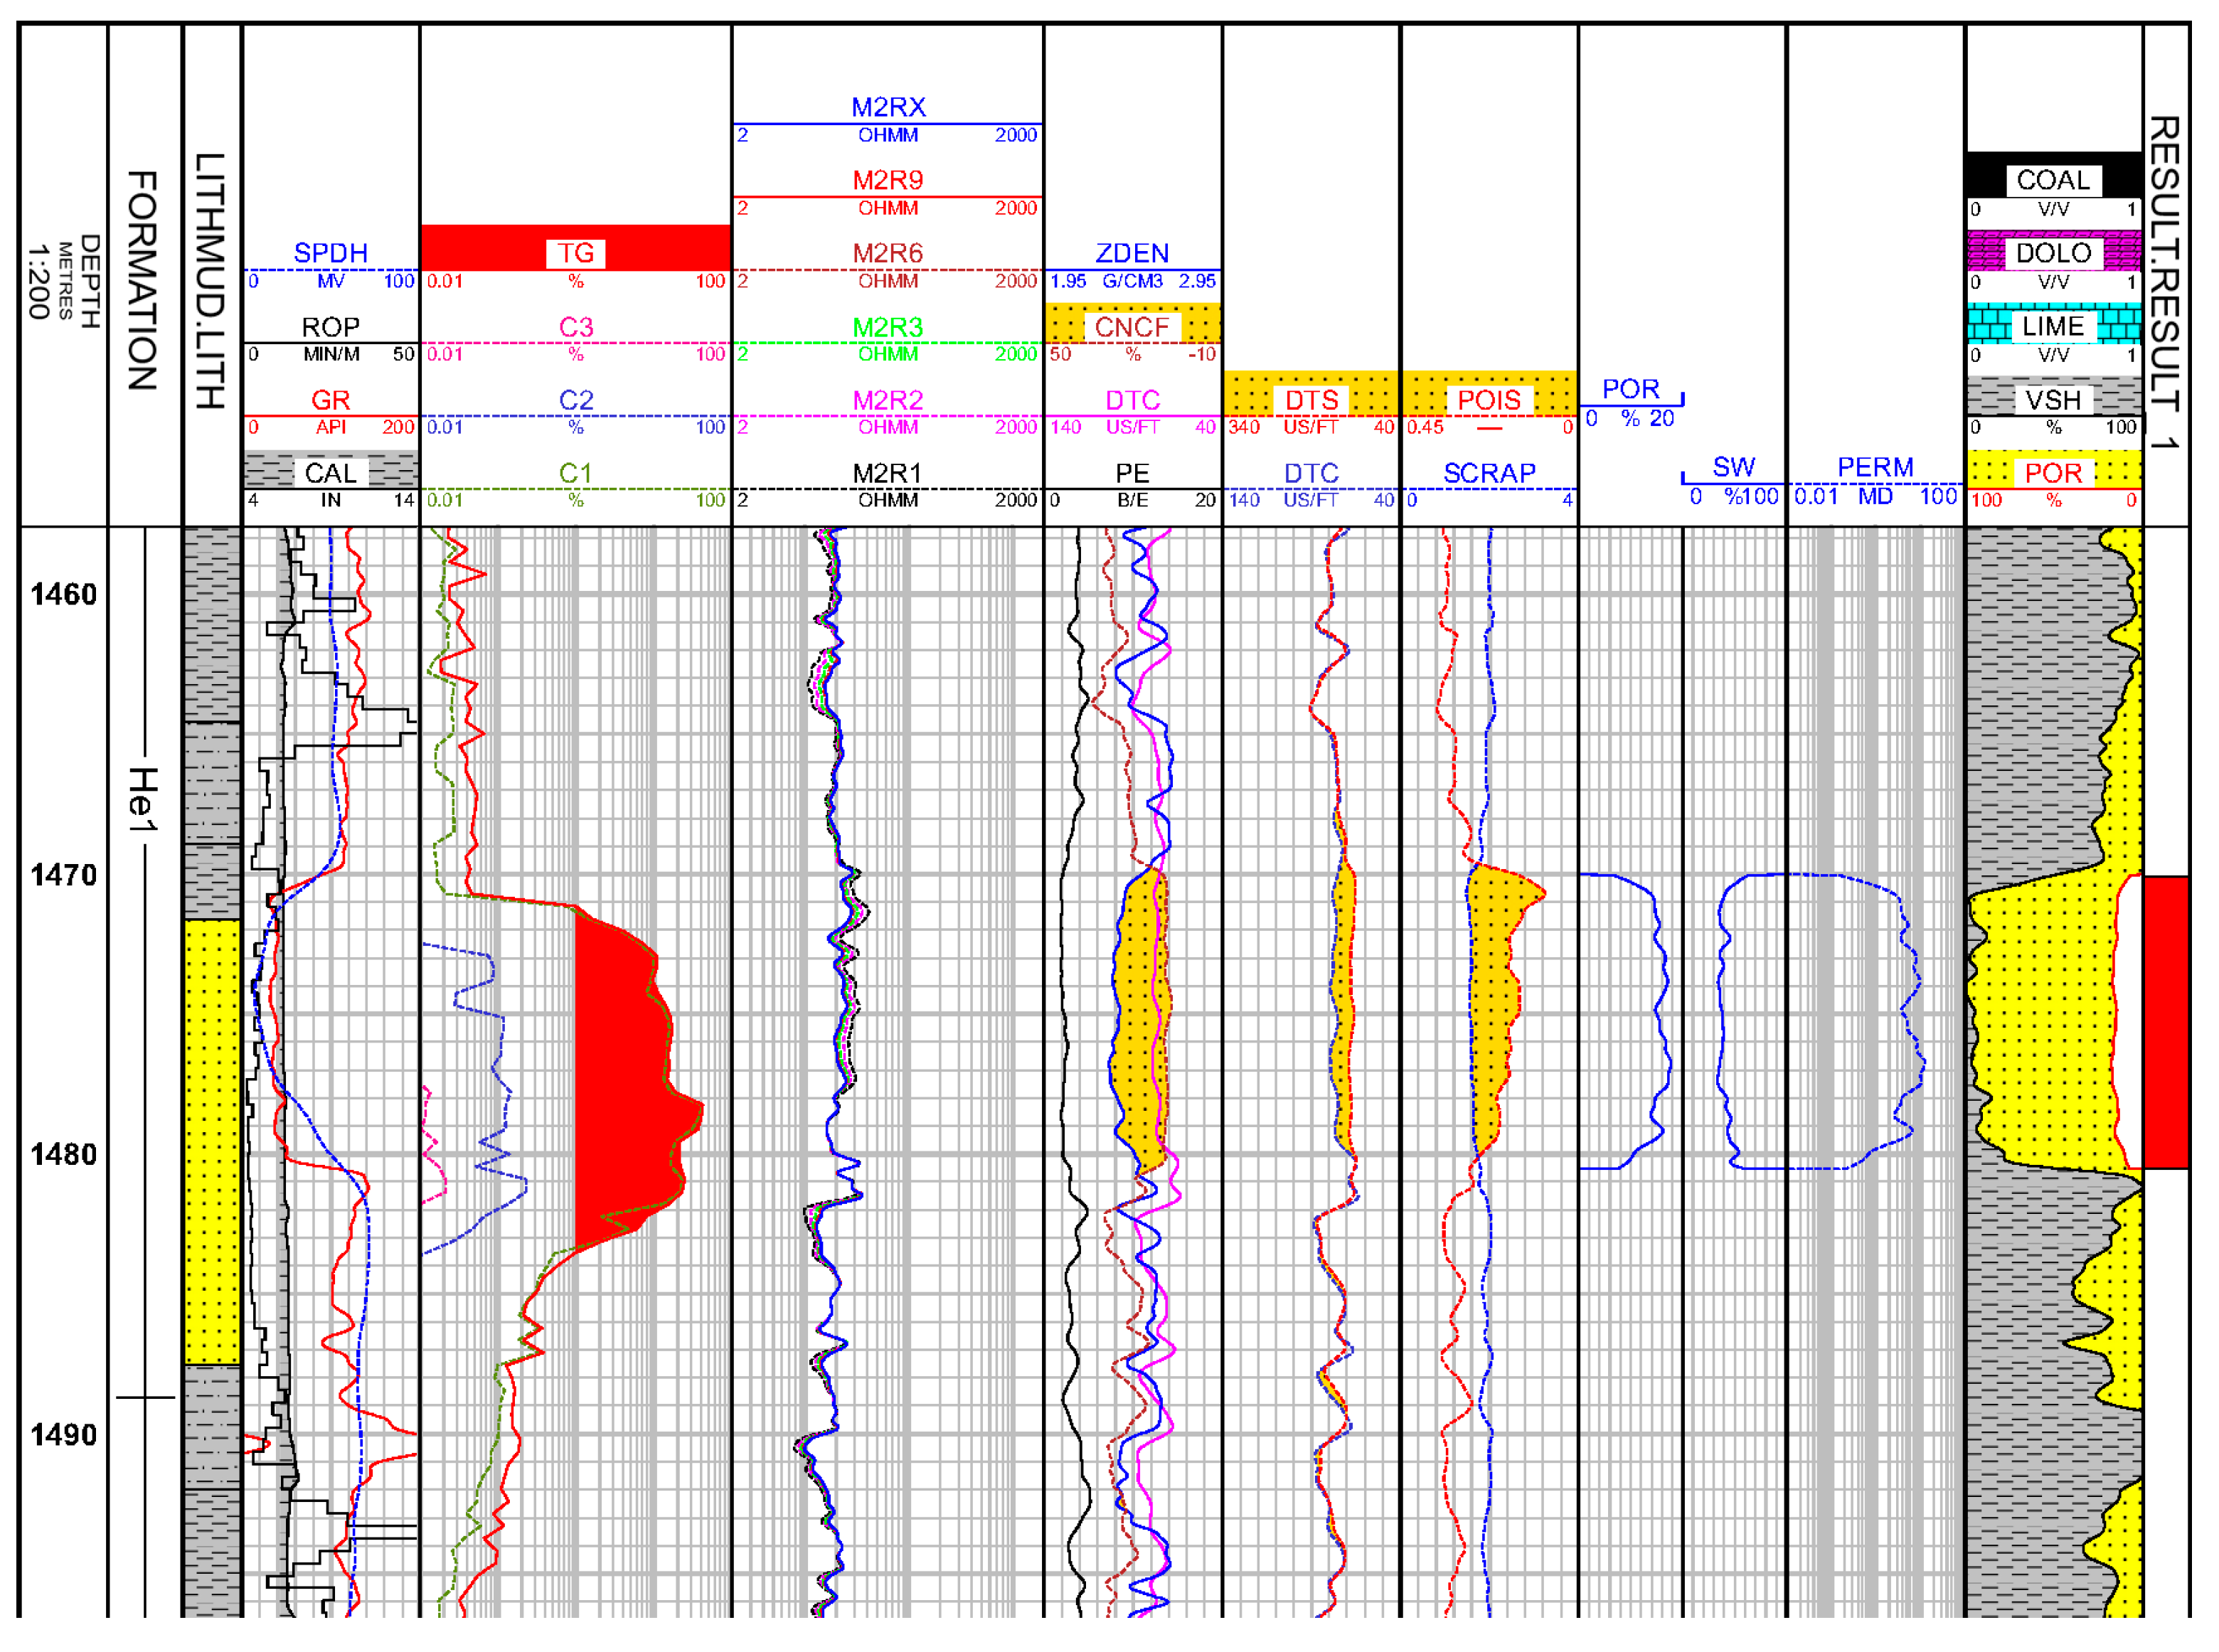
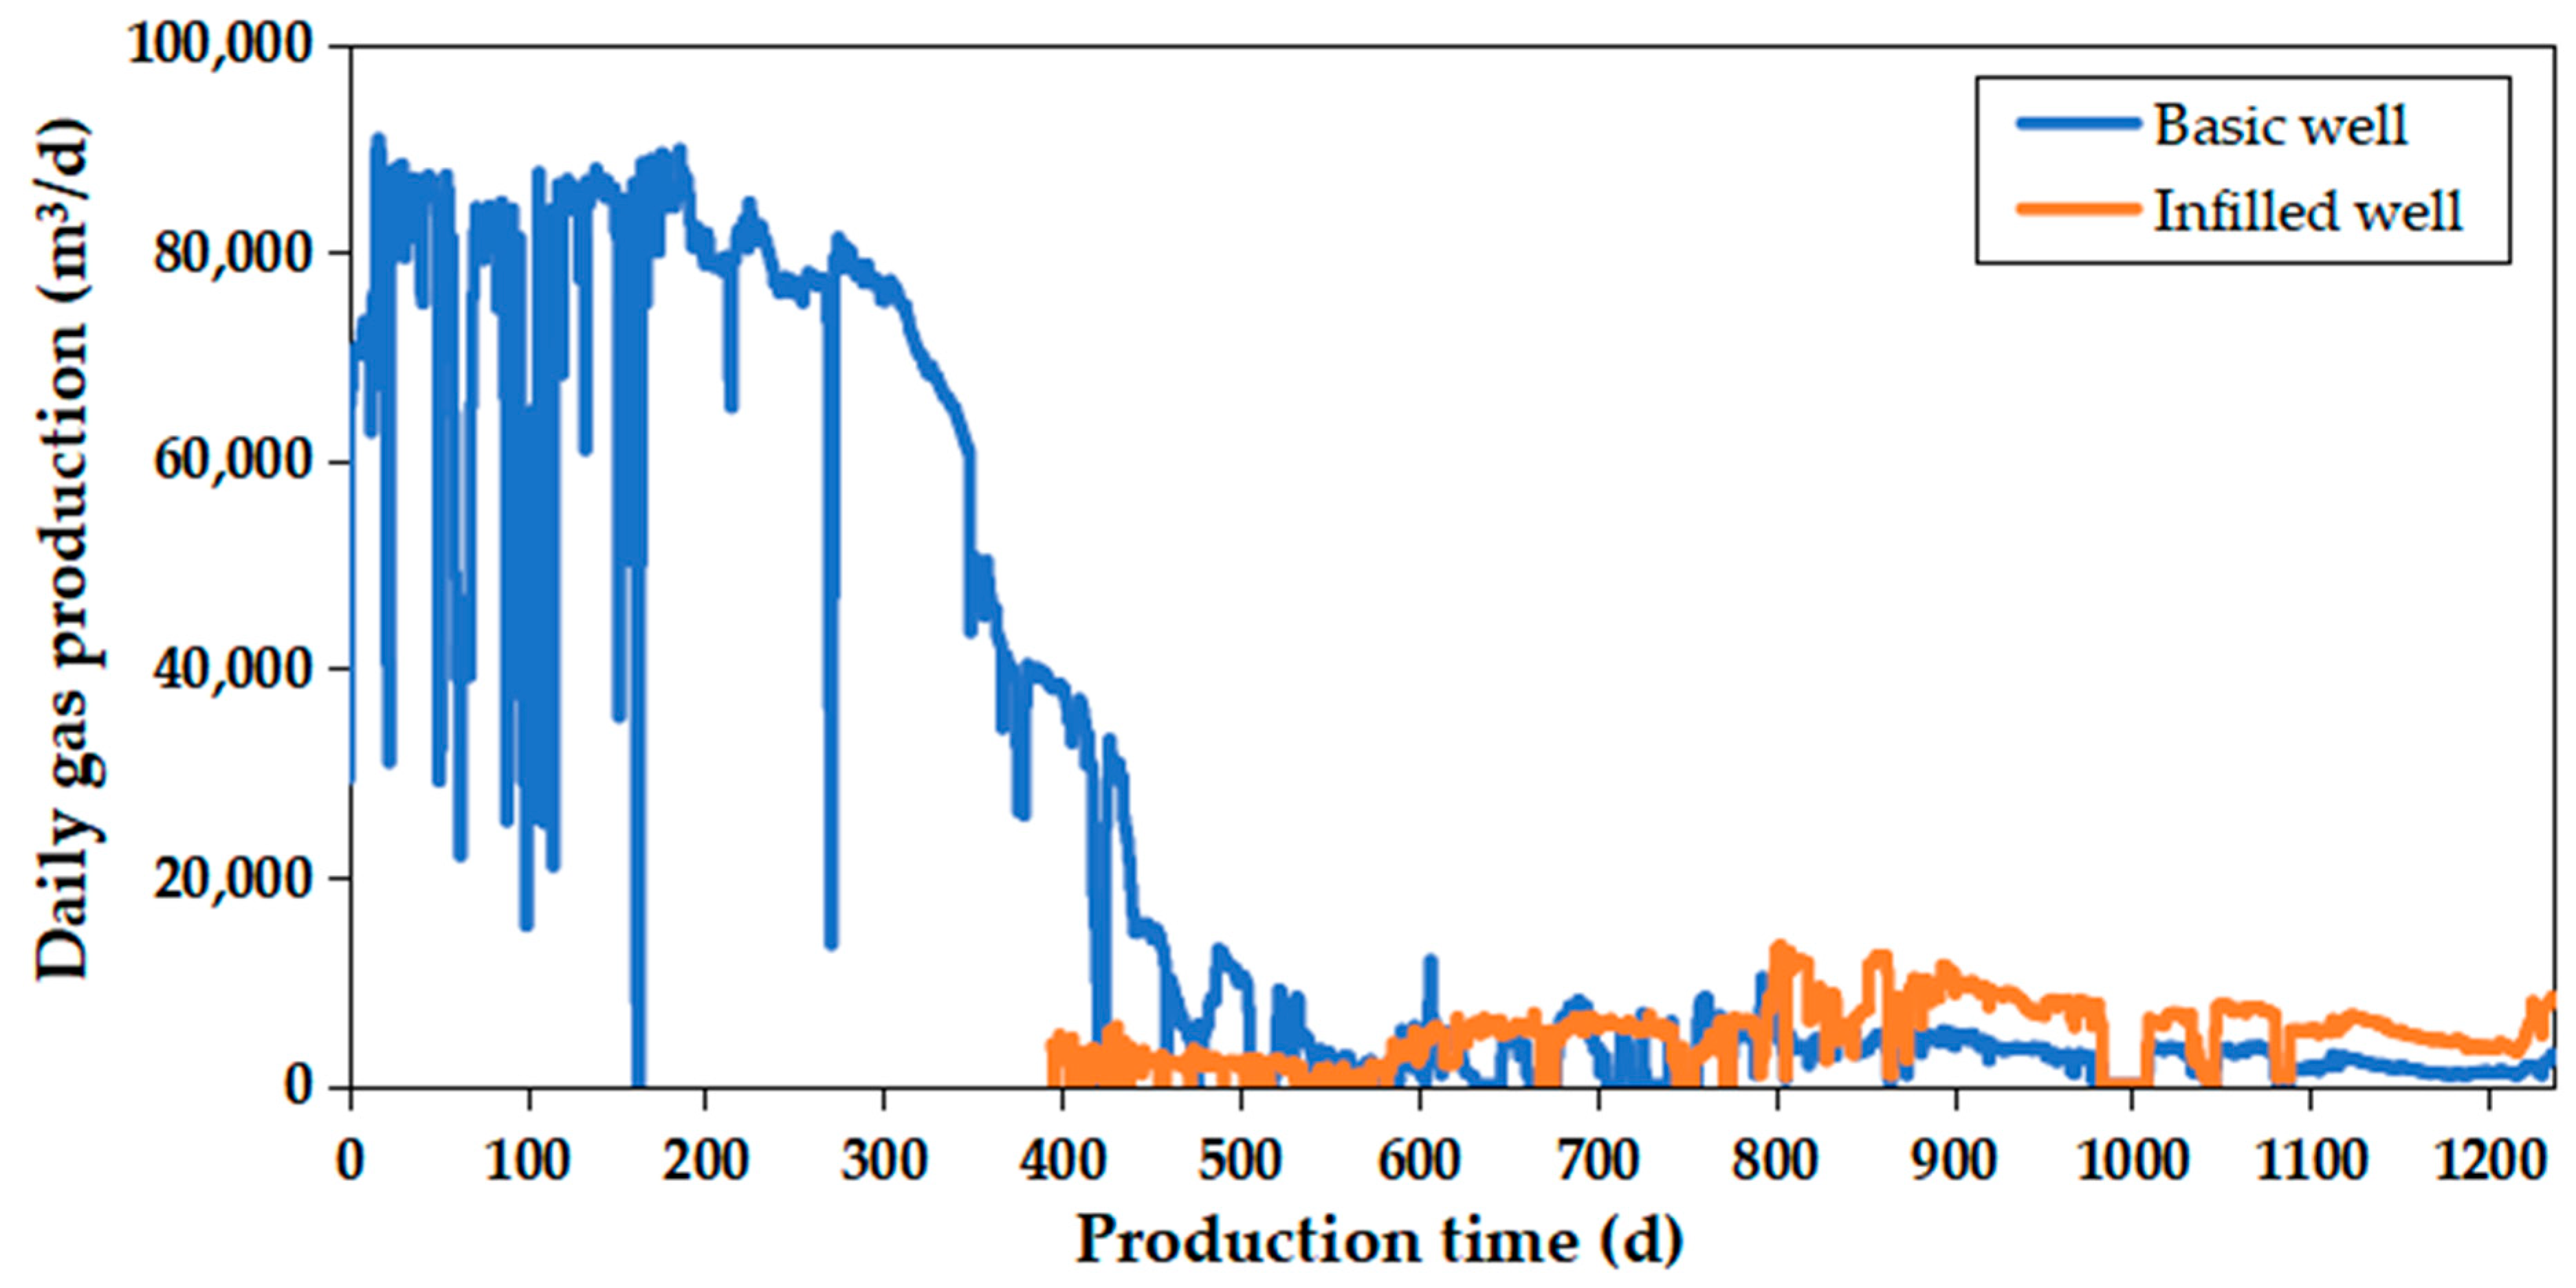
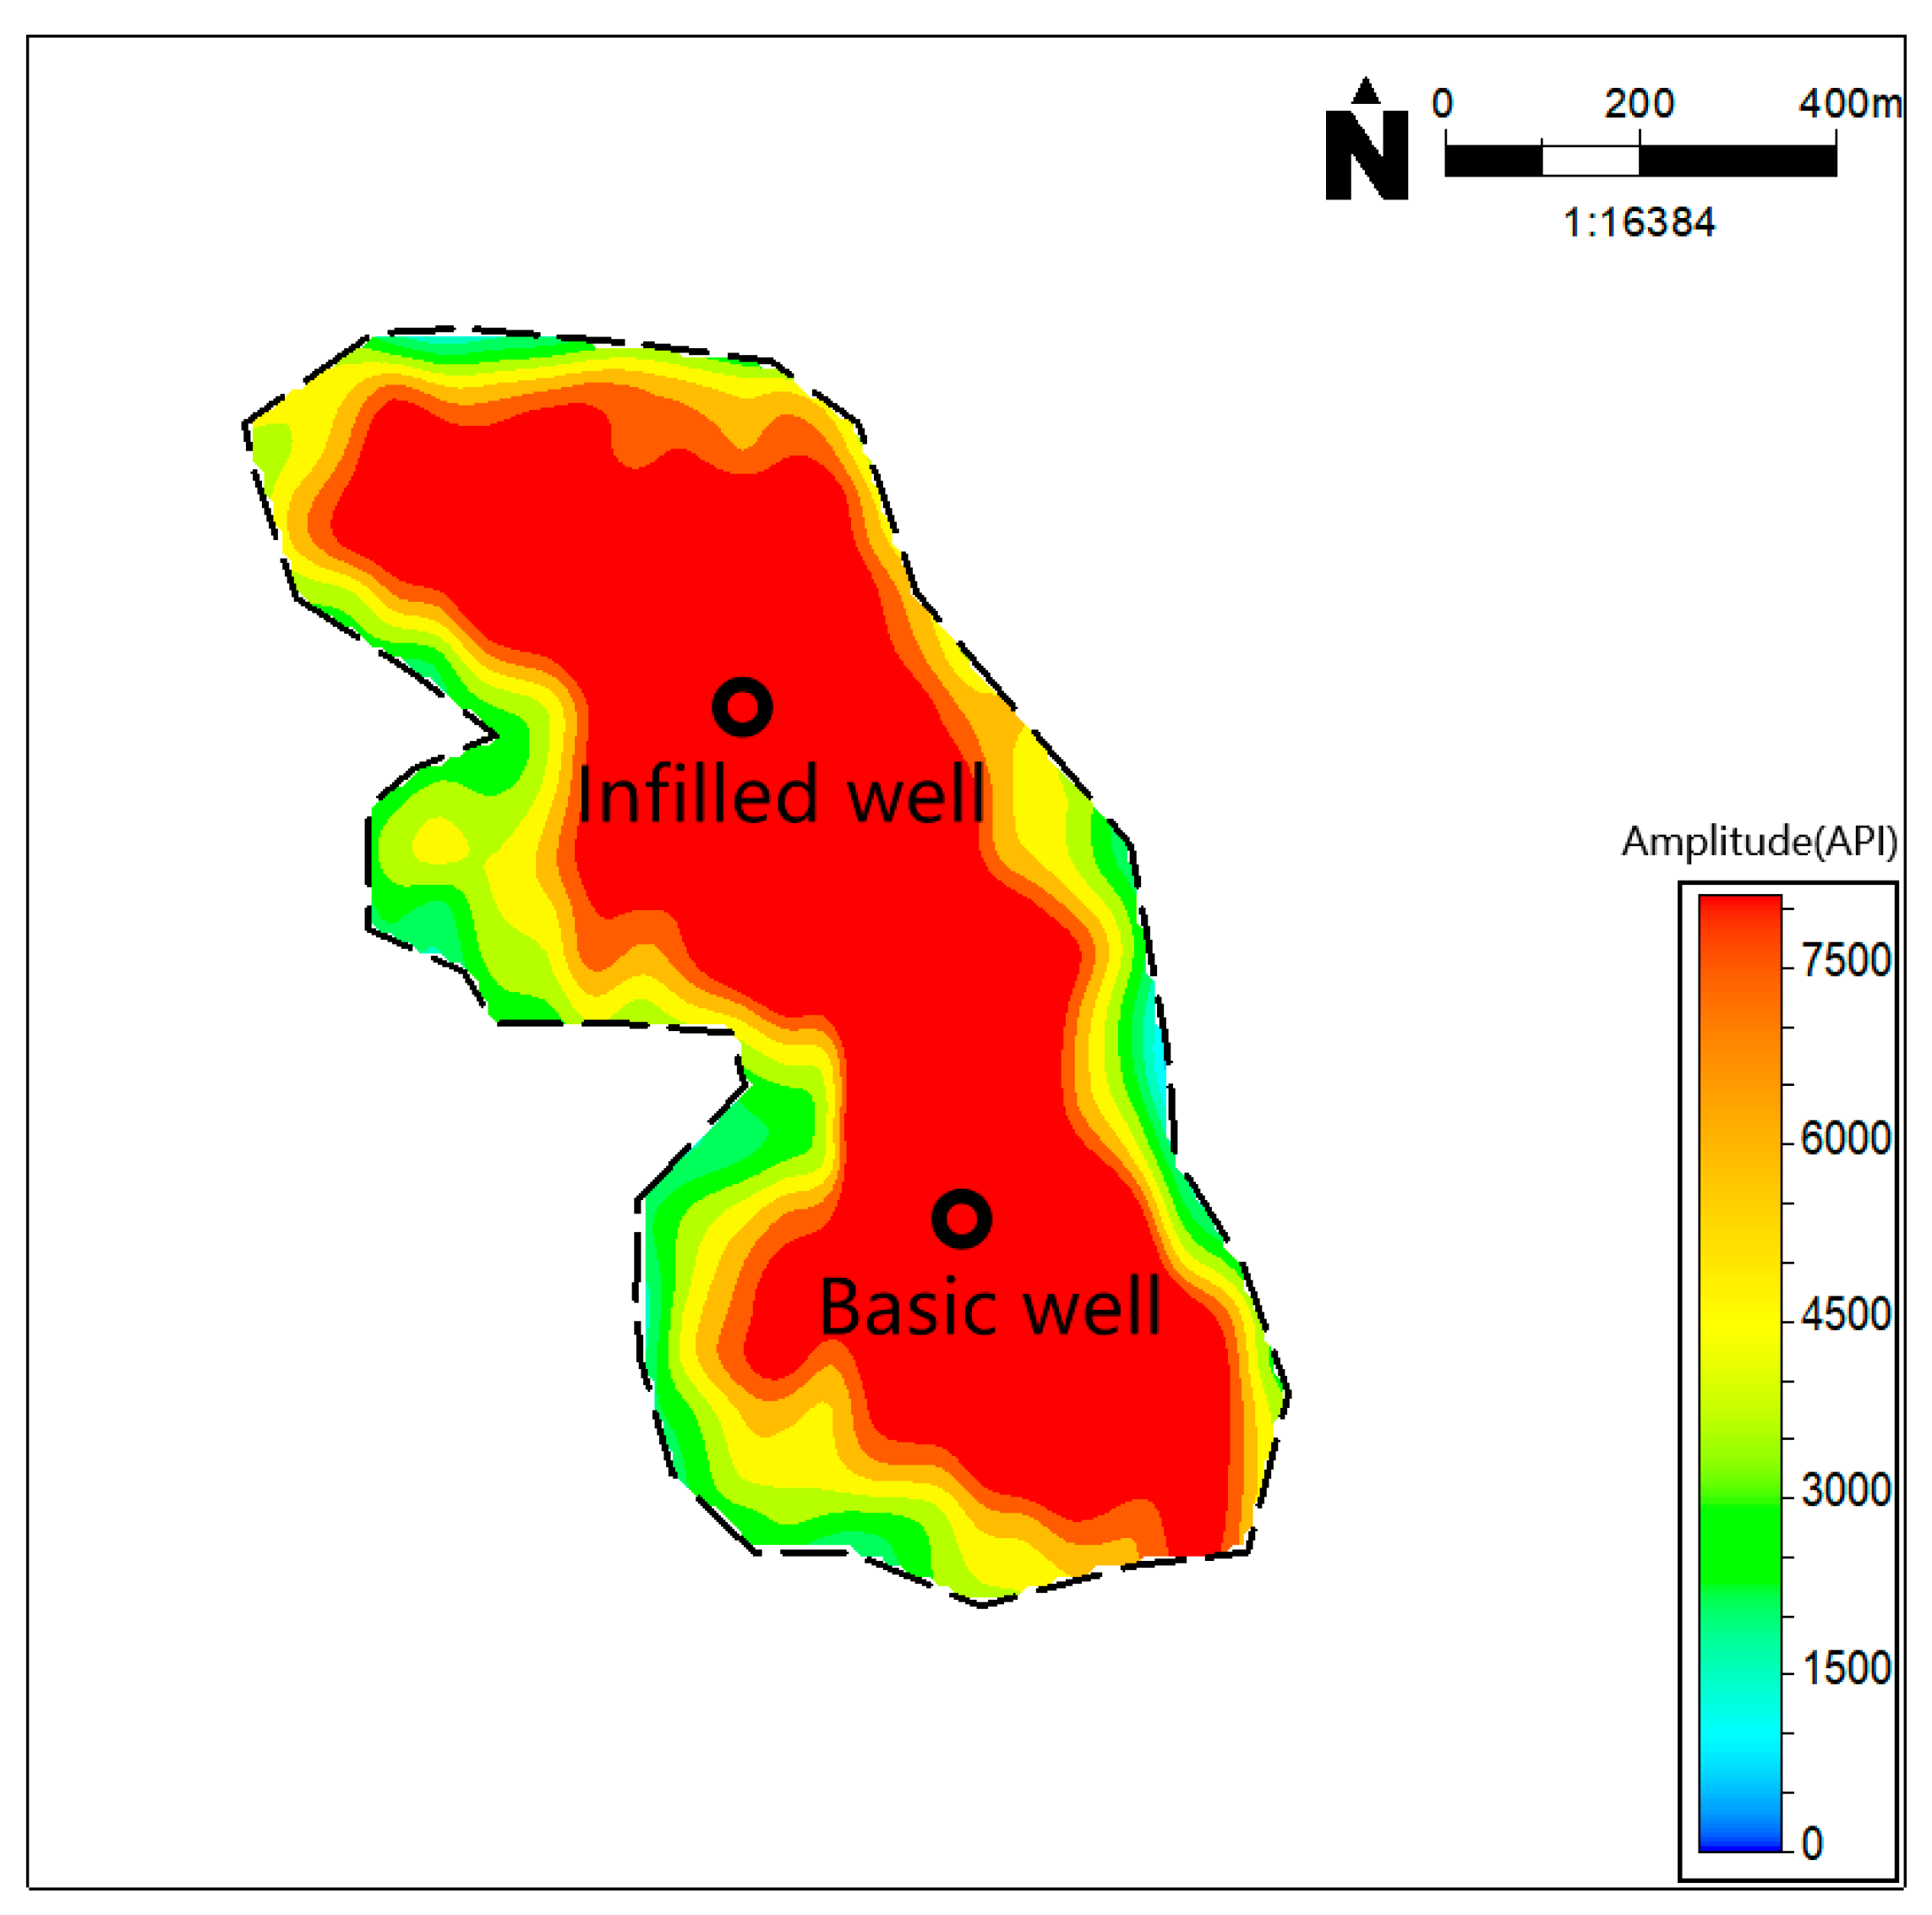
4.1. Analysis of Economic Well Pattern Density and Infilling Time—Taking the X-62 Well Site as an Example

In this section, a real well site, X-62, in the Linxing–Shenfu gas field in the Ordos Basin is selected as an example, and the infilling of the well site occurs after one year of production in the basic well pattern. For reference, please see Figure 9 for the logging curves of this well. As obtained from the well logging interpretation, Table 3 displays the lithologies and the geological parameters of each layer. The well site produces the first zone of the Shihezi Formation (H1) but has a problem of low production after infilling. The daily gas production of the infilled well and the basic well are shown in Figure 10.
As indicated in the above well logging curve in Figure 9 and data in Table 3, the formation under consideration is composed of mudstone and sandstone. This formation can be broadly divided into two sections: the upper and lower portions, separated by a gas layer in the middle. The upper section comprises mudstone with a thickness of 17.0 m, while the lower section also includes mudstone with a total thickness of 17.9 m. Between these two sections, there exists a gas layer with a thickness of 10.4 m, a gas saturation of 63.6%, a porosity of 15.7%, and a permeability of 2.00 mD.
As shown in Figure 10, the average daily gas production from the infilled well is a mere 5000 m³/d, which is significantly lower than that of the basic well. Simultaneously, there is a rapid decline in the production rate of the basic well following the fracturing of the infilled well. These observations strongly indicate the presence of severe well interference between the basic well and the infilled well. We constructed the geological model and completed the fine description of the distribution range of the single sand body according to field parameters (Figure 11). Then, we analyzed the reasons for well interference from the perspective of economic well pattern density and infilling time. The sand body properties and gas well production data are shown in Table 4.
Utilizing the reserve abundance and permeability data provided in Table 4, the economic well pattern density, as determined from Figure 5, yields a value of 2.2 wells/km2, which is slightly higher than the basic well pattern density. If a new well is infilled, the well pattern density of the sand body will rise to 3.1 wells/km2, which is much higher than the economic well pattern density, indicating that the basic well pattern density is economical and suitable. Considering the infilling time analysis depicted in Figure 8, the introduction of an infilled well is also discouraged. The collective findings from the analysis indicate that incorrect well pattern density and an inappropriate infilling time have resulted in significant well interference, ultimately leading to a poor production increment.

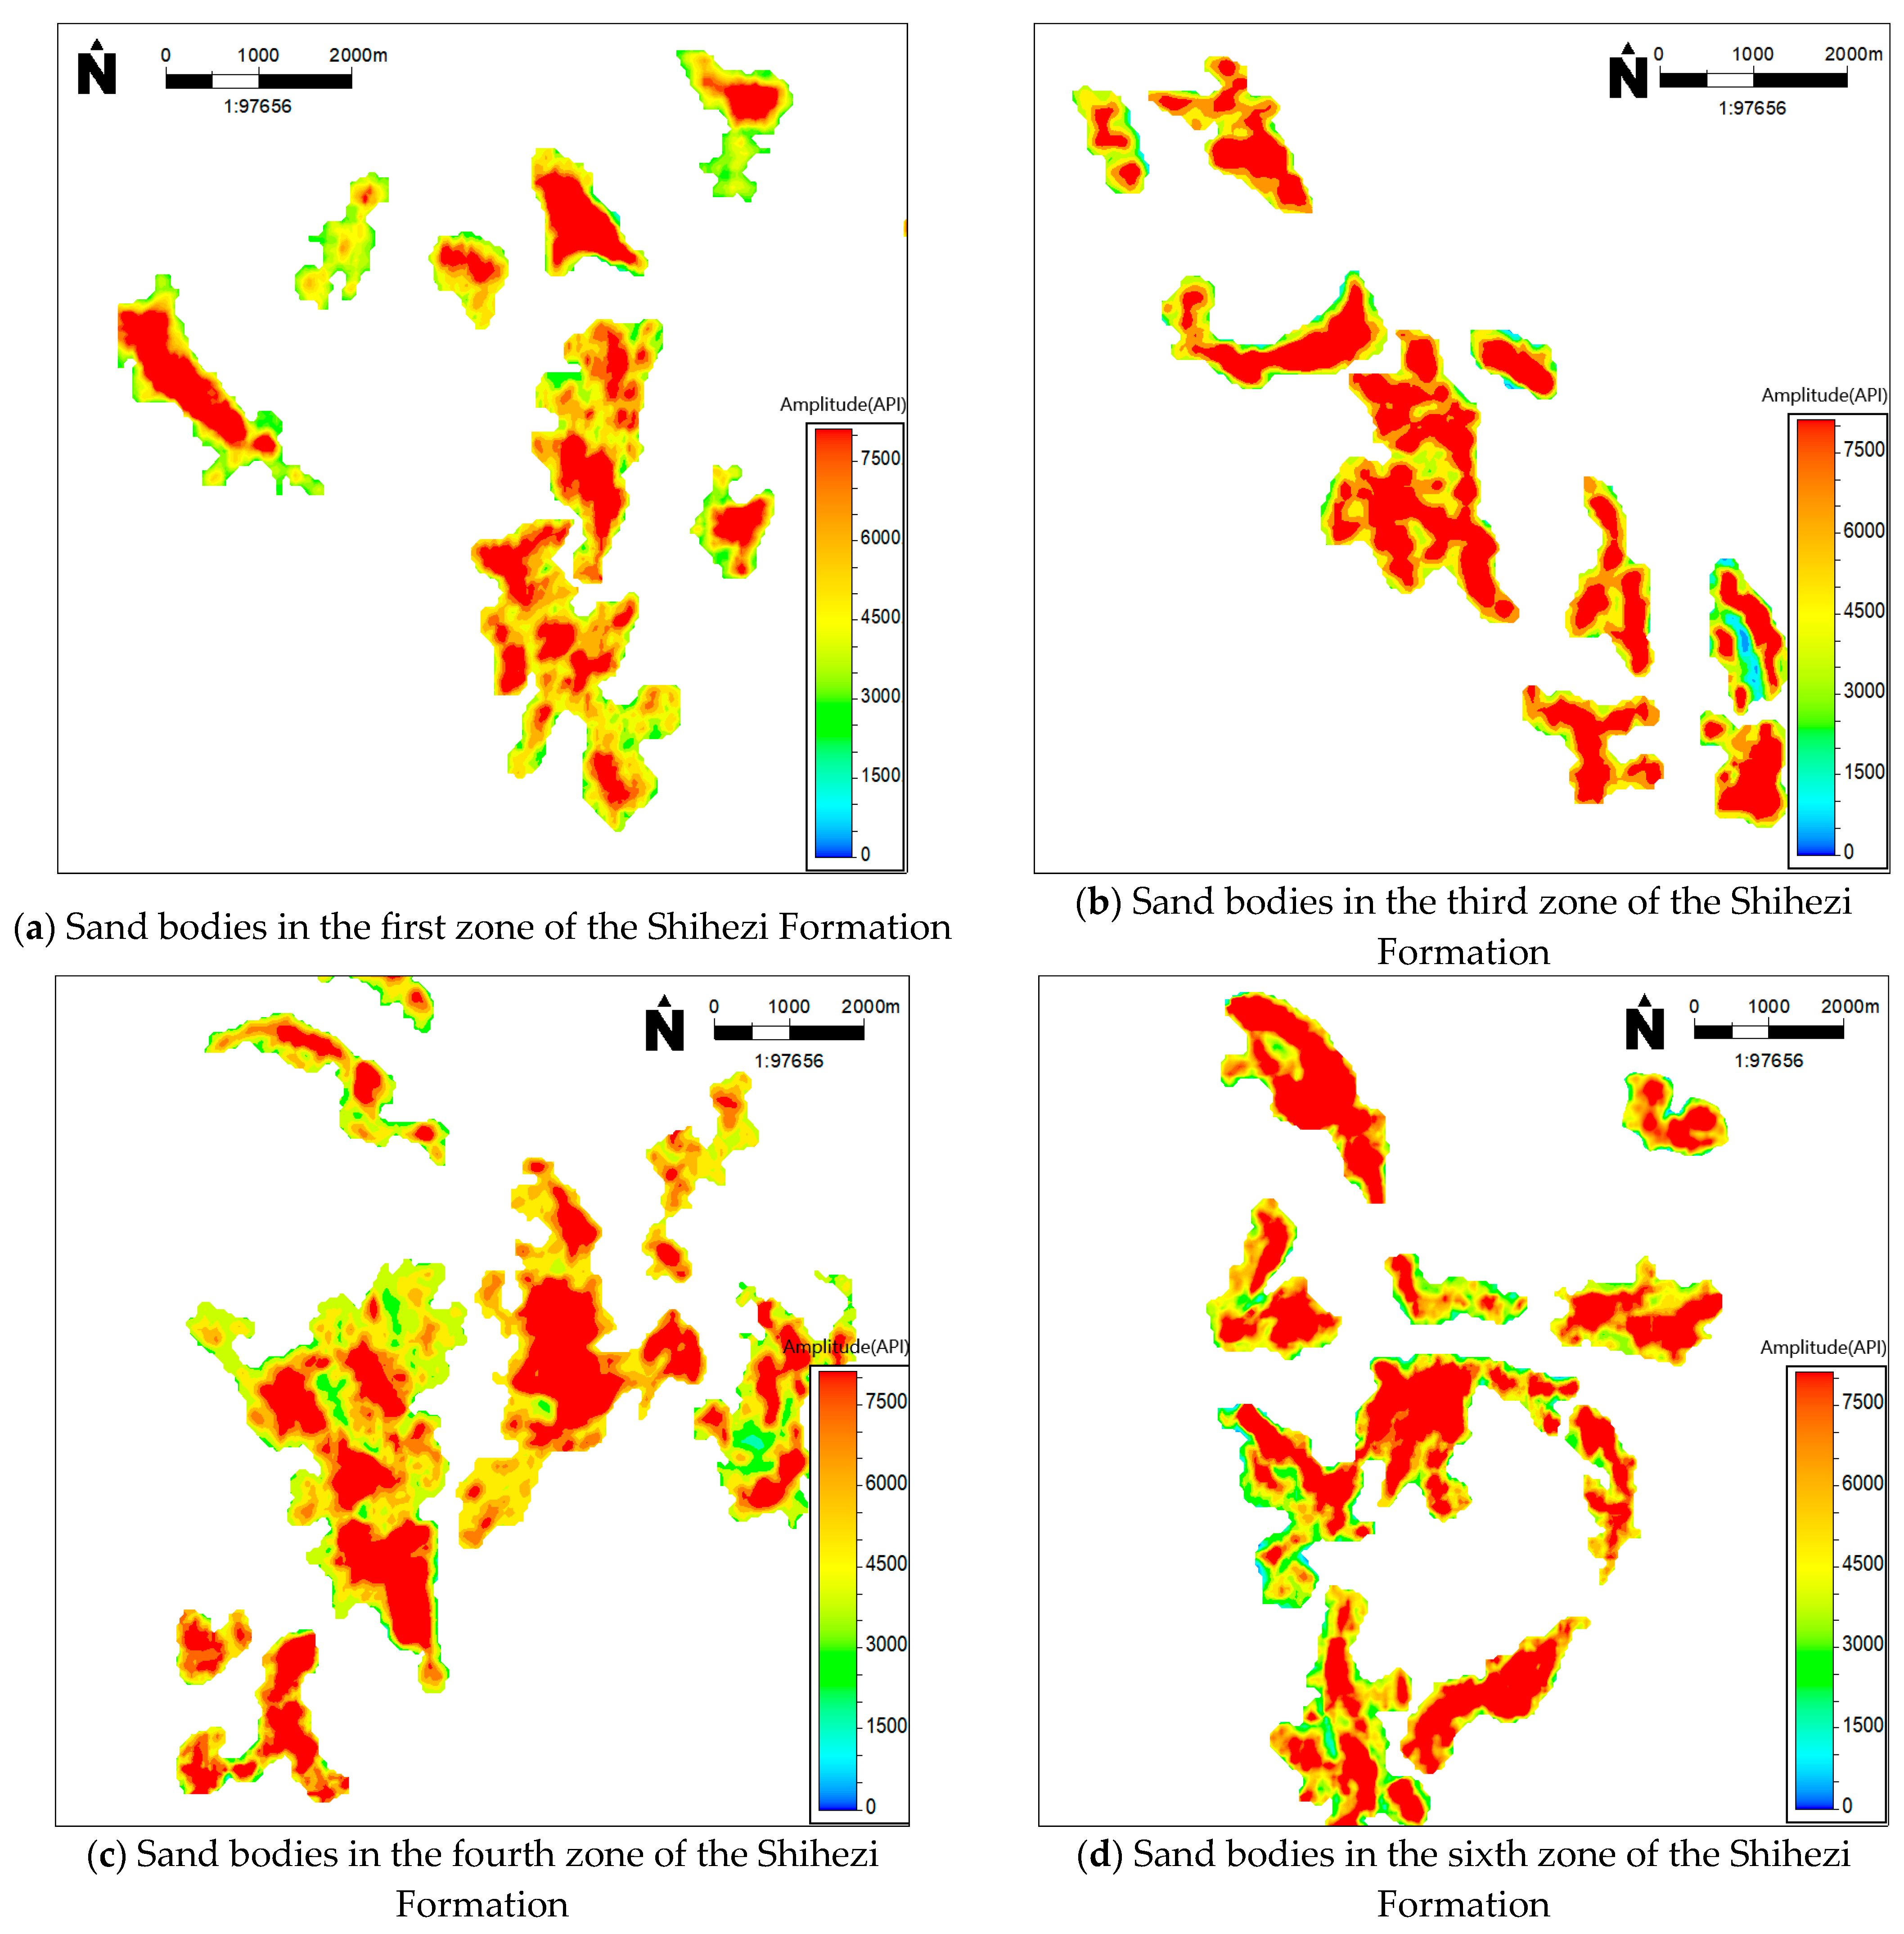
4.2. Application in the Linxing–Shenfu Gas Field

Since 2021, parts of the gas blocks in the Linxing–Shenfu gas field have entered into the stable production stage. To maximize the duration of stable production, it is imperative to drill infilled wells to make up for the decline. More than 200 dominant developed sand bodies were finely characterized based on the further understanding of tight gas reservoirs, and parts of them are shown in Figure 12. Based on fine characterizations of sand bodies and the new method, 47 infilled wells have been drilled, with a predicted accumulative production capacity of 1.24 × 10⁸ m3 a year, of which 25 infilled wells have been put into production, with an average Absolute Open Flow (AOF) of 2.4 × 10⁴ m3/d shown in Figure 13.
The examples and practical applications in the Linxing–Shenfu gas field serve as additional validation for the reliability of the economic well pattern density chart and infilling time chart. This underscores the efficacy of the new methodology in determining economic well pattern density and infilling time, providing robust support for the construction of production capacity in the Linxing–Shenfu gas field.

4.3. Discussion

In many current articles, whether employing methods such as well interference probability (Gao et al., 2020 [16]), well dynamic control area (Li et al., 2020 [17]), recoverable reservoir categorization (Guo et al., 2022 [18]), or gas well drainage radius conversion (Cheng et al., 2023 [19]), the exploration of economic well pattern density is often approached from the perspective of gas fields or gas blocks. These methods often involve extensive data collection and intricate calculations, and may not be directly applicable to the deployment of infilled wells.
In contrast to existing articles on economic well pattern density, this study adopted a novel approach by quantitatively investigating economic well pattern density from the perspective of sand bodies based on fine characterizations. Furthermore, this study, grounded in the practical development scenario of the Linxing–Shenfu gas field, established evaluation standards and developed a numerical model by integrating static and dynamic field data. Through numerical simulation and sensitivity analysis, a relationship chart for rapidly determining economic well pattern density was produced. Additionally, this study introduced, for the first time, the innovative concept of infilling time, a notion previously overlooked by other scholars. This study also introduced the concept of adjusting time, which is defined by the extent of extracting tight gas reserves from the sand body when a well is infilled. The latest adjusting time is defined as the infilling time, which refers to the maximum extent of sand body extraction that meets the gas production increment standard. The research results provide a novel method for rapidly quantifying economic well pattern density and infilling time under known conditions of sand body reserve abundance and permeability. Practical experience has demonstrated the excellent applicability and effectiveness of this method in gas fields.
However, this method also has certain limitations. It is suitable for gas fields where there is a good understanding of the sand body distribution characteristics. When sand body reserve abundance or permeability cannot be obtained, traditional methods must be employed to determine the economic well pattern density.

5. Conclusions

In this paper, the numerical simulation method was employed to investigate the economic well pattern density and infilling time in a tight gas reservoir chosen from the Linxing–Shenfu gas field in the Ordos Basin. A sensitivity analysis was conducted on various reserve abundance and permeability parameters, forming the basis for the subsequent analysis of economic well pattern density and infilling time. The conclusions drawn from this study are summarized as follows:
(1)
In consideration of construction investment, gas prices, and associated taxes, we formulated evaluation standards encompassing the average single well EUR, production interference ratio, and production increment of the infilled well. For the first time, we introduced the evaluation index “infilling time” to provide a quantitative characterization of the maximum recovery that aligns with the production increment standard of the infilled well.
(2)
A relationship chart depicting economic well pattern density, reserve abundance, and permeability was developed, based on the fine characterization of the sand body. This chart presents a novel method for promptly determining economic well pattern density when both the reserve abundance and permeability of the sand body are provided.
(3)
A relationship chart depicting infilling time, reserve abundance, and permeability was developed, based on the fine characterization of the sand body. This chart presents a novel method for promptly determining infilling time when both the reserve abundance and permeability of the sand body are provided.
(4)
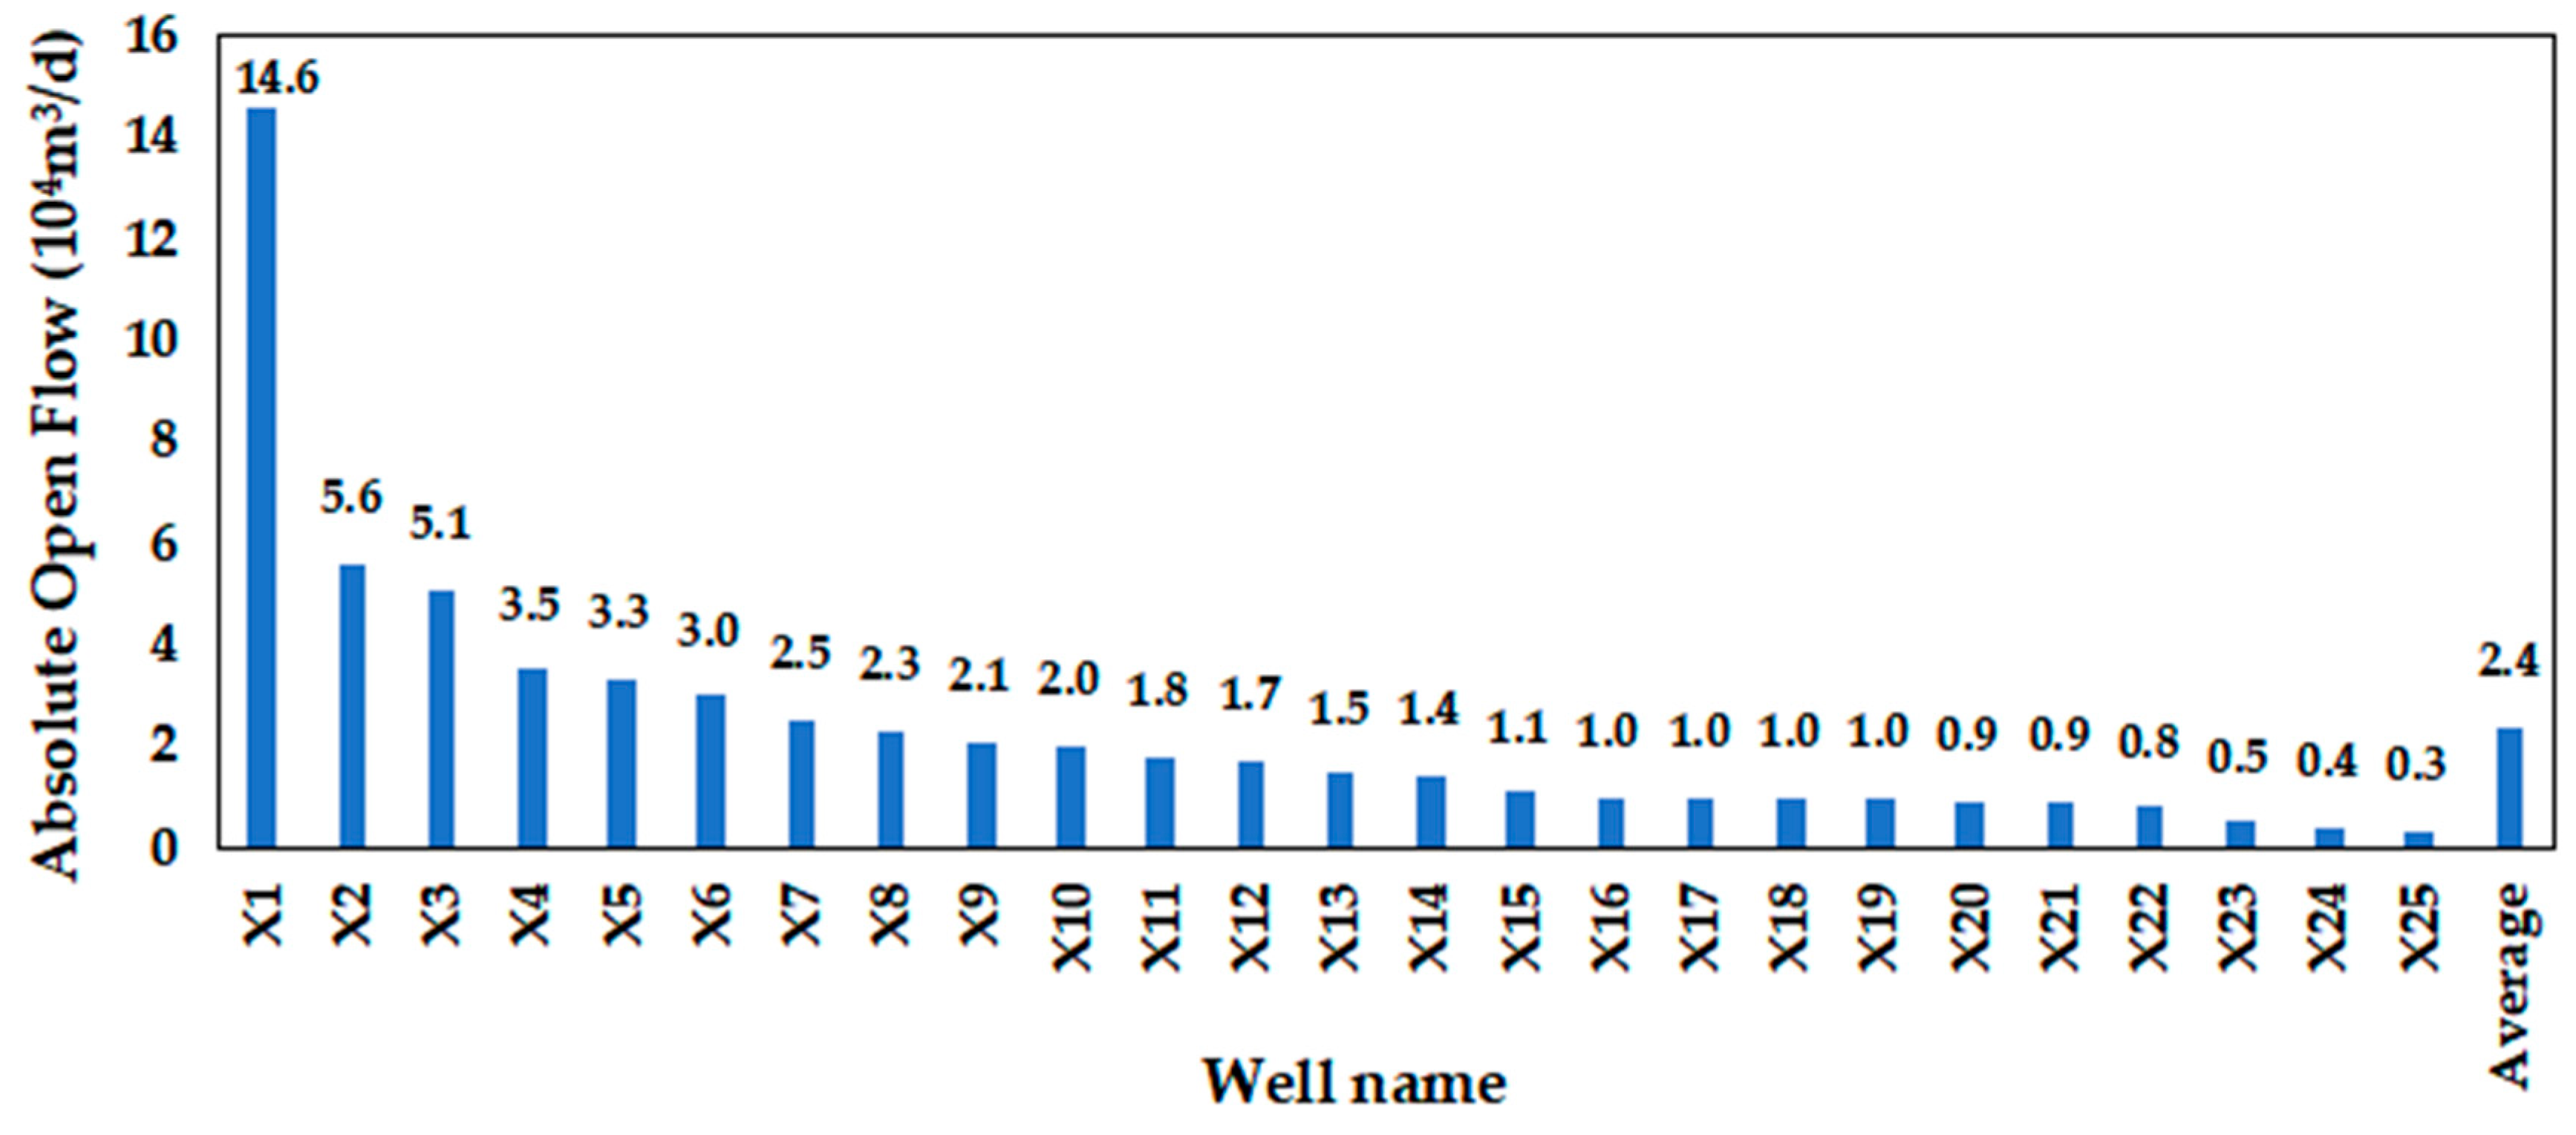
The application of the new method for determining economic well pattern density and infilling time has been successfully implemented in the Linxing–Shenfu gas field. As a consequence of applying this method, a total of 47 infilled wells have been drilled, with a projected cumulative production capacity of 1.24 × 10⁸ m3 a year. Out of these, 25 infilled wells have been brought into production, boasting an average AOF of 2.4 × 10⁴ m3/d. These results affirm the effectiveness and suitability of the new method for the conditions prevailing in the Linxing–Shenfu gas field.

Author Contributions

Conceptualization, D.W.; methodology, D.W., M.F. and G.C.; validation, D.W.; investigation, D.W.; data curation, H.L.; writing—original draft, D.W.; writing—review and editing, M.F., H.L. and G.C.; visualization, B.W.; supervision, M.F., H.L. and W.F.; project administration, M.F. All authors have read and agreed to the published version of the manuscript.

Funding

This paper is supported by a Key Research Subject for the 14th Five-Year Plan of CNOOC (Ltd.) Technology Project (Grant No. KJGG2022-1004).

Data Availability Statement

The data are not publicly available due to the privacy restrictions of the company.

Conflicts of Interest

Authors D.W., M.F., H.L., W.F. and B.W. were employed by the company CNOOC Research Institute Co., Ltd. The remaining authors declare that the research was conducted in the absence of any commercial or financial relationships that could be construed as potential conflicts of interest.

References

  1. Li, L. Development of natural gas industry in China: Review and prospect. Nat. Gas Ind. B 2022, 9, 187–196. [Google Scholar] [CrossRef]
  2. Sun, L.; Zou, C.; Jia, A.; Wei, Y.; Zhu, R.; Wu, S.; Guo, Z. Development characteristics and orientation of tight oil and gas in China. Pet. Explor. Dev. 2019, 46, 1073–1087. [Google Scholar] [CrossRef]
  3. Dai, J.; Ni, Y.; Wu, X. Tight gas in China and its significance in exploration and exploitation. Pet. Explor. Dev. 2012, 39, 277–284. [Google Scholar] [CrossRef]
  4. Jia, A.; Wei, Y.; Guo, Z.; Wang, G.; Meng, D.; Huang, S. Development status and prospect of tight sandstone gas in China. Nat. Gas Ind. B 2022, 9, 467–476. [Google Scholar] [CrossRef]
  5. Gao, H.; Li, H.A. Engineering, Pore structure characterization, permeability evaluation and enhanced gas recovery techniques of tight gas sandstones. J. Nat. Gas Sci. Eng. 2016, 28, 536–547. [Google Scholar] [CrossRef]
  6. Li, Y.; Xiao, F.; Xu, W.; Wang, J. Performance evaluation on water-producing gas wells based on gas & water relative permeability curves: A case study of tight sandstone gas reservoirs in the Sulige gas field, Ordos Basin. Nat. Gas Ind. B 2016, 3, 52–58. [Google Scholar]
  7. Wu, Z.; Jiang, Q.; Zhou, Y.; He, Y.; Sun, Y.; Tian, W.; Zhou, C.; An, W. Key technologies and orientation of EGR for the Sulige tight sandstone gas field in the Ordos Basin. Nat. Gas Ind. B 2023, 10, 591–601. [Google Scholar] [CrossRef]
  8. Farouk, S.; Sen, S.; Saada, S.A.; Eldosouky, A.M.; Elsayed, R.; Kassem, A.A.; Al-Kahtany, K.; Abdeldaim, A. Characterization of Upper Cretaceous Matulla and Wata Clastic Reservoirs from October field, Central Gulf of Suez, Egypt. Geomech. Geophys. Geo-Energy Geo-Resour. 2023, 9, 106. [Google Scholar] [CrossRef]
  9. Lotfy, N.M.; Farouk, S.; Hakimi, M.H.; Ahmad, F.; El Shennawy, T.; El Nady, M.M.; Salama, A.; Shehata, A.M. Biomarker and isotopic characteristics of Miocene condensates and natural gases, West Delta deep marine concession, Eastern Mediterranean, Egypt. Sci. Rep. 2024, 14, 235. [Google Scholar] [CrossRef]
  10. McCain, W.D.; Voneiff, G.W.; Hunt, E.R.; Semmelbeck, M.E. A tight gas field study: Carthage (Cotton Valley) Field. In Proceedings of the SPE Unconventional Resources Conference/Gas Technology Symposium, Calgary, AB, Canada, 28 June 1993. [Google Scholar]
  11. Voneiff, G.; Cipolla, C. A new approach to large-scale infill evaluations applied to the OZONA (Canyon) gas sands. In Proceedings of the SPE Permian Basin Oil and Gas Recovery Conference, Midland, TX, USA, 27–29 March 1996. [Google Scholar]
  12. Fu, N.; Tang, H.; Liu, Q. Technologies for fine adjustment in the middle-later development stage of low permeability tight sandstone gas reservoirs. J. Southwest Univ. (Sci. Technol. Ed.) 2018, 40, 136. [Google Scholar]
  13. Jia, A.; Wang, G.; Meng, D.; Guo, Z.; Ji, G.; Cheng, L. Well pattern infilling strategy to enhance oil recovery of giant low-permeability tight gasfield: A case study of Sulige gasfield, Ordos Basin. Acta Pet. Sin. 2018, 39, 802. [Google Scholar]
  14. Lu, T.; Liu, Y.; Wu, L.; Wang, X. Challenges to and countermeasures for the production stabilization of tight sandstone gas reservoirs of the Sulige Gasfield, Ordos Basin. Nat. Gas Ind. B 2015, 2, 323–333. [Google Scholar] [CrossRef]
  15. Li, Y.; Xu, W.; Xiao, F.; Liu, L.; Liu, S.; Zhang, W. Optimization of a development well pattern based on production performance: A case study of the strongly heterogeneous Sulige tight sandstone gas field, Ordos Basin. Nat. Gas Ind. B 2015, 2, 95–100. [Google Scholar] [CrossRef]
  16. Gao, S.; Liu, H.; Ye, L.; Wen, Z.; Zhu, W.; Zhang, C. A new method for well pattern density optimization and recovery efficiency evaluation of tight sandstone gas reservoirs. Nat. Gas Ind. B 2020, 7, 133–140. [Google Scholar] [CrossRef]
  17. Li, Q.; Gao, S.-S.; Liu, H.-X.; Ye, L.-Y.; Wu, H.-H.; Zhu, W.-Q.; Zhang, J.; Yang, Y.; Yang, M.-H. Well network densification and recovery evaluation of tight sandstone gas reservoirs. Nat. Gas Geosci. 2020, 31, 865–876. [Google Scholar]
  18. Guo, Z.; Wang, G.; Xia, Y.; Yang, B.; Han, J. Technical countermeasure of well pattern optimization in multi-layer lenticular tight sandstone gas field. Nat. Gas Geosci. 2022, 33, 1883–1894. [Google Scholar]
  19. Cheng, M.; Xue, W.; Guo, Z.; Hou, M.; Wang, C. Development of Large-Scale Tight Gas Sandstone Reservoirs and Recommendations for Stable Production—The Example of the Sulige Gas Field in the Ordos Basin. Sustainability 2023, 15, 9933. [Google Scholar] [CrossRef]
  20. Ji, G.; Jia, A.; Meng, D.; Guo, Z.; Wang, G.; Cheng, L.; Zhao, X. Technical strategies for effective development and gas recovery enhancement of a large tight gas field: A case study of Sulige gas field, Ordos Basin, NW China. Pet. Explor. Dev. 2019, 46, 629–641. [Google Scholar] [CrossRef]
  21. Xie, S.; Lan, Y.; Jiao, Y.; Liu, H.; Wu, Y. Research of Dynamic Reserves Estimation Methods for Complex Gas Wells in Low Permeability and Tight Gas Reservoir. IOP Conf. Ser. Earth Environ. Sci. 2019, 237, 042002. [Google Scholar] [CrossRef]
  22. Li, Q.; Li, Y.; Gao, S.; Liu, H.; Ye, L.; Wu, H.; Zhu, W.; An, W. Well network optimization and recovery evaluation of tight sandstone gas reservoirs. J. Pet. Sci. Eng. 2020, 196, 107705. [Google Scholar] [CrossRef]
  23. Guo, Z.; Jia, A.; Ji, G.; Ning, B.; Wang, G.; Meng, D. Reserve classification and well pattern infilling method of tight sandstone gasfield: A case study of Sulige gasfield. Acta Pet. Sin. 2017, 38, 1299. [Google Scholar]
  24. Sarhan, M.A. Technology, Gas-generative potential for the post-Messinian megasequence of Nile Delta Basin: A case study of Tao Field, North Sinai Concession, Egypt. J. Pet. Explor. Prod. Technol. 2022, 12, 925–947. [Google Scholar] [CrossRef]
  25. Farouk, S.; Sen, S.; Ahmad, F.; Al-Kahtany, K.; Benmamar, S.; Abdeldaim, A. Assessment of pore pressure in the Oligocene–Pleistocene stratigraphy of the West Delta Deep Marine, offshore Nile Delta, Egypt. Mar. Geophys. Res. 2024, 45, 6. [Google Scholar] [CrossRef]
  26. Zhang, W.; Cheng, Z.; Cheng, H.; Qin, Q.; Wang, M. Research of tight gas reservoir simulation technology. IOP Conf. Ser. Earth Environ. Sci. 2021, 804, 022046. [Google Scholar] [CrossRef]
  27. Zhang, H.; Bai, Y.; Xu, B.; Du, X.; Gai, S. Numerical Simulation and Sensitivity Analysis of Hydraulic Fracturing in Multilayered Thin Tight Sandstone Gas Reservoir. Geofluids 2023, 2023, 8310206. [Google Scholar] [CrossRef]
Figure 1. Location and structure superposition of the study area in the Linxing–Shenfu gas field.
Energies 17 01223 g001
Figure 2. Models with different well pattern densities.
Energies 17 01223 g002
Figure 3. Relationships between evaluation standards, well pattern density, and permeability.
Energies 17 01223 g003
Figure 4. Relationships between permeability, reserve abundance, and economic well pattern density.
Energies 17 01223 g004
Figure 5. Relationships between reserve abundance, permeability, and economic well pattern density.
Energies 17 01223 g005
Figure 6. Relationships between production increment of infilled well, adjusting time, and permeability.
Energies 17 01223 g006
Figure 7. Relationships between permeability, reserve abundance, and infilling time.
Energies 17 01223 g007
Figure 8. Relationships between reserve abundance, permeability, and infilling time.
Energies 17 01223 g008
Figure 9. Well logging curve of the basic well at the X-62 well site.
Energies 17 01223 g009
Figure 10. Daily gas production of the basic well and the infilled well.
Energies 17 01223 g010
Figure 11. The fine characterization of the single sand body at the X-62 well site.
Energies 17 01223 g011
Figure 12. Fine characterization of sand bodies.
Energies 17 01223 g012
Figure 13. AOF of infilled wells.
Energies 17 01223 g013
Table 1. Geologic parameters of the model.
Size
(m)
Area
(km2)
Thickness
(m)
Porosity
(%)
Gas Saturation
(%)
Initial Pressure
(MPa)
1430 × 7001.013.011.055.015.0
Table 2. Corresponding relationship between effective permeability and logging permeability.
Logging permeability
(mD)
0.40.60.81.01.21.52.0
Effective permeability
(mD)
0.150.190.240.290.360.500.86
Table 3. Layer division and the corresponding lithologies and geological parameters of the basic well at the X-62 well site.
LithologyTop
Depth
(m)
Bottom
Depth
(m)
Thickness
(m)
Sg
(%)
Poro
(%)
Perm
(mD)
Mudstone1453.11470.117.0000.01
Gas sandstone1470.11480.510.463.615.72.00
Mudstone1480.51498.417.9000.01
Table 4. Sand body properties and gas well production data of the X-62 well site.
Sand body properties
Area
(km2)
Reserve
(108 m3)
Reserve abundance
(108 m3/km2)
Well pattern density
(wells/km2)
Permeability
(mD)
0.640.831.31.62.0
Well production data
WellRecovery before infilling (%)Cumulative gas production before infilling (104 m3)Predicting EUR before infilling (104 m3)Predicting EUR after infilling (104 m3)
Basic well34277242503436
Infilled well\\\771
Disclaimer/Publisher’s Note: The statements, opinions and data contained in all publications are solely those of the individual author(s) and contributor(s) and not of MDPI and/or the editor(s). MDPI and/or the editor(s) disclaim responsibility for any injury to people or property resulting from any ideas, methods, instructions or products referred to in the content.

