Abstract
Traditional methods to develop biomass-based carbon adsorbents generally involve carbonization followed by chemical or physical activation. However, routes involving the hydrothermal treatment of biomass are receiving growing interest. In this work, two different strategies for the synthesis of sustainable CO2 adsorbents are compared, i.e., in situ ionic activation and hydrothermal treatment followed by activation with CO2. The latter is a green and simple procedure that does not require the addition of chemicals or acid-washing stages, and which leads to carbon adsorbents with relatively high CO2 adsorption capacity at low pressures, up to 0.64 mmol g−1 at 15 kPa and 50 °C, conditions relevant for postcombustion CO2 capture applications. On the other hand, in situ ionic activation can lead to carbon adsorbents with superior CO2 adsorption capacity in the aforementioned conditions, 0.78 mmol g−1, and with reduced cost and environmental impact compared to conventional chemical activation.
1. Introduction
The Paris Agreement, ratified by 195 of the Parties, aims to hold the increase in the global average temperature to well below 2 °C above preindustrial levels and to pursue efforts to limit the temperature increase to 1.5 °C, recognizing that this would significantly reduce the risks and impacts of climate change [1]. Limiting warming to 1.5 °C implies reaching net zero CO2 emissions globally around 2050 [2]. Achieving net zero CO2 and greenhouse gas (GHG) emissions requires system transformations across all sectors and contexts, including scaling up renewable energy while phasing out unabated fossil fuels, ending deforestation, reducing non-CO2 emissions, and implementing both supply- and demand-side measures [3]. The 28th meeting of the Conference of the Parties (COP28) to the United Nations Framework Convention on Climate Change (UNFCCC) led to the first global stocktake (GST) under the Paris Agreement that assessed the global action on climate change and set out the ambitious actions needed to keep the 1.5 °C climatic goal within reach. Parties adopted a decision on the GST that recognizes the need for deep, rapid and sustained reductions in GHG emissions in line with 1.5 °C [4].
CO2 capture and storage (CCS) involves the separation of CO2 from large stationary sources, such as power plants and factories, and its compression, transport, and permanent storage, in order to avoid its emission to the atmosphere [5]. CCS should prevent locked-in emissions from existing (and planned) infrastructure in the power and industry sectors, forming part of a wider portfolio of measures that need to be implemented in order to meet the climate goals [2,6]. CCS is a proven technology that has reached commercial scale, with a current global capacity of near 50 Mtpa [7]. However, according to the net zero emissions (NZE) by 2050 scenario of the International Energy Agency (IEA), which limits global warming to 1.5 °C, the global CCS capacity needs to be deployed up to 1 Gt by 2030 and up to 5.5 Gt by 2050 [6]. This is technically feasible, although it requires urgent action. In the NZE scenario, a further 0.6 Gt of CO2 would be captured for utilization by 2050 [6].
Several separation technologies can be used to accomplish the CO2 capture step: absorption, adsorption, membranes, cryogenic distillation, etc. [8]. CO2 capture from low-pressure streams, such as flue gas, is generally carried out by absorption with amine solutions [9]. This is a mature technology used since 1930 for the sweetening of natural gas [10]. However, it has a series of disadvantages, like corrosion [11], amine degradation [12], high energy intensity [13], environmental impact [14], and additional stress to scarce water resources [15]. On the other hand, adsorption is an environmentally friendly technology, with none of the previous disadvantages [16]. Adsorption-based CO2 capture has reached commercial-scale demonstration in the industrial sector, at the Valero Refinery in Port Arthur, USA [17].
The performance of an adsorption-based CO2 capture process is intrinsically related to the properties of the adsorbent used, so the development of efficient adsorbents is critical to develop the technology. An ideal adsorbent for CO2 capture should have the following characteristics: high working capacity, fast adsorption and desorption kinetics, availability, stability, low cost, and an easy regeneration. Zeolites, aluminas, carbon-based materials, silicas, amine-based solid sorbents, metal oxides, metal salts, double salts, hydrotalcites, metal organic frameworks (MOFs), zeolitic imidazole frameworks (ZIFs), porous organic polymers (POPs), polymers, composite materials, and a variety of waste-derived materials have been evaluated as adsorbents for different CO2 capture applications [18,19,20,21,22]. Providing specific details of the different types of CO2 adsorbents, including current challenges, is out of the scope of the present work, but these can be found in dedicated extensive reviews [22]. Among the CO2 adsorbent candidates, carbons have a series of significant advantages for large-scale CO2 capture applications: cost-effectiveness, fast adsorption and desorption kinetics, low energy requirements for regeneration, excellent thermal, mechanical, and chemical stability, and high thermal conductivity [21,22]. Moreover, carbon adsorbents can be developed from waste biomass, which is a low-cost, renewable, and climate-neutral source of carbon widespread all around the world, aligning with green synthesis, circular economy, and climate neutrality principles [22,23].
Biomass-based carbons have been traditionally produced through chemical activation, which consists of mixing the feedstock with activating agents such as KOH, NaOH, ZnCl2, H3PO4, K2CO3, H2SO4, FeCl3, MgCl2, or CaCl2 and heating the mixture in an inert atmosphere; or through physical activation, which refers to the controlled gasification of the precursor with H2O, CO2, air, or a mixture of these; both methods can be carried out in a single step or in a two-step procedure, where the activation is preceded by a carbonization process carried out at atmospheric pressure under inert atmosphere. However, routes involving a hydrothermal treatment of the biomass feedstock have been receiving growing interest in recent years due to the appealing properties of hydrochars as precursors of carbon adsorbents [23,24].
A new synthesis strategy, in situ ionic activation, has been recently proposed to produce microporous carbons with an extremely narrow pore size distribution that are promising for CO2 capture applications [25,26,27,28]. In general, hydrochars present a greater amount of oxygen-containing functional groups, such as hydroxyls or carboxyls, than conventional biochars [23]. In situ ionic activation makes use of that characteristic to exchange the protons (H+) of the surface groups by potassium ions (K+). The subsequent heat treatment of such K-exchanged hydrochars leads to ultramicroporous carbons with appealing properties for gas separation applications, while making use of significantly lower amounts of activating agents than conventional chemical activation, thus improving the economics of the process and its environmental impact [29].
In this work, in situ ionic activation is compared to hydrothermal treatment followed by physical activation with CO2 as the synthesis route for developing efficient CO2 adsorbents. A residue from the food industry is used as the carbon source in both cases: the solid waste from horchata manufacturing. Horchata is the sweetened liquid extract that results from the mechanical pressing of Cyperus sculentus tubers (also known as tiger nuts, earth almonds, or chufas). In Spain, 8 kt of tiger nuts are collected annually, 90% of which are used for horchata production. The solid waste from horchata manufacture is generally used for combustion, composting, or animal feed, although its use as dietary fiber in food processing [30], as raw material for biocomposite production [31], or as biosorbent for metal removal [32] has been proposed.
2. Materials and Methods
2.1. Raw Materials
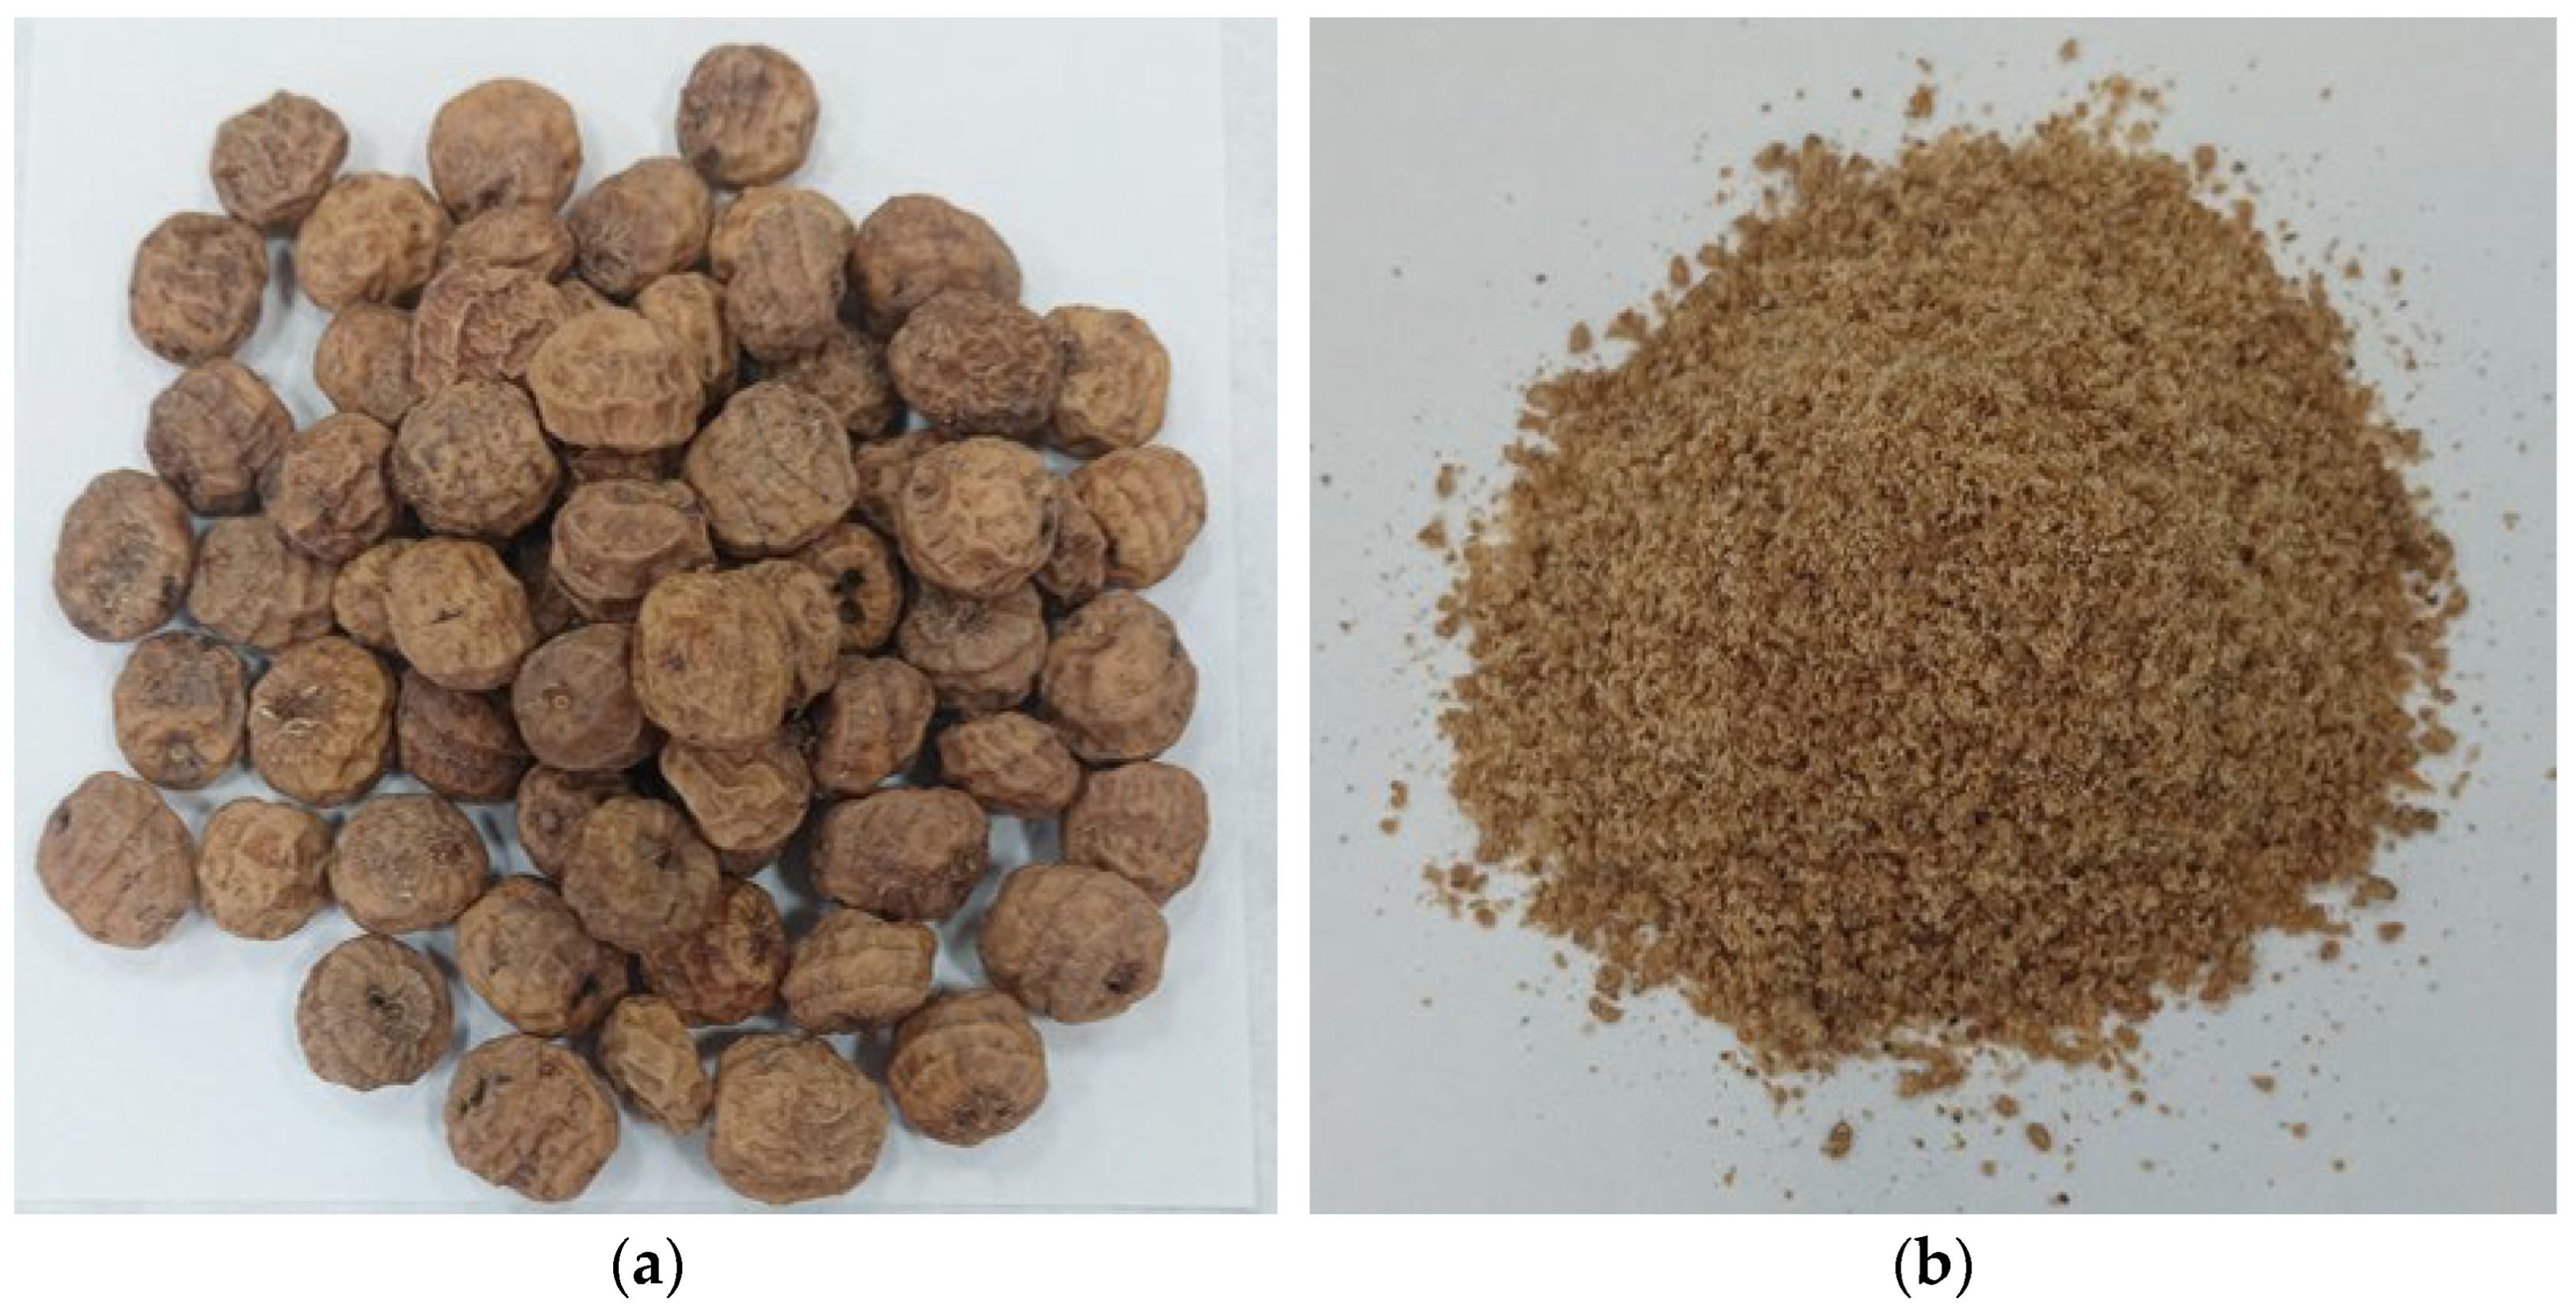
The solid waste of a batch of homemade horchata, referred to from now on as HSW, was recovered by filtration. HSW was air dried at low temperature (60 °C) to preserve the sample for further treatment, and its particle size was reduced to below 1 mm. Figure 1a shows a picture of tiger nuts and Figure 1b of HSW.
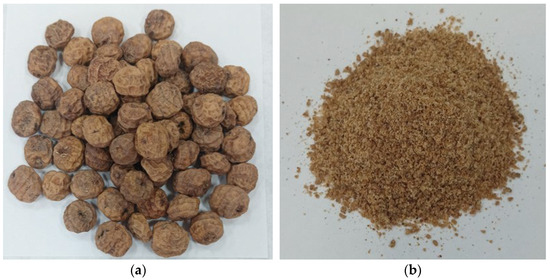
Figure 1.
Picture of: (a) Cyperus sculentus tubers (also known as tiger nuts, earth almonds, or chufas); (b) HSW.
2.2. Hydrothermal Treatment Followed by Activation with CO2
A first series of carbon adsorbents were prepared by a two-step procedure: 10 g of wet HSW was placed into a 45 cm3 Teflon-lined autoclave (Parr 4744) and heated up to 120–190 °C for 3 h in a programmable oven. The resulting hydrochar was recovered by filtration, washed with distilled water and ethanol, and dried under vacuum at 60 °C for 8 h. Subsequently, the hydrochar was pelletized into small cylinders with a diameter of 4 mm by uniaxial compression using a single stamping tablet machine (maximum impulsive force 15 kN) without binder addition. The hydrochars were denoted as HSWH-x-y where x represents the temperature of the hydrothermal treatment (in °C) and y its duration (in h). The hydrochar pellets were then subjected to a heating rate of 5 °C min−1 in CO2 flow up to a target temperature of 800 °C and held at this temperature for a given time. The final carbons were denoted as HSWHC-x-y-z-t, where x represents the temperature of the hydrothermal treatment (in °C), y its duration (in h), z the temperature (in °C) of the activation in CO2 flow, and t the holding time at this temperature (in min). Figure 2 shows a schematic representation of this synthesis protocol.

Figure 2.
Schematic representation of the carbon synthesis protocol consisting on hydrothermal treatment followed by activation with CO2.
2.3. In Situ Ionic Activation
An in situ ionic activation method adapted from Zhang et al. [26] was followed to prepare the second series of carbons. In a typical synthesis, ca. 2 g of dry HSW was dispersed in 25 cm3 of a potassium hydroxide (KOH) solution (mass ratio of precursor to KOH 4:1) and stirred for 30 min. The mixture was then transferred into a 45 cm3 Teflon-lined autoclave and heated up to 160–190 °C for 8 h in a programmable oven. The resulting hydrochar was recovered by filtration, washed with distilled water and ethanol, and dried under vacuum at 60 °C for 8 h. Subsequently, the hydrochar was pelletized following the previously described procedure. The pellets were then subjected to a heating rate of 10 °C min−1 in N2 flow up to a target temperature of 600–800 °C and held at this temperature for 2 h. After cooling, the carbons were dispersed in 10 cm3 of 10 wt.% HCl solution and stirred for 30 min and then washed with distilled water until neutral pH. The obtained carbons were dried under vacuum at 60 °C for 8 h. The final carbons were denoted as HSWIA-x-y-z, where x represents the temperature of the hydrothermal treatment (in °C), y its duration (in h), and z the temperature (in °C) of the final activation in N2 flow. Figure 3 shows a schematic representation of this synthesis protocol.

Figure 3.
Schematic representation of the carbon synthesis through in situ ionic activation.
2.4. Characterization
The moisture content of HSW was measured using an MB45 moisture analyzer from Ohaus, and its elemental composition was analyzed using a CHNS-932 from LECO.
The morphology of selected samples was studied by scanning electron microscopy (SEM) using a QuantaTM 650 FEG, from FEI Company, equipped with an S/TEM detector. The inorganic matter found in the backscattered electron images was analyzed by energy dispersive X-ray microanalysis (EDX) using an analyzer coupled to an Apollo X detector from Ametek-EDAX. HSW was sputter coated with an ultrathin film of electrically conductive metal (Ir) to prevent the charging of the poor conductive biomass in the SEM, thus increasing the signal-to-noise ratio.
The narrow microporosity of the samples (up to 1 nm) was assessed from the CO2 adsorption isotherms at 0 °C, following IUPAC recommendations [33]. These were measured in a TriStar 3000 apparatus from Micromeritics using a thermostatic bath circulator equipped with a D8-G Fisons for temperature control from Thermo Haake (±0.02 °C). Prior to the adsorption measurements, the samples were evacuated at 100 °C overnight in a VacPrep 061 degasser from Micromeritics. The micropore volume, VDR,CO2, was determined making use of the Dubinin–Radushkevich (DR) equation [34] assuming an affinity coefficient of 0.36 in the relative pressure range between 0.0001 and 0.005. The average micropore width (L) was calculated through the Stoeckli–Ballerini equation [35]. The narrow micropore size distribution (NMPSD) was calculated by the original density functional theory (DFT), using CO2 at 0 °C in a carbon slit pore model, with non-negative regularization and little smoothing (0.005).
2.5. Equilibrium of Adsorption
The equilibrium of adsorption of CO2 was evaluated at 25 and 50 °C, in a TriStar 3000 apparatus from Micromeritics, using a thermostatic bath circulator equipped with a D8-G Fisons for temperature control from Thermo Haake (±0.02 °C). The reversibility of adsorption was corroborated by measuring the adsorption and desorption isotherms. Prior to the adsorption measurements, the samples were evacuated at 100 °C overnight in a VacPrep 061 degasser from Micromeritics.
The isosteric heat of adsorption of CO2 was estimated from the experimental adsorption isotherms of CO2 at 0, 25, and 50 °C, making use of the Clausius–Clapeyron equation applied to adsorption [36]:
where is the isosteric heat of adsorption (J mol−1) at a selected adsorbed amount (mol g−1), T is the temperature (K), P is the pressure of the gas phase (Pa), and the universal constant of gases (8.314 J mol−1 K−1). The value of the isosteric heat of adsorption was calculated from the slope of the plots of lnP vs. 1/T at constant adsorbed amounts with linear regression coefficient greater than 0.99. The values of P for a given adsorbed amount were interpolated from the two closest experimental measurements.
The equilibrium of adsorption of N2 was evaluated for selected carbons at 50 °C, in a TriStar 3000 apparatus from Micromeritics, using a thermostatic bath circulator equipped with a D8-G Fisons for temperature control from Thermo Haake (±0.02 °C). Prior to the adsorption measurements, the samples were evacuated at 100 °C overnight in a VacPrep 061 degasser from Micromeritics.
The equilibrium selectivity of CO2 in relation to N2 () is defined by Equation (2) [37]:
where and are the CO2 and N2 adsorbed amounts (mol g−1) from a binary gas mixture of CO2 and N2 with partial pressures and (Pa).
was estimated for selected carbons making use of the ideal adsorbed solution (IAS) theory [38] to calculate the amount of CO2 and N2 adsorbed from binary gas mixtures with CO2 molar fractions between 0.01 and 0.9 at 50 °C and atmospheric pressure. The Toth adsorption model parameters were fitted to minimize the sum of square residuals between the pure component experimental adsorption data measured at 50 °C and the data calculated by the Toth model making use of the Solver Add-in in Excel. The Toth parameters were then added to the IAS.M Matlab routine written by D.D. Do [37] to obtain the values of and for every CO2 molar fraction of the gas phase. Once all the necessary data were collected, the was calculated making use of Equation (2).
3. Results and Discussion
3.1. Precursor Characterization
The carbon feedstock has a significant effect on the properties of the hydrochar and the final carbon [39]. The proximate and ultimate analysis of HSW can be found in Table 1, together with other agro-food wastes that have demonstrated excellent precursors of CO2 adsorbents: spent coffee grounds (SCG), olive stones (OS), and almond shells (AS), which have been included for comparison purposes.

Table 1.
Proximate and ultimate analysis of HSW and other biomass precursors of CO2 adsorbents.
The moisture content of HSW, 78%, is similar to that found in a previous study [31], although the industrial waste is expected to have a lower moisture content, in the vicinity of 60% [43], due to the greater efficiency of the mechanical extraction process. The high moisture content of HSW makes it an ideal candidate for the hydrothermal treatment. Hydrothermal treatment is generally recommended for biomass moisture contents above 30% (referred to as wet biomass) [39]. Note the lower moisture content of olive stones and almond shells shown in Table 1 that makes these food industry wastes more suitable for conventional dry carbonization methods.
HSW has a low ash content, 1.7%, only slightly above that of the industrial waste, 1.0% [43], but still below the ash content of tiger nuts, which varies between 1.9% and 2.6% depending on their origin [44]. The ash, the volatile matter, and the carbon, hydrogen, nitrogen, and oxygen contents of HSW are similar to the other agro-food wastes shown in Table 1, which have demonstrated excellent precursors of CO2 adsorbents.
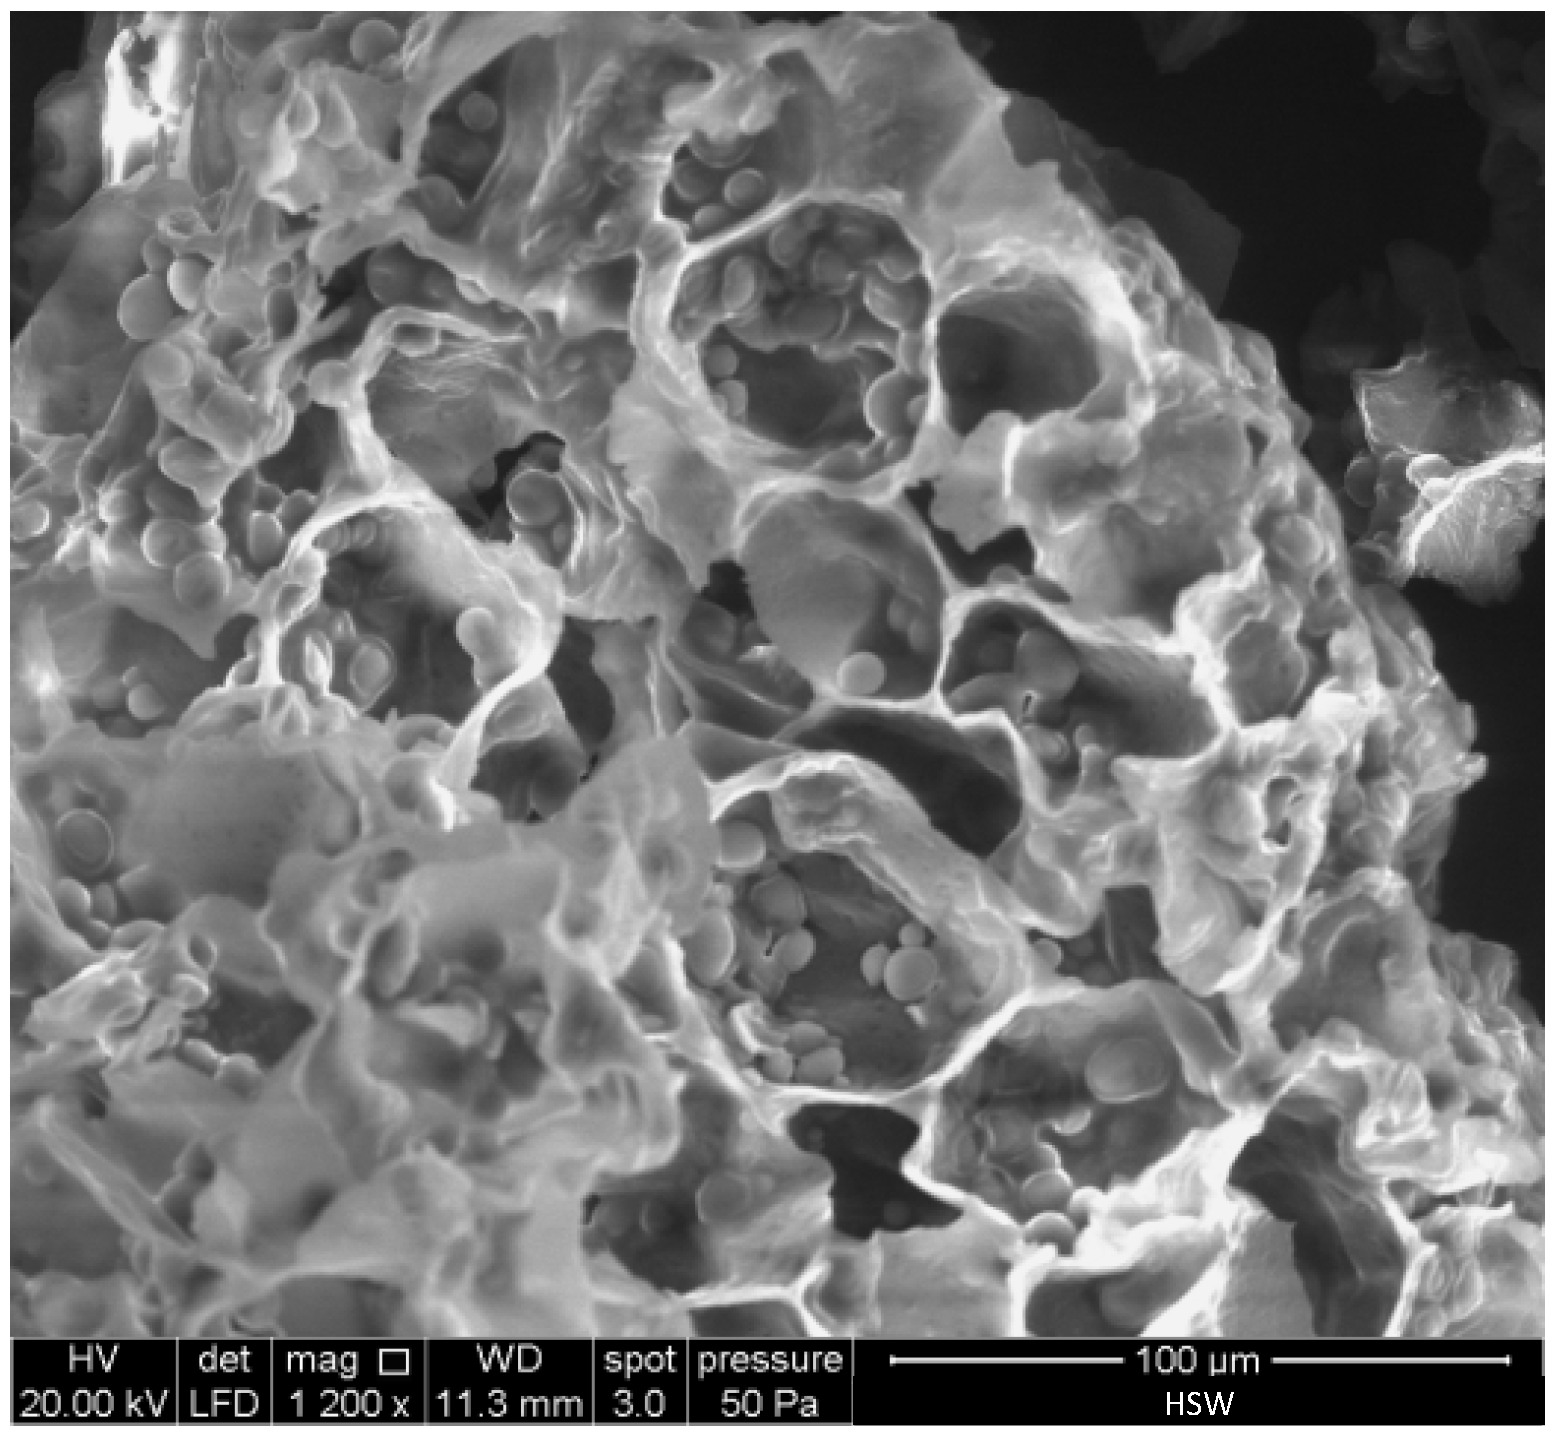
Figure 4 shows a SEM micrograph of HSW. Rounded starch granules with a diameter in the 3–11 μm range can be clearly distinguished within the cell wall compartments of HSW. These granules are similar in shape and size to starch extracted from tiger nuts [45,46]. Starch is an abundant component of tiger nuts (near 30 wt.%) [43].
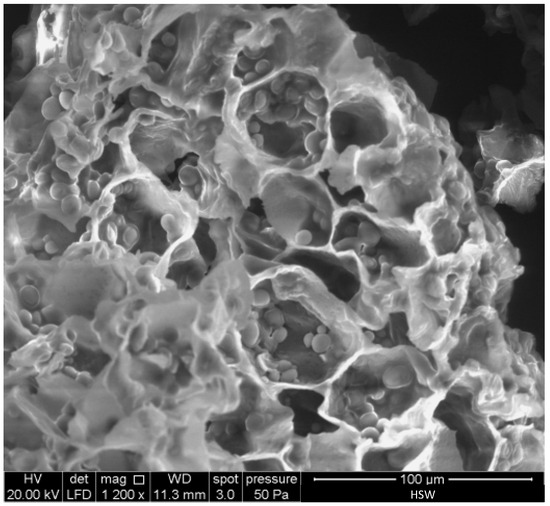
Figure 4.
SEM micrograph of the raw horchata solid waste (HSW).
The EDX analysis of HSW shows a carbon content of 58.35 wt.%, an oxygen content of 41.65 wt.%, and an O/C atomic ratio of 0.54.
3.2. Hydrothermal Treatment followed by Activation with CO2
The effect of the temperature of the hydrothermal step in the HSWHC series was evaluated within the 120–190 °C range. Temperature is known to greatly affect not only the type of reactions occurring during the hydrothermal transformation of biomass but also their reaction rates. Water ionization increases with temperature at constant pressure, significantly influencing the chemistry of water; subcritical water can lead to biomass decomposition without the need for additives [23]. In the temperature range evaluated in this work, which is relatively low, the main product expected from the hydrothermal transformation of biomass is solid carbon [47]. The yield of hydrochar is expected to decrease with increasing temperature [23].
As the temperature of the treatment increased, it was observed that the appearance of the resulting hydrochar changed progressively, from light to dark brown color, indicating an increasing degree of biomass transformation.
Neither the starting material, HSW, nor the hydrochar obtained at the lowest temperature evaluated, 120 °C, HSWH-120-3, could be pelletized by compression at room temperature without binder addition. However, the hydrochars obtained at 150 °C, 17 °C, and 190 °C, were pelletized under these conditions. HSW contains starch, proteins, and lignin that can enhance binding, although its high fiber and fat contents (ca. 9 wt.% and 24 wt.%, respectively [30]) present the opposite effect [48]. Lignin is inert during hydrothermal treatment up to 260 °C [49], so the increased lignin content of the higher-temperature hydrochars might favor their pelletization [50].
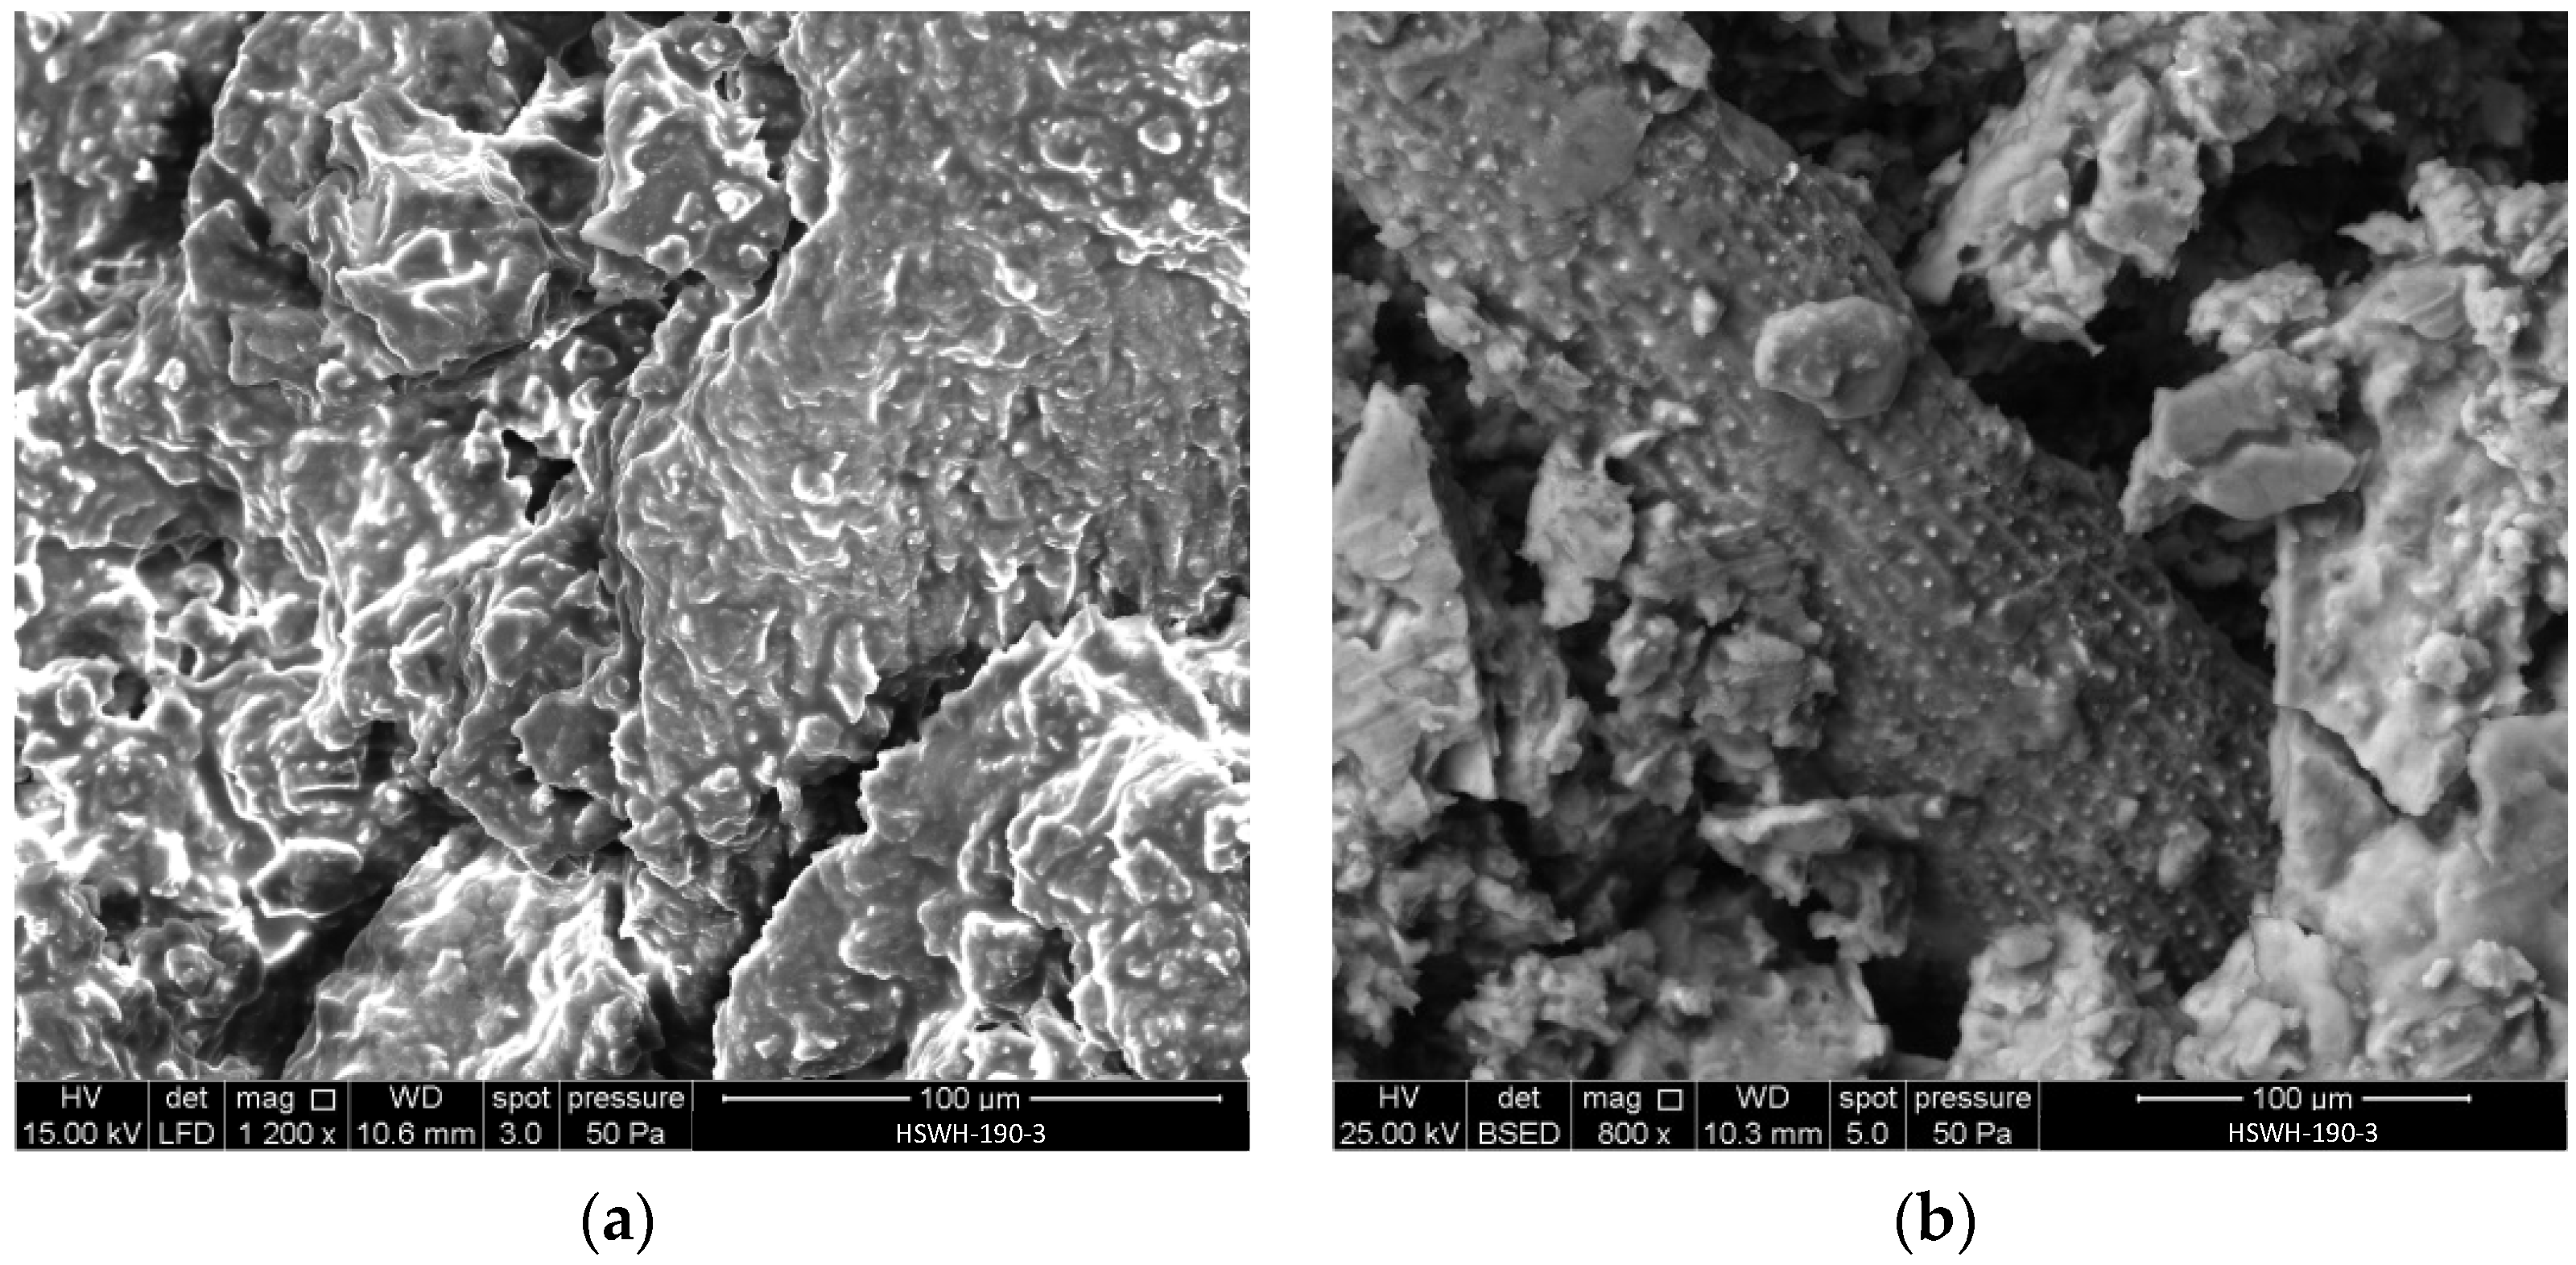
Figure 5 shows two SEM micrographs of the hydrochar pellet obtained at 190 °C: HSWH-190-3. The structure appears much denser than that of HSW, which was shown in Figure 4: neither the starch granules nor the cell walls can be identified in Figure 5a. No microspheres, characteristic of secondary hydrochar formation in the liquid phase during hydrothermal treatments, can either be seen. The latter is attributed to the conditions of the hydrothermal treatment carried out: relatively low water amount, temperature, and residence time. The individual particles within the pellet can be distinguished in Figure 5a, which points out mechanical interlock as the main binding mechanism of the pellet.
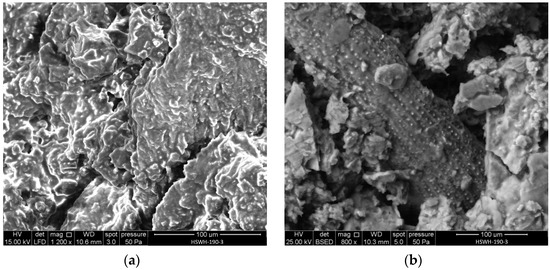
Figure 5.
SEM micrographs of HSWH-190-3: (a) general view of the pellet surface; (b) detail of silicophytolith accumulation.
The EDX analysis of HSWH-190-3 shows a carbon content of 59.82 wt.% and an oxygen content of 38.44 wt.%, with lesser amounts of potassium (0.95 wt.%), phosphorus (0.54 wt.%), and silicon (0.25 wt.%), although the actual figures can vary slightly with location due to the varying composition of the different parts of the body of the tiger nuts. As an example, Figure 5b shows the regular accumulation of silicophytoliths in the intercellular spaces of elongated particles that were randomly found in the carbons derived from HSW. The hydrothermal treatment led to a slight decrease in the O/C atomic ratio, from 0.54 in HSW to 0.48 in HSW-190-3, pointing out a small degree of carbonization.
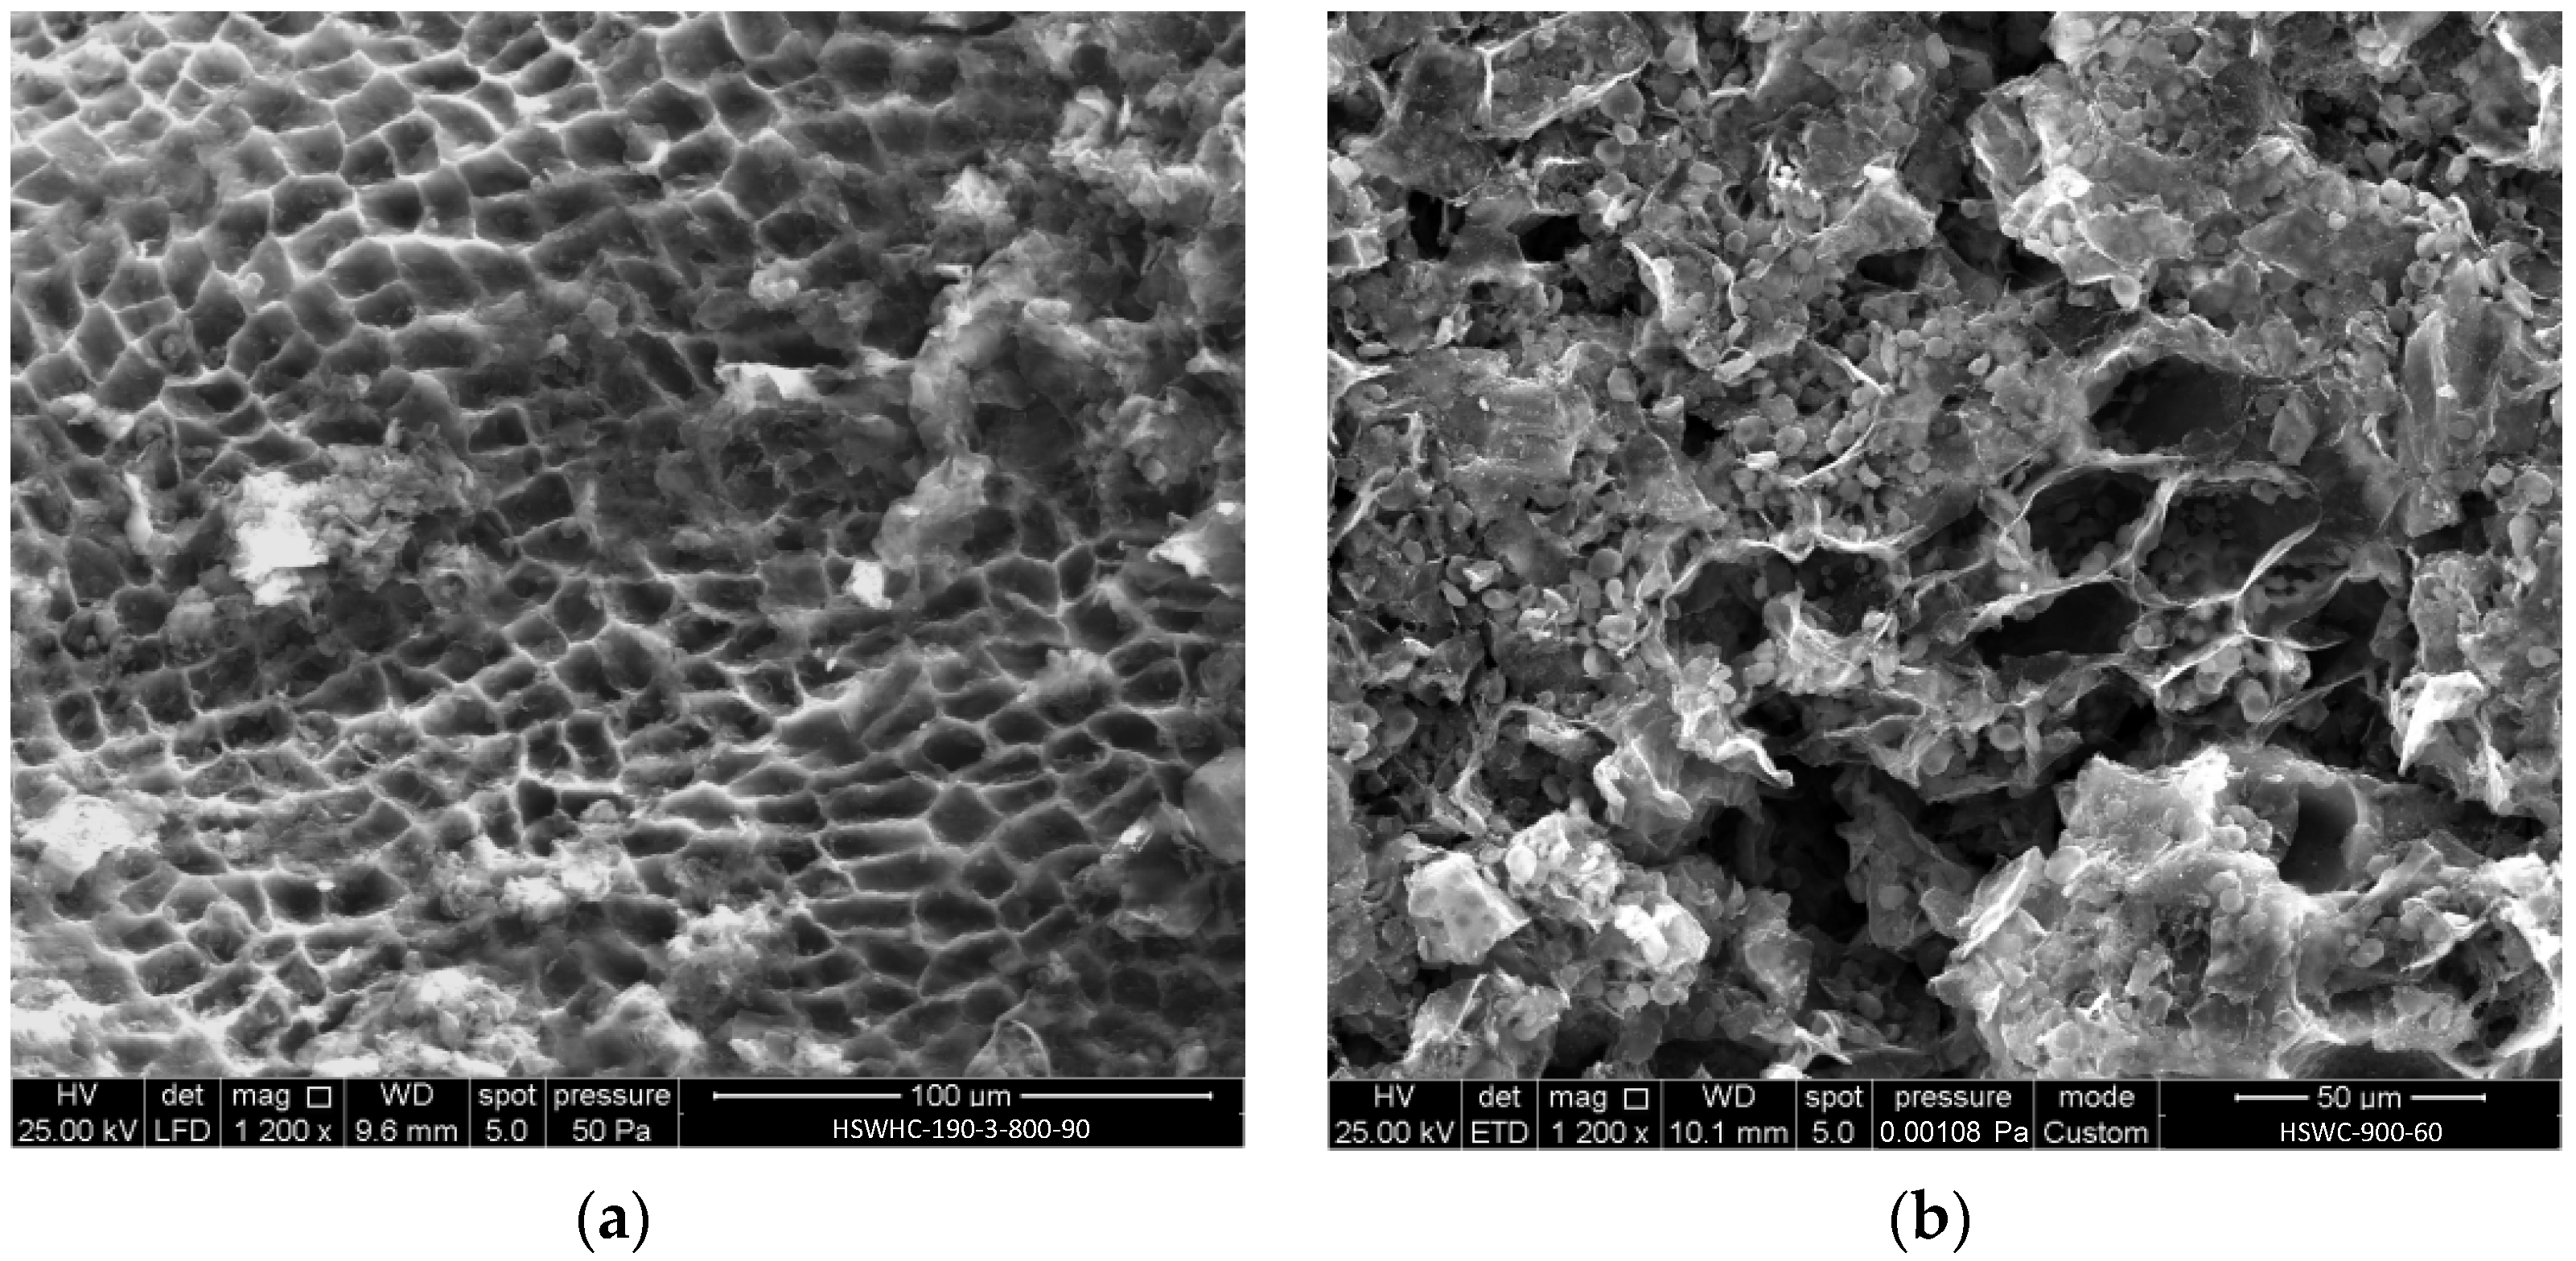
Figure 6a shows the SEM micrograph of HSWHC-190-3-800-90. The cell walls, which were clearly distinguished in HSW (Figure 4), but not in HSWH-190-3 (Figure 5), can be again observed in HSWHC-190-3-800-90 (Figure 6a). This is attributed to the release of volatiles during the activation of HSWH-190-3. The insoluble fraction of HSW has been carbonized, preserving its original microstructure, which is different throughout the body of the tiger nut.
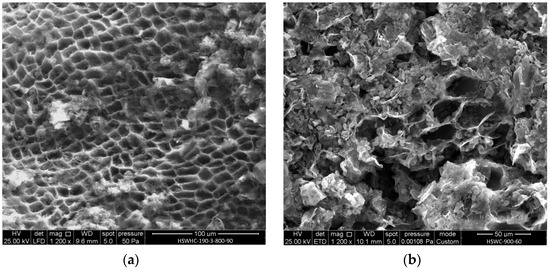
Figure 6.
SEM micrographs of: (a) HSWHC-190-3-800-90; (b) HSWC-900-60.
The EDX analysis showed that HSWHC-190-3-800-90 is mainly composed of carbon (87.8 wt.%), followed by oxygen (7.21 wt.%) and lesser amounts of potassium (1.54 wt.%), calcium (1.24 wt.%), phosphorus (0.88 wt.%), magnesium (0.64 wt.%), silicon (0.60 wt.%), and aluminum (0.10 wt.%). Activation at 800 °C leads to a significant reduction in the O/C atomic ratio, from 0.48 to 0.06, pointing out the high degree of carbonization achieved.
For comparison purposes, Figure 6b shows the SEM micrograph of a carbon obtained in a thermogravimetric analyzer (TGA92, SETARAM) by subjecting HSW to a heating rate of 15 °C min−1 in CO2 flow up to 900 °C and holding that temperature for 60 min (HSWC-900-60). The main difference between Figure 6a and Figure 6b is the presence of carbonized starch granules within the cell compartments in Figure 6b and their absence in Figure 6a. Cellulose and lignin, which are the main constituents of the cell walls, are stable up to 210 °C and 260 °C, respectively, under hydrothermal conditions [23]. On the other hand, starch undergoes dehydration reactions during hydrothermal carbonization at 180 °C [51]. When starch is heated in excess water above the gelatinization temperature, its crystalline structure is disintegrated. Hemicellulose also reacts and dissolves in water much more readily than cellulose at 180 °C. Therefore, only cellulose and lignin in biomass can produce primary hydrochar [23].
Table 2 summarizes the textural characterization of the HSWHC carbons. It can be observed that the narrow micropore volume increases with the temperature of the hydrothermal treatment. The narrow micropore volume of these carbons is larger than that of a reference commercial carbon, Norit R 2030 CO2, which is used for the adsorption of CO2 in cold warehouses and which was included in Table 2 for comparison purposes. The average size of the narrow micropores of HSWHC carbons lies within 0.55–0.58 nm.

Table 2.
Textural characterization of the samples.
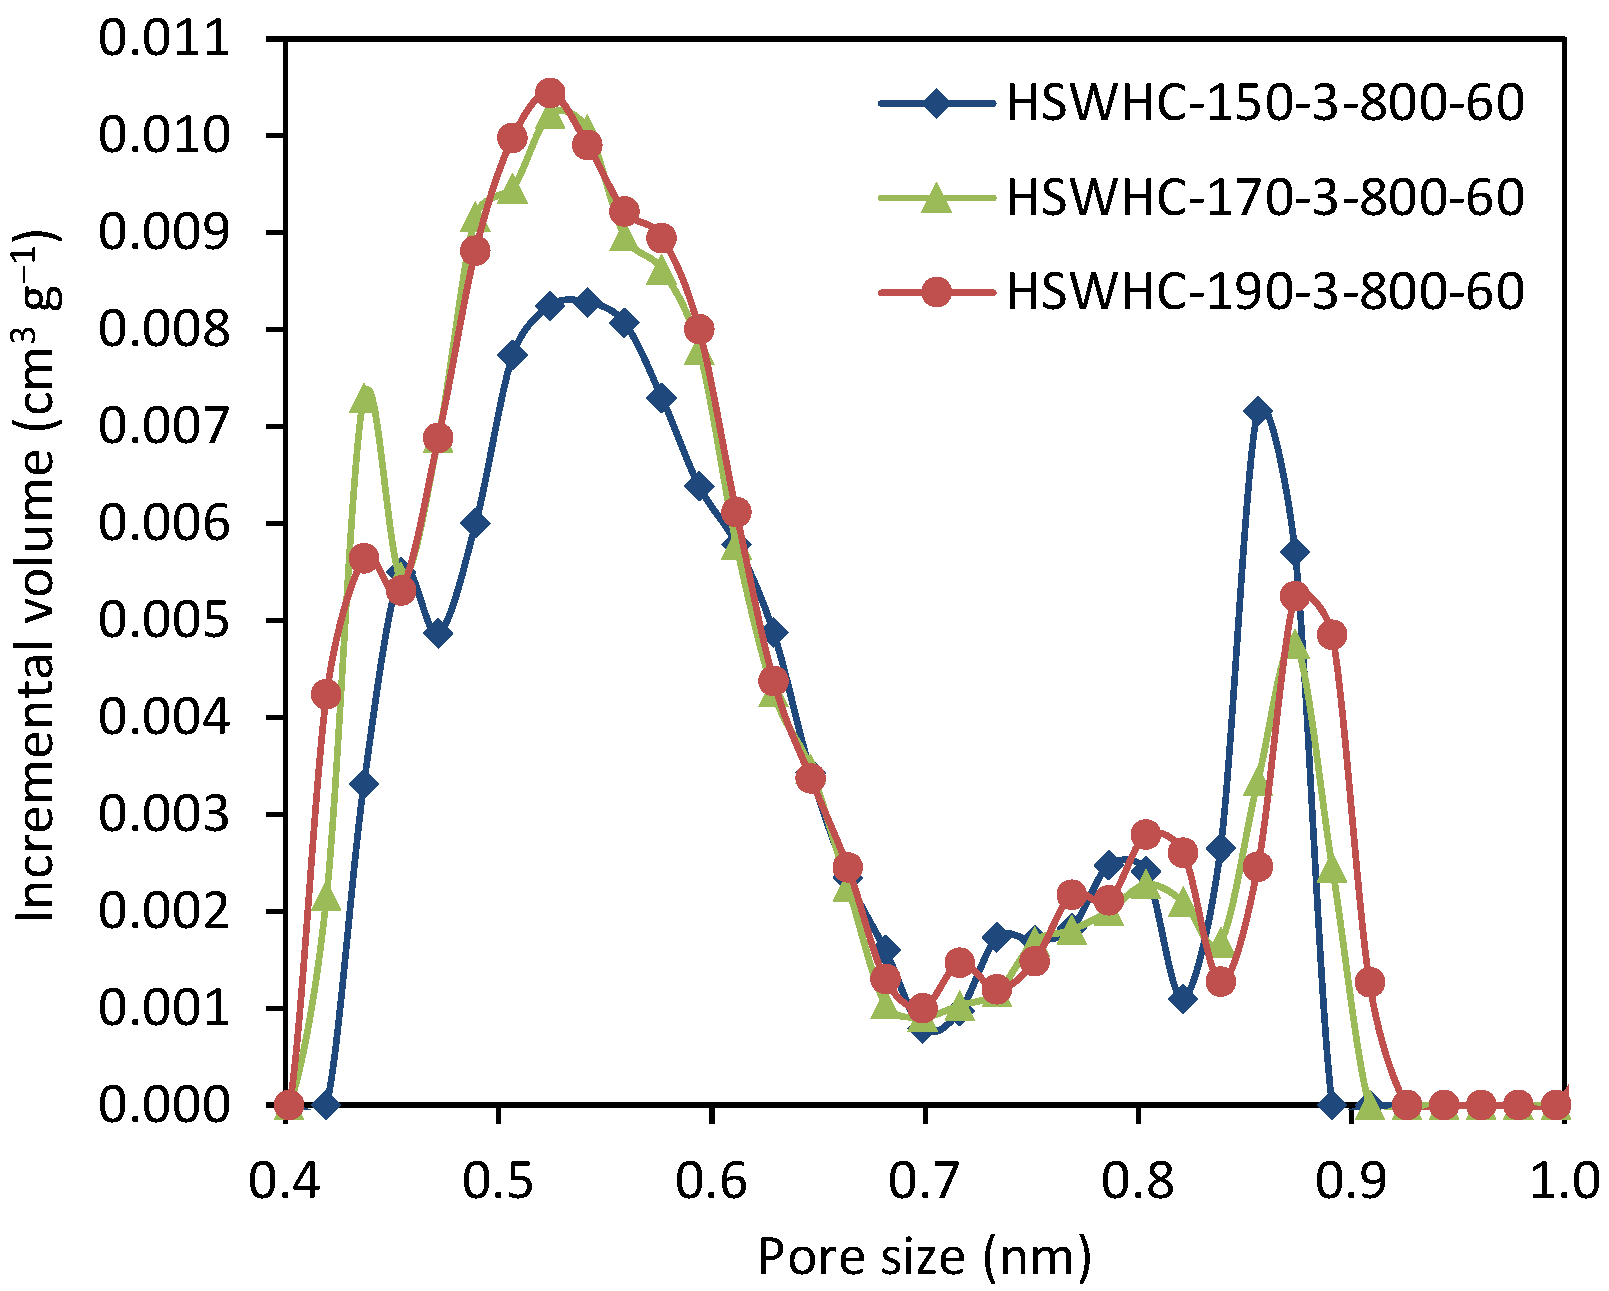
Figure 7 shows the NMPSD of these carbons. The carbons obtained using 150 °C as the temperature of the hydrothermal treatment, present a lower volume of micropores between 0.4 and 0.6 nm, and a slightly higher volume of micropores of ca. 0.85 nm, compared to the carbons developed at 170 and 190 °C. HSWHC-170-3-800-60 and HSWHC-190-3-800-60 have a similar NMPSD, with subtle differences at 0.44 and 0.9 nm.
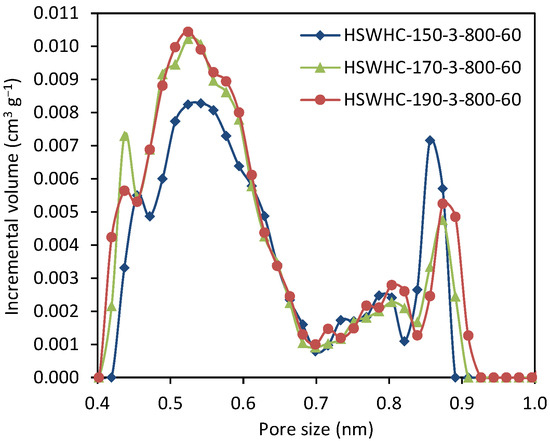
Figure 7.
Narrow micropore size distribution of samples HSWHC-150-3-800-60, HSWHC-170-3-800-60, and HSWHC-190-3-800-60.
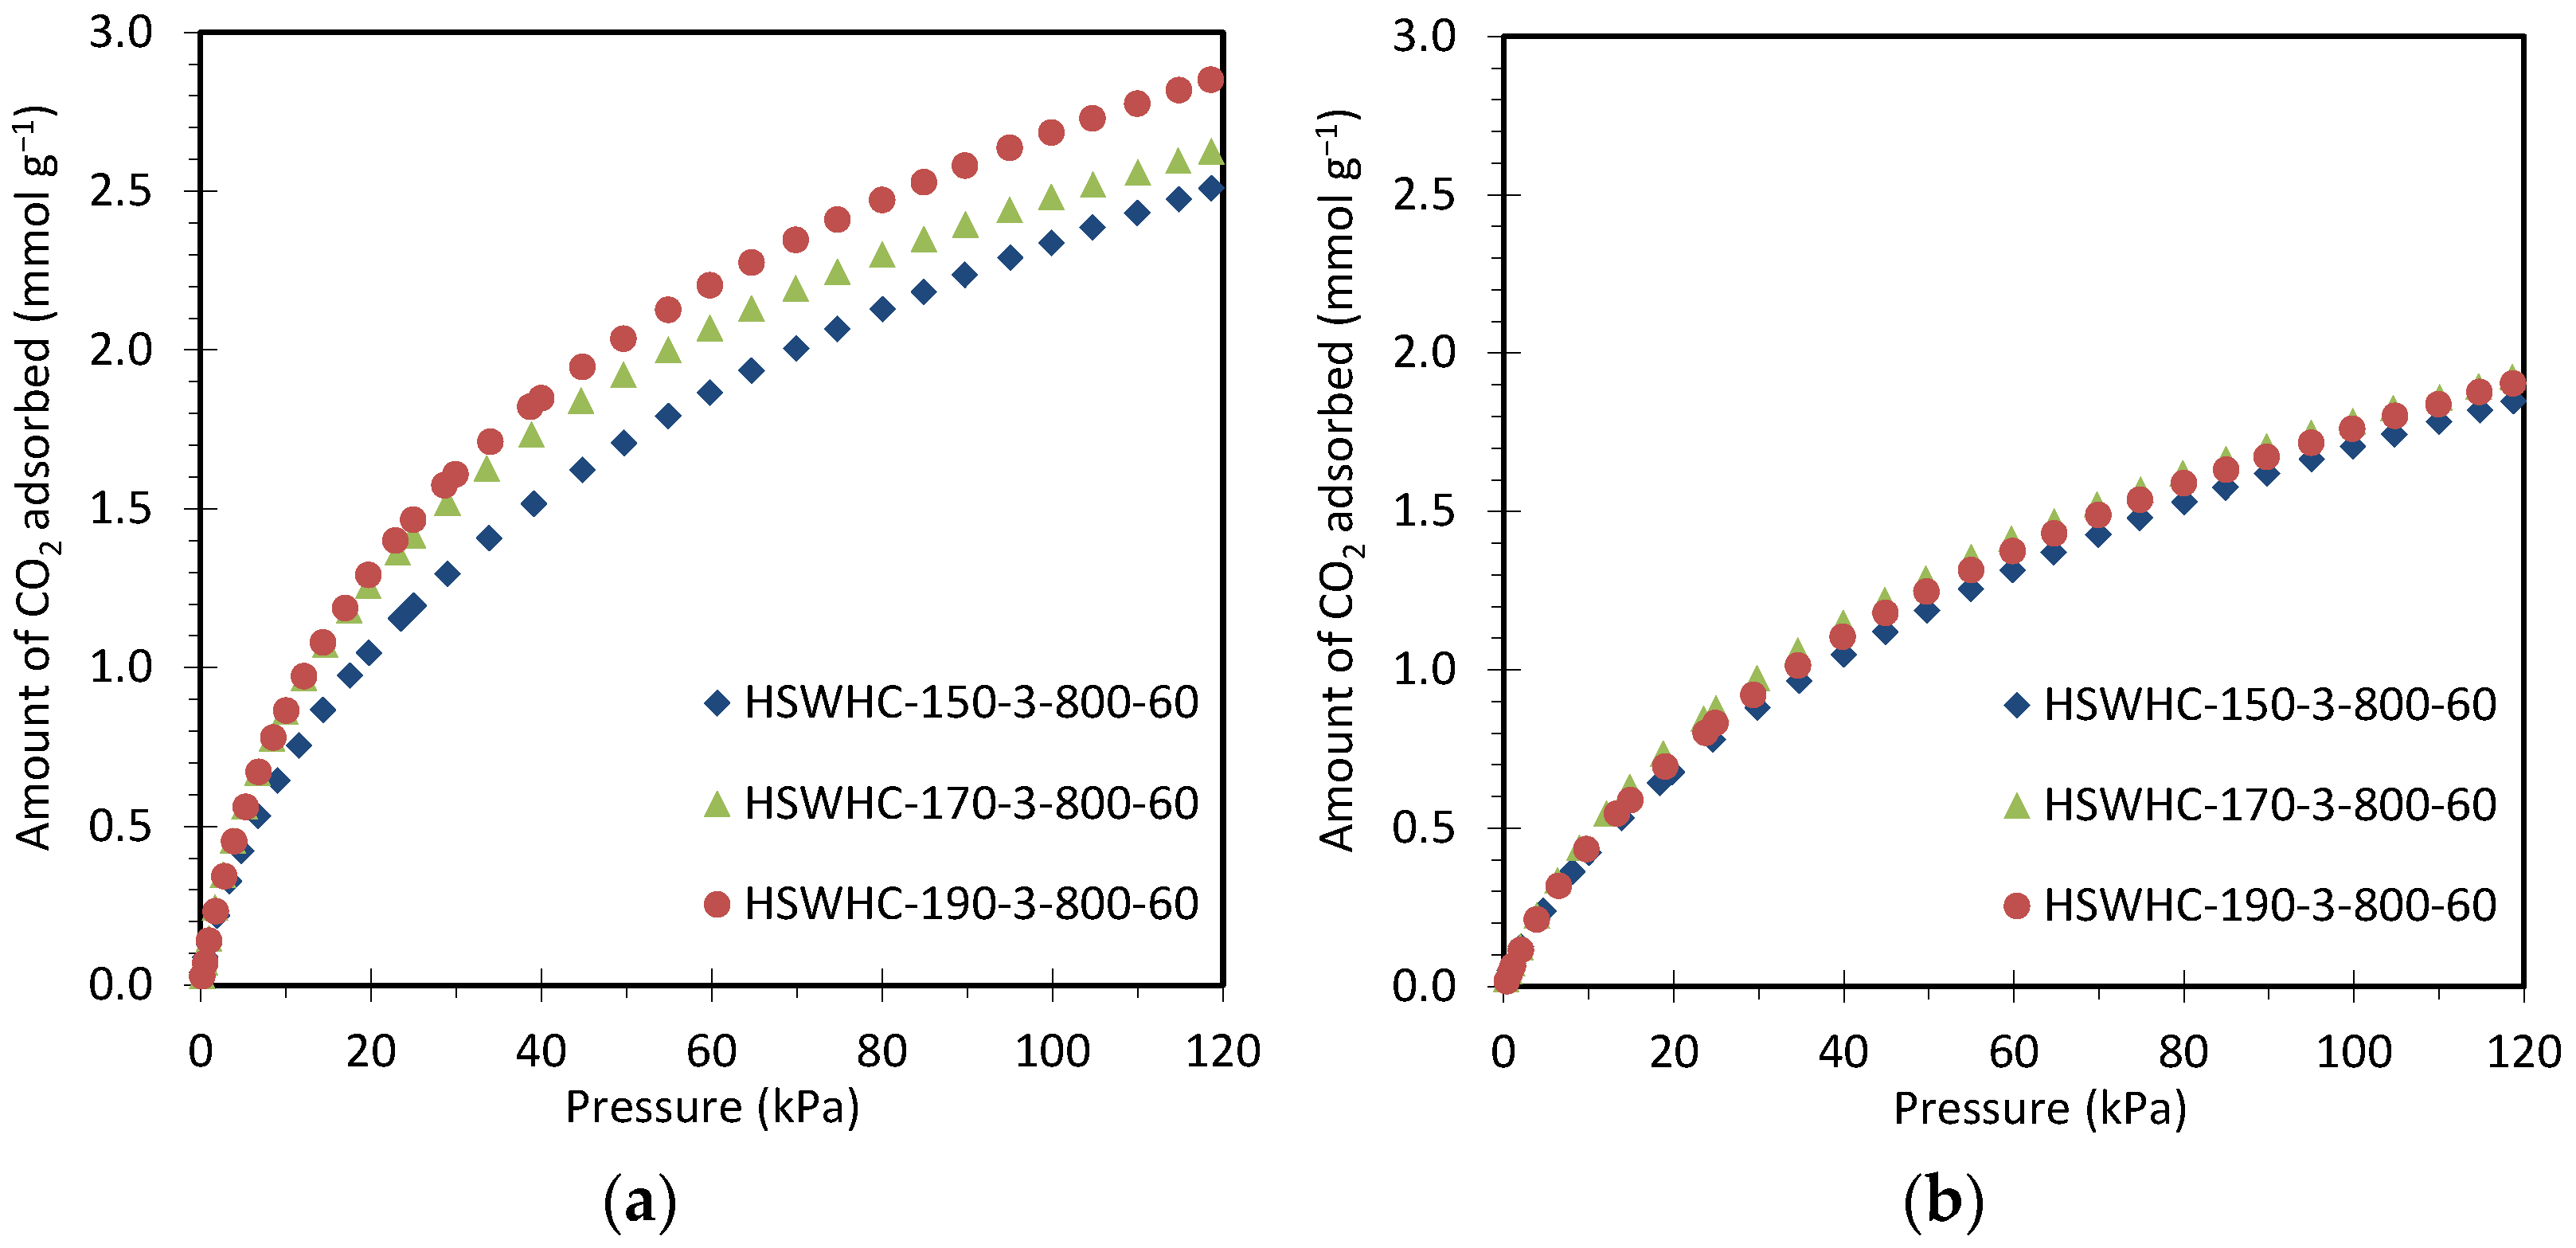
Figure 8 compares the CO2 adsorption isotherms at 25 °C and 50 °C of carbons HSWHC-150-3-800-60, HSWHC-170-3-800-60, and HSWHC-190-3-800-60. It can be observed that the CO2 adsorption capacity increases slightly with the temperature of the hydrothermal treatment, which is attributed to the formation of a higher volume of narrow micropores between 0.4 and 0.6 nm.
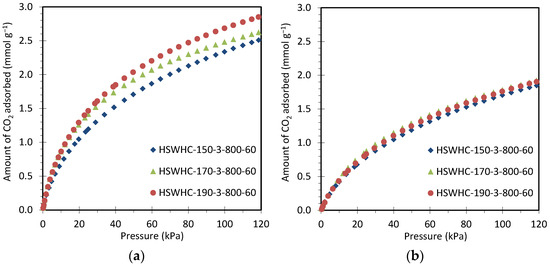
Figure 8.
CO2 adsorption isotherms of carbons HSWHC-150-3-800-60, HSWHC-170-3-800-60, and HSWHC-190-3-800-60 at: (a) 25 °C; (b) 50 °C.
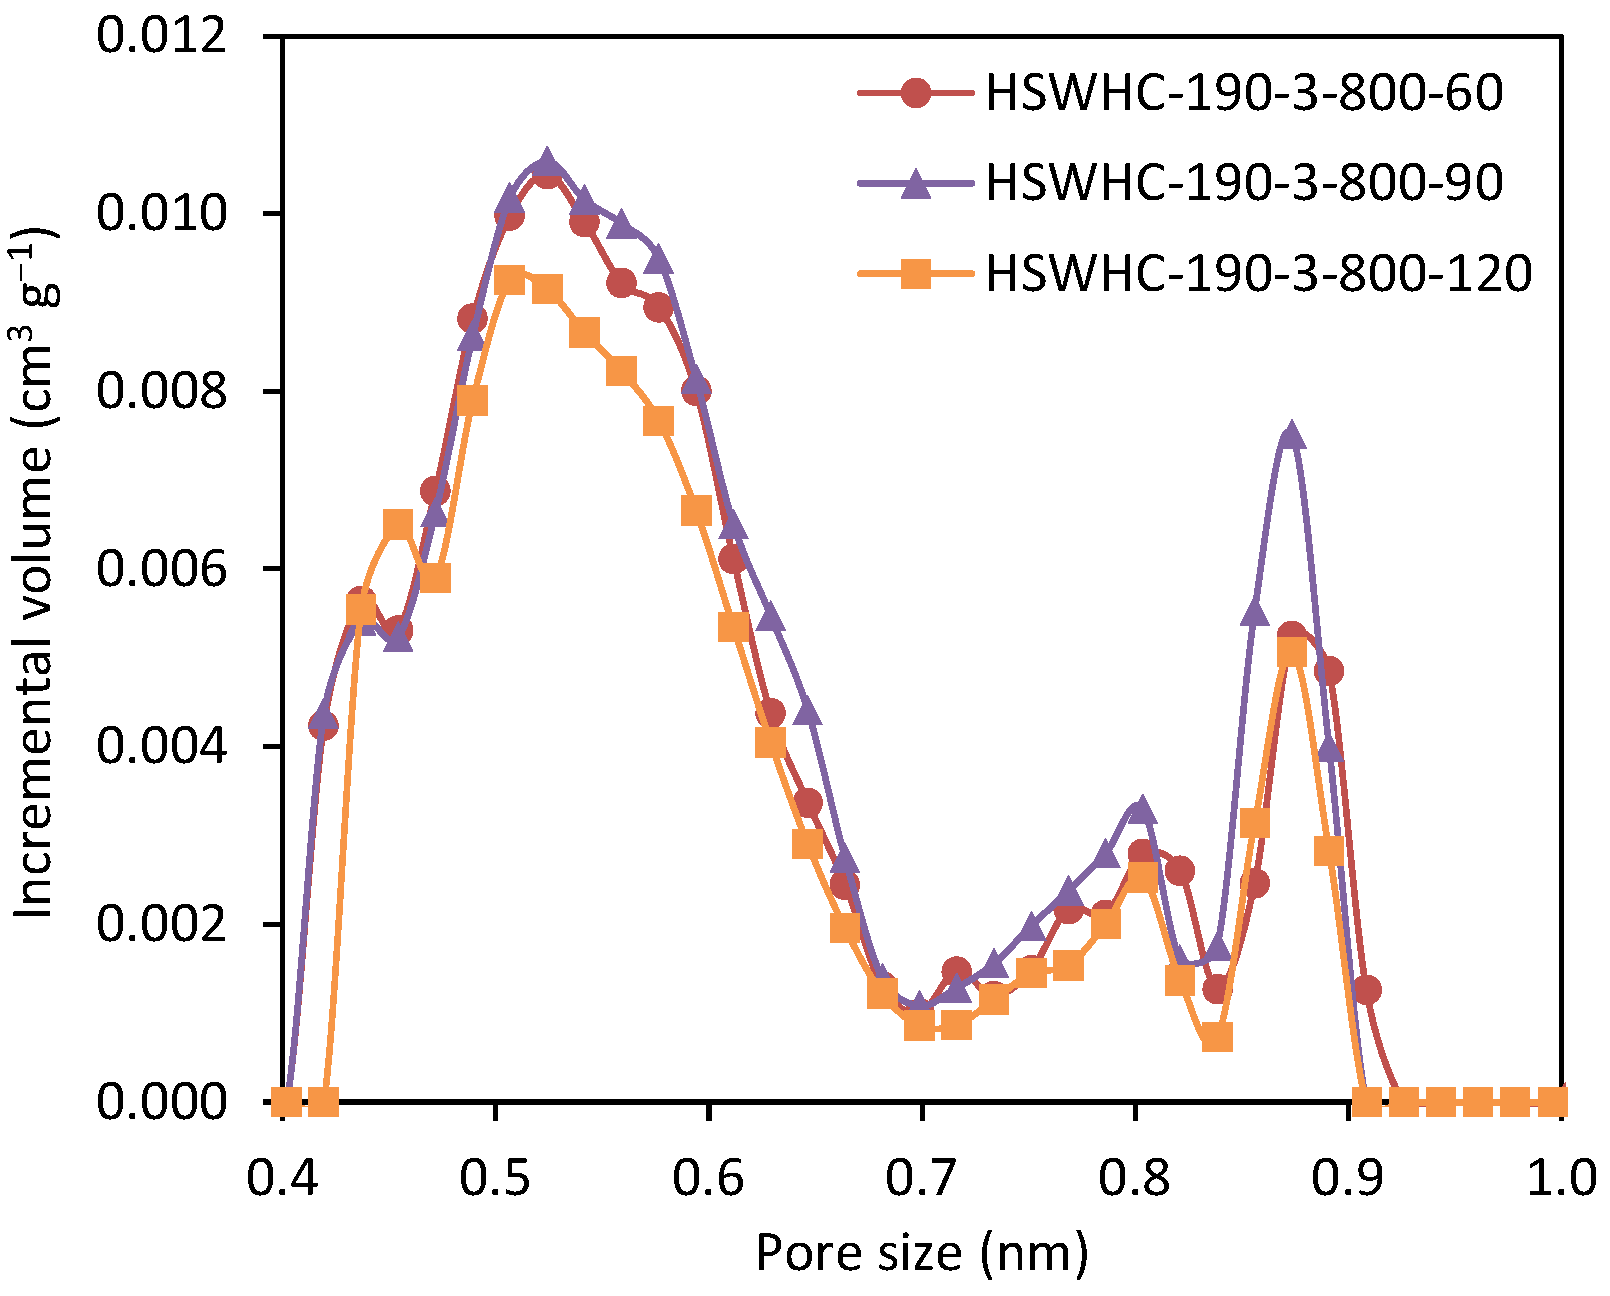
The effect of the activation time on the CO2 adsorption capacity was evaluated by preparing a series of carbons at the hydrothermal temperature of 190 °C and at an activation temperature of 800 °C. As shown in Table 2, the narrow micropore volume reaches a maximum at 90 min and decreases afterwards, due to the collapse of the adjacent micropore walls that occurs at high activation degrees. The corresponding NMPSD is shown in Figure 9.
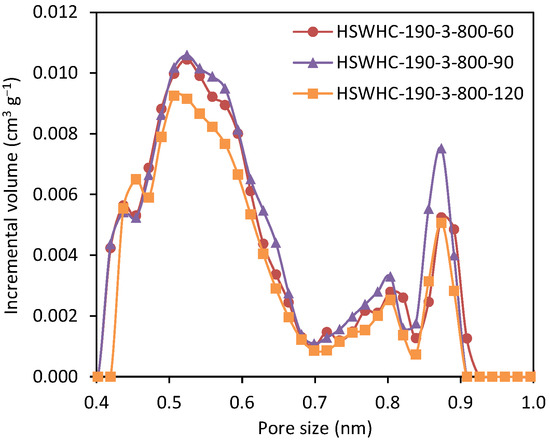
Figure 9.
Narrow micropore size distribution of carbons HSWHC-190-3-800-60, HSWHC-190-3-800-90, and HSWHC-190-3-800-120.
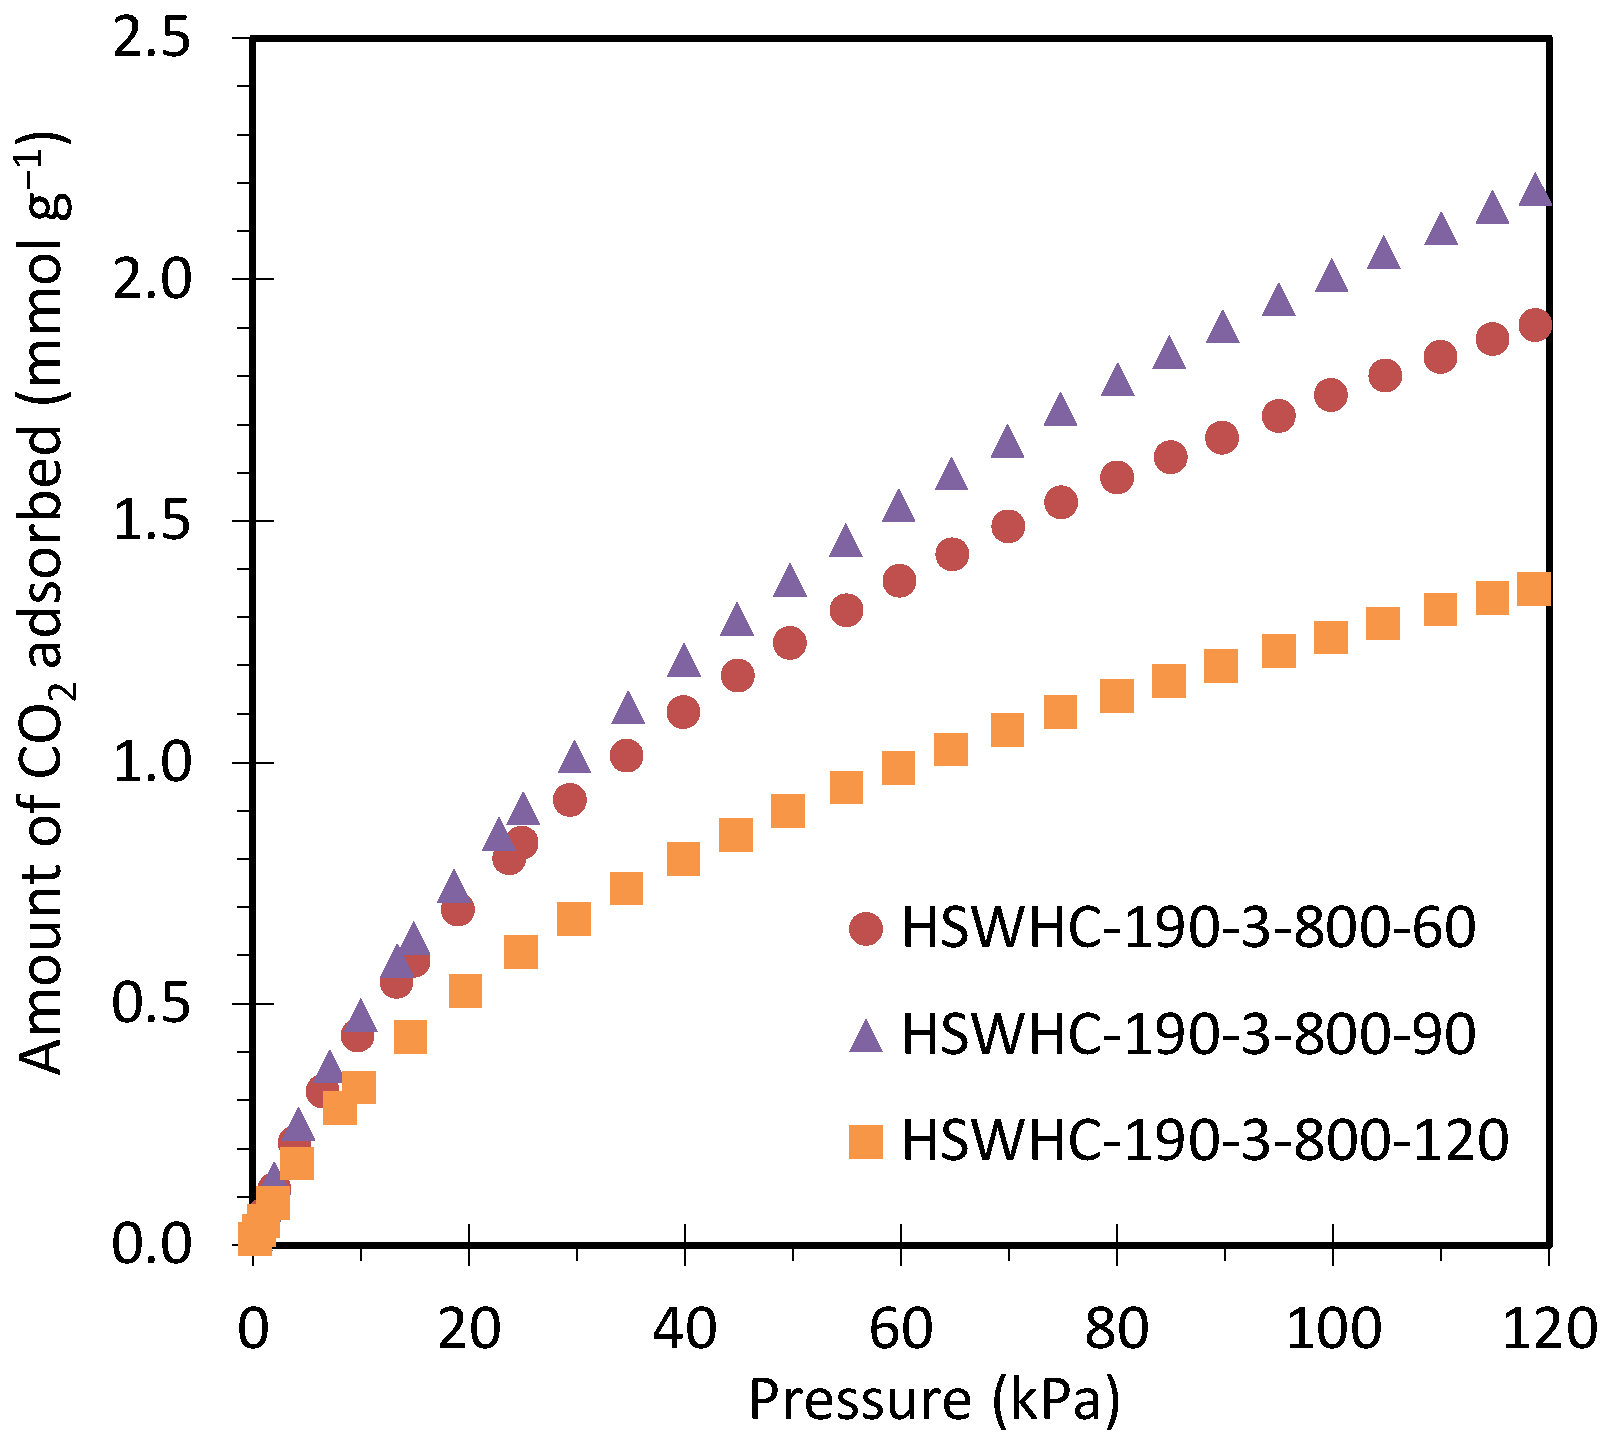
Figure 10 shows the CO2 adsorption isotherms at 50 °C of carbons HSWHC-190-3-800-60, HSWHC-190-3-800-90, and HSWHC-190-3-800-120. It can be seen that the adsorption capacity of CO2 reaches a maximum at an activation time of 90 min.
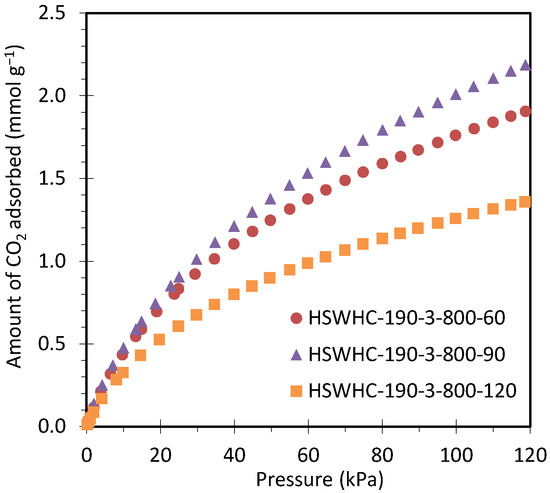
Figure 10.
CO2 adsorption isotherms at 50 °C of carbons HSWHC-190-3-800-60, HSWHC-190-3-800-90, and HSWHC-190-3-800-120.
Table 3 shows a summary of the CO2 adsorption capacity of the synthesized carbons, together with that of two commercial activated carbons, BPL and Norit R 2030 CO2, and several biomass-based carbon adsorbents: PPC, developed from spent coffee grounds by one-pot activation with CO2 [52], NCLK3, developed from spent coffee grounds by carbonization followed by KOH activation [53], AC and AC-KOH, developed from black locust by carbonization followed by steam and KOH activation, respectively [54], O-3-650-110 and A-3-650-83, developed from almond shells and olive stones, respectively, by one-pot oxidation [55], AS and OS, developed from almond shells and olive stones, respectively, by one-pot activation with CO2 [56], CGUC-0.5-6, developed from a mixture of cactus and glucose by the in situ ionic activation route [26], that have been included for comparative purposes. The CO2 adsorption capacity provided in Table 3 is given at 15 kPa as this is considered a representative partial pressure of CO2 for postcombustion applications. Two temperatures are included: 25 and 50 °C. These temperatures are considered to include the operating range of a postcombustion adsorption unit, given that this would be located after the desulfurization unit (desulfurized flue gas temperature is approximately 47 °C) and that the flue gas can be further cooled to ca. 31 °C by making use of cooling water to improve the performance of the adsorption-based capture unit [57]. Comparison with literature data is not straightforward, as many studies still provide the CO2 adsorption capacity solely at 1 bar [22] or do not specify the adsorption pressure [39]. It is relevant to highlight that an adsorbent with a large pore volume but with a wider pore size will have a higher adsorption capacity at high pressure but lower adsorption capacity at the low pressures relevant for the postcombustion case.

Table 3.
Comparison of the CO2 adsorption capacity of the carbons developed in this work, with that of two commercial activated carbons and several biomass-based carbons.
Among the HSWHC series, HSWHC-190-3-800-90 presents the highest adsorption capacity of CO2 in the entire temperature and pressure range evaluated. As can be seen from the table, it has a relatively large adsorption capacity for a carbon adsorbent, higher than the reference commercial activated carbons BPL and Norit R 2030 CO2. HSWHC-190-3-800-90 presents a CO2 adsorption capacity at 15 kPa in the 25–50 °C range, relatively close that of PPC, AS, and OS that have been obtained from different biomass residues by one-pot activation with CO2. This capacity is substantially above than that of AC, obtained by carbonization followed by steam activation.
3.3. In Situ Ionic Activation
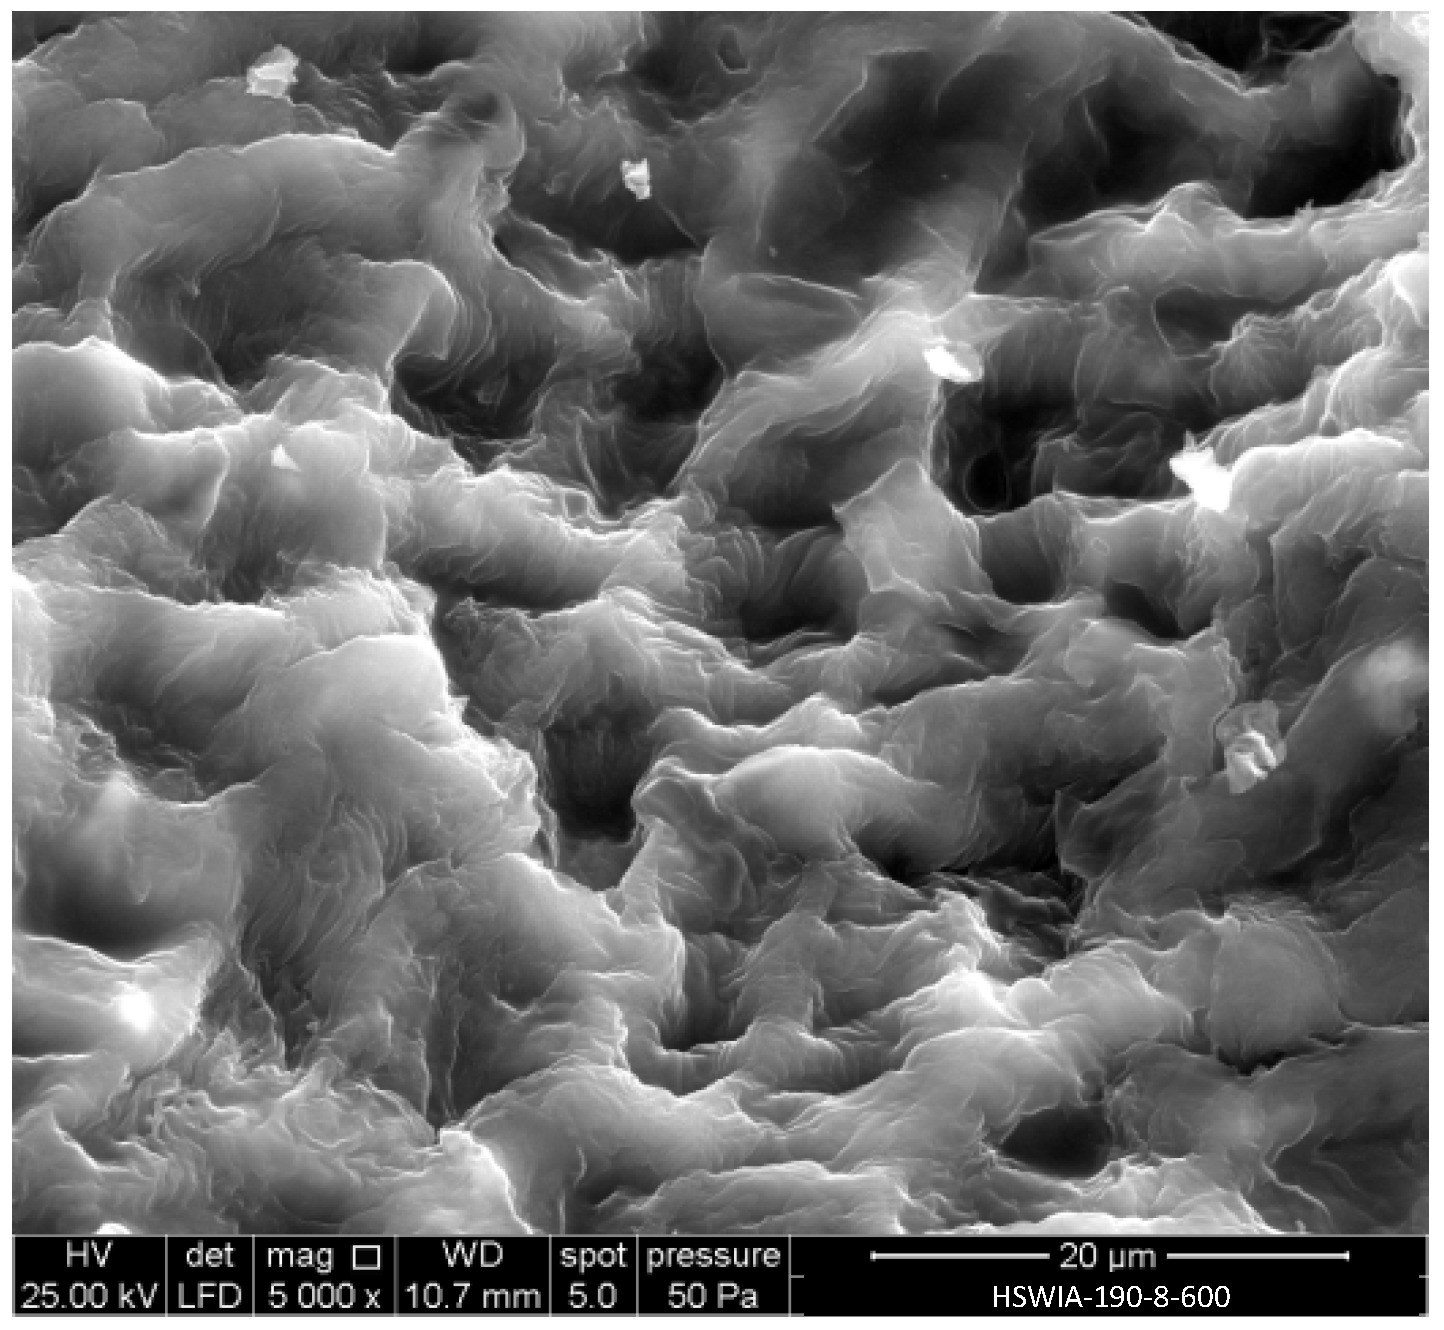
Figure 11 shows a SEM micrograph of HSWIA-190-8-600. The cell compartments of the raw HSW, shown in Figure 4, can still be identified in Figure 11, although the walls have a swollen appearance and a less smooth surface compared to those of HSWHC-190-3-800-90, shown in Figure 6a.
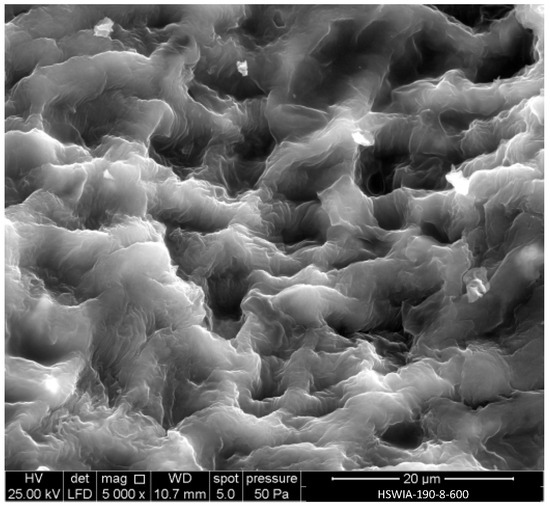
Figure 11.
SEM micrograph of carbon HSWIA-190-8-600.
EDX analysis showed that the main constituent of HSWIA-190-8-600 is carbon (84.12 wt.%), followed by oxygen (9.56 wt.%), with lesser amounts of potassium (3.10 wt.%), magnesium (1.87 wt.%), and silicon (1.36 wt.%). The potassium content is only slightly higher than that observed in HSWHC-190-3-800-90, while the magnesium and silicon contents are much higher, which indicates that the potassium added during the hydrothermal treatment in the in situ activation protocol was satisfactorily removed. The O/C atomic ratio of HSWIA-190-8-600, 0.09, is slightly above that of HSWHC-190-3-800-60, which is attributed to the lower temperature of the activation step in the first case.
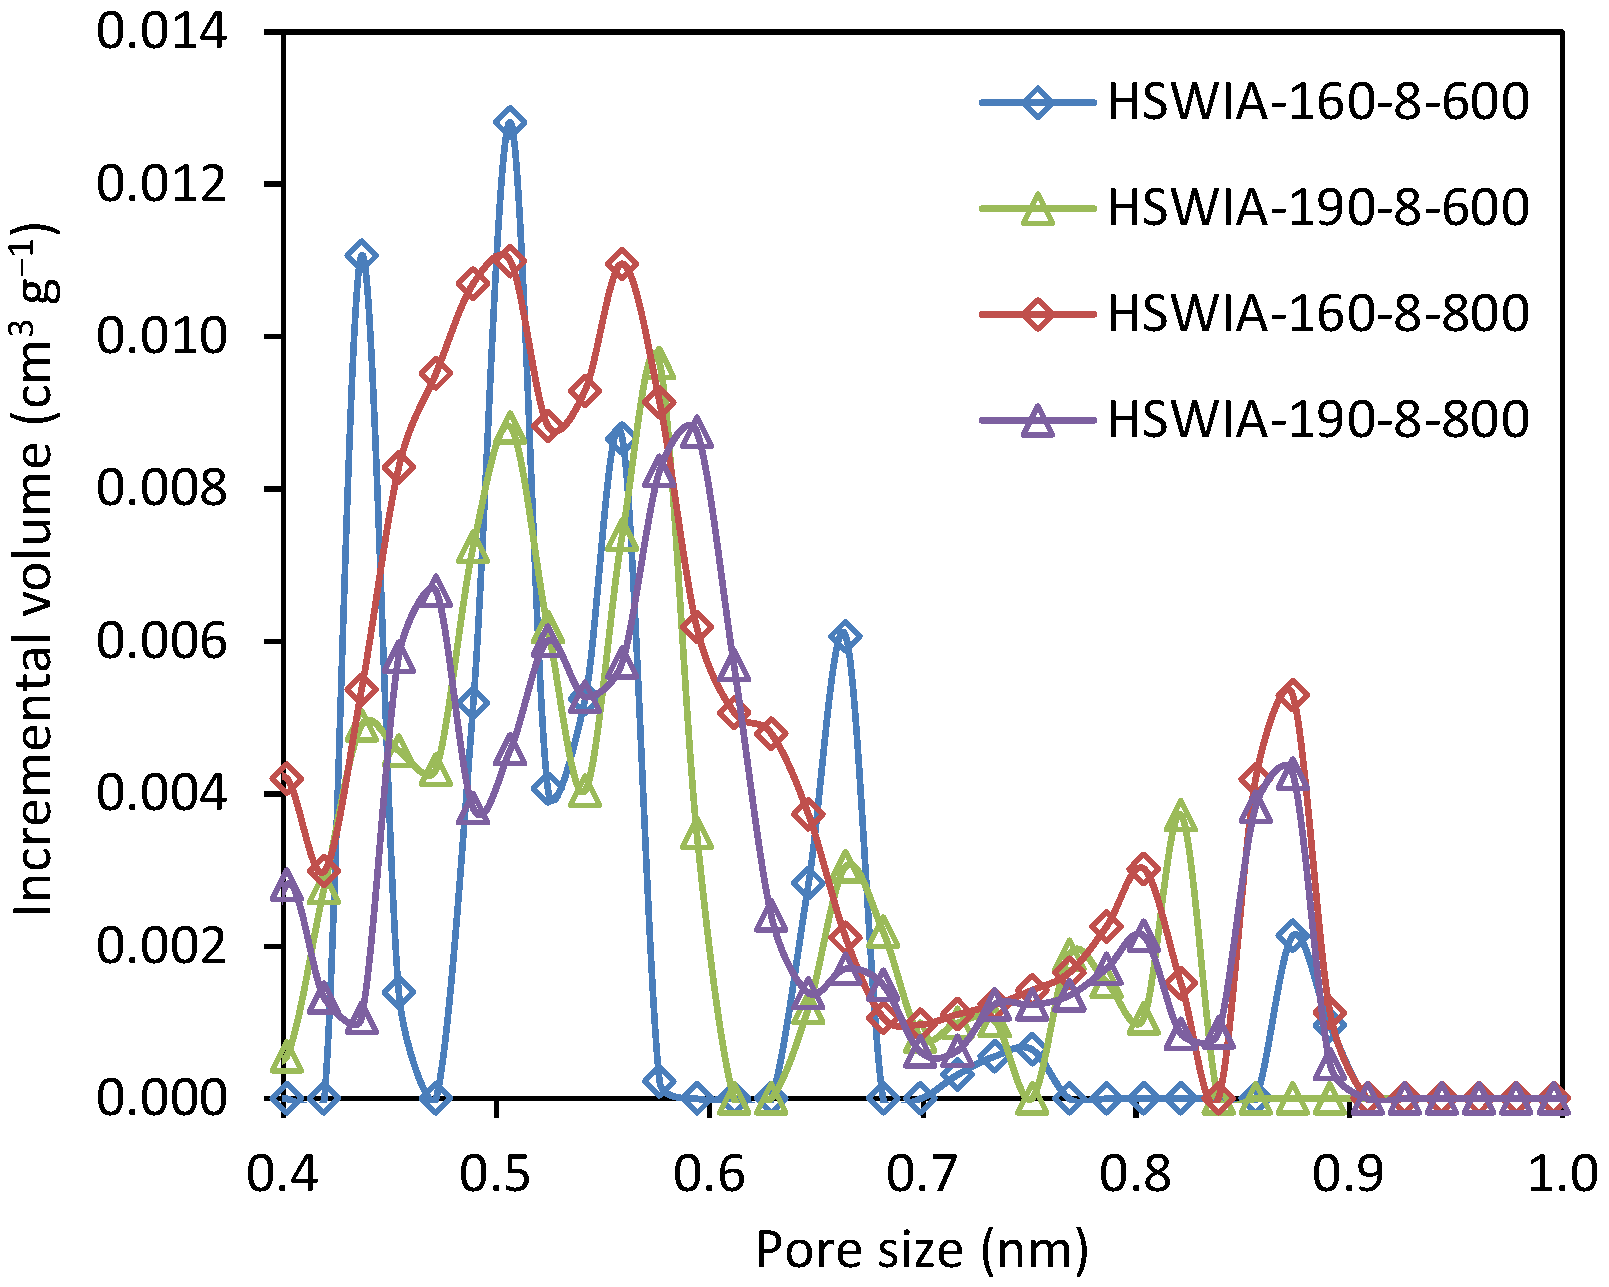
The narrow micropore volumes of HSWIA carbons increase with the activation temperature at a given hydrothermal temperature, as shown in Table 2. The carbon with the highest narrow micropore volume is HSWIA-160-8-800. Moreover, its average ultramicropore width is also the narrowest: 0.54 nm. The NMPSD of HSWIA carbons, shown in Figure 12, indicates that this carbon has a higher volume of micropores between 0.4 and 0.6 nm.
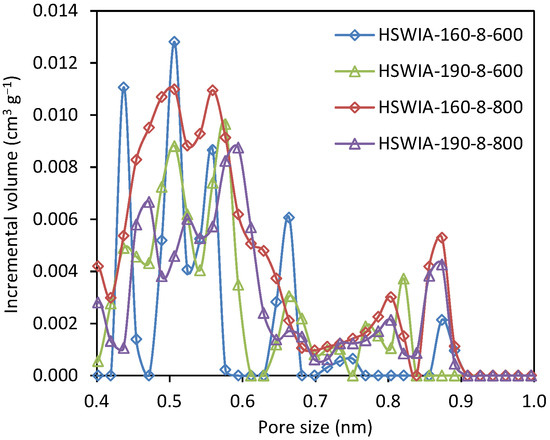
Figure 12.
Narrow micropore size distribution of carbons HSWIA-160-8-600, HSWIA-190-8-600, HSWIA-160-8-800, and HSWIA-190-8-800.
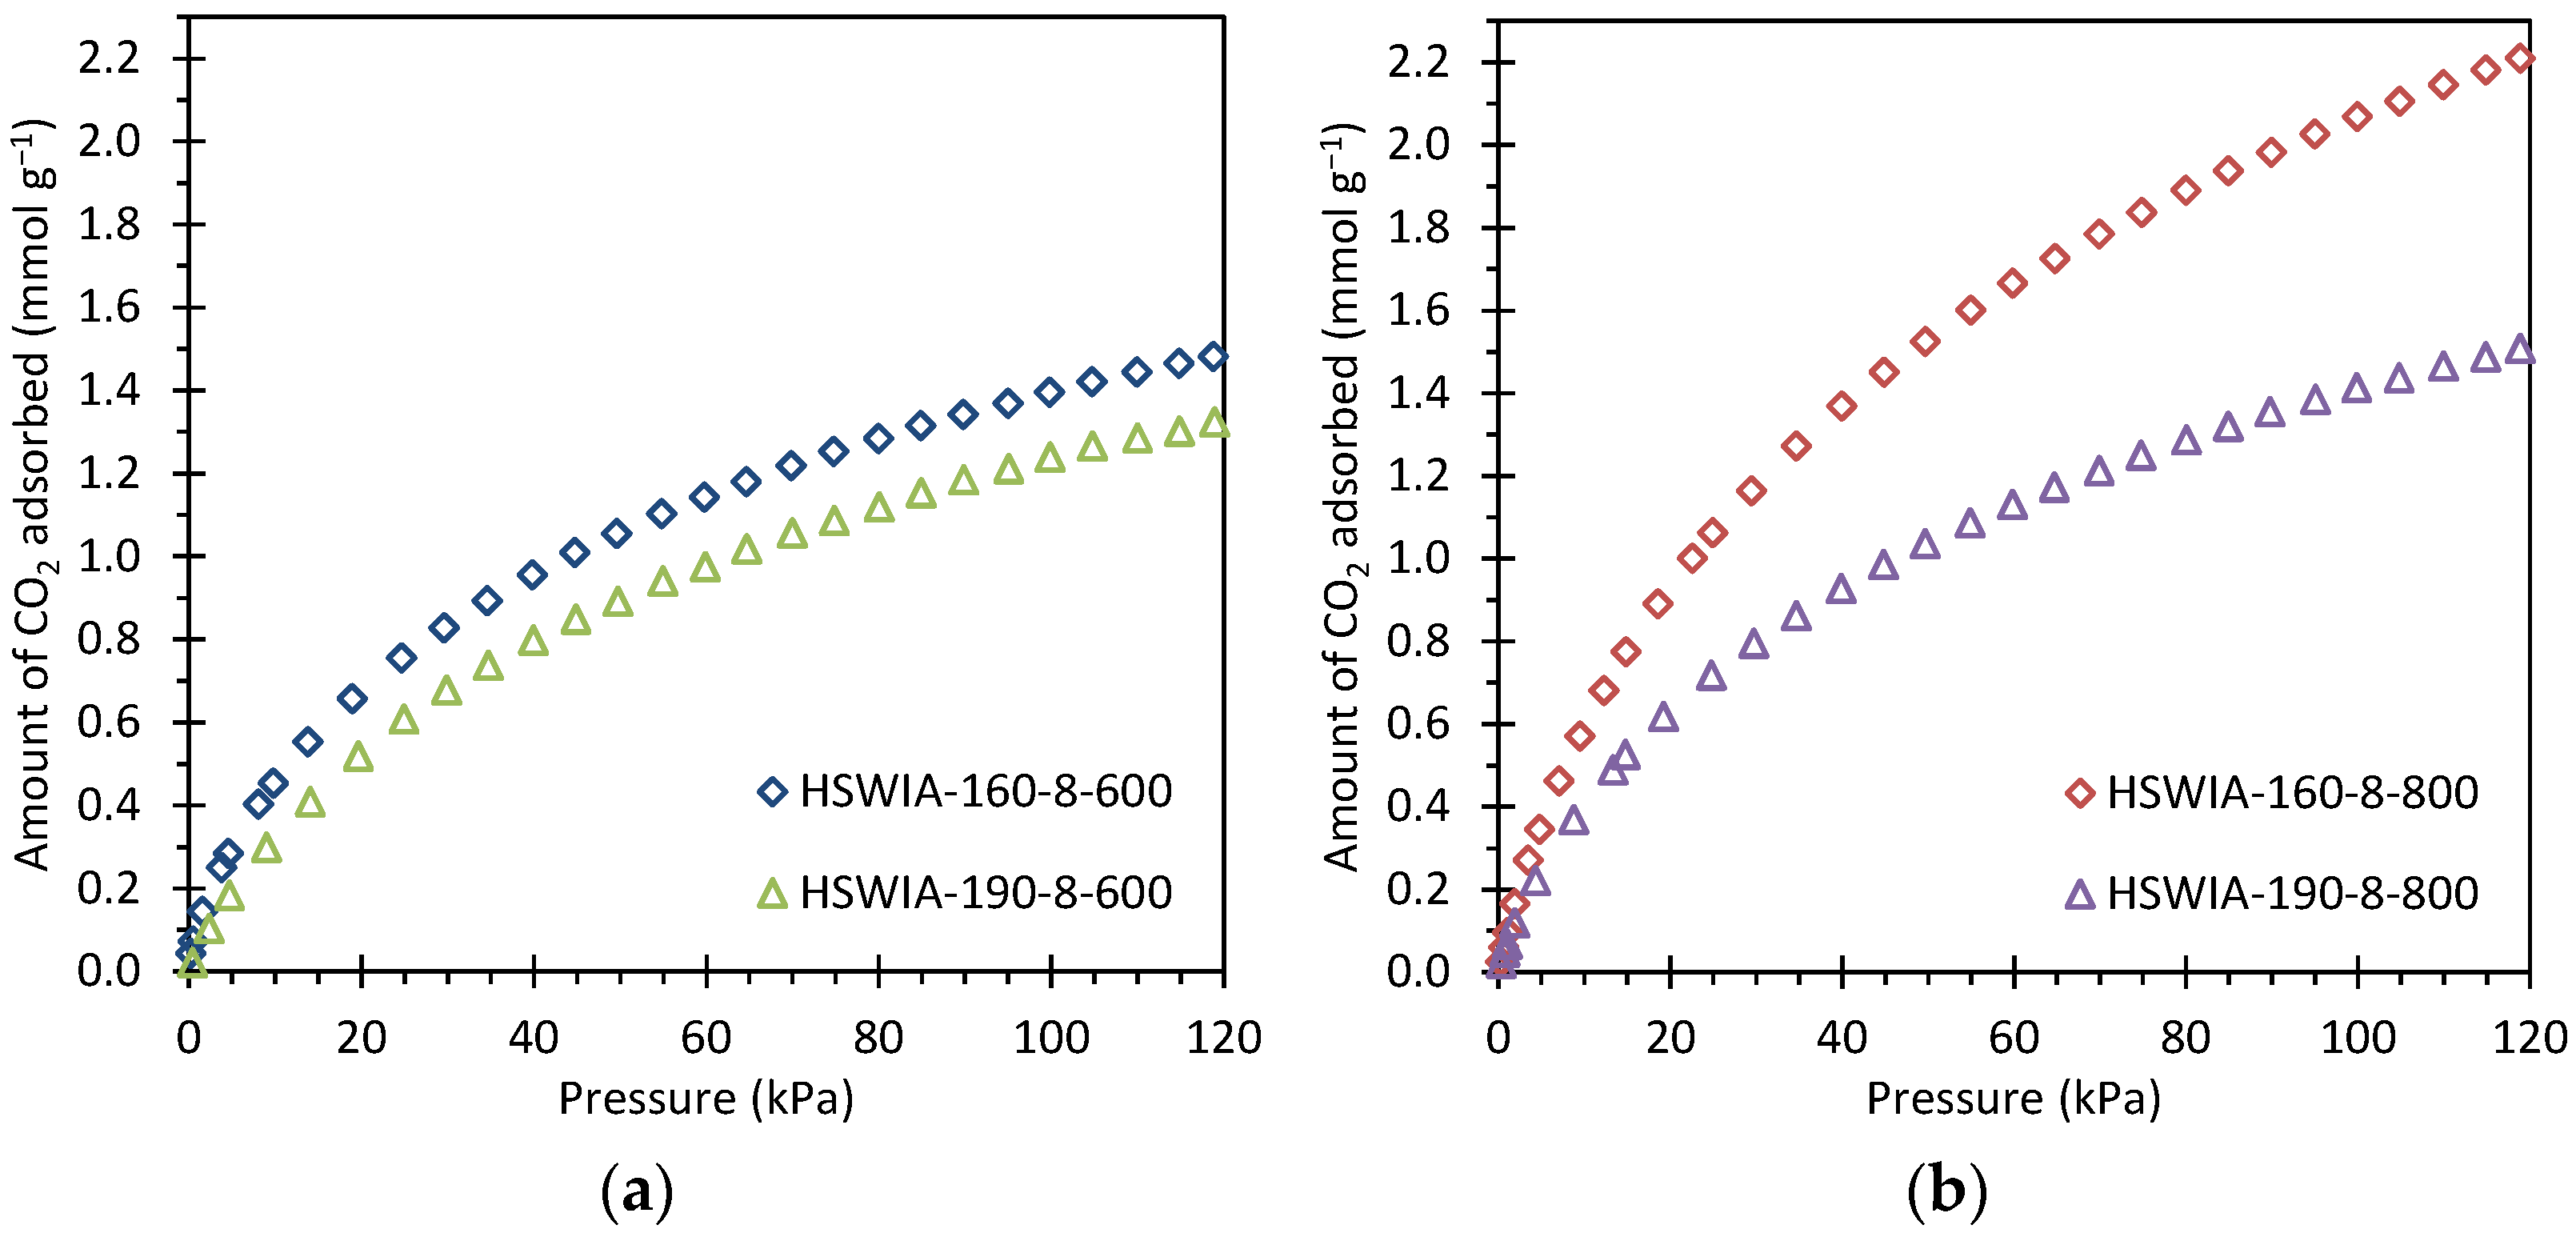
Figure 13 shows the CO2 adsorption isotherms of the HSWIA series at 50 °C. The carbons subjected to a hydrothermal temperature of 160 °C present higher CO2 adsorption capacity than those subjected to a hydrothermal temperature of 190 °C. This trend differs from that observed in the HSWHC carbons. However, it must be noted that there are relevant differences between the synthesis conditions of both series: the hydrothermal treatment carried out in the HSWIA series makes use of KOH, longer residence time, and higher water-to-HSW ratio than that of the HSWHC series. The longer residence time, the higher water-to-HSW ratio, and the presence of KOH are expected to affect the extent of reactions occurring during the hydrothermal treatment. A longer residence time can promote the formation of secondary char in the HSWIA series, although the higher reactant-to-water ratio used in the HSWHC series could have also led to enhanced polymerization at comparatively shorter residence times. In alkaline environments, the acid-catalyzed hydrolysis of cellulose and hemicellulose can be inhibited, whereas lignin can achieve greater conversions [23]. Moreover, the activation process of HSWIA carbons is chemical activation with KOH whereas for HSWHC carbons it is physical activation with CO2. It has been previously reported that the use of a lower temperature in the hydrothermal treatment leads to hydrochars with lower chemical stability and structural order, which in turn are more reactive towards chemical activation with KOH [59]. It can be seen in Table 3 and Figure 11 that the HSWIA carbons activated at 800 °C have superior CO2 adsorption capacity than those activated at 600 °C. This behavior differs from the results obtained when a mixture of glucose and cactus is used as the carbon precursor. In the latter case, the highest CO2 adsorption capacity at 50 °C and 15 kPa was obtained using an activation temperature of 600 °C (see CGUC-0.5-6 in Table 3) [26]. This must be attributed to the different feedstock used, which is known to play a decisive role in the properties of the final carbon [24]. As can be seen from Table 3, the CO2 adsorption capacity of HSWIA-160-8-800 at low pressures is only surpassed by CGUC-0.5-6.
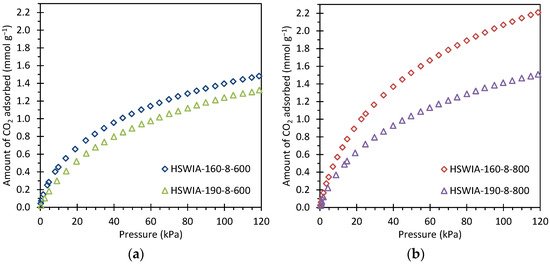
Figure 13.
CO2 adsorption isotherms at 50 °C of HSWIA carbons activated at: (a) 600 °C; (b) 800 °C.
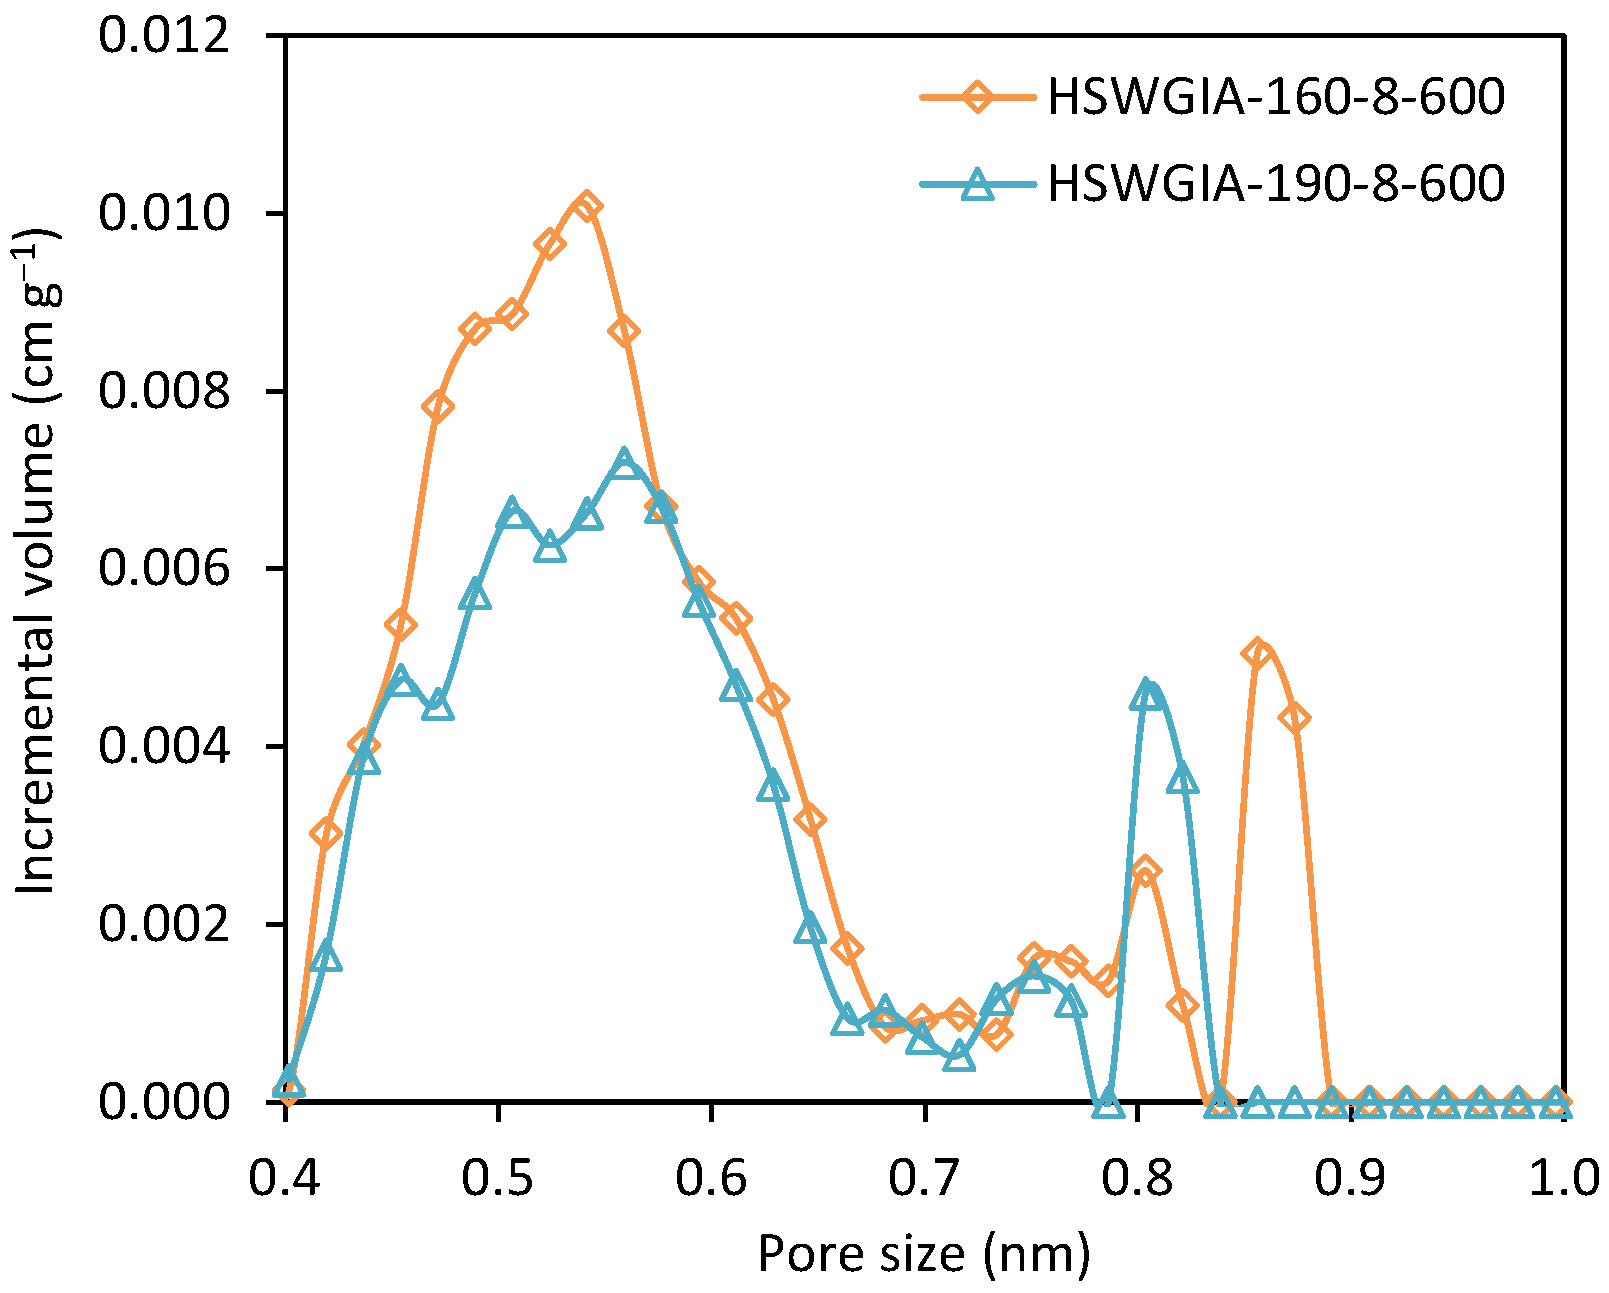
To investigate the effect of glucose addition, two additional carbons were prepared using the in situ ionic activation protocol but departing from an equiweight mixture of HSW and glucose. These were denoted as HSWGIA-160-8-600 and HSWGIA-190-8-600. As shown in Table 2, HSWGIA-160-8-600 shows a slightly higher micropore volume than HSWGIA-190-8-600 with a narrower average pore size. The NMPSDs of these carbons are shown in Figure 14: HSWGIA-160-8-600 has higher micropore volume between 0.45 and 0.58 nm than HSWGIA-190-8-600.
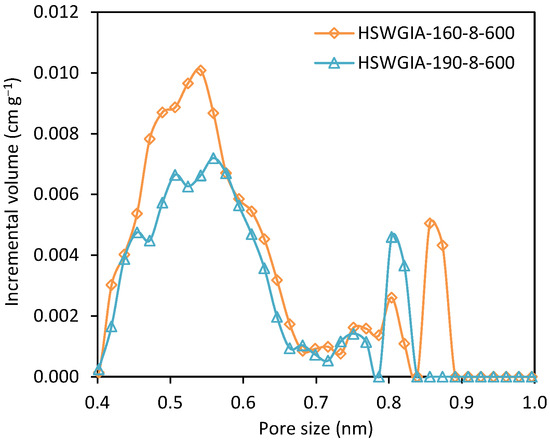
Figure 14.
Narrow micropore size distribution of carbons HSWGIA-160-8-600 and HSWGIA-190-8-600.
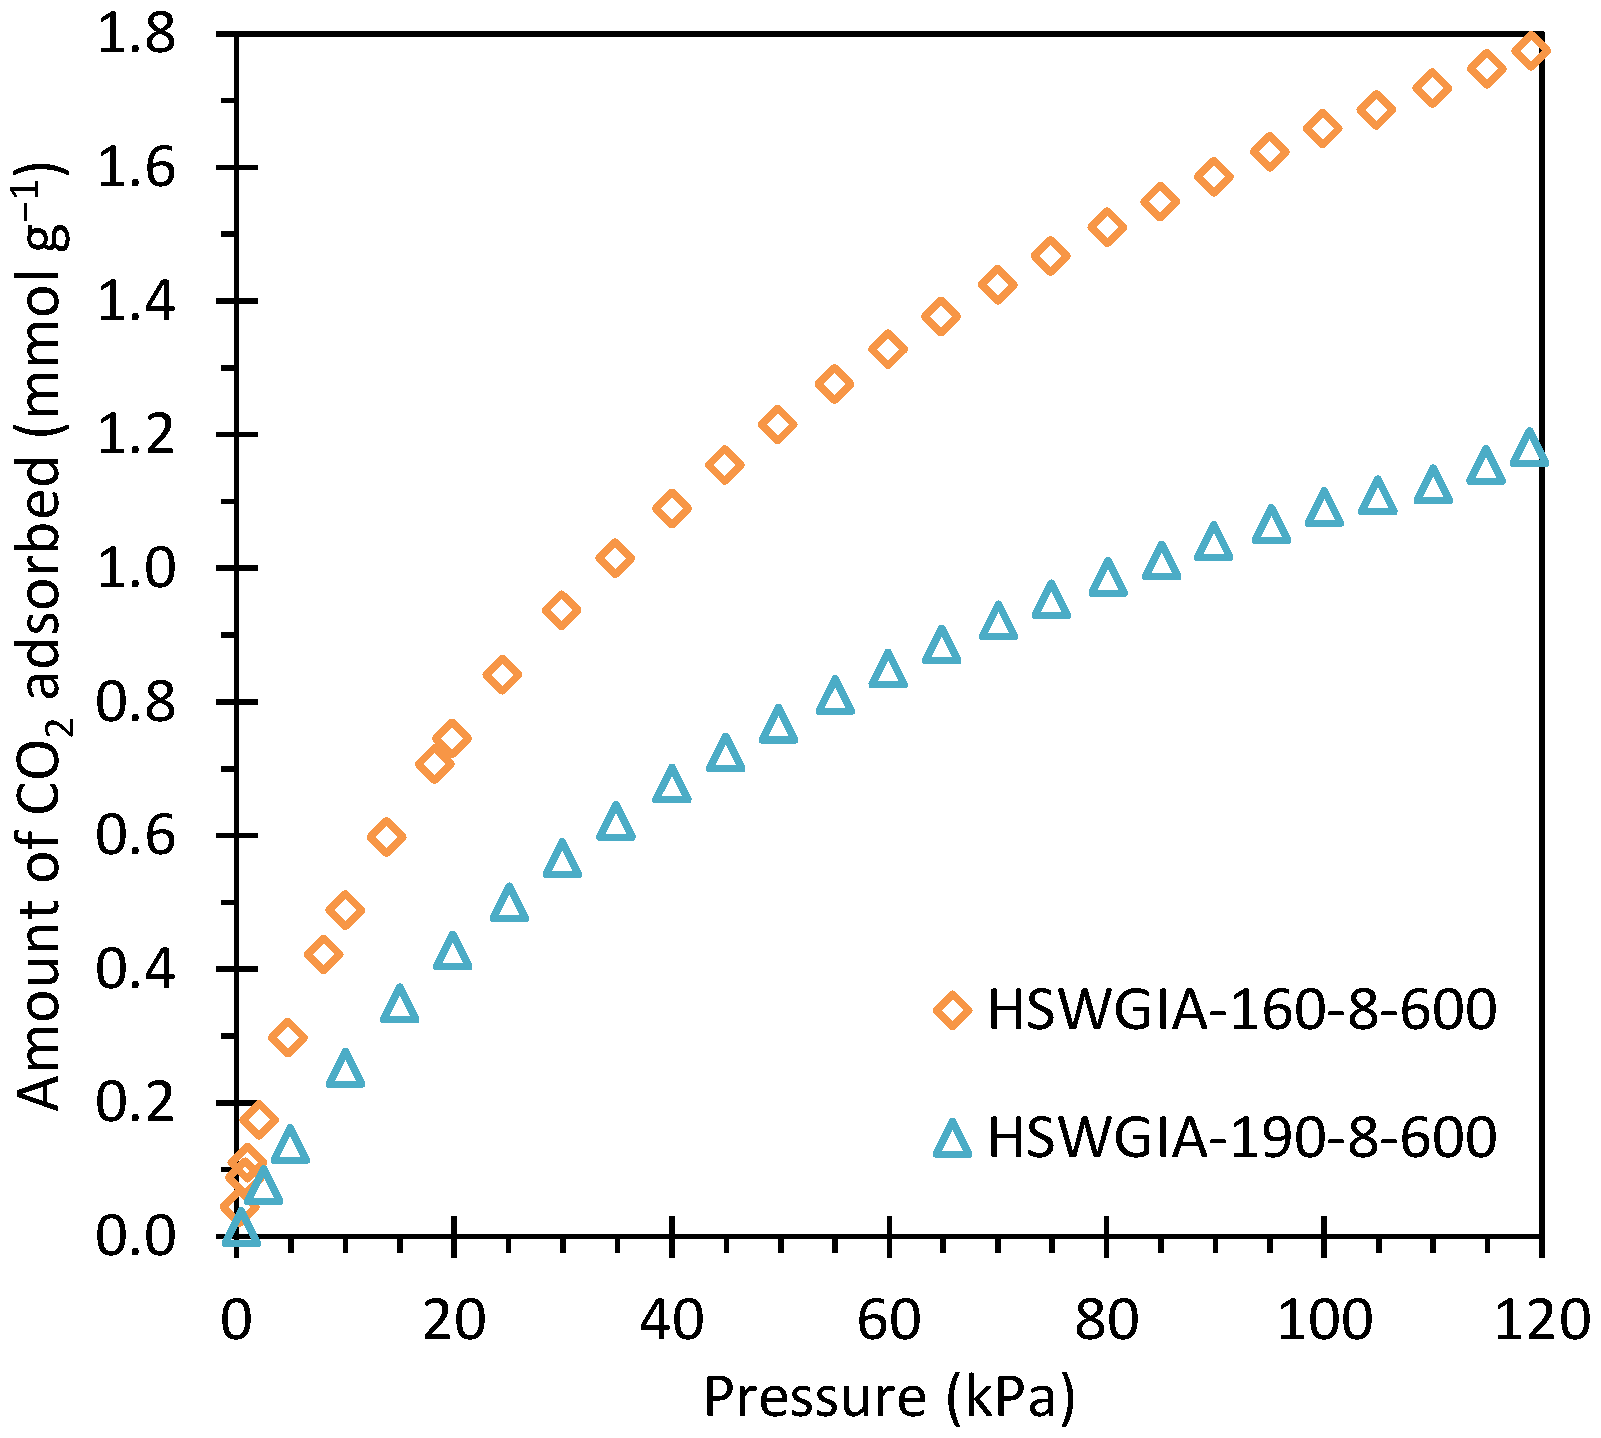
The corresponding CO2 adsorption isotherms at 50 °C are shown in Figure 15. As in the HSWIA series, the carbon subjected to a hydrothermal temperature of 160 °C shows superior CO2 adsorption capacity than that of 190 °C.
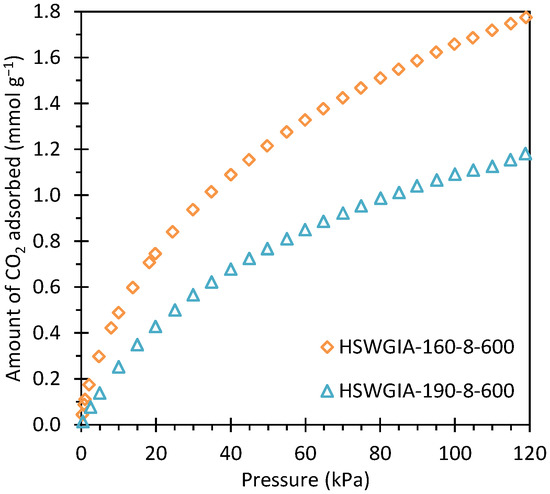
Figure 15.
CO2 adsorption isotherms at 50 °C of carbons HSWGIA-160-8-600 and HSWGIA-190-8-600.
Carbons HSWG-160-8-600 and HSWG-190-8-600, developed from a mixture of HSW and glucose, have larger narrow micropore volume than carbons HSW-160-8-600 and HSW-190-8-600, which were developed from HSW alone under the same experimental conditions (see Table 2). However, although the CO2 adsorption capacity of HSWGIA-160-8-600 is higher than that of HSWIA-160-8-600, the CO2 adsorption capacity of HSWGIA-190-8-600 is lower than that of HSWIA-190-8-600 (see Table 3). The latter is attributed to the wider micropore size of HSWGIA-190-8-600 compared to HSWIA-190-8-600 (see Table 2).
3.4. Comparison of Selected Carbons
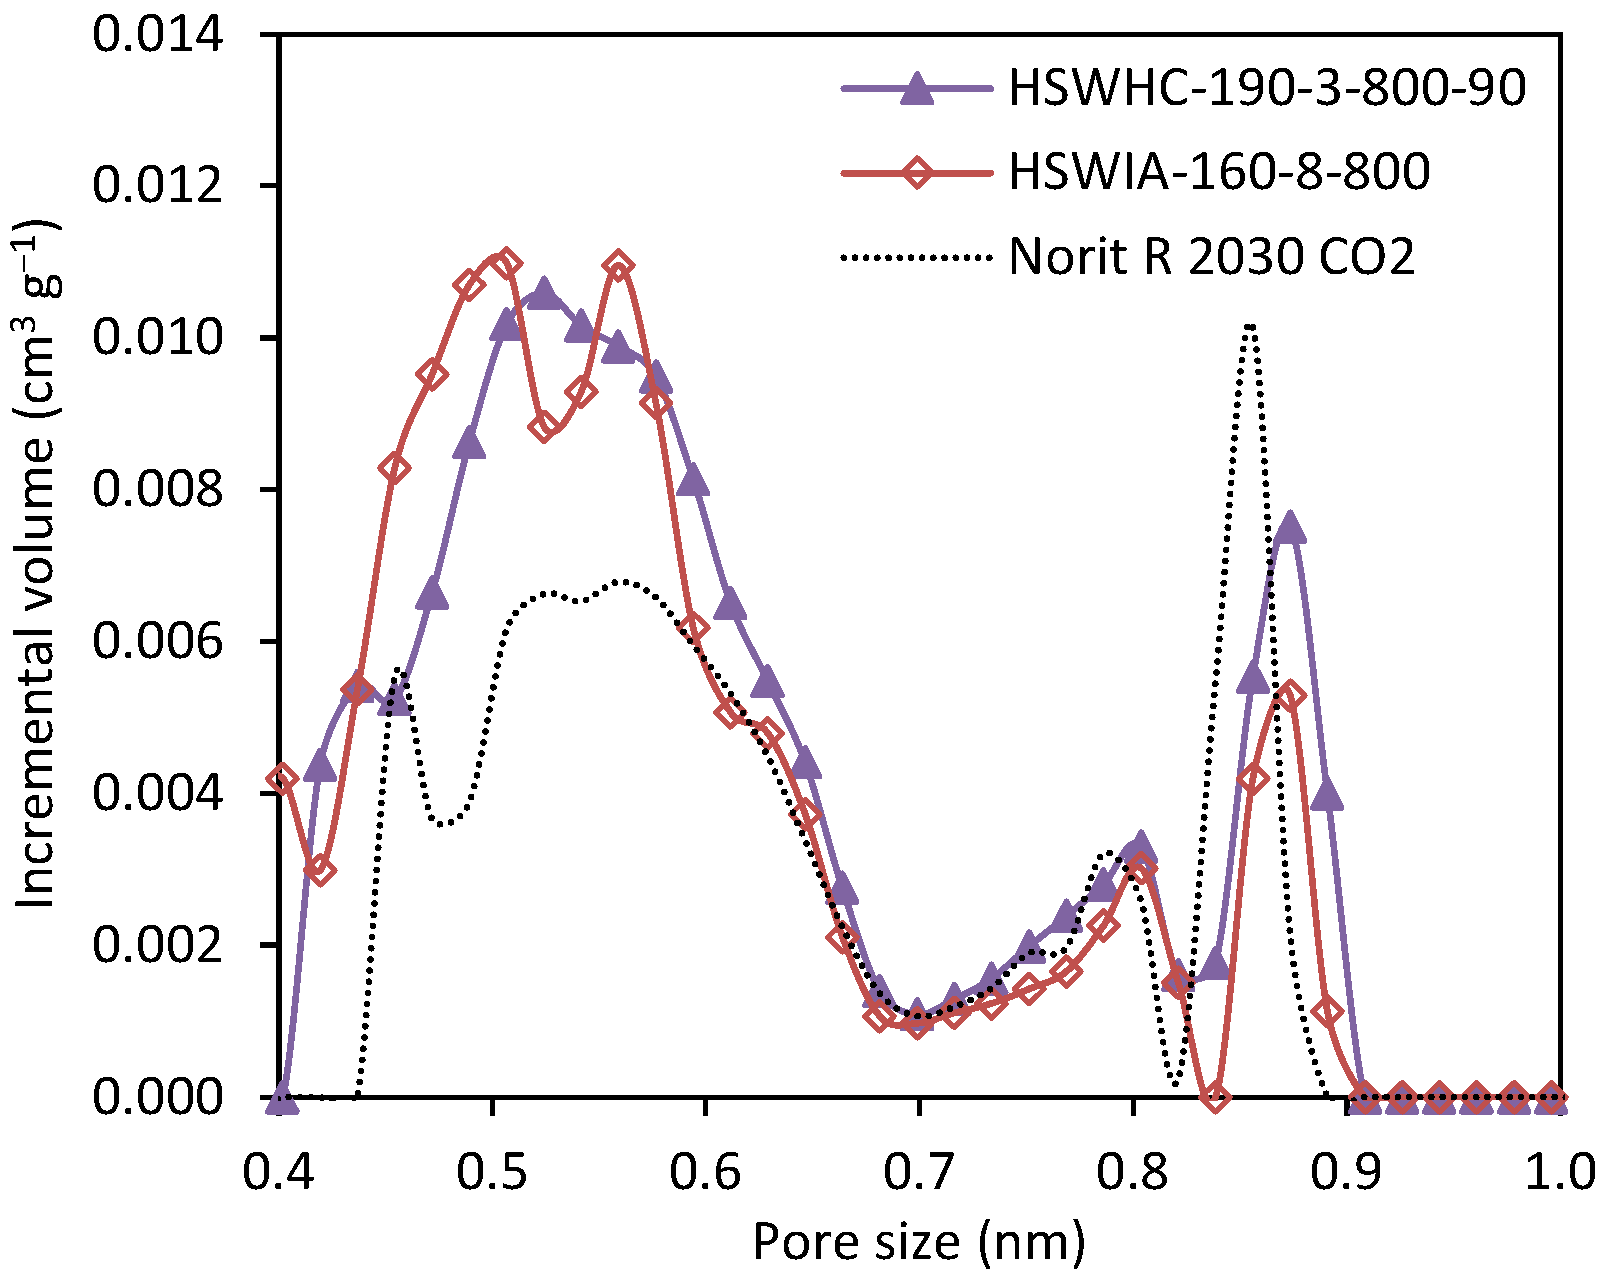
Figure 16 compares the narrow micropore size distribution of carbons HSWHC-190-3-800-90 and HSWIA-160-8-800, developed in this work, and that of the reference commercial activated carbon Norit R 2030 CO2. It can be observed that HSWHC-190-3-800-90 and HSWIA-160-8-800 have a higher volume of micropores in the range between 0.4 and 0.6 nm, which is known to be of utmost importance for CO2 adsorption at low pressures [60,61]. HSWIA-160-8-800 has a slightly higher volume of narrow micropores between 0.44 and 0.50 nm than HSWHC-190-3-800-90.
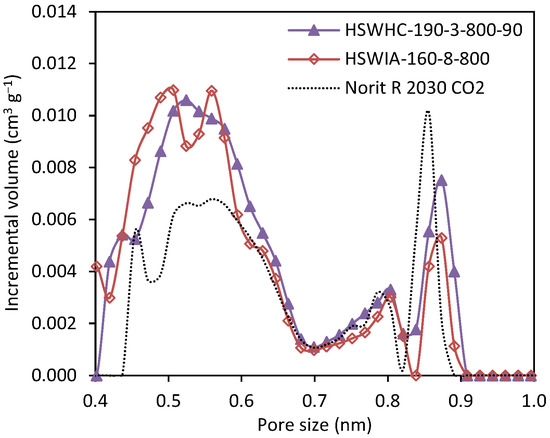
Figure 16.
Comparison of the narrow micropore size distribution of carbons HSWHC-190-3-800-90, HSWIA-160-8-800 and reference commercial activated carbon Norit R 2030 CO2.
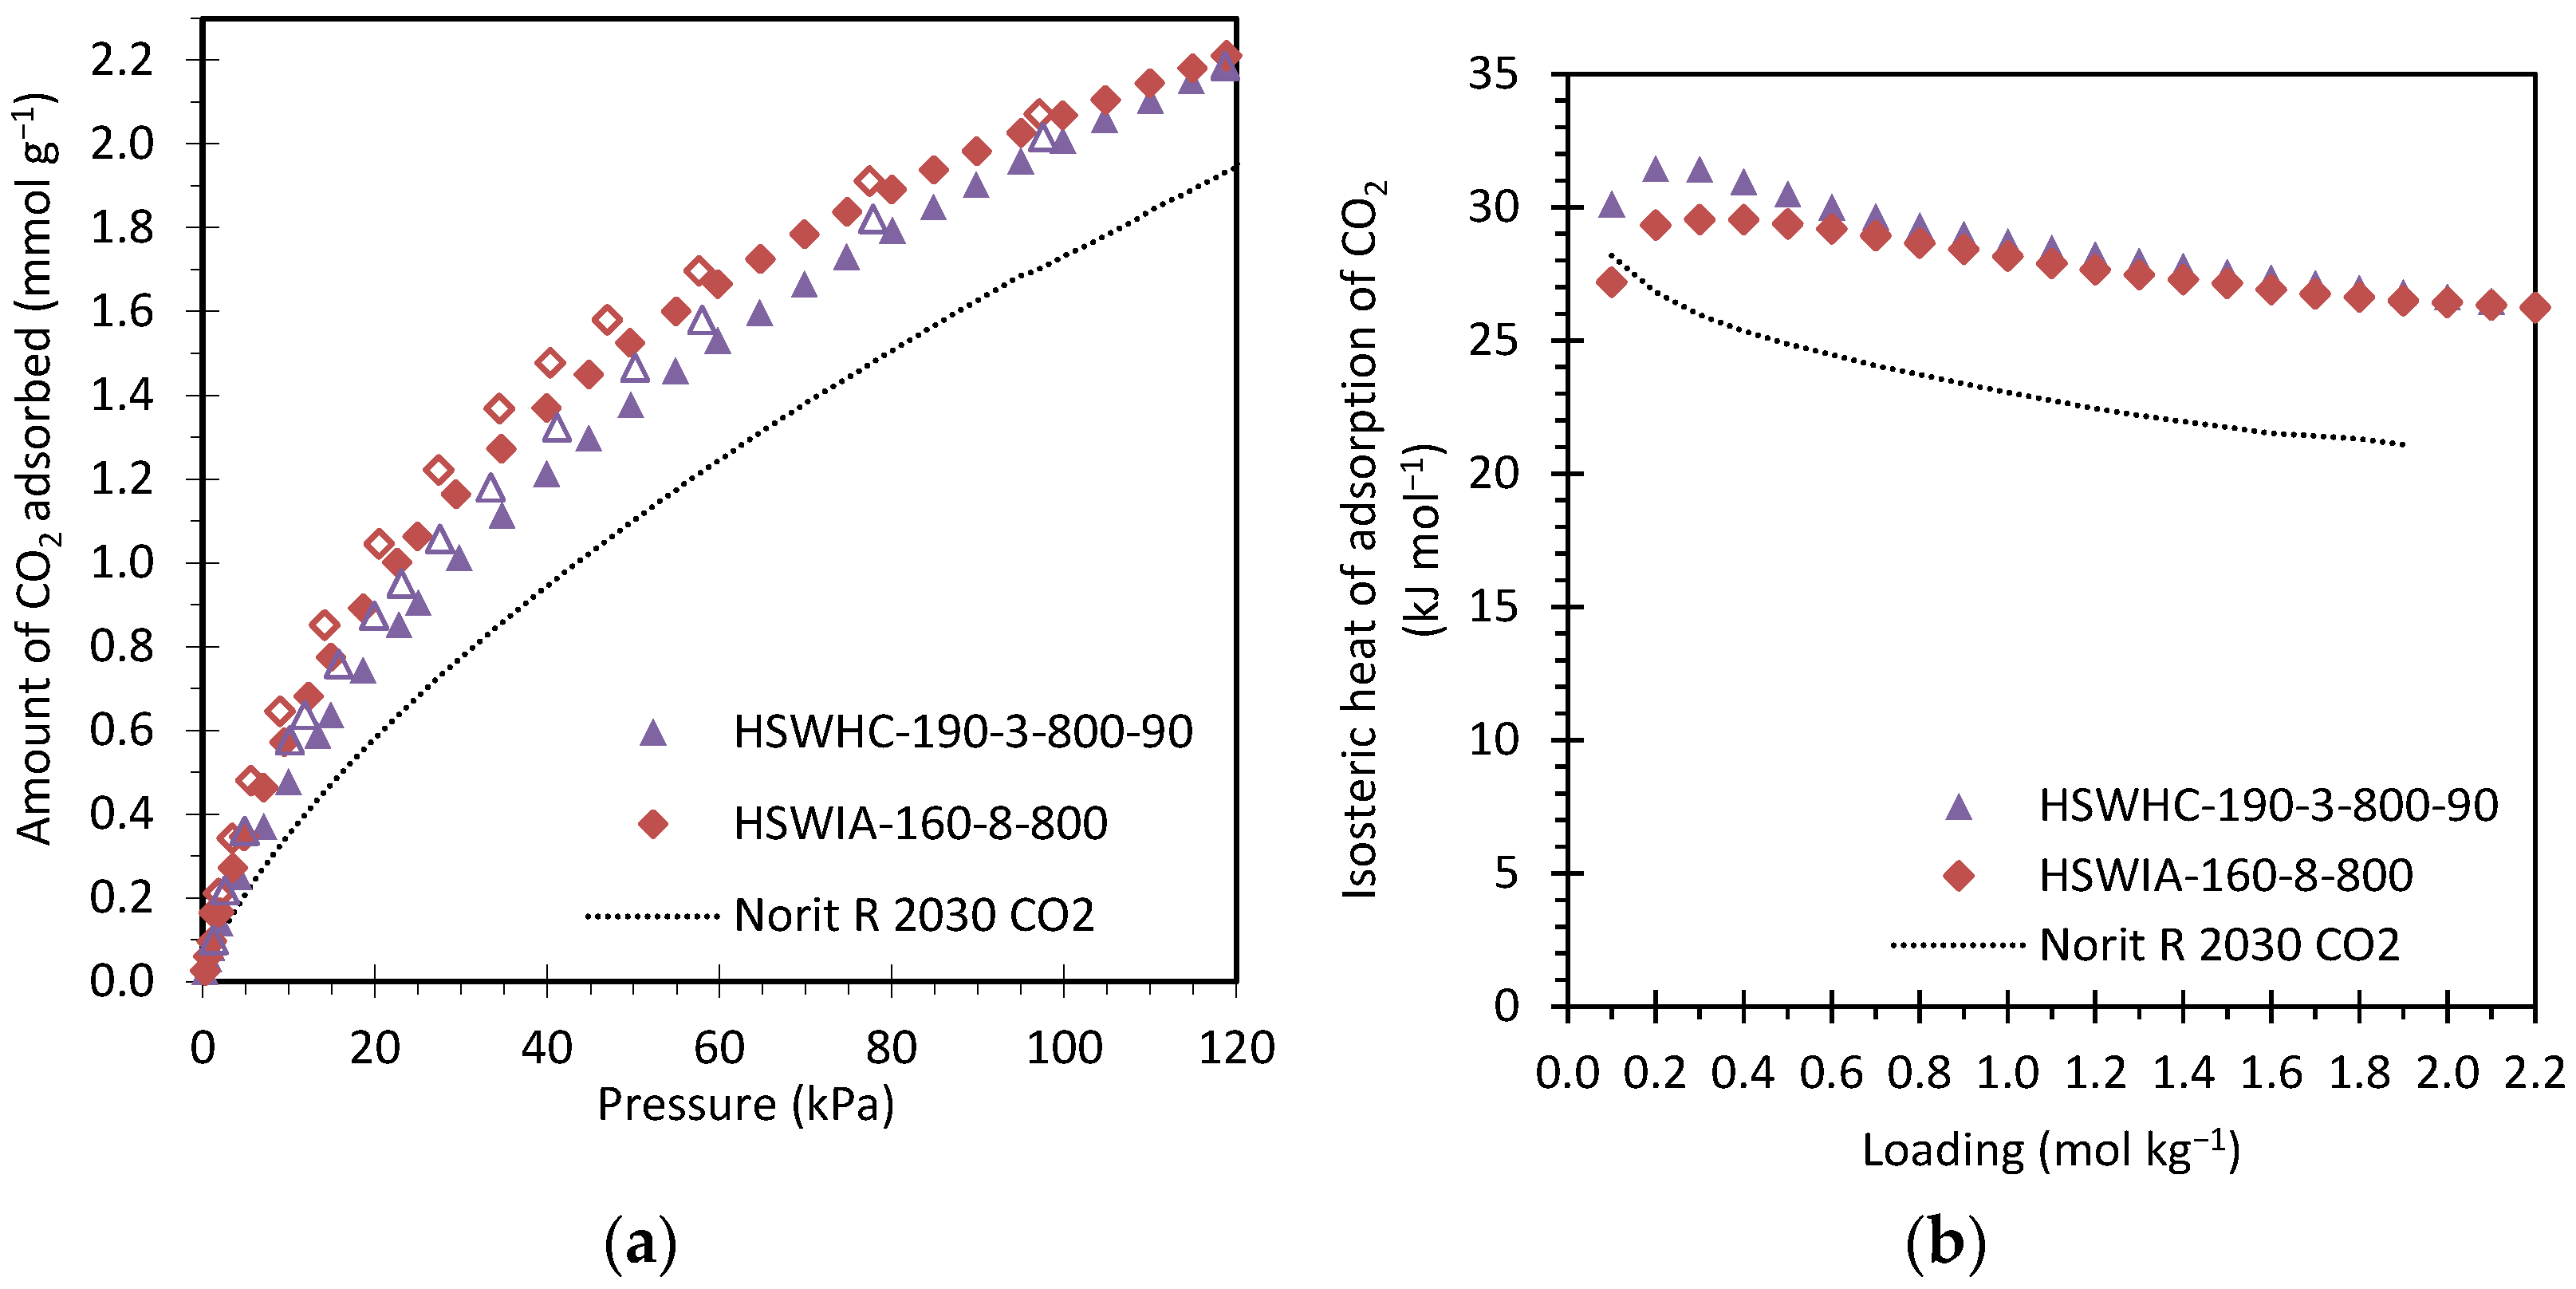
Figure 17a compares the CO2 adsorption isotherms at 50 °C of these same carbons. Full symbols represent adsorption data, and empty symbols represent desorption data. As can be seen from the figure, CO2 adsorption is reversible, as expected for carbon adsorbents, one of whose main advantages is that they can be easily regenerated by a moderate pressure swing. HSWIA-160-8-800 presents slightly higher CO2 adsorption capacity than HSWHC-190-3-800-90. Norit R 2030 CO2 presents the lowest CO2 adsorption capacity in the entire pressure range evaluated, which is attributed to the lower pore volume within 0.4 and 0.6 nm.
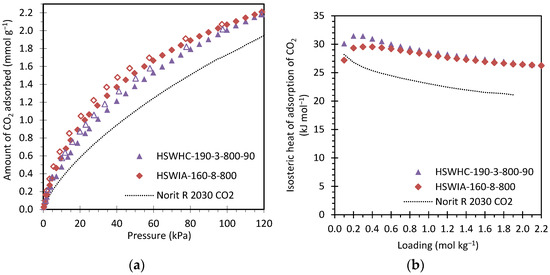
Figure 17.
(a) Comparison of the CO2 adsorption isotherms at 50 °C of carbons HSWHC-190-3-800-90, HSWIA-160-8-800 and reference commercial activated carbon Norit R 2030 CO2 (full symbols represent adsorption data and empty symbols desorption data); (b) Isosteric heat of adsorption of CO2 versus loading for carbons HSWHC-190-3-800-90, HSWIA-160-8-800 and reference commercial activated carbon Norit R 2030 CO2.
Figure 17b shows the isosteric heat of adsorption of CO2 versus loading of these three carbons. The isosteric heat of adsorption of CO2 on HSWHC-190-3-800-90 is slightly above that of HSWIA-160-8-800 at low loadings (31 vs. 30 kJ mol−1), but they tend to the same value as loading increases (26 kJ mol−1). However, Norit R 2030 CO2 presents a lower isosteric heat of adsorption, which varies between 28 and 21 kJ mol−1. The latter values are within the range of other commercial carbon adsorbents [36].
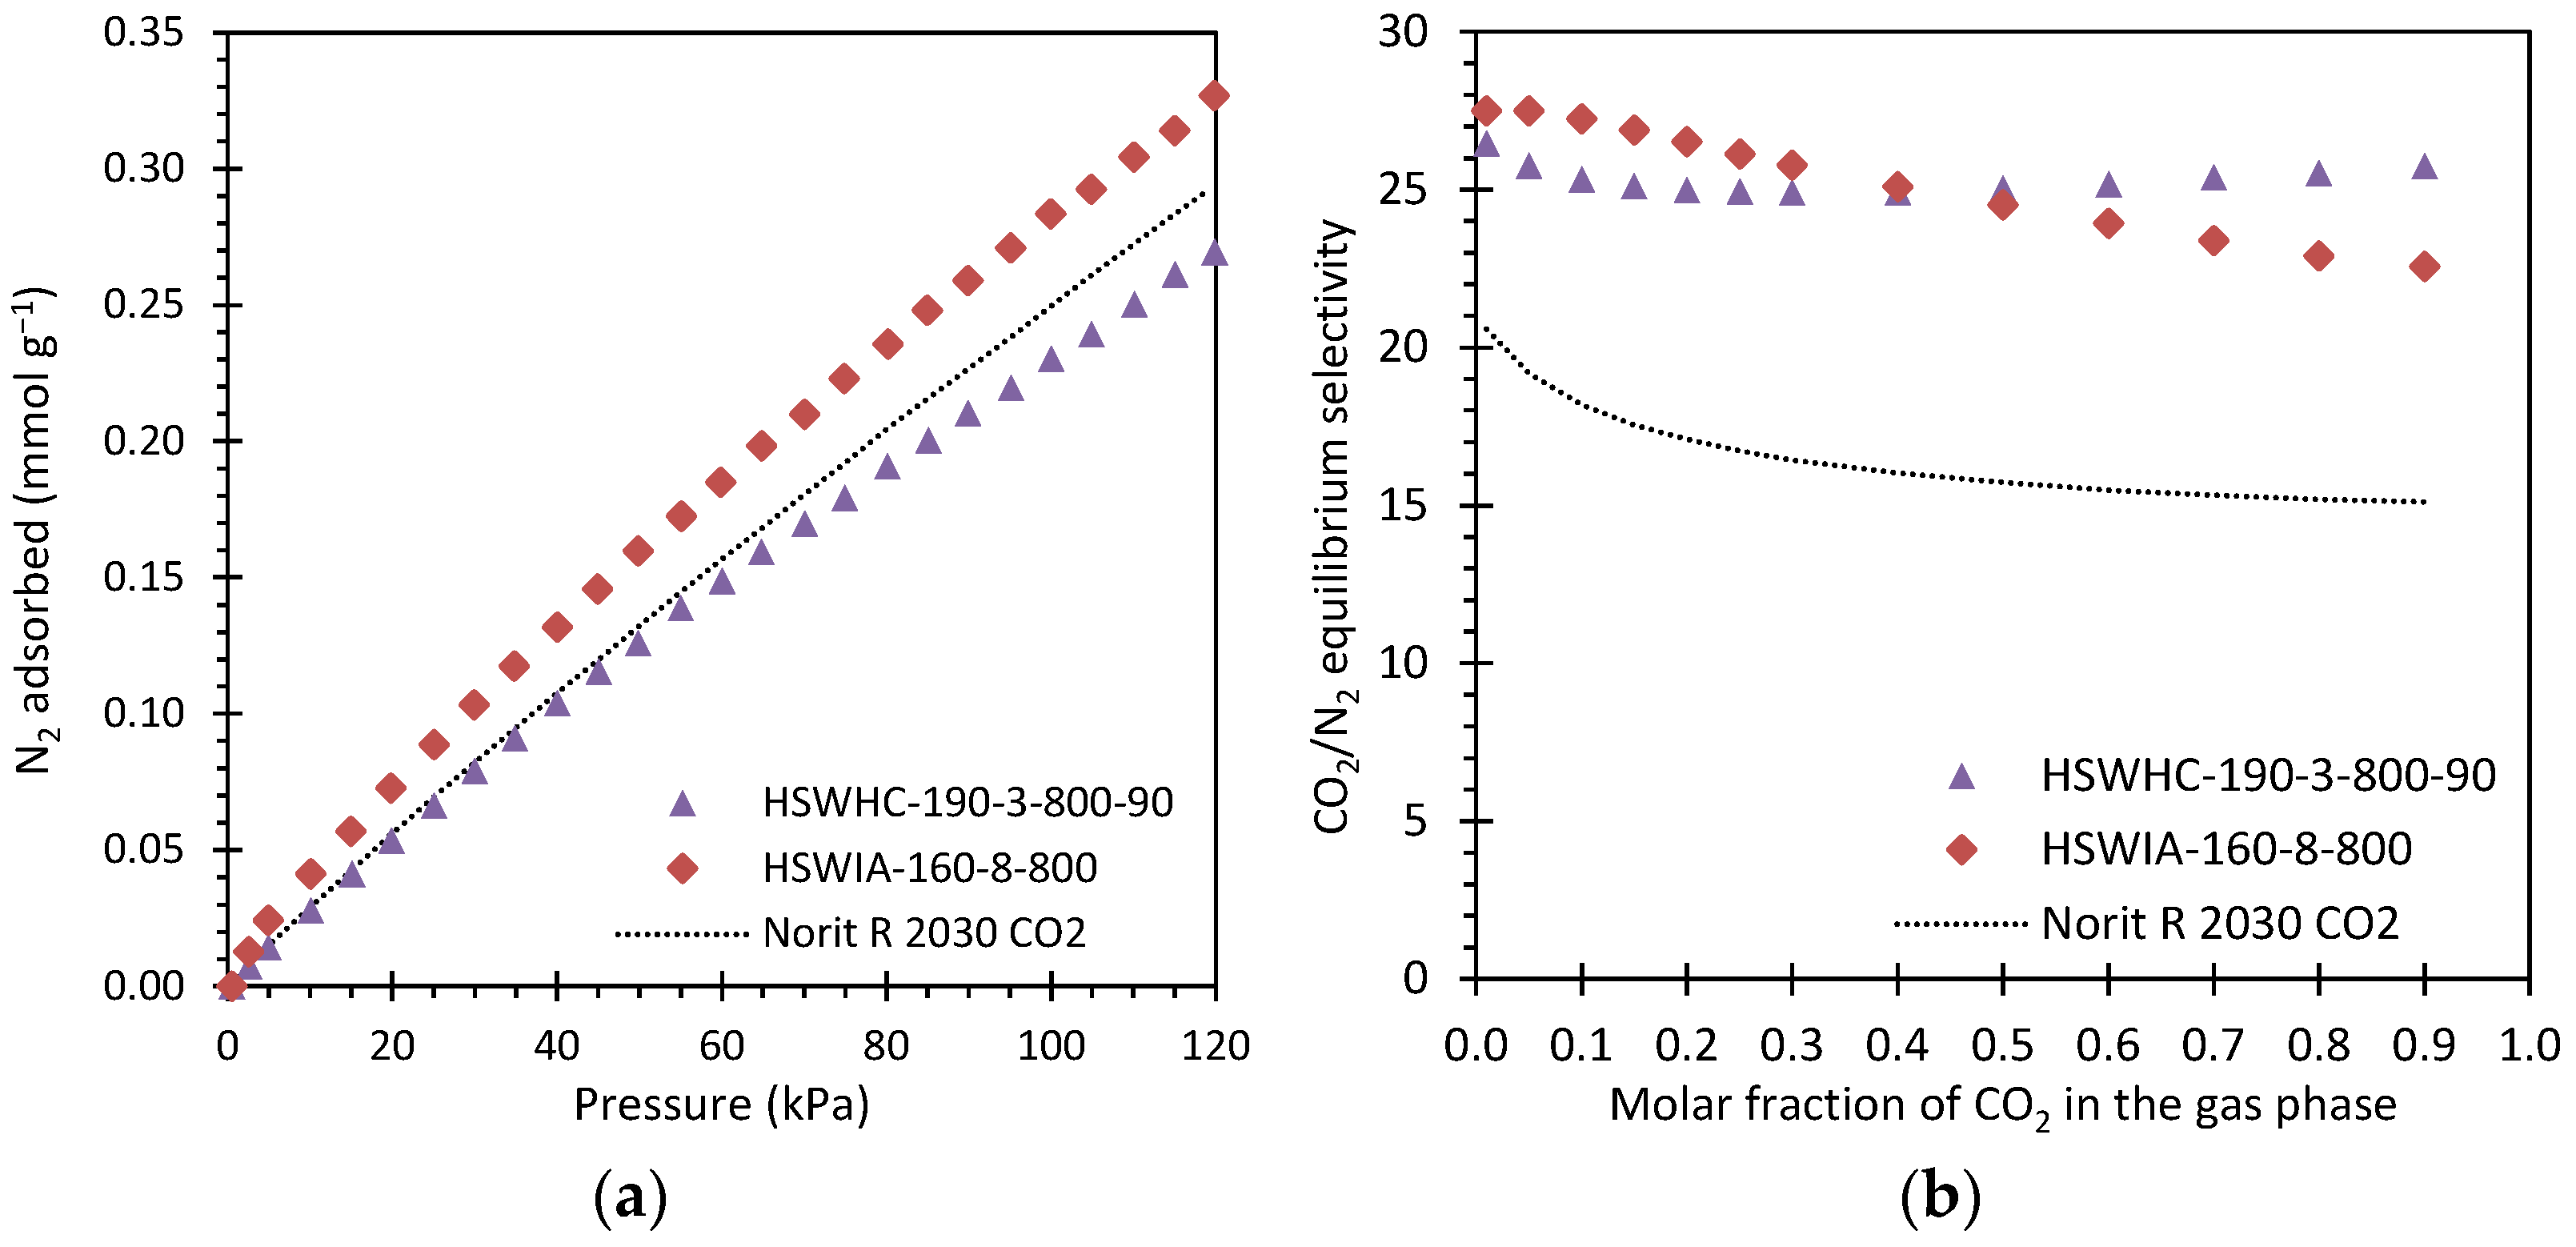
Figure 18a presents the N2 adsorption isotherms at 50 °C of these carbons. As expected, the N2 adsorption capacity of the samples is much lower than that of CO2, and the isotherms present a nearly linear shape, which is characteristic of weaker adsorbate–adsorbent interactions. HSWIA-160-8-800 presents the highest N2 adsorption capacity in the entire pressure range evaluated, followed by Norit R 2030 CO2 and HSWHC-190-3-800-90.
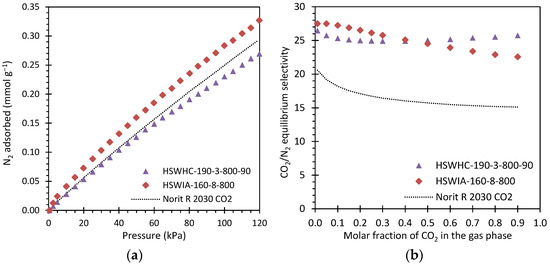
Figure 18.
(a) N2 adsorption isotherms at 50 °C of carbons HSWHC-190-3-800-90, HSWIA-160-8-800 and reference commercial activated carbon Norit R 2030 CO2; (b) CO2/N2 equilibrium selectivity at 50 °C and 101.325 kPa of carbons HSWHC-190-3-800-90, HSWIA-160-8-800 and commercial activated carbon Norit R 2030 CO2.
Figure 18b shows the CO2/N2 equilibrium selectivity of these three carbons at 50 °C and 101.325 kPa as a function of the molar fraction of CO2 in the gas phase. It can be observed that carbons HSWHC-190-3-800-90 and HSWIA-160-8-800 have superior equilibrium selectivity towards CO2 over N2 than that of the reference commercial activated carbon Norit R 2030 CO2. As shown in the figure, the equilibrium selectivity of HSWIA-160-8-800 is slightly above that of HSWHC-190-3-800-90 for molar fractions of CO2 in the gas phase up to 0.4 in the evaluated conditions.
4. Conclusions
Two synthetic routes, hydrothermal treatment followed by physical activation with CO2 and in situ ionic activation, were compared for the development of CO2 adsorbents from a biomass waste with high moisture content. The first is a greener route as it does not require the addition of chemicals or acid-washing stages.
The hydrochars obtained in the temperature range between 150 °C and 190 °C showed an appealing advantage: they can be easily pelletized by compression, without binder addition, allowing obtaining adsorbents with a suitable particle size for industrial separations in fixed bed adsorbers.
The temperature of the hydrothermal treatment has been shown to affect the CO2 adsorption capacity of the final adsorbents in opposite directions. This effect is more pronounced in the in situ ionic activation route, where a mild hydrothermal temperature of 160 °C led to carbons with greater pore volume between 0.4 and 0.6 nm and hence with superior CO2 adsorption capacity. On the other hand, in the alternative route, hydrothermal treatment followed by physical activation with CO2, a hydrothermal temperature of 150 °C produced a lower volume of pores between 0.4 and 0.6 nm than the carbons treated at higher temperatures; 190 °C was more suitable for the development of CO2 adsorbents.
Carbons developed from the greener route showed a large CO2 adsorption capacity, up to 0.64 mmol g−1 at 15 kPa and 50 °C in the case of HSWHC-190-3-800-90, which is above that of reference commercial activated carbons. On the other hand, one of the carbons developed by the in situ ionic activation route, HSWIA-160-8-800, showed an even higher CO2 adsorption capacity at 15 kPa and 50 °C, 0.78 mmol g−1, conditions that can be considered representative for postcombustion conditions. It must be highlighted that the KOH-to-HSW ratio used was only 1:4, whereas CO2 adsorbents developed from biomass by conventional chemical activation with KOH require KOH-to-char ratios of 2-3 [39].
The isosteric heat of adsorption of CO2 of carbons HSWHC-190-3-800-90 and HSWIA-160-8-800 varies between 31 and 26 kJ mol−1 CO2 as loading increases. This is above that of a reference commercial activated carbon used for CO2 adsorption.
The equilibrium selectivity of CO2 in relation to N2, at 50 °C and atmospheric pressure, of carbons HSWHC-190-3-800-90 and HSWIA-160-8-800 is above 25 for low to medium CO2 concentrations, which is substantially higher than that of the reference commercial activated carbon.
Author Contributions
Conceptualization: M.G.P. and F.R.; methodology: T.P., C.C. and M.G.P.; formal analysis: M.G.P.; investigation: T.P., C.C. and M.G.P.; resources: M.G.P. and F.R.; data curation: M.G.P.; writing—original draft preparation: C.C.; writing—review and editing: M.G.P. and F.R.; visualization: C.C. and M.G.P.; supervision: M.G.P.; project administration: M.G.P. and F.R.; funding acquisition: M.G.P. and F.R. All authors have read and agreed to the published version of the manuscript.
Funding
This research was funded by CSIC, grant number JAEINT_19_01312; the Government of Spain, grant number RyC-2015-17516 (co-financed by the European Social Fund, ESF); and the Government of the Principado de Asturias, grant number IDI/2021/000060 (co-financed by the European Regional Development Fund, ERDF).
Data Availability Statement
The original contributions presented in the study are included in the article. Further inquiries can be directed to the corresponding author.
Conflicts of Interest
The authors declare no conflicts of interest. The funders had no role in the design of the study; in the collection, analyses, or interpretation of data; in the writing of the manuscript; or in the decision to publish the results.
References
- UNFCCC. Report of the Conference of the Parties on Its Twenty-First Session, Held in Paris from 30 November to 13 December 2015. Addendum. Part Two: Action Taken by the Conference of the Parties at Its Twenty-First Session; FCCC/CP/2015/10/Add.1. In Proceedings of the UN Climate Change Conference (COP21), Paris, France, 30 November–13 December 2015; 2016. Available online: https://unfccc.int/documents/9097 (accessed on 20 February 2024).
- IPCC. Global Warming of 1.5 °C. An IPCC Special Report on the Impacts of Global Warming of 1.5 °C above Pre-Industrial Levels and Related Global Greenhouse Gas Emission Pathways, in the Context of Strengthening the Global Response to the Threat of Climate Change, Sustainable Development, and Efforts to Eradicate Poverty; Masson-Delmotte, V.P., Zhai, H.-O., Pörtner, D., Roberts, J., Skea, P.R., Shukla, A., Pirani, W., Moufouma-Okia, C., Péan, R., Pidcock, S., et al., Eds.; Cambridge University Press: Cambridge, UK; New York, NY, USA, 2018; pp. 3–24. [Google Scholar] [CrossRef]
- UNFCCC. Technical Dialogue of the First Global Stocktake. Synthesis Report by the Co-Facilitators on the Technical Dialogue; FCCC/SB/2023/9; 2023; Available online: https://unfccc.int/documents/631600 (accessed on 20 February 2024).
- IISD. Summary of the 2023 Dubai Climate Change Conference: 30 November—13 December 2023. Earth Negot. Bull. 2023, 12, 842. Available online: https://bit.ly/enb_cop28 (accessed on 20 February 2024).
- IPCC. IPCC Special Report on Carbon Dioxide Capture and Storage; Metz, B., Davidson, O., de Conick, H.C., Loos, M., Meyer, L.A., Eds.; Cambridge University Press: Cambridge, UK; New York, NY, USA, 2005; p. 442. [Google Scholar]
- IEA. World Energy Outlook 2023; International Energy Agency (IEA): Paris, France, 2023; Available online: https://iea.blob.core.windows.net/assets/86ede39e-4436-42d7-ba2a-edf61467e070/WorldEnergyOutlook2023.pdf (accessed on 20 February 2024).
- Global CCS Institute. The Global Status of CCS: 2023; Global CCS Institute: Melbourne, Australia, 2023; Available online: https://www.globalccsinstitute.com/wp-content/uploads/2024/01/Global-Status-of-CCS-Report-1.pdf (accessed on 20 February 2024).
- Budinis, S.; Krevor, S.; Dowell, N.M.; Brandon, N.; Hawkes, A. An assessment of CCS costs, barriers and potential. Energy Strateg. Rev. 2018, 22, 61–81. [Google Scholar] [CrossRef]
- Nocito, F.; Dibenedetto, A. Atmospheric CO2 mitigation technologies: Carbon capture utilization and storage. Curr. Opin. Green Sustain. Chem. 2020, 21, 34–43. [Google Scholar] [CrossRef]
- Bottoms, R.R. Process for Separating Acidic Gases. United States Patent 18,958, 2 December 1930. [Google Scholar]
- DuPart, M.S.; Bacon, T.R.; Edwards, D.J. Understanding corrosion in alkanolamine gas treating plants: Part 1. Hydrocarb. Process. 1993, 72, 75–80. [Google Scholar]
- Gouedard, C.; Picq, D.; Launay, F.; Carrette, P.L. Amine degradation in CO2 capture. I. A review. Int. J. Greenh. Gas Control 2012, 10, 244–270. [Google Scholar] [CrossRef]
- Goto, K.; Yogo, K.; Higashii, T. A review of efficiency penalty in a coal-fired power plant with post-combustion CO2 capture. Appl. Energy 2013, 111, 710–720. [Google Scholar] [CrossRef]
- Luis, P. Use of monoethanolamine (MEA) for CO2 capture in a global scenario: Consequences and alternatives. Desalination 2016, 380, 93–99. [Google Scholar] [CrossRef]
- Rosa, L.; Reimer, J.A.; Went, M.S.; D’Odorico, P. Hydrological limits to carbon capture and storage. Nat. Sustain. 2020, 3, 658–666. [Google Scholar] [CrossRef]
- Plaza, M.G.; Rubiera, F. Development of carbon-based vacuum, temperature and concentration swing adsorption post-combustion CO2 capture processes. Chem. Eng. J. 2019, 375, 122002. [Google Scholar] [CrossRef]
- Preston, C. The carbon capture project at Air Products’ Port Arthur hydrogen production facility. In Proceedings of the 14th Greenhouse Gas Control Technologies Conference (GHGT-14), Melbourne, Australia, 21–26 October 2018. [Google Scholar] [CrossRef]
- Modak, A.; Jana, S. Advancement in porous adsorbents for post-combustion CO2 capture. Microporous Mesoporous Mater. 2019, 276, 107–132. [Google Scholar] [CrossRef]
- Ding, M.; Flaig, R.W.; Jiang, H.-L.; Yaghi, O.M. Carbon capture and conversion using metal–organic frameworks and MOF-based materials. Chem. Soc. Rev. 2019, 48, 2783–2828. [Google Scholar] [CrossRef] [PubMed]
- Ochedi, F.O.; Liu, Y.; Adewuyi, Y.G. State-of-the-art review on capture of CO2 using adsorbents prepared from waste materials. Process Saf. Environ. Prot. 2020, 139, 1–25. [Google Scholar] [CrossRef]
- Ben-Mansour, R.; Habib, M.A.; Bamidele, O.E.; Basha, M.; Qasem, N.A.A.; Peedikakkal, A.; Laoui, T.; Ali, M. Carbon capture by physical adsorption: Materials, experimental investigations and numerical modeling and simulations—A review. Appl. Energy 2016, 161, 225–255. [Google Scholar] [CrossRef]
- Dziejarski, B.; Serafin, J.; Andersson, K.; Krzyzynska, R. CO2 capture materials: A review of current trends and future challenges. Mater. Today Sustain. 2023, 24, 100483. [Google Scholar] [CrossRef]
- Yu, S.; He, J.; Zhang, Z.; Sun, Z.; Xie, M.; Xu, Y.; Bie, X.; Li, Q.; Zhang, Y.; Sevilla, M.; et al. Towards negative emissions: Hydrothermal carbonization of biomass for sustainable carbon materials. Adv. Mater. 2024, 2307412. [Google Scholar] [CrossRef] [PubMed]
- Jain, A.; Balasubramanian, R.; Srinivasan, M.P. Hydrothermal conversion of biomass waste to activated carbon with high porosity: A review. Chem. Eng. J. 2016, 283, 789–805. [Google Scholar] [CrossRef]
- Liu, Z.; Zhang, Z.; Jia, Z.; Zhao, L.; Zhang, T.; Xing, W.; Komarneni, S.; Subhan, F.; Yan, Z. New strategy to prepare ultramicroporous carbon by ionic activation for superior CO2 capture. Chem. Eng. J. 2018, 337, 290–299. [Google Scholar] [CrossRef]
- Zhang, P.; Wang, J.; Fan, W.; Zhong, Y.; Zhang, Y.; Deng, Q.; Zeng, Z.; Deng, S. Ultramicroporous carbons with extremely narrow pore size distribution via in-situ ionic activation for efficient gas-mixture separation. Chem. Eng. J. 2019, 375, 121931. [Google Scholar] [CrossRef]
- Zhang, Z.; Luo, D.; Lui, G.; Li, G.; Jiang, G.; Cano, Z.P.; Deng, Y.-P.; Du, X.; Yin, S.; Chen, Y.; et al. In-situ ion-activated carbon nanospheres with tunable ultramicroporosity for superior CO2 capture. Carbon 2019, 143, 531–541. [Google Scholar] [CrossRef]
- Cao, S.; Zhao, H.; Hu, D.; Wang, J.-A.; Li, M.; Zhou, Z.; Shen, Q.; Sun, N.; Wei, W. Preparation of potassium intercalated carbons by in-situ activation and speciation for CO2 capture from flue gas. J. CO2 Util. 2020, 35, 59–66. [Google Scholar] [CrossRef]
- Du, S.; Wu, Y.; Wang, X.; Xia, Q.; Xiao, J.; Zhou, X.; Li, Z. Facile synthesis of ultramicroporous carbon adsorbents with ultra-high CH4 uptake by in situ ionic activation. AIChE J. 2020, 66, e16231. [Google Scholar] [CrossRef]
- Sánchez-Zapata, E.; Fuentes-Zaragoza, E.; Fernández-López, J.; Sendra, E.; Sayas, E.; Navarro, C.; Pérez-Álvarez, J.A. Preparation of dietary fiber powder from tiger nut (Cyperus esculentus) milk (“Horchata”) byproducts and its physicochemical properties. J. Agric. Food Chem. 2009, 57, 7719–7725. [Google Scholar] [CrossRef] [PubMed]
- Carbonell, A.; Boronat, T.; Fages, E.; Girones, S.; Sanchez-Zapata, E.; Perez-Alvarez, J.A.; Sanchez-Nacher, L.; Garcia-Sanoguera, D. Wet-laid technique with Cyperus esculentus: Development, manufacturing and characterization of a new composite. Mater. Des. 2015, 86, 887–893. [Google Scholar] [CrossRef]
- Sanusi, K.A.; Santuraki, A.H.; Abdus Salam, N.; Akpan, S.E. Application of tigernuts (Cyperus esculentus) as biosorbent for Cr6+ in aqueous solution. Int. J. Environ. Sci. Nat. Resour. 2019, 17, 109–113. [Google Scholar] [CrossRef]
- Thommes, M.; Kaneko, K.; Neimark, A.; Olivier, J.; Rodriguez-Reinoso, F.; Rouquerol, J.; Sing, K. Physisorption of gases, with special reference to the evaluation of surface area and pore size distribution (IUPAC Technical Report). Pure Appl. Chem. 2015, 87, 1051–1069. [Google Scholar] [CrossRef]
- Dubinin, M.M. Properties of Active Carbons; Walker, P.L.J., Ed.; Chemistry and physics of carbon; Marcel Dekker Inc.: New York, NY, USA, 1966; pp. 51–120. [Google Scholar]
- Stoeckli, F.; Ballerini, L. Evolution of microporosity during activation of carbon. Fuel 1991, 70, 557–559. [Google Scholar] [CrossRef]
- Himeno, S.; Komatsu, T.; Fujita, S. High-pressure adsorption equilibria of methane and carbon dioxide on several activated carbons. J. Chem. Eng. Data 2005, 50, 369–376. [Google Scholar] [CrossRef]
- Do, D.D. Adsorption Analysis: Equilibria and Kinetics; Imperial College Press: Singapore, 1998. [Google Scholar]
- Myers, A.L.; Prausnitz, J.M. Thermodynamics of mixed-gas adsorption. AIChE J. 1965, 11, 121–127. [Google Scholar] [CrossRef]
- Goel, C.; Mohan, S.; Dinesha, P. CO2 capture by adsorption on biomass-derived activated char: A review. Sci. Total Environ. 2021, 798, 149296. [Google Scholar] [CrossRef]
- Plaza, M.G.; González, A.S.; Pevida, C.; Pis, J.J.; Rubiera, F. Valorisation of spent coffee grounds as CO2 adsorbents for postcombustion capture applications. Appl. Energy 2012, 99, 272–279. [Google Scholar] [CrossRef]
- Plaza, M.G.; Pevida, C.; Arias, B.; Fermoso, J.; Casal, M.D.; Martín, C.F.; Rubiera, F.; Pis, J.J. Development of low-cost biomass-based adsorbents for postcombustion CO2 capture. Fuel 2009, 88, 2442–2447. [Google Scholar] [CrossRef]
- Plaza, M.G.; Pevida, C.; Martín, C.F.; Fermoso, J.; Pis, J.J.; Rubiera, F. Developing almond shell-derived activated carbons as CO2 adsorbents. Sep. Purif. Technol. 2010, 71, 102–106. [Google Scholar] [CrossRef]
- Sánchez-Zapata, E.; Fernández-López, J.; Pérez-Alvarez, J.A. Tiger nut (Cyperus esculentus) commercialization: Health aspects, composition, properties, and food applications. Compr. Rev. Food Sci. Food Saf. 2012, 11, 366–377. [Google Scholar] [CrossRef]
- Roselló-Soto, E.; Poojary, M.M.; Barba, F.J.; Lorenzo, J.M.; Mañes, J.; Moltó, J.C. Tiger nut and its by-products valorization: From extraction of oil and valuable compounds to development of new healthy products. Innov. Food Sci. Emerg. Technol. 2018, 45, 306–312. [Google Scholar] [CrossRef]
- Jing, S.; Yan, X.; Ouyang, W.; Xiang, H.; Ren, Z. Study on properties of Cyperus esculentus starch grown in Xinjiang, China. Starch 2012, 64, 581–589. [Google Scholar] [CrossRef]
- Costa Neto, J.; Silva, R.d.; Amaral, P.; Leão, M.R.; Gomes, T.; Sant Ana, G. Extraction, chemical modification by octenyl succinic and characterization of Cyperus esculentus starch. Polimeros 2018, 28, 319–322. [Google Scholar] [CrossRef]
- Möller, M.; Nilges, P.; Harnisch, F.; Schröder, U. Subcritical water as reaction environment: Fundamentals of hydrothermal biomass transformation. ChemSusChem 2011, 4, 566–579. [Google Scholar] [CrossRef] [PubMed]
- Kaliyan, N.; Morey, R. Factors affecting strength and durability of densified biomass products. Biomass Bioenergy 2009, 33, 337–359. [Google Scholar] [CrossRef]
- Zhang, B.; Huang, H.-J.; Ramaswamy, S. Reaction kinetics of the hydrothermal treatment of lignin. Appl. Biochem. Biotechnol. 2008, 147, 119–131. [Google Scholar] [CrossRef]
- Reza, M.T.; Lynam, J.G.; Vasquez, V.R.; Coronella, C.J. Pelletization of biochar from hydrothermally carbonized wood. Environ. Prog. Sustain. Energy 2012, 31, 225–234. [Google Scholar] [CrossRef]
- Sevilla, M.; Fuertes, A.B. Chemical and structural properties of carbonaceous products obtained by hydrothermal carbonization of saccharides. Chem. Eur. J. 2009, 15, 4195–4203. [Google Scholar] [CrossRef] [PubMed]
- Plaza, M.G.; González, A.S.; Pevida, C.; Rubiera, F. Green coffee based CO2 adsorbent with high performance in postcombustion conditions. Fuel 2015, 140, 633–648. [Google Scholar] [CrossRef]
- González, A.S.; Plaza, M.G.; Pis, J.J.; Rubiera, F.; Pevida, C. Post-combustion CO2 capture adsorbents from spent coffee grounds. Energy Procedia 2013, 37, 134–141. [Google Scholar] [CrossRef][Green Version]
- Zhang, C.; Song, W.; Ma, Q.; Xie, L.; Zhang, X. Enhancement of CO2 capture on biomass-based carbon from black locust by KOH activation and ammonia modification. Energy Fuels 2016, 30, 4181–4190. [Google Scholar] [CrossRef]
- Plaza, M.G.; González, A.S.; Pis, J.J.; Rubiera, F.; Pevida, C. Production of microporous biochars by single-step oxidation: Effect of activation conditions on CO2 capture. Appl. Energy 2014, 114, 551–562. [Google Scholar] [CrossRef]
- González, A.S.; Plaza, M.G.; Rubiera, F.; Pevida, C. Sustainable biomass-based carbon adsorbents for post-combustion CO2 capture. Chem. Eng. J. 2013, 230, 456–465. [Google Scholar] [CrossRef]
- Plaza, M.G.; Rubiera, F.; Pevida, C. Evaluating the feasibility of a TSA process based on steam stripping in combination with structured carbon adsorbents to capture CO2 from a coal power plant. Energy Fuels 2017, 31, 9760–9775. [Google Scholar] [CrossRef]
- Chue, K.T.; Kim, J.N.; Yoo, Y.J.; Cho, S.H.; Yang, R.T. Comparison of activated carbon and zeolite 13X for CO2 recovery from flue gas by pressure swing adsorption. Ind. Eng. Chem. Res. 1995, 34, 591–598. [Google Scholar] [CrossRef]
- Falco, C.; Marco-Lozar, J.P.; Salinas-Torres, D.; Morallón, E.; Cazorla-Amorós, D.; Titirici, M.M.; Lozano-Castelló, D. Tailoring the porosity of chemically activated hydrothermal carbons: Influence of the precursor and hydrothermal carbonization temperature. Carbon 2013, 62, 346–355. [Google Scholar] [CrossRef]
- Plaza, M.G.; Pevida, C.; Arenillas, A.; Rubiera, F.; Pis, J.J. CO2 capture by adsorption with nitrogen enriched carbons. Fuel 2007, 86, 2204–2212. [Google Scholar] [CrossRef]
- Presser, V.; McDonough, J.; Yeon, S.-H.; Gogotsi, Y. Effect of pore size on carbon dioxide sorption by carbide derived carbon. Energy Environ. Sci. 2011, 4, 3059–3066. [Google Scholar] [CrossRef]
Disclaimer/Publisher’s Note: The statements, opinions and data contained in all publications are solely those of the individual author(s) and contributor(s) and not of MDPI and/or the editor(s). MDPI and/or the editor(s) disclaim responsibility for any injury to people or property resulting from any ideas, methods, instructions or products referred to in the content. |
© 2024 by the authors. Licensee MDPI, Basel, Switzerland. This article is an open access article distributed under the terms and conditions of the Creative Commons Attribution (CC BY) license (https://creativecommons.org/licenses/by/4.0/).

