Abstract
The increasing interest in the use of renewable energy technologies is directing attention towards the potential contribution of marine energy technologies, especially ocean wave energy, to world energy demand. While open-sea demonstrations of full-scale devices have been carried out to validate several technologies, the focus now is shifting to optimising the components for efficiency and reliability. The efficiency of the electrical generator plays a crucial role in wave-to-wire numerical models for converting wave energy into usable electricity. It provides essential data that enables the industry to reduce technical risks and uncertainties. Wave-to-wire models typically simplify the generator’s efficiency through assuming a single curve based on the load. This curve is usually provided by the machine manufacturers for the nominal rotational speed. However, the rotational speed varies in the case of air turbines used in OWC devices. Therefore, to accurately estimate decision variables derived from these models, a comprehensive efficiency map is necessary. This map should demonstrate the performance at different rotational speeds and loads, as it directly influences the estimation of key parameters. The main objective of the present work is to improve the generator behaviour of an OWC for different generator operation regimes. For this purpose, a numerical model of the generator’s efficiency will be developed throughout the segregation of losses and validated experimentally. Finally, an optimal control law will be presented to maximise the electrical power output of the wave energy converter, considering the efficiency of both the generator and the turbine.
1. Introduction
Wave energy remains the least developed renewable energy technology despite its worldwide abundance and high power density [1]. After decades of research, wave energy solutions have yet to attain the design convergence needed for market expansion [2]. Among the different existing concepts for wave energy extraction, the Oscillating Water Column (OWC) stands up as one of the most promising technologies [3]. Examples of OWC systems comprise both fixed shore-mounted devices such as the Mutriku Power Plant [4], Pico wave power plant [5] or Limpet [6], and floating structures securely anchored in place such as the IDOM Marmok-A5 spar-type buoy [7], OE buoy [8] or Wave swell [9]. Figure 1 shows the representation of the three main types of OWC, where the incoming waves interact with the structure and induce a relative movement of the internal free surface within the water column (the structure plays an important role in the hydrodynamic to pneumatic energy transformation [10]). This motion generates a slow reciprocating airflow, subsequently propelling the turbine installed atop the structure.
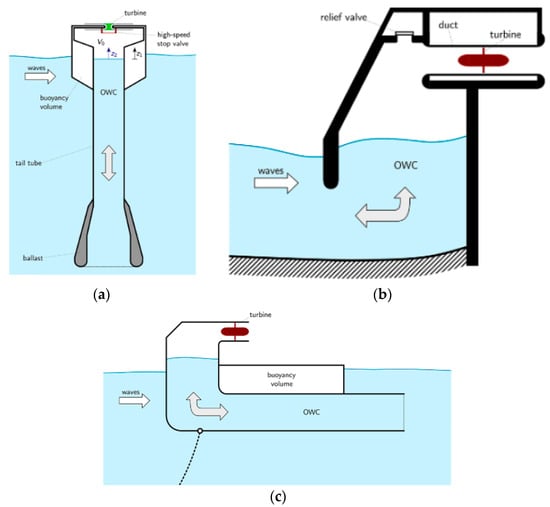
Figure 1.
Representation of the three main types of OWC: (a) Floating Spar-buoy, (b) Fixed OWC, and (c) Backward Bent Duct Buoy [3].
The OWC devices offer numerous advantages including a simple design with few moving parts and low maintenance requirements, high environmental and social acceptance arising from the minimal impact on marine ecosystems and adaptability to a wide range of wave conditions. Precisely, the inherent wave variability poses a significant design challenge for delivering high conversion efficiency throughout the various operational sea states.
The term used to refer to the system that transforms wave movement into electricity is called Power Take Off (PTO) [11]. Figure 2 shows the power conversion chain of an OWC device. It involves an air turbine used to convert the pneumatic power into useful mechanical power, a directly coupled rotative generator to produce electrical power and power electronics to increase the quality and adapt the energy generated to the grid requirements. Each conversion step has some power losses that contribute to the reduction of the overall PTO efficiency.

Figure 2.
Power conversion chain of an OWC device.
The PTO systems with low inertia offer the possibility of controlling the operating point of the air turbine wave-by-wave rather than relying on averaged time steps [12,13], which presents an opportunity for efficiency improvements compared to the traditional control techniques. Nevertheless, this control strategy can imply high peak-to-average power ratios that may worsen the power quality delivered to the grid. Besides, the vast majority of the control laws in the literature aim to maximise the efficiency of the air turbine [3,4,14], disregarding the optimum operation points of the rest of the PTO components. As an alternative, and overtopping mechanism used to reduce pressure peaks could be also analysed [15]. The power converter has a well-known efficiency curve that depends mainly on the load and is very high (up to 98%) and acceptable above a certain load. Therefore, it seems appropriate to exclude it when designing a control law. Hence, the electrical generator is the PTO component that is directly impacted through wave variability. Understanding its efficiency at different operation regimes is therefore vital for optimising performance and annual energy production.
The electrical generator has different kinds of losses that not only depend on the operational point but also on the load. By segregating losses, a better understanding of the generator performance can be gained, which is especially important for applications where overloads are frequent due to the variability of the resource [16]. The characterisation of these losses is well covered in the literature for an electrical motor working at nominal (constant) speed [17,18,19,20]. However, its behaviour is not as clear when coming to a generator with completely changeable working conditions. The research in [21] analytically segregates the losses from manufacturers’ tests as a function of the rated power and international efficiency classification but for constant speed. However, it does not perform adjustments using real experimental data and suffers from differences between the measured and calculated losses.
Furthermore, the generator temperature profile depends on several phenomena such as bearing friction, windage or air friction, core loss (eddy and hysteresis losses), copper losses and stray losses, but only the latter two vary with motor load [22]. Operating a generator at its thermal limit rather than its rated power limit can increase the amount of wave energy converted to electrical energy, leading to higher profits [23], but care must be taken to not compromise its reliability.
This work analyses the behaviour of an electrical generator when subjected to the high variability of the sea. The operational point of the generator has a direct relationship with its efficiency, and segregation of losses in the whole operational spectra allows to determine the best control alternative for extracting the maximum power. A methodology for combining theoretical knowledge of loss calculations with experimental inputs is discussed. The results are then compared with the efficiency pattern of an OWC turbine, obtaining a new control law that considers the whole WEC energy chain and allows real maximisation of the efficiency.
The paper is structured as follows: Section 2 briefly presents the typical control strategy of OWC devices. The power flow process of an asynchronous generator is described in Section 3. Section 4 provides a brief overview of the equivalent circuit and the tests performed in order to obtain its main parameters. A methodology for segregating the losses of the generator through combining the equivalent circuit parameters with experimental inputs is presented in Section 4. Section 5 focuses on the test bench where the experimental validation was carried out. Section 6 presents the resulting characterisation of the generator while Section 7 showcases the new control law that focuses on the maximisation of both, an OWC turbine and generator efficiency. Finally, conclusions are drawn in Section 8.
2. Control Strategies for OWC Devices
The air turbine is an important component of the PTO of an OWC. The principles of an OWC require the use of a self-rectifying air turbine capable of rotating consistently in a single direction, regardless of the bidirectional airflow. The performance characteristics of a turbine are usually defined in terms of the dimensionless flow coefficient () which is represented as Equation (1):
where Q is the volumetric flow rate, is the rotational speed and D is the turbine rotor diameter. Ref. [24] shows an efficiency comparison of three different bidirectional turbines. The Wells turbine is a bidirectional air turbine that operates efficiently over a restricted range of airflow. The biradial turbine is a new self-rectifying impulse turbine [25] that allows a higher efficiency for a wider range of rotational speeds, and the axial flow impulse turbine includes fixed guide vanes that allow a wider range of rotational speeds but at lower overall efficiency. A well-established variable speed control strategy is used to optimise the operation of the turbine [26]. The strategy relies on the premise that an ideal rotational speed exists, referred to as the Best Efficiency Point (BEP) in Figure 3.
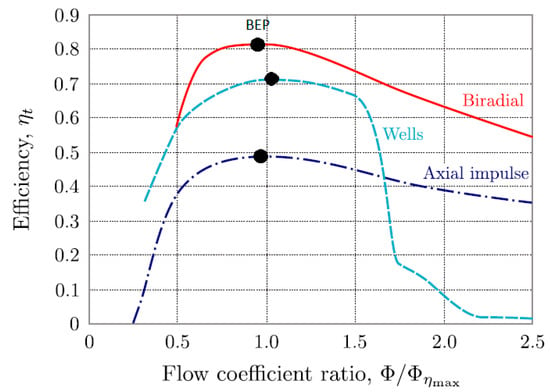
Figure 3.
Compared efficiency ηt of the biradial, Wells and axial flow impulse (fixed guide vanes) turbines versus flow rate coefficient ϕ/ϕηmax, where ϕηmax is the flow rate coefficient at the point of maximum efficiency (BEP) for each turbine [24].
The following equation represents the dynamics of the overall drive train shown in Equation (2):
where Tm is the mechanical torque provided by the turbine, is the generator resistive torque, ω the rotational speed, J is the inertia and is the damping or friction.
The objective of the control law is to regulate the turbine speed, in order to have it working at its BEP, by applying a resistive torque (Tg) on the generator side. The control variable then influences the rotational acceleration described by (2). In an ideal lossless power conversion system, the average powers on both the turbine and generator sides are equal. This implies that, similar to the optimal estimated turbine torque, an optimal torque exists at the generator side controller, which is defined by a quadratic relationship Equation (3) with respect to the speed [12,13].
where is the gain for the torque–speed law that is selected for a specific design point and offers the best efficiency of the turbine. The obtention process is well described in the literature [4,12,13].
The present work will focus on analysing how the different losses affect the overall Squirrel Cage Induction Generator (SCIG) operating points but emphasising the optimal control that combines the turbine and the generator to maximise the power output.
3. Generator Efficiency Model
A power transfer process in an asynchronous generator involves several intermediate stages that transform mechanical input power into electrical power. However, at each stage, there are power losses due to various physical phenomena [18], such as iron losses and ohmic resistance, as shown in Figure 4.
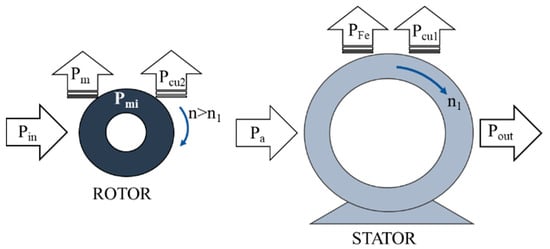
Figure 4.
Power flow diagram of an asynchronous generator.
A portion of the mechanical input power in the shaft is lost due to ventilation and friction, which is known as mechanical losses (). The remaining power is referred to as the internal mechanical power (), which serves as the input to the rotor and will be converted into electromagnetic power. The resistance of the rotor phases generates rotor copper losses, denoted as .
The power is then transferred from the rotor to the stator through the air gap. During this process, there are losses in the magnetic circuit of the stator due to hysteresis and Foucault currents, which are referred to as magnetic losses or iron losses (PFe). Additionally, there are stator copper losses caused by heat losses from the Joule effect in the stator.
Apart from the losses mentioned previously, other losses occur due to various phenomena, and they are collectively referred to as additional load losses (PLL). The remaining power after accounting for all losses is known as useful power, which is the electrical power at the generator’s output (POut). The power balance of the system can be expressed as Equation (4), which represents the power output in the stator:
4. Segregation of Losses Combining Equivalent Circuit Parameters and Experimental Inputs
In this section, the analytical calculation of the generator losses will be carried out using the parameters obtained in Appendix A and adjusted, whenever possible, with the real information available in the test bench (measurements). The methodology will follow the power transfer stages of Figure 4.
4.1. Mechanical Losses
Mechanical losses depend on construction variables. Friction losses depend on the type and shape of the bearings, lubrication, load and rotational speed, while ventilation losses depend on the ventilation method, cooling medium, pressure and flow [27]. The calculation of these losses requires constructive information not usually obtained from manufacturers, but most components depend on the square of rotational speed [17].
From no-load test processing, it was found that Pm was 22.41 W at 1.500 rpm. By applying a quadratic regression method, the following approximated equation is obtained:
that can be represented as a function of rotational speed (Figure 5):
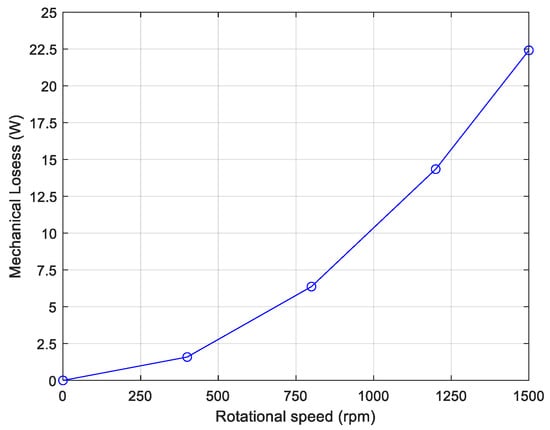
Figure 5.
Mechanical losses as a function of rotational speed (case study: 3 kW SCIG OBEKI generator).
4.2. Rotor Copper Losses
They can be quantified as Equation (6):
where m1 and m2 are the number of phases in the stator and rotor, respectively. These losses will be calculated for each test with the adjusted value and the calculated as follows. From the equivalent circuit the following expressions, Equations (7)–(10), can be obtained:
where and are real stator current and frequency that can be measured during the tests, is the real slip calculated for each test as Equation (11):
where is the measured rotational speed. Note that and from the equivalent circuit were obtained for a fixed frequency of 50 Hz, which will differ from the frequency during the tests. From them, the real inductances and are calculated and used instead for a more accurate approach.
4.3. Iron Losses
From the equivalent circuit, they can be expressed as Equation (12):
All the variables can be easily calculated for each test (Figure 6). However, from the no-load test and using polynomic regression we can better adjust the value of these losses as a function of the stator voltage for each test (Figure 6).
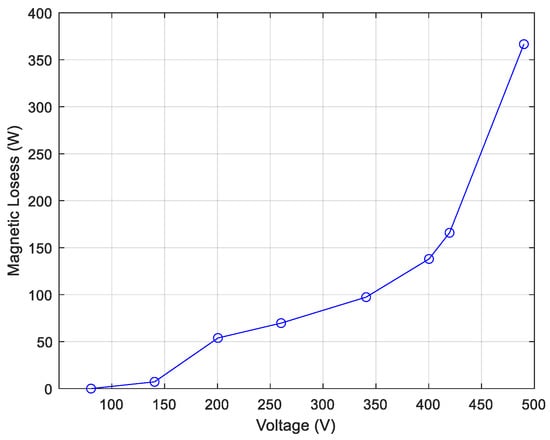
Figure 6.
Magnetic losses as a function of stator voltage (case study: 3 kW SCIG OBEKI generator).
4.4. Stator Copper Losses
Also from the equivalent circuit, they can be quantified as Equation (13):
In this case, has been directly measured in the stator terminals and is measured during each test.
4.5. Additional Losses
Both the measurement and estimation of these losses present some uncertainty that has been discussed in the literature [28]. According to the last version of the IEC standard [29], additional losses in a machine of a rated power between 1 kW and 10.000 kW can be estimated using Equation (14):
where nominal power is expressed in kW and is the input power. As stated in [30], the measured additional losses are below the IEC estimation. In fact, the performed tests (Equation (14)) give 2.5% of the input power while [31] states that the average value for 3 kW machines found from the test results is 1.2%. Despite this uncertainty, the losses calculated from (Equation (14)) are maintained in this work.
5. Validation of Numerical Model at Test Bench
Once the characterisation of the equivalent circuit and the segregation of losses have been completed, the next step is to validate the numerical model which represents the behaviour of the generator at different load regimes.
The Electrical PTO test rig which is going to be used was designed within the CORES FP7 [32] project. Since then, it has been used by many external research groups through MARINET [33] and MARINET2 [34] projects, and by internal groups for different applications.
The test bench emulates the rotational-mechanical output of an ocean/wind energy device, where using a numerical model of primary energy conversion (hydrodynamic-mechanic, aerodynamic-mechanic) a final motor torque/speed reference is completed.
The test bench can be divided into two key areas: the motor and the generator areas as shown in Figure 7.
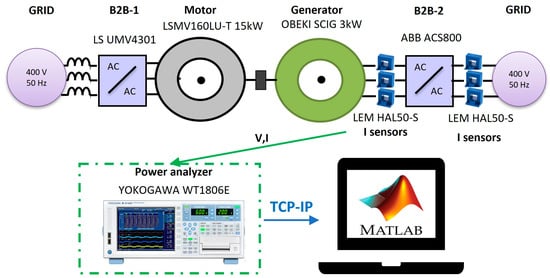
Figure 7.
General scheme of the Electrical PTO Lab.
The motor area is composed of the LSMV160LU-T 15 kW motor, the LS UMV4301 frequency converter to control the motor and the motor control software (CT-soft V01.14.02). These components aim to emulate the behaviour of the WEC (Wave/Wind Energy Converter) under any operational conditions. It is an emulation because the mathematical equations are programmed in the motor control software so that it behaves like the WEC.
The generator area includes the generator, the frequency converter (ABB ACS800 with window drive light software) to control the generator and a Programmable Logic Controller (PLC) with the generator control state machine. This part represents the real equipment that could be connected between the WEC and the grid. The motor and the generator are coupled by means of a shaft where a torque transducer is installed.
The objective of the present study is to analyse the behaviour of the generator of a wave energy converter PTO. Figure 8 shows the configuration of the test rig. The electrical generator under test is a 3 kW Squirrel Cage Induction Generator (asynchronous generator) supplied by OBEKI and has a relation of 1–5 in power with the motor. Its main features are described in Table 1.
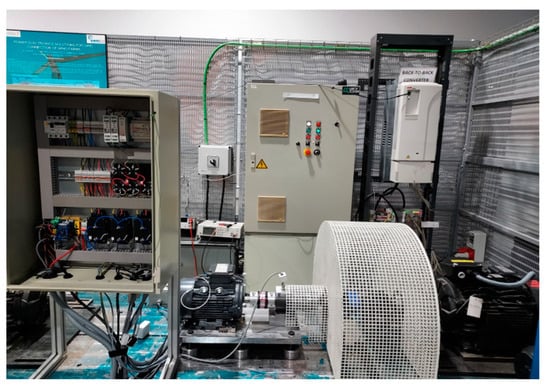
Figure 8.
General view of the test bench.

Table 1.
Main features of the electrical generator.
The objective is to obtain a surface with two inputs, speed and torque (w and T) and one output (efficiency). The efficiency map will be obtained through the execution of a controlled test battery on the generator. Figure 9 shows the power balance of the electrical generator under test. Mechanical input power will depend on the drive torque and rotational speed, while electrical output power or useful power will depend on the voltage (imposed by the power converter to create the magnetic field) and the currents (imposed by the power converter to extract electrical power and control the generator speed).
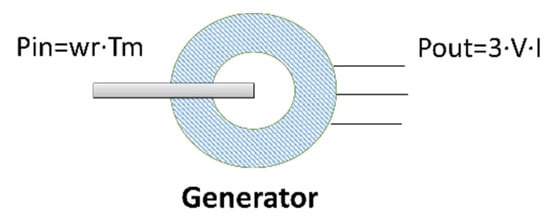
Figure 9.
Input and output power of the electrical generator.
The input power calculation will be performed via the speed measurement from the encoder and the resistive torque of the generator. The output power will be obtained by means of a Yokogawa WT1806 Power Analyzer (Yokogawa Test & Measurement Corporation, Tokyo, Japan) which has a direct connection to measure the voltage and indirect measurement of the current throughout the HAL 50-S current transducer (Figure 7).
The resistive torque is a good representation of the input drive torque when a torque meter is not available. Equation (2) represents the electro-mechanical behaviour of an electrical machine. When there is a variation in Tm, the rotational speed changes. The control law adjusts the resistive torque to be applied and the speed moves to the desired speed. Once stabilised, will be zero and except for the friction losses that can be neglected.
The efficiency at each step will be calculated using Equation (15):
6. Experimental Results and Assessment
The procedure used obtain the efficiency of the generator was carried out as follows: a constant speed reference was imposed by the motor power converter on a step basis from zero to nominal.
For each speed, a set of torques from zero to nominal and over the nominal were imposed and input and output power were registered, which allows for the efficiency calculation.
Besides the electrical power, the voltage and frequency imposed by the converter (due to the generator’s internal control) were also registered as these magnitudes contribute to the generator losses and were used in the calculation.
6.1. Experimental Efficiency Test Results
To obtain a better understanding of the influence of torque and speed on the different types of losses, several cases were defined for a total Capacity Factor (CF) in the range of 4–100%.
The total CF was calculated as CFtorque∗CFspeed. Figure 10 shows the resulting efficiency map of the test cases carried out for each speed/torque combination.
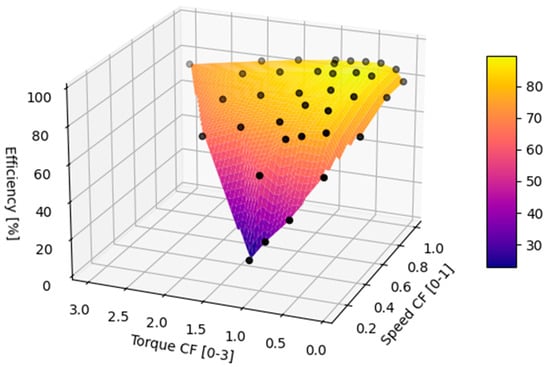
Figure 10.
Map of the generator efficiency results from the tests. Black dots represent individual test results.
The results illustrate that the maximum efficiency point is around 70–80% of the rated load, which is in line with the claim in [35] that the peak point of the curve is usually between 75 and 100% load. In fact, based on the knowledge of this efficiency pattern, many motor users have been sizing motors to carry a load of about 75% of the rated load [36].
6.2. Numerical Efficiency Model vs. Experimental Results
Considering the procedure of generator loss estimation developed in Section 5, a numerical model was built to obtain the overall efficiency at different operation levels. The results represented in Figure 11 show how, despite certain differences in the model output with respect to the experimental results, the numerical model significantly follows the results of the real tests.
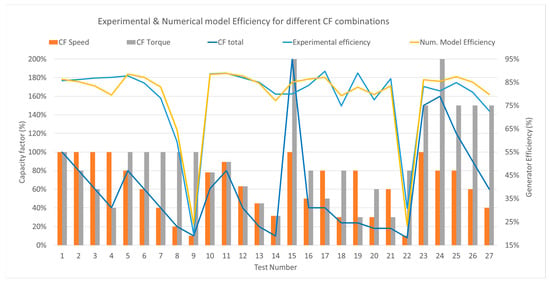
Figure 11.
Generator experimental efficiency vs. numerical model efficiency, speed and torque CF.
This means that the numerical model accurately represents the distribution of losses developed in Section 5. The influence of speed and torque on the efficiency can be assessed from the results in Figure 11. Tests 1, 10, 11, 12, 13 and 14 show the proportional reduction in efficiency when decreasing the torque and speed. The most extended control strategy for an OWC that aims to maintain the time-averaged value of the turbine aerodynamic efficiency at its maximum relies on the relation [26]. The gain for this torque–speed curve is selected for a specific design point offering the best turbine efficiency and depends on the optimum turbine pressure head, optimum mass flow rate, maximum efficiency and diameter [4]. This control strategy intends to keep the turbine at its maximum efficiency range but without consideration of the generator’s efficiency. The results of the present work confirm that a quadratic torque control will also ensure that the generator works in its efficient operation area, which is the most common load type [37]. Tests 5, 6, 7, 8 and 9 show that maintaining the torque and decreasing the speed causes a considerable overall efficiency decrease. On the other hand, tests 1, 2, 3 and 4 that maintained rated speed and decreased the torque show a quasi-constant efficiency experimentally and a slight decrease in the numerical model which means that speed-dependent losses might be overestimated.
6.3. Generator Losses Analysis
Once the numerical model has been validated it is interesting to analyse the influence of the different losses in the overall efficiency map of the generator because it will help to define the best operating region for an energy converter. Figure 12 represents the distribution of generator losses at nominal power obtained through the numerical model.
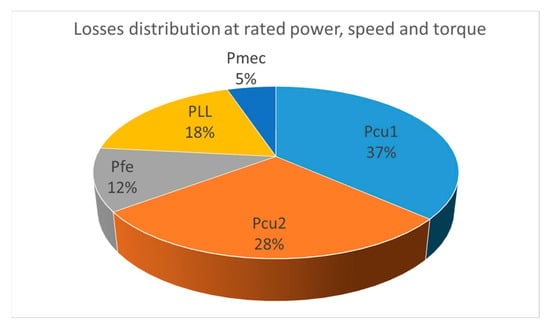
Figure 12.
Distribution of generator losses based on the numerical model, and .
As explained in Section 5, and are stator related losses and and are rotor losses. Mechanical losses represent a low percentage of the total losses. This is common in standard-speed machines, while in high-speed machines these represent the largest loss component [38]. See Figure 13, Figure 14, Figure 15 and Figure 16.
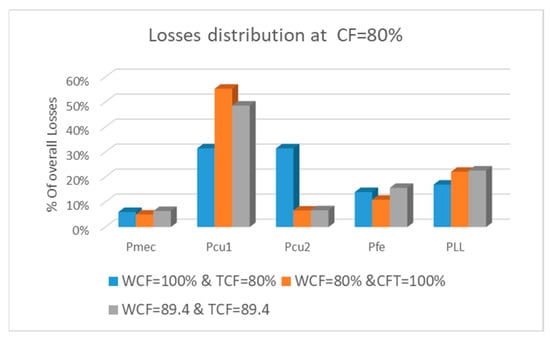
Figure 13.
Distribution of losses at CF 80%.
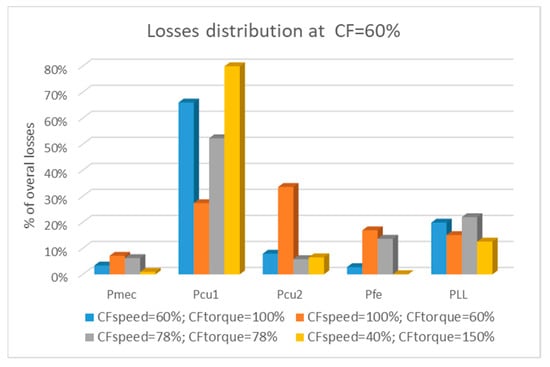
Figure 14.
Distribution of losses at CF 60%.
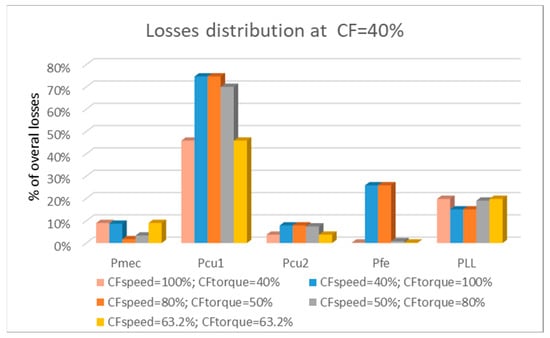
Figure 15.
Distribution of losses at CF 40%.
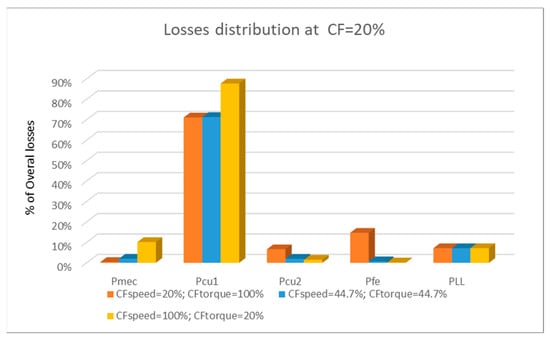
Figure 16.
Distribution of losses at CF 20%.
After analysing the distribution of losses for different global CFs, stator copper losses represent the most important ones (in line with previous studies [39]), being more than 50% of the overall losses in all the cases, with similar numbers to those found in [20]. Mechanical and iron losses are considered load-independent while copper losses and additional load losses depend on the load magnitude [21]. Therefore, increase when the generator torque increases, and with the evolution of the temperature of the stator.
7. Case Study: Oscillating Water Column Generator PTO Efficiency Optimisation with Wells Turbine
Once a generator non-dimensional speed–torque efficiency map has been obtained from the numerical model and validated experimentally at the test bench (Section 6), the next step is to analyse whether the optimal operating points of the turbine are correlated with a good efficiency response of the generator (notice that a quadratic control law is the most common load type [38] in electrical generators).
For this purpose, a specific case study is presented in this section, where a floating OWC OE-buoy [8] with low inertia was considered [12]. These systems provide the opportunity to control the turbine operating point at an instantaneous time step. The original mechanical power curves are represented in Figure 17.
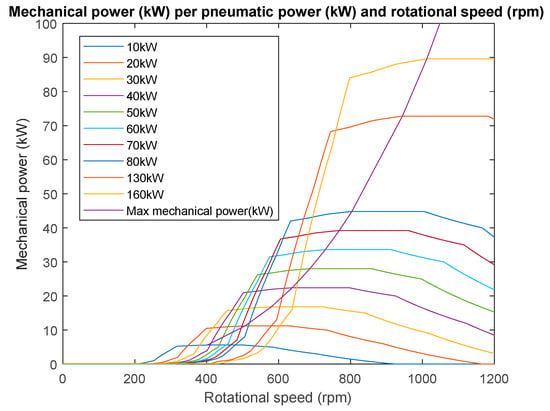
Figure 17.
Representation of OWC mechanical power [12] per pneumatic power and rotational speed.
A non-dimensional relationship between torque and speed was obtained in [12] based on Equation (16):
where D (turbine diameter), (damping constant from experimental tests), (peak value of turbine efficiency coefficient), (optimum nondimensional flow coefficient), (outer turbine diameter) and (inner turbine diameter) are constant.
The present work aims to maximise the electrical power which is, in fact, the profitable power. Figure 18 represents the additional power curves based on the generator efficiency.
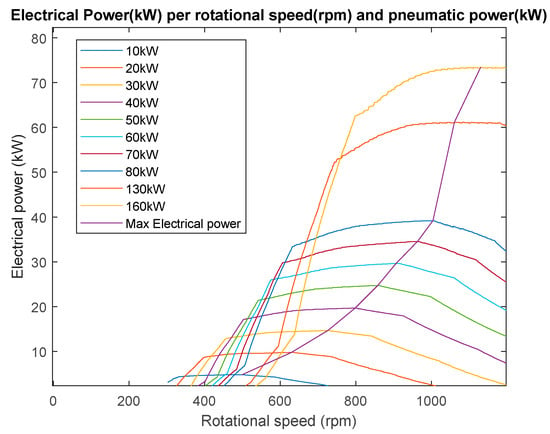
Figure 18.
Representation of OWC electrical power per pneumatic power and rotational speed.
Figure 19 shows a graphical representation of the efficiency of the generator during the different operation regimes. The dashed black line represents the non-dimensional theoretical torque/speed curve of the Wells turbine for maximum power tracking obtained from [12]. At first look, it can be derived that the non-dimensional speed–torque generator efficiency map obtained from the tests matches the maximum efficiency points of the turbine.
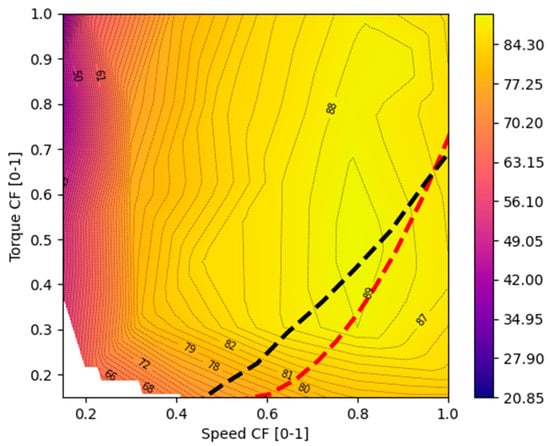
Figure 19.
Generator operation region and efficiency lines. Overlap of the Wells turbine maximum power tracking control law (black dashed line) and new control law optimising electrical power (red dashed line).
A deeper analysis of the electrical power gives rise to the red dashed line which is the real optimal control law that would maximise the electrical output power considering both turbine and generator efficiency. The main finding is that the new control law proposes a slight increase in the speed for the same torque.
Nevertheless, it is worth noting the importance of the nominal power of the generator for maximising the power output because of the capacity factor operating point. In this case, the results show how the optimal turbine control law follows good efficiency torque–speed. However, depending on the characteristics of the WEC, this constant could change and therefore the operating point and the overall efficiency of the system may also change.
A new challenge arises when selecting the nominal power of the generator due to the variability of the resource. The same generator will have to operate at low and high energetic sea states. The WEC PTO should be able to absorb as much energy as possible and operate at acceptable efficiency ranges which means not operating at the low-capacity factor of the generator.
An induction generator can extract energy in two regimes, the steady one and the flux-weakening one [4]. In the steady region, the generator operates normally increasing the voltage and current until nominal power. The flux weakening region starts when the rotational speed is higher than the rated speed. It is a technique for allowing the speed of an electric motor to increase above its rating at the expense of reduced torque, while the power is maintained. Therefore, the flux weakening region allows overspeed but does not extract more power than the rated. A method to increase the power absorption and not be at a low-capacity factor of the generator could be to work at overload during more energetic sea states.
8. Conclusions
This work presented a methodology used to obtain the segregation of losses of an SCIG working at variable operation regimes, which is necessary to have a better understanding of a generator’s performance during the special application of WECs.
The generator equivalent circuit theory used for the segregation of losses was adapted using input data from dedicated tests performed on a test bench. This allowed for a correct characterisation of the generator under variable operating conditions while developing a numerical model for calculating the overall efficiency and was validated using the test bench.
The subsequent analysis of segregated losses showed how the stator copper losses represent the most important ones. This means that by increasing the generator torque, the dominant losses will continue to be the losses.
Finally, an optimal control law to maximise the electrical power output of an OWC with a Wells turbine was presented, considering the efficiency of both the generator and the turbine. The results show that this improved control law proposes a slight increase in the speed for the same torque and enhances the whole efficiency compared to the classical control laws that maximise the mechanical power. A higher nominal power of the generator will have better efficiency, but the tendencies should be the same. Nevertheless, it is recommended to analyse the specific PTO generator efficiency.
Future work will be focused on generator nominal power definition, through efficiency and reliability optimisation, determining how long a generator can operate in overload and analysing the efficiency and thermal behaviour of the generator at these special operating points. The generator segregation of losses will help to analyse the efficiency of the system at overload and to understand what the main losses during this special operation regime are.
For this research, a numerical model of the specific WEC will be required in order to estimate the amount of time the generator will work under such operating conditions as they depend on the dynamic of the device. A thermal study should be completed to determine the stator winding temperature, which will help to deduce the generator’s durability under these unique operating conditions.
Author Contributions
Conceptualization, J.L.-M., E.R., P.R.-M.; methodology, J.L.-M., E.R., P.R.-M., S.C.; software, J.L.-M., J.R.; validation, J.L.-M., E.R., J.R.; formal analysis, J.L.-M., E.R., S.C., J.R.; investigation, J.L.-M., J.R., E.R.; data curation, J.L.-M., J.R.; writing—original draft preparation, J.L.-M., E.R.; writing—review and editing, P.R.-M., S.C.; supervision, P.R.-M.; project administration, P.R.-M.; funding acquisition, P.R.-M.. All authors have read and agreed to the published version of the manuscript.
Funding
The research has been carried out within the framework of the VALID project and received funding from the European Union’s Horizon 2020 research and innovation programme under Grant Agreement No 101006927.
Data Availability Statement
Data is contained within the article.
Conflicts of Interest
The authors declare no conflict of interest.
Appendix A. Asynchronous Generator Equivalent Circuit
The exact equivalent circuit of an asynchronous generator, depicted in Figure A1, is used to compute the generator losses and subsequently determine its efficiency.
To simplify the analysis of the asynchronous generator, the rotor is substituted with an equivalent one so that the rest of the system is not affected by the change. This means that by exchanging the current rotor with an equivalent, stator magnitudes, power flow across the air gap and the magnetic field will not change, and thus, the flux per pole will keep the same value. Moreover, the equivalent rotor is selected such that its winding is identical to that of the stator; i.e., with the same number of phases ( = m1), number of effective turns ( = N1) and winding factor than the stator, and immobile so that its currents will also have identical frequency ( = f1) to those in the stator. The name of this equivalent rotor is the rotor reduced to the stator.
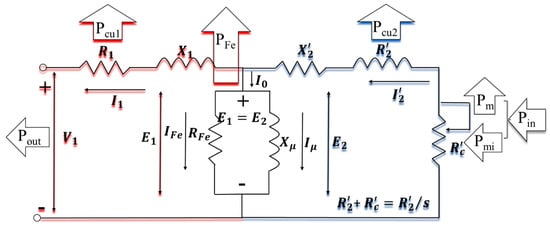
Figure A1.
Exact equivalent circuit of an asynchronous generator.
- Here, and are the resistance and reactance of the rotor reduced (or referred) to the stator. is the load resistance reduced to the stator that is introduced to stand for the mechanical power that the generator would have (as the equivalent rotor is static). This resistance Equation (A1) is variable during the different generator regimes.or to simplify the circuit Equation (A2):where s is the slip.
The parallel branch between the stator circuit (in red) and the rotor circuit (in blue) is called the no-load branch or magnetising branch. RFe is the no-load branch resistance that carries the working component of the no-load current to consider the losses on no-load. is the no-load branch reactance that carries the magnetising component of no-load that produces the flux.
The obtention of the equivalent circuit parameters for a complete characterisation of the generator requires the realisation of several tests in a dedicated test rig. The main reference for these tests is the IEEE Std 112-2004, IEEE Standard Test Procedure for Polyphase Induction Motors and Generators [40]. For the generator used in this work, the manufacturer [41] provided a test report page with the results of the following test procedures carried out in an equal generator:
- -
- No-load test;
- -
- Dielectric strength test;
- -
- Heating tests;
- -
- Load tests;
- -
- Locked rotor tests;
- -
- No load test after heating.
The measured value of stator winding resistance ( was provided. A brief description of the obtention of the rest of the parameters from the test results will be given in the following.
Appendix A.1. No-Load Test
It allows the obtention of and parameters of the no-load branch in the equivalent circuit. It also serves to obtain the mechanical and iron losses of the generator.
During the test the generator must work as a motor, at nominal voltage, without any mechanical load in the shaft, thus, the machine rotates with a free rotor.
It is known that the machine cannot rotate at synchronous speed, but the rotational speed at no load is very close to the synchronous speed. Therefore, from the perspective of the equivalent circuit, since s≈0, the value of the secondary resistance is very high. Furthermore, there is no load coupled to the shaft which implies that all the power dissipated comes from the energy required for friction losses and for the fan used for cooling the machine.
Such a high value of resistance in the secondary causes a very small current circulating through the rotor, . The losses in the rotor copper are therefore negligible.
To sum up, the power absorbed in the no-load test, P0, Equation (A3) comes from the sum of the stator copper losses, , the iron losses, , and the mechanical losses, .
Stator copper losses are calculated by multiplying the no-load current, , by the value of the stator resistance, , which is measured in the direct current test of the asynchronous machine.
To obtain the iron losses, , and the mechanical losses, , various voltage levels must be supplied to the machine, according to Section 6.4.2.3 of the IEC standard [29].
For each level, the supply voltage, , the power absorbed by the machine, P0V, and the no-load current, , must be measured, since iron and mechanical losses are deduced from them for each point according to Equation (A4).
By subtracting the winding losses from the total losses, we get the so-called “constant losses”, as shown in Equation (A4) that are the sum of iron and mechanical losses. They have a parabolic trend, as represented in Figure A2.
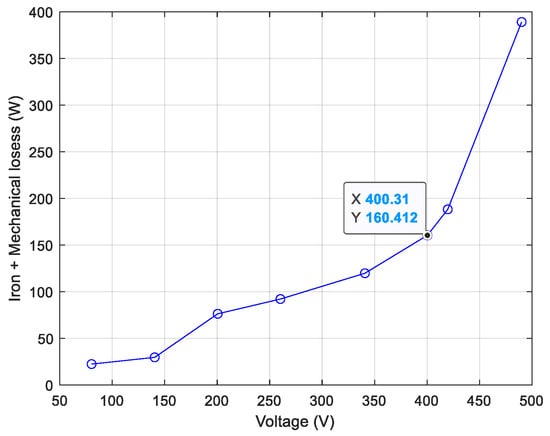
Figure A2.
Iron and mechanical losses as a function of the supply voltage (case study: 3 kW SCIG OBEKI generator).
In renewable energy applications, these losses will not be constant as the generator will not work at a constant speed.
If the parabolic-type curve is extrapolated to its intersection on the ordinate axis, the value of the mechanical losses is obtained, since at that point the supply voltage of the machine is and, therefore, the iron losses are null as there is no flow. To avoid measurement errors, the sum of the iron losses and the mechanical losses are represented as a function of the voltage squared as in Figure A3. In this case, linear behaviour is obtained within the region where magnetic saturation is not present, and a straight line can be extrapolated to zero voltage. The intercept with the zero-voltage axis defines the mechanical losses.
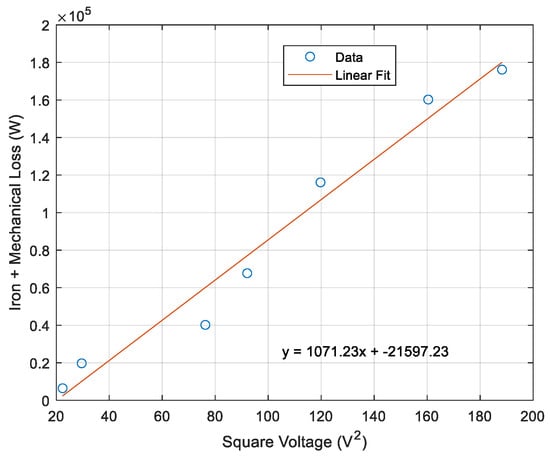
Figure A3.
Linear approximation of iron and mechanical losses as a function of the squared supply voltage (case study: 3 kW SCIG OBEKI generator).
The iron losses are obtained by subtracting the mechanical losses from the constant losses. According to the standard, a curve defining the iron losses as a function of the voltage can be developed. This method provides a constant number for the mechanical losses as it assumes the machine regime will be at nominal speed and voltage. In the case of iron losses, it will only supply a curve as a function of the stator voltage but without considering speed variability.
From the value of the iron losses at nominal voltage, the elements of the parallel branch of the equivalent circuit can be determined according to the following expressions Equations (A5)–(A8):
where:

Table A1.
No-load parameters obtained from the no-load test (case study: 3 kW SCIG OBEKI generator).
Table A1.
No-load parameters obtained from the no-load test (case study: 3 kW SCIG OBEKI generator).
| Parameter | Unit | Value |
|---|---|---|
| ; | - | 0.0386599 |
| rad | 1.53212679 | |
| A | 0.12139209 | |
| A | 3.13765262 | |
| Ω | 3297.6612 | |
| Ω | 127.582639 |
Appendix A.2. Short-Circuit or Blocked Rotor Test
It is used to obtain the short-circuit resistance and short-circuit reactance of the approximated equivalent circuit shown in Figure A4. From them, , and and are obtained, referred to as the stator in the equivalent circuit.
The rotor is locked so that it cannot break free. An increasing voltage is applied to the stator, starting from zero, until the absorbed current is nominal ( per phase). Then, the current, voltage and power input are measured at that point. As the rotor is immobile, the slip and load resistance in the equivalent circuit is . The test is carried out at 1/4 of the rated frequency as recommended by IEEE [19]. Repeating the test for different voltage values will ensure consistency of the results. As the current through the stator may be higher than the rated current, the test should be conducted quickly.
Since the voltage needed to circulate is very small, the magnetising current is very small compared to and the parallel branch can be neglected. The equivalent circuit is shown in Figure A4.
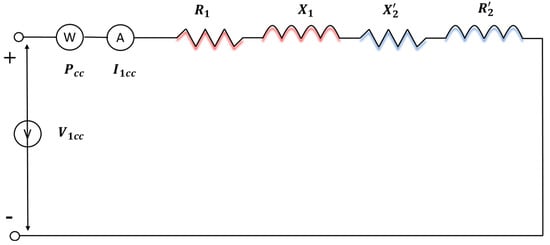
Figure A4.
Equivalent circuit of the asynchronous generator during the blocked rotor test.
The circuit parameters can be obtained as follows (Equation (A9)):

Table A2.
Short-circuit parameters from the locked rotor test (case study: 3 kW SCIG OBEKI generator).
Table A2.
Short-circuit parameters from the locked rotor test (case study: 3 kW SCIG OBEKI generator).
| Parameter | Unit | Value |
|---|---|---|
| - | 0.96915058 | |
| Ω | 5.43085908 | |
| Ω | 7.91029803 |
Appendix A.3. Parameters of the Equivalent Circuit
As R1 is known from the DC test we can obtain R′2. X1 and X′2 can be considered equal, therefore (Equation (A10)):
And finally, the generator equivalent circuit parameters derived from the manufacturer tests:

Table A3.
Electrical generator equivalent circuit parameters (case study: 3 kW SCIG OBEKI generator).
Table A3.
Electrical generator equivalent circuit parameters (case study: 3 kW SCIG OBEKI generator).
| Parameter | Unit | Value |
|---|---|---|
| Ω | 1.35233333 | |
| Ω | 4.07852575 | |
| Ω | 3.95514901 | |
| Ω | 3.95514901 | |
| Ω | 3297.6612 | |
| Ω | 127.582639 |
However, due to the construction process, these parameters can have slight differences in equal machines, and the losses calculation will not be completely accurate.
For the obtention of the real equivalent circuit of a generator, replication of the above tests would be mandatory. However, not all the tests can be as easily reproduced in a standard test rig. At present, can be directly measured in the stator terminals which resulted in 1.55 Ω. Using the available , is updated to 3.88 Ω.
References
- Greaves, D.; Iglesias, G. (Eds.) Wave and Tidal Energy; John Wiley & Sons, Ltd.: Chichester, UK, 2018; ISBN 978-1-119-01449-2. [Google Scholar]
- Magagna, D. Ocean Energy—Technology Development Report 2020, EUR 30509 EN; Publications Office of the European Union: Luxembourg, 2020; ISBN 978-92-76-27283-0. [Google Scholar] [CrossRef]
- Rosati, M.; Henriques, J.C.C.; Ringwood, J.V. Oscillating-Water-Column Wave Energy Converters: A Critical Review of Numerical Modelling and Control. Energy Convers. Manag. X 2022, 16, 100322. [Google Scholar] [CrossRef]
- Faÿ, F.-X.; Robles, E.; Marcos, M.; Aldaiturriaga, E.; Camacho, E.F. Sea Trial Results of a Predictive Algorithm at the Mutriku Wave Power Plant and Controllers Assessment Based on a Detailed Plant Model. Renew. Energy 2020, 146, 1725–1745. [Google Scholar] [CrossRef]
- Falcão, A.F.O.; Sarmento, A.J.N.A.; Gato, L.M.C.; Brito-Melo, A. The Pico OWC Wave Power Plant: Its Lifetime from Conception to Closure 1986–2018. Appl. Ocean Res. 2020, 98, 102104. [Google Scholar] [CrossRef]
- Heath, T.V. The Development and Installation of the Limpet Wave Energy Converter. In World Renewable Energy Congress VI; Elsevier: Amsterdam, The Netherlands, 2000; pp. 1619–1622. ISBN 978-0-08-043865-8. [Google Scholar]
- Touzon, I.; de Miguel, B.; Nava, V.; Petuya, V.; Mendikoa, I.; Boscolo, F. Mooring System Design Approach: A Case Study for MARMOK-A Floating OWC Wave Energy Converter. In Proceedings of the ASME 2018 37th International Conference on Ocean, Offshore and Arctic Engineering, Madrid, Spain, 17–22 June 2018; ASME: New York, NY, USA, 2018; 10, p. V010T09A025. [Google Scholar] [CrossRef]
- WEDUSEA Wave Energy Project. Available online: https://wedusea.eu/wave-energy/our-wave-energy-technology/ (accessed on 7 February 2024).
- Wave Swell. Available online: https://www.waveswell.com/ (accessed on 2 July 2023).
- Ramezanzadeh, S.; Ozbulut, M.; Yildiz, M. A Numerical Investigation of the Energy Efficiency Enhancement of Oscillating Water Column Wave Energy Converter Systems. Energies 2022, 15, 8276. [Google Scholar] [CrossRef]
- Lehmann, M.; Karimpour, F.; Goudey, C.A.; Jacobson, P.T.; Alam, M.-R. Ocean Wave Energy in the United States: Current Status and Future Perspectives. Renew. Sustain. Energy Rev. 2017, 74, 1300–1313. [Google Scholar] [CrossRef]
- Ceballos, S.; Rea, J.; Lopez, I.; Pou, J.; Robles, E.; O’Sullivan, D.L. Efficiency Optimization in Low Inertia Wells Turbine-Oscillating Water Column Devices. IEEE Trans. Energy Convers. 2013, 28, 553–564. [Google Scholar] [CrossRef]
- Fay, F.-X.; Marcos, M.; Robles, E. Novel Predictive Latching Control for an Oscillating Water Column Buoy. In Proceedings of the 12th European Wave and Tidal Energy Conference, Cork, Ireland, 7 August–1 September 2017. [Google Scholar]
- Amundarain, M.; Alberdi, M.; Garrido, A.J.; Garrido, I. Control Strategies for OWC Wave Power Plants. In Proceedings of the 2010 American Control Conference, Baltimore, MD, USA, 30 June 2010–2 July 2010; pp. 4319–4324. [Google Scholar]
- Simonetti, I.; Esposito, A.; Cappietti, L. Experimental Proof-of-Concept of a Hybrid Wave Energy Converter Based on Oscillating Water Column and Overtopping Mechanisms. Energies 2022, 15, 8065. [Google Scholar] [CrossRef]
- Kiran, D.R.; Palani, A.; Muthukumar, S.; Jayashankar, V. Steady Grid Power From Wave Energy. IEEE Trans. Energy Convers. 2007, 22, 539–540. [Google Scholar] [CrossRef]
- Dabala, K. Analysis of mechanical losses in three-phase squirrel-cage induction motors. In Proceedings of the Fifth International Conference on Electrical Machines and Systems (IEEE Cat. No.01EX501), ICEMS’2001, Shenyang, China, 18–20 August 2001; Volume 1, pp. 39–42. [Google Scholar] [CrossRef]
- EN 60034-2:1996/A2:1996; Rotating Electrical Machines—Part 2: Methods for Determining Losses and Efficiency of Rotating Electrical Machinery from Tests (Excluding Machines for Traction Vehicles). SEK Svensk Elstandard: Stockholm, Sweden, 1996.
- Lazarov, V.; Zarkov, Z.; Stoyanov, L. Experimental Study of Losses in Doubly-Fed Induction Generator, Ecological Engineering and Environment Protection. Ecol. Eng. Environ. Prot. 2012, 34–40. [Google Scholar]
- De Almeida, A.T.; Ferreira, F.J.T.E.; Fong, J.A.C. Standards for Efficiency of Electric Motors. IEEE Ind. Appl. Mag. 2011, 17, 12–19. [Google Scholar] [CrossRef]
- Aarniovuori, L.; Niemelä, M.; Pyrhönen, J.; Cao, W.; Agamloh, E.B. Loss Components and Performance of Modern Induction Motors. In Proceedings of the 2018 XIII International Conference on Electrical Machines (ICEM), Alexandroupoli, Greece, 3–6 September 2018; pp. 1253–1259. [Google Scholar]
- Brancato, E.L. Estimation of Lifetime Expectancies of Motors. IEEE Electr. Insul. Mag. 1992, 8, 5–13. [Google Scholar] [CrossRef]
- Kylander, G. Thermal Modelling of Small Cage Induction Motors; Chalmers University of Technology: Göteborg, Sweden, 1995. [Google Scholar]
- Faÿ, X.-F.; Henriques, J.C.C.; Marcos, M.; Robles, E. Review of Control Strategies for Oscillating Water Column Wave Energy Converters. In Proceedings of the 11th European Wave and Tidal Energy Conference, Nantes, France, 6 September 2015. [Google Scholar]
- Falcão, A.F.O.; Henriques, J.C.C.; Gato, L.M.C.; Gomes, R.P.F. Air Turbine Choice and Optimization for Floating Oscillating-Water-Column Wave Energy Converter. Ocean Eng. 2014, 75, 148–156. [Google Scholar] [CrossRef]
- de O Falcão, A.F. Control of an Oscillating-Water-Column Wave Power Plant for Maximum Energy Production. Appl. Ocean Res. 2002, 24, 73–82. [Google Scholar] [CrossRef]
- Veg, L.; Laksar, J.; Sobra, J. Verification of Actual Mechanical Losses on the Rotor of Induction Machine. In Proceedings of the 2017 IEEE Conference on Energy Conversion (CENCON), Kuala Lumpur, Malaysia, 30–31 October 2017; pp. 236–240. [Google Scholar]
- Bucci, G.; Ciancetta, F.; Fiorucci, E.; Mari, S.; Segreto, M.A. The Measurement of Additional Losses in Induction Motors: Discussion about the Actually Achievable Uncertainty. Energies 2019, 13, 78. [Google Scholar] [CrossRef]
- IEC 60034-2-1; Rotating Electrical Machines—Standard Methods for Determining Losses and Efficiency from Tests (Excluding Machines for Traction Vehicles). International Electrotechnical Commission (IEC): Geneva, Switzerland; SEK Svensk Elstandard: Stockholm, Sweden, 2014.
- Aarniovuori, L.; Lindh, P.; Kärkkäinen, H.; Niemela, M.; Pyrhönen, J.; Cao, W. Analytical Evaluation of High-Efficiency Induction Motor Losses. In Proceedings of the 2019 IEEE International Electric Machines & Drives Conference (IEMDC), San Diego, CA, USA, 12–15 May 2019. [Google Scholar]
- Agamloh, E.B. An Evaluation of Induction Machine Stray Load Loss from Collated Test Results. In Proceedings of the 2009 IEEE Energy Conversion Congress and Exposition, San Jose, CA, USA, 20–24 September 2009; pp. 1273–1279. [Google Scholar]
- FP7 Project CORES—Components for Ocean Renewable Energy Systems. Grant agreement ID: 213633. Available online: https://hal.science/hal-01266011/document (accessed on 16 February 2024).
- FP7 Project MARINET—Marine Renewables Infrastructure Network for Emerging Energy Technologies. Available online: https://cordis.europa.eu/project/id/262552/news/es (accessed on 16 February 2024).
- H2020 Project MARINET2—Marine Renewable Infrastructure Network for Enhancing Technologies 2. Available online: https://cordis.europa.eu/project/id/731084/es (accessed on 16 February 2024).
- Agamloh, E.; Butler, K.; Kaufman, N.; Kellum, Z.; Morrison, J.; Welch, D. Achieving More With Less: Efficiency and Economics of Motor Tools. 2006. Available online: https://www.osti.gov/servlets/purl/1034283 (accessed on 23 March 2023).
- Agamloh, E.B. The Partial-Load Efficiency of Induction Motors. IEEE Trans. Ind. Applicat. 2009, 45, 332–340. [Google Scholar] [CrossRef]
- ABB. ABB DRIVES Technical Guide No. 7. Dimensioning of a Drive System. Available online: https://library.e.abb.com/public/e555e5106a3c44e882f48b75a44f6807/Technical_guide_No_7_3AFE64362569_RevD_EN_lowres.pdf (accessed on 23 March 2023).
- Jokinen, T. Losses of High-Speed Induction Motors. Proc. Electrotech. Inst. 2005, 223, 71–79. [Google Scholar]
- de Almeida, A.T.; Ferreira, F.J.T.E.; Fong, J.A.C.; Brunner, C.U. Electric Motor Standards, Ecodesign and Global Market Transformation. In Proceedings of the 2008 IEEE/IAS Industrial and Commercial Power Systems Technical Conference, Clearwater Beach, FL, USA, 4–8 May 2008; pp. 1–9. [Google Scholar]
- IEEE Std 112-2004; IEEE Standard Test Procedure for Polyphase Induction Motors and Generators. Available online: https://engineering.purdue.edu/~dionysis/EE452/Lab12/IEEEstd_112.pdf (accessed on 16 February 2024).
- OBEKI ELECTRIC MACHINES S.L. Available online: https://landings.obeki.com/obeki-brake-motors-for-winches/ (accessed on 3 August 2023).
Disclaimer/Publisher’s Note: The statements, opinions and data contained in all publications are solely those of the individual author(s) and contributor(s) and not of MDPI and/or the editor(s). MDPI and/or the editor(s) disclaim responsibility for any injury to people or property resulting from any ideas, methods, instructions or products referred to in the content. |
© 2024 by the authors. Licensee MDPI, Basel, Switzerland. This article is an open access article distributed under the terms and conditions of the Creative Commons Attribution (CC BY) license (https://creativecommons.org/licenses/by/4.0/).