1. Introduction
In the last few decades there has been a dramatic increase in global energy consumption, essentially due to industrialization and demographic growth. As a result, the environmental impact connected to the energy sector is getting more and more intense, with the relative CO2 emissions intensifying on the global scale. To improve the total efficiency of the energy system, a possible path is the application of energy storage devices. Indeed, these can mitigate the gap between energy demand and supply, by collecting the energy in excess when then demand is low and releasing it when the demand is high.
Different types of energy storage systems (ESSs) exist, and these can be distinguished depending on storage time, efficiency, as well as the amount of energy stored. These systems could store energy in forms like mechanical, thermal, and so on, or in a hybrid form that includes different types [
1]. The importance of these technologies lies in the fact that they have the potential to reduce environmental impact related to heating and cooling processes. Worldwide, heat represents about 50% of final energy consumption, and is responsible for 40% of CO
2 emissions [
2]. For this reason, it is necessary to develop some strategies that can both satisfy increasing demand and mitigate pollution and energy wastefulness. For thermal energy storage systems, the most common classification is based on the type of thermal exchange among source, storage, and user. In relation to this parameter, there are three categories: sensible heat thermal energy storage systems (SHTES), latent heat thermal energy storage systems (LHTES) and thermochemical thermal energy storage systems (TCTES).
The present work is focused on latent heat thermal storages with phase change materials (PCMs) as storage materials. The advantage is that the operation is nearly isothermal, and there are high energy quantities stored, as compared to conventional SHTES. For these reasons, nowadays, they are receiving more and more attention from the worldwide scientific community [
3,
4].
PCMs can be classified into three categories: organics, synthetics, and eutectics. The organic ones have high storage density with small temperature differences during melting or solidification. They are divided into paraffin waxes and fatty acids [
5]. The synthetic ones have distinct melting points with high latent heat, high specific storage capacity and excellent thermal conductivity. They are divided into salt hydrates and metallic ones [
6]. Finally, the eutectics ones are blends of two or more components that do not interact to create a new chemical compound, but the crystallization process is inhibited if these are mixed in certain proportions, producing one mixture with a melting temperature lower than its starting components. They are metal alloys formed by tin, zinc, lead, copper, cadmium, and bismuth.
However, the main barrier to the diffusion of PCMs is their low thermal conductivity. Scientists are trying to face up to this using several strategies, such as nanoparticles (NP) use, saturation by means of porous materials, form stabilization, encapsulation, and the use of fins. As regards the use of nanoparticles, recent studies have demonstrated that the addition of NP guarantees higher thermal reliability and velocity of heat transmission. The thermal conductivity of NEPCM is 20–100% higher than that of pure PCM [
7]. The union of PCMs and porous materials produces form-stabilized phase change materials, characterized by a better thermal conductivity and lower energy losses. Scientists have examined the implementation of porous metal foams inside paraffin waxes, obtaining very good thermal performances [
8]. By means of physical or chemical process, called micro-encapsulation or simply encapsulation, the PCM is surrounded with a coherent and stable shell. This technique improves PCM properties such as thermal stability and efficiency [
9]. On the other hand, in relation to the use of fins, results obtained with the insertion of several fins inside an encapsulated PCM into a spherical shell showed a charging time that was reduced more than 50% in the capsule with six fins in comparison with the one with no fins [
10].
The present work is also focused on the integration of PCMs into heat exchangers. For this type of application, an example is the development of a bi-dimensional mathematical model based on the enthalpy method to predict the thermal behaviour of an LHTES system filled up with three different phase change materials and used in solar energy applications. The three PCMs considered, called PCM1, PCM2 and PCM3, are the following: K
2CO
3 (51% in mass) + Na
2CO
3 (49% in mass); Li
2CO
3 (20% in mass) + Na
2CO
3 (60% in mass) + K
2CO
3 (20% in mass); Li
2CO
3 (30% in mass) + K
2CO
3 (35% in mass) + Na
2CO
3 (35% in mass). From the results of the analysis, it was concluded that the PCM3 guaranteed a higher melting rate in both the considered directions [
11]. Several tests showed that the heat transfer can be improved thanks to liquid PCM convection. However, one should neglect this effect during solidification [
12]. Further, several studies have been carried out to determine the influence of design parameters on the energetic performances of latent heat energy storage systems consisting of PCMs integrated in a shell and tube heat exchanger, and also analysed the performances of finned tube heat exchangers [
13,
14,
15]. Another example concerns cooling energy storage, and consists of an experimental investigation conducted on a storage system composed of 18 counter-flowing spiral coils immersed into 1450 kg of the commercial PCM RT8 (a paraffin with a melting temperature of 4–8 °C). In this case, the best performances in terms of energy losses and costs were obtained using a low inlet temperature and flowrate [
16]. Another study has examined the performances of a vertical shell and tube heat exchanger filled up with biological phase change material, connected to a cooling system capable of satisfying the necessities of a single-family house of 150 m
2 [
17]. Elsanusi et al. [
18] analyzed a horizontal heat exchanger with different PCMs, while a zig-zag configuration has been studied by Wang et al. [
19].
Some scientists have examined the use of a compact finned PCM heat exchanger for TES, seeking to analyze the effect of mass flow rate on PCM charging and storage efficiency. They established that the impact of mass flow rate is lower than that of fluid inlet temperature. In addition, higher flow rates lead to a faster phase change process and a lower system efficiency [
20]. A numerical model based on the FEM technique has been developed to study storage systems for HVAC applications, such as PCM-to-air heat exchangers [
21]. It has been found that the rate of heat transfer is dependent upon temperature, velocity, and channel diameter on the airside. Another study evaluated the thermal behavior of the tank used for cooling energy storage. Two different storage materials were compared: water and a microencapsulated PCM with a transition temperature equal to 10 °C. The results demonstrate that the use of PCM offers several advantages, as, for example, at the same volume it allowed the storage of 35.5% of additional cooling, but at the expense of a higher recharge time [
22]. In another study, the use of either PCM (RT 15) or water was also compared. The results show that the phase change material guaranteed higher storable energy (until the 53% extra) even if the thermal exchange coefficient was lower than in the case where the water was chosen [
23].
In recent years, personal or local cooling systems have been receiving increasing interest from the scientific community, since they can guarantee the desired thermal conditions in a limited space, as for example a specific location in an office, with a reduction in the overall energy consumption. In fact, they allow one to set the set-point temperature of the centralized air-conditioning system to higher values, without affecting the local comfort conditions guaranteed by the local cooling systems, and this can lead to sensible energy and cost savings.
An example of a personal cooling system is a vapor compression system coupled with a condenser filled with phase change material [
24]. This technology had two modes of operation, namely, the cooling mode, and PCM regeneration through the so-called radiator cycle. The performances of five possible shell and tube heat exchangers were compared and examined. From the results of several tests, the authors certified that the capacities of the condenser were very similar amongst the different analyzed types, with variances lower than 5%. Similar applications have been analyzed in the works of Dhumane et al. [
25,
26] and Quiao et al. [
27].
The present work deals with a novel application of PCM in a personal cooling system. The cooling system, designed for a personal cooling application, was experimentally analyzed by varying the configuration of the PCM-based condenser, and numerically simulated using a commercial solver. In the following, the characterization of the adopted commercial PCM realized by means of a differential scanning calorimeter (DSC) is presented first. Successively, the experimental apparatus realized to test the refrigeration system with a PCM-based condenser in different configurations is described, and experimental results are presented. Finally, the simulation model developed for the numerical simulation of the PCM melting process in the condenser is presented in detail, and numerical results are presented and discussed.
2. PCM Characterization
This section reports the results of the experimental characterization, performed using a differential scanning calorimeter (DSC), of the commercial PCM that has been selected for the present application, namely, the RT35HC, produced by Rubitherm Technologies GmbH, for the evaluation of latent heat of fusion.
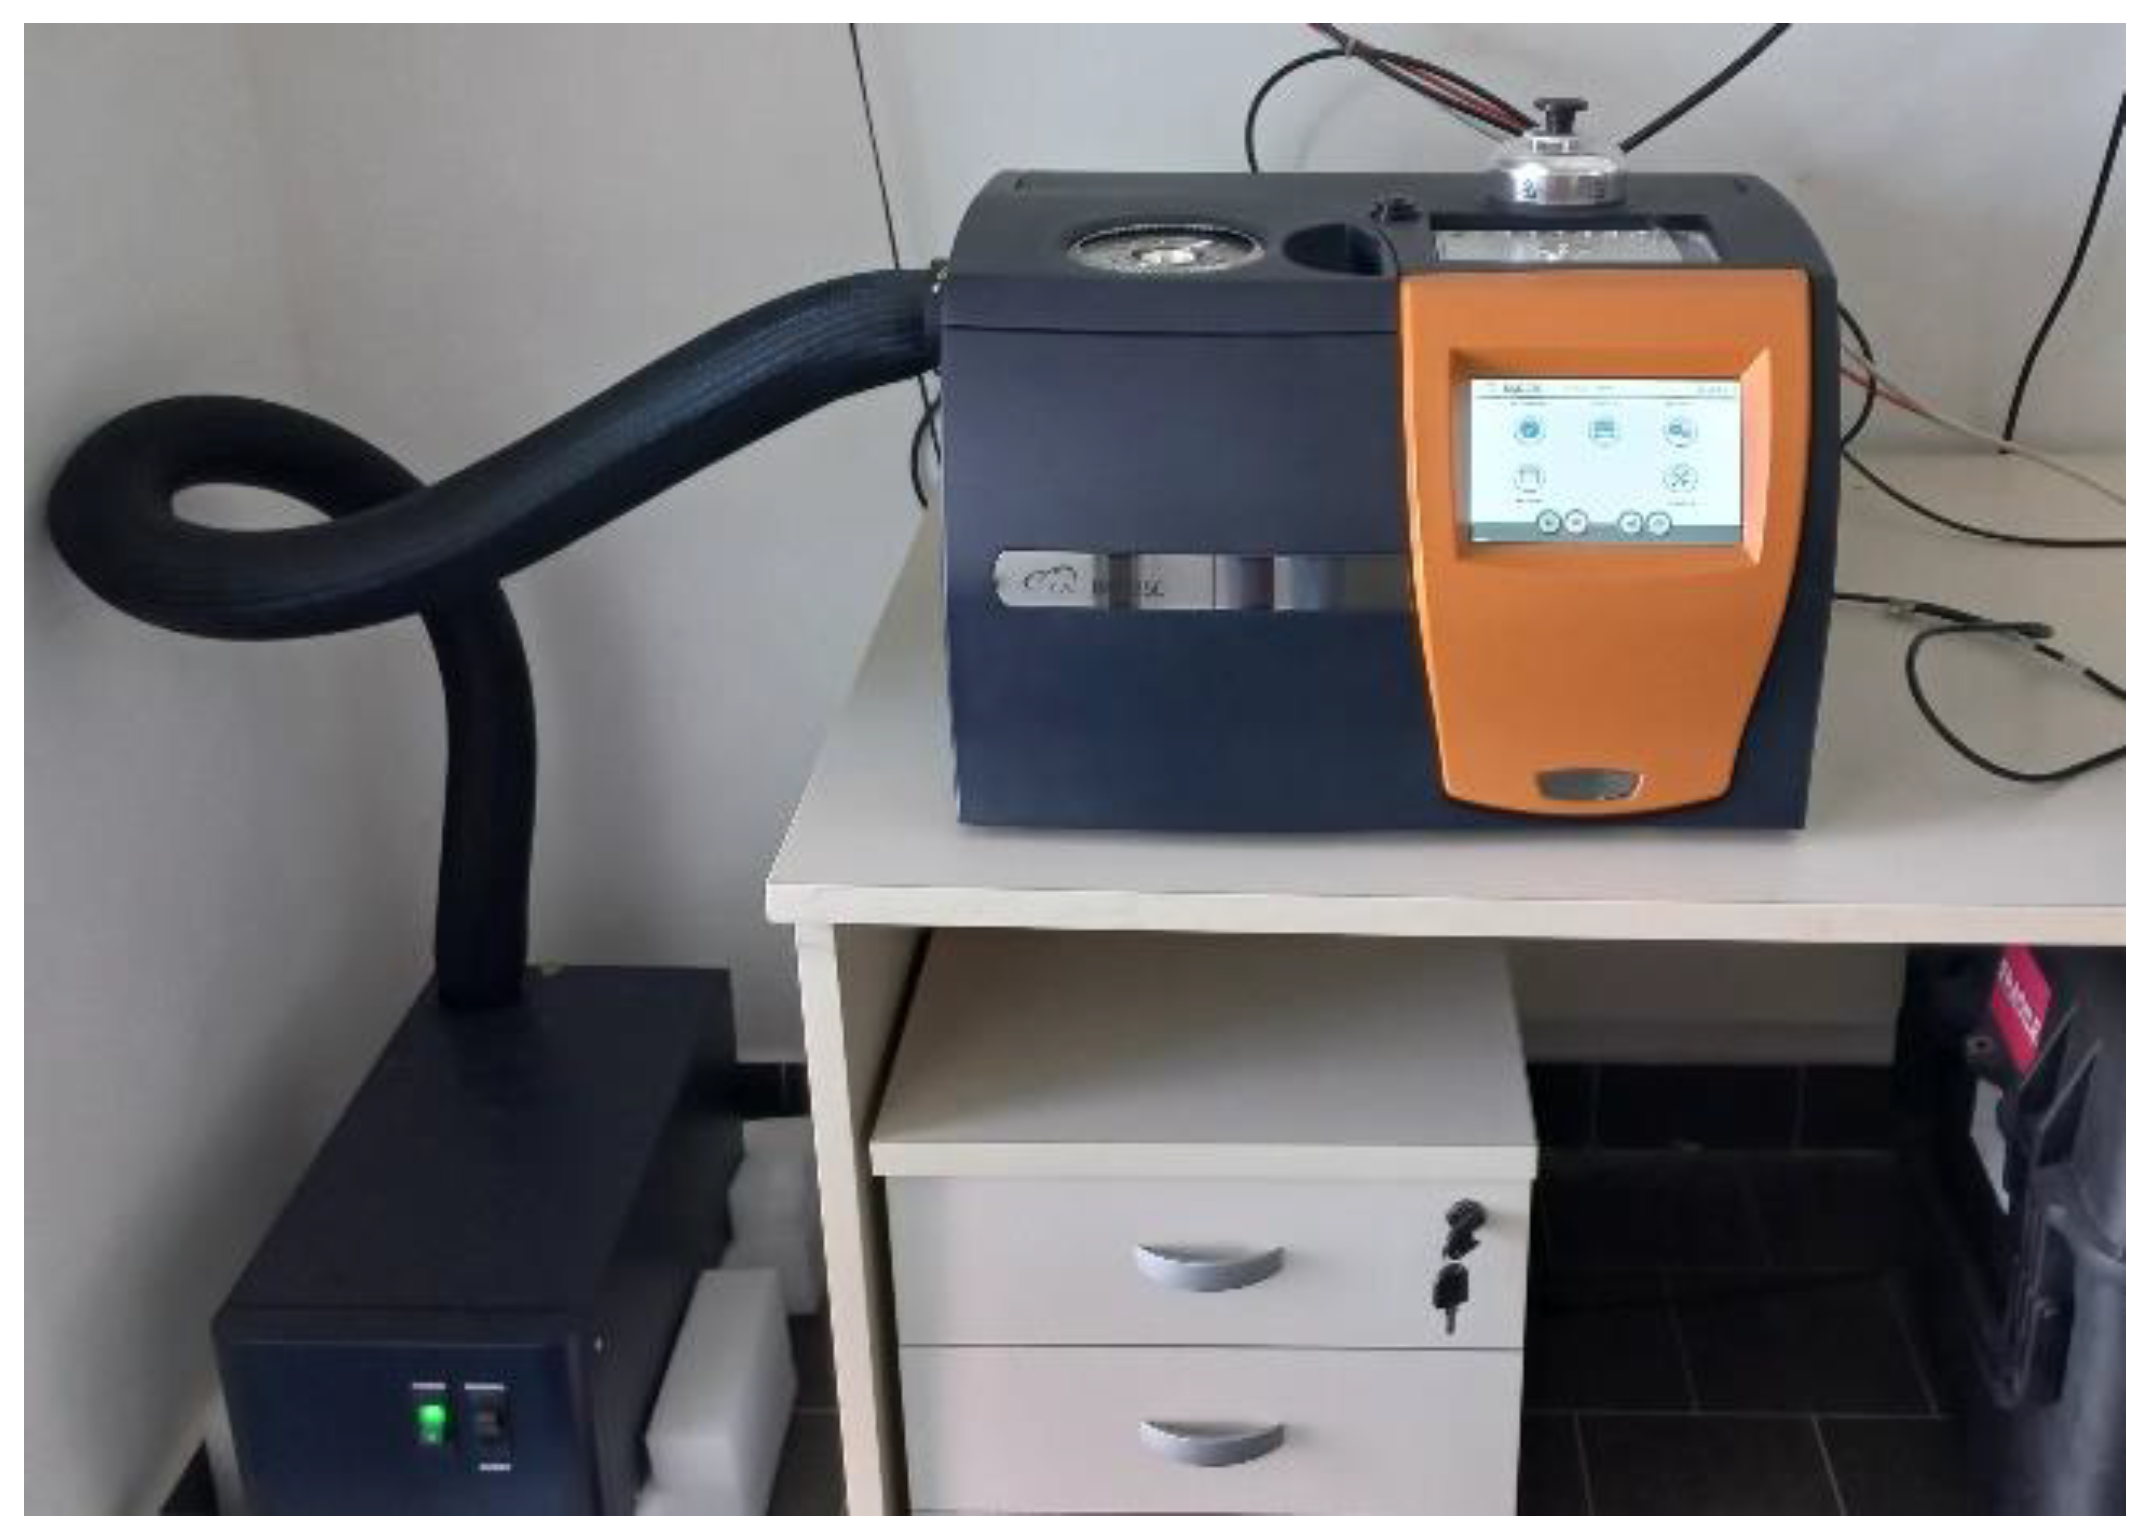
Figure 1 shows a picture of the calorimeter that was used (TA Instruments DSC 250), while
Table 1 lists its main technical specifications.
The samples were subjected to the following thermal steps:
Ramp from 40 °C to 15 °C at 5 °C/min;
Isothermal 10 min;
Ramp at X °C/min to 55 °C;
Isothermal 5 min;
Ramp at X °C/min to 15 °C;
Isothermal 5 min.
The symbol “X” indicates the heating/cooling ramp velocity. Some researchers suggest setting this value at a relatively high value, as for example 10 °C/min; others instead suggest a value lower than 0.5 °C/min [
28]. For this reason, to be independent from this parameter, different values of X have been implemented. Further, even more tests have been realized with different quantities of PCM, to evaluate the influence of the PCM mass on the DSC results.
Figure 2 (heat flow obtained using 8.13 mg of RT35HC at 1 °C/min rate) shows the normalized heat flow as a function of temperature in the case with a sample consisting of 8.13 mg of RT35HC with X equal to 1 °C/min. We can identify the presence of double peaks during solidification, and also a different temperature for the solidification as compared to the melting one. The reason for this is traceable in the scientific literature. Indeed, many PCMs are mixtures characterized by a lack of homogeneity in their composition. During melting, thanks to the intermolecular interactions among the several components, which have different molecular weights, the mixture can undergo homogeneous melting (unless the heating/cooling velocity is too low). Instead, during solidification, many different peaks can arise due to the different solidification processes of the components. Indeed, the greater the molecular weight of the component is, the greater its freezing point will be [
29]. Moreover,
Figure 2 (heat flow obtained using 8.13 mg of RT35HC at 1 °C/min rate) also shows a discontinuity in the heat flow relative to the solidification phase, probably due to a spatial redistribution (verified with a microscope) of the material during that phase. Indeed, the liquid PCM covered the whole bottom surface of the pan. When the solidification started, the PCM solidified, producing several concentric crowns where the crystallization nucleuses were concentrated. This process proceeded gradually, until the material exhibited a sudden solidification. This moment coincided with the graphical discontinuity.
As concerns the effects of the heating/cooling rate, it was noticed that if the heating/cooling rate increased, the resulting melting temperature became higher; for the opposite, the solidification temperature was lower. The reason for this is associated to the thermal gradient inside the sample. In particular, during the melting process, the sample’ inner temperature was lower than its surface temperature due to the thermal resistance of the sample material. Consequently, the temperature of the sample was overrated. When the heating velocity increased, this temperature difference also increased. So, although the surface was well beyond the value of melting temperature, the sample still absorbed latent heat, and for this reason the melting temperature moved towards higher values [
30].
In the following table (
Table 2), the results of the experiments are listed.
The results of the numerical simulation realized to simulate the PCM melting phase, which will be shown later, have been obtained using the mean value of the latent heats of fusion reported in
Table 2, i.e., 223,800 J/kg, that is very similar to the value provided by the producer [
31].
3. Experimental Apparatus
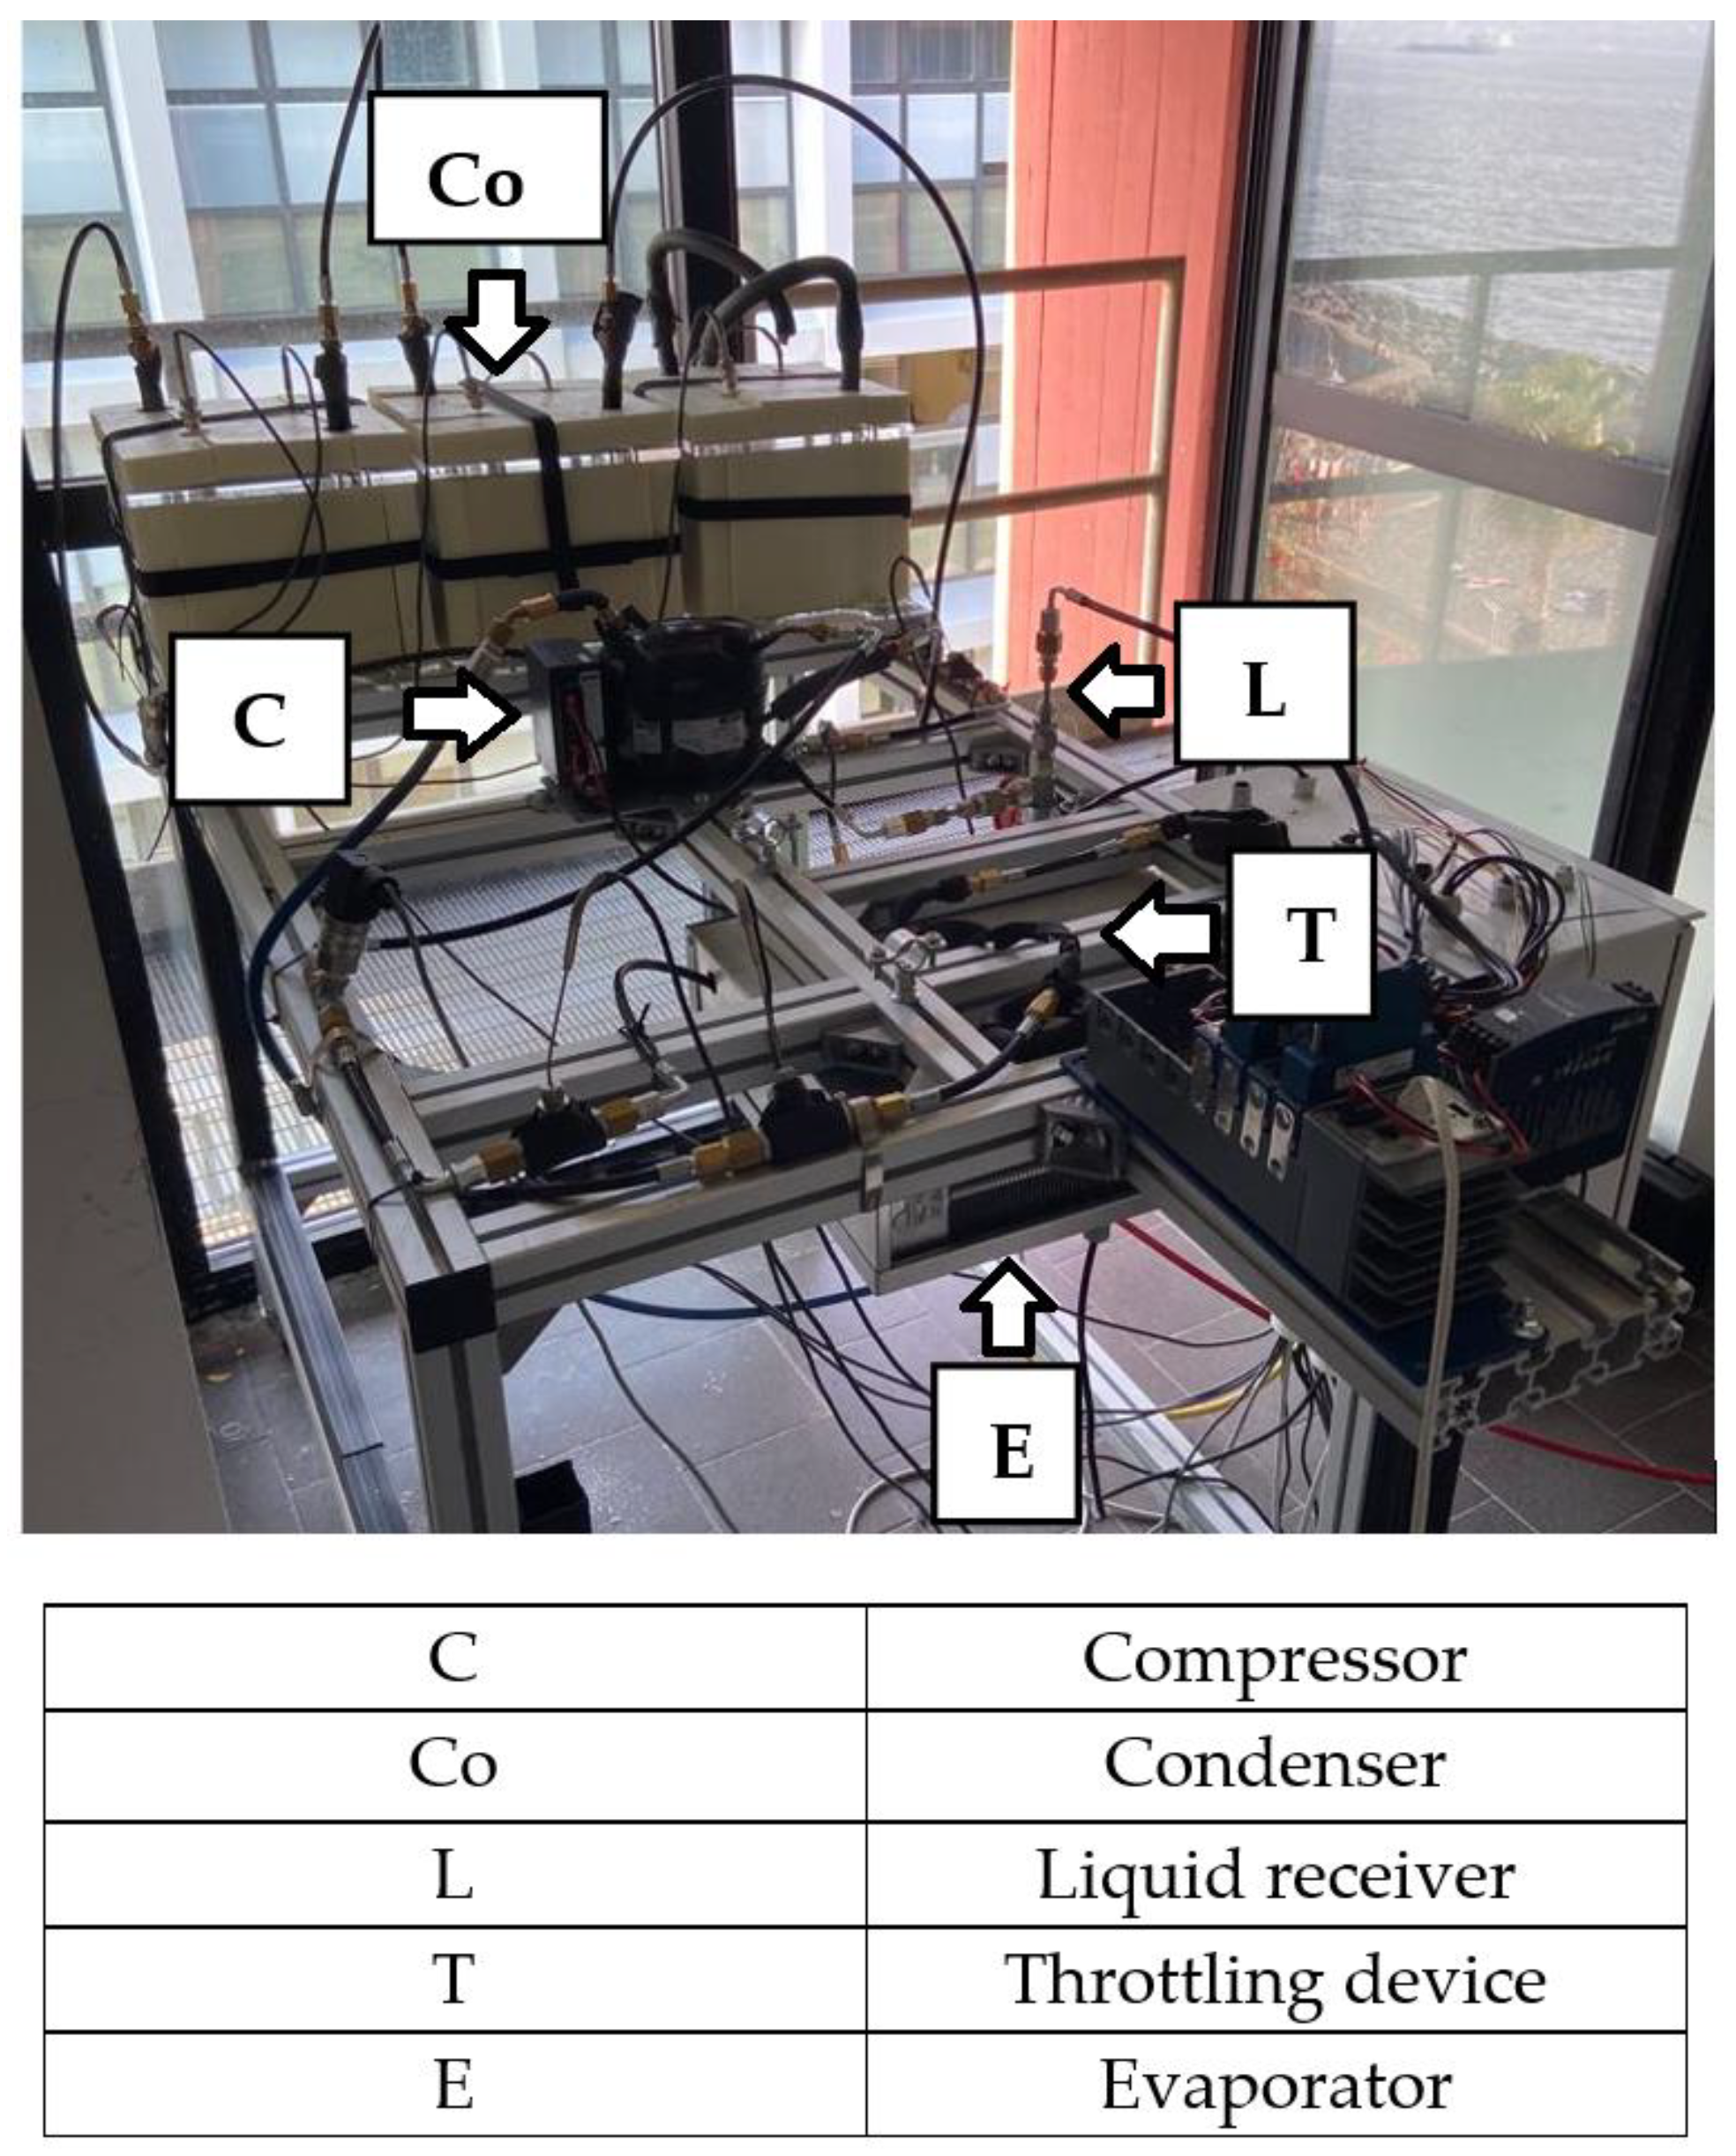
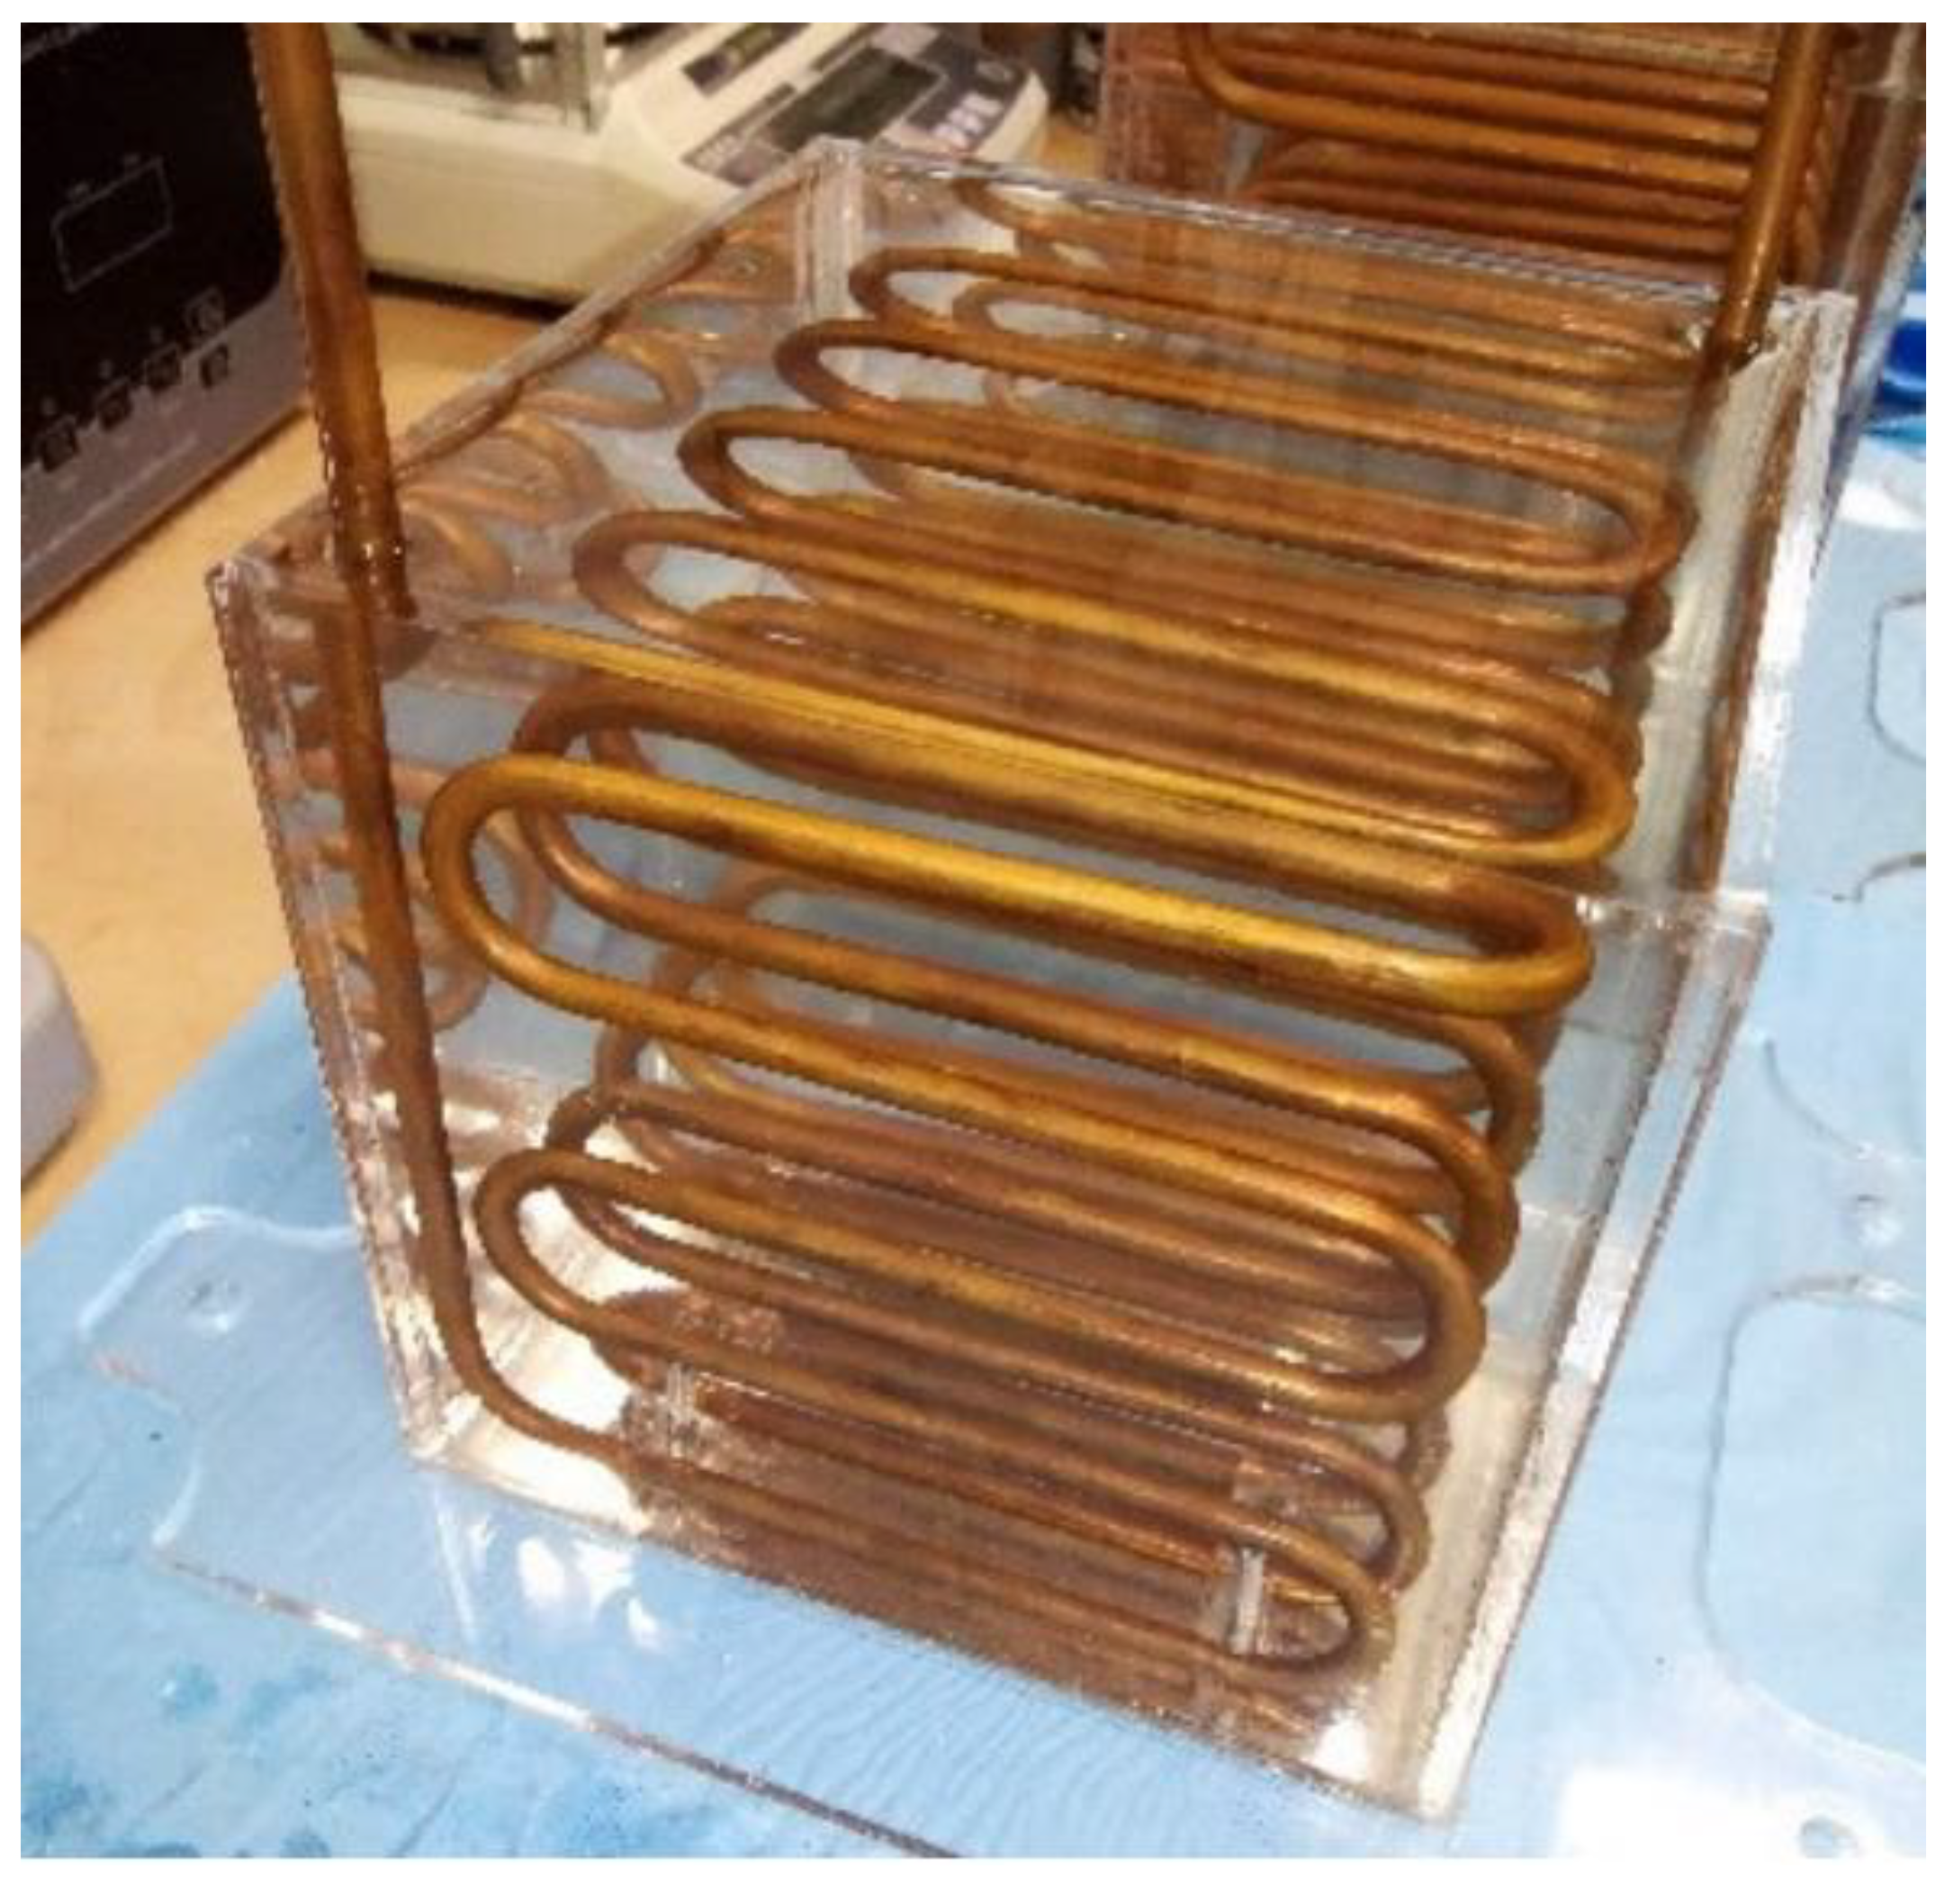
Figure 3 shows the laboratory apparatus realized for the experimental analysis of the refrigeration cycle of the personal cooling system, with the condenser integrated with the PCM presented in the previous section. The main components of the apparatus are: the compressor (Danfoss BD50F); the PCM-based condenser composed of three modules, each consisting of an insulated plexiglass cube with a 17 cm side containing a copper serpentine tube in which the refrigerant circulates, shown in
Figure 4 without the thermal insulation; the liquid receiver; the throttling device (in this case a 5.25 m capillary tube with an internal diameter of 0.86 mm); the evaporator (RIVACOLD RS1040). The nominal diameter of the circuit piping is DN4, with flexible tubes (ZEC FRST270N) connecting the circuit components.
The refrigerant temperature was measured in four different points of the circuit, namely, the characteristic points 1, 2, 3, and 4 of the thermodynamic cycle (to be introduced later), using four class A Pt100 Resistance Temperature Detectors (RTDs), and six class A Pt100 RTDs were used to monitor the temperature of the PCM with reference to various points within the condenser. In particular, two temperature measurements were taken for each module. The first was performed starting from the box base, at a height of 4.2 cm; on the other hand, the second was done at 9 cm. Moreover, two other class A RTDs were used to measure room air temperature and the air temperature at the evaporator outflow. The accuracy of the class A RTDS is ±0.15 °C (IEC 751). Pressure relative to points 1 and 2 in the cycle was measured by two pressure sensors of Danfoss AKS 32. The accuracy of these sensors is ±0.06 bar. These have been used to establish the pressure at points 1 and 2 of the thermodynamic cycle. The experimental data acquisition was realized using NI LabView 2018 software. The following NI components were used: NI cRIO-9053 Controller, two-modules NI-9216 (RTDs), one-module NI-9239 (pressure transducers) and one-module NI-9425. The last was also used to obtain a digital output in order to switch on and off, via the LabView interface, the compressor and evaporator. The Lenovo Thinkpad E565 computer was used for data acquisition, and the sampling time was fixed to 1 s.
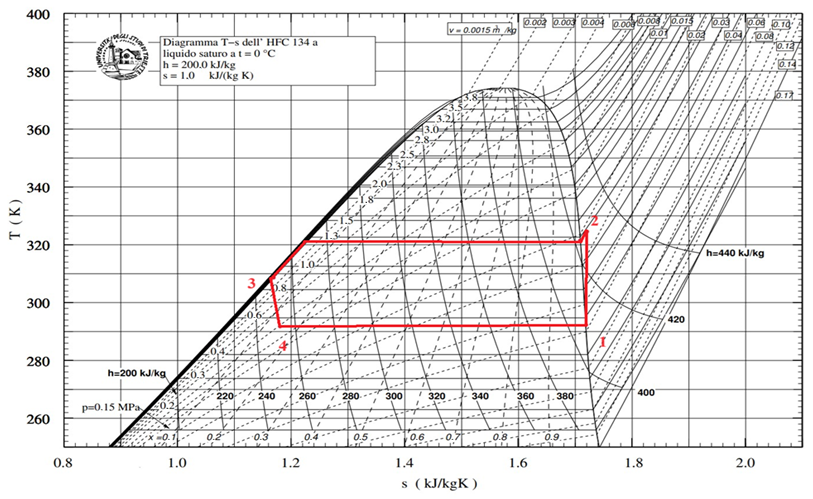
The components of the experimental apparatus were selected and sized on the basis of the theoretical thermodynamic cycle of the refrigerant fluid R134a shown in the temperature–entropy diagram of
Figure 5. The goal of the experimental phase was, therefore, to get as close as possible to this cycle, with a useful refrigerating power of 100 W at the evaporator.
The following table (
Table 3) shows the thermodynamic properties at the thermodynamic cycle points. Such properties were computed by considering that a heat rate of
Qev = 100 W at the evaporator, a condensation temperature of about 50 °C, an evaporation temperature of about 11 °C, and a compressor efficiency of 0.75. The above refrigerant condensation temperature, and the PCM RT35HC (melting around 35 °C), were chosen in order to obtain a relatively high temperature difference (15 °C), and as a consequence a consistent heat exchange between the refrigerant and the PCM during refrigerant condensation (and PCM melting). Similarly, the evaporation temperature was chosen to have a relatively high temperature difference between the refrigerant and values of room air temperature in the range 21–26 °C. Under these assumptions and thermodynamic points, the mass flow rate is given by:
The heat exchanged at the condenser
Qco can be calculated using the following equation:
Table 3.
Points of the thermodynamic cycle—physical properties from Refprop [
32].
Table 3.
Points of the thermodynamic cycle—physical properties from Refprop [
32].
| Thermodynamic Point | T (°C) | P (bar(a)) | v (m3/kg) | h (kJ/kg) | s (kJ/(kgK)) | x |
|---|
| 1 | 11.10 | 4.30 | 0.0477 | 404.928 | 1.722 | 1.000 |
| 2s | 53.89 | 13.20 | 0.0155 | 428.144 | 1.722 | \ |
| 2 | 60.46 | 13.20 | 0.0163 | 435.882 | 1.745 | \ |
| 3 | 50.06 | 13.20 | 0.00091 | 271.721 | 1.238 | 0.000 |
| 4 | 11.10 | 4.30 | 0.0148 | 271.721 | 1.253 | 0.298 |
It must be noted that, for the experimental apparatus, it was necessary to oversize the compressor, as compared to the one that would be used in a real prototype, since the system was equipped with various measuring devices that contribute to generating concentrated pressure losses. Additionally, the quantity of pipes should not be so large so as to limit the cost, and also limit distributed pressure losses.
5. Numerical Simulation of the First Module of the Condenser
This section deals with the numerical simulation of the melting process of the PCM included in first module of the PCM-based condenser of the low-scale refrigeration system developed to analyze personal cooling applications. In particular, the simulated case is the one with the serpentine length of 5.13 m.
Nowadays, the use of Computational Fluid Dynamics (CFD) is becoming increasingly widespread as a useful instrument to resolve many problems concerning the flow of fluids and connected phenomena, such as thermal exchange, mass exchange, and chemical reactions. Hence, in the present study, a CFD model was developed and validated through comparison with the experimental results. The objective was to develop a numerical tool that could provide useful indications about the realization of real prototypes without performing a number of complex and costly experimental tests.
5.1. Simulation Model
The numerical model is based on the enthalpy–porosity method [
33,
34] and has been solved by means of the finite element commercial software COMSOL Multiphysics 5.5 using second-order schemes.
The assumptions made are outlined in the following. It was assumed that materials were homogeneous and isotropic, that phase change occurred within a certain temperature difference, the initial temperature of the phase change material was uniform, the volume change during the phase change could be neglected, the liquid PCM was Newtonian, and the liquid PCM flow was incompressible (density was assumed to be constant and equal to the arithmetic mean of the liquid density and solid density).
The thermophysical properties of the PCM are reported in
Table 5:
To account for the phase change, the following function, say
θ(T), is defined in Equation (4):
Continuity equation assuming an incompressible flow:
The momentum balance can be represented by the following equation:
where
represents a constant density equal to the arithmetic mean of the values of both phases, and therefore was 825 kg/m
3.
represents the buoyancy force, according to the Boussinnesq approximation:
In Equation (7), the term
represents the coefficient of thermal expansion equal to 0.0006 K
−1. A value of 4.4 mPa s is set for the viscosity
. The last term on the right side of Equation (6) represents the Carman–Kozeny source term that accounts for the phase change, forcing the solution to have a null velocity when temperature is below the phase change temperature. This term is given by the equation:
where the source term
S(
T) is derived from the porous media theory, also known as the Carman–Kozeny porosity term:
with the term at the denominator
δ set equal to 0.001 to avoid any divisions with zero. The other constant,
Amush, is arbitrary, and set equal to 10
3.
According to the apparent heat capacity formulation, one can write the energy balance:
where the heat capacity at constant pressure is defined by Equations (11) and (12):
where
LH is the latent heat of fusion.
As regards the fluid dynamics boundary conditions, a no-slip condition at both serpentine tube walls and box boundaries was imposed, while the initial conditions prescribed null velocity and atmospheric pressure in the whole domain.
Concerning the thermal boundary conditions, the box walls were assumed to be thermally insulated, and a heat flux was imposed on the serpentine tube walls. This flux was given using Equations (13) and (14):
where
d is the coil nominal diameter (8 mm) and L is the length (5.13 m). ∆T is the difference between the R134a condensation temperature and the PCM bulk temperature. R
tot is the total resistance due to the series of the convective resistance refrigerant-coil side, the conductive resistance across the thickness of the coil, and finally the convective resistance coil-PCM side. This was calculated in the following way:
where d
e is the outer diameter of the serpentine tube (13.72 mm) and d
i the inner one (10.418 mm). The parameter k is the thermal conductivity of the copper (390 W/(m·K)) and h
cn is the convective heat transfer coefficient for the natural convection among serpentine tube walls and the phase change material, equal to 90 W/(m
2·K). Lastly, the parameter h
tf is the convective heat transfer coefficient connected to the condensation of R134a, which flows inside the serpentine heat exchanger. It can be calculated by means of the correlations found in the scientific literature.
The correlations are given by the following equations [
35]:
where
hLO is the heat transfer coefficient assuming the liquid phase flowing alone in the tube (W/m
2K),
Z is a correlating parameter introduced by Shah in 1979,
is the liquid dynamic viscosity (1.2733 × 10
−4 Pa·s),
is the vapour dynamic viscosity (1.343 × 10
−4 Pa·s), p
r is the reduced pressure (0.394), Re
LO is the Reynolds number assuming liquid phase flowing alone, ρ
L is the liquid density (1064.96 kg/m
3), ρ
G is the vapor density (82.64 kg/m
3), g is the gravity acceleration (9.81 m
2/s), Pr
L is the Prandtl number of the liquid (3.105), k
L is the thermal conductivity of the liquid phase (0.06699 W/(m·K)),
D is the outer diameter of the serpentine tube, x is the vapour quality and finally
G is the total mass flux (132.23 kg/m
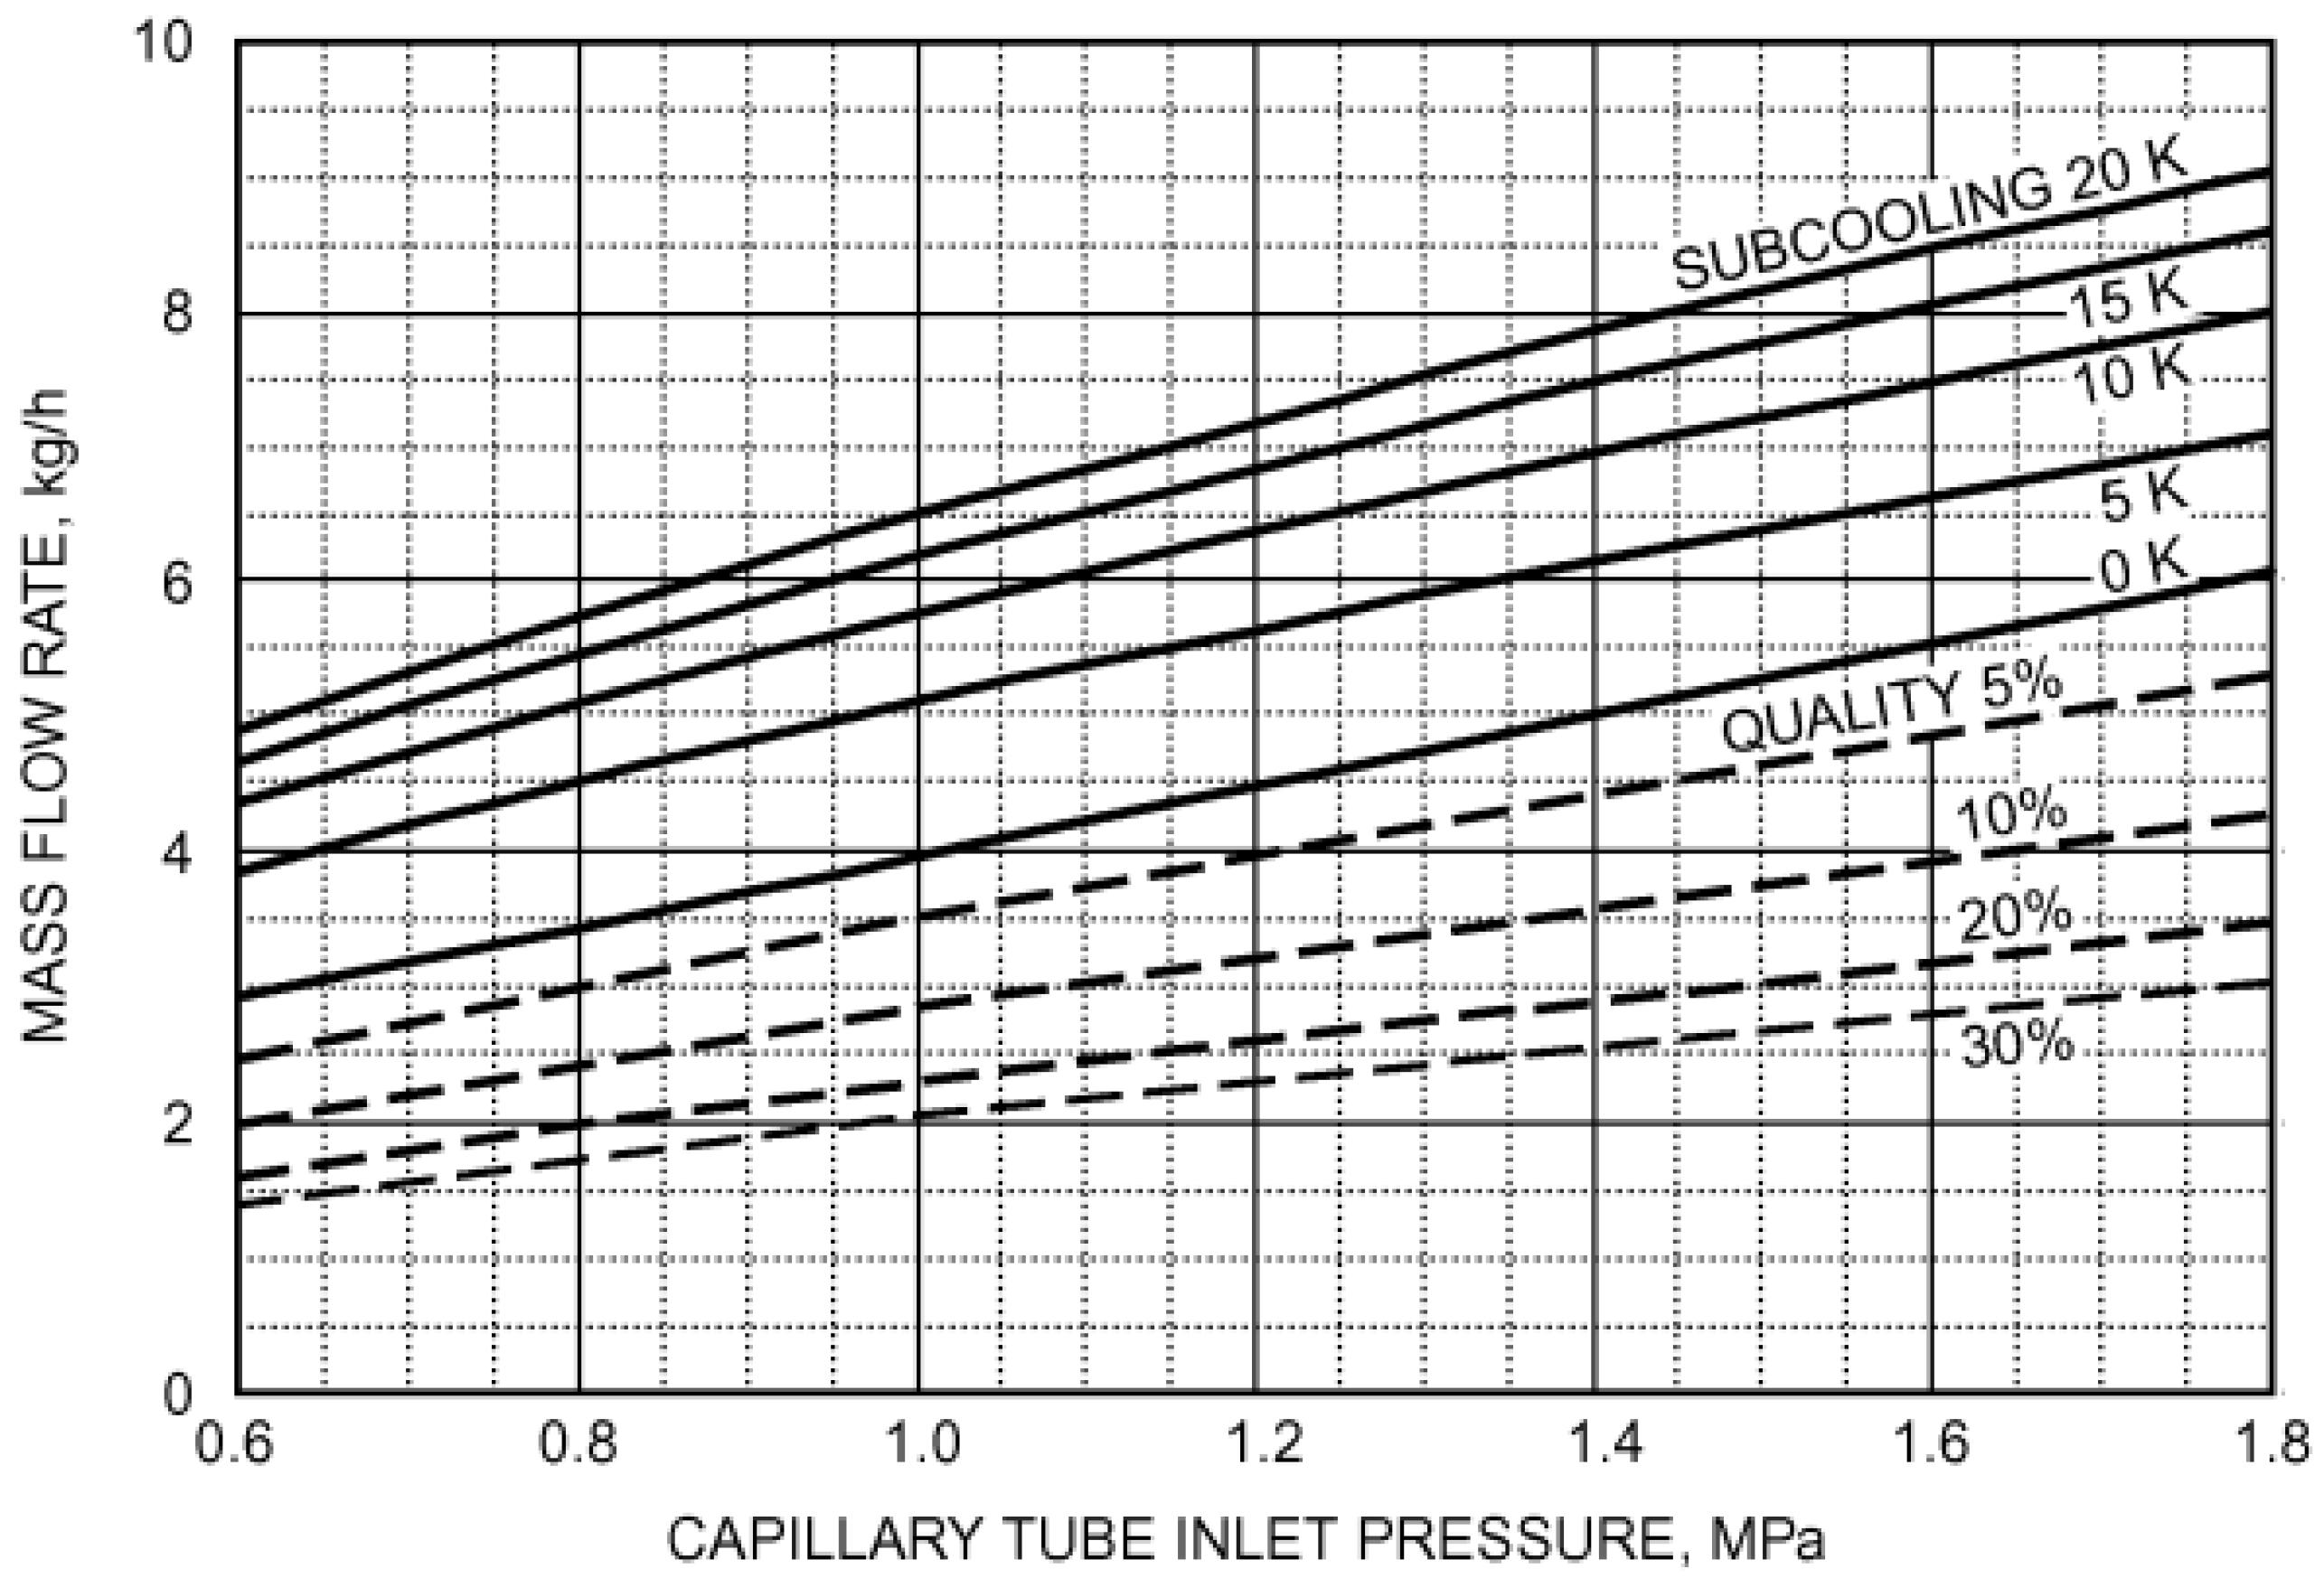
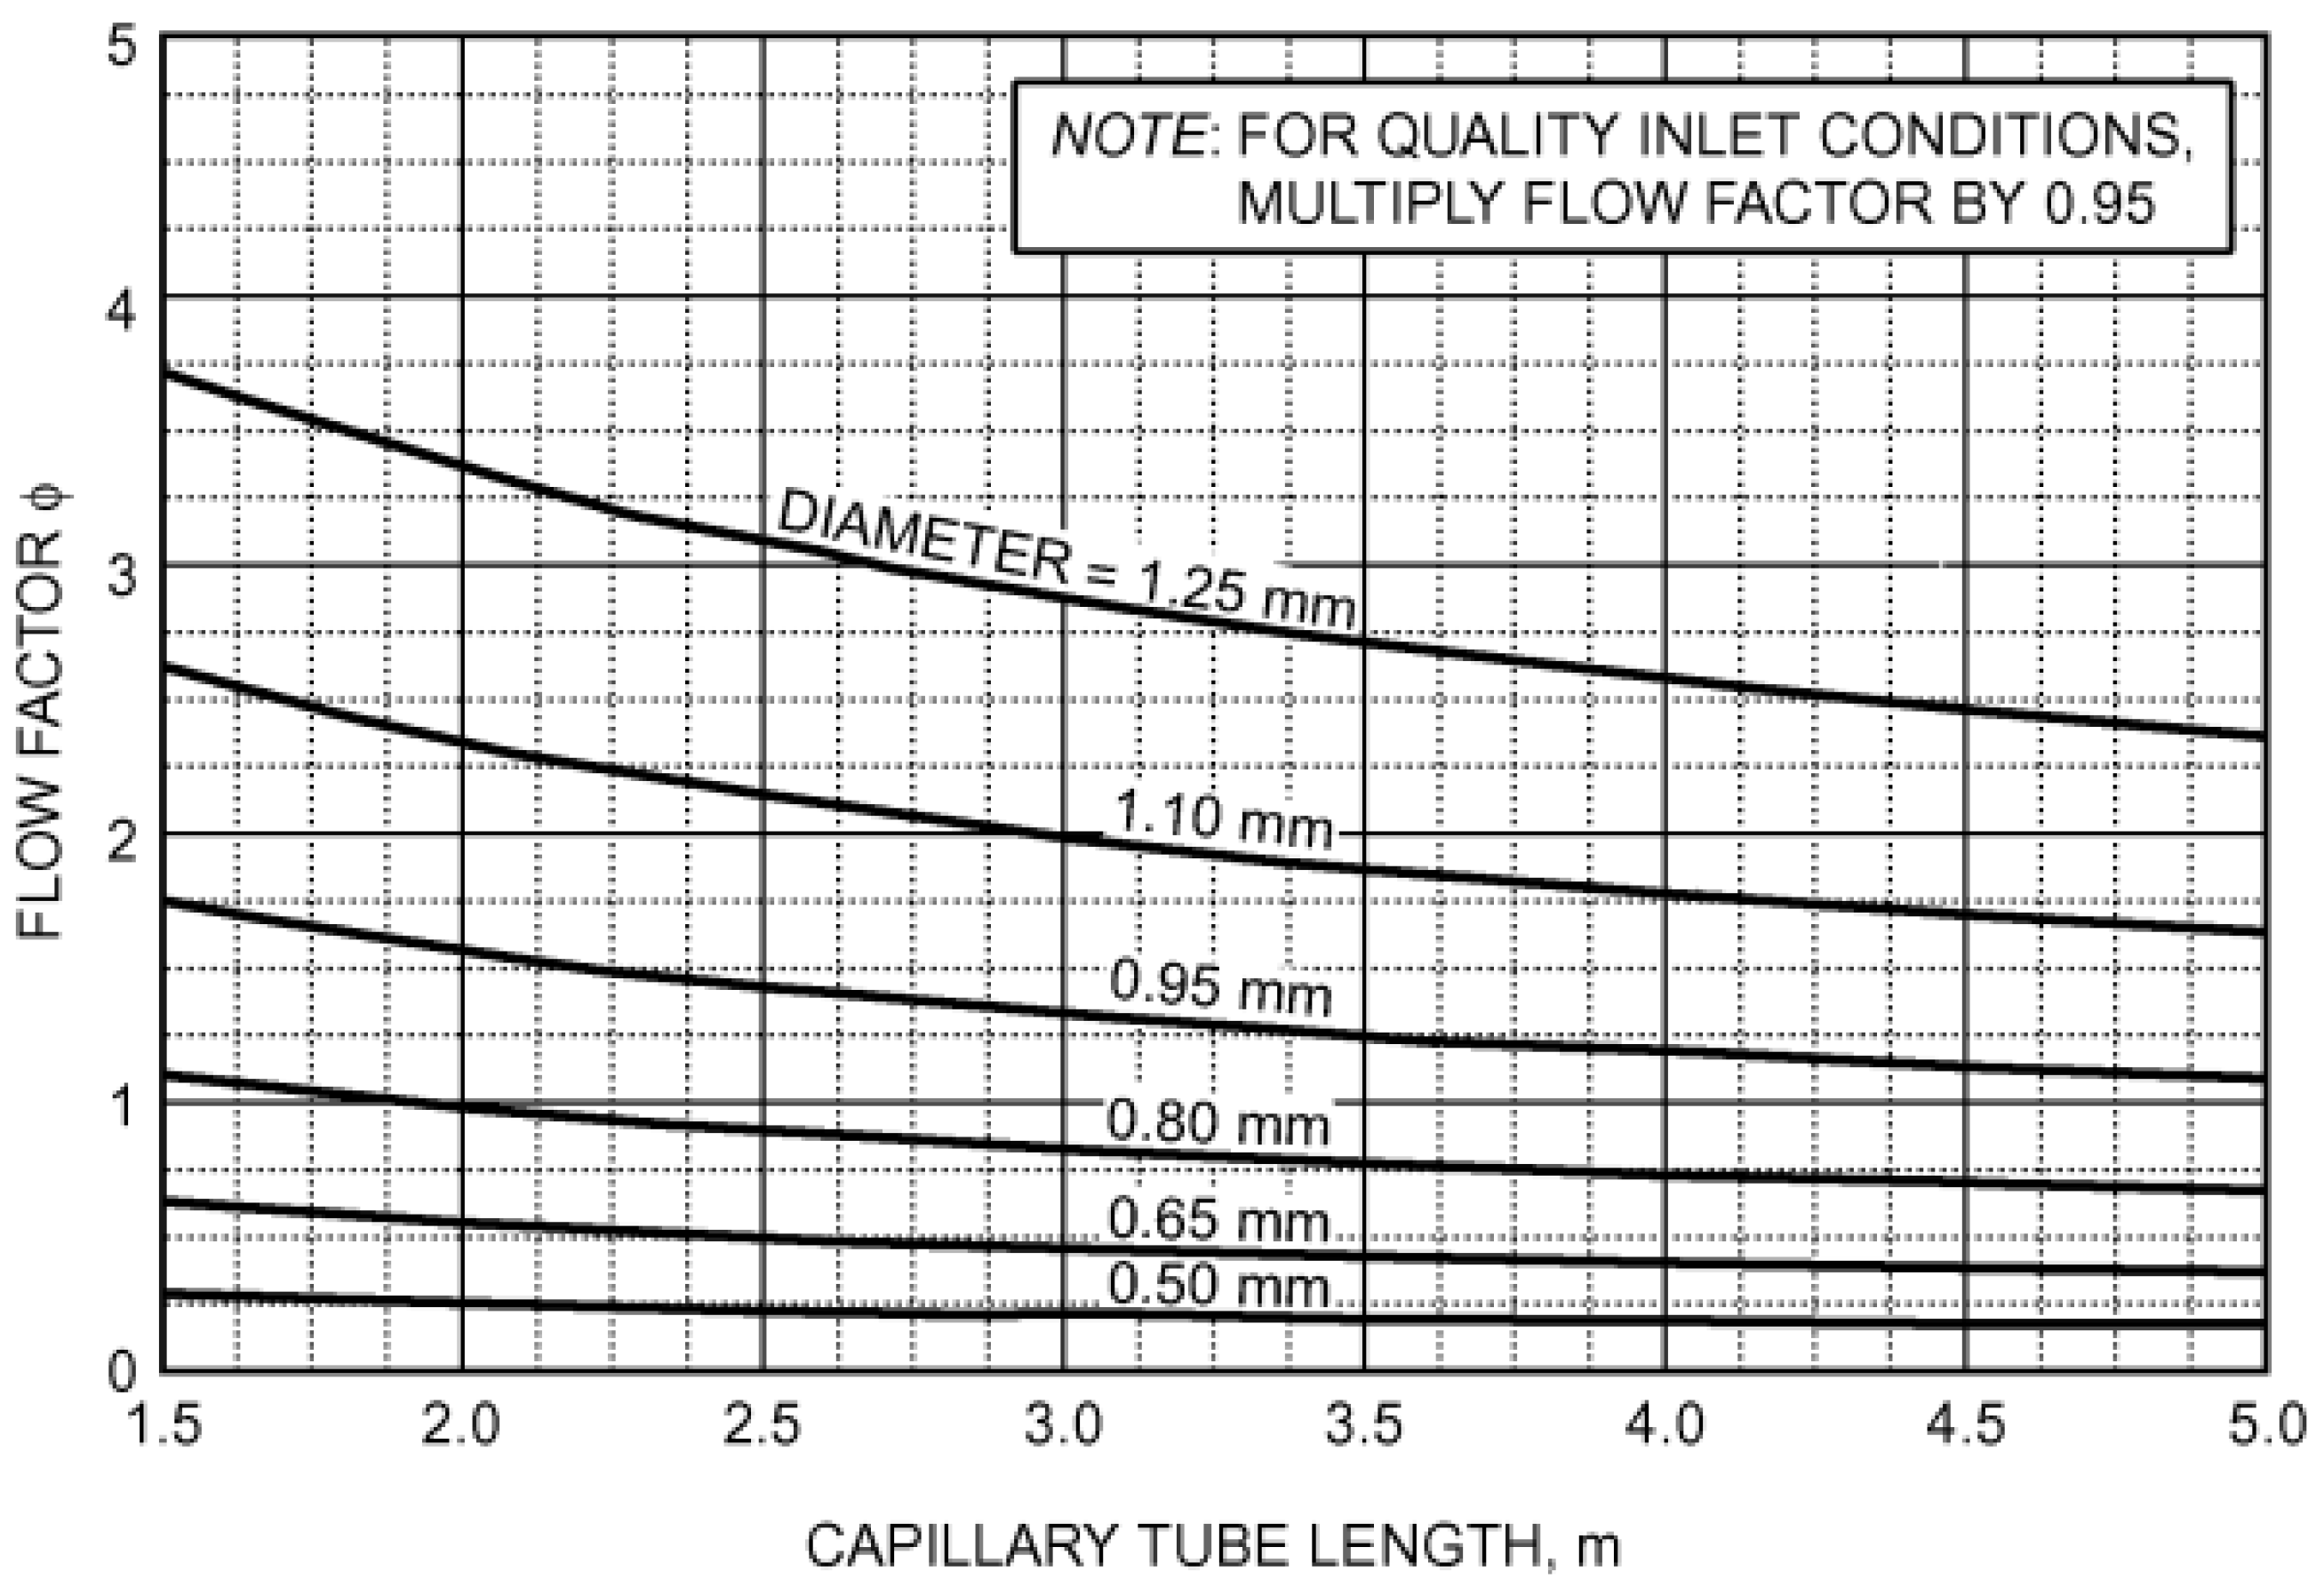
2s). The estimation of the refrigerant mass flow rate was performed using the graphs reported in
Figure 15 and
Figure 16, taken from the ASHRAE Handbook—Refrigeration [
36].
5.2. Simulations Results
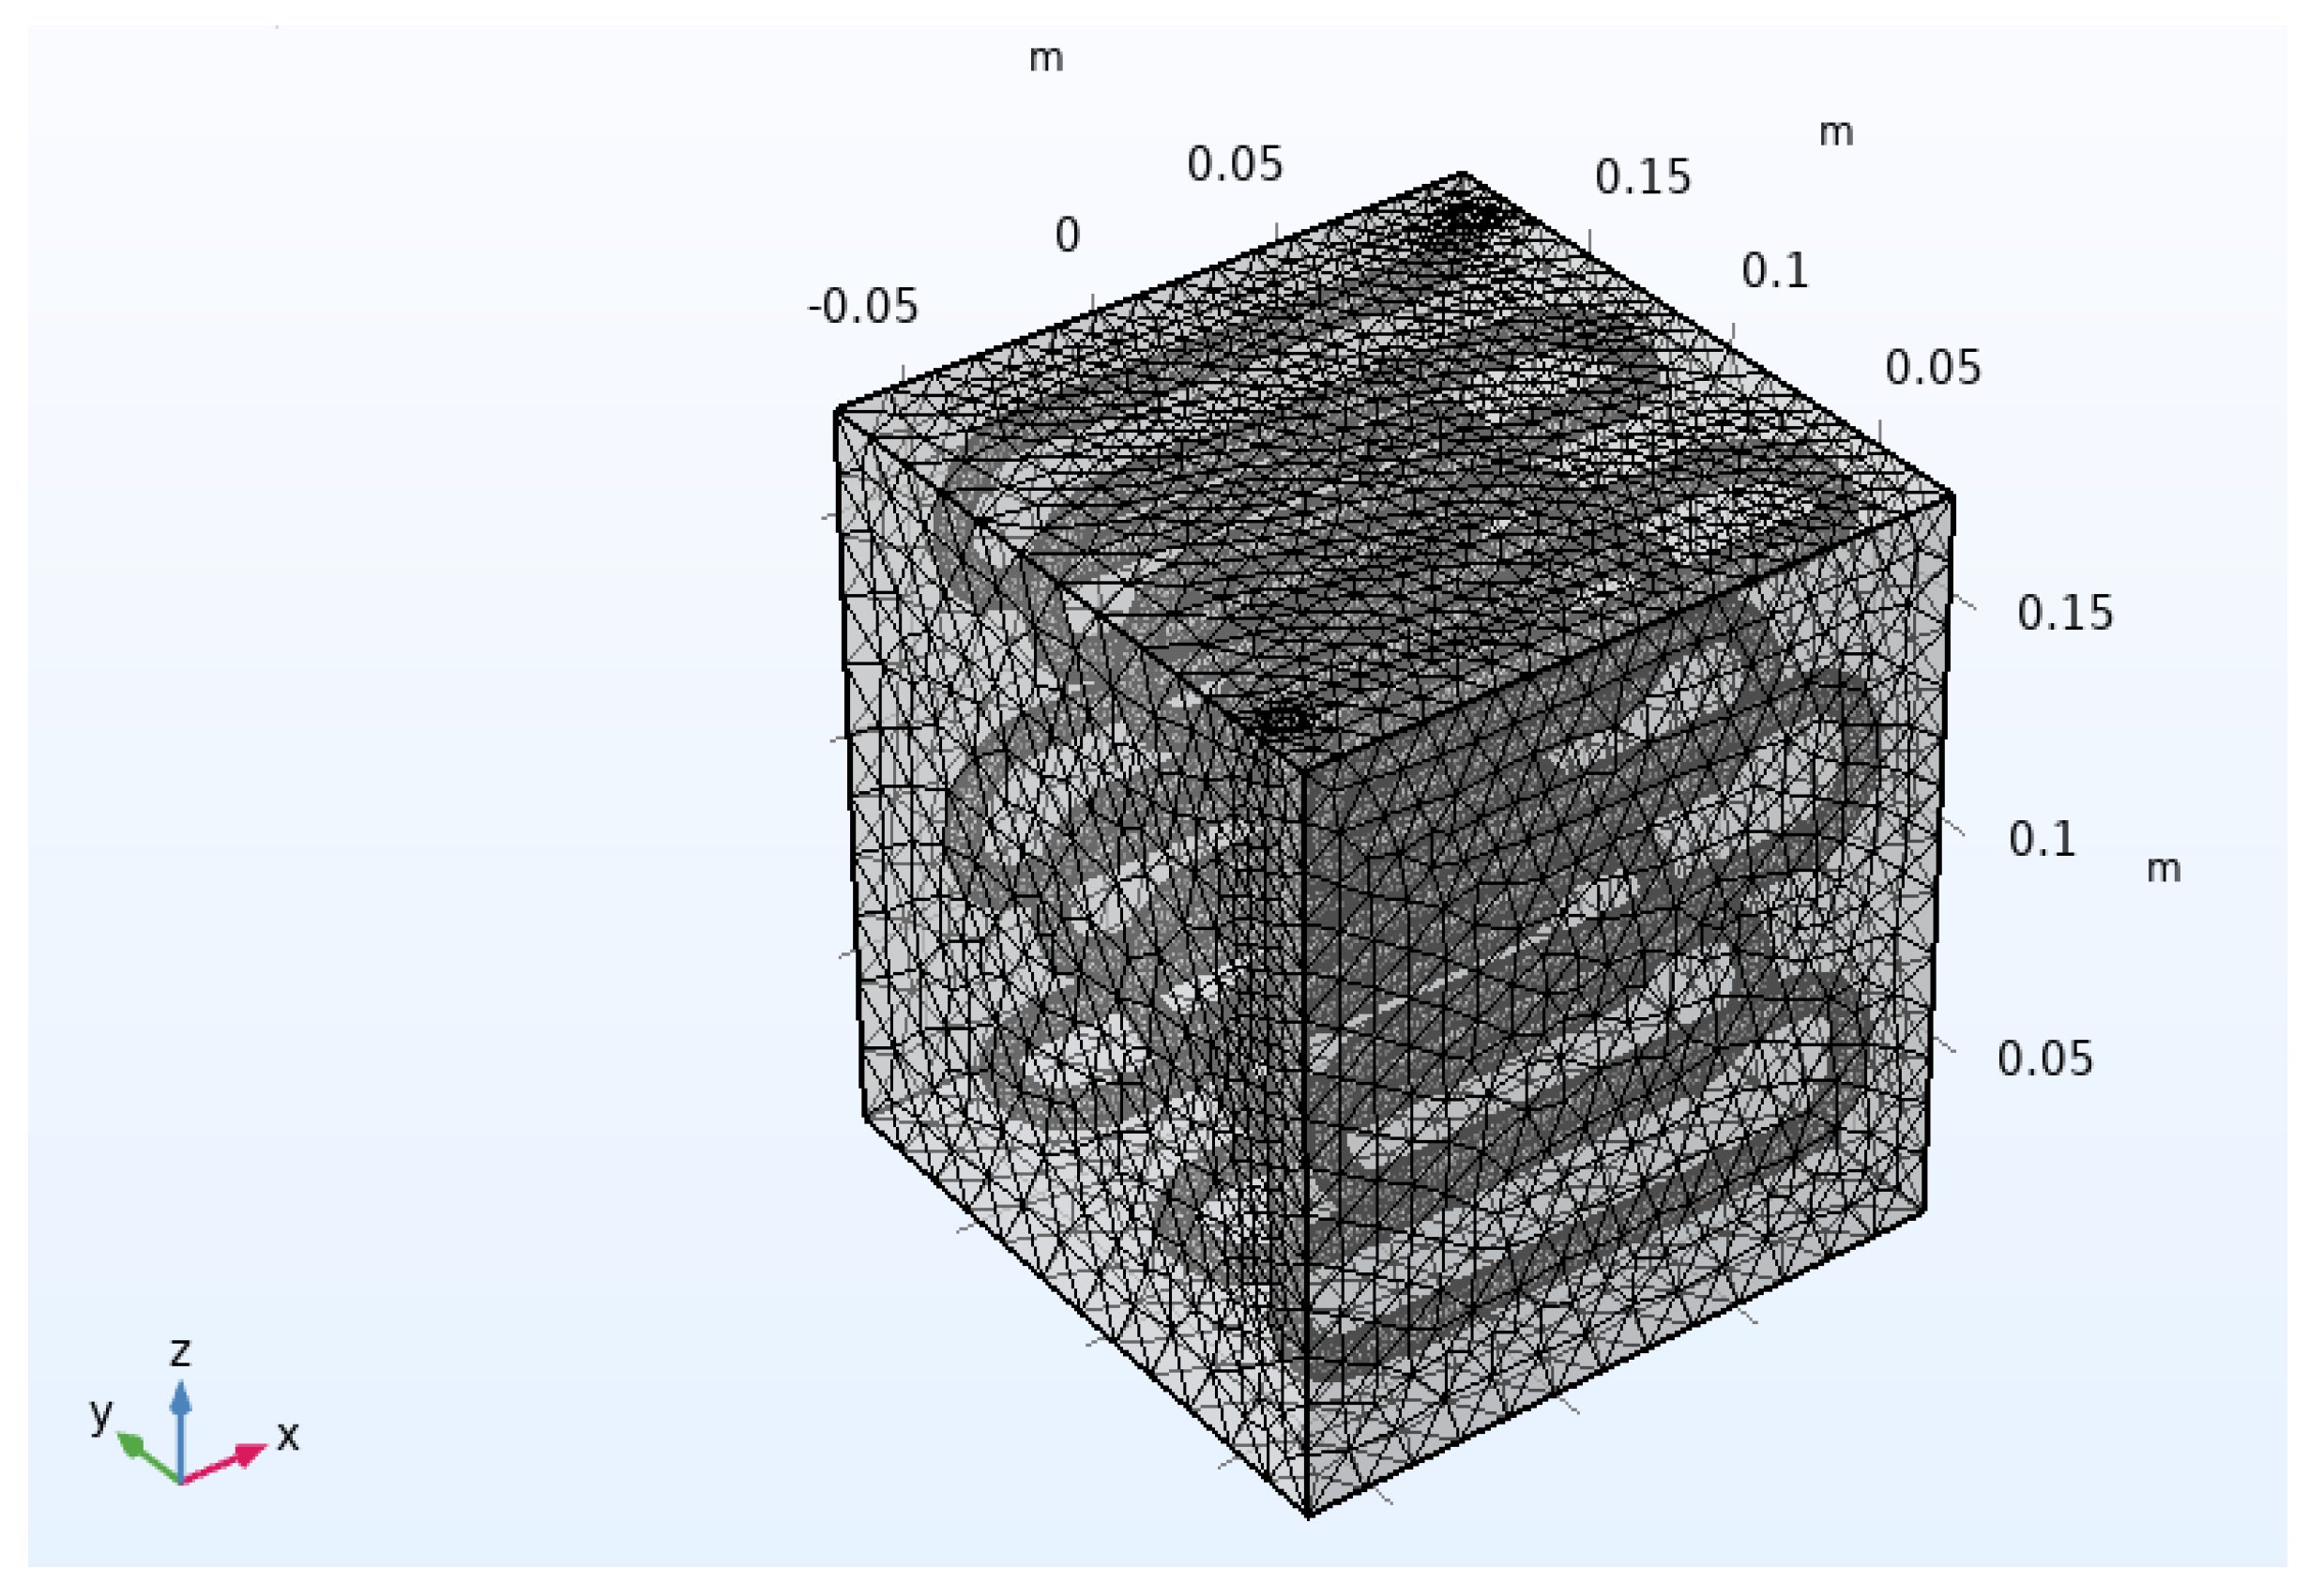
Figure 17 shows the mesh adopted for the numerical simulation of the PCM-based condenser module.
The above mesh is the result of an analysis aimed at evaluating the independence of the numerical results from the computational grid. The tested meshes were:
Mesh 1 (Very coarse) = 45,304 domain elements, 7708 boundary elements and 1603 edge elements;
Mesh 2 (Coarse) = 105,342 domain elements, 14,182 boundary elements and 2245 edge elements;
Mesh 3 (Normal) = 295,888 domain elements, 33,188 boundary elements and 3383 edge elements;
Mesh 4 (Fine) = 751,063 domain elements, 75,842 boundary elements and 5164 edge elements.
The respective simulation durations were:
Mesh 1 (Very coarse) = 28,911 s, (8 h, 1 min, and 51 s);
Mesh 2 (Coarse) = 69,202 s, (19 h, 13 min, and 22 s);
Mesh 3 (Normal) = 92,097 s, (1 d, 1 h, 34 min, and 57 s);
Mesh 4 (Fine) = 184,220 s, (2 d, 3 h, 10 min, and 20 s).
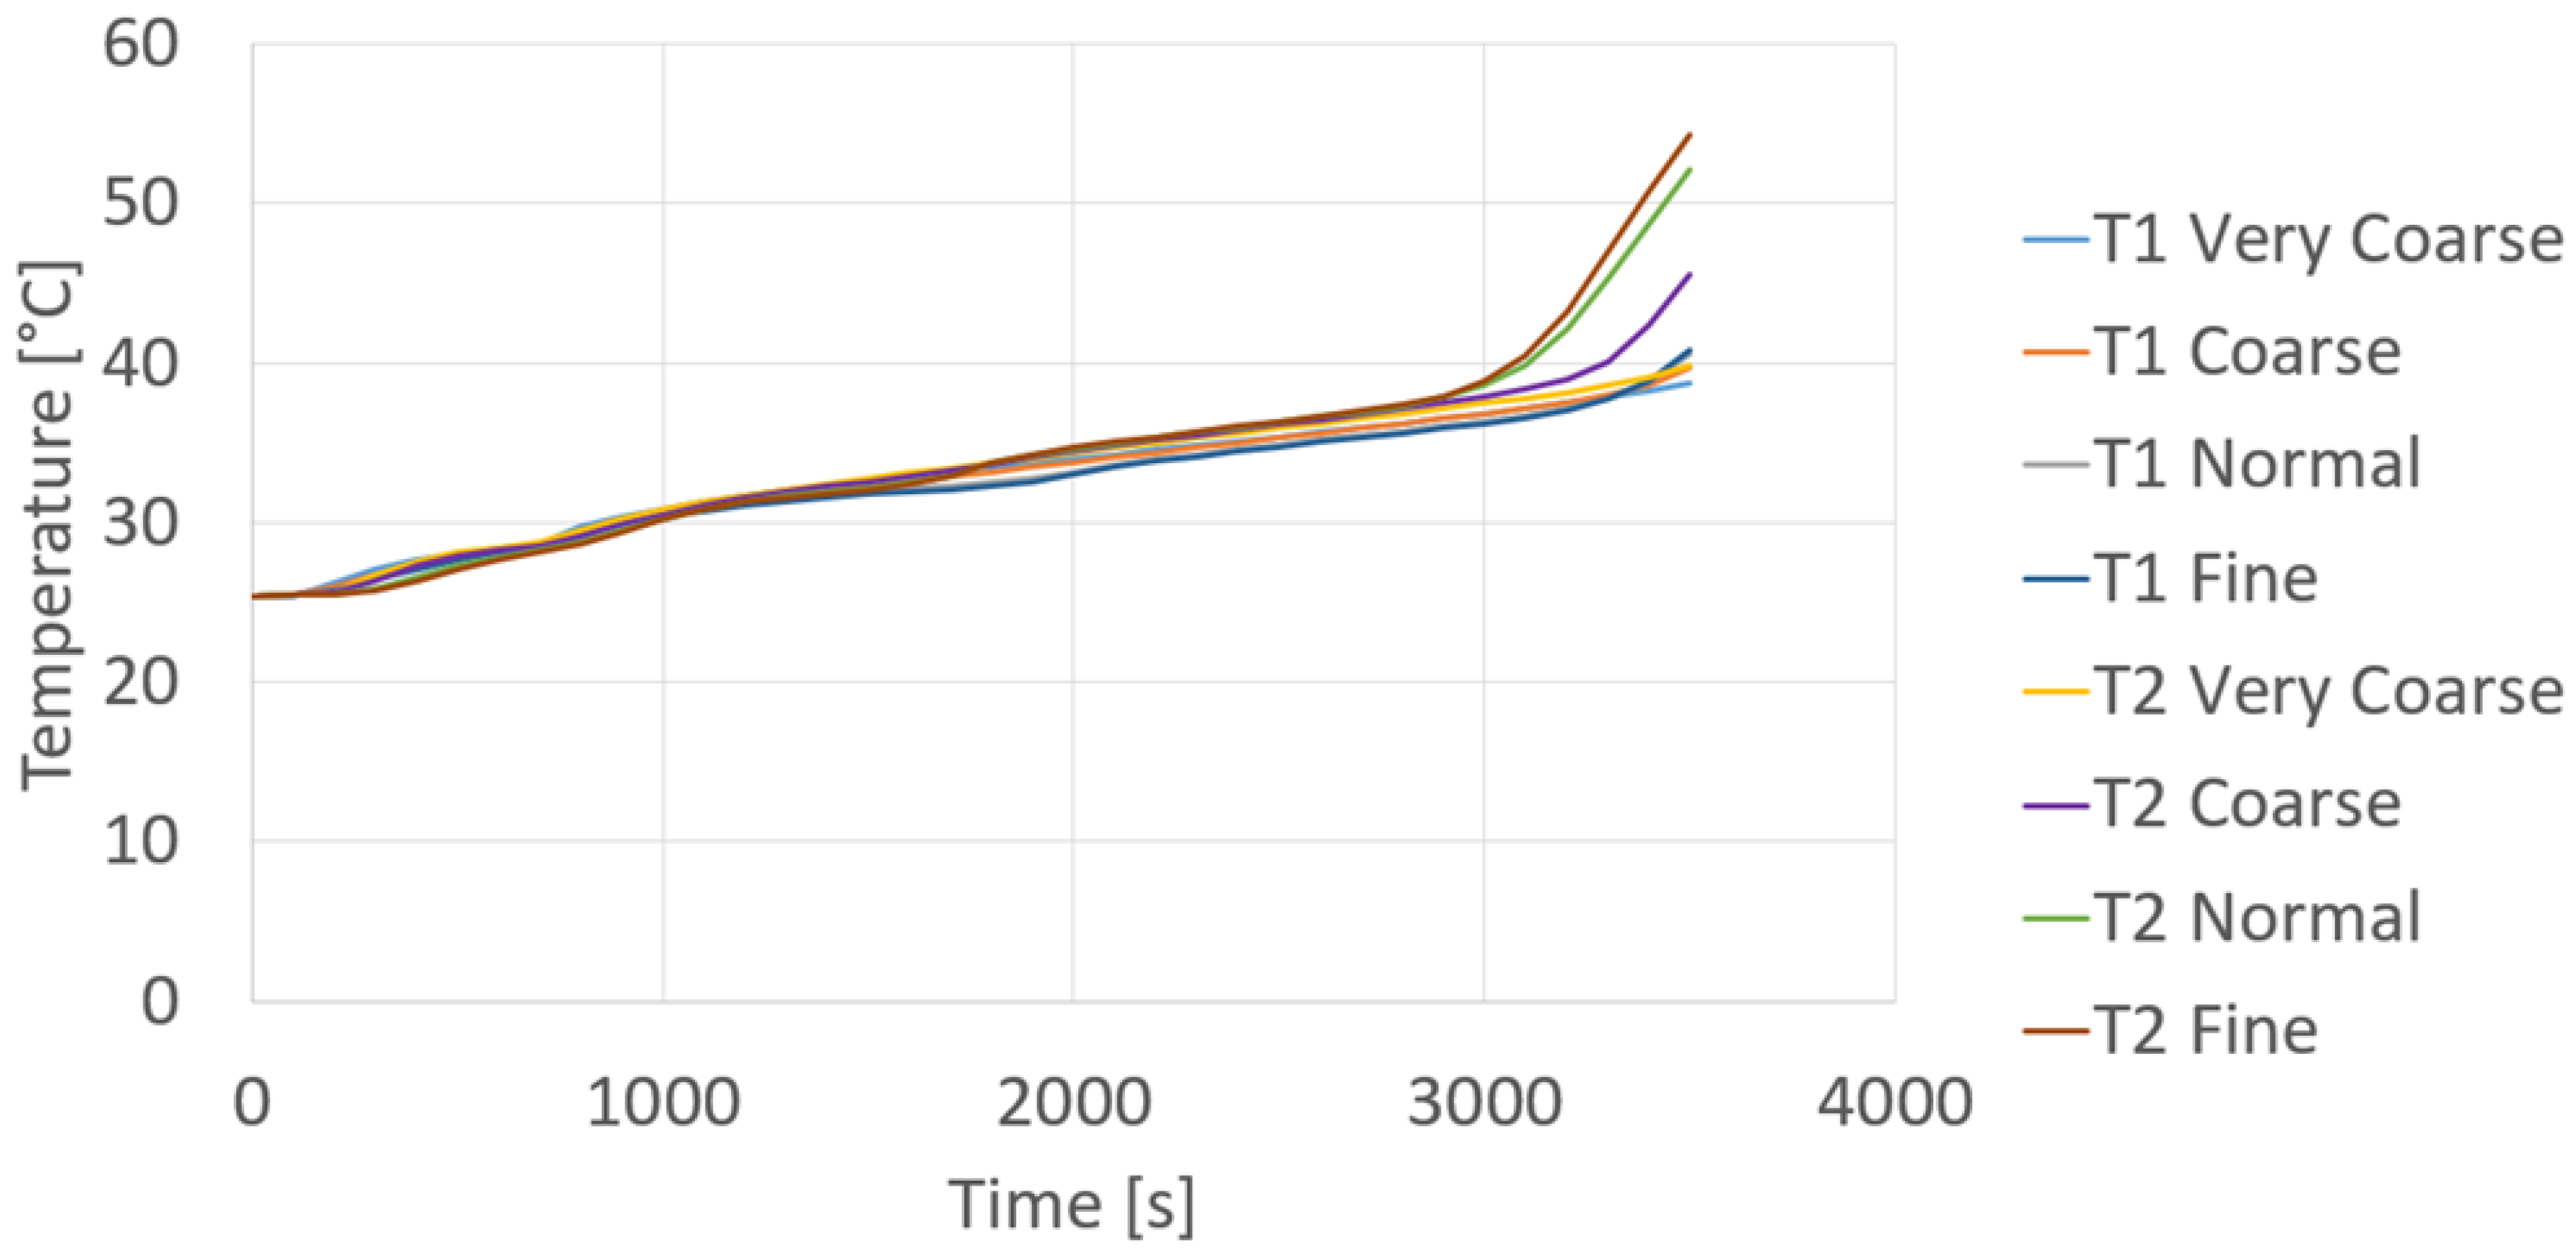
Since the results between Mesh 3 and Mesh 4 (
Figure 18) show no substantial change, while both the computational time and the amount of memory space required increased significantly, in this section, the numerical results obtained with Mesh 3 are shown. In particular, according to the physical parameters of interest, in the following the results shown are those relative to the PCM temperature, volume liquid fraction of PCM, and liquid PCM velocity magnitude.
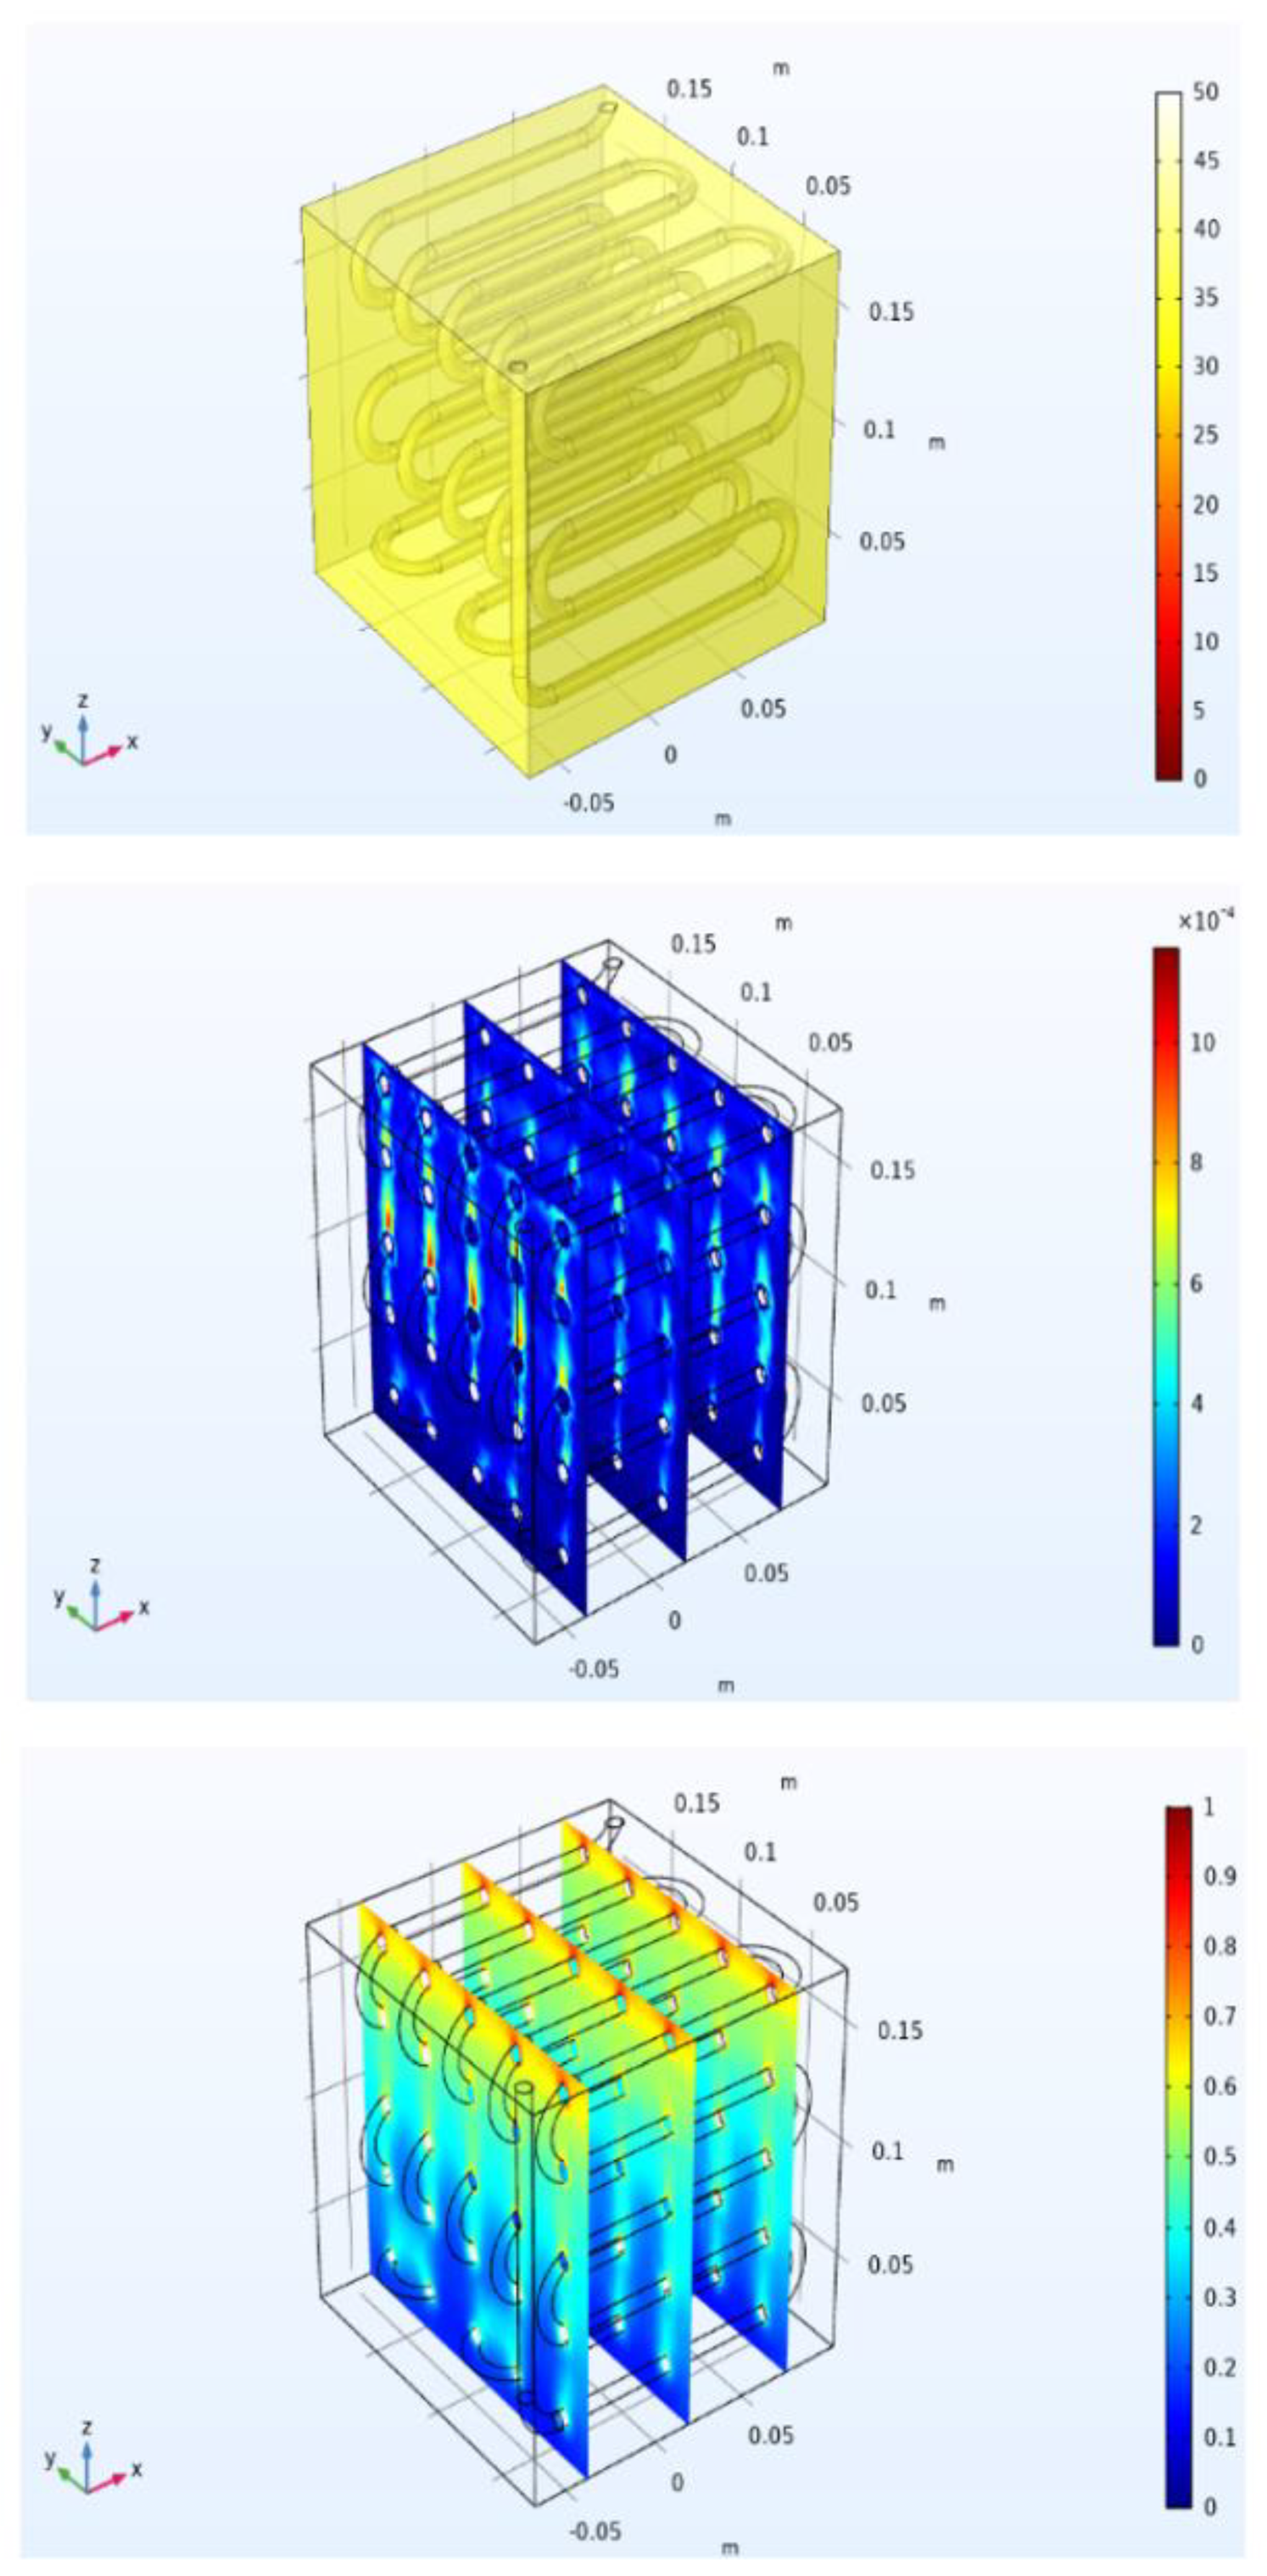
Figure 19 shows a picture of the condenser PCM-based module (without the thermal insulation) at initial conditions, with all the PCM in a solid state and null velocity field. The measured temperatures were used to fix the initial conditions in the numerical simulation.
As concerns the numerical results,
Figure 20 shows the temperature, velocity magnitude, and liquid volume fraction of the PCM after 1700 s. It can be noticed that there are ascensional movements of buoyancy connected to natural convection close to the serpentine heat exchanger, which pushed up the warmer and liquid PCM. A different velocity distribution can be seen in
Figure 21 after 2700 s, since there was here much more liquid, and for this reason higher values of the velocity magnitude are present in the upper part of the module. Finally,
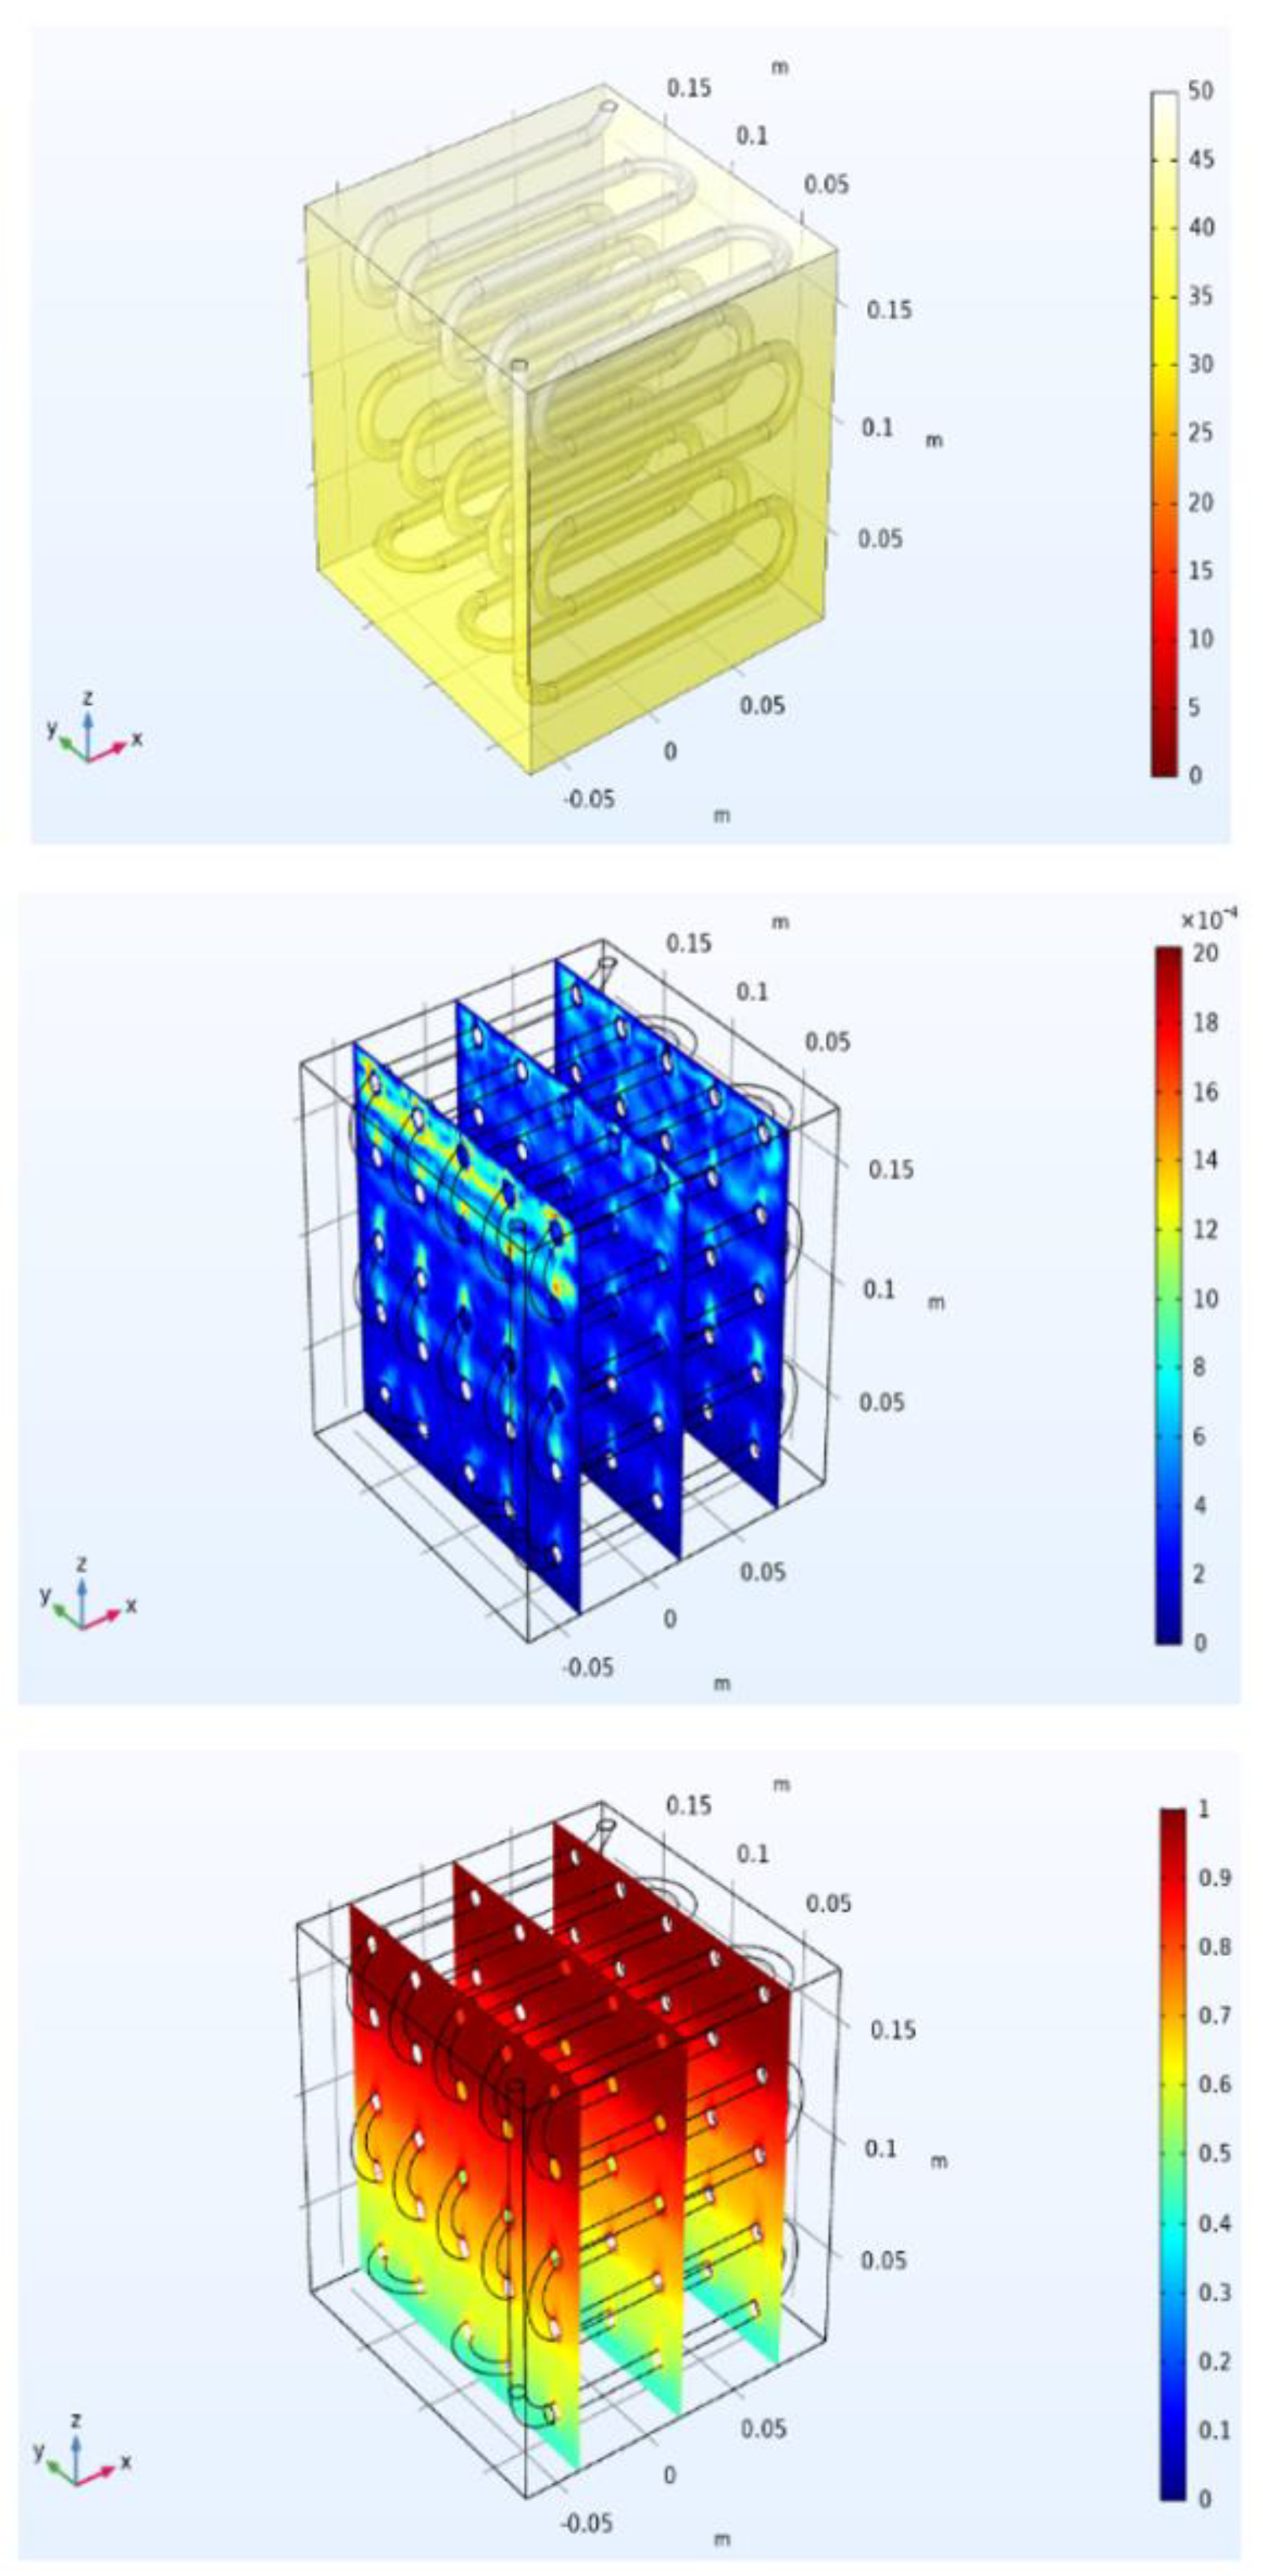
Figure 22 shows that after 3700 s, the melting process was completed. The temperature was almost everywhere higher than 50 °C, and the PCM liquid volume fraction is uniformly equal to one, or in other words, there was no solid in the domain.
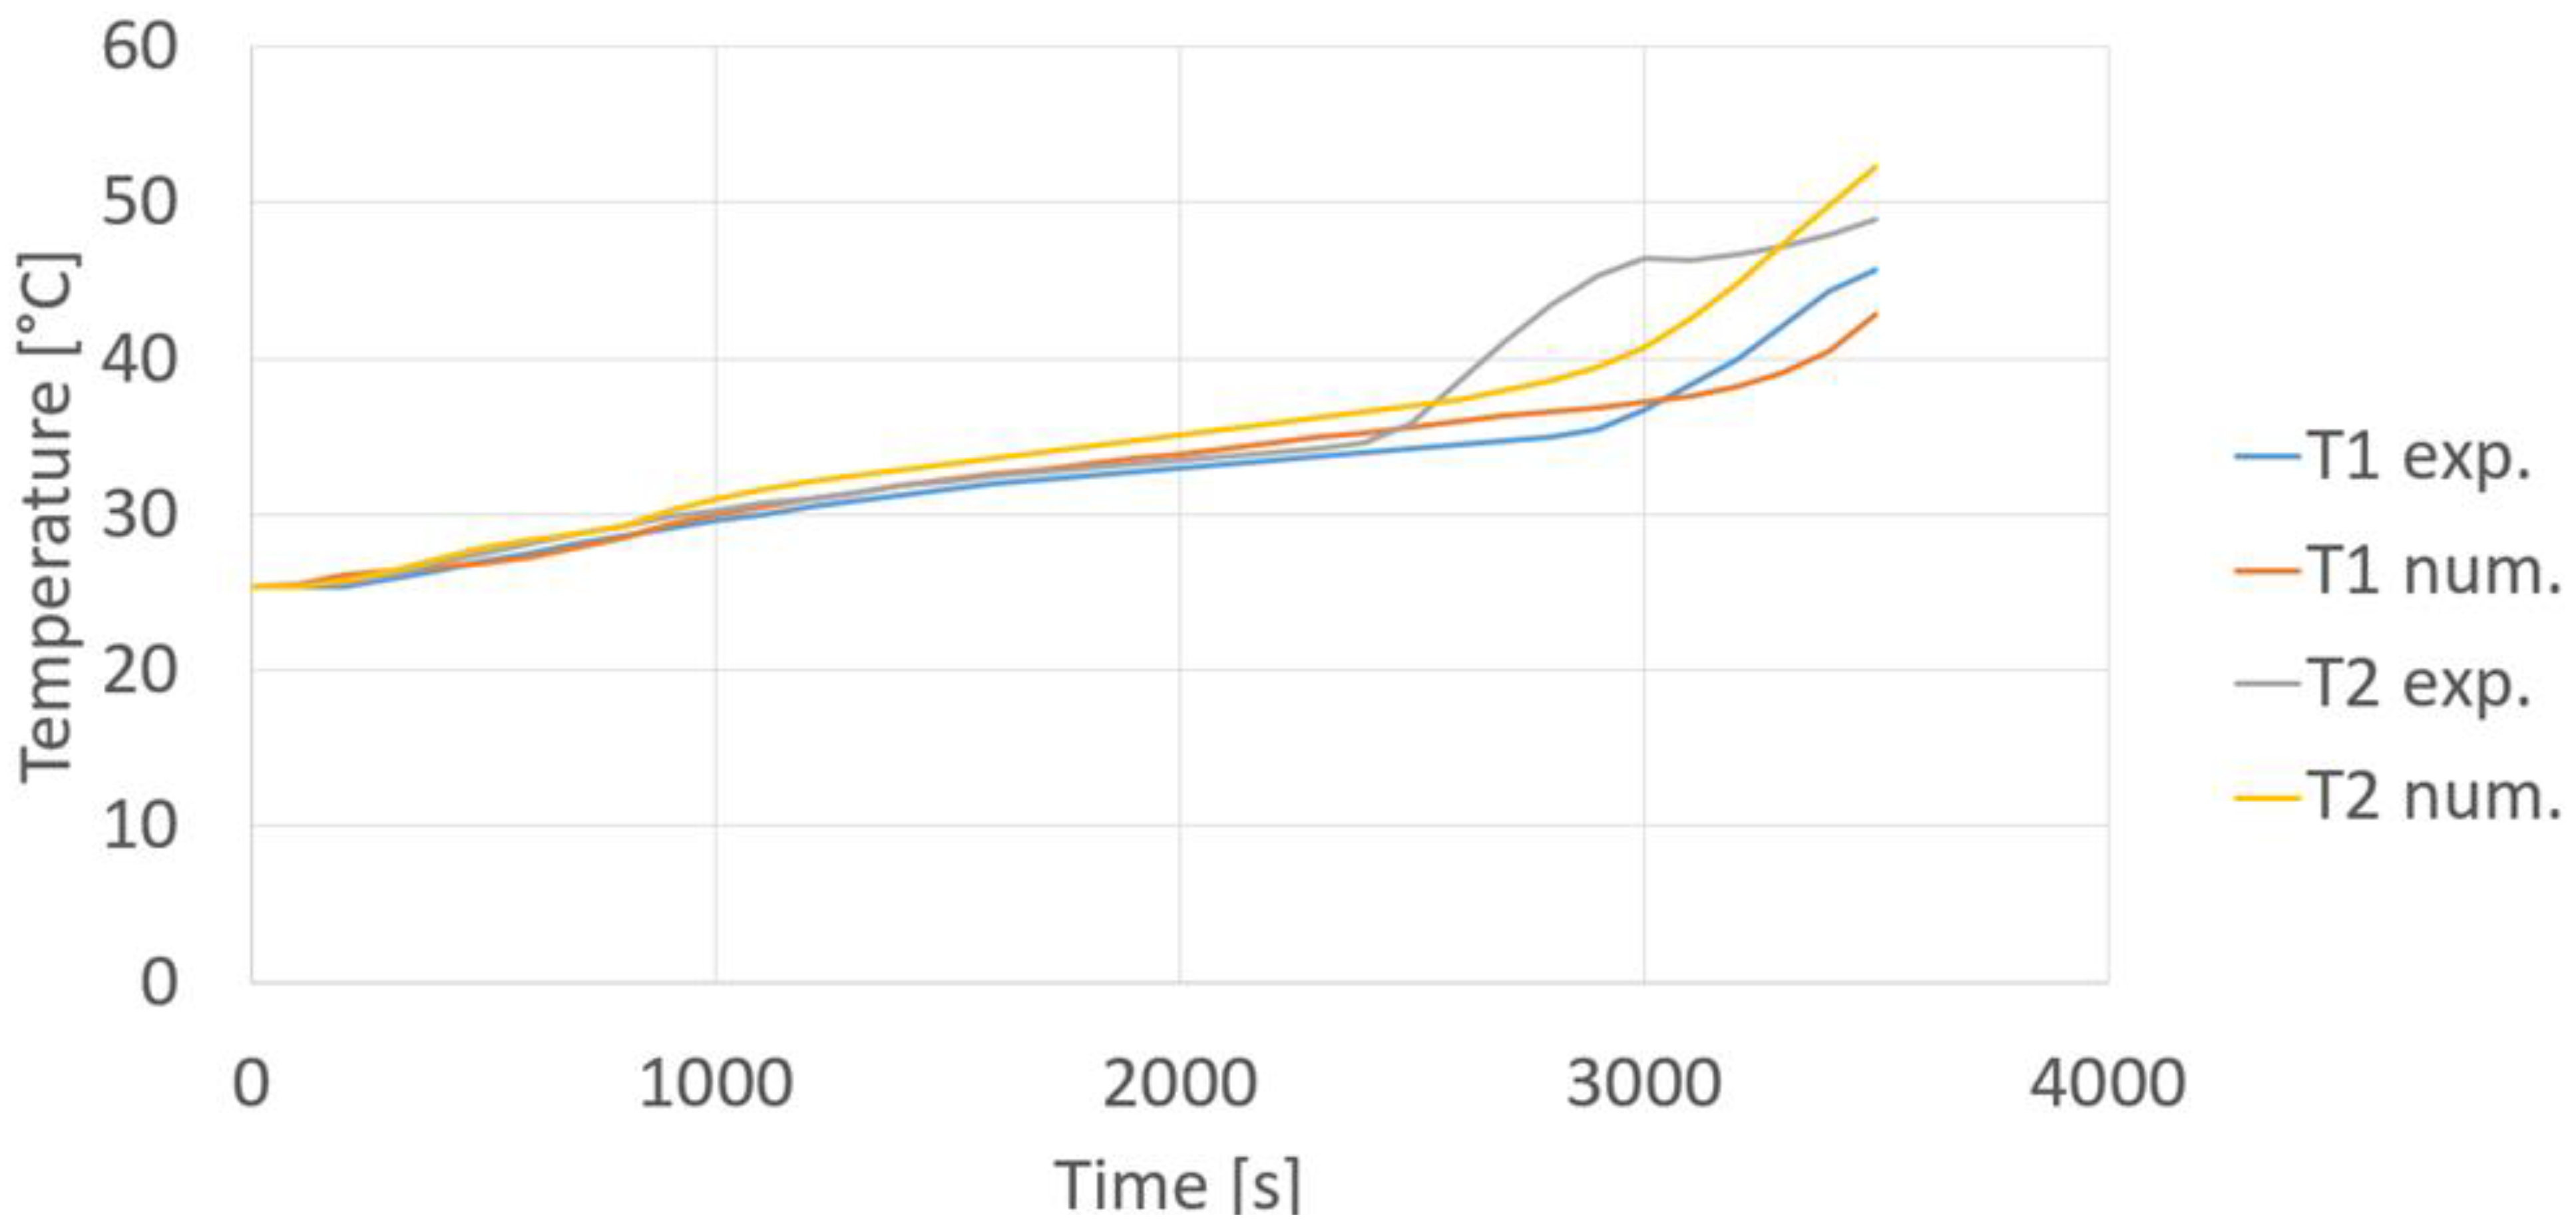
Figure 23 shows a picture of the real module after 3700 s from compressor start-up. It can be noticed that, differently from the simulation results, in the experimental test the PCM was not completely melted after 3700 s. Indeed, there was a small portion of PCM on the bottom side and at the plexiglass walls still in solid phase, that was essentially due to the non-perfect insulation of the plexiglass container. Finally, a more quantitative comparison between numerical and experimental results can be seen in
Figure 24, showing the experimental and numerical temperatures evaluated at points T1 PCM and T2 PCM. A good agreement between numerical and experimental results during the solid phase heating and the phase transition has been found, but, after about 2500 s, the experimental results reveal a faster temperature increase of liquid PCM compared to the numerical ones, that can be explained by considering the assumptions made to simplify the simulation model, and also the uncertainty about the position of the measuring points.
