Article

The Effect of Magnetic Anisotropy on the Computed Specific Total Loss in Electrical Steel

by
Wojciech A. Pluta
Faculty of Electrical Engineering, Czestochowa University of Technology, 42-201 Czestochowa, Poland
Energies 2024, 17(5), 1112; https://doi.org/10.3390/en17051112
Submission received: 6 December 2023 / Revised: 19 February 2024 / Accepted: 21 February 2024 / Published: 26 February 2024

Abstract

:
Grain-oriented (GO) electrical steel (ES) laminates are still very important in industrial applications due to their remarkable crystallographic properties. Cores of large electrical machines and transformers are built from ES. The performances of these devices are significantly influenced by the properties of ES. The improvement of ES properties has been the subject of considerable research for many years. The phenomenon of magnetic anisotropy is highly non-linear, and it should be taken into account by the designers of magnetic circuits. The article proposes a modified model for calculating the angular properties of specific total loss of ES. The modeling takes into account the isotropic component (from classic eddy currents) and the anisotropic component, which is the sum of hysteresis and excess losses. For the directional loss modeling, the Boltzmann function was used. An analysis of the dependency of model coefficients on the frequency is presented.

1. Introduction

The increasing global electrical energy demand due to climate policies drives the growth of the global electrical steel market. The rising electricity consumption and increasing need for industrial development are the major drivers boosting the demand for electrical steel. Electrical steel (ES) is classified into two types: non-oriented (NO) and grain-oriented (GO). Electrical vehicles use non-oriented electrical steel in most cases. Grain-oriented electrical steel (GOES) is used in power generation, transmission and distribution, and for the charging of electrical vehicles. Hence, the market for GOES grows every year. At present, the electrical industry consumes about 30 million tons of electrical steel annually, and the expected increase in volume of electrical steel production is of the order of 20% by 2028 [1]. Excellent magnetic properties of GOES result from the crystallographic structure developed, e.g., in accordance with the Goss method [2].
GOES exhibits a strong magnetocrystalline anisotropy with a (110) plane grain orientation and a <100> edge direction, as shown in Figure 1. For this grain orientation, GOES shows high values of magnetic flux saturation and magnetic permeability, as well as a low specific total power loss PS for the easy magnetization direction (along the rolling direction). These features make the GOES particularly useful for assembling the magnetic cores of large transformers. GOES exhibits excellent magnetic properties for the rolling direction (RD), parallel to the easy magnetization direction <100>. In conventional GOES, grains are misaligned about 3°–7° with respect to the RD. In a material with Goss texture, the worst magnetic properties are noticeable for the angle of 55° with respect to the RD, which coincides with the direction of <111>, the body diagonal to the unit cell. Intermediate magnetic properties are noticeable for an angle of 90° to the RD, i.e., in the transverse direction TD. In the construction of laminated cores made of tape cut along the RD at the T-joints and in the corners, the deviations in the magnetic flux from the easy magnetization axis deteriorate the magnetic properties of the whole magnetic core [3,4,5,6,7,8,9,10,11,12]. This implies that during the production of large transformers, the magnetocrystalline anisotropy has to already be taken into account at the design stage in order to minimize the core loss and the magnetizing currents. For example, butt-lap or step-lap stacking methods are used. These are aimed at lowering the reluctance of the magnetic flux [13]. Since power transformers operate continuously for at least twenty years, it is crucial to minimize energy losses in their magnetic circuits in order to achieve an improved energy conversion. Hence, considerable energy and material savings can be achieved when taking into account the anisotropic ES properties at the design stage.
The anisotropic properties of specific power loss in ES and its modeling are the subjects of extensive studies [14,15,16,17,18,19,20,21,22,23,24,25]. Among the possible approaches, the models based on the co-energy concept [15], reluctivity tensor [16] or Neél phase theory [17,18,19] can be distinguished. Apart from these, there are descriptions directly based on the experimental data. They describe the directional properties of power loss using different mathematical functions. In [20], cumulative distribution functions of the Gaussian functions were used, and most often, the orientation distribution function (ODF) was used in crystallographic studies [21,22,23]. There exists a description [24,25] based on a three-component model [26], which stresses the same origin of hysteretic Ph and excess Pex components [18,19,27]. The advantage of the latter model [24] is that it makes it possible to compute loss at high flux density levels. This is particularly important, since in the case of GOES, the trend to increase the working flux density is clearly noticeable. At present, the values are from the range 1.6–1.78 T [28]. Moreover, in some core regions, the local flux density can significantly differ from the average value due to an uneven flux distribution.
In this paper, a modification of an anisotropy model for the specific total loss [24] is presented. The approach is based on a three-component model for the description of the specific total loss. It also takes into account the interdependency between hysteresis and excess loss components. Using a novel model, based on the aforementioned interdependency, the investigation of the angular properties of PS loss is performed in a similar way like in [23,24].
This paper presents the investigation results of the directional properties of PS for seven grades of GOES. The ES grades differ in the sheet thickness and anisotropy resulting from the texture. The results of this investigation indicate that the correlation between Ph and Pex components varies with the ES grade. It is demonstrated that the correlation can be used in modeling the angular properties of PS loss. The proposed model might be useful for analyzing the influence of the flux density, permeability and frequency on the magnetic properties of ES, as long as the assumed ranges are maintained.

2. Some Properties of GOES

2.1. Anisotropy Phenomenon

The production process of electrical steel sheets is carried in such a way that grain growth is encouraged for the grains whose crystals are ordered along the rolling direction (RD). The GOES features different magnetic properties depending on the direction of magnetization. GOES is generally used in transformers and other electric machines. The distribution of crystallites in GOES grains and the characteristic of the Goss texture are presented in Figure 1.
GOES owes its particularly favorable magnetic properties to the elementary cells edges of individual crystallites that are precisely arranged [21]. The edges of the crystallites of the <100> unit cells are arranged along the RD, which corresponds to the “easy” direction of magnetization. The diagonals of the faces of a cubic crystal (Figure 1), the <110> direction of the unit cell, are oriented perpendicular to the RD direction, i.e., the transverse direction TD. The diagonals of the cubic unit cell, direction <111>, are arranged at an angle of approximately 55° with respect to the RD. In this direction, ES shows the worst magnetic properties.
The anisotropic properties of a monocrystal are different from a commercial GOES consisting of multiple grains. In commercial ES, the grains are misaligned with an angle of ~3°–7° from the RD, as shown in Figure 1 [29,30,31,32]. In high-quality ES, the misalignment angle is even less than 3° [33]. Therefore, the magnetic core should be designed considering the magnetic anisotropy. The optimal approach relies on providing the lowest reluctance for the magnetic flux path [13].
GOES magnetic anisotropy is defined as the difference in energy needed to reach the saturation state of the material along the tested magnetization direction x1 and the reference direction x2 [20]:
E a = 0 J s H ( x 1 ) H ( x 2 ) d J V   [ J ] ,
where H(x1) and H(x2) are the saturation magnetic field strengths for the x1 and x2 directions, J is the magnetic polarization, Js is the saturation magnetic polarization, and V is the sample volume.
Calculating the anisotropy of the PS loss in ES from Equation (1) is problematic due to the difficulty in determining the technical saturation states in different directions. This is due to the requirement of very high magnetic-field strengths [29]. Therefore, for engineering purposes, the anisotropy of the PS loss is determined for a given cutoff value Bp = 1.5 T, as shown in Equation (2). The most important quantities describing the directional properties of ES are the anisotropy of the flux density and the specific total loss.
Δ P S , 1.5 y 0 = P S , 1.5 y P S , 1.5 0 P S , 1.5 y + P S , 1.5 0 ,
where P S , 1.5 y is the PS loss at Bp = 1.5 T in the chosen direction y (most often y = 90°), and P S , 1.5 0 is the PS loss at Bp = 1.5 T in the rolling direction 0°.
Subsequently in the work, Equation (2) is used to determine the specific total loss PS anisotropy of the tested samples of grain-oriented sheets.
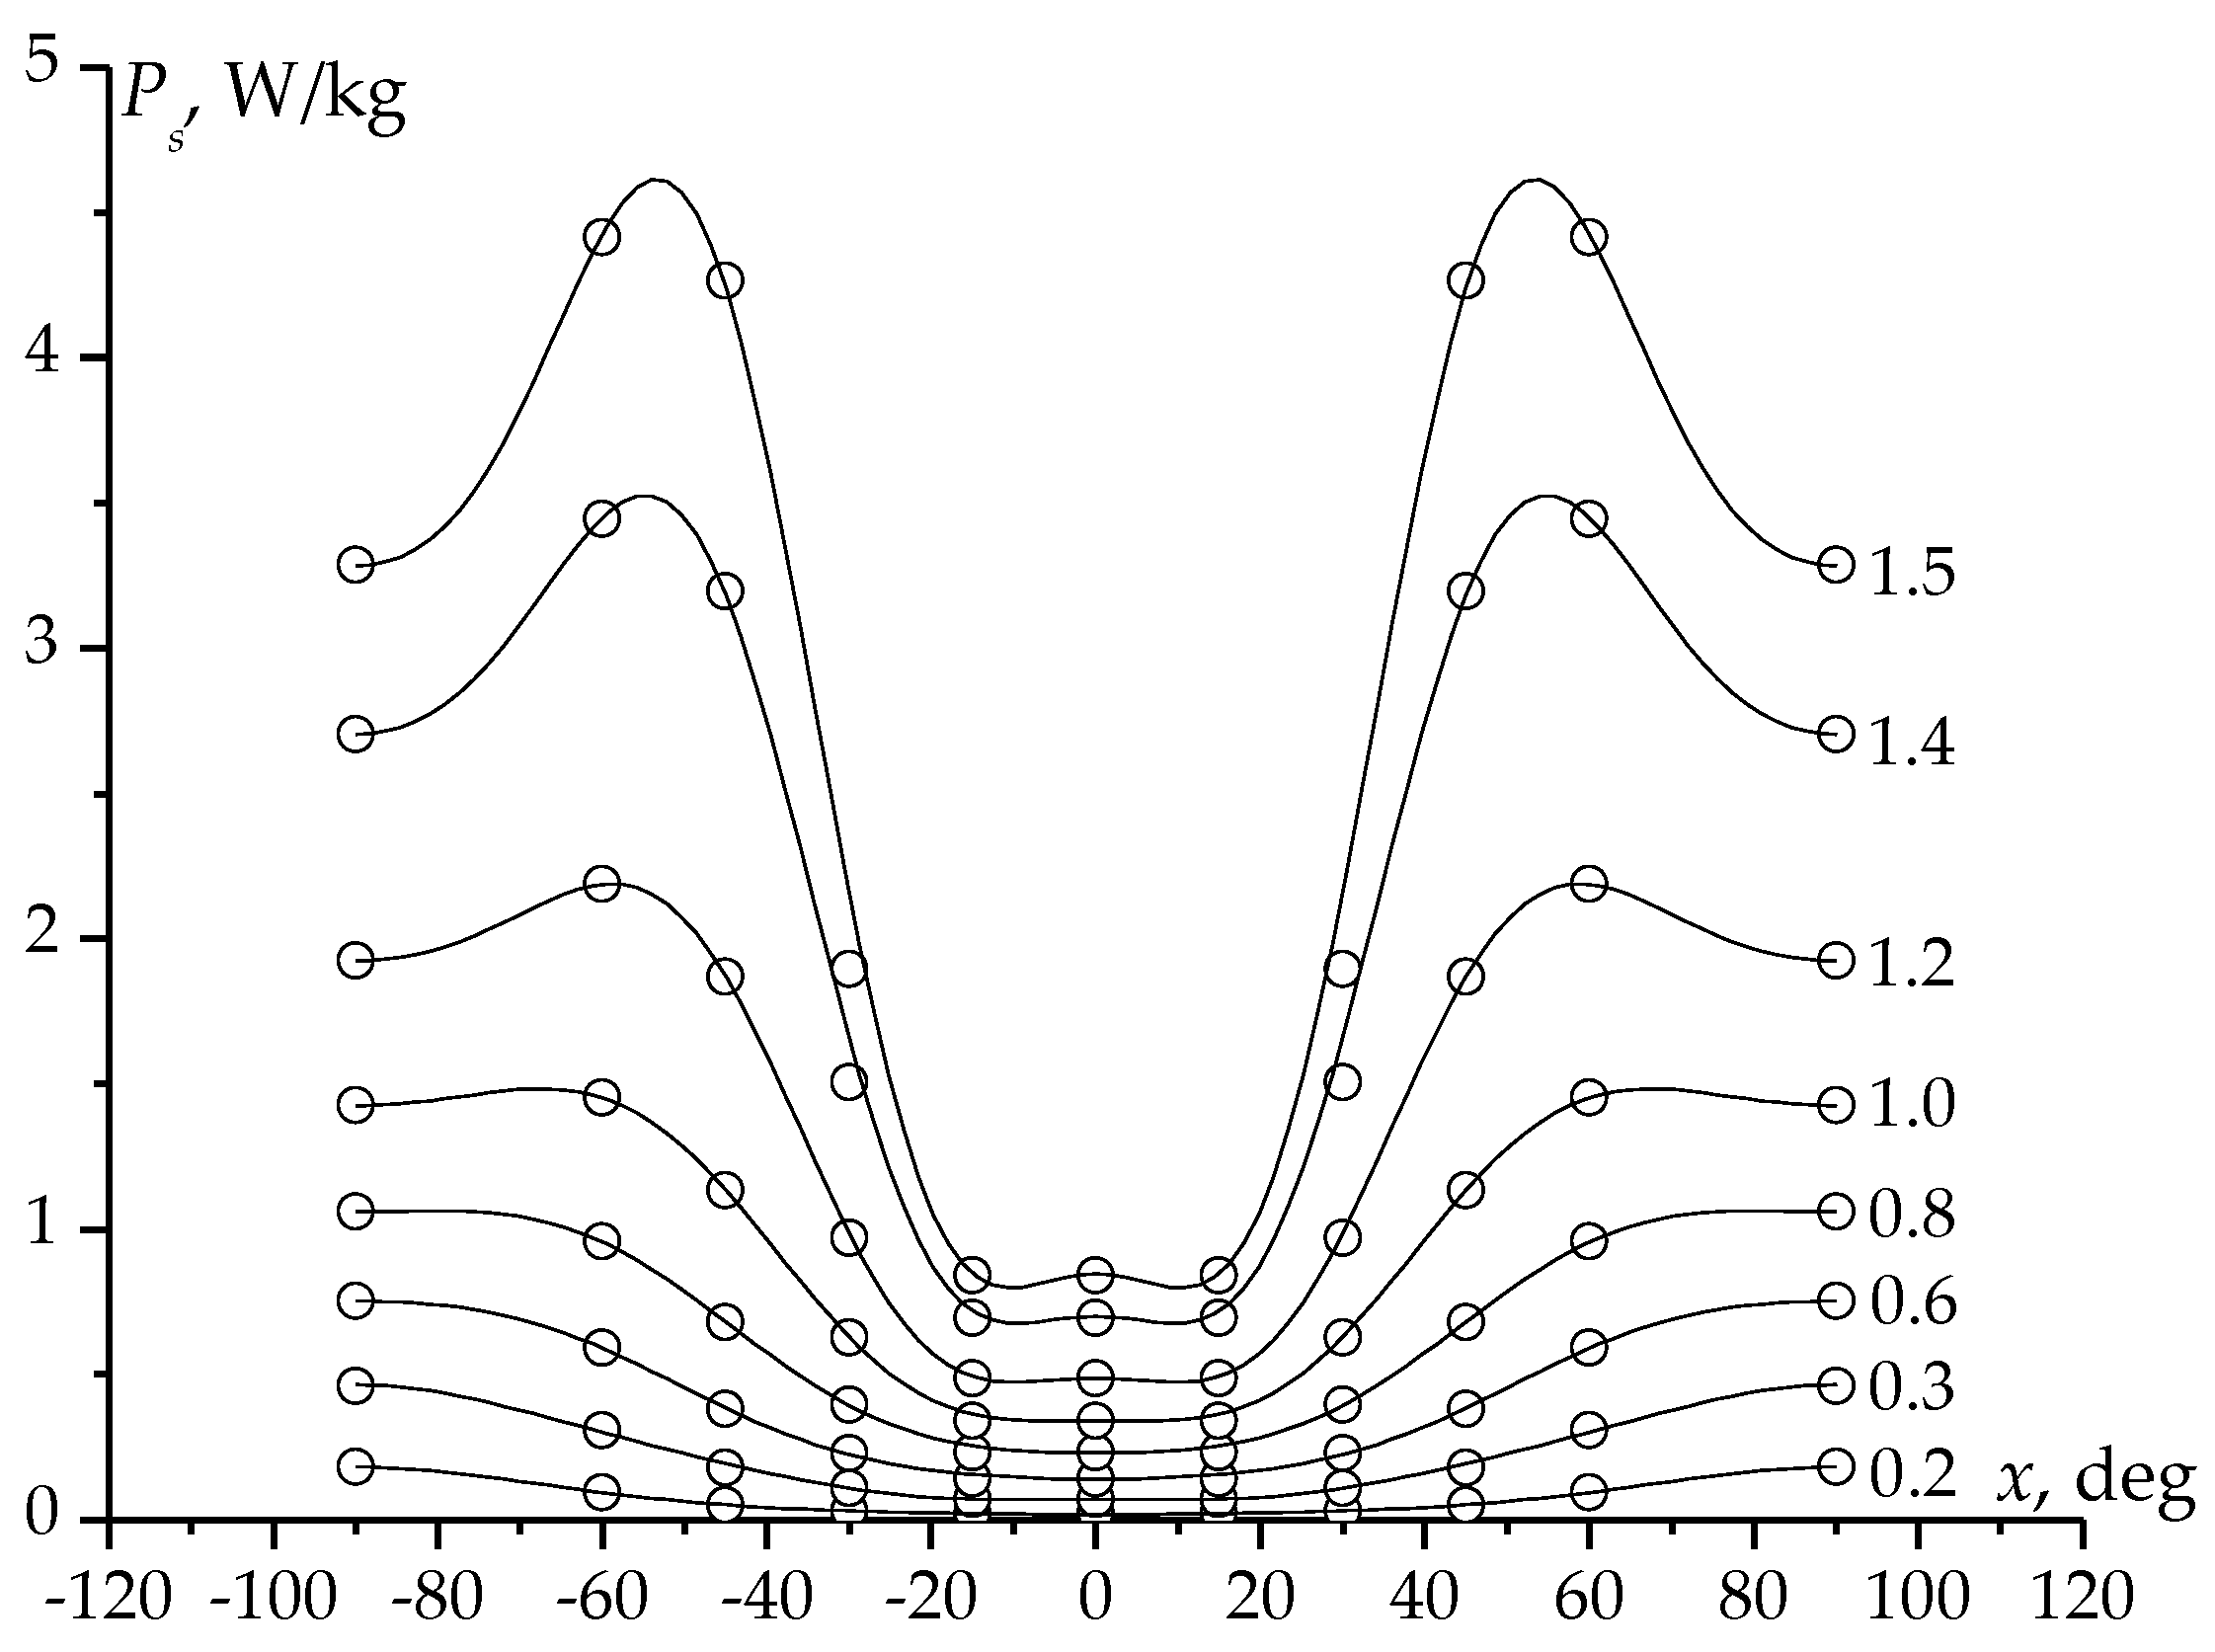
The quantitative dependencies of the anisotropic properties of specific total loss in ES often use directional properties (polar figures), as presented in the figure below.
The dependencies presented in Figure 2 depict variations of specific properties (e.g., magnetic induction or loss) as functions of the angle measured with respect to the rolling direction. Such dependencies are usually available only for GOES and constitute a great help in the design of transformers and electrical machines. The angular dependencies of PS loss can be represented by the ODF, consisting of a series of trigonometric functions [21,22].

2.2. Loss Separation

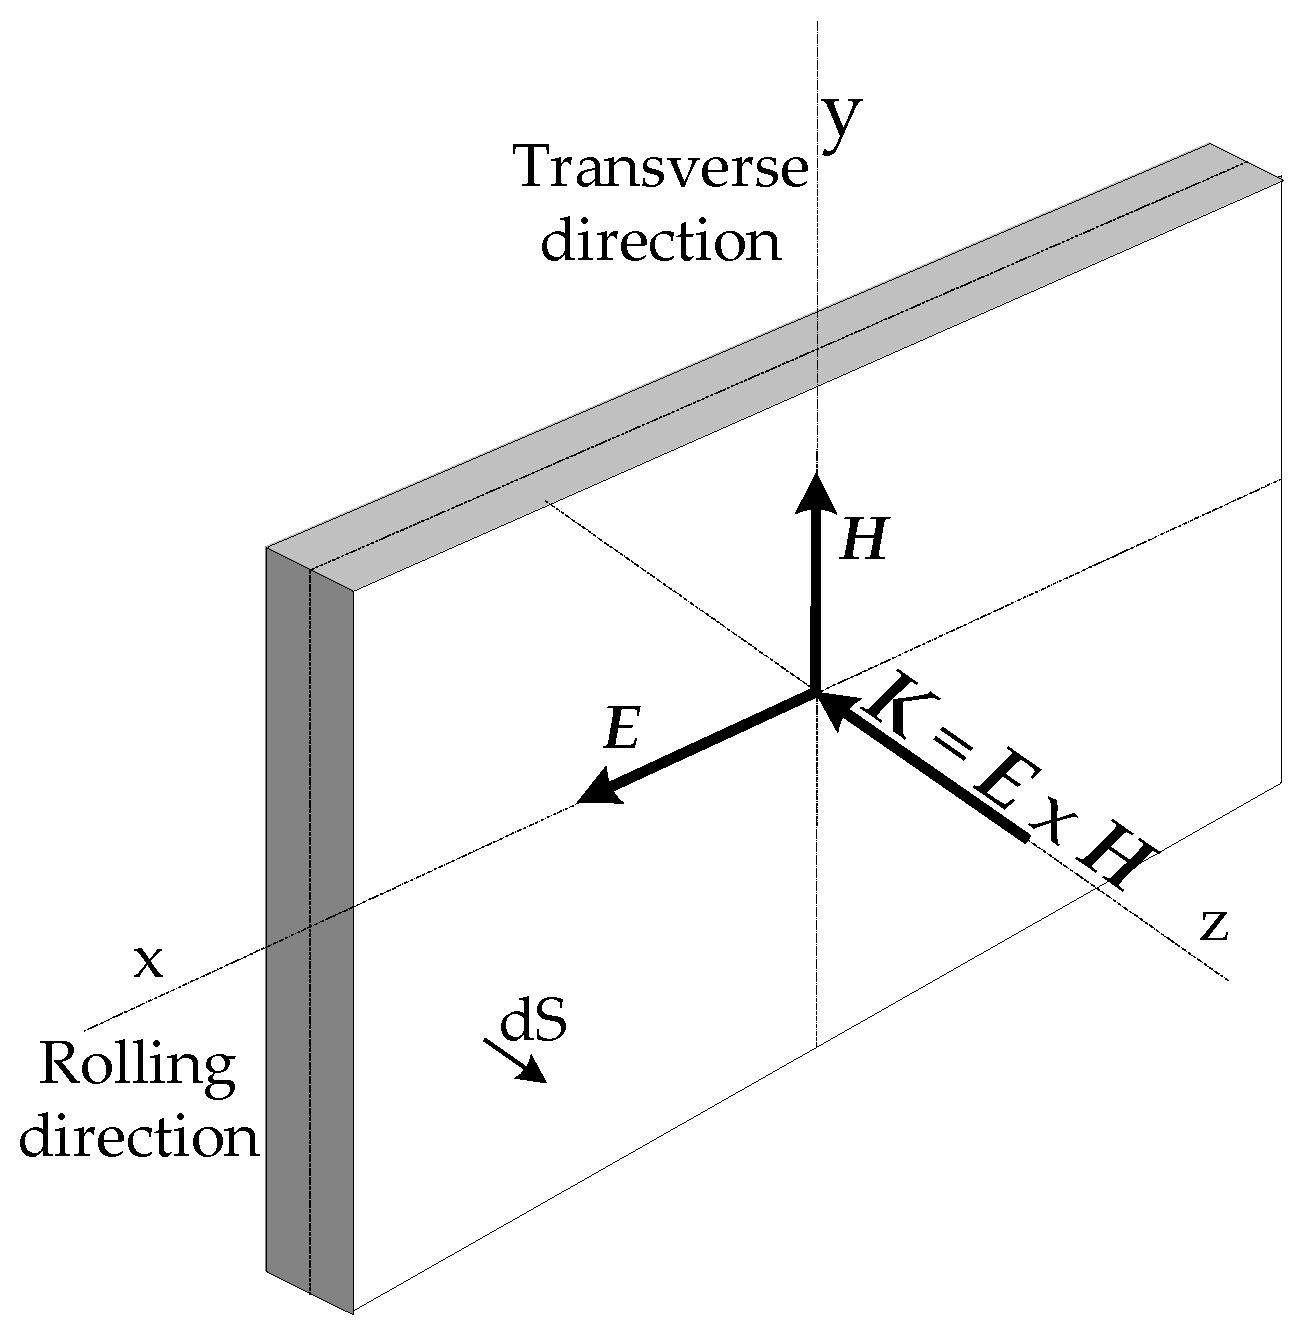
A magnetic loss due to the magnetization of ES causes the heating of the ferromagnetic material, which can be measured using a thermal method or an electrical method. The last method uses the Poynting theorem [34]. The Poynting vector K describes the power loss flow through a unit surface area. It is a vector product of the electric E and magnetic H fields, so the vector K is normal at the surface S of the ferromagnetic plate [35,36]. The sense of direction of vector K shows the direction of the energy flow, as shown in Figure 3. The power P, flowing in one second, may be described using Equation (3).
P = ( S ) ( E × H ) d S o r P = 1 T 0 T ( S ) ( E × H ) d S d t ,
The minus sign (−) indicates the energy emitted by the sheet surface.
After the transformation of Equation (3), using the Gauss–Ostrogradsky theorem ( V div ( E × H ) d V = S ( E × H ) d S ) as well as the first ( rot H = σ E , for D = 0) and the second ( rot E = B / t ) Maxwell equations, a relationship useful for the determination of the total loss in an ES sheet can be obtained. The total loss in the unit time, here, taken as 1 s, is equal to:
P = 1 T 0 T ( V ) H d B   d V + ( V ) E 2 1 ρ   d V   d t ,
where ρ is the resistivity of the sample, T is the magnetization cycle, and t is the time.
The first component of the sum in Equation (4) is interpreted as a hysteresis loss component. The second part of the sum is an eddy current loss component. Hence, Equation (4) represents the total loss separated in the volume of the ES sheets. However, it should be remembered that the use of Gauss–Ostrogradsky and Maxwell equations in the transformation of Equation (3) was possible under many assumptions, as for example the material uniformity and isotropy of its physical properties [29,36,37].
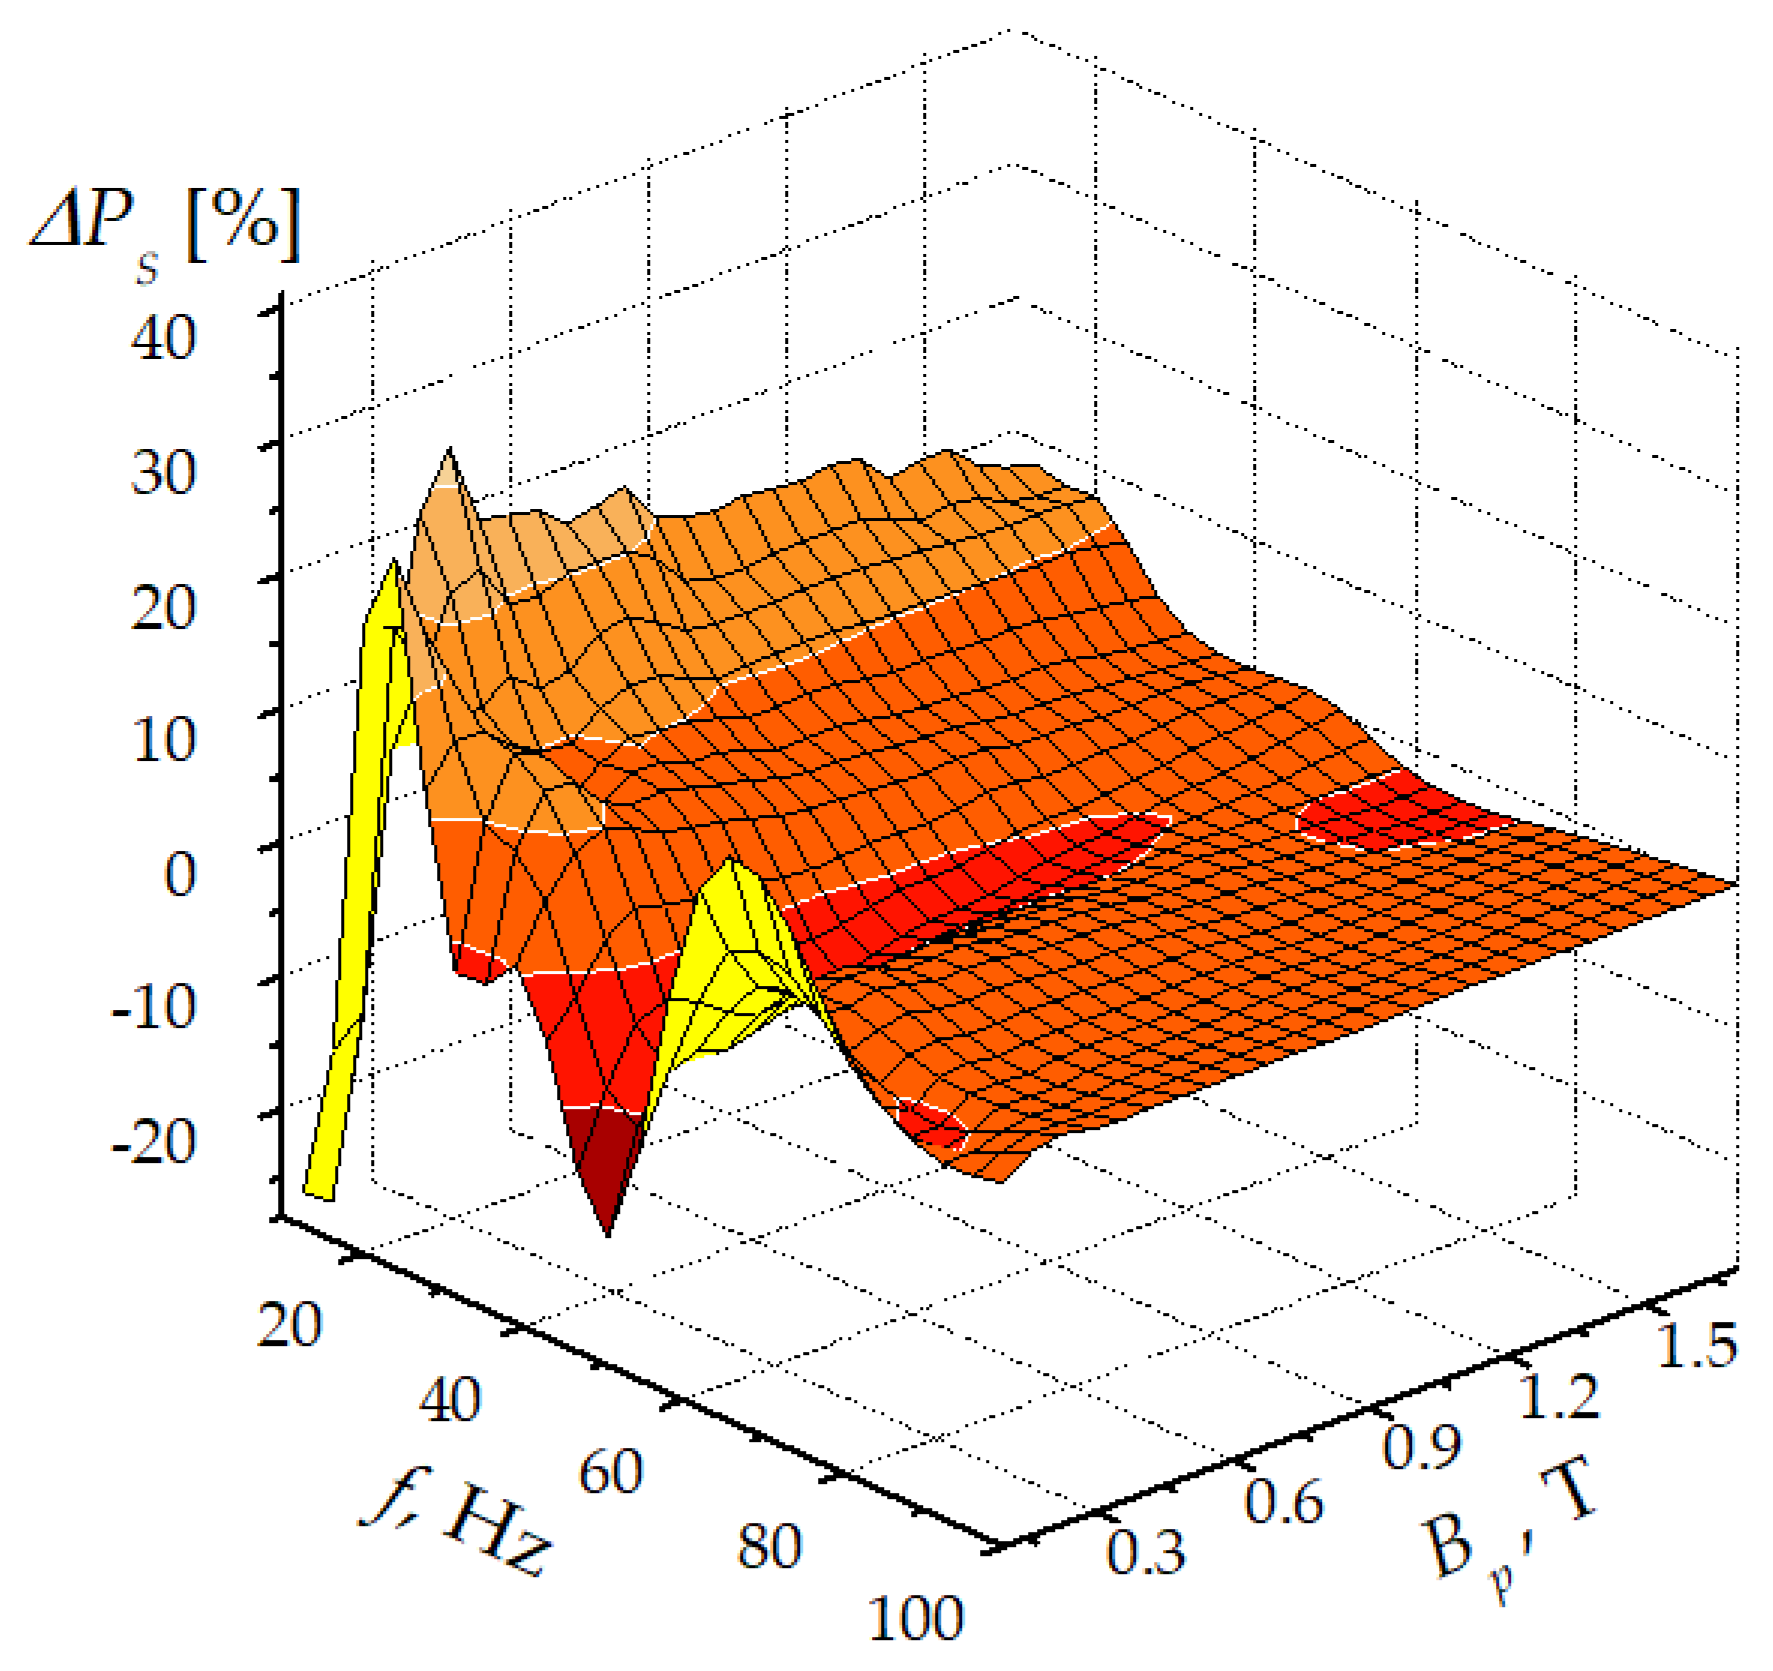
On the bases of the Poynting vector [34], the Steinmetz model [38] was elaborated. This description is still in use nowadays [39]. This model is referred to as the classical model. As in Equation (4), it consists of two components. The model was developed during experiments on hot-rolled steel with a maximum permeability lower than 5000, for frequencies up to 100 Hz and a peak flux density Bp up to 1.5 T. Exemplary results indicating the difference between the calculated and measured PS loss for the conventional, grain-oriented electrical steel sheet of grade M140-30S are presented in Figure 4.
In the case of conventional GOES of grade M140-30S, relatively small calculation errors are obtained for frequencies above f > 40 Hz and flux densities above Bp > 0.7 T. For smaller frequencies and flux densities, the two-component model yields values which differ significantly from their measured counterparts.
In the two-component model, the dynamic eddy current component was changed to the classical eddy current loss component, derived under severe simplifications from Maxwell’s equations. Together with the improvement in the GOES with Goss texture, the calculation error increased. Brailsford [40] already mentioned that the difference between the calculated and measured loss could be several times greater than the Pce loss component. The difference is called an excess or additional loss. Therefore, another component named the excess loss (Pex) was added to the existing two components in order to account for this discrepancy.
In the aftermath, the three-component model was developed for many years [41,42,43]. Finally, a statistical loss model was proposed by Bertotti [26,27]. Equation (5) is a simplified three-component model:
P s = C h ( B p ) B p α f P h + C c e B p 2 f 2 P c e + C e x ( B p ) B p 3 / 2 f 3 / 2 P e x ,
where Ch(Bp) is the hysteresis loss coefficient, Cce = π2d2(6ργ)−1 is the classical eddy current loss coefficient, Cex(Bp) is the excess eddy current loss coefficient, α is the exponent of flux density, ρ is the resistivity, Bp is the peak magnetic flux density, d is the sheet thickness, and γ is the mass density.
The classical eddy current loss component coefficient Cce can be calculated as in Equation (5). The skin effect phenomenon can change the flux density distribution over a cross section of the steel sheet and modify the value of classical eddy current power loss. In a frequency range up to 400 Hz (which is more or less the upper limit, where Bertotti’s model is applicable), the variation in parameter Cce is relatively small. The coefficients Ch(Bp) and Cex(Bp) are determined from the measured data for a certain frequency using the least square method and are assumed to keep constant values. The coefficient Cex(Bp) changes with the flux density due to variations in the specific coercive force V0 [26]. Since for the magnetization process at a quasi-static state, the source of hysteresis loss is moving domain walls, the quantity V0 might be a link between the hysteresis loss and the additional loss. The coefficient Ch(Bp), in practice, varies with both the flux density and frequency. The Steinmetz model and statistical model assume that Ch(Bp) is constant over different flux densities and frequencies. Therefore, loss prediction requires the calculation of their average values [39]. However, averaging can be a source of significant errors in a loss calculation. Although these limitations are due to the fact that it employs coefficients dependent on the material structure, the model was extended into a time domain [44,45]. However, the components Ph and Pce were derived under some assumptions that we have already mentioned, such as a sinusoidally varying magnetic flux and a constant magnetic permeability value, both in time and space. As a consequence, the model is applicable in a narrow range of flux densities and frequencies. Beyond those ranges, the loss prediction accuracy decreases, as will be shown later. The three-component model can be applied at any magnetization angle x related to the RD [24,46,47].

3. Materials and Methods

The experiment was carried out using commercially available GOES with Goss texture. From the mother sheet, square samples of 100 mm × 100 mm were cut. They were cut at the angles x = 0°, 27°, 36°, 45°, 54°, 63° and 90°, with respect to the rolling direction. The thicknesses of ES grades chosen for the tests varied in the range from 0.27 mm to 0.35 mm, whereas the specific total loss anisotropy calculated from Equation (2) varied from about 50% to 60%.
A non-standard single sheet tester was used. The magnetizing yoke consisted of two C-cores that were 25 mm thick. The magnetic field strength was calculated from the magnetizing current using Ampere’s law. The current was measured as a voltage drop on a non-inductive resistor of 0.5 Ω. The magnetic flux density was calculated from the voltage detected in the secondary coil. An air flux compensating coil was used. The magnetizing conditions were controlled using the computerized system presented in Figure 5.
The measuring system was based on the LabViewTM ver. 8.1 programming platform. A 16-bit NI PCI 6251M DAQ card was used to acquire data and generate a voltage signal amplified by a 4 kW power amplifier [48]. The amplifier was equipped with specially designed overcurrent protection. To avoid the direct component of the magnetization current, an isolation transformer was used. To minimize the additional distortion that could be introduced by the separation, the transformer was designed to work on the linear section of the magnetization curve.
The specific total loss PS was measured under a sinusoidal magnetic flux condition. The sine wave was controlled by monitoring the values of the form factor (FF) [49] and total harmonic distortion (THD) factor for the magnetic flux [50]. For the aim of loss separation, measurements were carried out in frequency range from 2 Hz to 100 Hz. The maximum flux density was dependent on the grade of the ES and on the magnetization direction. For magnetically hardest direction, around 60° to the RD, the maximum peak flux density Bp varied from 1.3 T to 1.5 T, and in the other magnetization directions, the maximum peak flux density Bp varied from 1.6 T to 1.9 T.

4. Calculation Results

4.1. Specific Total Loss Separation

To model the directional properties, a three-component PS loss model described by Equation (5) can be used [39,46]. The accuracy of PS loss modeling depends mainly on the accuracy of the loss separation. For this reason, measurements of the PS loss were performed for a minimum of twelve frequencies. The frequency values were chosen to compact the measurement data in the range of the greatest non-linearity of the PS/f relationship, as shown in Figure 6. The results of the work in [50] indicate a discrepancy of about 10% for GOES over the entire range of flux densities and measurement frequencies.
Only one, namely the classical eddy current component Pce appearing in Equation (5), can be directly calculated. The determined curves for Pce are depicted in Figure 6 as black dashed lines. The coefficient of the hysteresis component Ph and the excess component Pex must be determined experimentally. The Pce component should be subtracted from the PS loss values obtained from the measurements and the difference should be divided by the value of frequency f. As the result, a linear equation of the type a f1/2 + b is obtained. This equation is fitted to the experimental points PS/f = f(f), presented as circles in Figure 6. The experimental relationship PS/f = f(f) shows a high non-linearity for all considered angles, especially in the low-frequency range.
As can be inferred from Figure 6, the dependency of Ps/f = f(f) for electrical steel of grade M120-27S exhibits a significant non-linearity, in particular, in the low-frequency range. In the GOES grades under study, an important source of excess loss Pex is the domain structure. The domain structure affects the hysteresis component and the excess component alike. Both components also show a strong dependency on the magnetic anisotropy. As can be seen from Figure 6, the excess loss component is a significant portion of PS loss. The excess loss is higher than the hysteresis loss for all presented magnetization directions. The large non-linearity of the PS/f = f(f) relationship indicates that more than two experimental points are required for the purpose of distributing the loss for different magnetization directions. The proposed model of the angular behavior of specific total loss allows for the calculation of the directional properties for any magnetization angle based on the loss separation carried out only for three directions of magnetization, for example, as presented in Figure 6 [25].
The graphs of the three components of PS loss from Equation (5) obtained from loss separation are shown in Figure 7.
In Figure 7, all relationships for different magnetization directions and all three loss components follow a power law function. However, at high flux densities, above about Bp > 1.0 T, both the Ph and Pex relationships are curved. This can be due to the result of a non-uniform magnetic flux distribution across the sheet thickness when the saturation state is approached [40]. It is worth noticing that both components are dependent on the magnetic anisotropy, contrary to the classical eddy current component Pce, which is assumed to be isotropic. In fact, there exists some anisotropy in component Pce due to the anisotropy of resistivity, but at room temperature, it is negligible [51]. It should be stressed that only the ends of curves of the Pex component dependency are slightly curved. Hence, the above-given dependencies may be fitted with a power equation as below,
P = a B p b ,
and the power law function in the log–log scale is plotted as straight line. The directional dependencies of the specific total loss components Ph and Pex were fitted with Equation (6). The dependencies of the coefficients a and b on the direction of magnetization x are presented in Figure 8.

4.2. Specific Total Loss Model

It is agreed that the excess loss component is associated with domain wall movement. This movement occurs even at very low magnetization frequencies. Therefore, firstly, the component has been associated with the hysteresis loss [52,53,54], and it was not until later that it was combined with micro eddy currents created by the domain wall movement. The literature reports on numerous attempts to establish some relationships between the excess loss and the non-uniform distribution of permeability in the sample cross section.
For the above reasons and the similarities between the dependencies of hysteresis and excess loss components on the flux density for different magnetization directions, it follows that the sum of both of these components can be used in further calculations. In Figure 8, the coefficients were obtained from the fitting dependencies presented in Figure 7 with Equation (6).
The similarities presented in Figure 7 and Figure 8 result from the strong dependencies of both loss components on the domain structure. The domain structure influences the hysteresis loss even at quasi-static magnetization conditions. The main reason for separating both components is a different frequency behavior and different origin. In [55], it was found that the hysteresis loss component may not be proportional to the frequency, especially in the low-frequency range (non-linearity of the characteristics shown in Figure 6).
Apart from the presented similarities between hysteresis and excess loss components, their interdependency was examined in [46]. Therefore, in papers [24,46] for the modeling of PS loss, it was proposed to use the sum of the two components. In Figure 9, the dependency (sum of Ph and Pex versus magnetic flux density) was plotted.
The angular behavior of the sum of Ph + Pex presented in Figure 9 follow the power law function Ph+ex = aBpb. The power function does not reproduce precise relationships in the entire flux density range presented in Figure 9, but only up to approximately 1.0 T–1.5 T. Above this range, the curves presented in Figure 9 are considerable deviations between the experiment and the power law fit. Therefore, instead of a simple power law function, a modified power law function with an expanded peak flux density exponent in the form of a parabolic function was used:
P h + e x ( x ) = a ( x ) B p b ( x ) ,
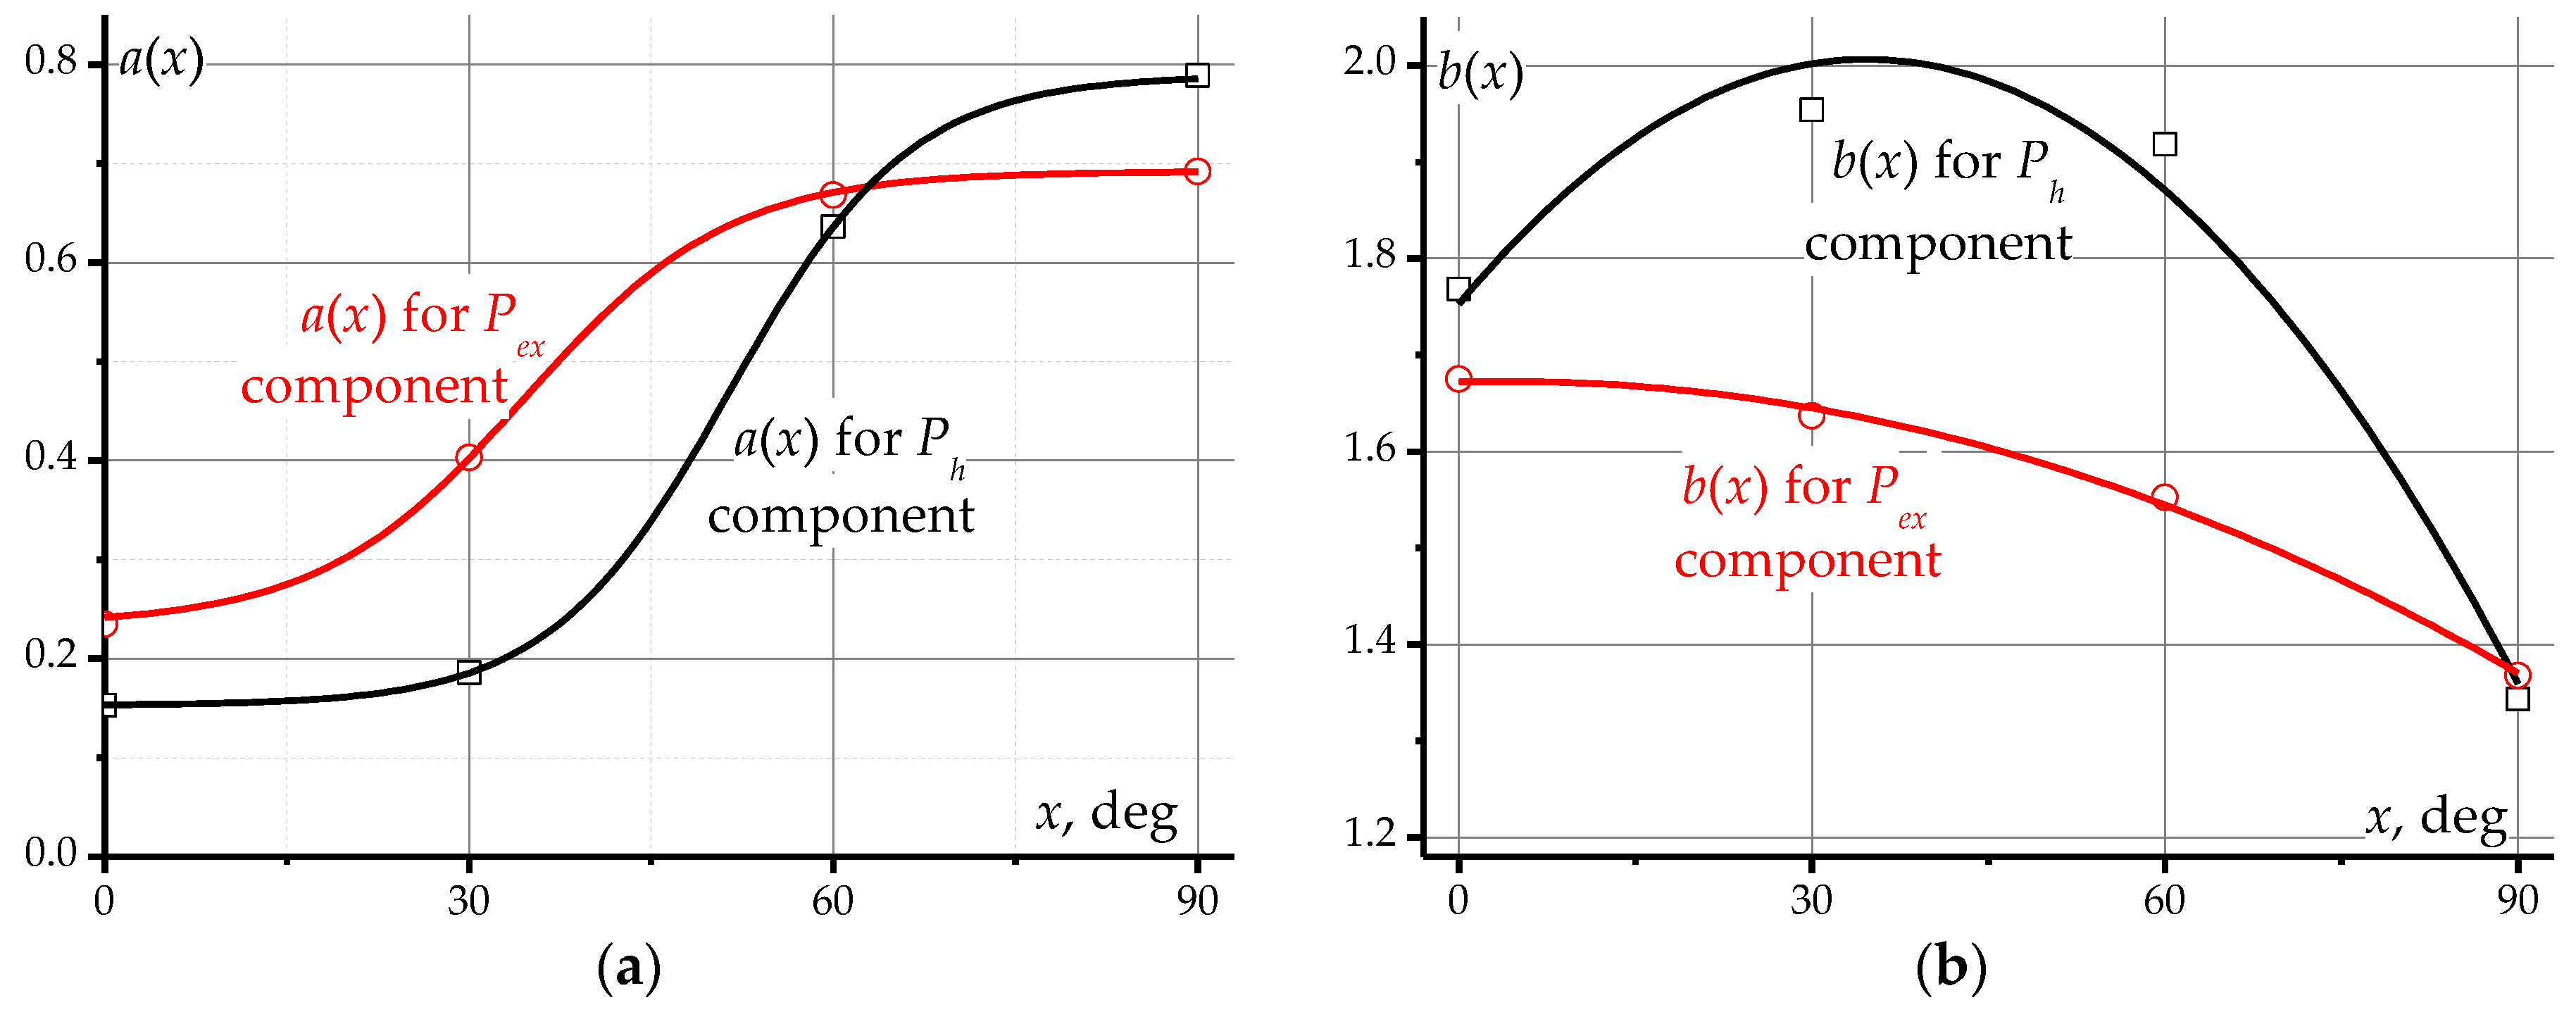
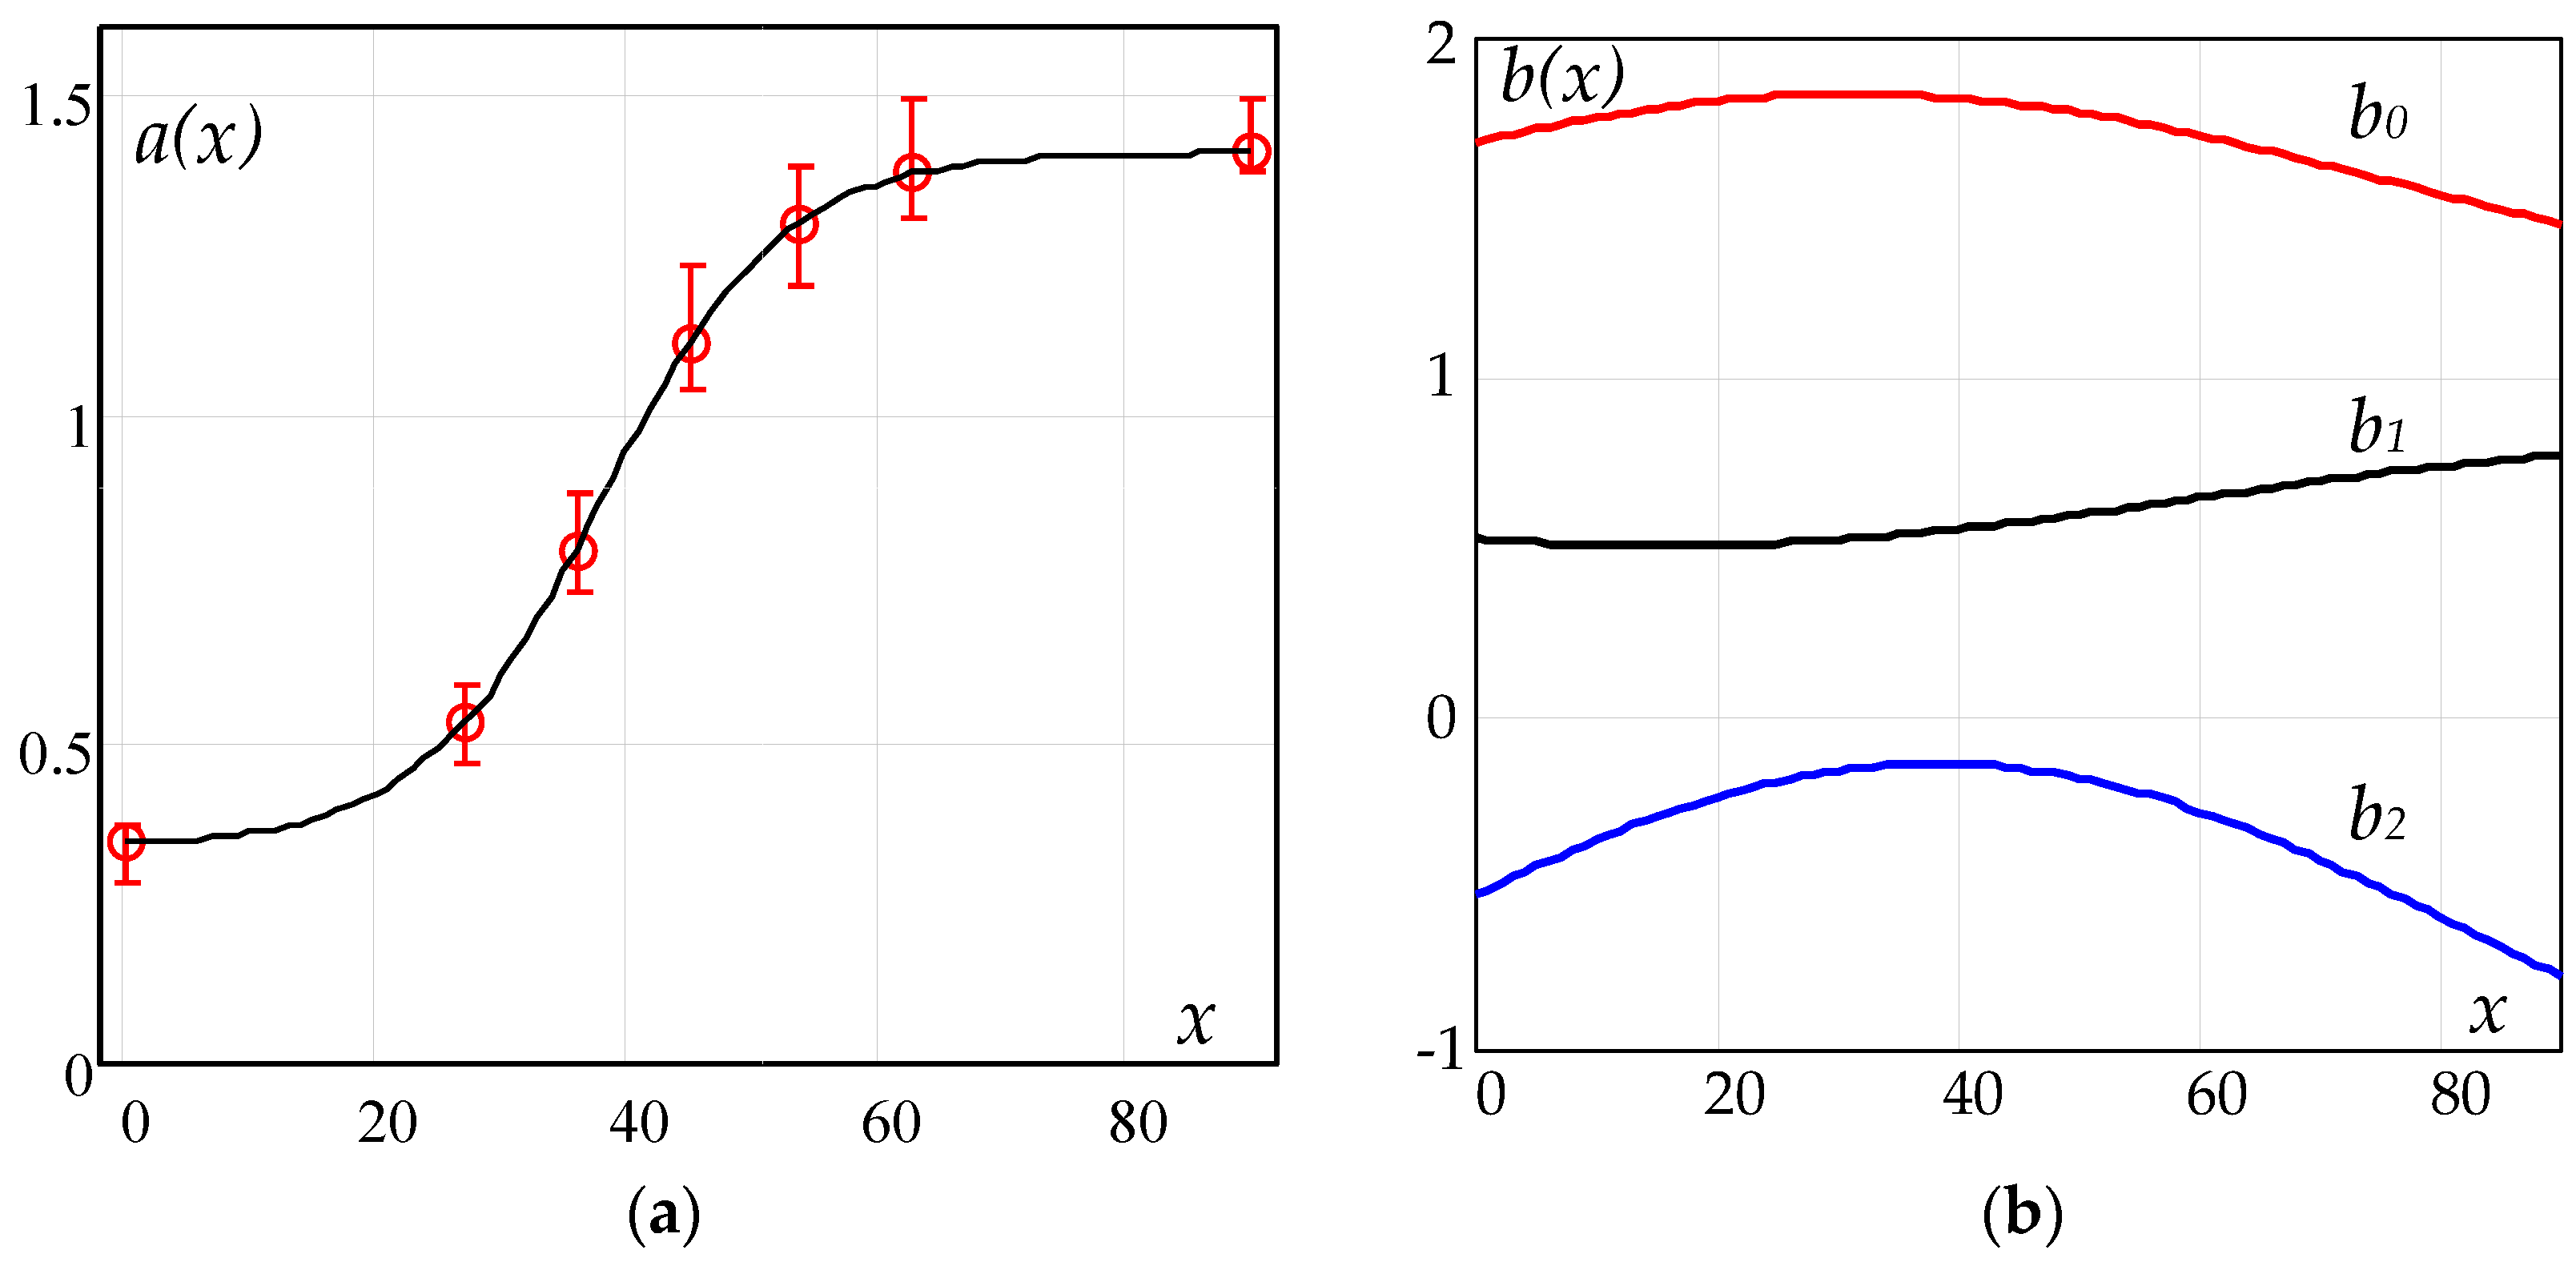
where the functions a(x) and b(x) are presented in Figure 10a and Figure 10b, respectively, and the function b(x) is a parabolic function in the form b0 + b1x + b2x2.
Therefore, each curve in Figure 10 can be described by a set of coefficients. For example, for the 0° magnetization direction, these will be a(0), b0(0), b1(0) and b2(0), and the function describing the Ph+ex relationship in Figure 9 will have the form Ph+ex = aBpb0(0) b1(0)+b2(0). In Figure 10, the coefficients a(x), b0(x), b1(x) and b2(x) are plotted versus the magnetization angle x.
Previous work [25] presents the dependencies a(x) and b(x) calculated as the average for five tested grades of electrical steel under research. In this work, a certain modification was used, consisting in averaging the parabola coefficients b0(x), b1(x) and b2(x) constituting the exponent of the exponential Equation (7) for all the ES grades tested. The validity of such a procedure was confirmed by the small variability in the coefficients b0, b1 and b2 with the anisotropy ΔPS90-0 and magnetizing frequency [24]. In this way, three dependencies (b0(x), b1(x) and b2(x)) were obtained, which were used in the calculations of the basis of the power function from Equation (7). This procedure achieved a smaller spread of the a(x) coefficients marked in Figure 10a. The curves of the base and averaged coefficients in the function given as Equation (7) are shown in Figure 10.
In Figure 10a, the sets of coefficient a for seven grades of GOES are presented. The dependency of coefficient a versus the angle could be described with a sigmoidal function. In this paper, the Boltzmann equation is proposed to fit the non-linear relationship between coefficient a and the magnetization angle x, as in Equation (8):
a ( x ) = a ( 90 ) + a ( 0 ) a ( 90 ) 1 + exp ( x x c m )
where a(0) is the value of coefficient a at the angle x = 0°, a(90) is the value of coefficient a at the magnetization angle x = 90°, xc is the angle at the center (a(90) + a(0))/2, and m is the slope of curve.
The lines in Figure 10a were calculated by fitting the Boltzmann function Equation (8), and error bars characterize the distribution of coefficient a for the seven grades of ES under study. In Equation (8), the coefficients a(0) and a(90) are the values of coefficient a for Equation (7) for the magnetization directions 0° and 90°, respectively. They are determined from measurements. The coefficient xc is found as an angle for which a(xc) = ½(a(90)—a(0)), and it is an inflection point. The coefficient m is the slope of the curve a(x) in the inflection point, and it is obtained using a fitting procedure. To sum up, to obtain all coefficients of Equation (8), minimum measurement data for three magnetization directions are required, e.g., a(0), a(45) and a(90).
Three experimental points are also needed to determine the set of coefficients b0(x), b1(x) and b2(x), for example, for x equal to 0°, 45° and 90°. Then, the course of the coefficients of the parabolic functions b(x) can also be determined. The function b(x) is a parabolic function in the form b0 + b1·x + b2·x2. In the model presented in this paper, parabolic functions, as shown in Figure 10b, were used. They were calculated as an average of the seven considered electrical steel grades.

4.3. Analysis of Model Coefficients

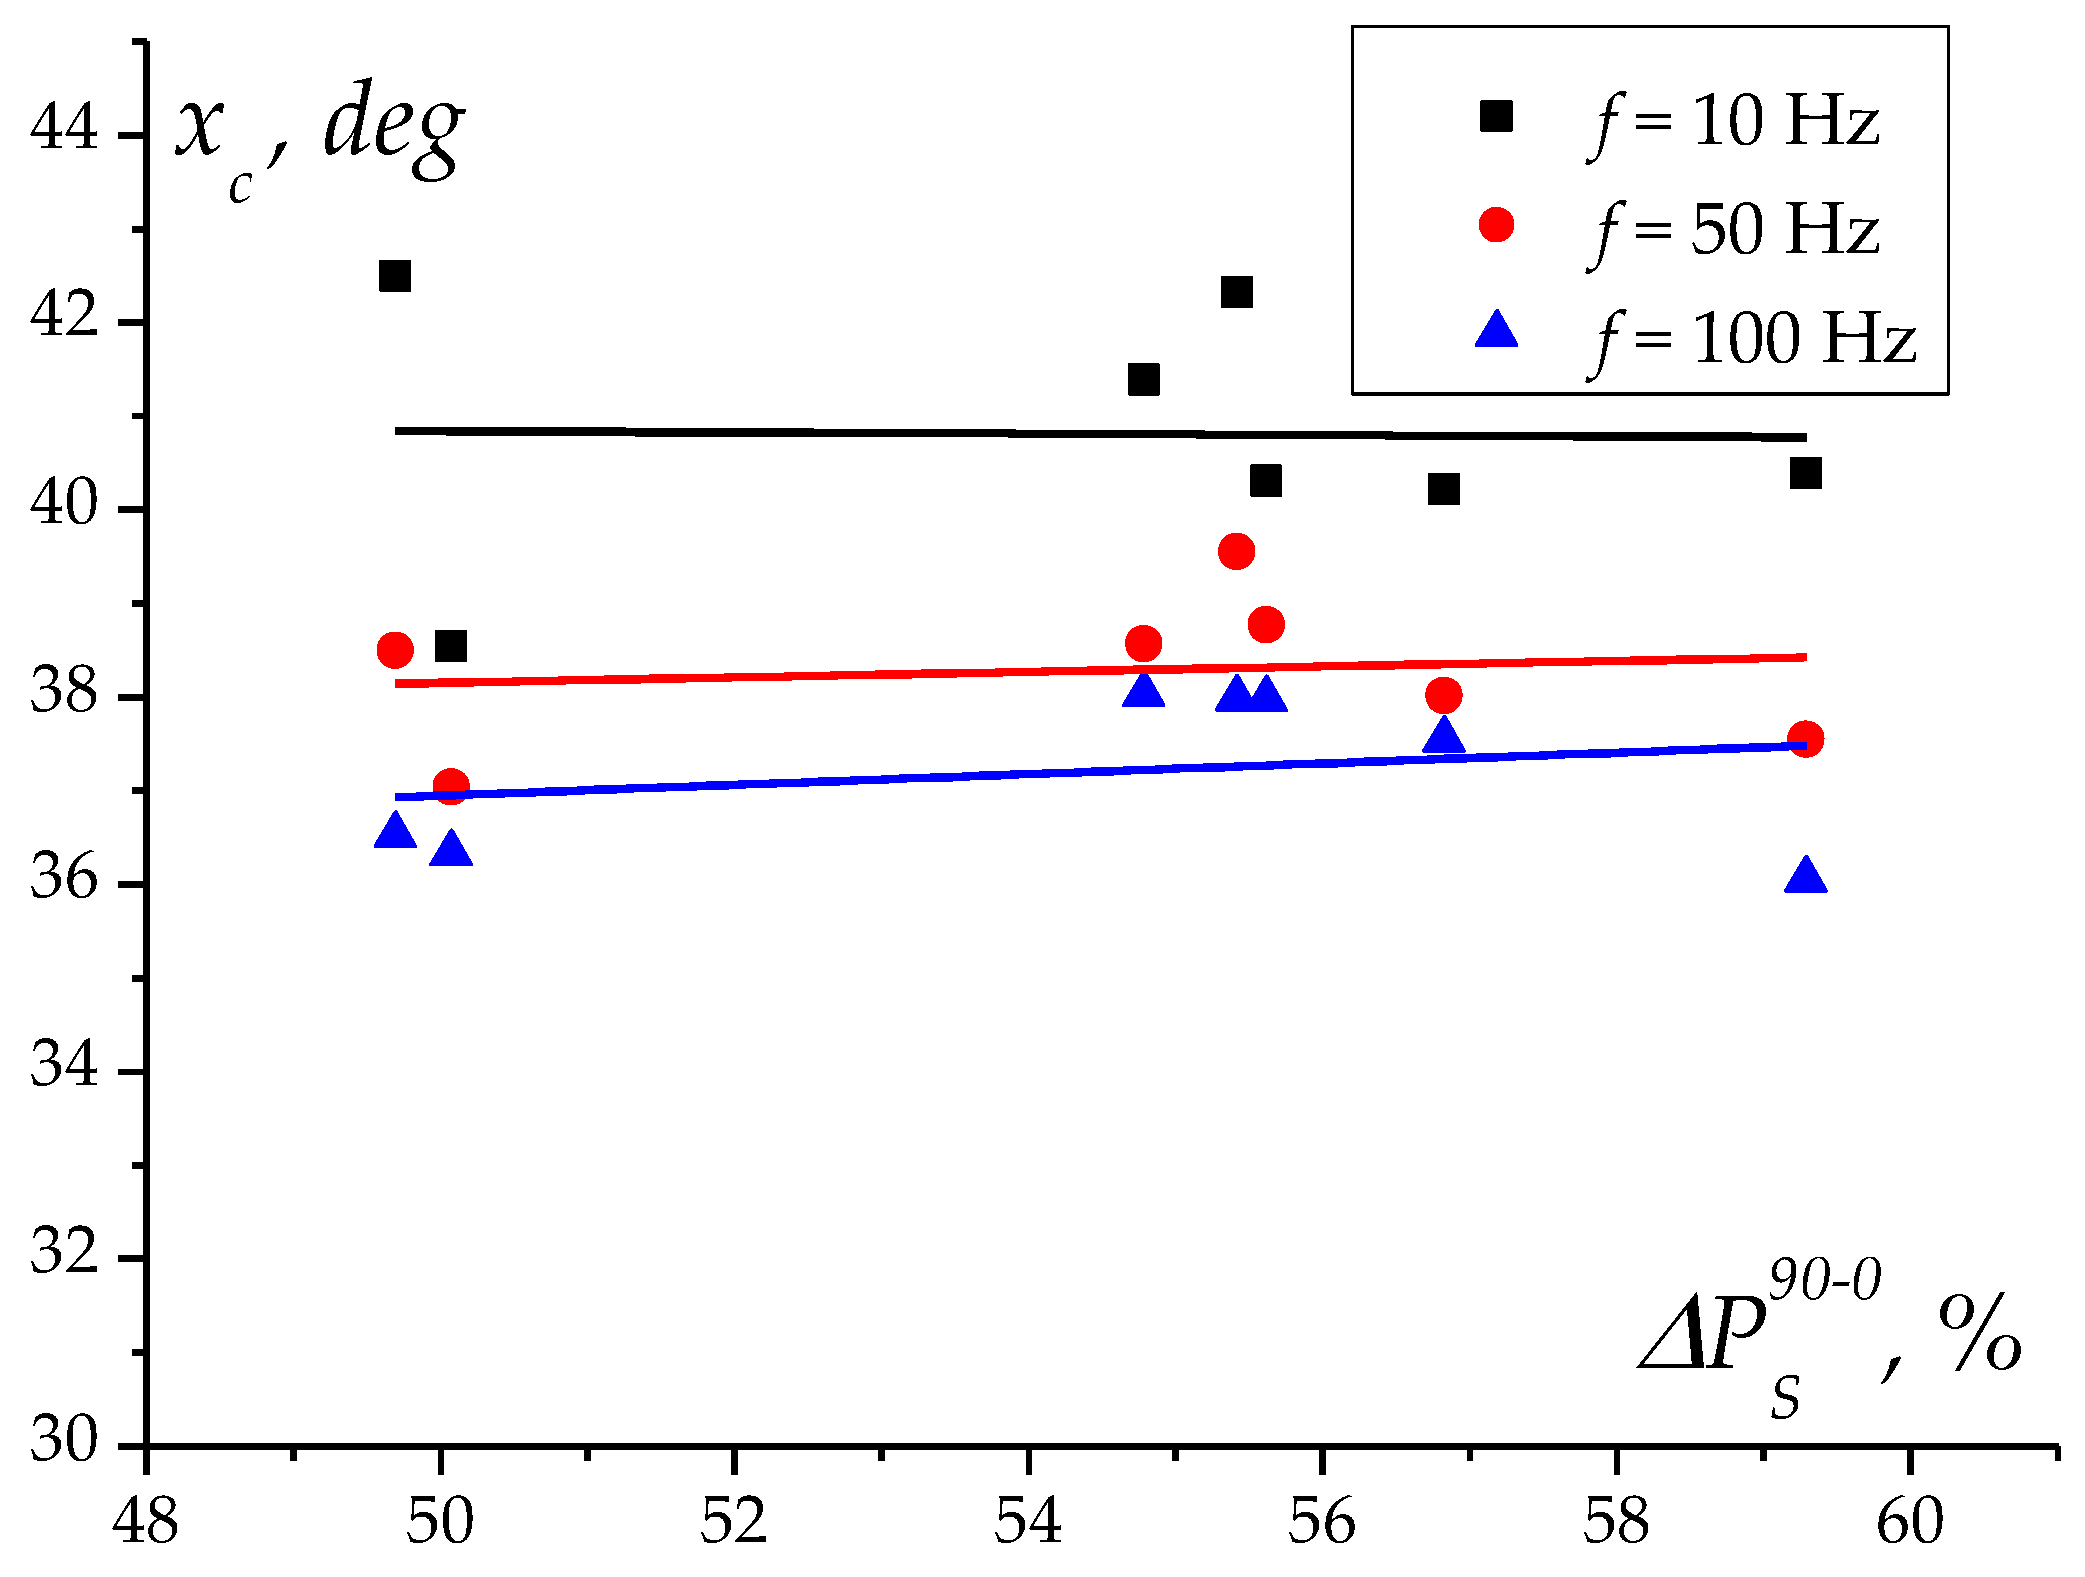
The measurements of specific total power loss PS should be carried out at the angles x = 0° and 90°. The performed analysis (Figure 11) indicates that the third angle should be chosen from the magnetization angle in the range x = 30° to 45°. Also, in Figure 10b, it can be seen that the inflection point is less than 45° in the case of the parabolic function b(x).
The inflection point of the sigmoidal function (Figure 10a) depends on the frequency, as it can be seen in Figure 11. For the frequencies 10 Hz, 50 Hz and 100 Hz, the inflection points (the parameter xc of Equation (8)) are in the ranges of 36° to 38°, 37° to 39° and 38.5° to 42.5°. The inflection point xc weakly depends on the loss anisotropy ΔPS90-0, but the influence of the frequency is significant. In Figure 11, the increasing dispersion of the xc points with a decreasing frequency is also visible. At 5 Hz (not shown in Figure 11), the point even reaches 43° for ES displaying ΔPS90-0 = 55%. Moreover, this angle increases with a frequency decrease. This statement is consistent with the fact that the origin of the magnetic anisotropy should be measured at the dc magnetization condition [31,32].
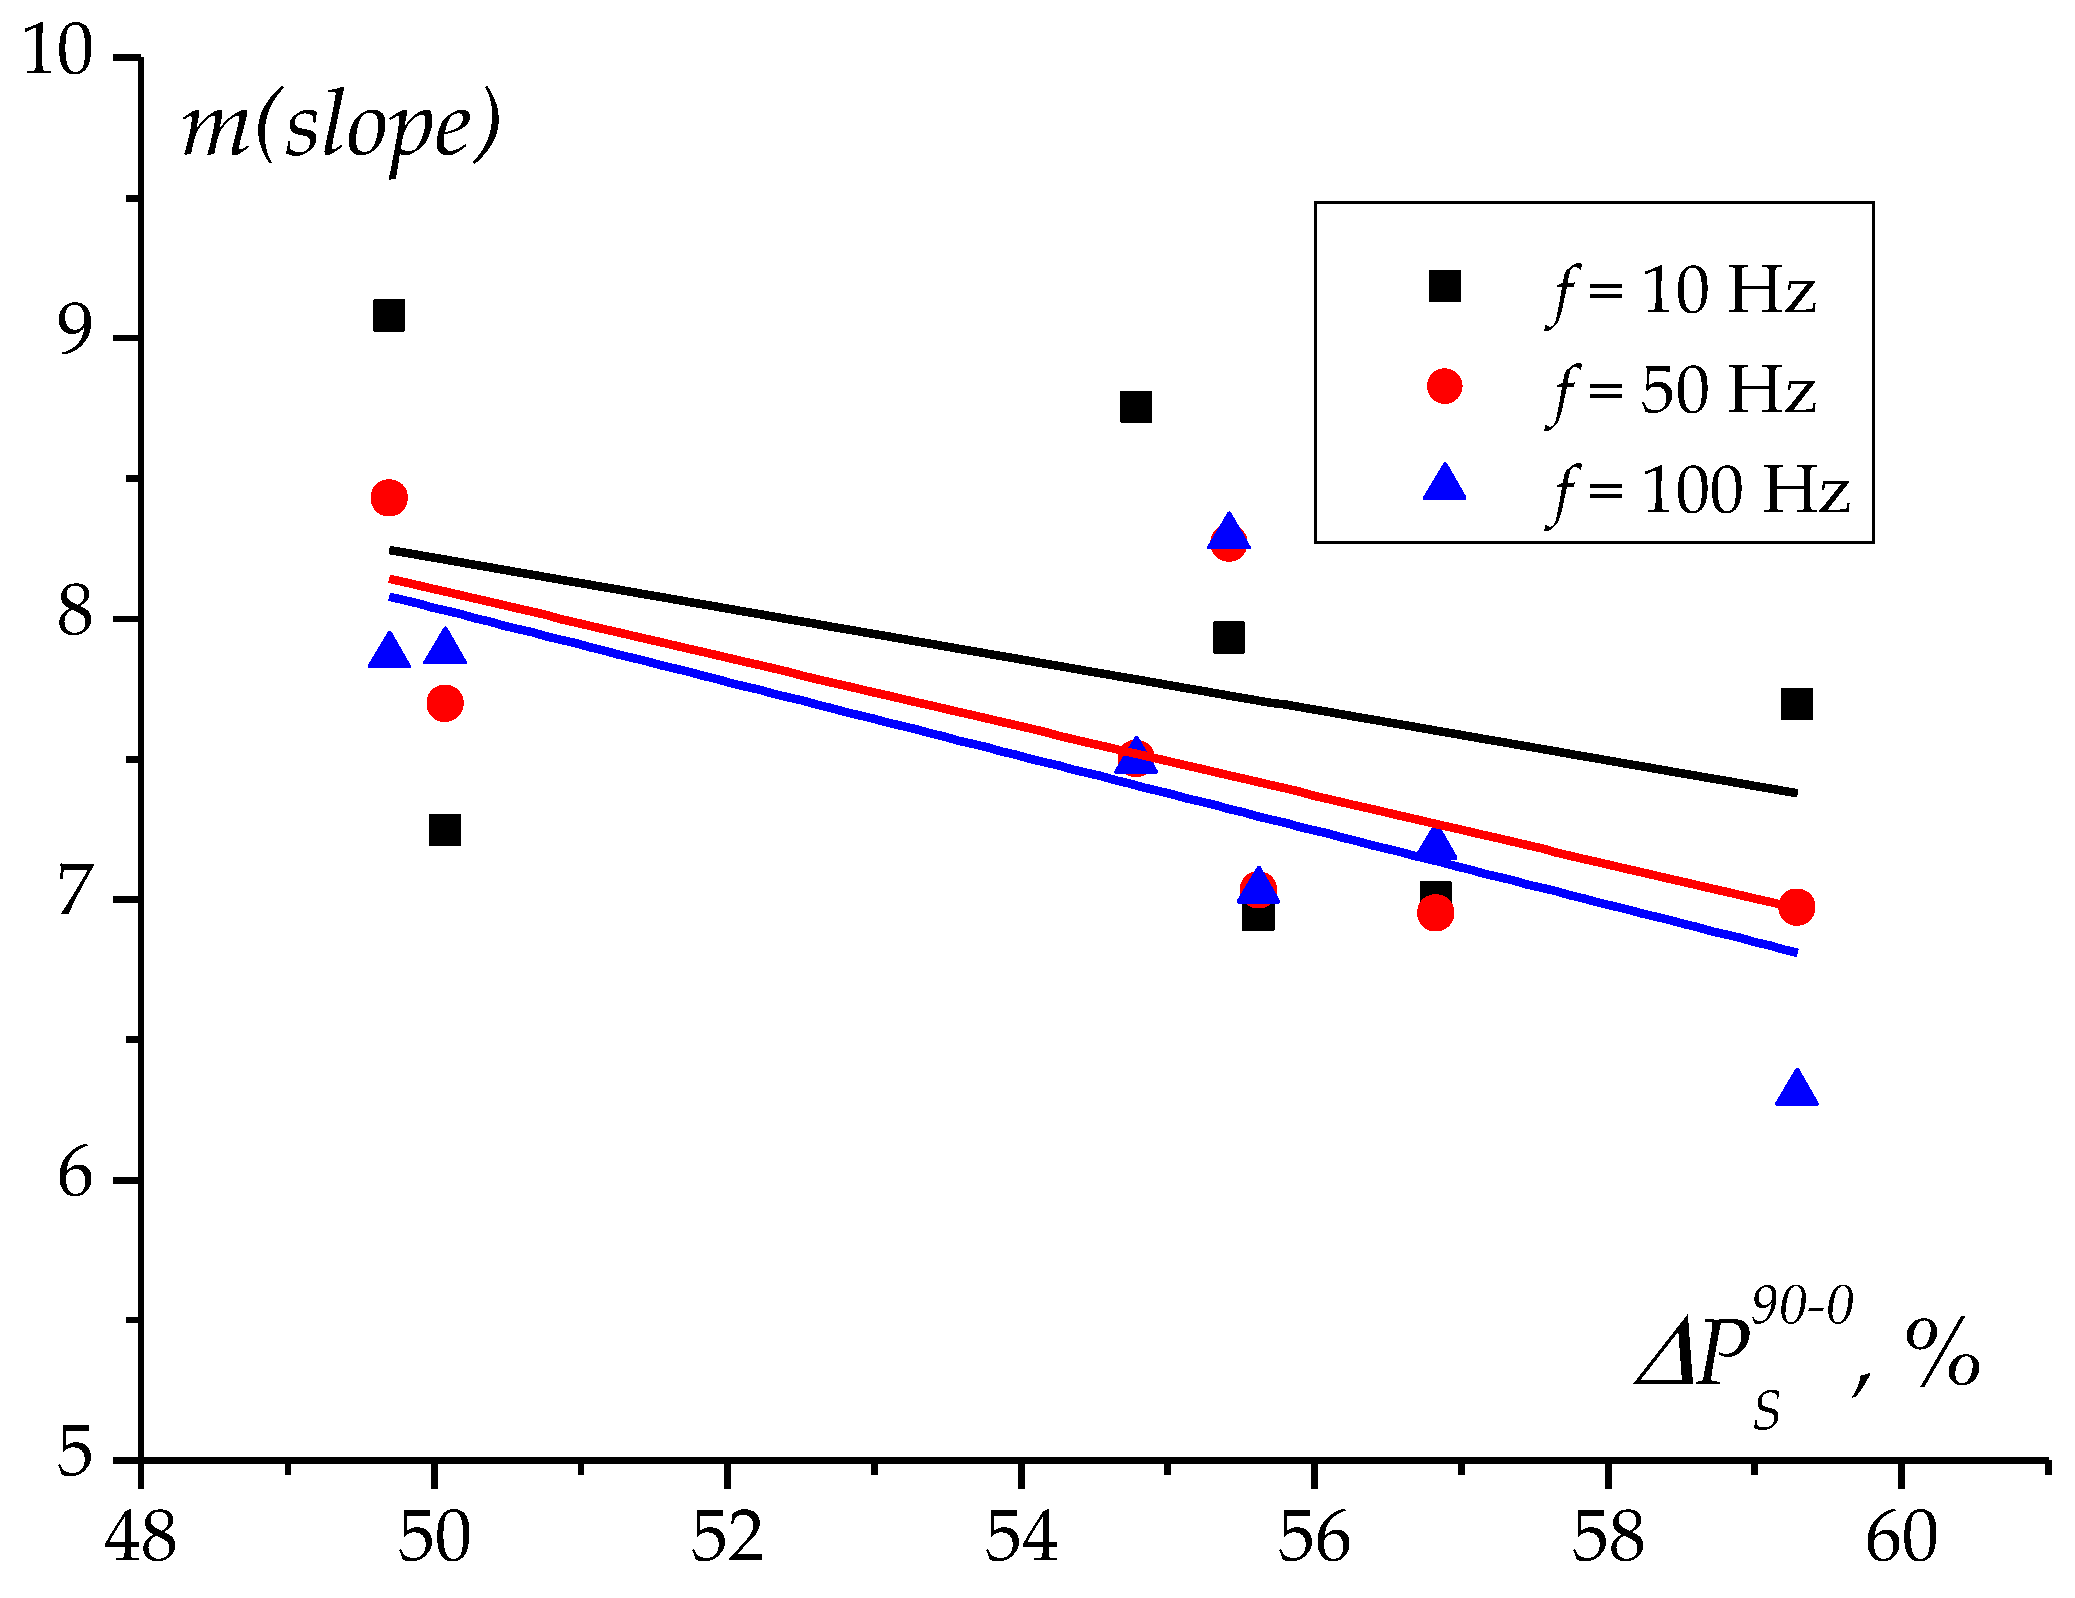
A similar dispersion of experimental points as in the case of the xc point is observed in the case of the slope m (Equation (8)) in the sigmoidal function. The largest dispersion occurs for the frequency 10 Hz and the lowest, for a frequency of 100 Hz. In Figure 12, the dependency of the successive values of coefficient m on the loss anisotropy ΔPS90-0 is presented.
The parameter m is the slope of the curve a(x) presented in Figure 10a. This is one of the coefficients that have to be fitted to three experimental points at a(0) and a(90), as well as one point from the range 35° to 45°. It can be seen that it is inversely proportional to the loss anisotropy ΔPS90-0. The parameter m weakly depends on the frequency and similarly, like in the case of the dependencies of xc, the dispersion of data increases with a decrease in the frequency. This is opposite for the remaining two parameters a(0) and a(90) presented below.
Figure 13 shows parameter a(0) of Equation (8) as a function of the anisotropy ΔPS90-0 and frequency.
The dependency of parameter a(0) depends on the anisotropy ΔPS90-0 and frequency. The slope of the straight lines fitted to experimental points decreases with an increase in the anisotropy ΔPS90-0 and frequency. The frequency dependency is understandable, as it concerns two parameters directly related to the difference between the specific total loss PS and classical eddy currents Ph+ex = PSPce. It is worth emphasizing that the slope of the straight lines significantly decreases with a decreasing frequency. In Figure 13, the curves look parallel when they are plotted on a logarithmic scale. A similar behavior can be observed in Figure 14 concerning parameter a(90) of the sigmoidal function Equation (8) plotted versus the anisotropy ΔPS90-0 for three magnetization frequencies: 10 Hz, 50 Hz and 100 Hz.
As can be inferred from Figure 14, the parameter a(90) concerning the transverse direction does not seem to be dependent on the anisotropy ΔPS90-0. However, the parameter depends on the frequency as a power law function with an exponent value less than unity, whereas for the parameter a(0), the power exponent is approximately 1.3. The difference between the frequency behaviors of a(0) and a(90) can be due to the different magnetization phenomena at rolling and transverse directions.

5. Calculation of Directional Properties of Ps

As mentioned above, the directional properties of PS can be calculated from a minimum of three values of PS measured at the angles x = 0° and 90°, as well as one from the range 30°≤ x ≤ 45°. For each direction, the sum of hysteresis Ph and Pex (excess eddy current components) can be calculated. This can be performed from the loss separation procedure in the form Ph+ex = Ph + Pex. For a single frequency, the loss separation procedure is not required. However, the sum Ph+ex can be calculated as the difference between the specific total loss and classical eddy current loss Ph+ex = PS − Pce. The component Pce can be calculated theoretically from the middle term of Equation (5). The advantage of loss separation is the possibility to calculate the angular behavior at any frequency up to the limit of applicability of the three-component loss model. Figure 15 presents an example of the calculation results for electrical steel of grade M150-27S.
Figure 15 presents the results of the directional properties for four different magnetization angles. The results of the PS loss measurements, marked with empty circles, and the calculation results for two versions of the computational models are presented. In one version of the model, the average values of the coefficients for the second-order polynomial of the power exponent of the magnetic flux density Bp, Equation (7), were taken into account. For the exponent coefficients selected in this way, a single sigmoidal function was calculated. The calculation results for this model are shown in Figure 15, and they are marked in red, with the dashed line marking the error in calculating the total PS loss, and the solid line marking the calculated PS values. In the second version of the model, the average values of the coefficients for the second-order polynomial of the power exponent of the magnetic flux density were determined, and a sigmoidal function was determined for the coefficients selected in this way. In the considered example, calculations were carried out assuming the sigmoidal function and the average values of the flux density Bp. The values of the parameters appearing in the sigmoidal function and the value of the power exponent were chosen specifically for the grade M150-27S. In Figure 15, the values for this model are marked in blue, and the designated errors are marked with a dashed line and a solid line for the values of the calculated PS loss.
The calculation errors shown in Figure 15 depend strongly on the flux density Bp. For small Bp values, they reach up to 40%, but for higher Bp values, they are significantly reduced to several percent. They should be considered relatively small, as the calculations were performed for the average values of the coefficients a and b(Bp) for the considered seven grades of GOES. A characteristic feature of the considered approach is the exact reproduction of errors obtained for the average values of the flux density (Bp) exponents and the sigmoidal function, and for the average values of the flux density (Bp) exponents and the sigmoidal function calculated for the selected grade of ES. Both facts indicate that the selection of the flux density exponent coefficients has the greatest impact on the accuracy of the calculations according to Equation (7). Although the parameters of the sigmoidal function influence the calculation errors, the most important thing is to map the course of the PS losses versus the density flux. On the other hand, they may also be caused by a lower accuracy in the measurements for small values of the flux density (0.1 T to 0.4 T) and low frequencies below 10 Hz.

6. Conclusions

The magnetic anisotropy of specific total power loss is a highly non-linear phenomenon. It can be modeled in various ways as mentioned in the Introduction. The paper discusses the modeling of the directional properties of GOES, which involves the division of the total losses into two components: isotropic and anisotropic. The first isotropic component is the so-called classical eddy current component. The second anisotropic component is the sum of hysteresis and the so-called excess loss component. Both the hysteresis and excess components depend strongly on the magnetic anisotropy.
Previous work [25] presents the results of the calculations for the coefficients of the sinusoidal and parabolic functions, calculated for individual values of different GOES grades. These errors were relatively small, around a few percent. In the case of the calculated average values for the group of tested sheets, the calculation errors were significant and reached several percent. In the case of the averaged values of the coefficients for both the parabolic and sigmoid functions, they did not exceed several percent in most magnetization angles. However, for some magnetization angles, they reached significant values, but for magnetic induction values above 0.5 T, they did not exceed 30% for all the sheets tested. This result should be considered as an acceptable one due to the averaging of two functions: the exponent of flux density and sigmoidal function. It is worth noting that the error characteristics are almost parallel, as shown in Figure 15. Small values of errors and the repeatability of error characteristics confirm the correctness of the direction of the research work aimed at refining the presented model.
The above conclusions are also confirmed by the analysis of the parameters in the PS loss anisotropy model. The analysis of the computational errors showed that the accuracy of mapping the polynomial exponent of the flux density had a significant impact on their reduction. The analysis of the sigmoidal function coefficients showed a decrease in the value of the a(0) coefficient and the m slope with an increasing ΔPS90-0 anisotropy, and the dependency of sigmoidal function parameters on the frequency is exponential. The increase in the spread of the coefficient values of parameters xc and m for low magnetization frequencies can be caused by the difficulties in the correct mapping of the relationship Ph+ex = f(Bp) with the power law function in the range of low flux density values, particularly at low frequencies.
The approach to directional loss modeling presented in this work can be useful in modeling the total core loss in such places as at the L- or T-joints of transformer core regions, where the magnetic flux must pass from the rolling to the transverse direction. In such places, the flux density can exceed 1.8 T. The advantage of this model is the ability to model the anisotropy of PS loss even at high flux densities. Calculation errors in the order of a few percent should be considered small. This advantage is particularly important, because the operating flux density of magnetic cores is constantly being increased. Additionally, the proposed model can be used together with a three-component PS model to characterize the loss anisotropy at different frequencies.
The advantages of the adapted model result from taking into account the phenomenon of interdependency between hysteresis and excess losses, since both loss terms strongly depend on the magnetic anisotropy. A part of the hysteresis loss component may contain a component related to the domain movement (reorganization), which occurs even at very slowly varying magnetizations. However, further research is needed to quantitatively and qualitatively describe the aforementioned interdependency between the hysteresis and excess components.

Funding

This research received no external funding.

Data Availability Statement

The data presented in this study are available on request from the corresponding author. The data are not publicly available because they are still being analyzed for their usability in a potential new paper.

Acknowledgments

The author would like to thank Marek Lis and Krzysztof Chwastek from Faculty of Electrical Engineering at the Czestochowa University of Technology, for their financial support and useful advice and suggestions, respectively.

Conflicts of Interest

The author declares no conflicts of interest.

References

  1. Grand View Research. Available online: www.grandviewresearch.com/industry-analysis/electrical-steel-market (accessed on 15 March 2023).
  2. Goss, N.P. Electrical Sheet and Method and Apparatus for Its Manufacture and Test. U.S. Patent US1965559, 3 July 1934. [Google Scholar]
  3. Fiorillo, F. Measurements of magnetic materials. Metrologia 2010, 47, 114–142. [Google Scholar] [CrossRef]
  4. Pluta, W.A. Some properties of factors of specific total loss components in electrical steel. IEEE Trans. Magn. 2010, 46, 323–325. [Google Scholar] [CrossRef]
  5. Pfuetzner, H. Rotational magnetization and rotational losses of grain oriented silicon steel sheets-fundamental aspects and theory. IEEE Trans. Magn. 1994, 30, 2802–2807. [Google Scholar] [CrossRef]
  6. Sievert, J.; Ahlers, H.; Birkfeld, H.; Cornut, B.; Fiorillo, F.; Hempel, K.A.; Kochmann, T.; Kedous-Lebouc, A.; Meydan, T.; Moses, A.J.; et al. European intercomparison of measurements of rotational power loss in electrical sheet steel. J. Magn. Magn. Mater. 1996, 160, 115–118. [Google Scholar] [CrossRef]
  7. Stranges, N.; Findlay, R.D. Measurement of rotational losses in electrical steel. IEEE Trans. Magn. 2000, 36, 3457–3459. [Google Scholar] [CrossRef]
  8. Rodriguez-Sotelo, D.; Rodriguez-Licea, M.A.; Araujo-Vargas, I.; Prado-Olivarez, J.; Barranco-Gutiérrez, A.-I.; Perez-Pinal, F.J. Power Losses Models for Magnetic Cores: A Review. Micromachines 2022, 13, 418. [Google Scholar] [CrossRef] [PubMed]
  9. Stumberger, B.; Gorican, V.; Stumberger, G.; Hamler, A.; Trlep, M.; Jesenik, M. Accuracy of iron loss calculation in electrical machines by using different iron loss models. J. Magn. Magn. Mater. 2003, 254–255, 269–271. [Google Scholar] [CrossRef]
  10. Tumanski, S. Investigations of the anisotropic behaviour of SiFe steel. J. Magn. Magn. Mater. 2003, 254–255, 50–53. [Google Scholar] [CrossRef]
  11. Moses, A.J.; Anderon, P.I.; Phophongviwat, T. Localized Surface Vibration and Acoustic Noise Emitted From Laboratory-Scale Transformer Cores Assembled From Grain-Oriented Electrical Steel. IEEE Trans. Magn. 2016, 52, 7100615. [Google Scholar] [CrossRef]
  12. Chwastek, K.; Szczygłowski, J. The effect of anisotropy in the modified Jiles-Atherton model of static hysteresis. Arch. Electr. Eng. 2011, 60, 49–57. [Google Scholar] [CrossRef]
  13. Hernandez-Robles, I.A.; Francisco, L.; Cañedo, J.; Olivares-Galvan, J.C. Modeling transformer core joints using Gaussian models for the magnetic flux density and permeability. IET Electr. Power Appl. 2010, 4, 761–771. [Google Scholar] [CrossRef]
  14. Wang, H.; Li, C.S.; Zhu, T. Hard magnetization direction and its relation with magnetic permeability of highly grain-oriented electrical steel. Int. J. Miner. Metall. Mater. 2014, 21, 1077–1082. [Google Scholar] [CrossRef]
  15. Cornut, B.; Kedous-Lebouc, A.; Waeckerlé, T. From metallurgy to modeling of electrical steels: A multiple approach to their behaviour and use based on physics and experimental investigations. J. Magn. Magn. Mater. 1996, 160, 102–108. [Google Scholar] [CrossRef]
  16. Sande, H.V.; Boonen, T.; Podoleanu, F.; Henrotte, F.; Hameyer, K. Simulation of a Three-Phase Transformer Using an Improved Anisotropy Model. IEEE Trans. Magn. 2004, 40, 850–855. [Google Scholar]
  17. Néel, L. Les lois de l’aimantation et de la subdivision en domaines elementaires d’un monocristal de fer. J. Phys. Radium 1944, 5, 241–251. [Google Scholar] [CrossRef]
  18. Fiorillo, F.; Dupré, L.; Appino, C.; Rietto, A.M. Comprehensive model of magnetization curve, hysteresis loops, and losses in any direction in grain-oriented Fe–Si. IEEE Trans. Magn. 2002, 38, 1467–1476. [Google Scholar] [CrossRef]
  19. Appino, C.; Ferrara, E.; Ragusa, C.; de la Barrière, O.; Fiorillo, F. Energy loss long different directions in GO steel sheets. In Proceedings of the 15th International Workshop on 1&2 Dimensional Magnetic Measurement and Testing, Grenoble, France, 25 September 2018; pp. 28–29. [Google Scholar]
  20. Tolentino, G.; Leite, J.; Rossi, M.; Ninet, O.; Parent, G.; Blaszkowski, J. Modelling of Magnetic Anisotropy in Electrical Steel Sheet by Means of Cumulative Distribution Functions of Gaussians. IEEE Trans. Magn. 2022, 58, 7300605. [Google Scholar] [CrossRef]
  21. Bunge, H.J. Texture and magnetic properties. Textures Microstruct. 1989, 11, 75–95. [Google Scholar] [CrossRef]
  22. Najgebauer, M. Scaling-based prediction of magnetic anisotropy in grain-oriented steels. Arch. Electr. Eng. 2017, 66, 423–432. [Google Scholar] [CrossRef]
  23. Pluta, W.A. Calculating power loss in electrical steel taking into account magnetic anisotropy. Przeląd Elektrotechniczny 2018, 2, 100–103. [Google Scholar] [CrossRef]
  24. Pluta, W.A. Frequency behaviour of specific total loss model taking into account anisotropy of electrical steel. Przegląd Elektrotechniczny 2022, 12, 129–132. [Google Scholar]
  25. Pluta, W.A.; Moses, A.J. Prediction of angular variation of specific total loss of Goss oriented electrical steel. Phys. B Condens. Matter 2018, 544, 28–33. [Google Scholar] [CrossRef]
  26. Bertotti, G. Hysteresis in Magnetism; Academic Press: Cambridge, MA, USA, 1998. [Google Scholar]
  27. Bertotti, G. General properties of power losses in soft ferromagnetic materials. IEEE Trans. Magn. 1988, 24, 621–630. [Google Scholar] [CrossRef]
  28. Mekic, F.; Girgis, R.; Gajic, Z.; teNyenhuis, E. Power Transformer Characteristics and Their Effects on Protective Relays. In Proceedings of the 60th Annual Conference for Protective Relay Engineers, College Station, TX, USA, 27–29 March 2007. [Google Scholar] [CrossRef]
  29. Pluta, W.A. Influence of the Magnetic Anisotropy on Rotational Power Loss in Electrical Steel Sheets with Goss Texture. Ph.D. Thesis, Department Electrical Electronics Engineering, Technical University of Łódź, Łódź, Poland, 2001. (In Polish). [Google Scholar]
  30. Groyecki, J.; Kopiec, J.; Majchrzak, H.; Pawełek, W.; Zawada, A. Charakterystyki Stali (Steel Characteristics–in Polish), GI, Part 1; Wyd. Śląsk: Katowice, Poland, 1982. [Google Scholar]
  31. Bozorth, R.M. Ferromagnetism; IEEE Press: New York, NY, USA, 1993. [Google Scholar]
  32. Chikazumi, S. ; Physics of Ferromagnetism, 2nd ed.; Graham, C.D., Ed.; Oxford University Press: New York, NY, USA, 1997. [Google Scholar]
  33. Chwastek, K.; Jabłoński, P.; Kusiak, D.; Szczegielniak, T.; Kotlan, V.; Karban, P. The effective field in the T(x) model. Energies 2023, 16, 2237. [Google Scholar] [CrossRef]
  34. Poynting, J.H. On the transfer of energy in the electromagnetic field. Philos. Trans. R. Soc. Lond. 1884, 175, 343–361. [Google Scholar]
  35. Griffits, D.J. Podstawy Elektrodynamiki (Fundamental of Electrodynamics); Wydawnictwo Naukowe PWN: Warszawa, Poland, 2011. [Google Scholar]
  36. Pfuetzner, H. Fundamental aspects of rotational magnetization. In Proceedings of the First International Workshop on Magnetic Properties of Electrical Sheet Steel under Two-Dimensional Excitation, Braunschweig, Germany, 16–17 September 1991. [Google Scholar]
  37. Zakrzewski, K. Pole elektromagnetyczne w ciałach ferromagnetycznych przewodzących (Electromagnetic fields in conductive ferromagnetic bodies–in Polish). Zesz. Nauk. Politech. Łódzkiej Elektr. 1972, 160, 38. [Google Scholar]
  38. Steinmetz, C.P. On the law of hysteresis. AIEE Trans. 1892, 9, 3–51, Reprinted in Proc. IEEE 1984, 72, 197–221. [Google Scholar] [CrossRef]
  39. Pluta, W.A. Core loss models in electrical steel sheets with different orientation. Przegląd Elektrotechniczny 2011, 9b, 37–42. [Google Scholar]
  40. Brailsford, F. Physical Principles of Magnetism; D. Van Nostrand Company LTD: London, UK, 1966. [Google Scholar]
  41. Sakaki, Y. An approach estimating the number of domain walls and eddy current losses in grain-oriented 3% Si-Fe tape wound cores. IEEE Trans Magn. 1980, 16, 569–572. [Google Scholar] [CrossRef]
  42. Overshoot, K.J. The use of domain observations in understanding and improving the magnetic properties of transformer steels. IEEE Trans Magn. 1976, 12, 840–845. [Google Scholar] [CrossRef]
  43. Ferro, A.; Montalenti, G.; Soardo, G.P. On linearity anomaly of power losses vs. frequency in various soft magnetic materials. IEEE Trans Magn. 1975, 11, 1341–1343. [Google Scholar] [CrossRef]
  44. Fiorillo, F.; Novikov, A. An improved approach to power losses in magnetic laminations under nonsinusoidal induction waveform. IEEE Trans Magn. 1990, 26, 2904–2910. [Google Scholar] [CrossRef]
  45. Barbisio, E.; Fiorillo, F.; Ragusa, C. Predicting Loss in Magnetic Steels Under Arbitrary Induction Waveform and With Minor Hysteresis Loops. IEEE Trans Magn. 2004, 40, 1810–1819. [Google Scholar] [CrossRef]
  46. Pluta, W.A. Angular properties of specific total loss components under axial magnetization in grain-oriented electrical steel. IEEE Trans Magn. 2016, 52, 6300912. [Google Scholar] [CrossRef]
  47. Dupré, L.; Fiorillo, F.; Melkebeek, J.; Rietto, A.M.; Appino, C. Loss versus cutting angle in grain-oriented FeSi laminations. J. Magn. Magn. Mater. 2000, 215–216, 112–114. [Google Scholar] [CrossRef]
  48. DAQ M Series. M Series User Manual; National Instruments: Austin, TX, USA, 2008.
  49. IEC 404-3:1999; Magnetic Materials. Methods of Measurements of Soft Magnetic Properties of Electrical Steel and Type with the Use of Single Sheet Tester. IEC: Geneva, Switzerland, 1999.
  50. Pluta, W.A. Measurements of magnetic properties of electrical steel sheets for the aim of loss separation. J. Electr. Eng. 2010, 61, 58–61. [Google Scholar]
  51. Soinski, M. Anisotropy of electrical resistivities in electrical sheets. J. Magn. Magn. Mater. 1985, 53, 54–62. [Google Scholar] [CrossRef]
  52. Nix, W.D.; Johnson, W.R. Technical Properties of Soft Magnetic Materials, Magnetism and Magnetic Materials: 1965 Digest; Academic Press: New York, NY, USA; London, UK, 1965. [Google Scholar]
  53. Brailsford, F.; Fogg, R. Anomalous iron losses in cold-reduced grain-oriented transformer steel. Proc. Inst. Electr. Eng. 1964, 111, 1463–1467. [Google Scholar] [CrossRef]
  54. Lenhart, R.E. Grain Size Effects in Silicon Steels upon the ac Core Loss Components. J. Appl. Phys. 1964, 35, 861–862. [Google Scholar] [CrossRef]
  55. Pfuetzner, H.; Schonhuber, P.; Erbil, B.; Harasko, G.; Klinger, T. Problems of loss separation for crystalline and consolidated amorphous soft magnetic materials. IEEE Trans Magn. 1991, 27, 3426–3432. [Google Scholar] [CrossRef]
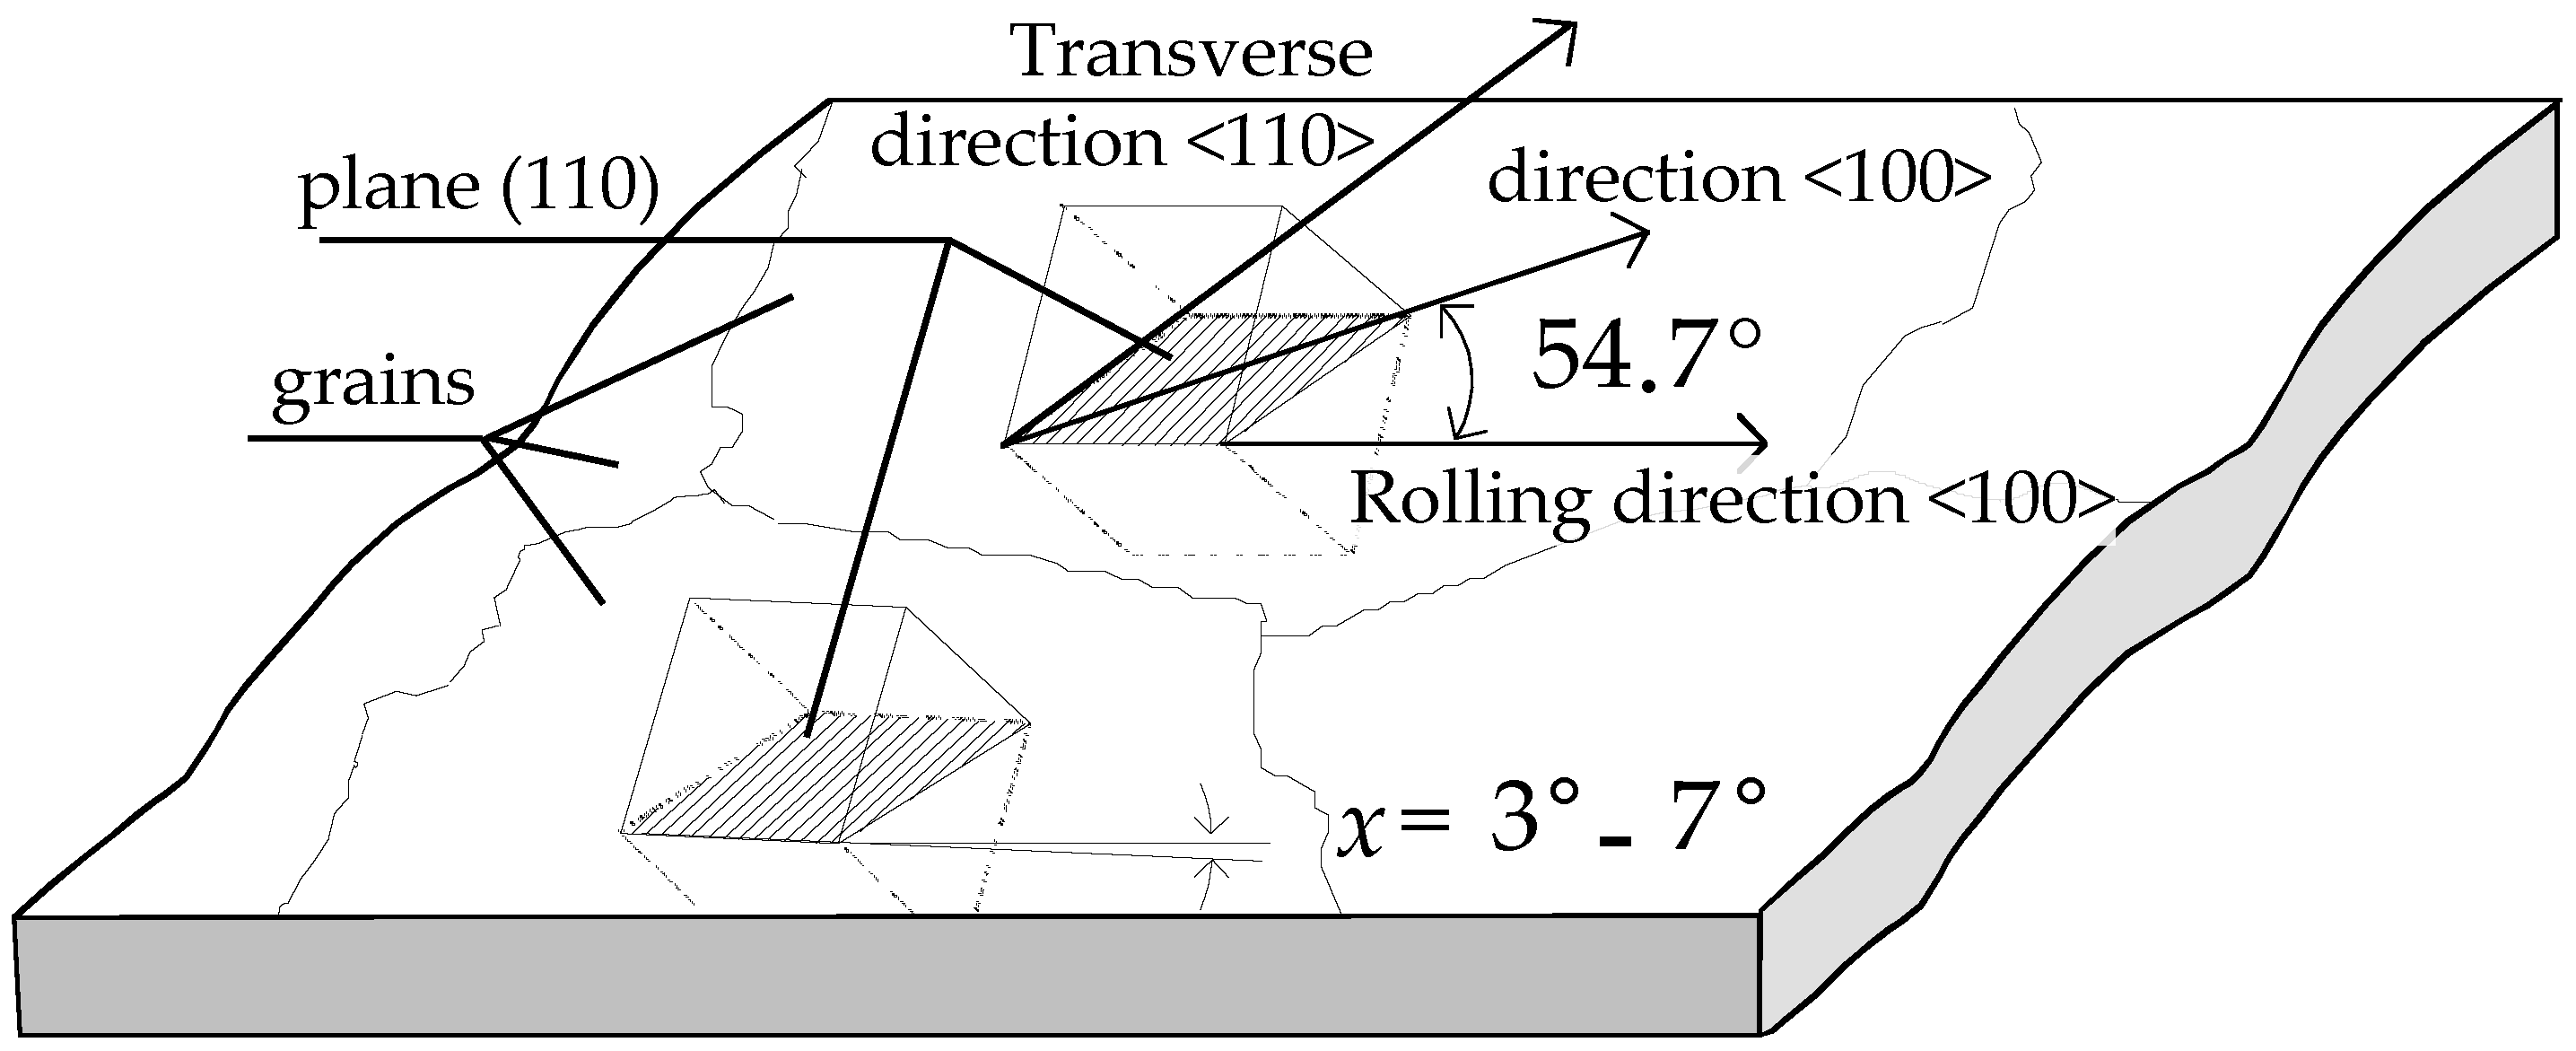
Figure 1. Distribution of crystallites in grains of electrical steel with edges <100> deviated from the direction of rolling.
Energies 17 01112 g001
Figure 2. Example of a form of presentation of the anisotropic properties of PS loss for GOES of grade M120-27S at the frequency f = 50 Hz at induction, Bp = 0.2, 0.4, 0.6, 0.8, 1.0, 1.2 and 1.4 and 1.5 T.
Energies 17 01112 g002
Figure 3. Locations of vectors K, E and H on the surface of an electrical steel sheet.
Energies 17 01112 g003
Figure 4. Calculation error ΔPS obtained using a two-component model for GOES of grade M140-30S versus the frequency f and peak flux density Bp, adapted from [39].
Energies 17 01112 g004
Figure 5. The block diagram of the measuring system.
Energies 17 01112 g005
Figure 6. Energy loss per unit mass versus frequency obtained for sample of GOES of grade M120-27S at the flux densities Bp: (a) 1.0 T and (b) 1.5 T. Dots—experimental data; solid lines—fitting to experimental data. Dashed lines denote the PS loss components of Equation (5). The black line denotes the Pce component, which is invariant with respect to the cutting angle. The subscript denotes the angle at which the individual samples were cut.
Energies 17 01112 g006
Figure 7. Dependencies of specific total loss components on flux density for different magnetization angles of GOES of grade M150-27S magnetized at 50 Hz: (a) hysteresis, (b) excess and classical eddy current.
Energies 17 01112 g007
Figure 8. Coefficients a and b of function P = aBpb versus the direction of x for GOES of grade M165-35S at 50 Hz; (a) coefficient a = f(x) and (b) coefficient b = f(x). Square marks—hysteresis; circle marks—excess loss components; solid lines—fitting to data.
Energies 17 01112 g008
Figure 9. Dependencies of sums of Ph and Pex components versus flux density Bp for three magnetization angles (0°, 54° and 90°) for ES of grade M150-35S at 50 Hz.
Energies 17 01112 g009
Figure 10. Power function coefficients of Equation (7) versus magnetization angle x used for extrapolating curves presented in Figure 9: (a) a(x), (b) b(x). Points—average data for all tested ES grades; solid lines—fitting to data.
Energies 17 01112 g010
Figure 11. Parameter xc of Equation (8) as a function of anisotropy ΔPS90-0 and frequency. Points—data obtained from fitting of Equation (8); solid lines—fitting straight line to data.
Energies 17 01112 g011
Figure 12. Parameter m of Equation (8) as a function of anisotropy ΔPS90-0 and frequency. Points—data obtained from fitting of Equation (8); solid lines—fitting straight line to data.
Energies 17 01112 g012
Figure 13. Parameter a(0) of Equation (8) as a function of anisotropy ΔPS90-0 and frequency. Points—data obtained from fitting of Equation (8); solid lines—fitting straight line to data.
Energies 17 01112 g013
Figure 14. Parameter a(90) of Equation (8) as a function of anisotropy ΔPS90-0 and frequency. Points—data obtained from fitting of Equation (8); solid lines—fitting straight line to data.
Energies 17 01112 g014
Figure 15. Specific total loss for GOES of grade M150-27S at 50 Hz at magnetization angle: (a) x = 0° (RD), (b) x = 27°, (c) x = 54° and (d) x = 90°. The measured points are marked as circles and solid lines, indicating the calculation results; the red color indicates the calculations performed for the average sigmoid function; and the blue line is calculated for the sample. The dashed lines show the calculation error for the average sigmoid function—red—and blue for M150-27S electrical steel.
Energies 17 01112 g015
Disclaimer/Publisher’s Note: The statements, opinions and data contained in all publications are solely those of the individual author(s) and contributor(s) and not of MDPI and/or the editor(s). MDPI and/or the editor(s) disclaim responsibility for any injury to people or property resulting from any ideas, methods, instructions or products referred to in the content.