Article

A Complete Assessment of the Emission Performance of an SI Engine Fueled with Methanol, Methane and Hydrogen

Institute of Science and Technology for Sustainable Energy and Mobility (STEMS)—CNR, Via G. Marconi 4, 80125 Naples, Italy
*
Author to whom correspondence should be addressed.
Energies 2024, 17(5), 1026; https://doi.org/10.3390/en17051026
Submission received: 19 January 2024 / Revised: 16 February 2024 / Accepted: 20 February 2024 / Published: 22 February 2024

Abstract

:
This study explores the potentiality of low/zero carbon fuels such as methanol, methane and hydrogen for motor applications to pursue the goal of energy security and environmental sustainability. An experimental investigation was performed on a spark ignition engine equipped with both a port fuel and a direct injection system. Liquid fuels were injected into the intake manifold to benefit from a homogeneous charge formation. Gaseous fuels were injected in direct mode to enhance the efficiency and prevent abnormal combustion. Tests were realized at a fixed indicated mean effective pressure and at three different engine speeds. The experimental results highlighted the reduction of CO and CO2 emissions for the alternative fuels to an extent depending on their properties. Methanol exhibited high THC and low NOx emissions compared to gasoline. Methane and, even more so, hydrogen, allowed for a reduction in THC emissions. With regard to the impact of gaseous fuels on the NOx emissions, this was strongly related to the operating conditions. A surprising result concerns the particle emissions that were affected not only by the fuel characteristics and the engine test point but also by the lubricating oil. The oil contribution was particularly evident for hydrogen fuel, which showed high particle emissions, although they did not contain carbon atoms.

1. Introduction

European policy strives to achieve the challenging goal of zero carbon dioxide (CO2) emissions by 2050 [1]. In this regard, the decarbonization of the transport sector plays a pivotal role. For this purpose, in the last few years, academic and industrial communities have devoted research efforts to the electrification of propulsion systems. Nevertheless, it is well recognized that electrically driven vehicles do not represent an immediate solution to climate change due to some barriers that still hinder their widespread use, such as the high purchase price of electric vehicles (EVs) limiting their usage to the wealthier social classes, the lack of charging infrastructure [2] and the potential environmental impacts of lithium mining [3]. Therefore, in parallel with the technological improvement of EVs, it is essential to continue to focus on internal combustion engines (ICEs) [4]. An effective way to guarantee a future for ICEs in the transition phase towards zero greenhouse gas emissions consists in the use of low/zero carbon fuels [5]—both liquid, such as methanol, and gaseous, such as methane and hydrogen. As known by the literature, the study of the effective impact of alternative fuels on environmental sustainability should not be limited to considering just the emissions at the vehicle exhaust but should also take into account all the factors spanning from fuel production to its utilization [6].
Methanol is a valid alternative for powering spark ignition (SI) engines thanks to its high octane quality and high heat of vaporization (HOV) resulting in improved engine thermal efficiency [7]. It can be produced from a lot of sources such as coal, natural gas, wood and waste [8]. A green method for producing methanol has also been developed. It consists of the use of captured carbon dioxide (CO2) and hydrogen obtained from renewable sources such as solar and wind power [9]. Methanol can be used both pure and in blends at different mixture proportions. Several studies in the literature have investigated the emission characteristics of binary blends of methanol with gasoline as well as ternary blends of methanol, ethanol and gasoline [10,11,12]. They have shown reduced exhaust emissions of total hydrocarbons (THCs) and nitrogen oxides (NOx) [13] and a blend-dependent behavior of the particulate matter (PM) [14]. Regarding the use of pure methanol in SI engines, the majority of the studies available in the literature were carried out on direct injection (DI) engines [15]. To the best of the authors’ knowledge, there is a lack of investigations of port fuel injection (PFI) engines fueled by methanol, as also observed by Wei et al. [16] for heavy-duty applications. Therefore, a deeper comprehension of the benefits as well as the criticalities of the use of methanol for PFI systems is crucial. Moreover, a better insight into the effect of neat methanol on PM emissions is essential. Larsson et al. [17] observed that oxygenated fuels tend to decrease particle emissions thanks to their chemical structure, which inhibits the formation of soot precursors and increases post-oxidation. Nevertheless, the formation of particles also depends on the physical properties of the fuel such as the volatility. Low volatility, in fact, can cause pool fires where particles are formed. On the other hand, Svensson et al. [18] observed that methanol has a non-sooting behavior and, hence, particles measured at the exhaust of a pure methanol-fueled engine could be due to sources other than the fuel such as oil leakage [17].
Methane and hydrogen are also excellent candidates to replace gasoline in SI engines thanks to their clean-burn characteristics [19,20]. The existing literature on the effect of gaseous fuels on engine performance and emissions is mainly focused on the PFI strategy [21,22]. This technique allows engines to benefit from a homogeneous charge formation, but, on the other hand, it can induce abnormal combustion and power drop [23]. These issues could be overcome through the DI strategy [24]. This method can lead to high NOx emissions, thus requiring the lean mode operation. As observed by Thawko et al. [25], the DI of gaseous fuel is a promising method to improve engine performance and avoid PFI drawbacks. However, some knowledge gaps exist on the application of this technology to gaseous fuels, and one of them regards particle emissions. Methane contains carbon in its molecular structure, so it can emit fuel-derived particles. However, it was found that in some operating conditions, the contribution of the lubricant oil to particle formation is predominant with respect to that of the fuel [26]. The impact of lubricant oil on particle emissions is even more evident for hydrogen, which is a carbon-free fuel and, hence, should not emit fuel-derived particles.
This study tries to contribute to the knowledge of the effect of carbon-neutral fuels for SI engines, and its novelty consists in a comparative analysis of methanol, methane and hydrogen. The investigation was carried out on a low-displacement, single-cylinder SI engine. Different injection strategies were adopted depending on the fuel properties. Liquid fuels were, in fact, injected in PFI mode, while gaseous ones were injected directly into the chamber. The engine was operated in stationary conditions at three test points included in the urban and extra-urban cycles. For a comparative analysis among the different fuels, experiments were realized at a fixed indicated mean effective pressure (imep). Indicative data were acquired to analyze the combustion behavior. Carbon monoxide (CO), CO2, THC and NOx were measured at raw exhaust. Particles were characterized in terms of number and size at diluted exhaust.

2. Materials and Methods

2.1. Experimental Apparatus

Figure 1 illustrates the schematic diagram of the experimental setup. Tests were carried out on a four-stroke, single-cylinder SI engine equipped with a naturally aspirated four-valve head. The engine crankshaft was connected to an electrical dynamometer. A list of engine technical specifications is reported in Table 1.
The ignition system consisted of a spark plug mounted in the center of the cylinder head. The engine was equipped with two different injection systems. In its marked version, it was fitted with a DI system characterized by a side-mounted, six-hole injector located between the intake valves. The DI injection system was adapted to also operate with gaseous fuels through an air strata injector typically used for the simultaneous injection of air and gasoline. It was set in the cylinder head with an ad hoc designed adaptor [27]. Moreover, the PFI system was implemented through a three-hole injector for liquid fuels placed in the intake manifold.
For the liquid fuels, the fuel supply system consisted of a fuel tank, an electric, low-pressure pump and a fuel filter. On the other hand, the gaseous fuels were stored in a pressurized bottle at 200 bar, decompressed to 6 bar by a regulator and then supplied to the cylinder. A flame arrestor and a pneumatic-actuated valve were installed in the gaseous fuel supply line to avoid any risk of backfire.
Engine parameters, such as the spark and injection timing and throttle valve opening to adjust the airflow, were controlled by an AVL engine timing unit (ETU).
The operating excess air ratio (λ) was measured using a wideband oxygen sensor (LSU 4.9 Bosch) located in the exhaust manifold and monitored using a lambda meter (LA4, ETAS).
In-cylinder pressure was measured with a high-speed piezoelectric pressure sensor (GH12D) flush mounted on the cylinder head. The charge output from this transducer was converted to an amplified voltage and sent to the high-speed data acquisition system AVL Indimodul for combustion analysis. Engine crank angle detection was performed by an AVL 365C encoder with a multiplier at a resolution of 0.1 degrees.
Regulated exhaust emission species such as CO, CO2, THC and NOx were measured by an AVL DiGas 4000, whose details are shown in Table 2, with uncertainties of ±0.2%, ±0.15%, ±0.2% and ±1%, respectively [28].
Engine exhaust particle number and size distribution were measured through a TSI Engine Exhaust Particle Spectrometer (EEPS) 3090 whose main specifications are listed in Table 3. The instrument is based on the electrical mobility principle described in [29] and is capable of detecting particles in the range of 5.6–560 nm at 10 Hz frequency. The particle number distributions were calculated from the electrometer currents after adjusting for time delay, multiple charges and other factors by a proprietary inversion matrix [30].
Before measuring the particles, the exhaust gas sample was passed through a 150 °C heated probe to prevent water condensation and then it was diluted at a ratio of 1:9 by a single diluter (SD).
Table 2. DiGas specifications [31].
SpeciesPrinciple MeasurementMeasurement RangeResolution
CONon-dispersive infrared (NDIR)0–10% vol.0.01%vol.
CO2Non-dispersive infrared (NDIR)0–20% vol.0.1%vol.
THCNon-dispersive infrared (NDIR)0–20,000 ppm vol.1 ppm
NOxChemiluminescent detector (CLD)0–5000 ppm vol.1 ppm
Table 3. EEPS specifications [29].
PropertiesRange
Particle Size Range5.6–560 nm
Particle Size Resolution16 channels per decade (32 total)
Electrometer Channels22
Maximum Data Rate10 size distribution per second
Inlet Aerosol Temperature10–52 °C
Storage Temperature−20 to 50 °C

2.2. Procedure

In this study, three different alternative fuels, methanol, methane and hydrogen, were tested. They were used in pure form. Performance and pollutant emissions were analyzed and compared to those of conventional gasoline. Table 4 shows the main physical–chemical properties of the fuels.
Methanol, methane and hydrogen represent three high-octane-number (ON) fuels. As with gasoline, methanol can be stored in liquid form at a standard temperature and pressure. The chemical structure of the alcohol fuel, with its lower carbon content and higher amount of oxygen with respect to gasoline, contributes to determining its properties and combustion characteristics. Methanol has, in fact, a lower stoichiometric air–fuel ratio (AFRst) and a low heating value (LHV) which is almost half that of gasoline.
Gaseous fuels are characterized by a higher LHV than liquid ones, even if the thermal values per volume of methane and even more so of hydrogen are lower because of their low density. Methane shows poor lean-burn capability. On the other hand, the hydrogen–air mixture combusts in the range of 4–75% air by volume, ensuring that combustion is achieved even with a poor mixture.
Two different approaches were adopted for the experiments with liquid and gaseous fuels to take into account their different properties. To exploit the intrinsic nature of the fuels, the liquid ones were injected in PFI mode, thus allowing for a better homogeneous charge formation. On the other hand, DI technology was chosen for methane and hydrogen to improve the volumetric efficiency. To allow for comparison among the tested fuels, experiments were carried out at the same imep, that is, 6.0 bar. To obtain data sufficiently meaningful and worthwhile, three engine speeds were selected, 2000, 2500 and 3000 rpm, which are representative of the operating points of a typical commercial vehicle.
A synthesis of the investigated condition is shown in Table 5. The start of injection (SOI) and start of spark (SOS) were modified to guarantee a stable combustion operation. Tests with liquid fuels were carried out at throttled conditions, the throttle position (TP) was at 4% and the duration of injection (DOI) was properly set to run under stoichiometric mode at all engine speeds. This allowed us to maximize the performance while maintaining low emissions.
The λ values at which the engine was operated for the tested fuels at all investigated conditions are shown in Figure 2. Experiments with gaseous fuels were realized at leaner conditions to reduce the NOx emissions.
When the engine was fueled with methane, λ was kept at 1.15 at all tested engine speeds by adjusting the TP. This λ was the maximum value achievable to guarantee the desired imep with a stable operation because of the narrow flammability limits of methane.
Hydrogen was tested under wide open throttle (WOT) conditions to benefit from its wide flammability range. In order to improve the efficiency and at the same time reduce the NOx emissions, the engine was run with λ values equal to 1.5, 1.4 and 1.6 at 2000, 2500 and 3000 rm, respectively.
The engine ran at steady and stable conditions for at least 5 min before starting the measurements at each engine speed. Each acquisition was repeated three times. The average values of the three repetitions are shown in the experimental results section.

3. Results

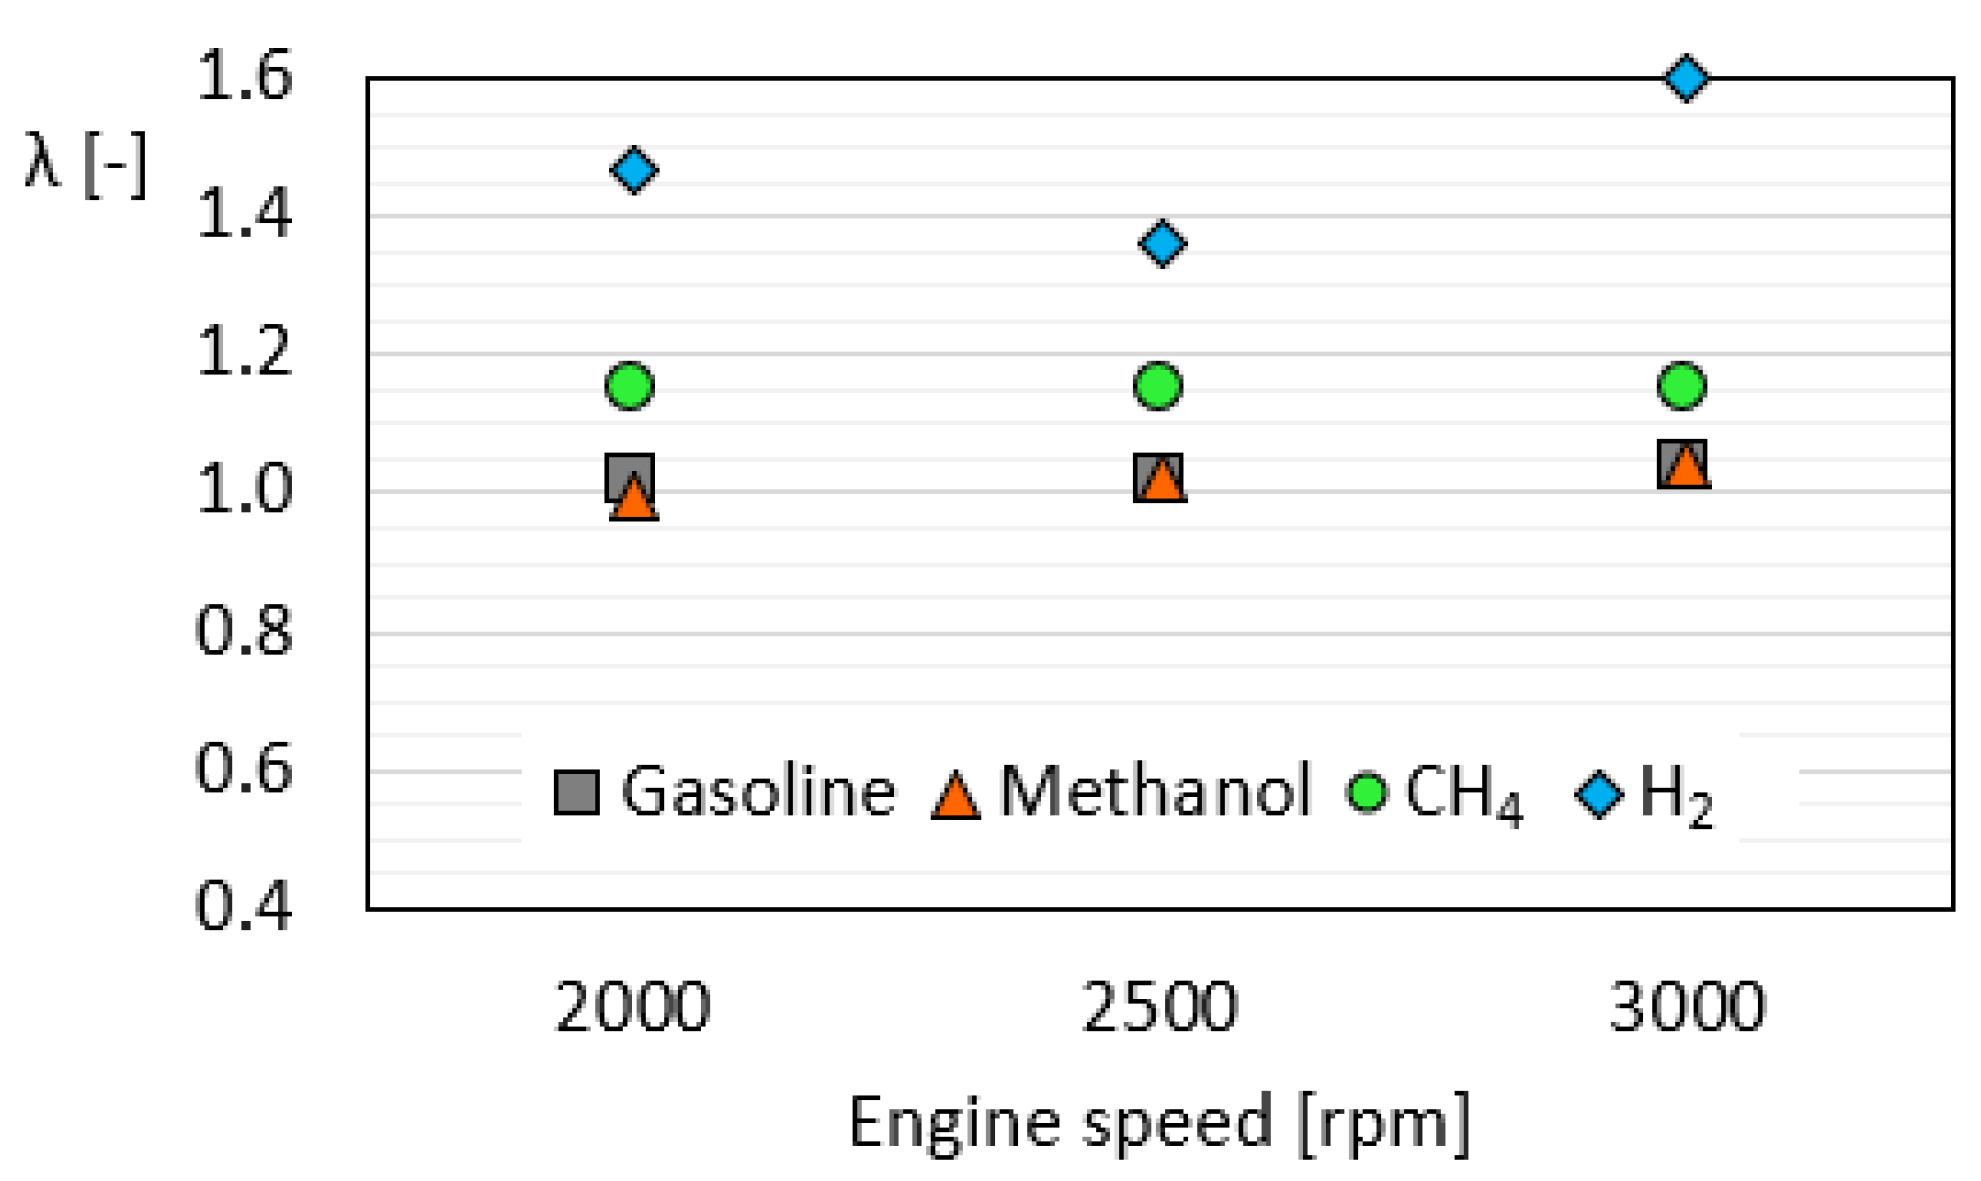
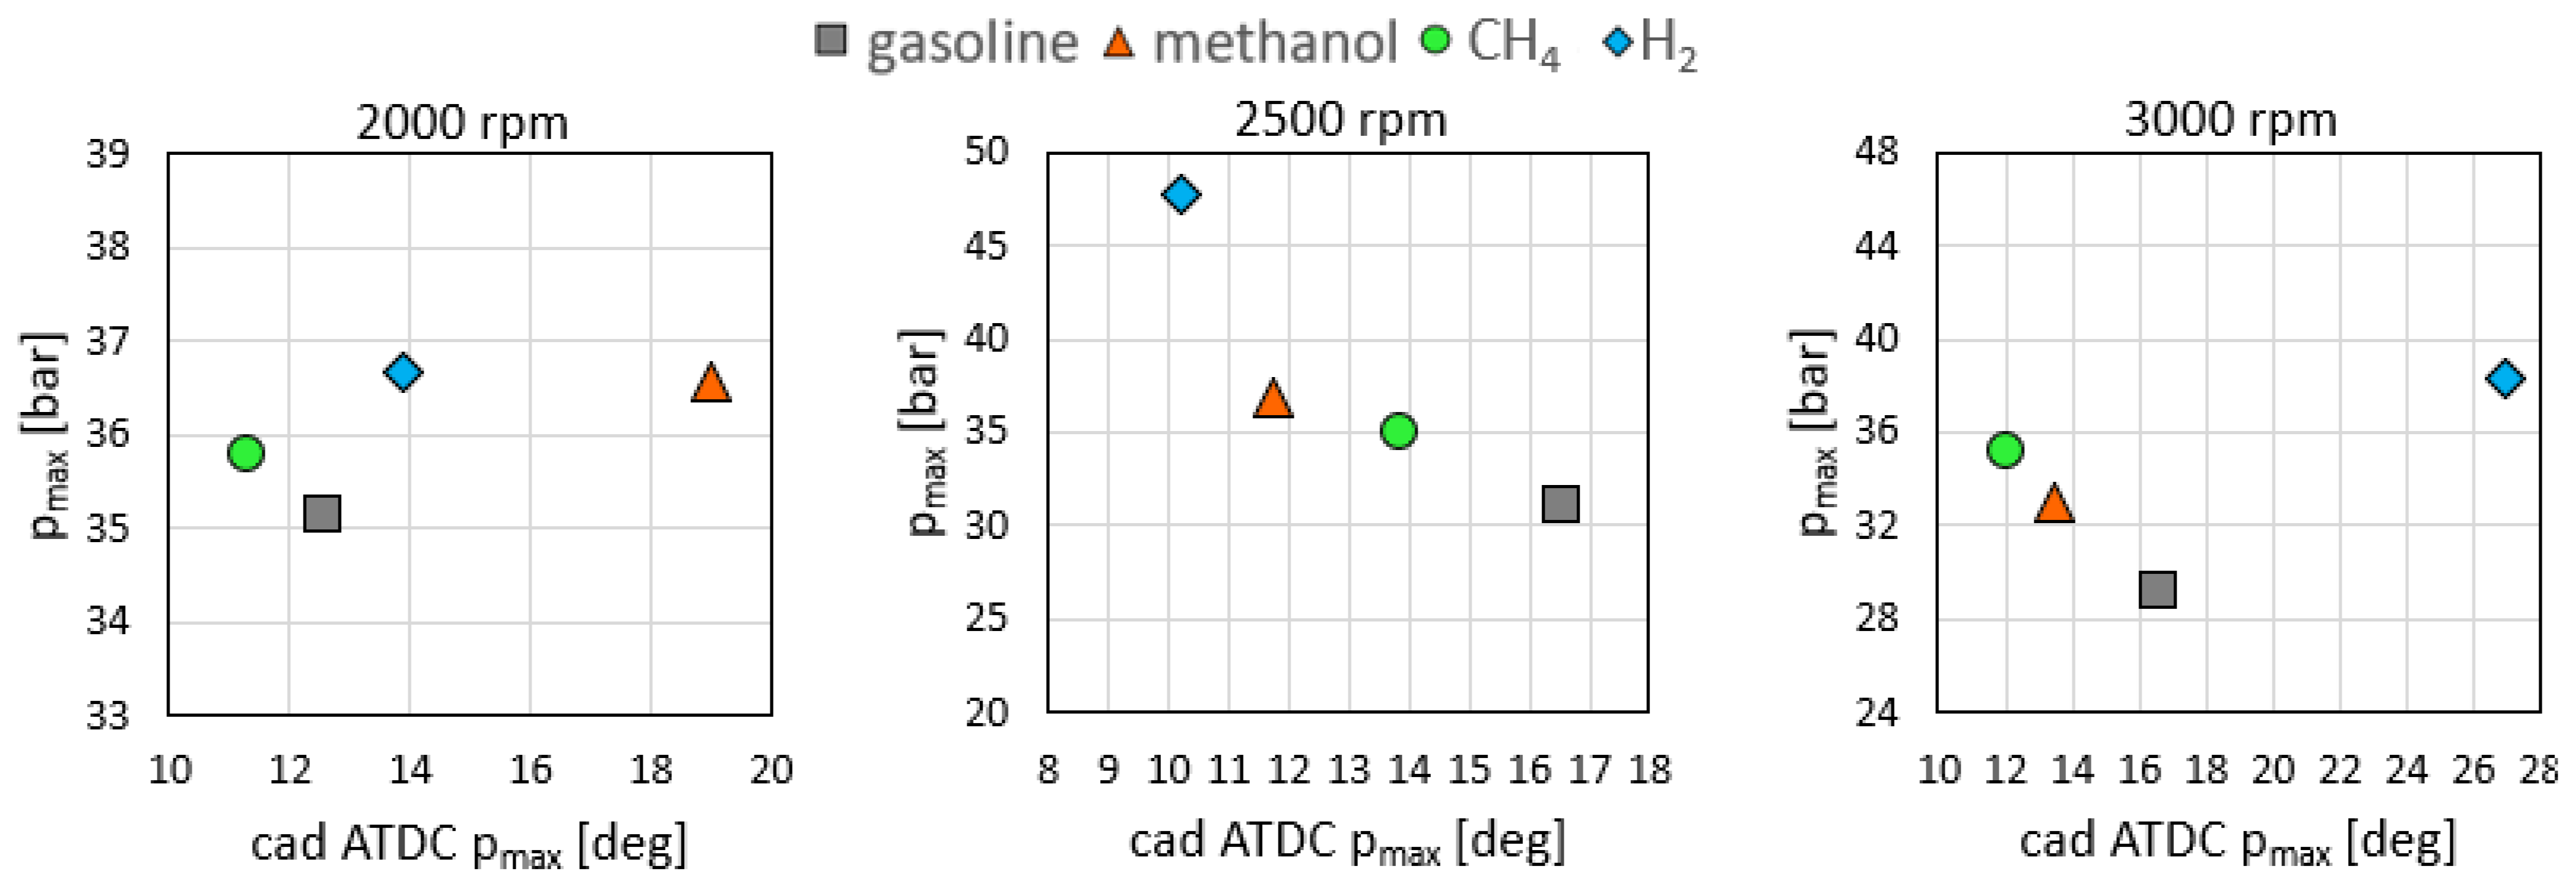
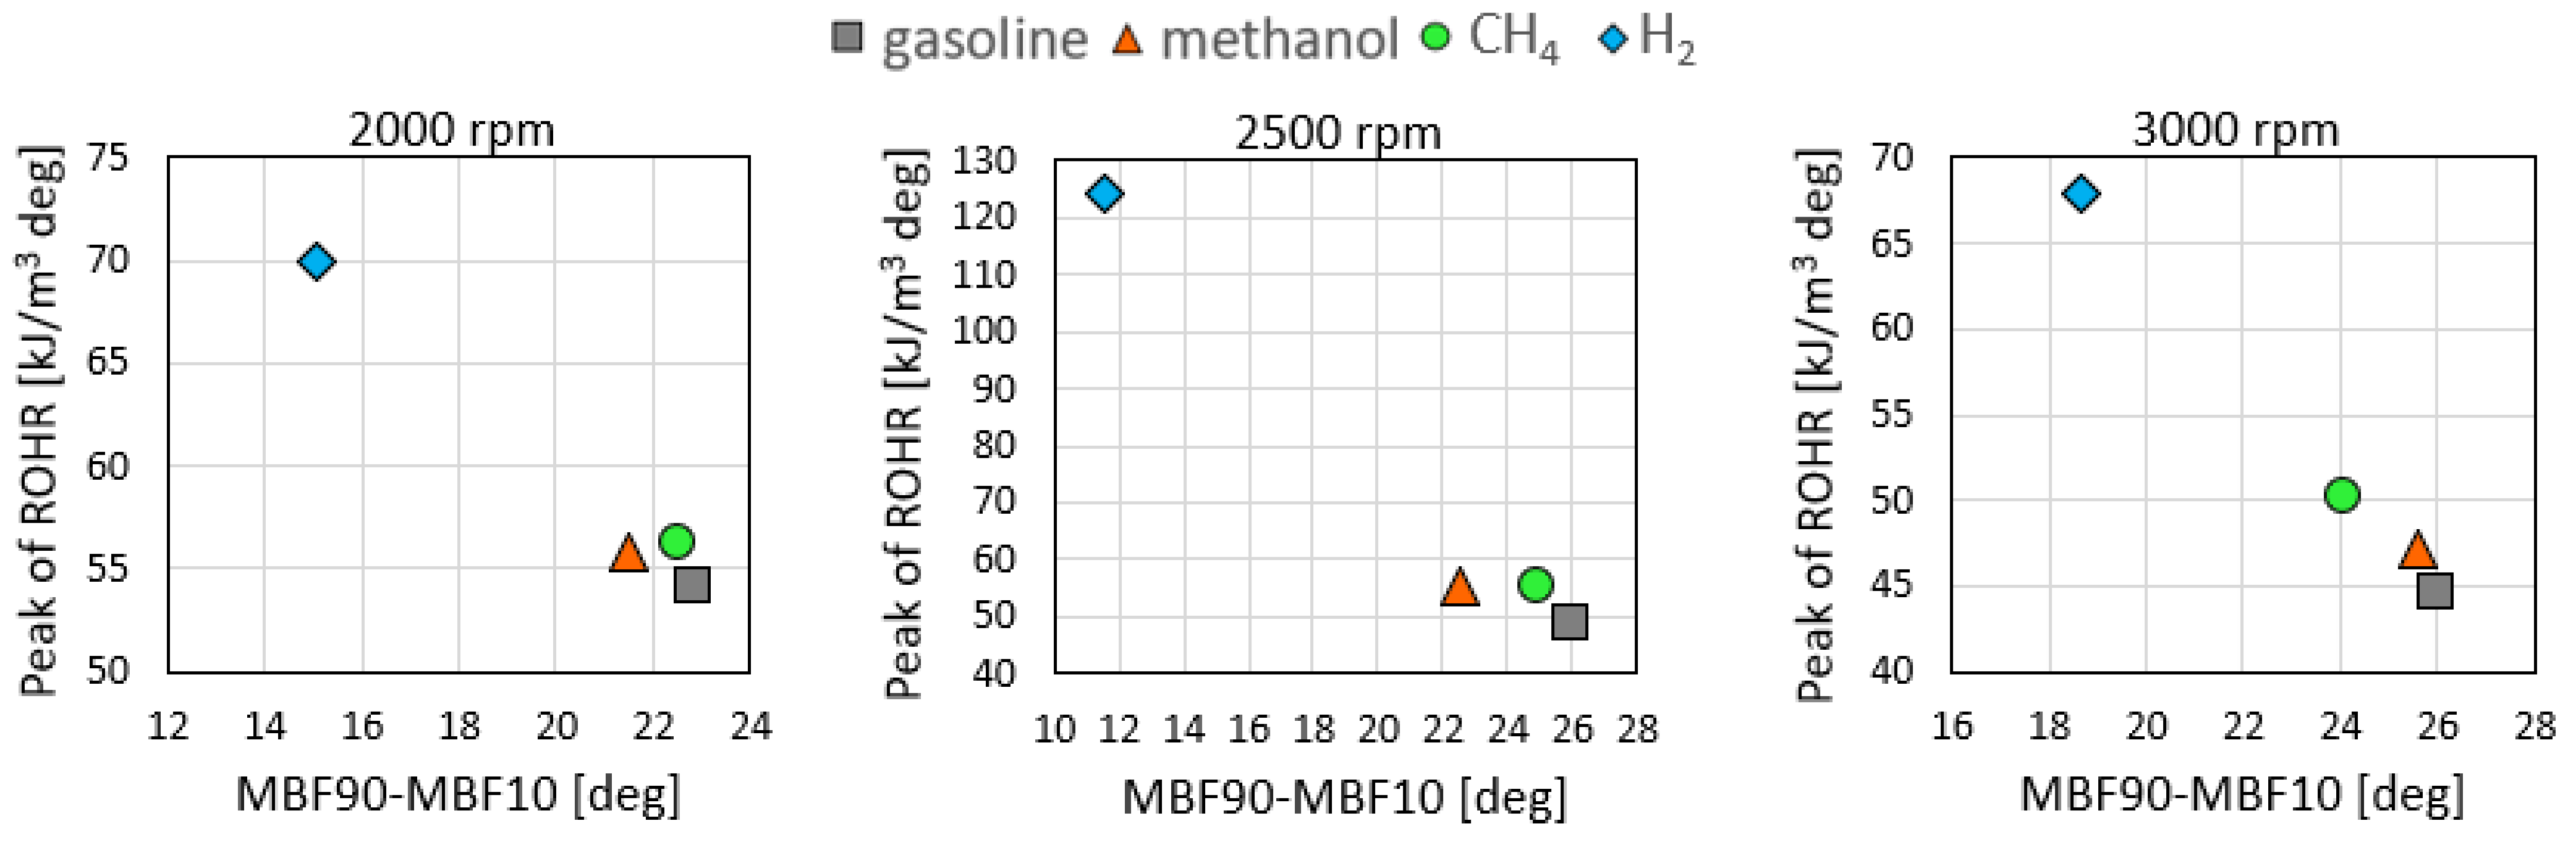
3.1. Combustion Analysis

In order to achieve a better comprehension of the impact of the tested alternative fuels on the engine performance and emissions, the combustion behavior was investigated through the analysis of the indicated parameters. The in-cylinder pressure was detected and, for an effective comparative analysis among the fuels, the maximum pressure and crank angle degree (cad) at which it occurred was calculated as shown in Figure 3.
As mentioned above, to take advantage of the different fuel properties, different injection strategies—PFI and DI—were applied for liquid and gaseous fuels, respectively. Therefore, the differences in the combustion evolution depended on both the injection mode and the fuel type.
At 2500 and 3000 rpm, as concerns the liquid fuels, methanol had a higher and more advanced peak of pressure compared to gasoline, up to 5 cad at 2500 rpm. Since a similar SOS was set for both fuels at these engine speeds, the earlier combustion of the alcohol fuel could be ascribed to the faster combustion rate owing to the oxygen content of methanol, and the higher maximum pressure was due to the higher ON. At 2000 rpm, instead, the SOS was 3 cads retarded for methanol, thus limiting the effect of the fuel properties and leading to a delayed but always higher maximum pressure with respect to gasoline.
Regarding the gaseous fuels, a definite trend was not distinguishable since the combustion phasing was affected by different factors such as the injection mode, the control parameters and the fuel properties. The maximum pressure phasing of hydrogen with respect to methane changed because of the combination of the SOS applied for the different fuels and the higher flame speed of the hydrogen. In general, a higher pressure peak could be observed for hydrogen at all engine speeds. To justify this trend, it is important to take into account, beyond its properties, that WOT was implemented for hydrogen to benefit from its wide flammability limits entailing that a larger amount of air entered the cylinder with respect to methane tested in throttle operation.
Interesting information about combustion evolution can be drawn from the rate of heat release (ROHR), from which the peak and combustion duration could be determined. The latter was calculated as the difference between the cads for 90 and 10% of the mass fraction burned (MBF90 and MBF10, respectively), representative of the end and start of combustion. These parameters are reported in Figure 4. Regarding the liquid fuels, methanol showed a lower combustion duration than gasoline thanks to its higher flame velocity and higher peak of heat release thanks to its larger oxygen content that guaranteed more complete combustion.
As concerns the gaseous fuels, in general, methane—compared to gasoline—showed faster combustion characterized by greater heat released. This trend could be correlated to the DI of the fuel that, improving the turbulence and, hence, the fuel–air mixing, resulted in increased flame propagation. This phenomenon for hydrogen was amplified by its intrinsic higher flame speed.

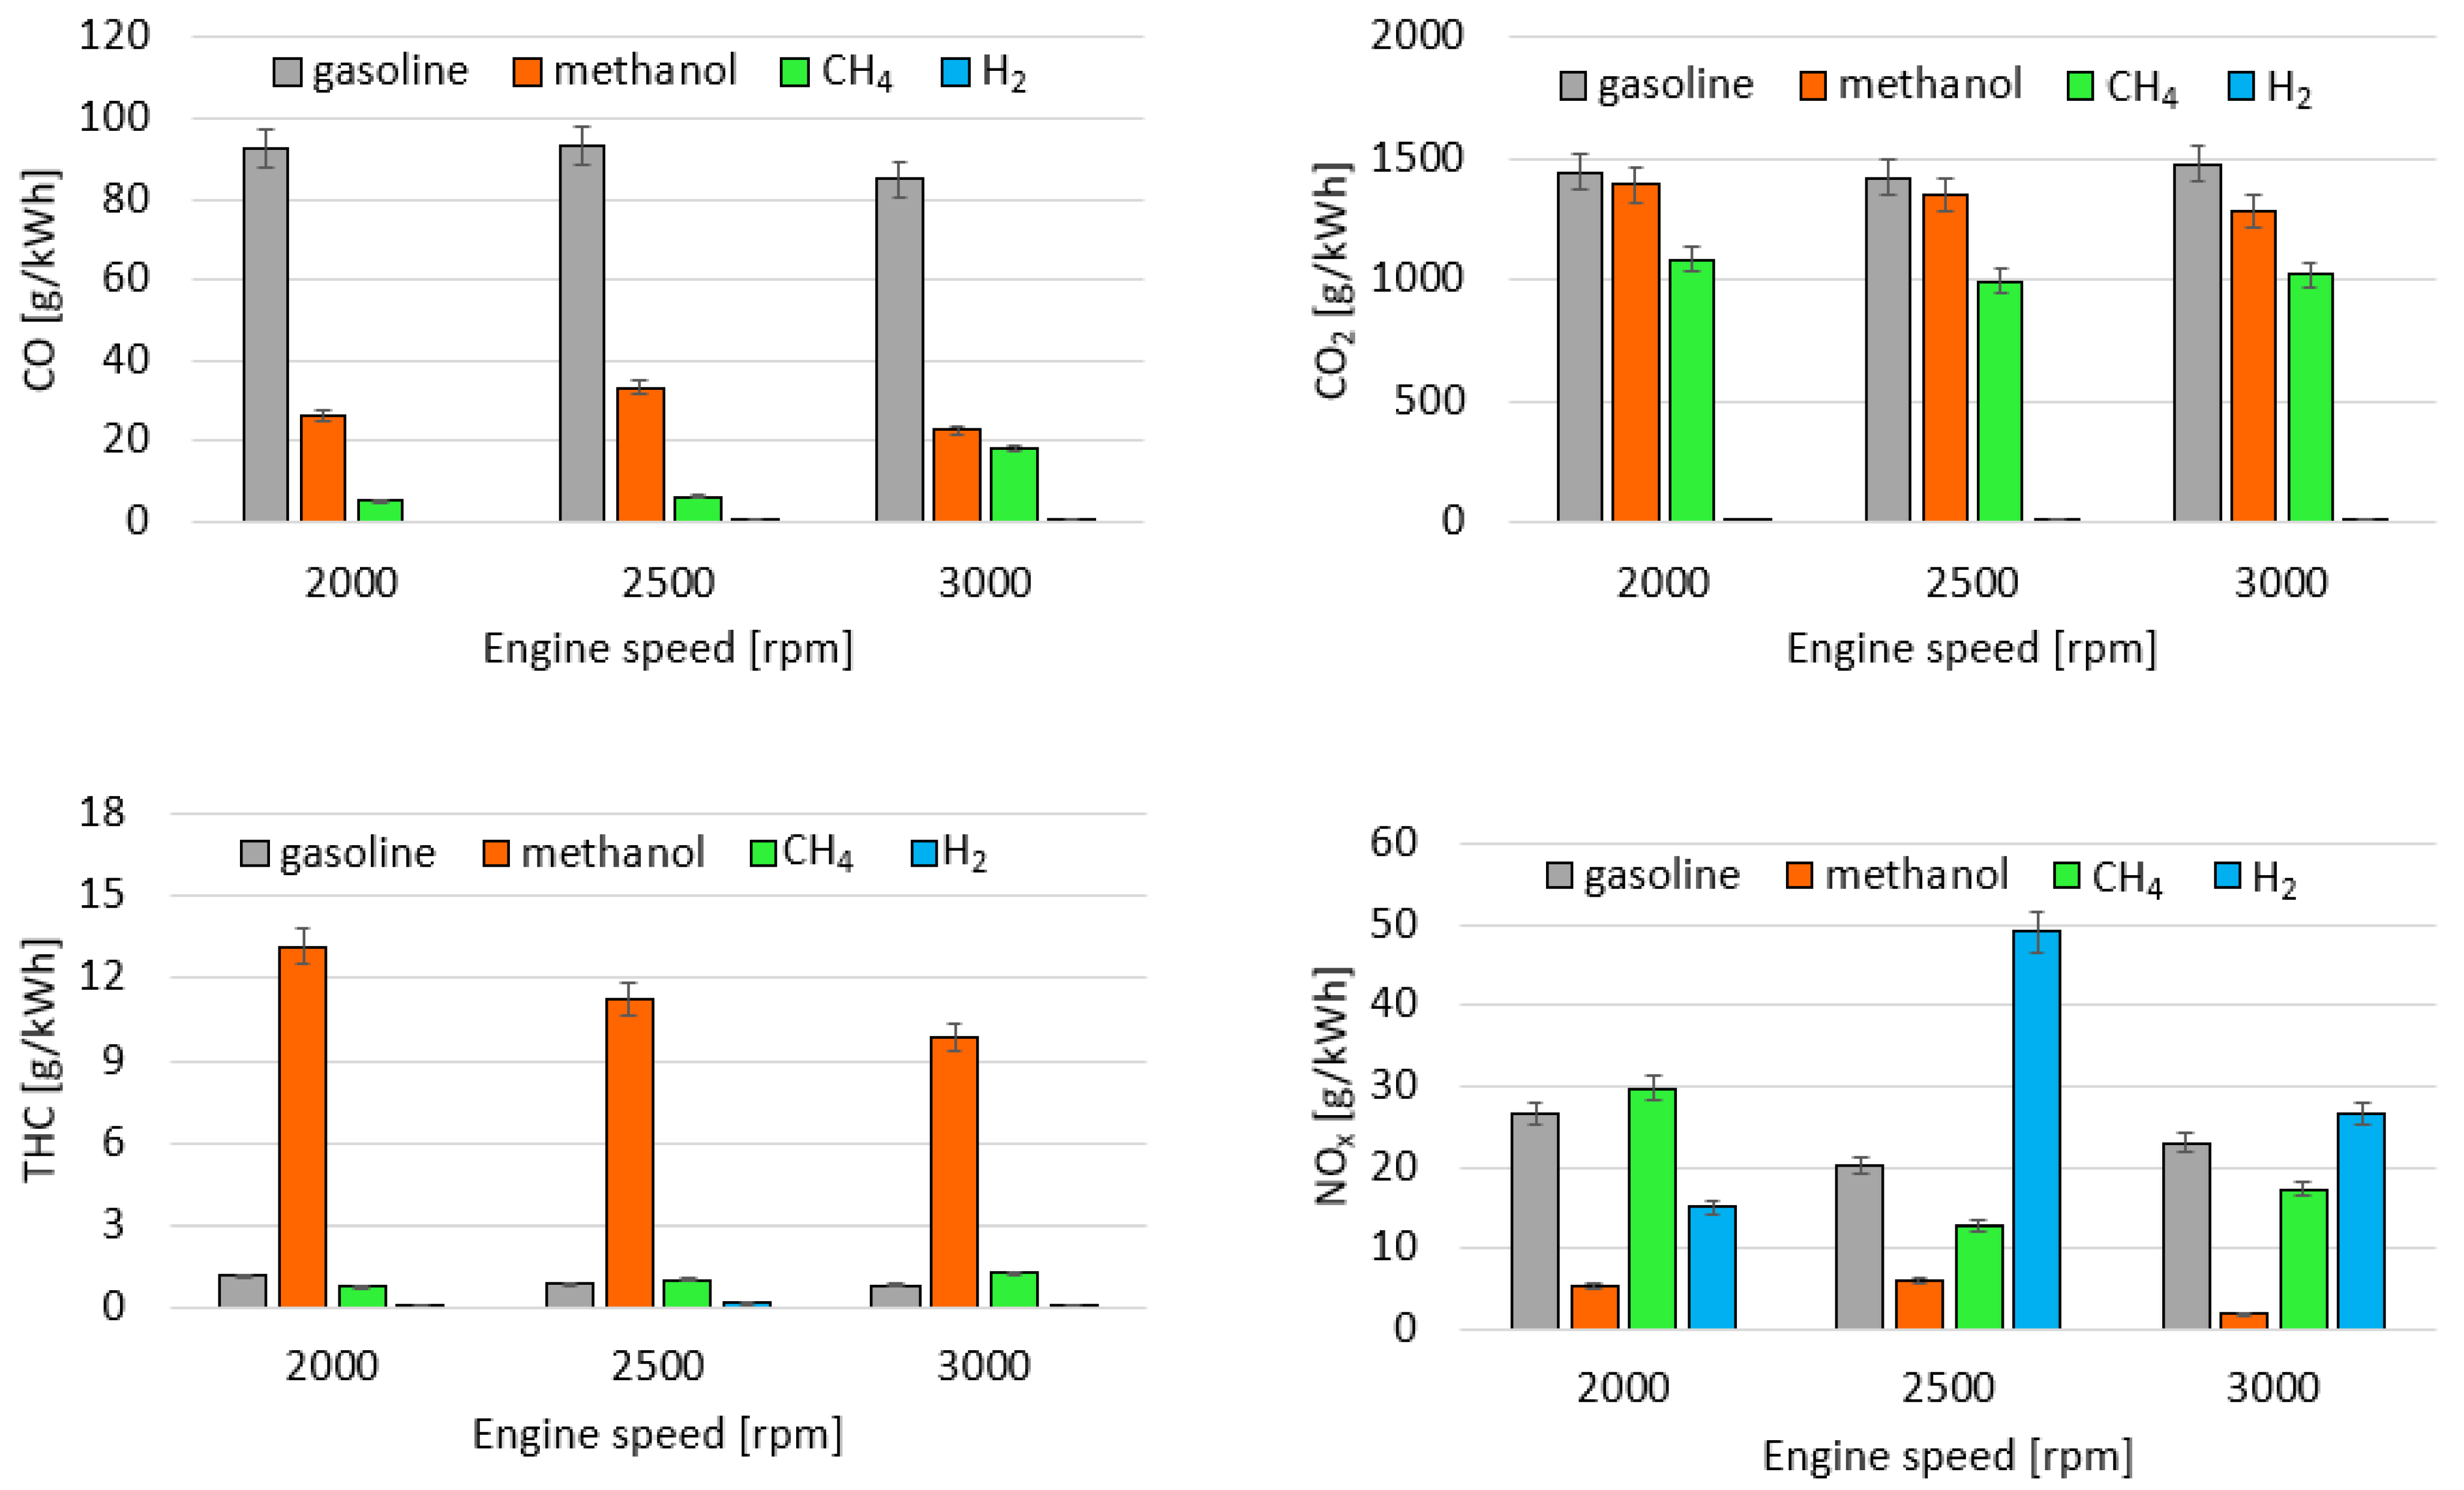
3.2. Exhaust Emission Analysis

To better analyze the environmental impact of the tested alternative fuels, gaseous emissions were measured at the exhaust, as shown in Figure 5. Emission concentrations were converted to mass flow rate by determining the inlet air and fuel mass flow rate. Therefore, the pollutant mass flow rates were expressed as grams of pollutant per kWh by referring them to the indicated power.
Regarding the liquid fuels, methanol showed a reduction of CO emissions of about 70% with respect to gasoline and quite similar CO2 emissions. It is well known that the mechanisms of CO and CO2 formation depend on the C/H ratio and the oxygen content in the fuel. Therefore, the lower amount of carbon atoms in the methanol resulted in reduced CO emissions. On the other hand, the oxygenated fuel entailed a large oxygen presence in the rich areas of the chamber, thus promoting the conversion reactions of CO to CO2. Methanol was characterized by THC emissions about one order of magnitude higher with respect to gasoline. This trend could be ascribed to the lower volatility of the alcohol fuel, which can result in worse fuel evaporation, and the formation of liquid fuel pools near the intake valves [32]. NOx emissions were decreased compared to gasoline, with values up to 90% lower at 3000 rpm because of the higher HOV of the fuel, which reduced the temperature in the combustion chamber, thus inhibiting the NOx formation reaction, although there was a leaning effect of the charge due to the larger oxygen presence in the methanol.
With regard to the gaseous fuels, methane allowed to reduce CO and CO2 emissions compared to the liquid ones. The emissions of THC and NOx were instead affected by both the fuel properties and the operating conditions. Methane combustion was characterized by lower THC than gasoline at 2000 rpm and slightly higher THC at 2500 and 3000 rpm. Conversely, NOx emissions were higher at 2000 rpm compared to gasoline and lower at higher speeds. At 2000 rpm, because of the typical low temperature, the evaporation of the gasoline was worsened, resulting in less efficient combustion and thus in higher THC emissions. As the speed increased, the temperature increased, resulting in better evaporation. The slight increase in the THC emissions of methane could be ascribed to the lower temperature that is typical of its combustion as well as the lower quenching distance of methane when it was direct-injected. Compared to methanol, methane emitted less THC at each tested condition because of the worst evaporation that is typical of liquid fuel. The cooling of the charge also contributed to producing a lower amount of NOx.
Concerning hydrogen, since it does not contain any carbon atoms in its molecules, the formation of CO2, CO and THC does not occur, and these species could just be produced by the lubricating oil. In the tested conditions, the level of emissions of these gases was too low to be detected by the available equipment. On the other hand, hydrogen showed high emissions of NOx, especially at 2500 and 3000 rpm. The high combustion velocity led to an increased rate of heat release (Figure 4) and, consequently, to a higher in-cylinder temperature that promoted NOx formation. Thanks to its high flammability limits, hydrogen can be burnt in lean conditions, thus reducing the flame temperature and, hence, preventing NOx reactions. This phenomenon was amplified in operating conditions with a lower engine speed, 2000 rpm, which was characterized by lower temperature.
Figure 6 shows the contour plot depicting the particle number and diameter over time for hydrogen fueling in operating conditions with the higher engine speed, 3000 rpm.
Particles ranged between 6 and 300 nm, with a peak concentration of order of magnitude around 107 #/cm3 in the size range of 10–50 nm. Since hydrogen does not contain any carbon atoms in its molecular structure, these measured particles were not ascribable to the fuel but rather to other sources such as the lubricant oil. This result was also confirmed by previous research studies of the authors [33,34] through simultaneous physical and chemical analyses of the particles emitted by a hydrogen-fueled engine.
An interesting outcome arising from the time-resolved particle concentration and size distributions in Figure 6 was the oscillation behavior of the particle concentration. Although the tests were carried out in fixed operating conditions in stationary mode, the emission of particles was not continuous but exhibited variations in the concentrations. These particle fluctuations were also observed by Thawko et al. [35], who characterized the particles emitted by a DI ICE fed with a hydrogen-rich reformate. This trend could be due to the entrainment of vapor oil in the combustion chamber. This oil accumulates during engine running and, periodically, at a frequency depending also on the operating conditions, burns when the self-ignition temperature is reached.
In order to compare the particle emissions from the different fuels, the average PSDs were calculated at each operating condition, as shown in Figure 7. The data are plotted on a y-log scale to better highlight the differences among the tested fuels. The intensity and the shape of the PSDs depended on the operating conditions and fuel type.
Regarding the liquid fuels, at all investigated engine speeds, the PSDs of methanol were shifted towards a smaller diameter with respect to gasoline fuel, with a distinct nucleation mode (NM) at around 10 nm and a small inflection point of the accumulation mode (AM) centered at 200 nm. Gasoline has a broader distribution, with a little hump typical of the NM at 10 nm and a more pronounced tail of the accumulated particles. At 2000 and 2500 rpm, methanol had a higher concentration of nucleated particles with respect to gasoline. It is known from the literature that the volatile species typical of the NM can originate from the partial combustion of the fuel as well as from the lubricating oil [36]. It is known from the literature that alcohol fuels can induce oil dilution, thus contributing to oil-derived particle formation [37]. Oxygenated fuels were expected to reduce particle emissions due to their oxygen content, which inhibits soot precursor formation and improves post-oxidation. The higher volatility of the alcohol fuels can cause pool fires near the intake valves where the nuclei particles are formed [32]. This result is also consistent with the higher THC emissions [14,38] (Figure 5). At 3000 rpm, instead, the PSD of methanol dropped down compared to gasoline because of the higher temperature reached at high engine speeds, which increases the rates of evaporation and oxidation. The better fuel evaporation and charge formation, in fact, reduced the mechanism of particle formation. Moreover, the increased particle post-oxidation led to smaller-particle emissions.
The PSDs of the gaseous fuels were strongly affected by the engine test point because of the in-cylinder environmental condition that impacted the participation of the lubricating oil in combustion. At 2000 rpm, methane and hydrogen emitted little or no particle emissions, respectively. The PSD of methane, in fact, was higher than the lower limit of the spectrometer, while, for hydrogen fueling, it was not distinguishable due to noise.
At 2500 rpm, the gaseous fuels showed definite PSDs with lower concentrations than the liquid ones. Both methane and hydrogen presented two bumps at 10 and 60 nm and a lower tail peaked at 200 nm. In particular, hydrogen had a higher PSD with respect to methane. At high engine speeds, the PSDs of the gaseous fuels were comparable to those of the liquid fuels. Methane exhibited a little peak of the NM at 10 nm and a wide AM overlapping the gasoline one. Hydrogen showed a pronounced NM with concentration values even higher than those of gasoline. As mentioned above, the main source of particles when gaseous fuels are burnt is the lubricating oil that enters the cylinder because of the piston ring dynamics [39]. The partial combustion of high-molecular-weight hydrocarbons in the oil, in fact, leads to the formation of nanoparticles that then grow and coagulate to form larger aggregates.
To better highlight the effect of fuel and operating conditions on particle emissions, the total particle number (Np) and mean diameter (Dm) were calculated and are depicted in the bubble graph in Figure 8. Np values are reported on the y-axis while Dm is represented by the bubble dimension. Methanol allowed for a reduction in particle size at all engine speeds thanks to the embedded oxygen that promoted the oxidation of the particles. At 2000 rpm, the alcohol fuel emitted a large number of particles due to the higher HOV of the fuel that, together with the lower temperature reached at low engine speeds, led to poor atomization and the mixing of the oxygenated fuels, thus promoting the formation of fuel-rich zones were nuclei particles originated from. With the increase in engine speed to 2500 and 3000 rpm, the in-cylinder temperature increased, overcoming the charge cooling effect typical of methanol and, hence, reducing the sources of particles.
When gaseous fuels were used, the particle number and size decreased. At 2000 rpm, the bubbles representative of the particles emitted from methane and hydrogen are not shown since their values were too low to be well detected by the used spectrometer. As mentioned above, for the gaseous fuels, the main role in particle formation is played by the lubricating oil. It can be observed that the particle number and size of the particles emitted by both methane and hydrogen increased with the engine speed. With increases in the engine speed, the flame temperature also increased. Therefore, a major amount of the oil film deposited on the cylinder surface participated in combustion, leading to particle formation. No significant differences in terms of number and size were observed at 2500 rpm, evidencing the role of the lubricating oil. On the other hand, at high engine speeds, methane exhibited a higher number of particles of larger diameter with respect to hydrogen. This trend can be ascribed to the higher DOI of methane resulting in a longer interaction of the fuel jet with the cylinder surface and, hence, dragging large amounts of oil into the combustion. Moreover, another aspect to consider is that methane combustion evolves at a lower temperature than hydrogen, thus facilitating the process of particle growth and coagulation.
This experimental study has highlighted the advantages in terms of pollutant emission reduction obtained at different extents from the use of alternative fuels—both liquid and gaseous. However, for a complete evaluation of the effective environmental benefit of using alternative fuels, the entire process of fuel production, transportation and distribution should be taken into account—the well-to-tank pathway (WtT). In this regard, the engine indicated power (Pind) was related to the WtT global warming potential (GWP 100a) in kg CO2eq obtained by the literature [6] as shown in Figure 9. Data were expressed in % with respect to gasoline. All the fuels showed positive values, indicating an advantage in terms of total CO2 reduction compared to gasoline. Moreover, the best behavior was shown by methanol, followed by methane and then by hydrogen.

4. Conclusions

This study investigated the combustion and emission characteristics of methanol, methane and hydrogen in a small displacement SI engine. Fuels were injected in different modes depending on their nature—PFI for the liquids and DI for the gaseous ones—to better exploit their potential. Tests were carried out at different engine speeds and at the same imep. The following conclusions are drawn from the research activity:
Combustion analysis:
  • The indicative data revealed that methanol is characterized by advanced—up to 5 cad—and faster combustion with a higher pressure peak—up to 18%—and heat release compared to the reference fuel.
  • Gaseous fuels are characterized by a lower combustion duration and higher heat release than gasoline. This result could be in part due to the injection configuration, highlighting the positive effect of the DI technology for gaseous fuels.
  • For hydrogen fueling, the effect of the higher flame speed was more evident, resulting in the fastest combustion—up to 11 cad of combustion duration—at 2500 rpm.
Emission characteristics:
  • All the alternative fuels guarantee a reduction of CO and CO2 emissions.
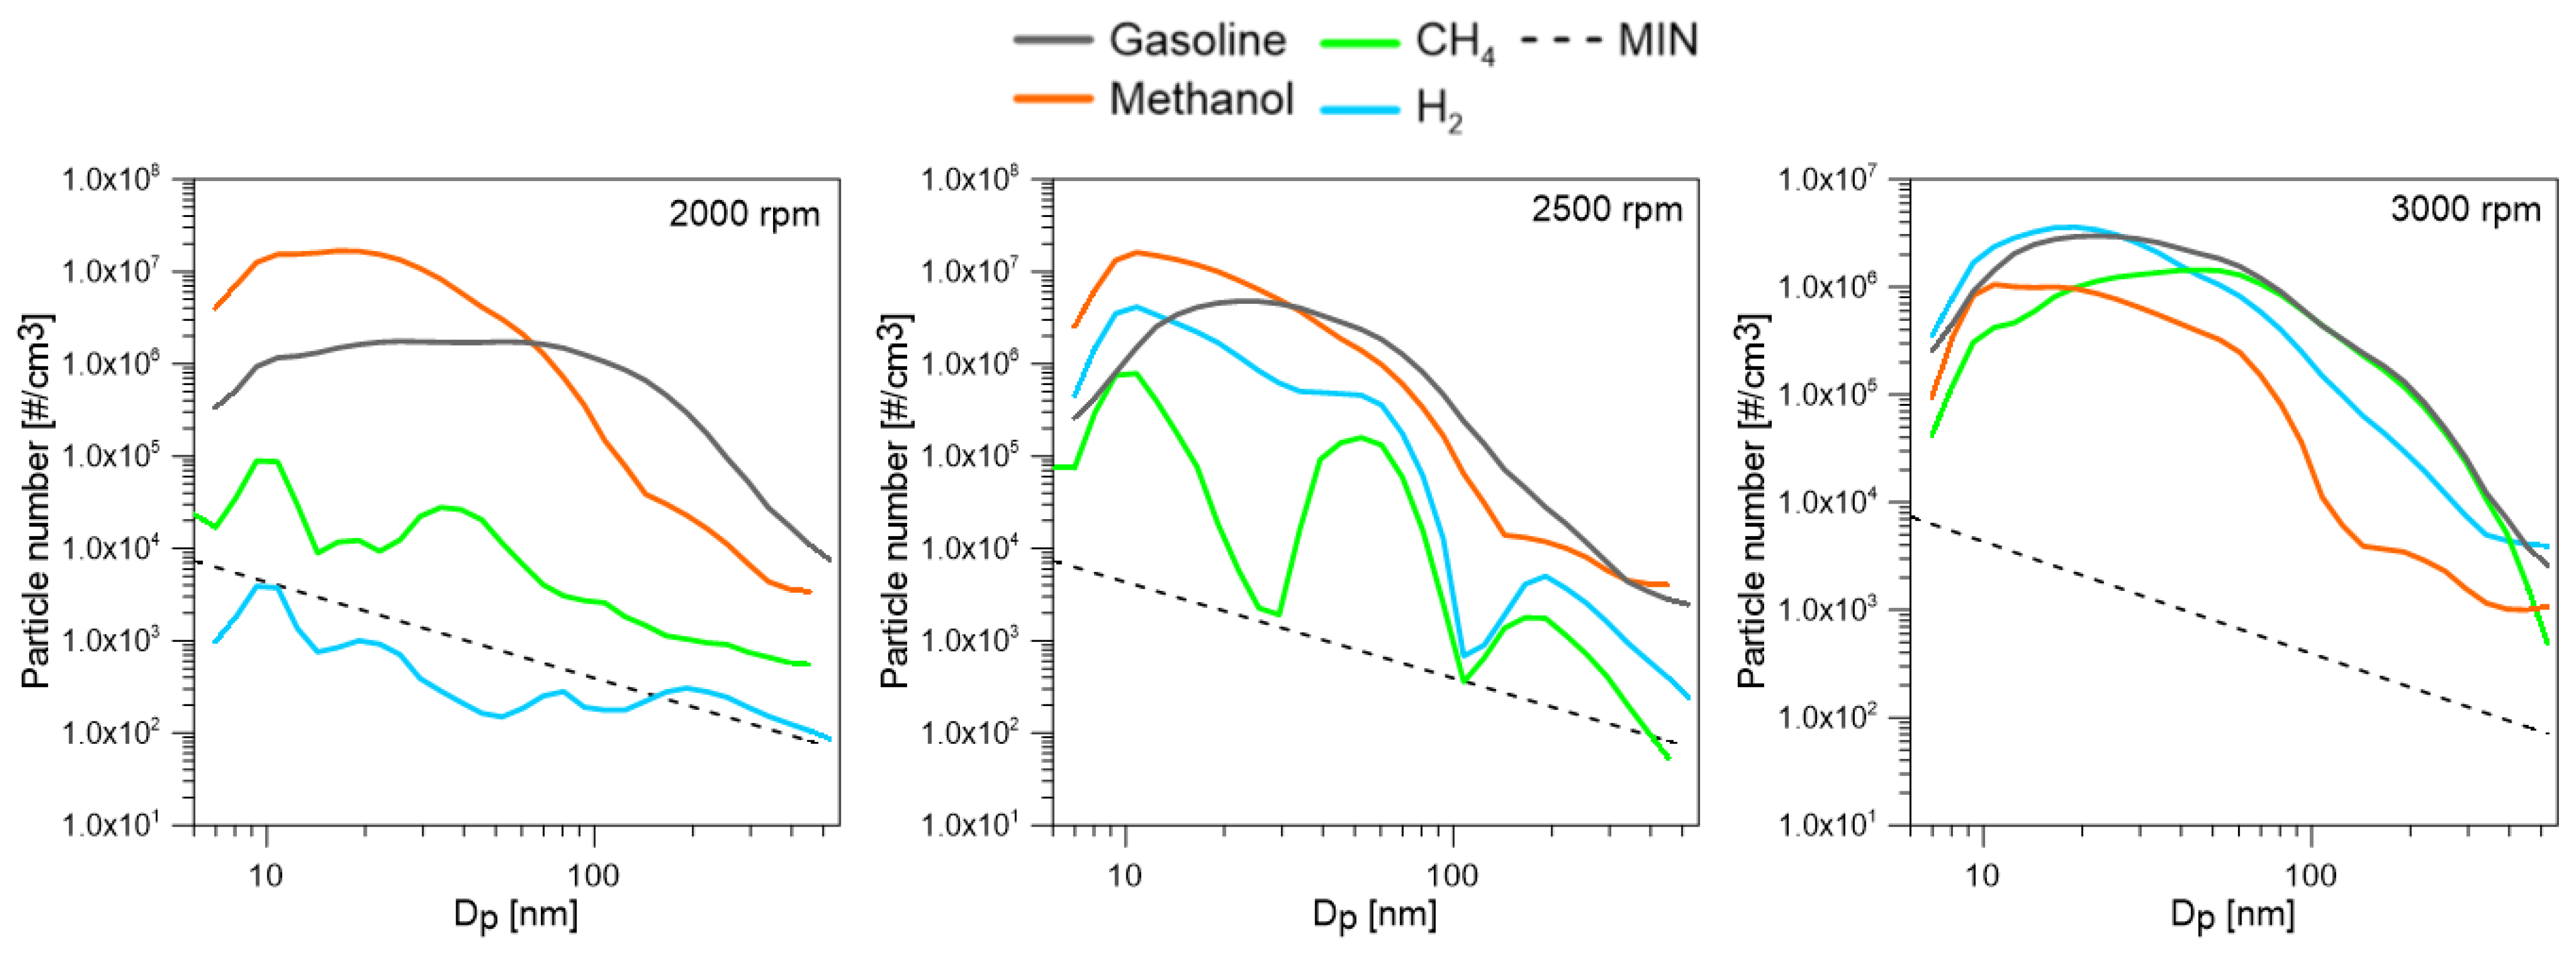
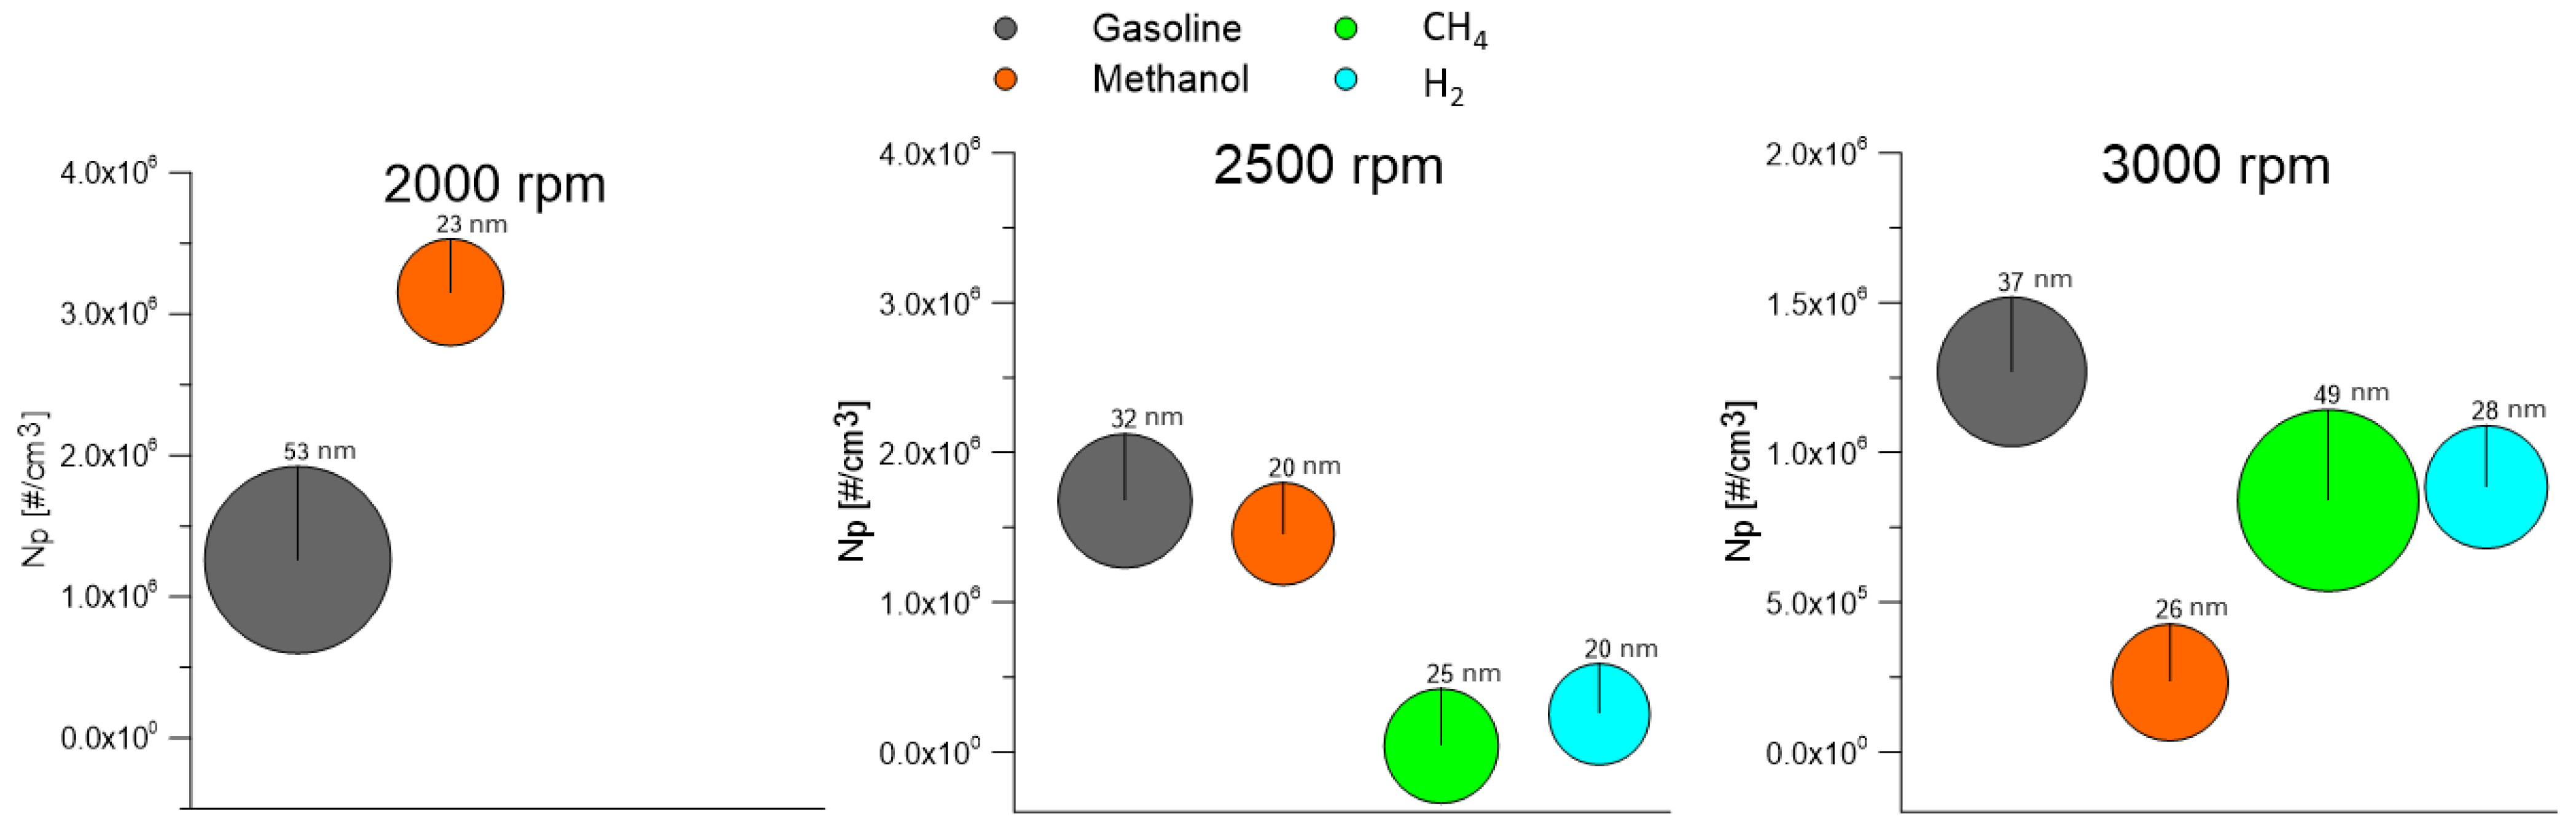
  • Methanol shows high THC emissions, with a maximum value of 13 g/kWh at 2000 rpm, due to the less efficient fuel vaporization. NOx emissions are, instead, decreased. Regarding the particles, methanol shows not negligible emissions. In general, smaller size particles were measured, while their number depended on the engine test point. The nature of these particles is not clear. An important factor affecting their formation is, in fact, the lubricating oil.
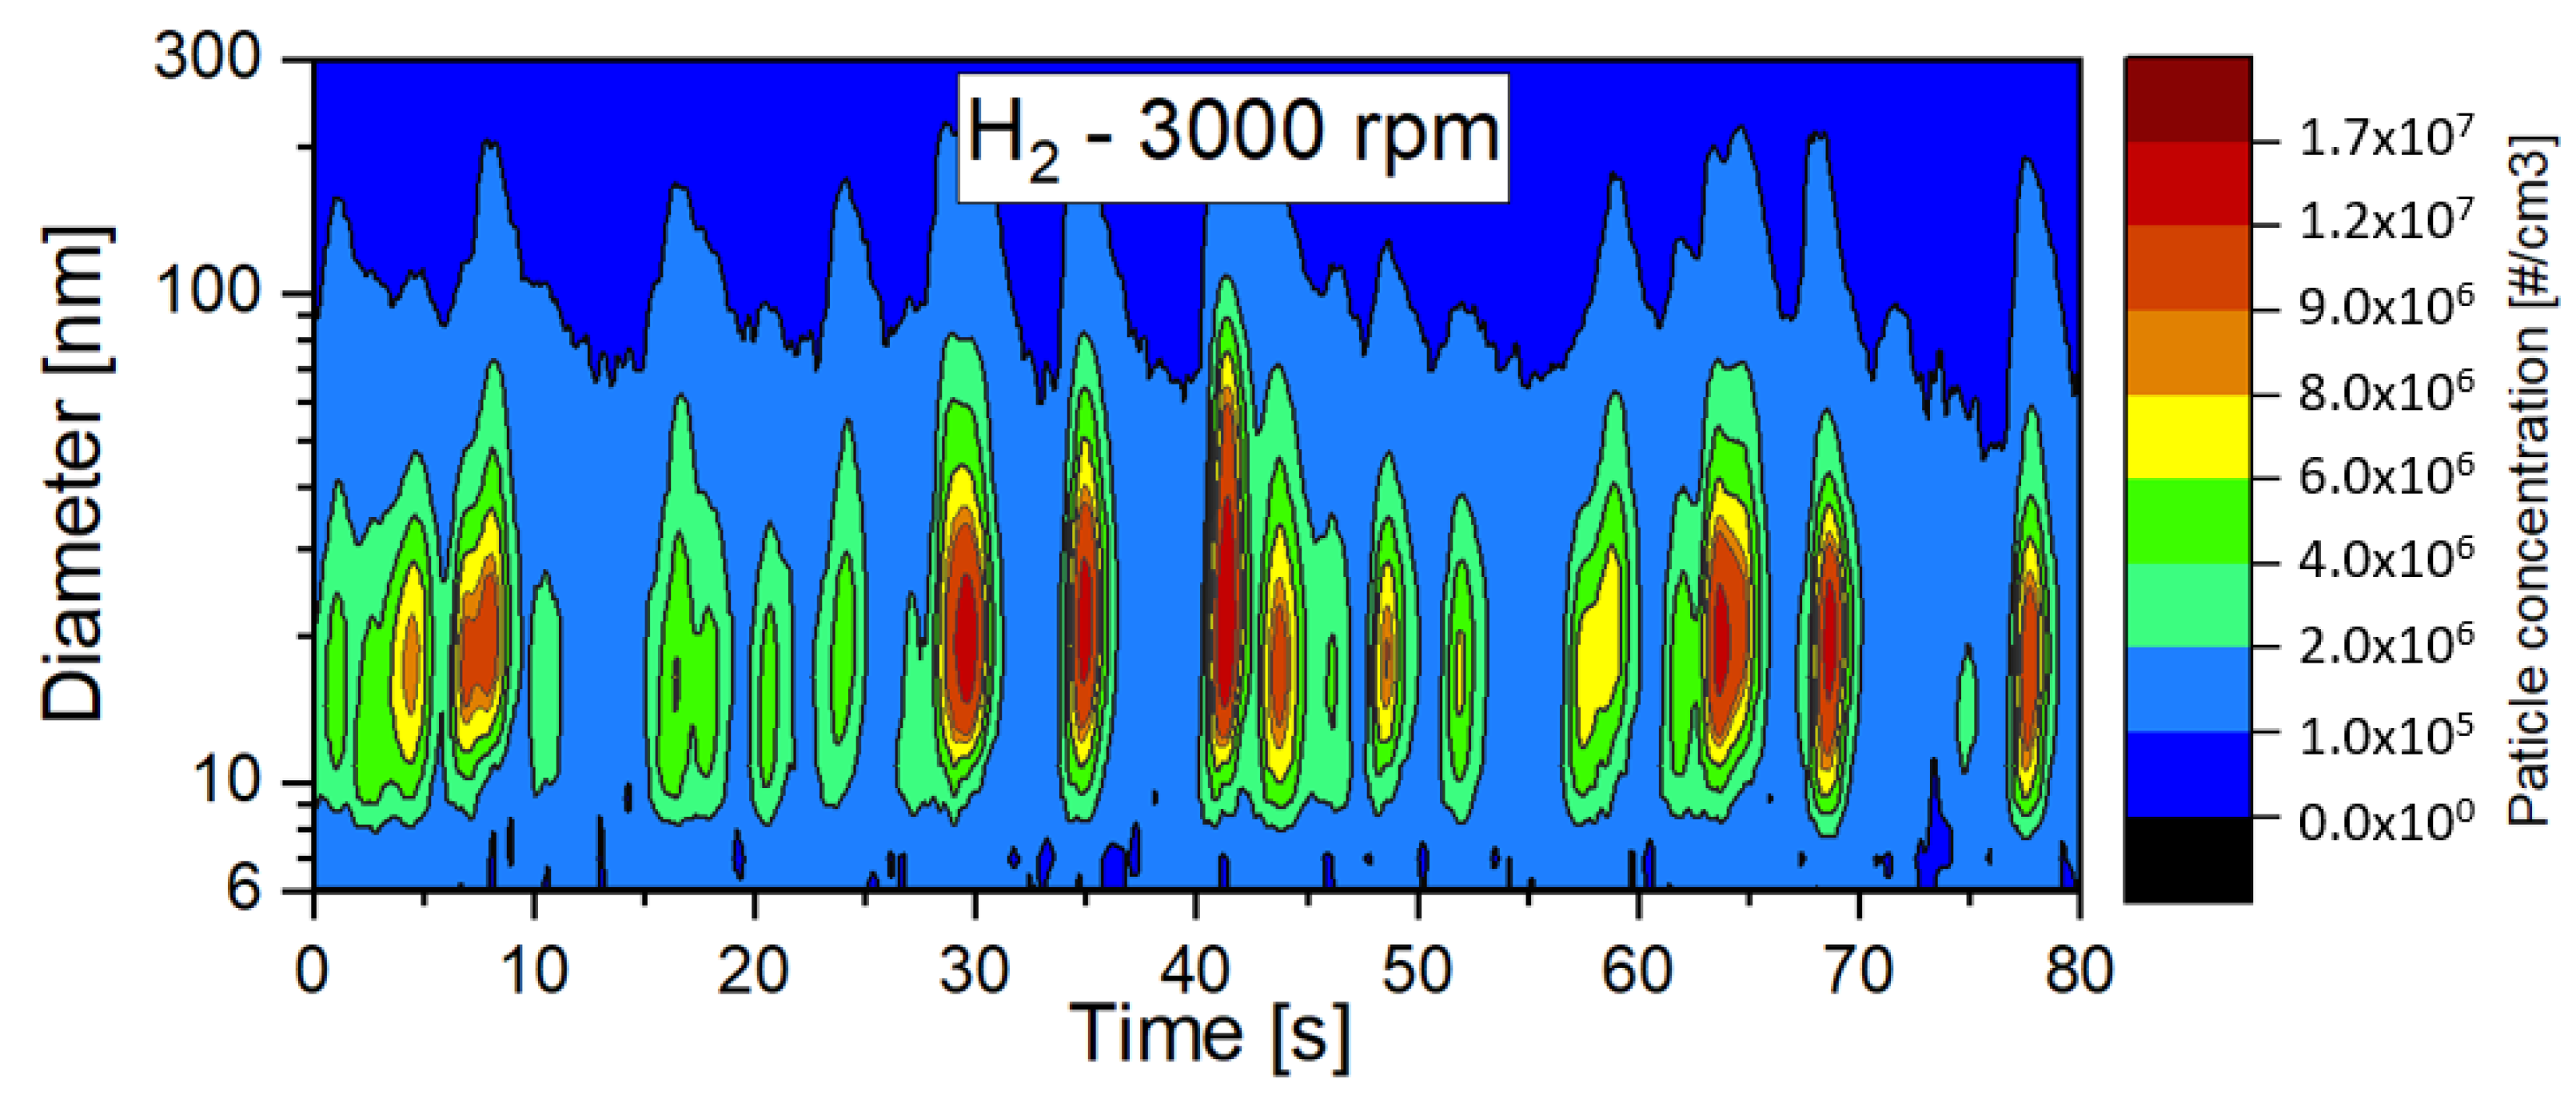
  • For gaseous fuels, the emission levels also depended on the operating conditions that affect the in-cylinder temperature. When gaseous fuels were used, the effect of oil on the particle emissions was clear, especially for hydrogen, which should not emit particles on its own. Lower particle emissions with a larger diameter were measured for methane fueling. For hydrogen, an increase in particle emissions was observed with increases in engine speed.
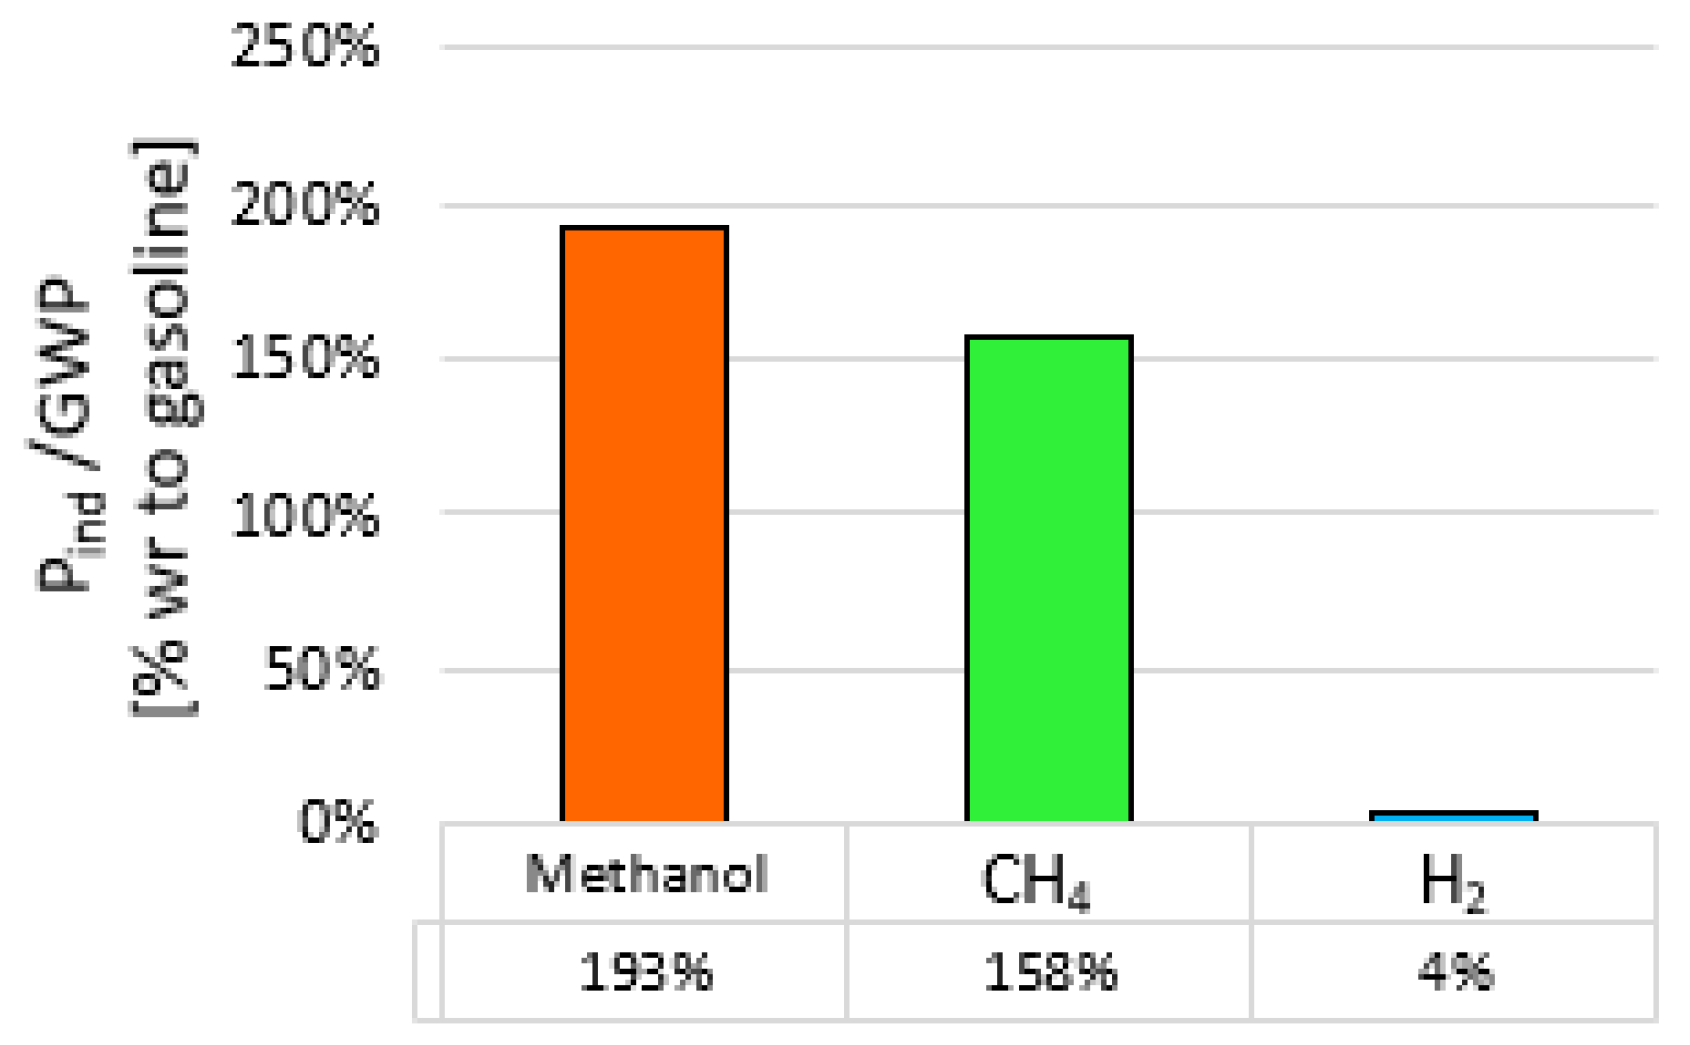
  • All the tested fuels contributed to sustainable mobility thanks to the benefit in terms of total CO2 reductions with respect to gasoline, with the best performance achieved by methanol.
Therefore, this study has highlighted that there is considerable merit in continuing to investigate alternative fuels as potential future automotive energy vectors since the objective of CO2 abatement cannot be achieved by focusing on a single technology but rather by diversifying the available solutions. From this perspective, this study has pointed out that a proper injection strategy and control could help to make the most of fuel characteristics.
Moreover, continuing the study of particle emissions due to lubricating oil when the engine is fueled with alcohol is important to determine the nature of such particles, if fuel- or oil-derived, and better understand how to control their emissions. This type of analysis is also relevant when gaseous fuels are used for the proper optimization of engine oil.

Author Contributions

F.C.: Methodology, Investigation. S.D.I.: Methodology, Investigation, Writing—original draft, Visualization. A.M.: Methodology, Investigation, Writing—original draft, Visualization. P.S.: Methodology, Investigation. B.M.V.: Supervision. All authors have read and agreed to the published version of the manuscript.

Funding

This research has been partially supported by the European Union—NextGenerationEU—National Sustainable Mobility Center CN00000023, Italian Ministry of University and Research Decree n. 1033—17/06/2022, Spoke 12, CUP B43C22000440001.

Data Availability Statement

The data presented in this study are available on request from the corresponding author. The data are not publicly available due to privacy.

Acknowledgments

The authors thank Carlo Rossi and Bruno Sgammato for the engine assessment and support with the experiments.

Conflicts of Interest

The authors declare no conflicts of interest.

Abbreviations

AFRstStoichiometric Air/Fuel Ratio
AMAccumulation Mode
ATDCAfter Top Dead Center
cadCrank Angle Degree
CLDChemiluminescent Detector
COCarbon Monoxide
CO2Carbon Dioxide
DIDirect Injection
DmMean Diameter
DOIDuration of Injection
EEPSEngine Exhaust Particle Spectrometer
ETUEngine Timing Unit
EVElectric Vehicle
GWPGlobal Warming Potential
HOVHeat of Vaporization
ICEInternal Combustion Engine
ImepIndicated Mean Effective Pressure
λExcess Air Ratio
LHVLow Heating Value
MBF10cad for 10% of Mass Fraction Burned
MBF90cad for 90% of Mass Fraction Burned
NDIRNon-Dispersive Infrared
NMNucleation Mode
NOxNitrogen Oxides
NpParticle Number
ONOctane Number
PFIPort Fuel Injection
PindIndicated Power
PMParticulate Matter
PSDParticle Size Distribution
ROHRRate of Heat Release
SDSingle Diluter
SISpark Ignition
SOIStart of Injection
SOSStart of Spark
THCTotal Hydrocarbons
TPThrottle Position
WOTWide Open Throttle
WtTWell-to-Tank

References

  1. 2050 Long-Term Strategy. n.d. Available online: https://climate.ec.europa.eu/eu-action/climate-strategies-targets/2050-long-term-strategy_en (accessed on 27 March 2023).
  2. Adhikari, M.; Ghimire, L.P.; Kim, Y.; Aryal, P.; Khadka, S.B. Identification and analysis of barriers against electric vehicle use. Sustainability 2020, 12, 4850. [Google Scholar] [CrossRef]
  3. Kaunda, R.B. Potential environmental impacts of lithium mining. J. Energy Nat. Resour. Law 2020, 38, 237–244. [Google Scholar] [CrossRef]
  4. Serrano, J.R.; Novella, R.; Piqueras, P. Why the development of internal combustion engines is still necessary to fight against global climate change from the perspective of transportation. Appl. Sci. 2019, 9, 4597. [Google Scholar] [CrossRef]
  5. Karczewski, M.; Chojnowski, J.; Szamrej, G. A review of low-CO2 emission fuels for a dual-fuel RCCI engine. Energies 2021, 14, 5067. [Google Scholar] [CrossRef]
  6. Breuer, J.L.; Scholten, J.; Koj, J.C.; Schorn, F.; Fiebrandt, M.; Samsun, R.C.; Albus, R.; Görner, K.; Stolten, D.; Peters, R. An Overview of Promising Alternative Fuels for Road, Rail, Air, and Inland Waterway Transport in Germany. Energies 2022, 15, 1443. [Google Scholar] [CrossRef]
  7. Bae, C.; Kim, J. Alternative fuels for internal combustion engines. Proc. Combust. Inst. 2017, 36, 3389–3413. [Google Scholar] [CrossRef]
  8. Verhelst, S.; Turner, J.W.; Sileghem, L.; Vancoillie, J. Methanol as a fuel for internal combustion engines. Prog. Energy Combust. Sci. 2019, 70, 43–88. [Google Scholar] [CrossRef]
  9. Boretti, A. Renewable hydrogen to recycle CO2 to methanol. Int. J. Hydrogen Energy 2013, 38, 1806–1812. [Google Scholar] [CrossRef]
  10. Di Iorio, S.; Catapano, F.; Magno, A.; Sementa, P.; Vaglieco, B.M. The Potential of Ethanol/Methanol Blends as Renewable Fuels for DI SI Engines. Energies 2023, 16, 2791. [Google Scholar] [CrossRef]
  11. Turner, J.W.; Lewis, A.G.; Akehurst, S.; Brace, C.J.; Verhelst, S.; Vancoillie, J.; Sileghem, L.; Leach, F.; Edwards, P.P. Alcohol fuels for spark-ignition engines: Performance, efficiency and emission effects at mid to high blend rates for binary mixtures and pure components. Proc. Inst. Mech. Eng. Part D J. Automob. Eng. 2018, 232, 36–56. [Google Scholar] [CrossRef]
  12. Turner, J.W.; Lewis, A.G.; Akehurst, S.; Brace, C.J.; Verhelst, S.; Vancoillie, J.; Sileghem, L.; Leach, F.; Edwards, P.P. Alcohol Fuels for Spark-Ignition Engines: Performance, Efficiency, and Emission Effects at Mid to High Blend Rates for Ternary Mixtures. Energies 2020, 13, 6390. [Google Scholar] [CrossRef]
  13. Zhang, Z.; Wen, M.; Cui, Y.; Ming, Z.; Wang, T.; Zhang, C.; Ampah, J.D.; Jin, C.; Huang, H.; Liu, H. Effects of methanol application on carbon emissions and pollutant emissions using a passenger vehicle. Processes 2022, 10, 525. [Google Scholar] [CrossRef]
  14. Geng, P.; Zhang, H.; Yang, S. Experimental investigation on the combustion and particulate matter (PM) emissions from a port-fuel injection (PFI) gasoline engine fueled with methanol–ultralow sulfur gasoline blends. Fuel 2015, 145, 221–227. [Google Scholar] [CrossRef]
  15. Ho, C.S.; Peng, J.; Yun, U.; Zhang, Q.; Mao, H. Impacts of methanol fuel on vehicular emissions: A review. Front. Environ. Sci. Eng. 2022, 16, 121. [Google Scholar] [CrossRef]
  16. Wei, Y.; Zhu, Z.; Liu, S.; Liu, H.; Shi, Z.; Zeng, Z. Investigation on injection strategy affecting the mixture formation and combustion of a heavy-duty spark-ignition methanol engine. Fuel 2023, 334, 126680. [Google Scholar] [CrossRef]
  17. Larsson, T.; Mahendar, S.K.; Christiansen-Erlandsson, A.; Olofsson, U. The effect of pure oxygenated biofuels on efficiency and emissions in a gasoline optimised disi engine. Energies 2021, 14, 3908. [Google Scholar] [CrossRef]
  18. Svensson, E.; Li, C.; Shamun, S.; Johansson, B.; Tuner, M.; Perlman, C.; Lehtiniemi, H.; Mauss, F. Potential Levels of Soot, NOx, HC and CO for Methanol Combustion. SAE Tec Pap 2016-01-0887. 2016. Available online: https://saemobilus.sae.org/content/2016-01-0887/ (accessed on 18 January 2024).
  19. Cho, H.M.; He, B.-Q. Spark ignition natural gas engines—A review. Energy Convers. Manag. 2007, 48, 608–618. [Google Scholar] [CrossRef]
  20. Akal, D.; Öztuna, S.; Büyükakın, M.K. A review of hydrogen usage in internal combustion engines (gasoline-Lpg-diesel) from combustion performance aspect. Int. J. Hydrogen Energy 2020, 45, 35257–35268. [Google Scholar] [CrossRef]
  21. Duc, K.N.; Duy, V.N.; Hoang-Dinh, L.; Viet, T.N.; Le-Anh, T. Performance and emission characteristics of a port fuel injected, spark ignition engine fueled by compressed natural gas. Sustain. Energy Technol. Assess. 2019, 31, 383–389. [Google Scholar] [CrossRef]
  22. Ma, F.; Liu, H.; Wang, Y.; Li, Y.; Wang, J.; Zhao, S. Combustion and emission characteristics of a port-injection HCNG engine under various ignition timings. Int. J. Hydrogen Energy 2008, 33, 816–822. [Google Scholar] [CrossRef]
  23. Ortiz-Imedio, R.; Ortiz, A.; Ortiz, I. Comprehensive analysis of the combustion of low carbon fuels (hydrogen, methane and coke oven gas) in a spark ignition engine through CFD modeling. Energy Convers. Manag. 2021, 251, 114918. [Google Scholar] [CrossRef]
  24. Yosri, M.; Palulli, R.; Talei, M.; Mortimer, J.; Poursadegh, F.; Yang, Y.; Brear, M. Numerical investigation of a large bore, direct injection, spark ignition, hydrogen-fuelled engine. Int. J. Hydrogen Energy 2023, 48, 17689–17702. [Google Scholar] [CrossRef]
  25. Thawko, A.; Eyal, A.; Tartakovsky, L. Experimental comparison of performance and emissions of a direct-injection engine fed with alternative gaseous fuels. Energy Convers. Manag. 2021, 251, 114988. [Google Scholar] [CrossRef]
  26. Thawko, A.; Tartakovsky, L. The Mechanism of Particle Formation in Non-Premixed Hydrogen Combustion in a Direct-Injection Internal Combustion Engine. Fuel 2022, 327, 125187. [Google Scholar] [CrossRef]
  27. Di Iorio, S.; Sementa, P.; Vaglieco, B.; Catapano, F. An Experimental Investigation on Combustion and Engine Performance and Emissions of a Methane-Gasoline Dual-Fuel Optical Engine. SAE Technical Paper 2014-01-1329. 2014. Available online: https://saemobilus.sae.org/content/2014-01-1329/ (accessed on 18 January 2024).
  28. Holman, J.P. Experimental Methods for Engineers; McGraw-Hill: New York, NY, USA, 2012. [Google Scholar]
  29. TSI Incorporated. Engine Exhaust Particle Sizer TM Spectrometer Model 3090. Available online: https://tsi.com/products/particle-sizers/fast-particle-sizer-spectrometers/engine-exhaust-particle-sizer-(eeps)-3090/ (accessed on 30 March 2015).
  30. TSI. Updated Inversion Matrices for Engine Exhaust Particle Sizer TM (Eeps TM) Spectrometer Model 3090—Application Note EEPS-005 (A4). 2015. Available online: https://tsi.com/getmedia/22bf0106-13d9-4503-b179-bc76cb55e100/Updated_Inversion_Matrices_EEPS-005-A4-web?ext=.pdf (accessed on 18 January 2024).
  31. AVL Emission Tester Series 4000. 2007. Available online: https://www.yumpu.com/en/document/view/7031754/avl-emission-tester-series-4000-product-brochure-avl-ditest (accessed on 18 January 2024).
  32. Catapano, F.; Di Iorio, S.; Luise, L.; Sementa, P.; Vaglieco, B.M. Influence of ethanol blended and dual fueled with gasoline on soot formation and particulate matter emissions in a small displacement spark ignition engine. Fuel 2019, 245, 253–262. [Google Scholar] [CrossRef]
  33. Apicella, B.; Catapano, F.; Di Iorio, S.; Magno, A.; Russo, C.; Sementa, P.; Tregrossi, A.; Vaglieco, B.M. Comprehensive analysis on the effect of lube oil on particle emissions through gas exhaust measurement and chemical characterization of condensed exhaust from a DI SI engine fueled with hydrogen. Int. J. Hydrogen Energy 2023, 48, 22277–22287. [Google Scholar] [CrossRef]
  34. Apicella, B.; Catapano, F.; Di Iorio, S.; Magno, A.; Russo, C.; Sementa, P.; Tregrossi, A.; Vaglieco, B.M. Comprehensive analysis on the effect of lube oil on particle emissions through gas exhaust measurement and chemical characterization of condensed exhaust from a DI SI engine fueled with hydrogen. Part 2: Effect of operating conditions. Int. J. Hydrogen Energy 2024, 49, 968–979. [Google Scholar] [CrossRef]
  35. Thawko, A.; Yadav, H.; Eyal, A.; Shapiro, M.; Tartakovsky, L. Particle emissions of direct injection internal combustion engine fed with a hydrogen-rich reformate. Int. J. Hydrogen Energy 2019, 44, 28342–28356. [Google Scholar] [CrossRef]
  36. Raza, M.; Chen, L.; Leach, F.; Ding, S. A Review of particulate number (PN) emissions from gasoline direct injection (gdi) engines and their control techniques. Energies 2018, 11, 1417. [Google Scholar] [CrossRef]
  37. Larsson, T.; Olofsson, U.; Erlandsson, A.C. Undiluted measurement of the particle size distribution of different oxygenated biofuels in a gasoline-optimised disi engine. Atmosphere 2021, 12, 1493. [Google Scholar] [CrossRef]
  38. Lou, D.; Wang, T.; Fang, L.; Tan, P.; Hu, Z.; Zhang, Y.; Xu, Z.; Cheng, C.; Wang, S.; Zhang, Y. Investigation of the combustion and particle emission characteristics of a GDI engine with a 50 MPa injection system. Fuel 2022, 315, 123079. [Google Scholar] [CrossRef]
  39. Hora, T.S.; Shukla, P.C.; Agarwal, A.K. Particulate emissions from hydrogen enriched compressed natural gas engine. Fuel 2016, 166, 574–580. [Google Scholar] [CrossRef]
Figure 1. Experimental setup.
Energies 17 01026 g001
Figure 2. λ values for gasoline, methanol, methane and hydrogen at all investigated conditions.
Energies 17 01026 g002
Figure 3. pmax versus cad ATDC at pmax for gasoline, methanol, methane and hydrogen at 2000, 2500, and 3000 rpm, 6.0 bar of imep.
Energies 17 01026 g003
Figure 4. Peak of ROHR versus combustion duration for gasoline, methanol, methane and hydrogen at 2000, 2500 and 3000 rpm, 6.0 bar of imep.
Energies 17 01026 g004
Figure 5. CO, CO2, THC and NOx emissions for gasoline, methanol, methane and hydrogen at 2000, 2500 and 3000 rpm, 6.0 bar of imep.
Energies 17 01026 g005
Figure 6. Time-resolved particle concentration and size distributions for hydrogen at 3000 rpm.
Energies 17 01026 g006
Figure 7. PSDs for gasoline, methanol, methane and hydrogen at 2000, 2500 and 3000 rpm, 6.0 bar of imep.
Energies 17 01026 g007
Figure 8. Particle number and diameter for gasoline, methanol, methane and hydrogen at 2000, 2500 and 3000 rpm, 6.0 bar of imep.
Energies 17 01026 g008
Figure 9. Pind/GWP ratio in % with respect to gasoline for methanol, methane and hydrogen at 3000 rpm.
Energies 17 01026 g009
Table 1. Engine specification.
EngineSpark Ignition
Number of Cylinders1
Bore [mm]72
Stroke [mm]60
Displacement [cm³]244.3
Compression Ratio11.5:1
Max. Power [kW]16 @ 8000 rpm
Max. Torque [Nm]20 @ 5500
IntakeTurbo-charged
Injection SystemGaseous fuels—DILiquid fuels—PFI
Number of Nozzle Holes63
pinj [bar]52.5
Table 4. Fuel properties.
PropertiesGasolineMethanolMethaneHydrogen
Chemical FormulaC4–C12CH3OHCH4H2
Density at 15 °C [kg/L]7467960.670.08
Boiling Point [°C]27–22564−161.4−252.9
LHV [MJ/kg]42.9420.150120
AFRst14.56.417.2434.20
RON95.0108.6>120>130
Flammability Limits [vol %]1.4/7.66.7/365.3/144/75
C [% mass]85.938.075-
H [% mass]13.412.125100
O [% mass]0.650.0--
Table 5. Investigated operating conditions.
Engine Speed [rpm]/Imep [bar]FuelInjection ModeSOI
[cad BTDC]
SOS
[cad ATDC]
TP
[%]
DOI
[cad]
2000/6gasolinePFI31537.0464
methanolPFI36040.04155
CH4DI30522.58175
H2DI3109.695200
2500/6gasolinePFI31539.0480
methanolPFI36040.04170
CH4DI31524.314238
H2DI3306.595320
3000/6gasolinePFI31544.0489
methanolPFI36045.04175
CH4DI31528.510270
H2DI35210.095245
Disclaimer/Publisher’s Note: The statements, opinions and data contained in all publications are solely those of the individual author(s) and contributor(s) and not of MDPI and/or the editor(s). MDPI and/or the editor(s) disclaim responsibility for any injury to people or property resulting from any ideas, methods, instructions or products referred to in the content.

