Article

Examples of Paleokarst in Mesozoic Carbonate Formations in the Carpathian Foreland Area

Oil and Gas Institute—National Research Institute, 25A Lubicz Str., 31-503 Cracow, Poland
*
Author to whom correspondence should be addressed.
Energies 2024, 17(4), 838; https://doi.org/10.3390/en17040838
Submission received: 20 December 2023 / Revised: 31 January 2024 / Accepted: 3 February 2024 / Published: 9 February 2024
(This article belongs to the Special Issue Carbonate Reservoirs, Geothermal Resources and Well Logging)

Abstract

:
A paleokarst system developed in the Upper Jurassic–Lower Cretaceous carbonate complex has been recognized in the Carpathian Foreland area. Well logs testing and core data as well as an acoustic imager, a microresistivity scanner and six-arm dipmeter images were used to identify and analyze the character of the paleokarst features. A detailed interpretation of microresistivity and acoustic image logs allowed for the identification of different types of karst forms, such as caverns; multidirectional fractures, including fractures widened by dissolution; and the type of sediments filling them. The analysis of the seismic survey was conducted by linking the paleokarst characteristic features recognized in the seismic image to the karst intervals determined from borehole data. The set of seismic attributes calculated from the analyzed 3D seismic data, including the RMS amplitude, instantaneous frequency, consistent dip, variance, sweetness and relative acoustic impedance, helped to delineate the zones of the paleokarst distribution. Within the interpreted paleokarst surface developed in the carbonate formations in the study area, there are sinkholes, limestone pavements and valleys. Furthermore, in the northwestern part of the analyzed area, the development of paleokarst forms is related to the presence of a relatively deep branch of a paleovalley formed in the Paleogene, as well as to numerous discontinuities developed in carbonate formations. The development of this type of larger karst form was probably controlled primarily by tectonic faults. The research conducted by the authors of this paper showed the widespread presence of paleokarst features in Upper Jurassic–Lower Cretaceous carbonate formations in the study area. A good spatial identification of the paleokarst surface can be important in a regional context, since the highest part of the profile of carbonate formations is the most important reservoir for geothermal or hydrocarbon resources in this region.

1. Introduction

Paleokarst-related reservoirs are important for hydrocarbon accumulation in carbonate formations. Carbonates, with few exceptions, are generally characterized by poor petrophysical parameters, especially porosity and permeability. Zones of better reservoir parameters in carbonate rocks are usually associated with formations subjected to tectonic and karstification processes. Depending on the extent to which buried paleokarst structures are filled with rock material, they can be good traps for hydrocarbon accumulation.
A number of oil and gas fields associated with carbonate rocks have been identified to date in southern Poland (e.g., Grobla, Łąkta, Tarnów-jura, Swarzów, DąbrowaTar-nowska, Korzeniów and Brzezówka) [1]. The carbonate rock complexes present in the Carpathian Foreland are mainly represented by Upper Jurassic and, to a lesser extent, Lower Cretaceous formations [2]. Upper Cretaceous carbonate formations are also observed locally [3]. The carbonate sediments are covered by a Miocene complex and, in the southern part, also by sedimentary rocks belonging to the tectonic units of the Carpathians.
The world’s best-known examples of oil and gas fields associated with a buried paleokrast reservoir have been found in China. In several petroleum basins (such as Ta-rim, Ordos and Sichuan), hydrocarbon accumulations have been discovered in carbonate formations with strongly developed karst features [4,5,6,7,8]. Similar types of fields are also exploited in other countries around the world, including Canada, the US, Mexico, Venezuela, Saudi Arabia, Iraq, Russia and Kazakhstan, and also in the North Sea and the Barents Sea [9,10,11,12,13,14,15,16,17]. Analyses of geological and drilling data showed that the volume of karst structures can account for a significant portion of porosity for some hydrocarbon fields [18]. The later research work, covering the region of hydrocarbon fields in the central part of the Carpathian Foreland, confirmed the occurrence of buried paleokarst structures [19].
The main goal of this article is to present examples of paleokarst structures in the Carpathian Foreland area that, due to their good reservoir properties, may have significant potential for both hydrocarbon accumulation and geothermal resource exploration. The presence and nature of the distribution of paleokarst facies was documented by analyses based on the descriptions of drill cores, measurements of standard geophysical logging, interpretation of microresistivity and ultrasonic borehole image logs, interpretation of high-resolution microresistivity and acoustic image logs (Acoustic Scanning Tool) and analysis of 3D seismic data.

Geological Background

The study area is situated in southern Poland in the central part of the Carpathian Foreland (Figure 1).
The rock formations within the area belong to four main structural stages: Neoprote-rozoic, Paleozoic, Permian-Mesozoic and Miocene. A more detailed description of the geological structure of the area was presented in the authors’ earlier publications [19,20,21]. The oldest structural stage in the research area is represented by a series of Neoproterozoic anchimetamorphic rocks. The middle stage is composed of Meso-Paleozoic rocks of a considerable summary thickness up to 2000 m. The Ordovician and Silurian deposits are situated in the southern part of the analyzed region, directly on the Ediacaran interval. Higher up in the section lie the carbonate series of Devonian and Carboniferous sediments. The Mesozoic interval is represented by carbonate and clastic Triassic sediments, and above them lie mainly carbonate Jurassic and Cretaceous complexes. The youngest structural stage is formed by the Miocene formations (Badenian–Sarmatian), which were initially deposited in the Carpathian Foredeep basin.
The karst surface analyzed in this study developed in the upper part of the Upper Jurassic–Lower Cretaceous carbonate complex. The first stage of its development dates to the late Early Cretaceous. The second stage probably began at the end of the Late Cretaceous and continued for most of the Paleogene. In most of the Carpathian Foreland area (including the study site), the Upper Cretaceous formations were completely removed, and karst forms re-developed in formations of the Jurassic-Lower Cretaceous complex (Figure 2). This stage was closely associated with intensive erosion and the development of paleovalleys, deeply cutting into the Mesozoic basement formations and dominating the present Mesozoic surface morphology [22,23,24,25].

2. Materials and Methods

2.1. Research Methodology

The integrated macroscopic analysis of the geological–geophysical data and 3D seismic images was the starting point for the identification and recognition of the spatial distribution of the buried paleokarst features in the Upper Jurassic and Lower Cretaceous carbonate series. It is worth noting that the geophysical surveys in the boreholes located in the study area differ in their scope, technology, recording method and methodology. Borehole data were used to characterize some of the structures of the paleokarst mainly on the meter scale, and in the case of high-resolution geophysical surveys and core surveys also on the centimeter scale. Seismic data, on the other hand, due to resolution limitations, revealed mainly macroscopic information on the occurrence of buried paleokarst zones.

2.2. Well Data

A dataset containing photographs and descriptions of cores with information on the dips, drilling progression and well test results was used for detailed studies of paleokarst features. Particular attention was paid to information on the occurrence of fractures, caverns and unconformity surfaces. It should be noted that the structures of the paleokarst are more or less filled with secondary sediments, which are often different in mineral composition and structure from the nature of the surrounding rocks. On this basis, the intervals of the potential occurrence of sediment filling karst structures were determined. Standard geophysical logging was then analyzed, including mainly the following: natural gamma ray, resistivity, diameter and, in more recent boreholes, also density and acoustic measurements. Based on the results of these analyses, it was possible to delineate up to several levels associated with paleokarst development. The determined intervals are characterized by an increase in values on gamma logging, an increase in diameter and a decrease in values on resistivity, density and acoustic logging. The results of the analyses may indicate, among other things, the presence of numerous voids, a weaker diagenesis of cave sediments or an increase in the clay content of the secondary sediment filling the karst voids [19]. In addition, standard geophysical measurements were used to identify the carbonate series of the Jurassic and Cretaceous sediments in the individual boreholes and to correctly identify the karst surfaces and define the interpreted karst formations. This was important as the tops of the Upper Jurassic with Lower Cretaceous and Upper Cretaceous complexes are closely associated with two major erosional phases, the first occurring in the late Early Cretaceous and the second at the end of the Cretaceous and in the Paleogene. The erosional processes related to these phases, combined with the tectonic processes, have influenced the present thickness and morphology of the Mesozoic sedimentary cover in the study area.
The most detailed information on the buried paleokarst forms found in the study area was obtained by interpreting images taken with high-resolution measurement methods, such as the acoustic imager (Circumferential Acoustic Scanning Tool, CAST, by Halliburton) and the resistivity scanner (X-tended Range Micro Imager, XRMI, by Halliburton). The CAST probe records the amplitude and propagation time of the acoustic wave reflected from the borehole wall [26,27], while the XRMI probe records changes in the resistivity of the rocks forming the borehole wall [28].
The images derived from these measurements are often used to interpret complex geological features in both carbonate and clastic formations [29,30]. The high vertical resolution (~5 mm CAST and ~2.5 mm XRMI) and near-complete coverage (in 360 degrees) of the borehole walls with measurements significantly increases the detail and precision of geological interpretations. CAST acoustic probe images, in which acoustic waves reflected from more compact formations, are characterized by a higher velocity than those reflected from rocks of a lower density allow for, with an appropriately selected color palette, to interpret with great success, for example, paleocaverns and dissolution fractures characterized by a lower density than limestone rocks. In the microresistivity XRMI scanner images, the intervals of the development of the paleokarst structures were recorded as low- or high-resistivity elements, depending on the type of fill or its absence. Dark colors in the resulting images suggest well-conductive objects, while bright colors represent highly resistive structures [28]. Each fill type is recorded as an anomaly shape. Based on well-defined anomaly shapes [30,31,32], the interpretation of many details, such as the up dip and azimuth of the layers and fractures, sedimentary structures and secondary and chemical sediment fill textures, can be carried out.
Measurements with six-arm dipmeters SED (Six Arm Dipmeters by Halliburton) and SDT (Six Arm Dipmeter by Tucker) were also helpful in delineating the zones of the paleokarst, especially in wells where the cores were not taken or high-resolution probes were not recorded in the intervals of interest. For this type of survey, the simultaneous interpretation of the dipmeter arrows (SHIVA) and continuous resistivity images of borehole wall (RESMAP) conducted in conjunction with an analysis of the standard geophysical logging record is essential. This approach makes it possible to indicate in the dipmeter measurements the differences between the carbonate rocks and the secondary sediments. The continuous image is created by using horizontal interpolation of the resistivity data that allow for the identification of high-angle fractures from dissolution, which clearly contrast in resistivity with the rest of the carbonate formation.

2.3. Seismic Data

According to Qi et al. [33], the existence of large-scale karst structures is most often associated with the occurrence of tectonic faults, which can serve as pathways to facilitate water circulation, promoting rock dissolution and indirectly contributing to the development of karst forms. Analyzing the seismic record, attention was drawn to the weakening of the amplitude, the occurrence of discontinuities and chaotic seismic reflections, as well as anomalous frequency decreases, indicating an increase in the absorption of seismic waves, which may occur in the paleokarst zones [34].
A seismic data analysis was conducted using Schlumberger’s Petrel software v.20.4 on two 3D surveys (Figure 1) processed in 2016 (survey I) and 2015 (survey II). The analysis of the seismic survey was conducted by relating the characteristic features of the seismic image to karst intervals determined from the borehole data (such as the core descriptions, geophysical logging, XRMI, CAST, SED and SDT measurements). The seismic attributes used for the analysis were primarily the RMS attribute, instantaneous frequency, consistent dip, local dip and chaos. The attributes were calculated from the analyzed seismic volume in the time domain and then used to calculate the surface attributes (e.g., extract value) in the selected time windows.
For the 3D seismic survey II, the analysis performed included the calculation of the seismic attributes, the consistent dip, variance, sweetness, instantaneous frequency, dominant frequency, spectral decomposition and iso-frequency, the image of which was then analyzed on different time slices. A horizon prob module was also used for the analysis, with reference to the mapped top surface of the Mesozoic carbonate formations.
The seismic attributes analysis conducted, partly in combination with well data, made it possible to select zones in the analyzed area for which the analyzed seismic im-age can be most reliably associated with the occurrence of a number of different paleokarst elements.

3. Results and Discussion

3.1. Identification of Paleokarst Features from Well Data

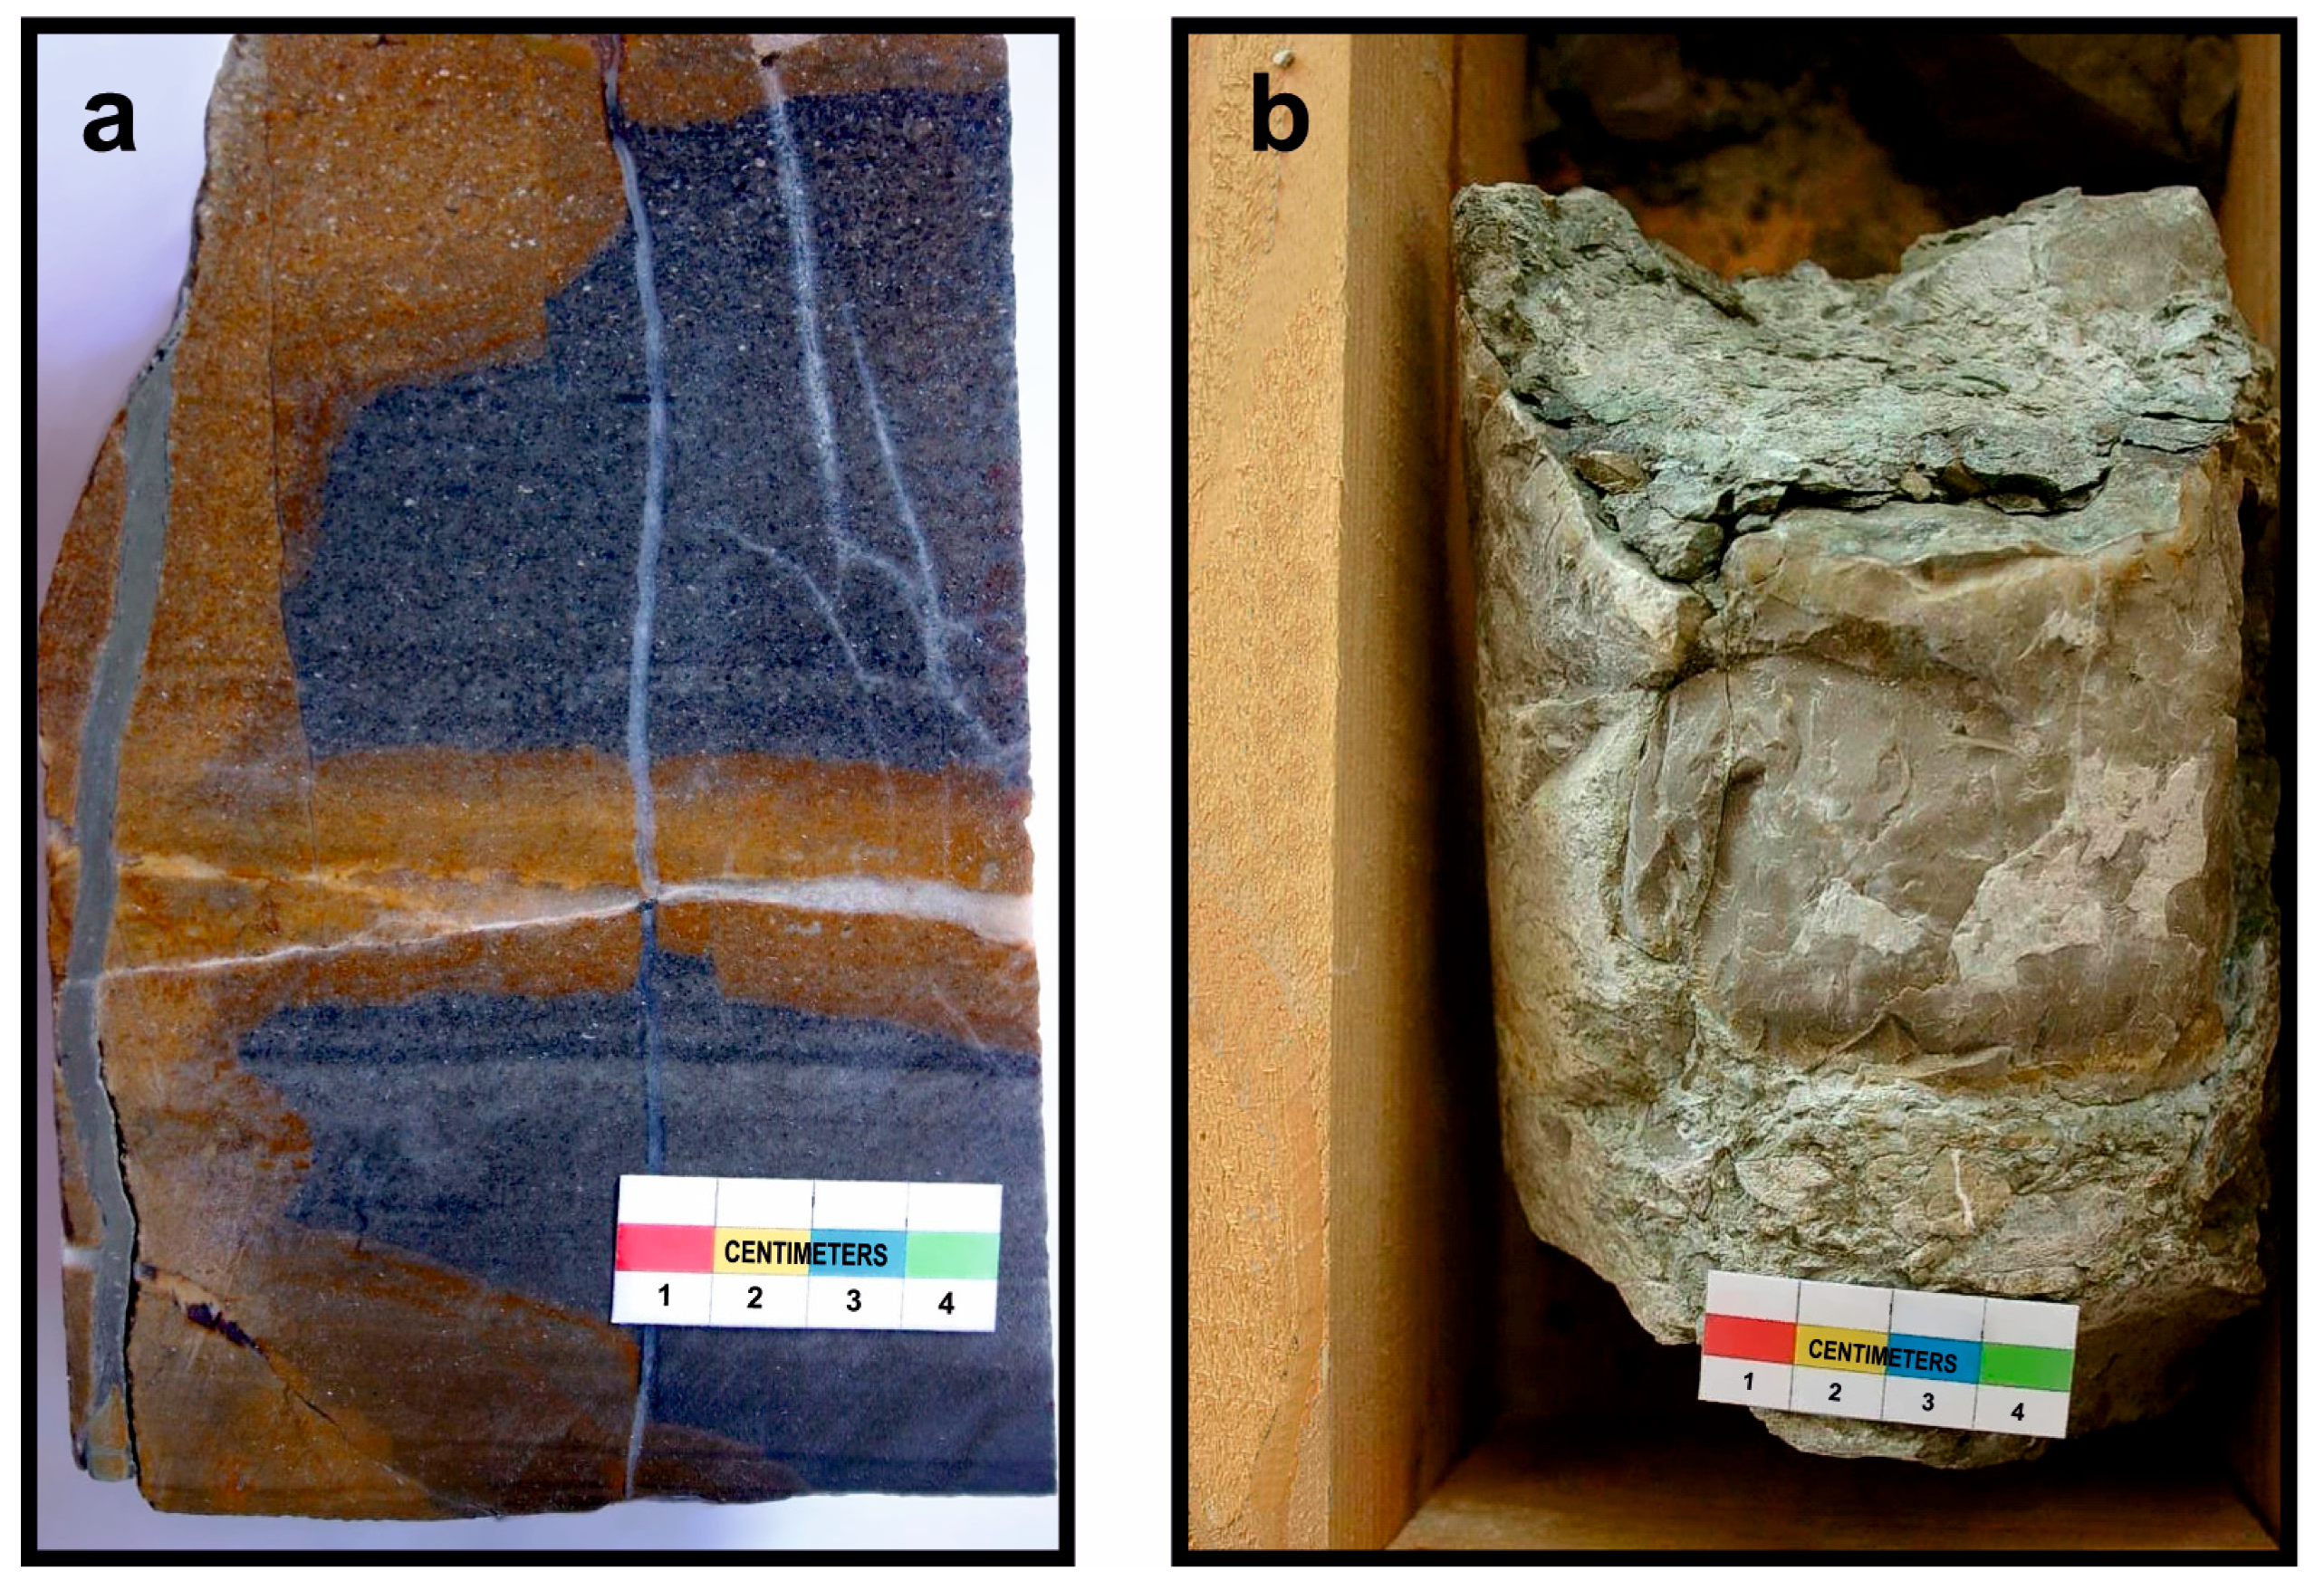
An analysis of the available lithological descriptions and photographs of the cores made it possible to identify in some of the analyzed boreholes such forms as caverns, breccia and multidirectional fractures with their fills, formed as a result of karst processes. It was also possible to determine the parameters of some of the cracks (such as the length, dilation or dip), as well as the degree of their filling. The fracture-filling material consists mostly of greenish or greenish-grey clay-marly sediments, locally sandy (Figure 3), which can be correlated with an early sedimentary phase in the Late Cretaceous (Cenomanian). The most common mineral fracture filling in the analyzed Upper Jurassic and Lower Cretaceous formations, occurring primarily as cement, is calcite.
It is worth noting that the interpretation of the borehole data was supported by the available results of the measurements with the SED six-arm fall meter (A-1, C-2, C-4, C-5K, Ko-1, P-1, Po-3 and W-2 wells) or SDT (K-1K well). The analysis carried out allowed for both to indicate the differences in the dip angles of the Upper Jurassic–Lower Cretaceous carbonate complex rocks and the Miocene clastic formations lying above but also to identify some paleokarst features.
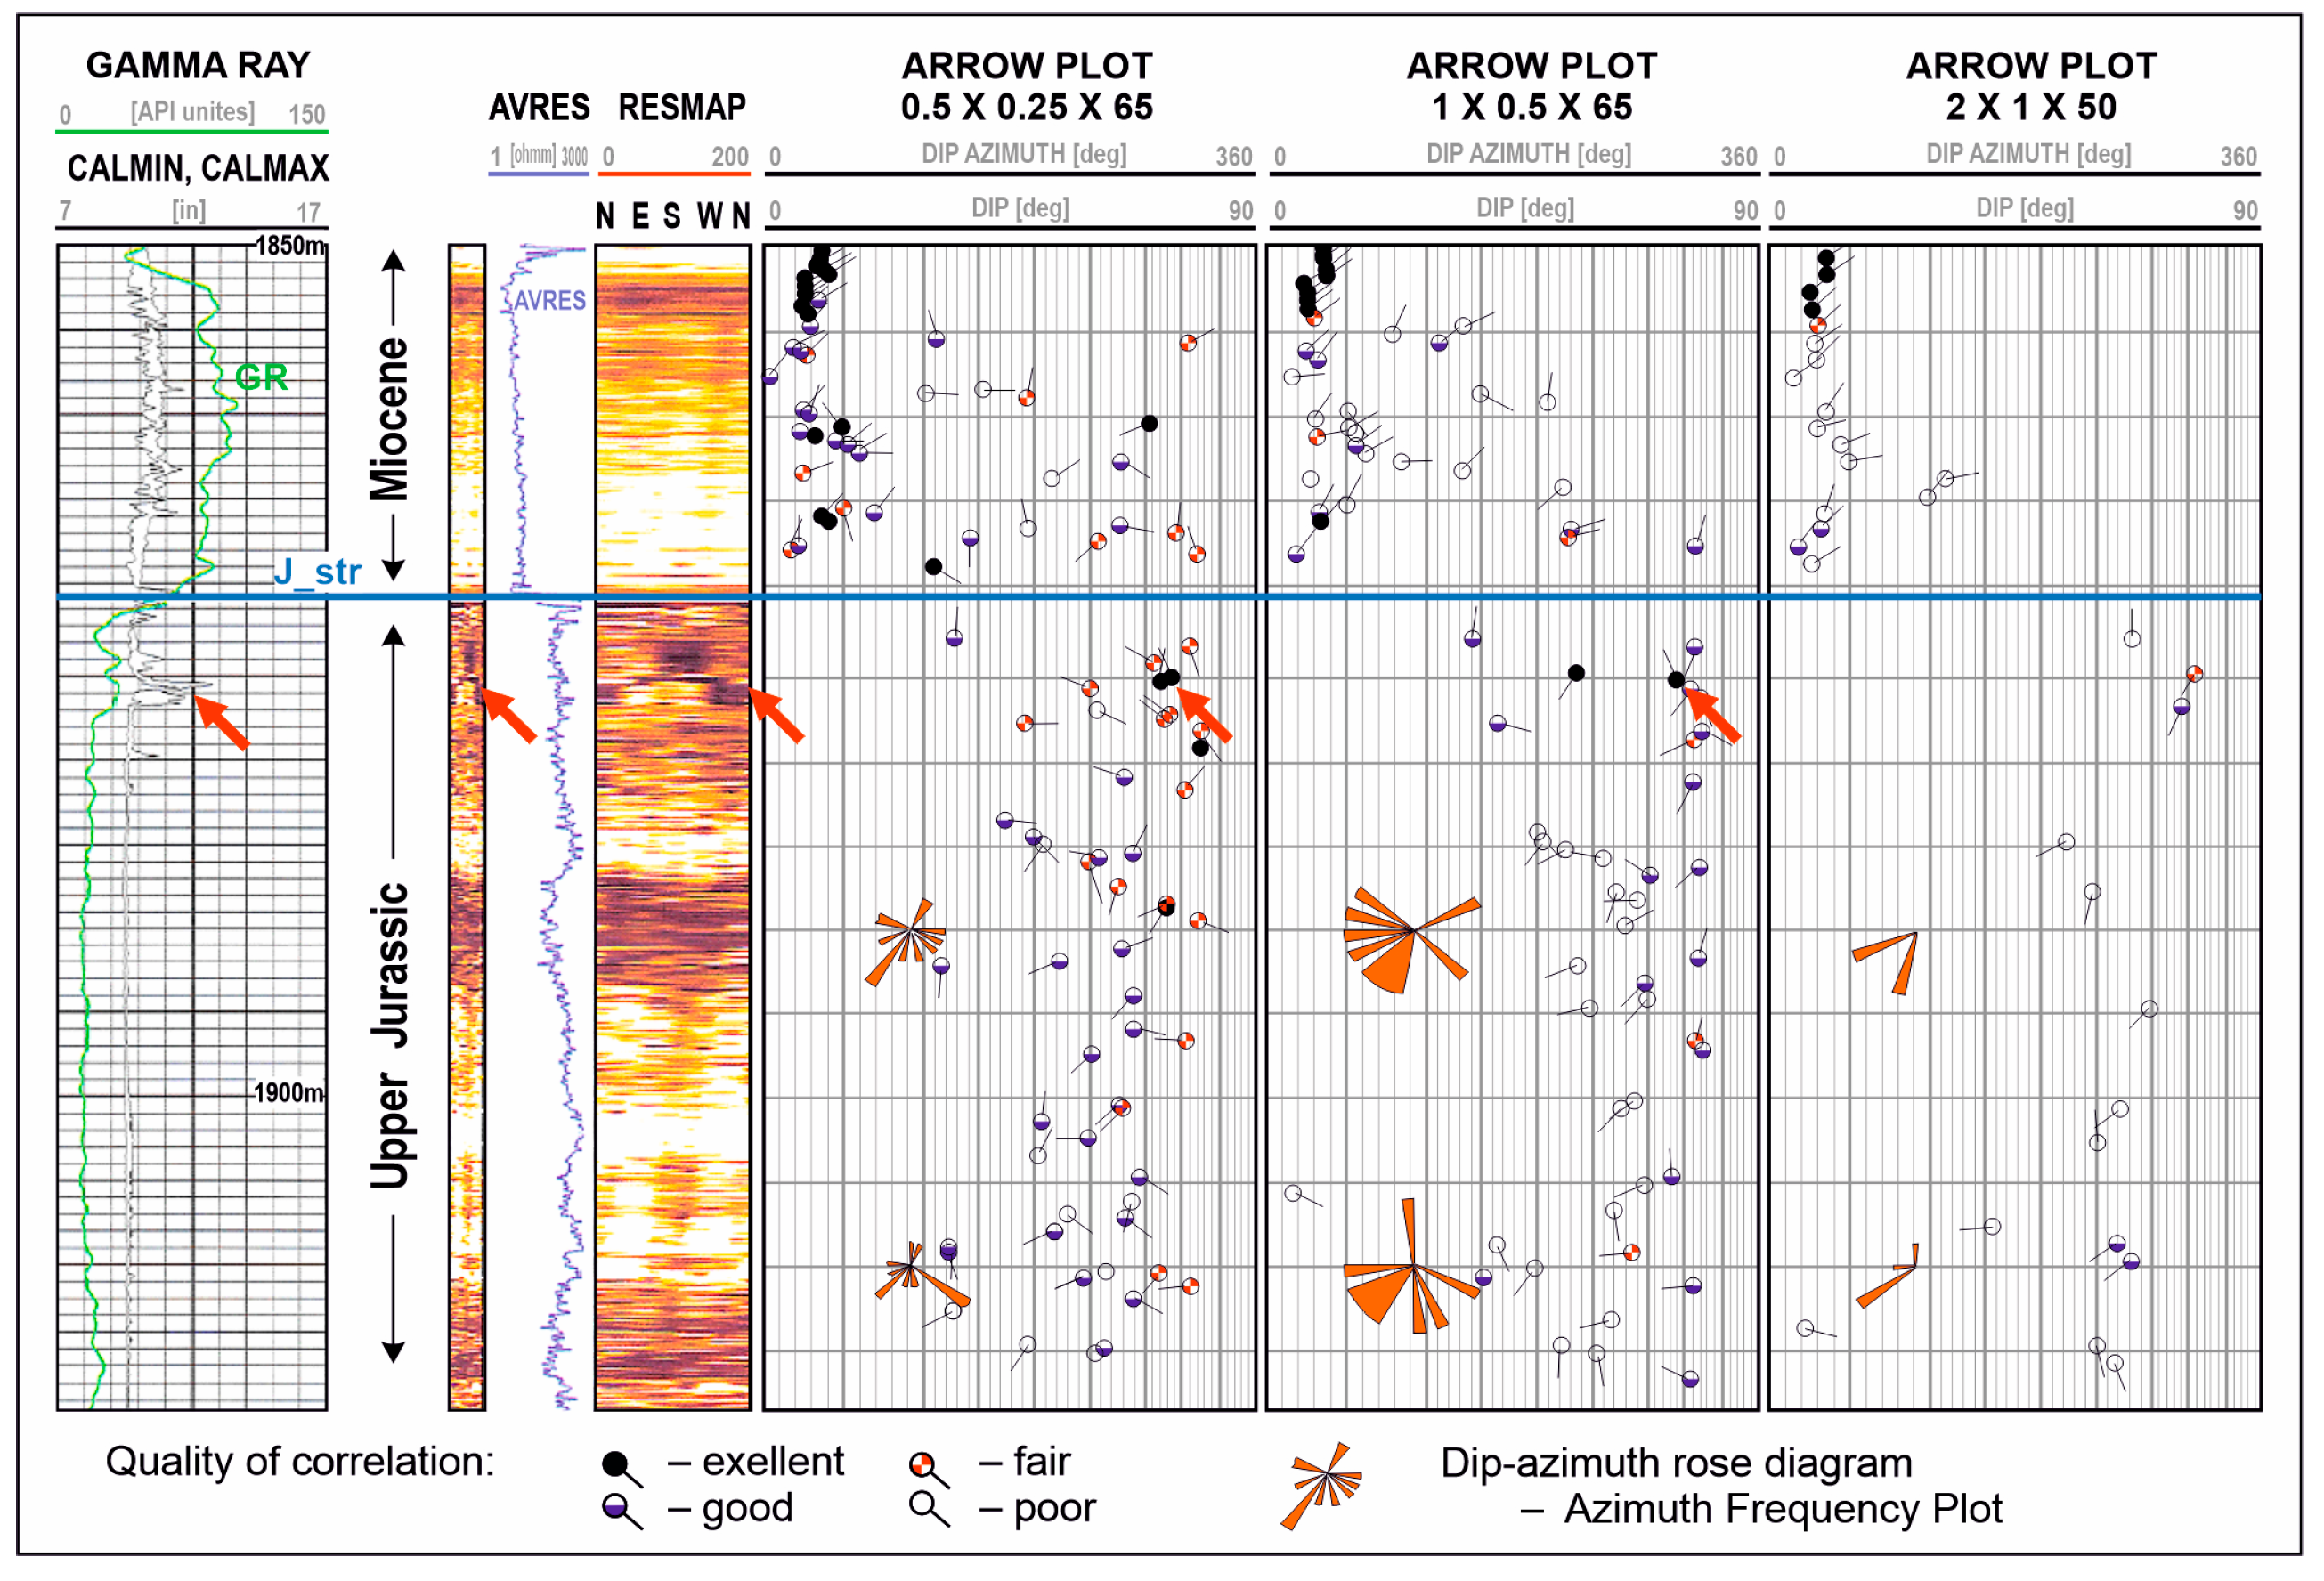
The resistivity image on the borehole wall (RESMAP) has proved very helpful in identifying karst features. An analysis of the image identified high-angle fractures widened by dissolution, which record as sinusoidal forms with irregular edges that show a clear resistivity contrast to the other carbonate formations. An analysis of the arrow plots of a six-arm dipmeter, allowed for the determination of the fracture parameters, such as the dip and azimuth (Figure 4). At the same time, a clear widening of the diameter in these zones can be observed on the diameter profiles.
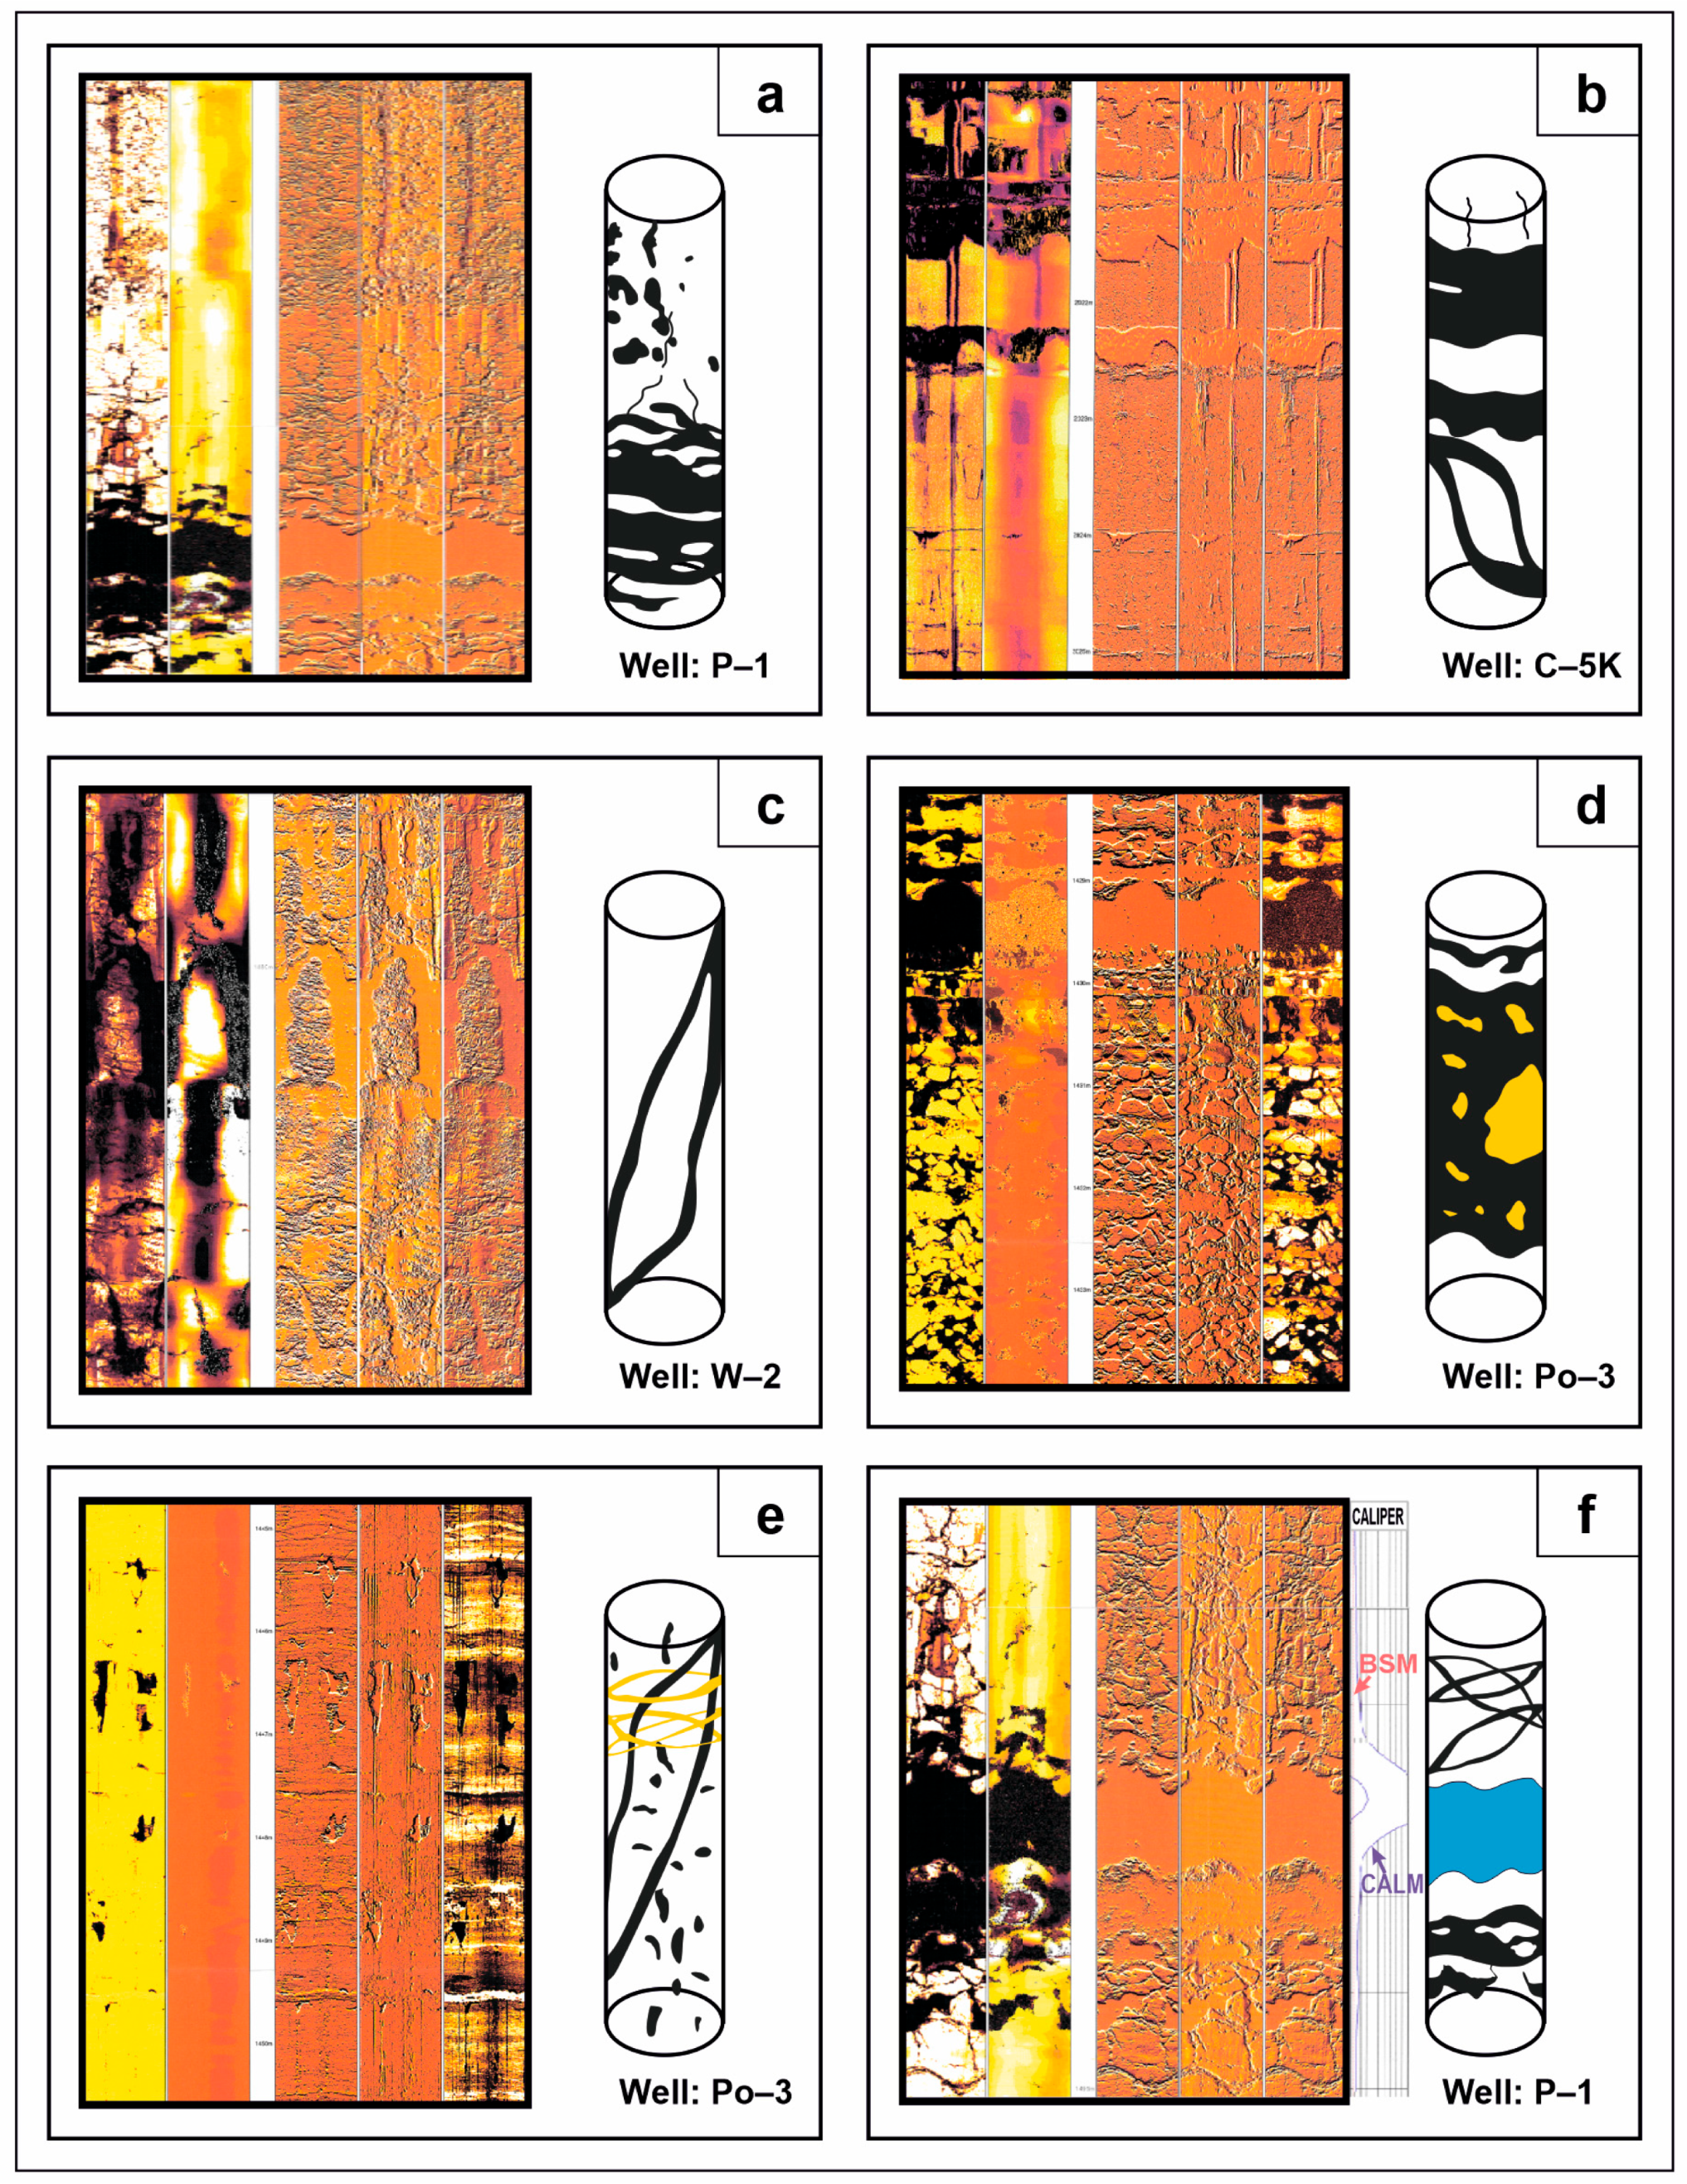
The high-resolution borehole measurements, such as the CAST and XRMI, provided the most information on the karst formation features in the carbonate rocks analyzed. The CAST acoustic probe measurements were taken in five of the boreholes analyzed (C-2, C-5K, P-1, Po-3 and W-2), while the XRMI measurements were taken only in borehole A-1. The probes provide a complete image of the borehole walls, delivering highly detailed and extensive geological information on the structural and lithological development of the drilled rocks. Furthermore, the selection of an appropriate color palette allows for specific features of the rock complex to be highlighted, including a more accurate depiction of the various paleokarst forms. A detailed interpretation of the CAST and XRMI images available in the boreholes allowed for the identification of different types of karst forms, such as caverns, karst breccia filling them and multidirectional fractures, including fractures that have been widened by dissolution (Figure 5). On the basis of the analysis of these images, it was also possible to distinguish the aforementioned paleokarst forms from sedimentary, erosional or deformational structures, as well as from features resulting from tectonic processes, such as fault planes or micro-folds. In addition, an analysis of the CAST and XRMI images allowed for the nature of the filling of caverns and fractures with low-resistivity material (usually clay or marginal clay) to be determined in more detail. It was also possible to identify the chemical cement fillings of cracks and fractures characterized by uniformly high resistivity/acoustics on static XRMI and CAST images. In order to definitively confirm the nature of the mineral filling of cracks and fractures, XRD tests should be performed.
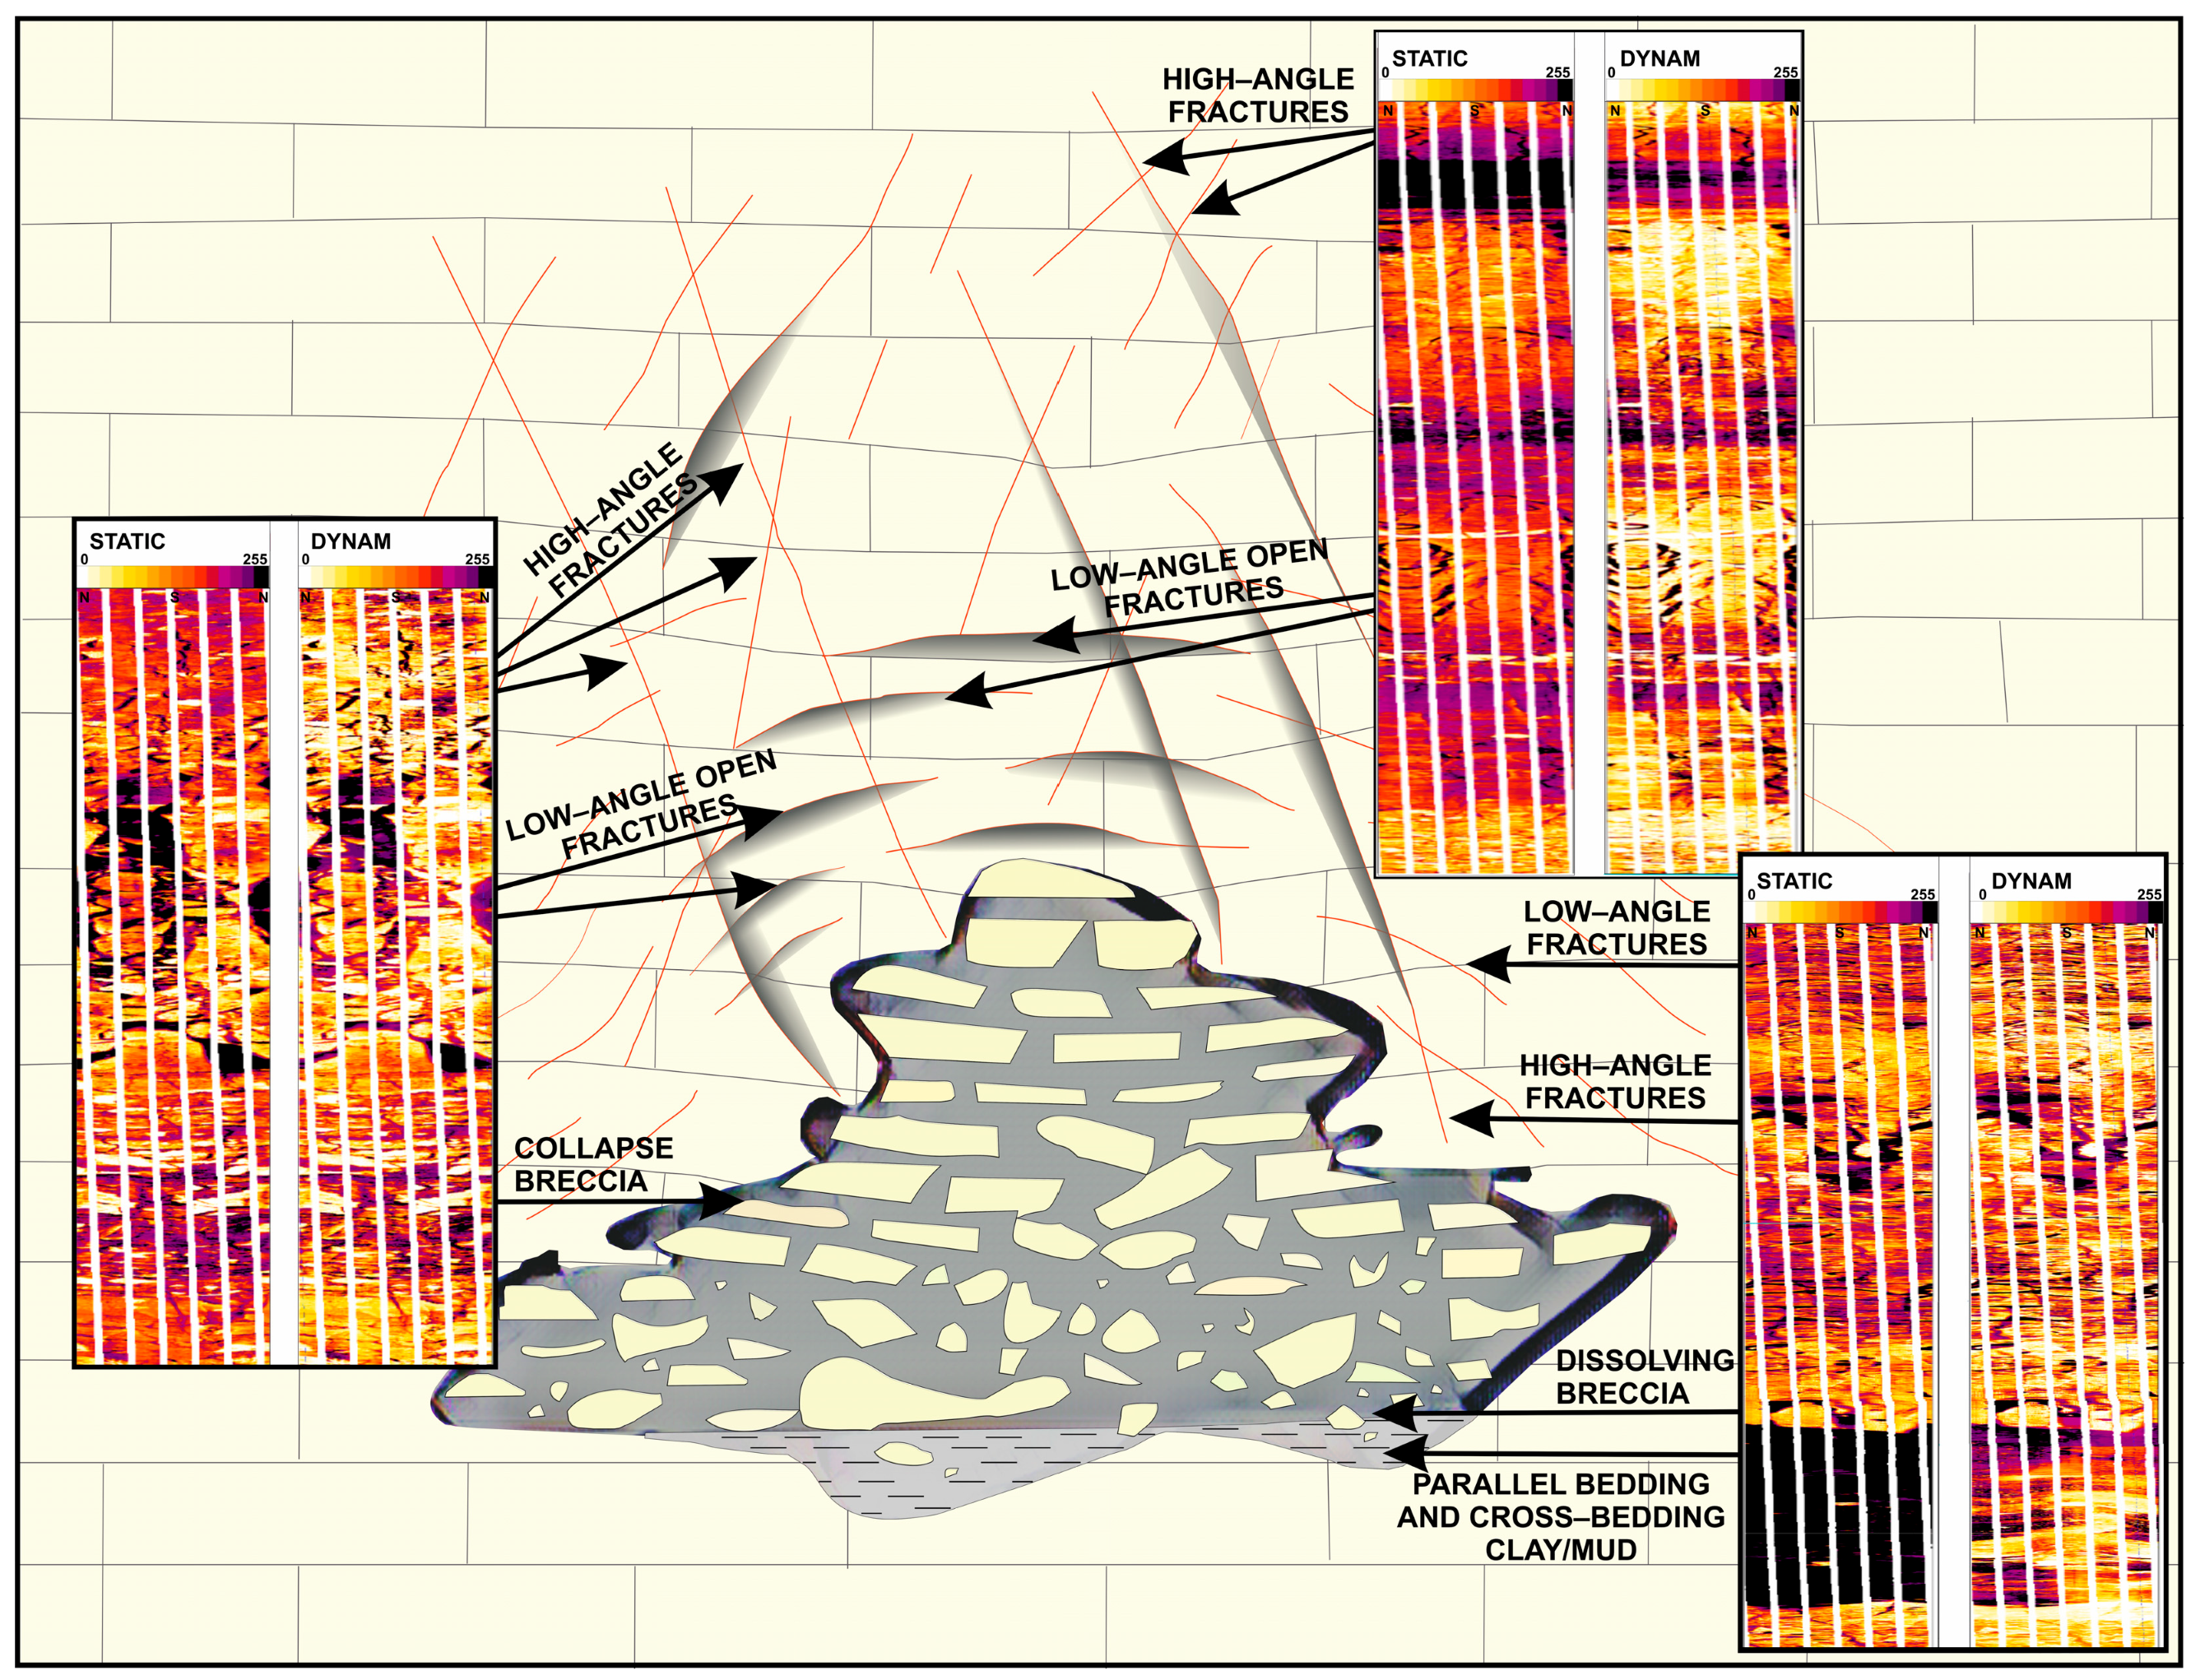
The high-resolution XRMI microresistivity scanner image of the A-1 well allowed for the reconstruction of many details related to the development of the paleokarst, as well as the determination of the fracture parameters (i.e., the angles and dip directions) resulting from the karst processes. In the zone mentioned above, breccia (both fine- and coarse-bedded) was also found, most probably formed by the collapse of the roof of a larger cavern (which could be called a cave), with this layer of breccia being underlain by a layer of laminated fine clastic (clayey) sediments (Figure 6). The fine clastic sediments in this case can be interpreted as secondary cave sediments deposited by suspension. Above the mentioned breccia, a dense network of multidirectional fractures and cracks, both low angle and high angle, can be observed in the XRMI image, among which it is possible to distinguish fractures filled with low-resistivity material (most likely clay) or cemented with high-resistivity material (presumably calcite). It is worth mentioning that locally, in addition to calcite cements, anhydrite cements have also been found in Jurassic formations (based on an analysis of core material), mainly present within Jurassic organic buildups [36,37]. Among the fractures described above, a large group are fractures widened by dissolution processes. The analysis of the vertical succession of the different types of karst structures, based on the interpretation of the XRMI image from the A-1 well, shows a fairly typical trend that correlates well with the models of buried paleocaves presented in the works of Loucks et al. [31] and Yang et al. [32] (Figure 6).

3.2. Seismic Data Analysis

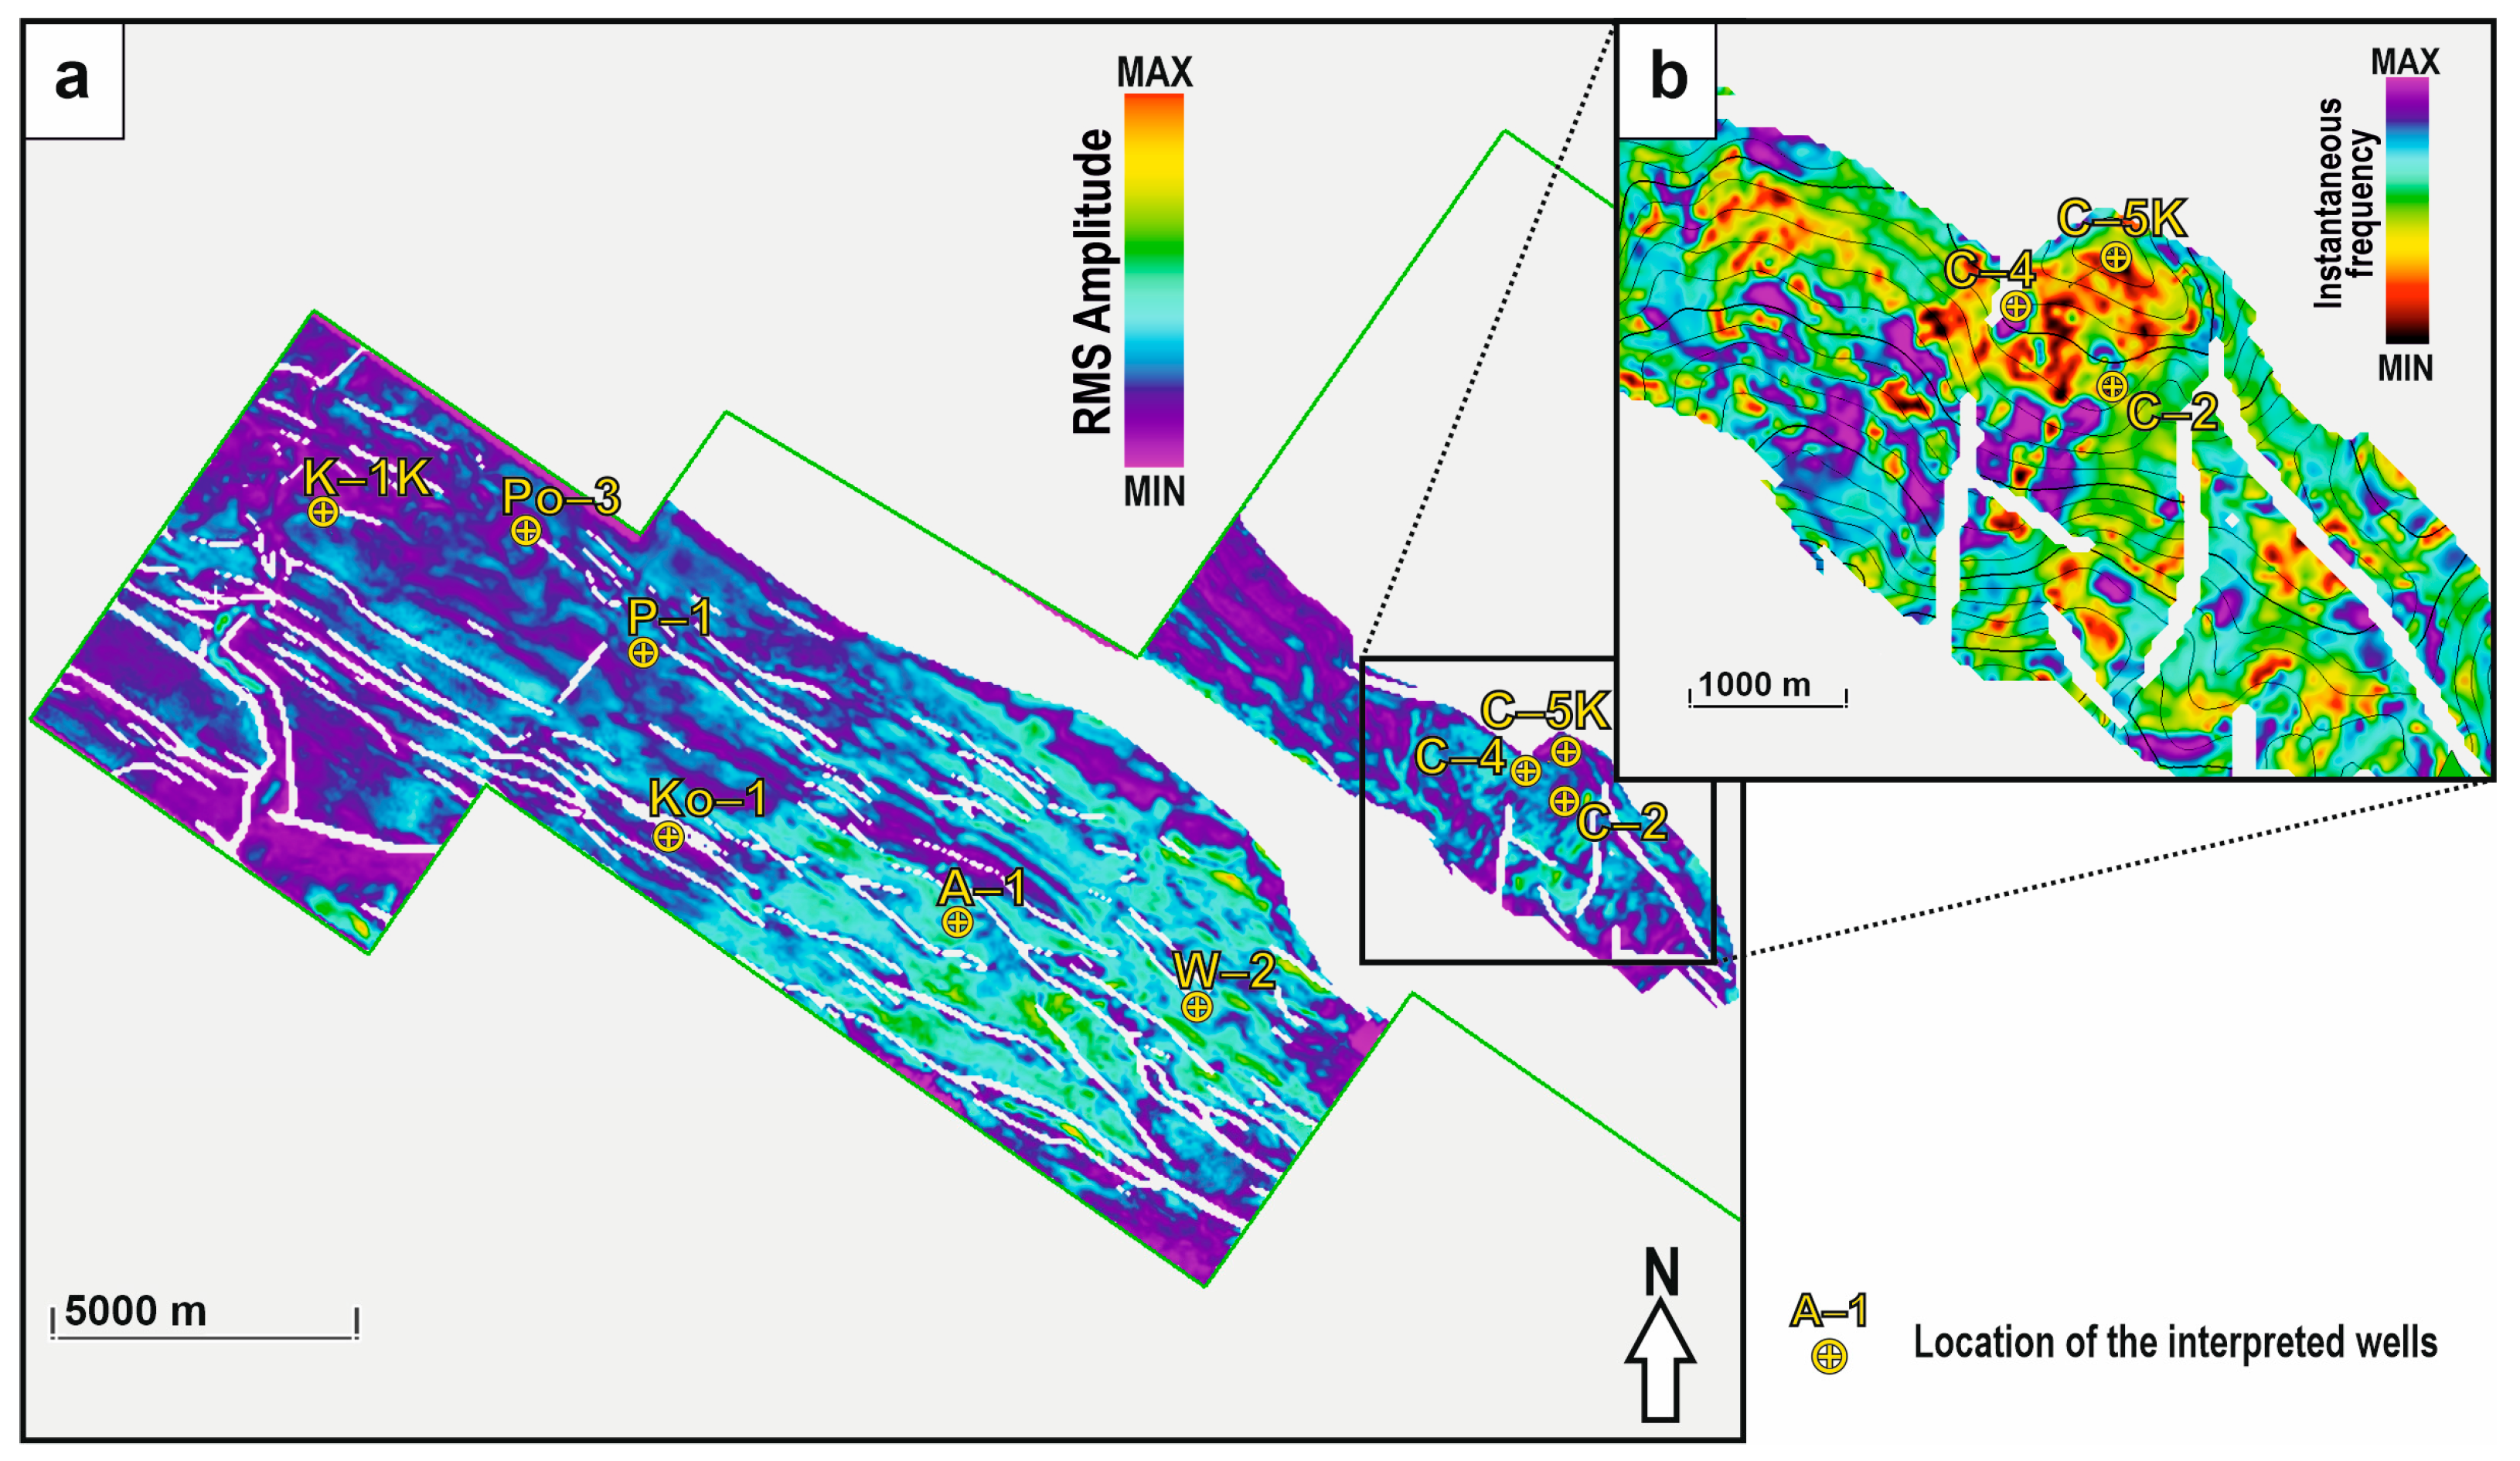
The study area is characterized by the presence of Miocene evaporates, mostly lying in profile generally no more than 20 m above the Upper Jurassic and Lower Cretaceous carbonate formations, as well as the local presence of a very dense network of reactivated faults. In the analyzed 3D seismic survey I, the influence of the evaporate series is clearly visible on the map of the surface attribute RMS amplitude calculated in the 0–30 ms window below the top of the J3 + K1 horizon (Figure 7a). The seismic record associated with the mentioned evaporate series masks the real character of the upper part of the analyzed carbonate complex, not allowing for its detailed interpretation (the area of borehole A-1, the central part of the study area). Visible amplitude reductions are concentrated in the northwestern part of the analyzed area, where the development of paleokarst forms is most probably related both to the presence of a relatively deep branch of the paleovalley formed in the Paleogene and to the numerous discontinuities developed in carbonate formations. This type of location of larger karst forms, whose occurrence and development are controlled primarily by tectonic faults, is described in publications from areas with well-recognized developed karst forms [6,33].
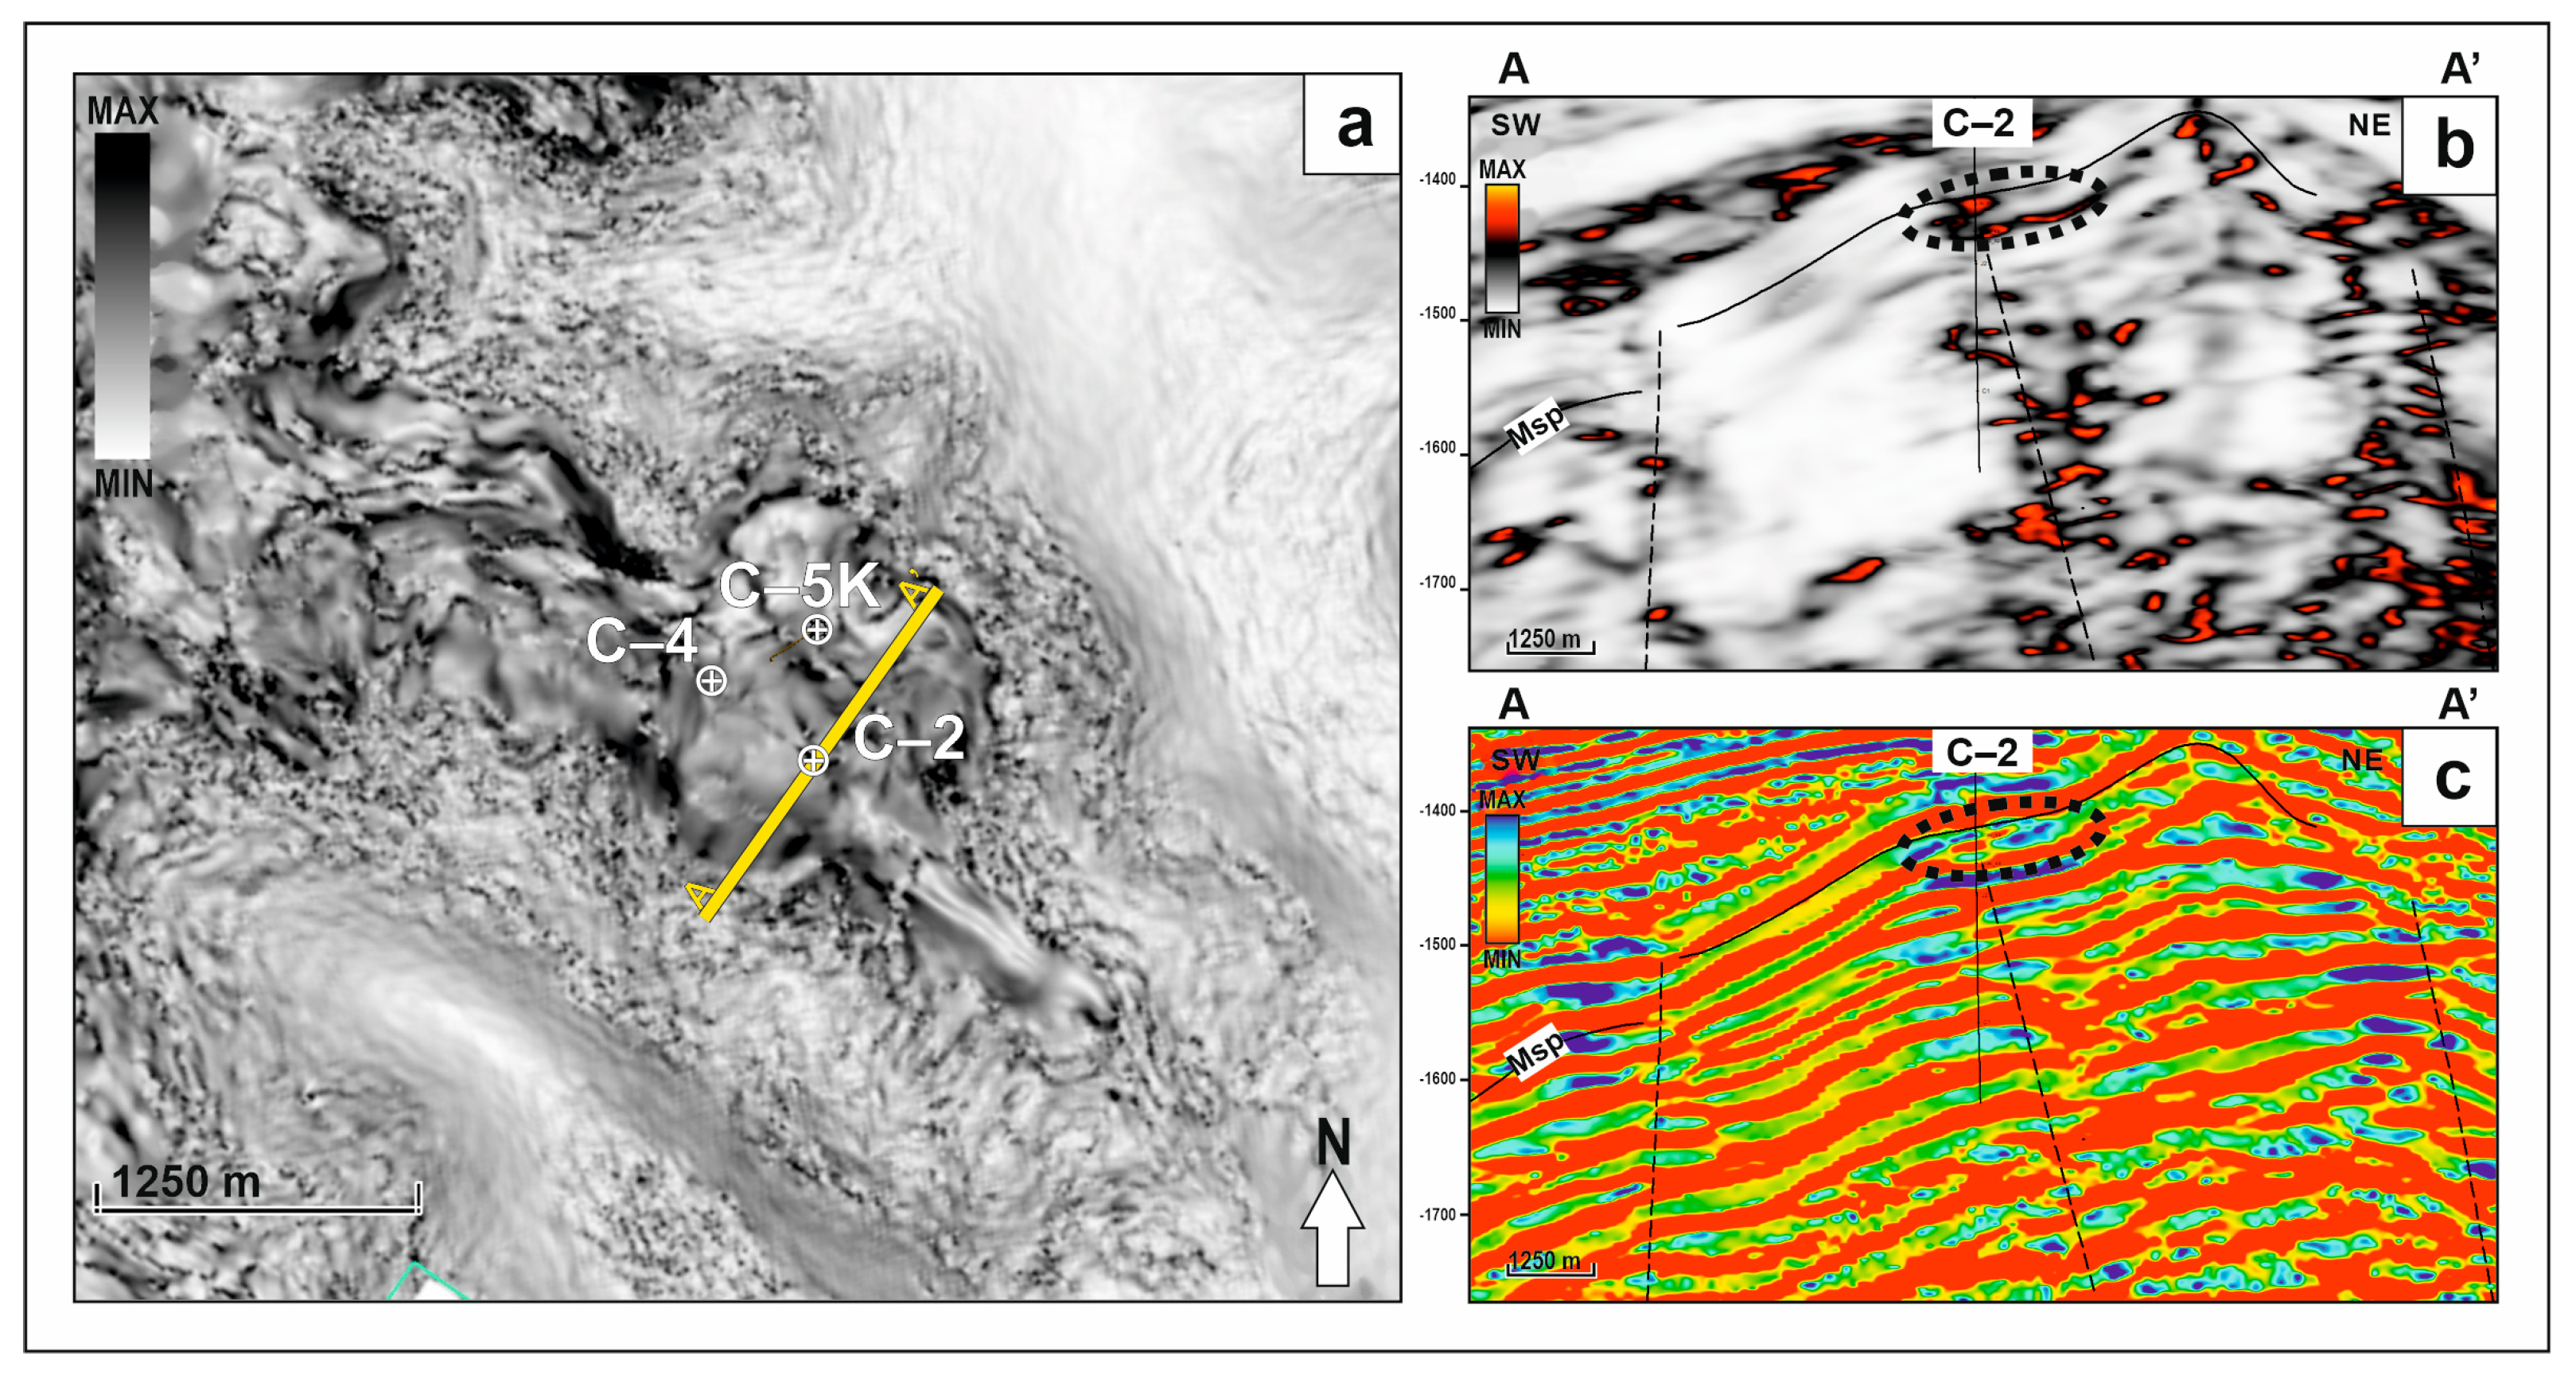
A very good correlation of the analyzed seismic record with the karst intervals determined on the basis of the available borehole data was obtained in the northeastern part of the seismic survey I, in the vicinity of the C-2 and C-5K wells. The surface attribute maps of the RMS amplitude (Figure 7a) and extract value from the instantaneous frequency attribute (Figure 7b), calculated at a time window of 0 to 30 ms below the top of the carbonate formations, show anomalous reductions in the values of these attributes in the vicinity of the boreholes. The observed low values of the instantaneous frequency can be associated with the presence of disturbed, weakened discontinuity zones and buried karst structures, whose non-uniform filling results in the attenuation of higher frequencies. The interpretation of the calculated consistent dip, local dip and chaos attributes indicated locations where zones of low coherence (i.e., chaotic signal recording), observed as anomalously high values of these attributes, can be best associated with the presence of discontinuity zones and faults, as well as karst formations (which corresponds well with the CAST interpretation from the C-2 well) (Figure 8 and Figure 9).
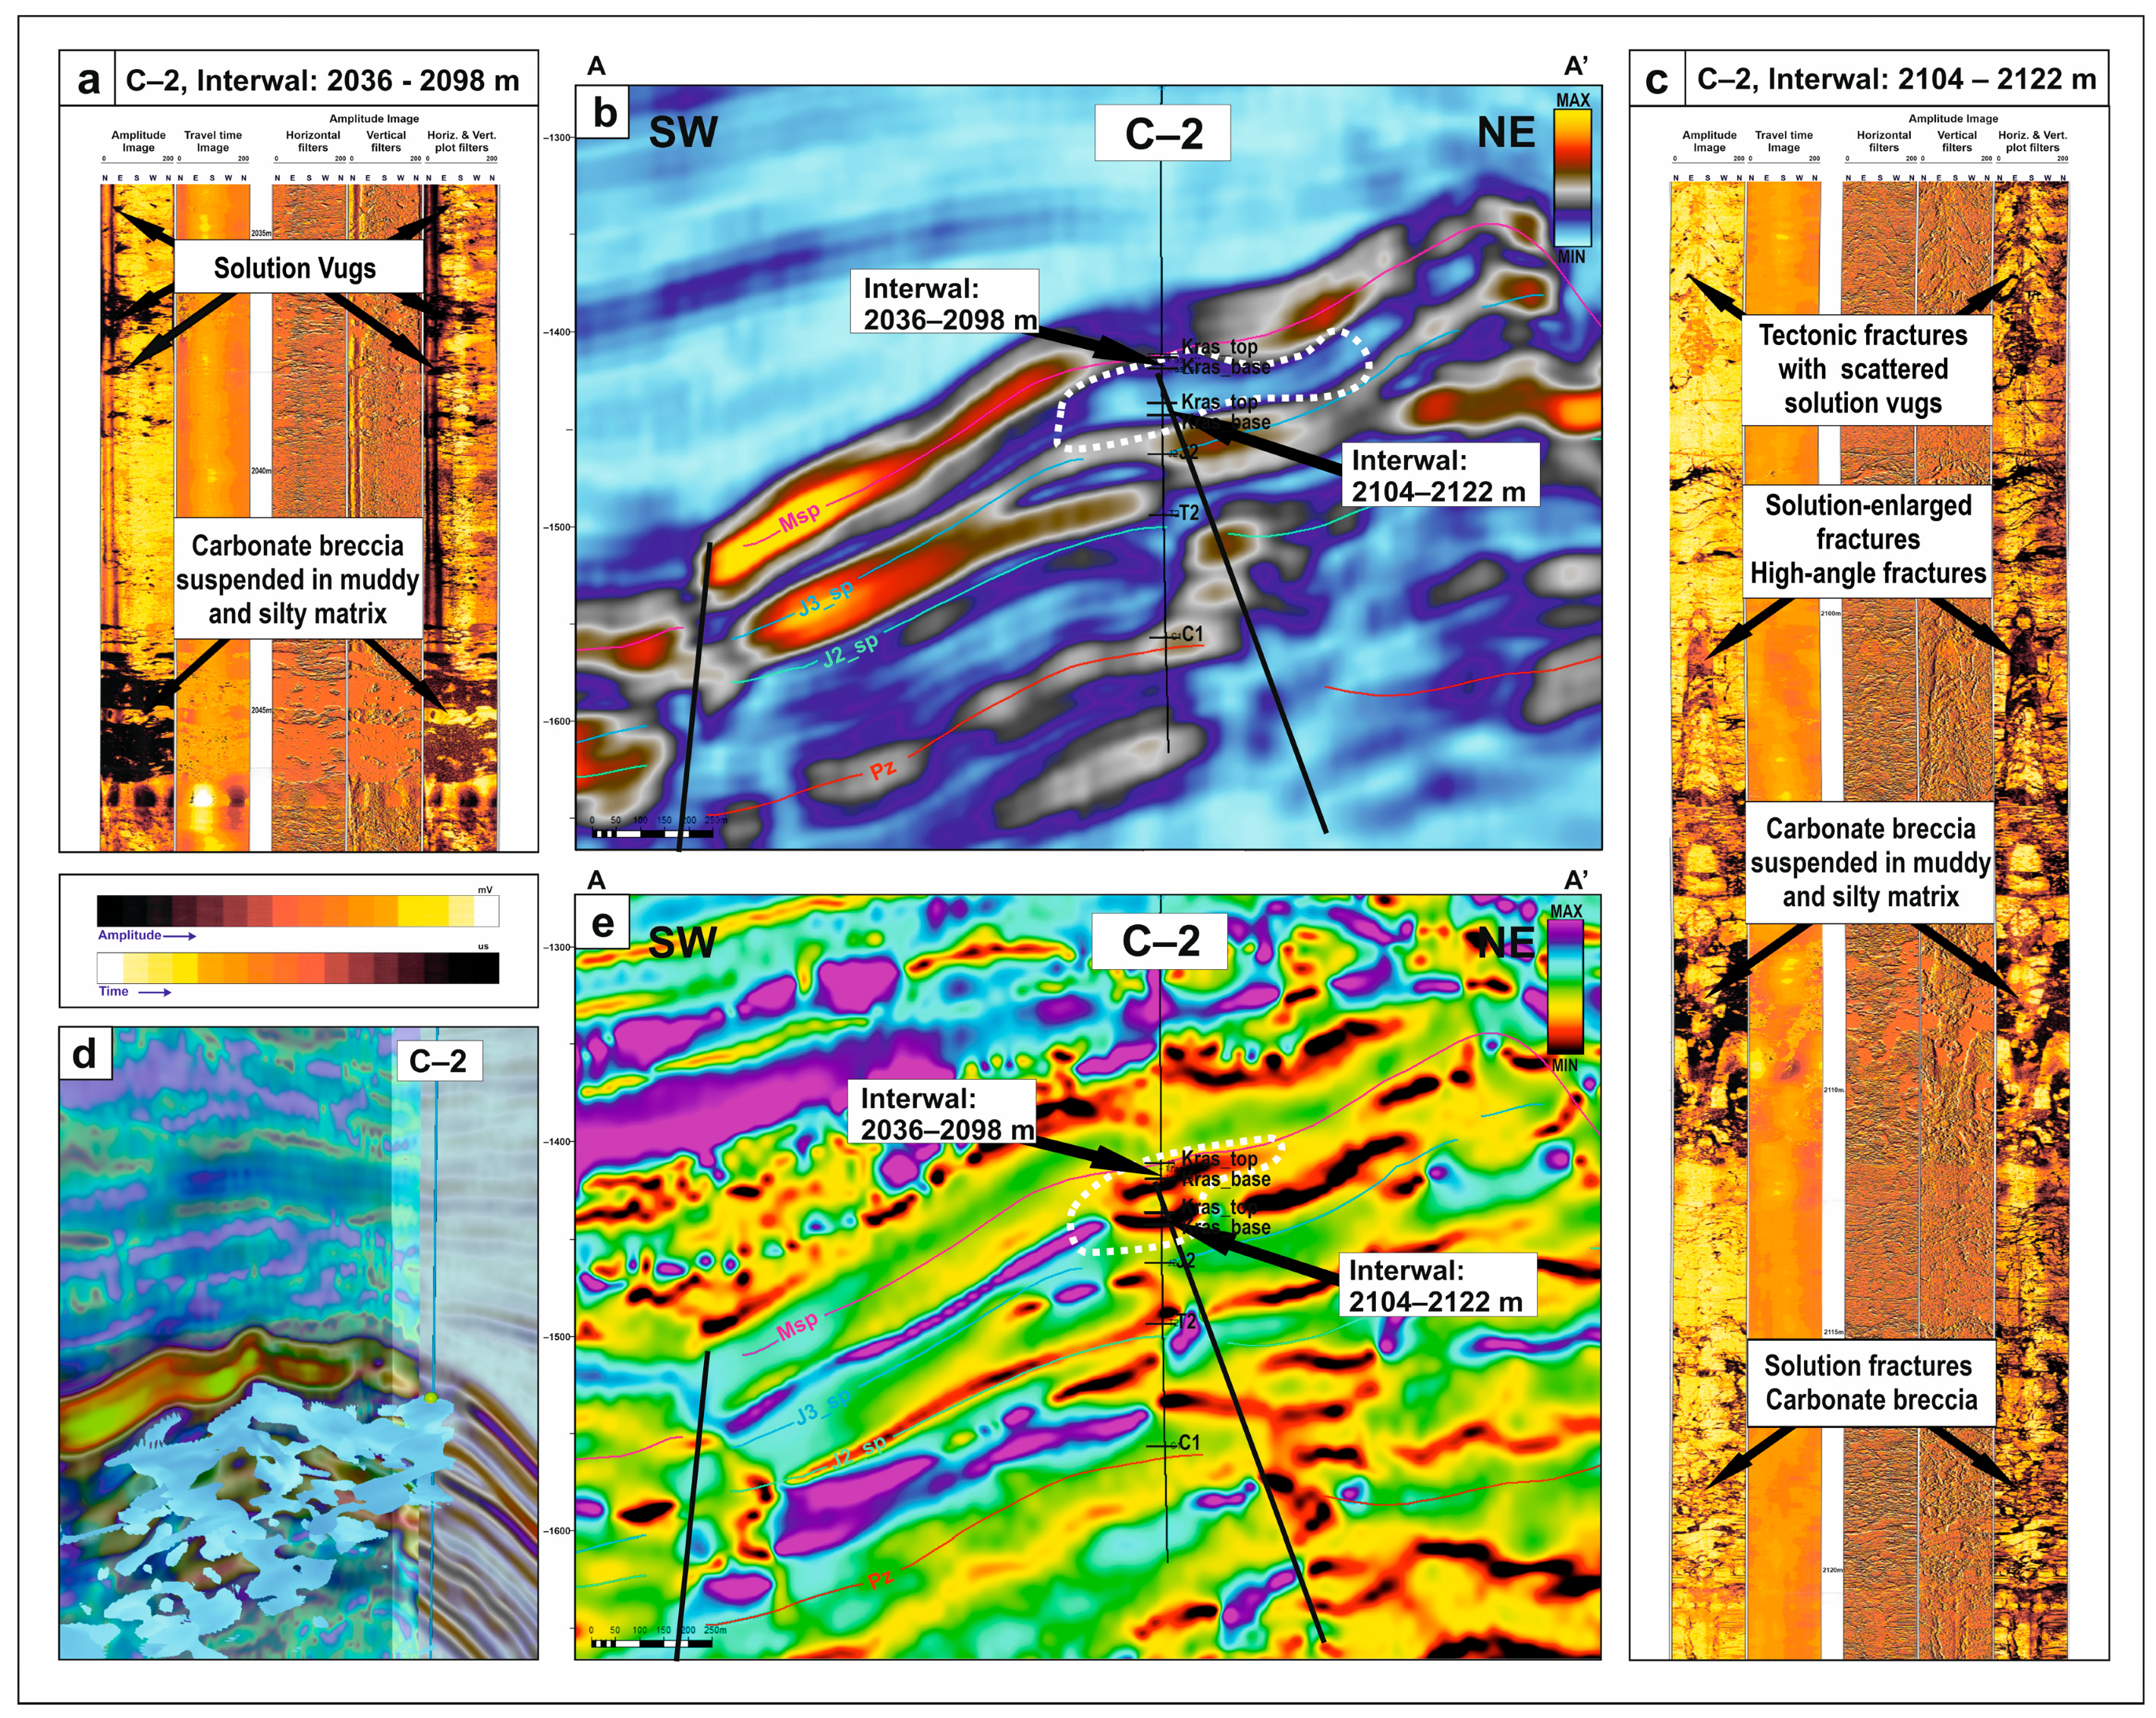
Figure 9 shows the seismic section at the location of borehole C-2 in the mapping of the RMS amplitude and instantaneous frequency attributes, in juxtaposition with the features identified in this borehole, based on the interpretation of the CAST image, related to the development of the paleokarst. Using the Geobody interpretation module, zones characterized by both reduced values of the RMS amplitude and instantaneous frequency attributes were extracted (Figure 9d). The analysis was focused on the close vicinity of borehole C-2. Calculations were made for the time interval from the top surface of the Upper Jurassic and Lower Cretaceous carbonate formations to −100 ms below this surface. In the resulting three-dimensional image, it is possible to interpret the pattern of existing tectonic fractures passing into a system of caverns or paleocaves, formed by the impact of dissolution processes in carbonate rocks.
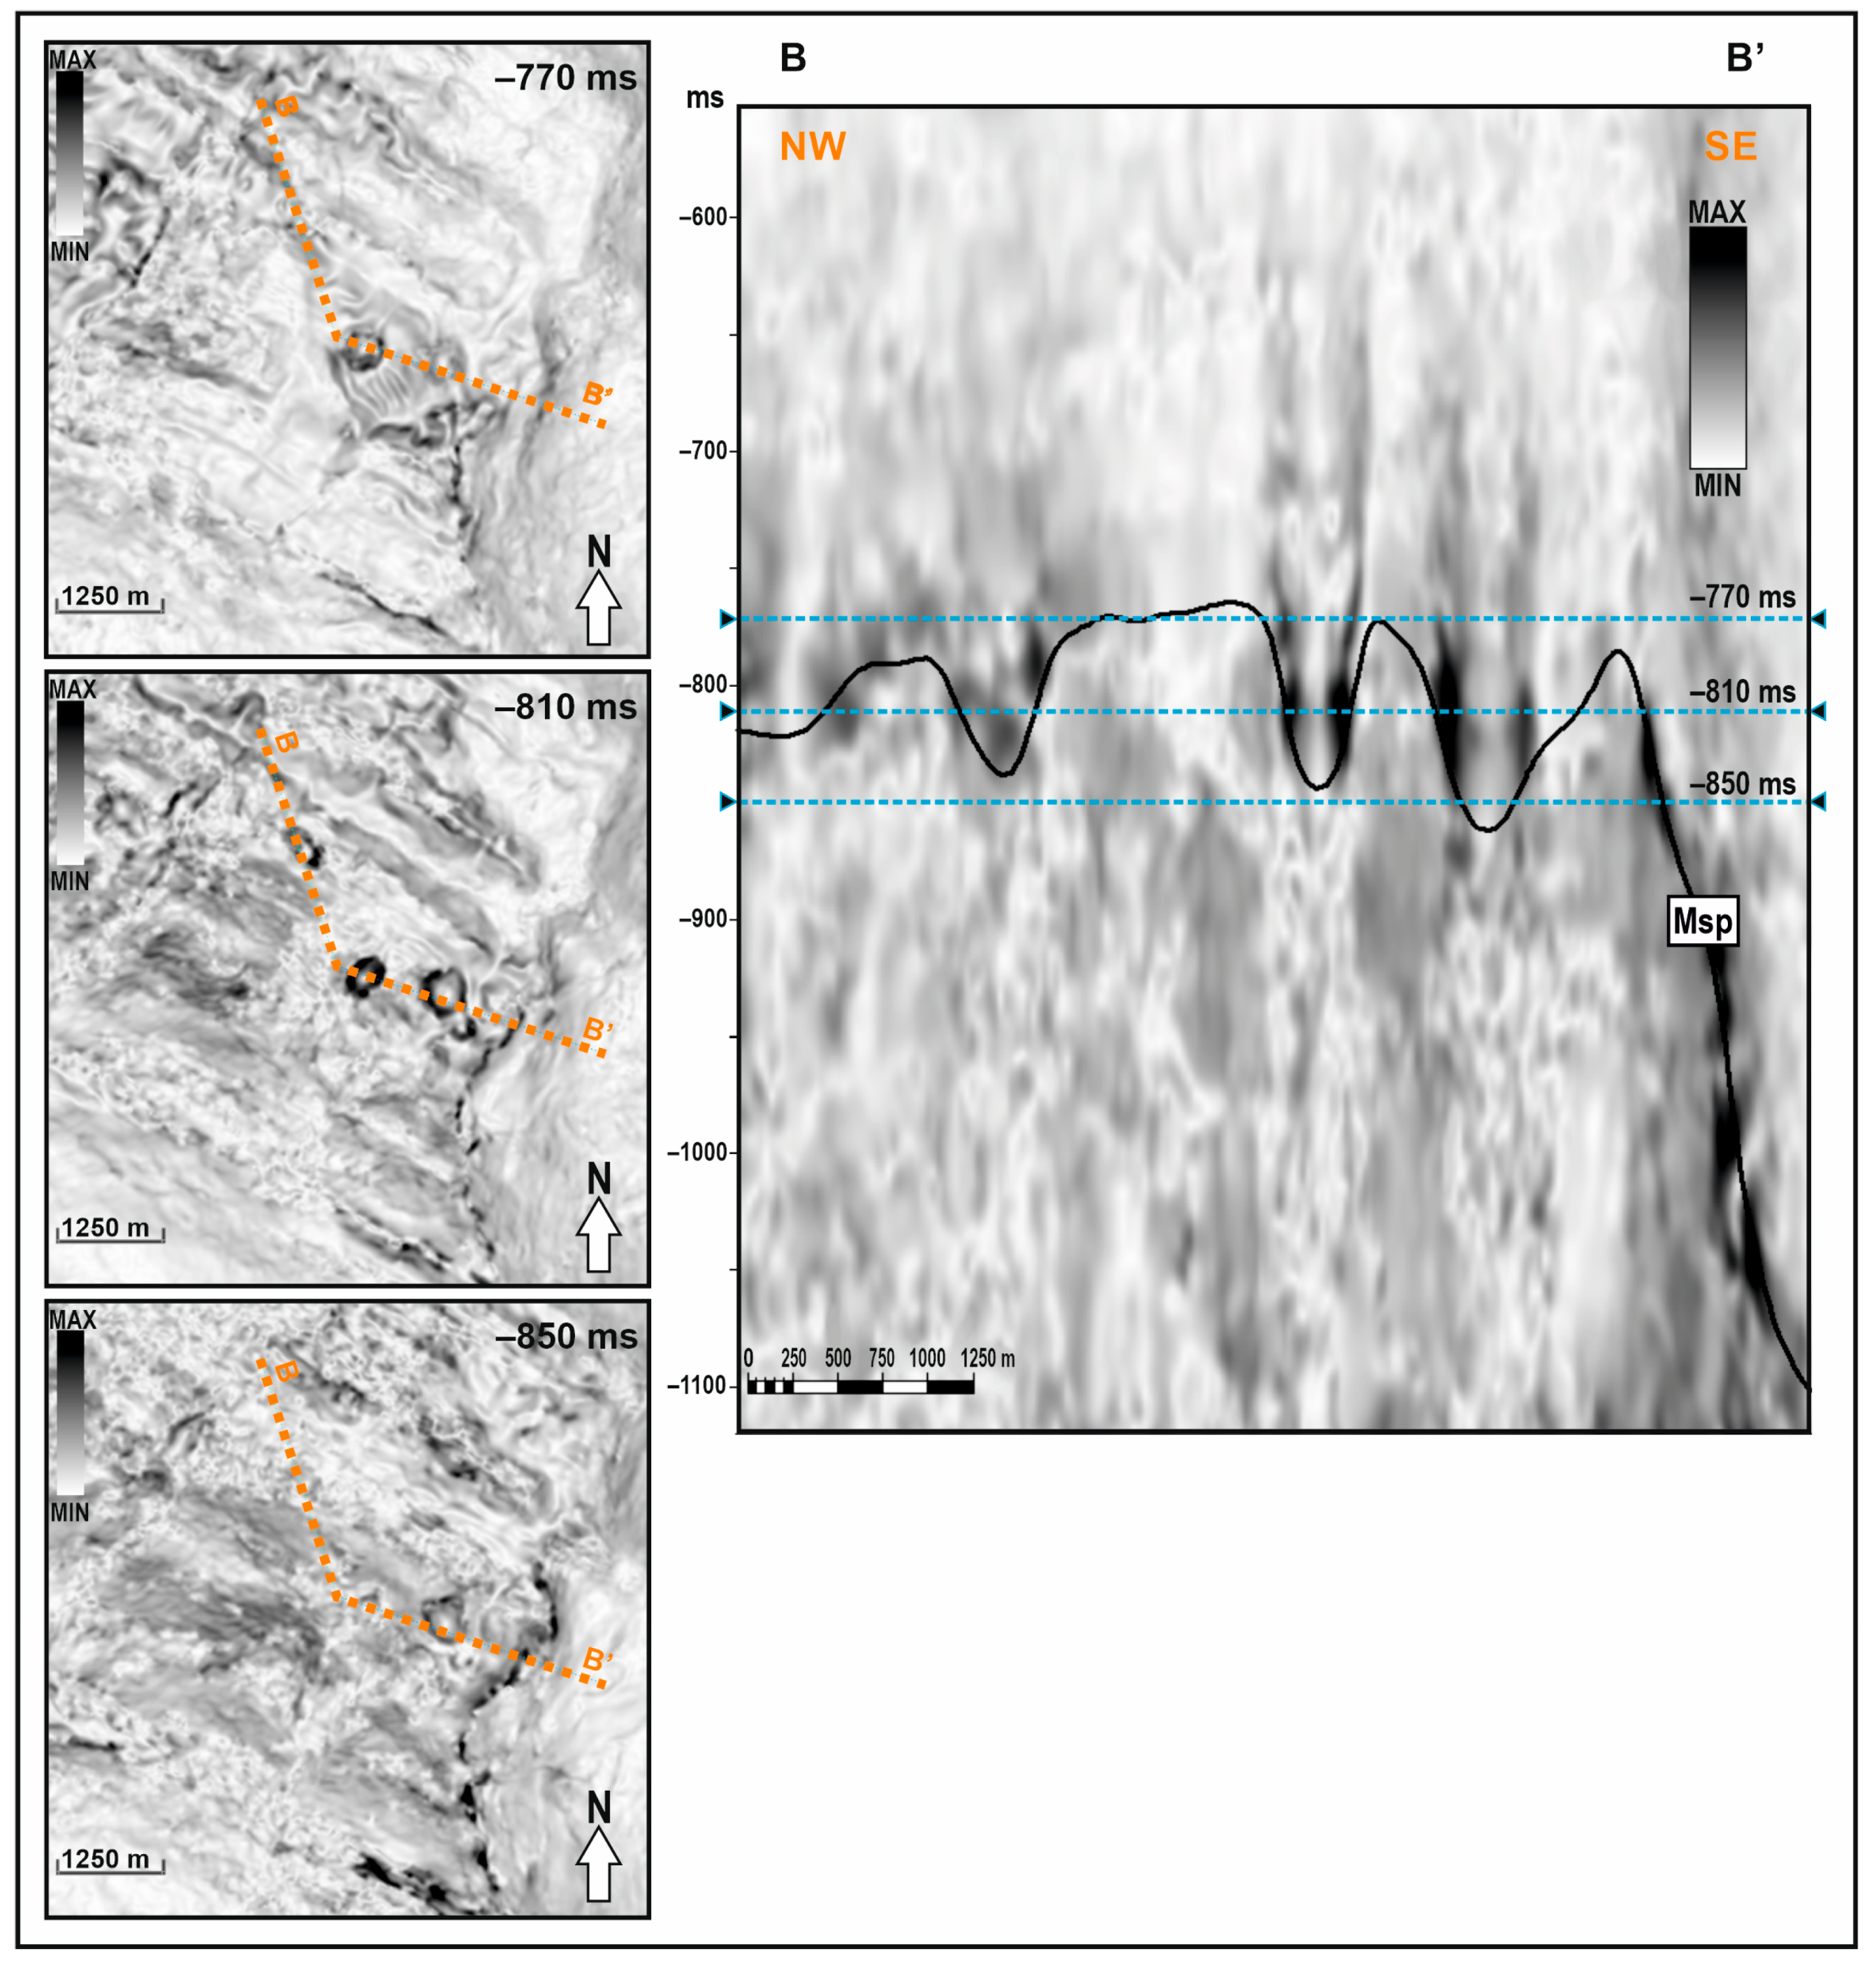
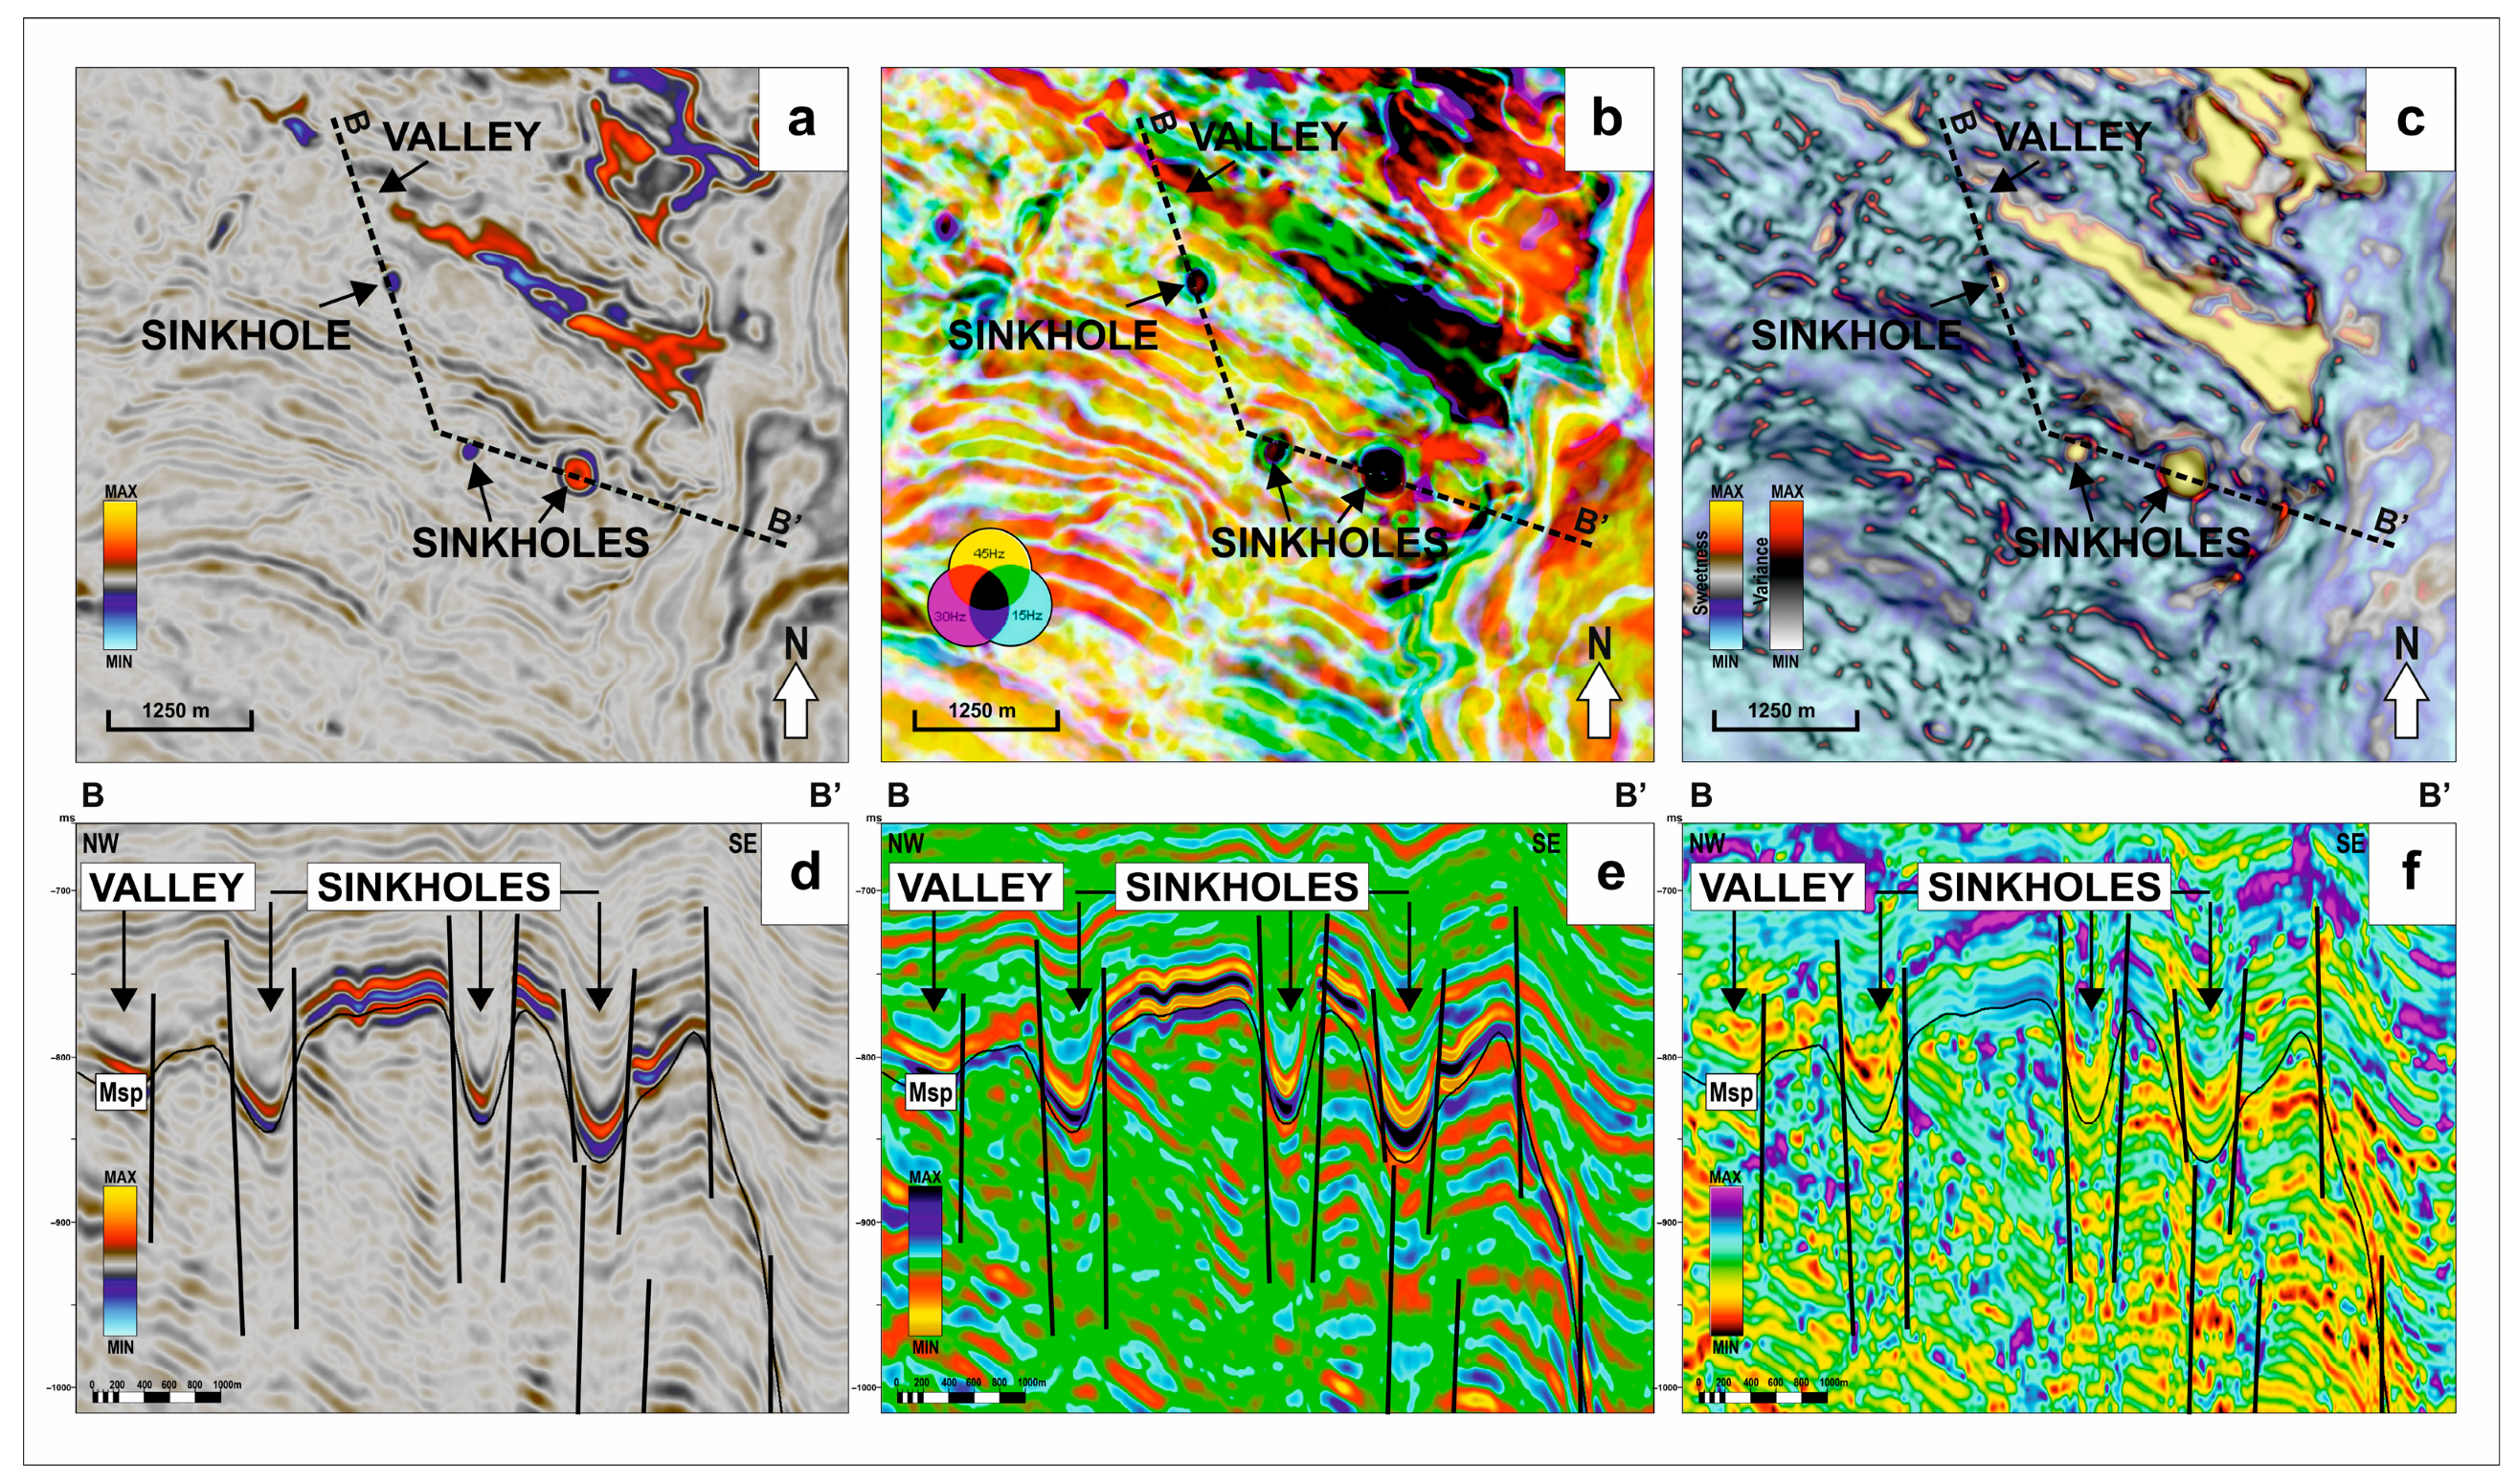
The next 3D seismic survey analyzed is located to the northeast of the area discussed above (Figure 1). The interpreted seismic image shows a well-developed erosional surface in the topmost part of the Mesozoic carbonate complex. Based on the analysis of the seismic attributes, the various karst forms were identified. Figure 10 shows time slices at −770 ms, −810 ms and −850 ms in the consistent dip attribute rendering, with clearly visible closed circles of steeply sloping walls. These forms could be interpreted as karst sinkholes. In areas of visible sinkholes, an anomaly is observed with a very abrupt change in the values of this attribute.
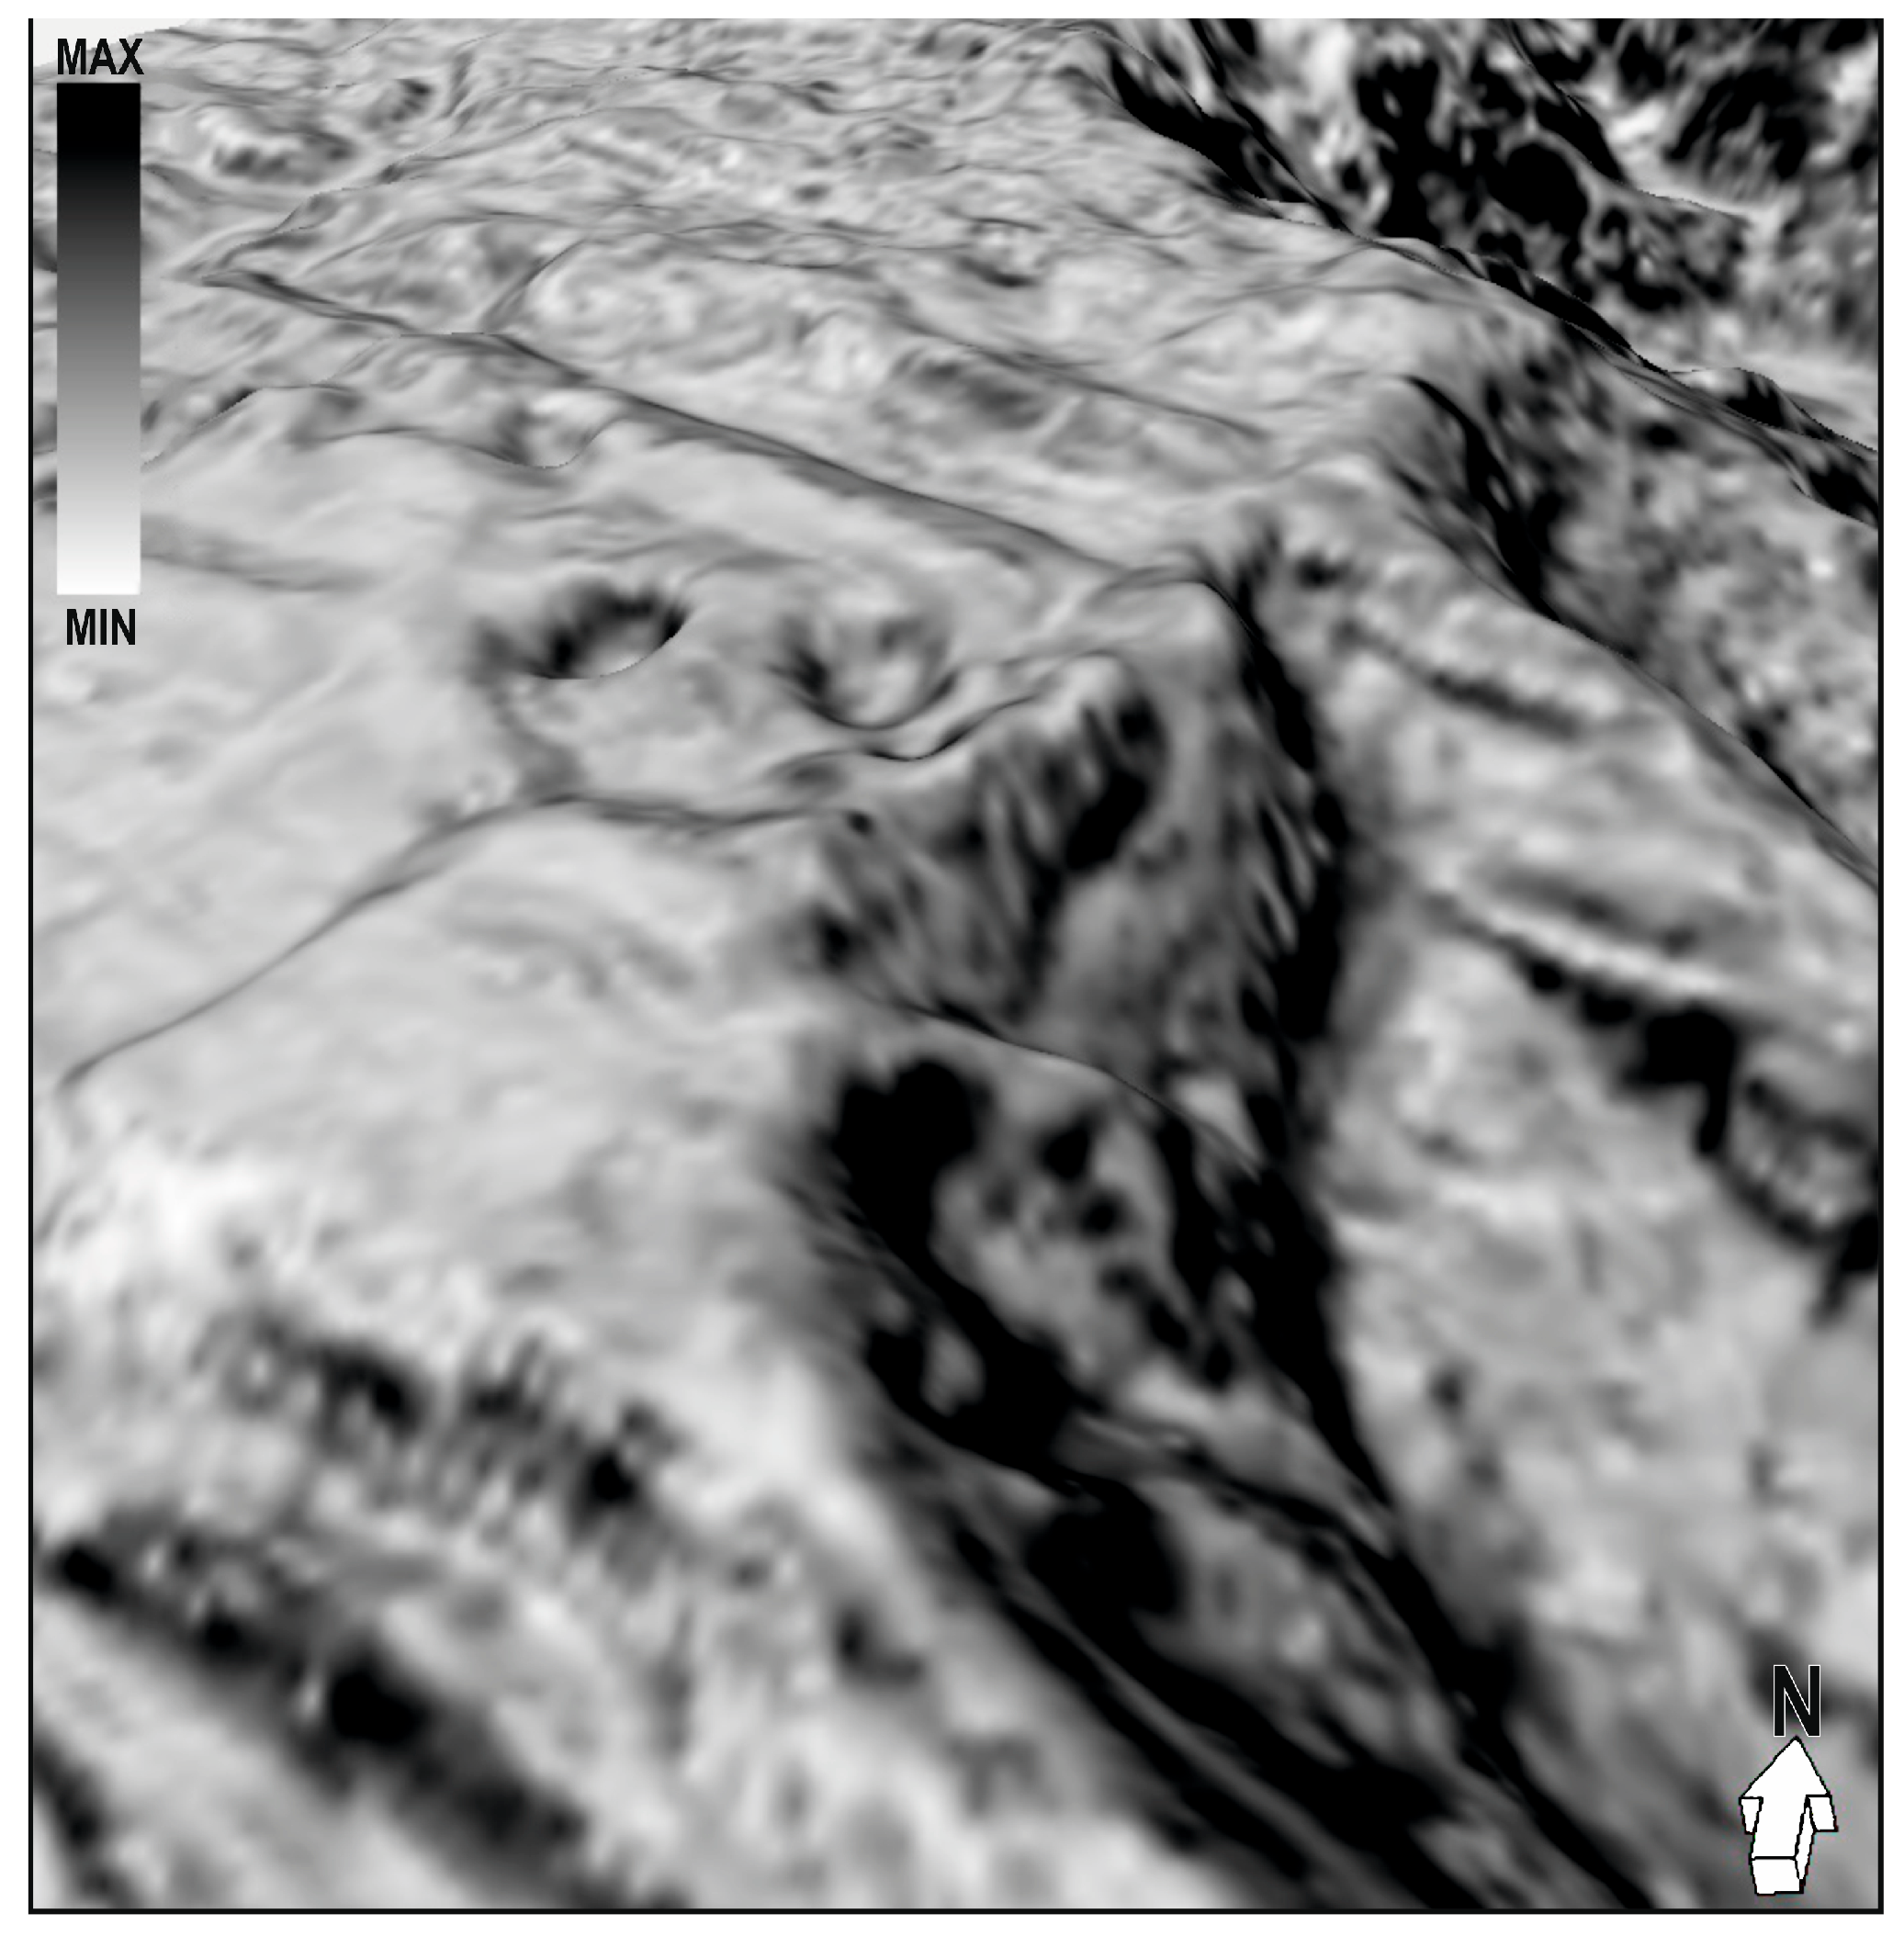
The 3D mapping, using the surface attribute extract value from the consistent dip attribute calculated for the top surface of the Mesozoic carbonate complex (Figure 11), presents a very varied morphological picture with clearly marked faults and a number of other elements, some of which can be interpreted as the effect of karst processes. It can be observed that the largest of the valleys visible within this surface is adjacent to an NW-SE tectonic zone (Figure 12). Figure 12c shows the image at time slice −842 ms for the blended volume attributes variance and sweetness. Increased values of the variance attribute (black to red color) indicate the presence of numerous discontinuity zones and faults. The maximum values of the sweetness attribute (yellow) mark areas that distinguish themselves from the background with much lower frequency and increased values of the envelope attribute. These data allowed for the detailed mapping of the mentioned lowering of the terrain with the character of a small valley. The amplitude (Figure 12d) and the relative acoustic impedance (Figure 12e) records show small but distinct bright spots below the three largest karst sinkholes. The presence of bright spots may indicate that the sinkholes are filled with formations of a much lower impedance (e.g., slumps) or that there are more fractures in these zones. In addition, above the interpreted top surface of the carbonate formations in the location of the karst sinkholes, a reduction in the value of the instantaneous frequency is also noticeable (Figure 12f). It should be noted that the seismic record within the interpreted karst sinkholes is quite different from that within the aforementioned valley, which may indicate that the valley is filled with different sedimentary material.
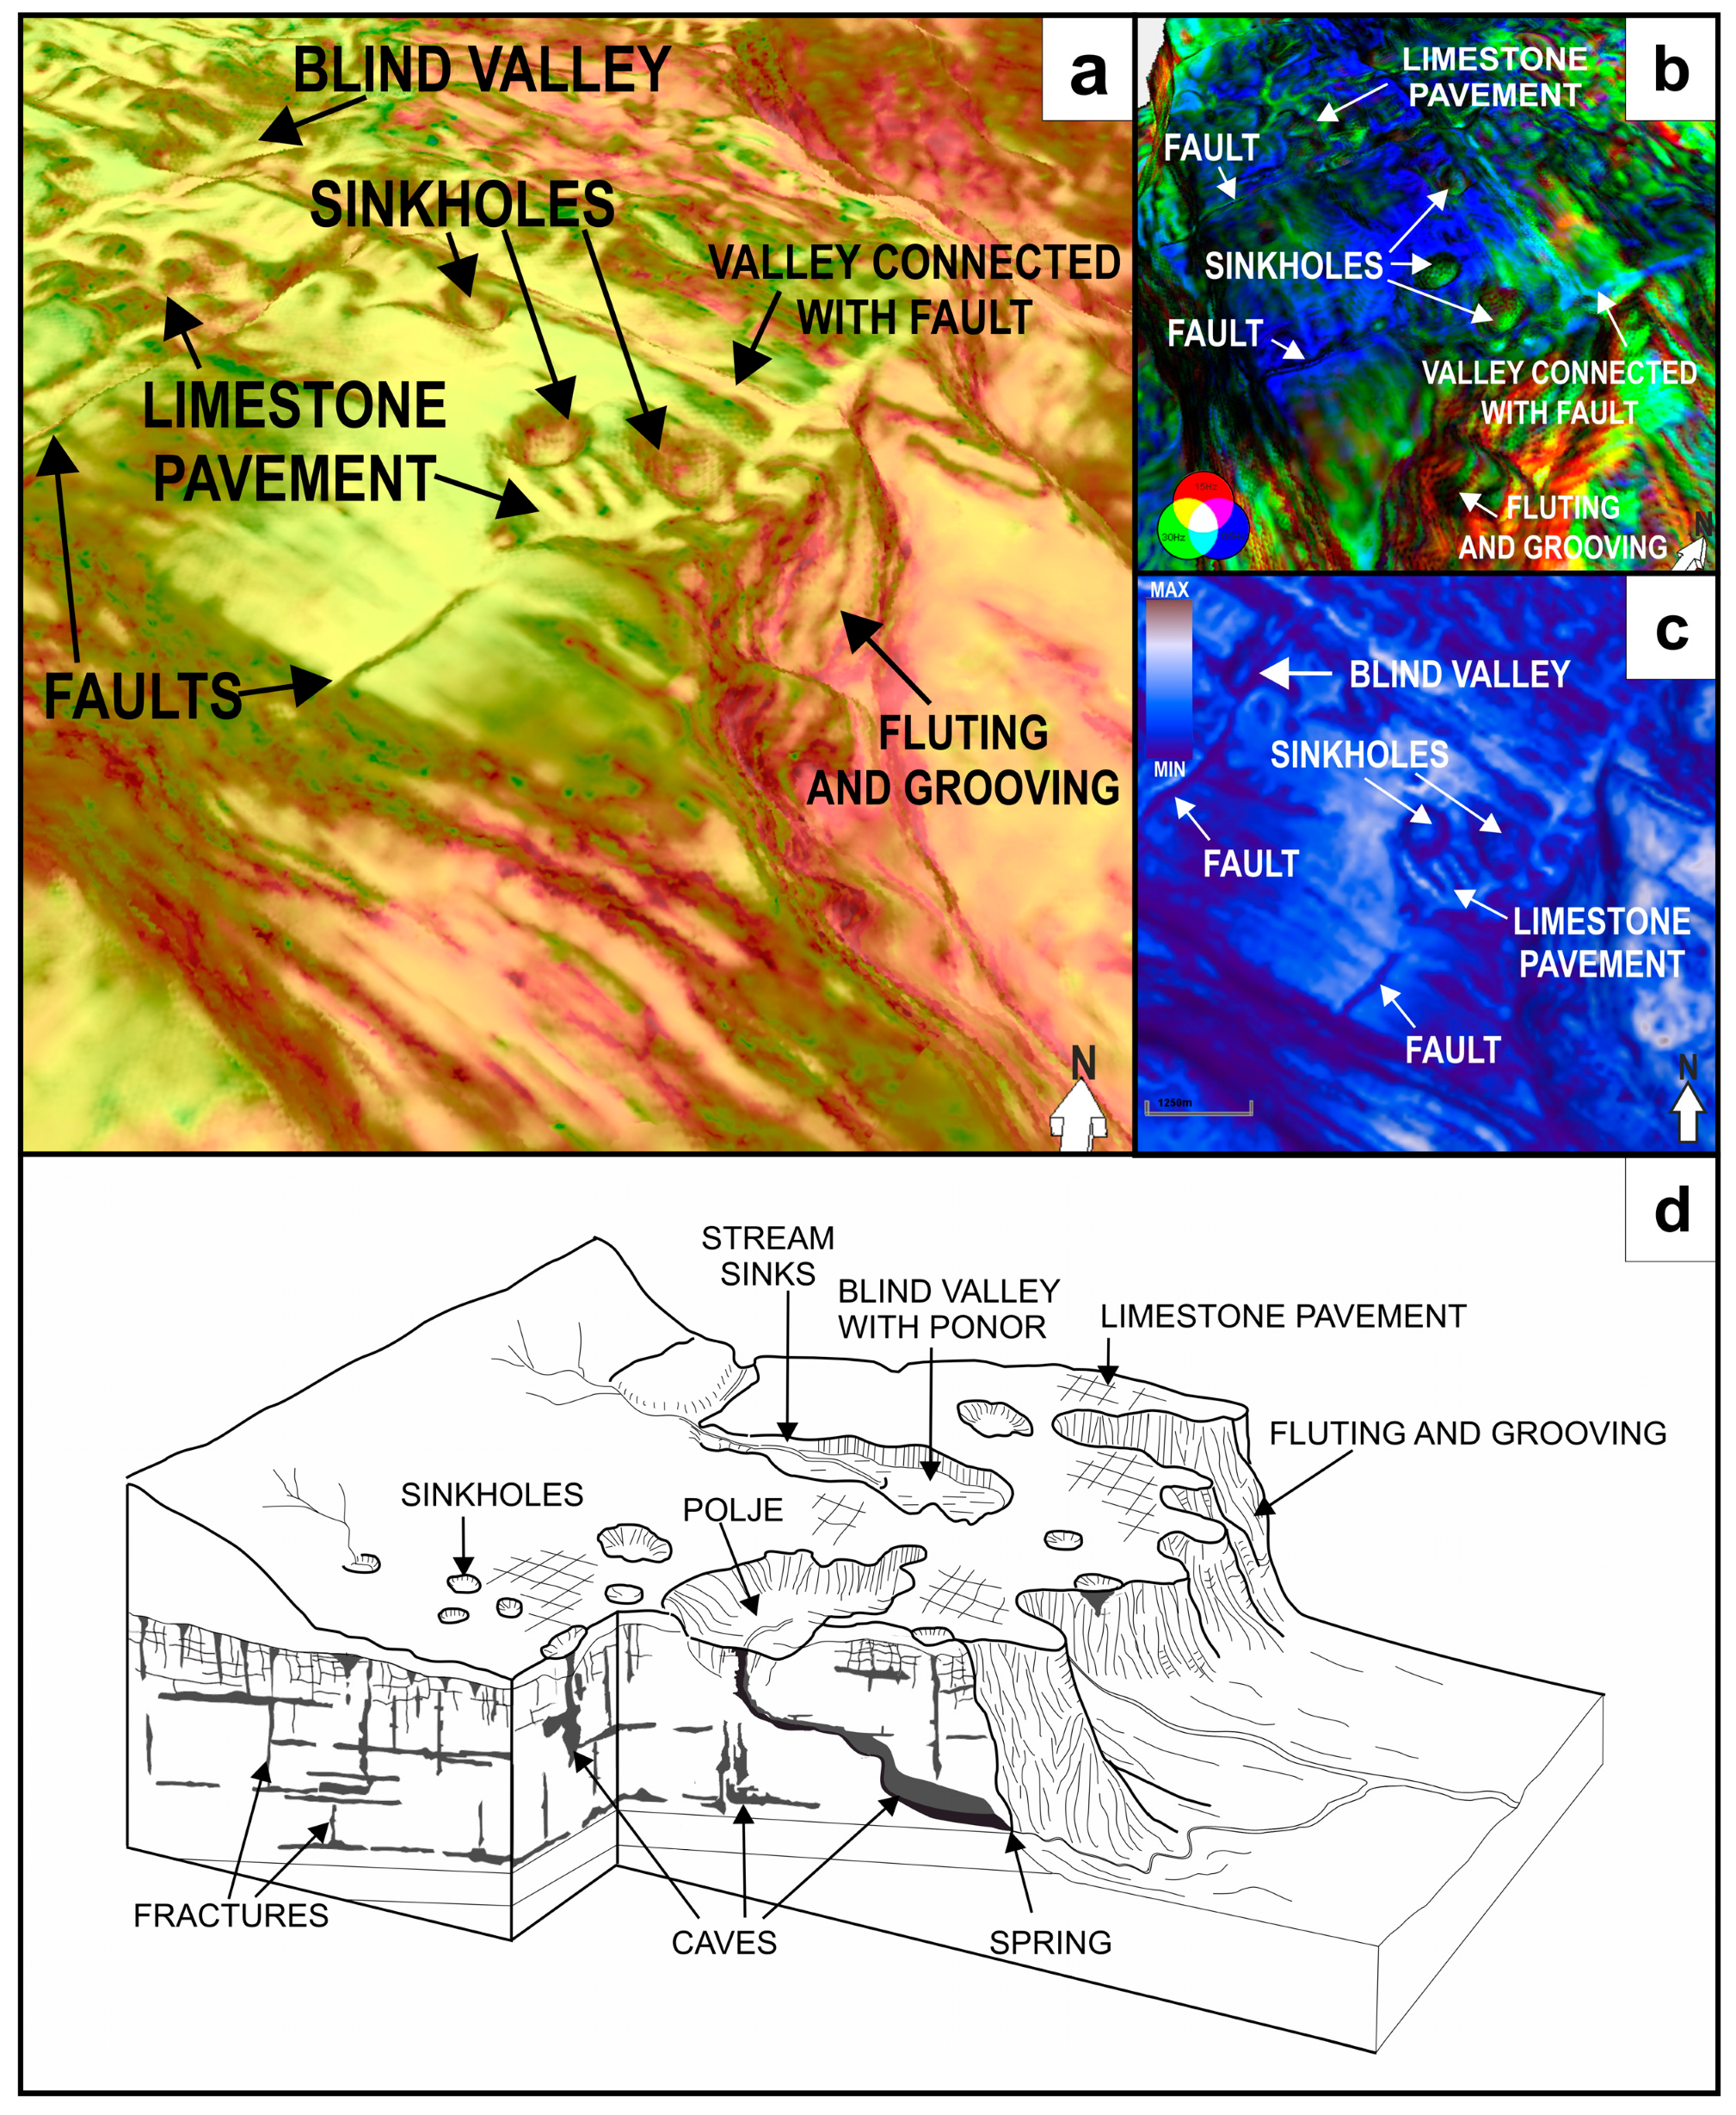
The interpretation of the maps computed using the horizon probe option along the top of the carbonate platform for the combined dominant frequency and sweetness attributes, and the spectral decomposition for frequencies of 15, 30 and 65 Hz presented in RGB colors (Figure 13), allowed for further characteristic elements to be recognized within the erosion surface analyzed. On the interpreted erosion surface, two clearly geomorphologically differentiated zones can be distinguished—the upland area and the bordering zones of steep slopes (Figure 10, Figure 11, Figure 12 and Figure 13). The upland region is characterized by a varied relief with well-developed paleokarst forms, whose orientation and density show a relationship with structural elements, such as faults and fracture systems. Much of the upland area is occupied by limestone pavements and sinkholes. In the maps shown in Figure 13, limestone pavements are represented by an image with a distinct chessboard-like pattern consisting of a system of fractures developed generally in two directions intersecting at approximately 90°. Each direction is most likely related to the other stage of tectonic history. Sinkholes of a circular shape and varying size (diameter and depth) are quite unevenly developed in the southern, more elevated part of the upland. The largest paleokarst form interpreted in this area is an extensive valley aligned with an NW-SE extensional dislocation. The depth of the valley decreases, and its width increases significantly toward the edge of the highland. Blind valleys are observed extending perpendicularly from the edges of the main valley. On the southern side, the highland ends in a steep slope with a relatively smooth topography. In the eastern and northern part of the slope was identified a complex network of dendritic, elongated structures (grooves), formed by intensive erosion.

4. Discussion

The best-known examples of hydrocarbon fields closely associated with karst reservoirs come from China. Reservoirs of this type have been identified there within a few large petroleum basins, including the Tarim Basin [6,7,30,39,40,41,42,43], the Ordos Basin [44,45] or the Sichuan Basin [4,46], among others. The issue of identifying zones of paleokarst development in carbonate formations based on seismic and borehole data has been addressed by various authors, e.g., [8,10,12,47,48].
The examples presented in this paper document the occurrence of various paleokarst forms in the Polish part of the Carpathian Foreland. Previous research on karst formations in the area has mainly focused on the analysis of geological and borehole data [19,20]. Of the available borehole data, the records obtained from high-resolution survey methods such as the X-tended Range Micro Imager (XRMI) and Circumferential Acoustic ScanningTool (CAST) proved to be the most useful. Measurements with six-arm dipmeter falls (SED and SDT) can also be helpful in delineating the zones of paleokarst occurrence. These images made it possible to reconstruct many details within the surface and karst forms developed in the Upper Jurassic and Lower Cretaceous carbonate formations analyzed, such as vugs, solution fractures and caves. They made it possible to define the sedimentary or chemical nature of the fills of karst forms or the presence of karst breccia. In general, the interpretation results obtained are similar to those of other authors [6,30,35] that unequivocally document the presence of various types of karst features in the profiles of the analyzed boreholes.
The paleokarst forms in the Upper Jurassic and Lower Cretaceous carbonates have also been identified in the seismic data. Seismic surveys have provided additional information on the spatial distribution of paleokarst structures (including those identified in boreholes) through seismic attribute analysis. The recognized paleokrast zones are most often located directly in the topmost part of the Upper Jurassic and Lower Cretaceous carbonate complexes. It is notable that locally the paleokarst intervals identified in the top of the carbonate complex may not be visible in the seismic image, as they are affected by the anomalous seismic reflection from the overlying anhydrite horizon [19]. Karst forms have also been identified in the deeper part of the carbonate formations in the immediate area of fractures and faults. The karst structures recognized in the study area can be divided into two main genetic types: base-level (or shallow) karst, including buried hill, reef banks and internal karst, as well as nonbase-level (or deep) karst, including bedding (confined) deep-underflow, vertical deep-infiltration and hydrothermal fluid karst [8]. The base-level karst is controlled by different-order sequence episodes, whereas the nonbase-level karst is mainly controlled by tectonics, where the fracture system allows for the flow of surface and thermal waters (Figure 2). Hydrothermal waters in the Carpathian Foreland area for the analyzed Cretaceous–Jurassic intervals are characterized by temperatures of 50–70 Celsius degrees and increased mineralization [20]. The influence of the activity of hydrothermal waters is ubiquitous and noticeable in the region regardless of the genetic type of the karst forms.
The presence of a regional karstic surface, with varying degrees of development, in the top of the Mesozoic carbonate complex was also confirmed by the analysis of the seismic data. Of the broad set of seismic attributes available in the Petrel software v.20.4, the following were found to be the most useful for identifying the paleokarst surface: instantaneous frequency, consistent dip, variance, RMS attribute, spectral decomposition and relative acoustic impedance.
In the literature, examples can be found of the use of other seismic attributes as well, for detecting zones of paleokarst development and analyzing the diversity of reservoir properties within karst reservoirs. For example, Farzadi and Hesthammer [49] used seis-mic attributes (such as the cosine of the instantaneous phase, dominant frequency, integrated absolute amplitude, envelope and inversion impedance) extracted from the final migrated 3D seismic data to analyze the Upper Cretaceous Mishrif Formation in Iran. The resulting 3D multi-attribute seismic facies classification enabled a detailed stratigraphic interpretation of the Turonian paleokarst surface. In contrast, Dai et al. [4] conducted an analysis of karst reservoirs in the Lower Permian Maokou Formation in the central Sichuan Basin, China, using RMS amplitude and instantaneous frequency as the optimal seismic attributes for reservoir prediction.
Paleogeomorphology of the paleokarst surface shows a division into the upland and the bordering zones of steep slopes. The upland area is characterized by a varied relief with well-developed paleokarst forms (limestone pavements, sinkholes, valleys and blind valleys), the orientation and concentration of which show a relationship with the structural elements, such as faults and fracture systems. On the southern side, the upland ends in a steep slope with relatively smooth topography, while on the eastern and northern parts of the slope a complex network of dendritic, elongated structures (grooves) formed by intense erosion was identified. The distribution of interpreted paleokarst forms is consistent with the diagram of the karst landscape (after Huggett [38]) and is similar to the paleokarst Cretaceous Macaé group carbonates in Campos Basin, Brazil [10], but also to the Ordovician paleokarst in the Tabei Uplift, Tarim Basin [50]. The occurrence of tower karst in the Ordovician carbonates of the Tarim Basin indicates a higher level of karst maturity than in the Upper Jurassic and Lower Cretaceous carbonates. Paleokarst in the analyzed area is represented by small suffusion or dropout sinkholes, open stream sinks, many small cracks and pavements widespread within a few meters of the paleokarst surface and the relatively poor expression of open karst conduits (i.e., many small caves and vertical shafts). Such a set of characteristic structures identified in well data and on the surface of the upland may result from the relative immaturity (Youthful class of karst) of the paleokarst [10,51,52].
Zones of carbonate rocks that were subjected to tectonic, karstification and hydrothermal transformation processes could be considered as complex exploration targets. The complexity of the processes had a great influence on the variability in reservoir parameters and poses a great challenge in their calculations. Understanding the origins and evolution is essential for the exploration and identification of deposits associated with the paleokarst [4,53,54]. Examples of such reservoirs containing significant geothermal water resources are recognized, among others, in Rospo Mare, Italy [16]; in Geneva Basin, Switzerland [55]; and the Wolonghe Gasfield in Sichuan Basin, China [46].

5. Conclusions

The studies conducted by the authors using an integrated analysis of geological–geophysical data and 3D seismic images showed the widespread presence of paleokarst features in Upper Jurassic and Lower Cretaceous carbonate formations in the analyzed central part of the Carpathian Foreland region.
The results were obtained by analyzing archival core descriptions; available geo-physical measurements, such as the gamma, resistivity, density, acoustics and diameter; and high-resolution CAST, XRMI and SED records in combination with the analysis of a number of selected seismic attributes.
In the first stage, various karst forms, including caves, multidirectional fissures, fissures widened by dissolution and the type of sediments filling them, were documented based on the well data. Linking these results to the analysis of the seismic attributes including the RMS attribute, sweetness, instantaneous and dominant frequencies, consistent dip, local dip, chaos, variance, spectral decomposition and iso-frequency made it possible to identify and delineate the zones of occurrence of the paleokarst structures.
The results of the presented research can provide fundamental information for the detailed identification of buried paleokarst structures in the study area. Combining core data with seismic interpretation allows for a much better understanding of the spatial distribution of the paleokarst system in carbonate rocks. A good recognition of paleokarst structures characterized by improved reservoir parameters is important in terms of estimating geothermal water resources as well as hydrocarbon exploration.

Author Contributions

Conceptualization, A.Ł.-B., M.M. and A.U.; methodology, A.Ł.-B., K.F.-J., M.M. and A.M.; software, K.F.-J., R.B. and T.K.; validation, A.Ł.-B. and M.M.; formal analysis, A.U. and B.F.; investigation, A.Ł.-B., K.F.-J., M.M. and A.M.; resources, R.B., B.F. and T.K.; writing—original draft preparation, A.Ł.-B., K.F.-J., A.U. and M.M.; writing—review and editing, A.U. and B.F.; visualization, A.Ł.-B., K.F.-J. and M.M.; supervision, A.U. and M.M. All authors have read and agreed to the published version of the manuscript.

Funding

The study was financed based on the statutory work entitled: Possibilities of using existing well infrastructure to extract renewable geothermal energy from Mesozoic formations in the marginal part of the Carpathian Mountains—the work of the Oil and Gas Institute-National Research Institute (OGI-NRI) commissioned by the Ministry of Education and Science; order number: 0068/SR/2022.

Data Availability Statement

Original data are not shared. Data were obtained from ORLEN PGNiG Exploration and Production Division.

Acknowledgments

We would like to acknowledge the ORLEN PGNiG Exploration and Production Division for sharing their data for research purposes and for their permission to publish the results.

Conflicts of Interest

The authors declare no conflicts of interest.

References

  1. Karnkowski, P. Natural Gas and Oil Deposits in Poland; The Carpathians and Carpathian Foreland; Towarzystwo Geosynoptyków Geos AGH: Kraków, Poland, 1993; Volume 2. (In Polish) [Google Scholar]
  2. Gutowski, J.; Urbaniec, A.; Złonkiewicz, Z.; Bobrek, l.; Świetlik, B.; Gliniak, P. Upper Jurassic and Lower Cretaceous of the middle Polish Carpathian Foreland. Biul. Państwowego Inst. Geol. 2007, 426, 1–26. (In Polish) [Google Scholar]
  3. Urbaniec, A. Lithofacial characteristics of Upper Jurassic and Lower Cretaceous deposits in the Dąbrowa Tarnowska—Dębica area based on an interpretation of seismic and well data. Pr. Nauk. INiG-PIB 2021, 232, 1–240. (In Polish) [Google Scholar] [CrossRef]
  4. Dai, X.; Zhang, M.; Jiang, Q.; Feng, Z. Karst reservoirs seismic prediction of Lower Permian Maokou Formation in central Sichuan Basin, SW China. Pet. Explor. Dev. 2017, 44, 79–88. [Google Scholar] [CrossRef]
  5. Ding, Z.; Wang, R.; Chen, F.; Yang, J.; Zhu, Z.; Yang, Z.; Sun, X.; Xian, B.; Li, I.E.; Shi, T.; et al. Origin, hydrocarbon accumulation and oil-gas enrichment of fault-karst carbonate reservoirs: A case study of Ordovician carbonate reservoirs in South Tahe area of Halahatang oilfield, Tarim Basin. Pet. Explor. Dev. 2020, 47, 306–317. [Google Scholar] [CrossRef]
  6. Gao, D.; Lin, C.; Hu, M.; Yang, H.; Huang, L. Paleokarst of the Lianglitage Formation related to tectonic unconformity at the top of the Ordovician in the eastern Tazhong Uplift, Tarim Basin, NW China. Geol. J. 2018, 53, 458–474. [Google Scholar] [CrossRef]
  7. Tian, F.; Jin, Q.; Li, Y.; Zhang, H.; Kang, X. Visualization and Quantification of Deeply Buried Paleokarst Reservoirs in Tahe Oilfield, Tarim Basin, China. In Search and Discovery Article #20257; Adapted from Poster Presentation Given at 2014 AAPG Annual Conventionand Exhibition, Houston, TX, USA, 6–9 April 2014; AAPG: Tulsa, OK, USA, 2014. [Google Scholar]
  8. Zhang, B.; Liu, J. Classification and characteristics of karst reservoirs in China and related theories. Pet. Explor. Dev. 2009, 36, 12–29. [Google Scholar] [CrossRef]
  9. Aboaba, O.; Liner, C. Characterization of paleokarst Mississippian chat and tripolite zones in Osage County, Oklahoma, USA. In Proceedings of the SEG/AAPG/SEPM First International Meeting for Applied Geo-Science, Energy, Denver, CO, USA and online, 26 September–1 October 2021. [Google Scholar] [CrossRef]
  10. Basso, M.; Kuroda, M.C.; Afonso, L.C.S.; Vidal, A.C. Three-dimensional seismic geomorphology of paleokarst in the Cretaceous MACAÉ group carbonates, Campose Basin, Brazil. J. Pet. Geol. 2018, 41, 513–526. [Google Scholar] [CrossRef]
  11. Black, T.J. Deep karst system research, Michigan, USA. Carbonates Evaporites 2012, 27, 119–122. [Google Scholar] [CrossRef]
  12. Carrillat, A.; Hunt, D.; Randen, T.; Sonneland, L.; Elvebakk, G. Automated mapping of carbonate buildups and palaeokarst from the Norwegian Barents Sea using 3D seismic texture attributes. In Petroleum Geology: North-West Europe and Global Perspectives, Proceedings of the 6th Petroleum Geology Conference, Geological Society, London, UK, 6–9 October 2003; Doré, A.G., Vining, B.A., Eds.; Petroleum Geology Conference Series; Geological Society: London, UK, 2005; Volume 6, pp. 1595–1611. [Google Scholar] [CrossRef]
  13. Castillo, M.V.; Mann, P. Deeply buried, Early Cretaceous paleokarst terrane, southern Maracaibo Basin, Venezuela. AAPG Bull. 2006, 90, 567–579. [Google Scholar] [CrossRef]
  14. Dembicki, E.A.; Machel, H.G. Recognition and delineation of paleokarst zones by the use of wireline logs in the bitumen-saturated Upper Devonian Grosmont Formation of Northeastern Alberta, Canada. AAPG Bull. 1996, 80, 695–712. [Google Scholar]
  15. Dubois, P.; Sorriaux, P.; Soudet, H.J. Rospo Mare (Adriatique): Un paléokarst pétrolier du domaine méditerranéen. Karstologia 1993, 21, 31–42. [Google Scholar] [CrossRef]
  16. Fournillon, A.; Bellentani, G.; Moccia, A.; Jumeaucourt, C.; Terdich, P.; Siliprandi, F.; Peruzzo, F. Characterization of a Paleokarstic Oil Field (Rospo Mare, Italy): Sedimentologic and Diagenetic Outcomes; and Their Integra-tion in Reservoir Simulation. In Euro-Karst 2016, Neuchâtel. Advances in the Hydrogeology of Karst and Carbonate Reservoir; Renard, P., Bertrand, C., Eds.; Springer: Cham, Switzerland, 2017. [Google Scholar] [CrossRef]
  17. Navarro, J. Casablanca: Spain’s Biggest Oil Field. Explor. AAPG 2019, 9, 20–23. [Google Scholar]
  18. Miziołek, M. Exaple of the construction of heterolithological reservoir traps in the NW part of the Carpathian Foredeep. Nafta-Gaz 2018, 74, 495–502. (In Polish) [Google Scholar] [CrossRef]
  19. Miziołek, M.; Filipowska-Jeziorek, K.; Urbaniec, A.; Filar, B.; Łaba-Biel, A. Possibilities of paleokarst zones identification in the Carpathian Foreland area based on well and seismic data. Nafta-Gaz 2022, 78, 485–502. (In Polish) [Google Scholar] [CrossRef]
  20. Miziołek, M.; Filar, B. Paleokarst phenomena in the Upper Jurassic deposits in the Carpathian Foredeep substrate and its reserves importance. Nafta-Gaz 2019, 75, 330–344. (In Polish) [Google Scholar] [CrossRef]
  21. Urbaniec, A.; Bartoń, R.; Bajewski, Ł.; Wilk, A. Results of the structural interpretation of Triassic and Paleozoic formations of the Carpathian Foreland based on new seismic data. Nafta-Gaz 2020, 76, 559–568. (In Polish) [Google Scholar] [CrossRef]
  22. Jawor, E. Miocene strata between Cracow nad Dębica. Przegląd Geol. 1983, 31, 635–640. (In Polish) [Google Scholar]
  23. Karnkowski, P.H.; Ozimkowski, W. Structural evolution of the pre-miocene basement in the Carpathian Foredeep (Kraków–Przemyśl Region, SE Poland). Przegląd Geol. 2001, 49, 431–436. (In Polish) [Google Scholar]
  24. Połtowicz, S. The Lower Sarmatian delta of Szczurowa on the background of the Carpathian Foreland geological evolution. Geologia 1998, 24, 219–239. (In Polish) [Google Scholar]
  25. Połtowicz, S. Badenian olisthostromes and turbidity fans near Tarnów (Middle Carpathian Foreland). Geologia 1999, 25, 153–187. (In Polish) [Google Scholar]
  26. Sowiżdżał, K.; Stadtmüller, M. Methodology of construction of spatial fracture models of reservoirs. Nafta-Gaz 2010, 66, 159–166. (In Polish) [Google Scholar]
  27. Stankiewicz, B.; Stadtmüller, M. Abilities in identification of sedimentary structures of thin-bedded Miocene deposits of the Carpathian Foredeep, southern Poland. Przegląd Geol. 2002, 50, 222–226. (In Polish) [Google Scholar]
  28. Plewka, T.; Jarzyna, J. Electrical borehole wall imaging—Data processing and breakouts focused interpretation in clastic-carbonate rock masses. Nafta-Gaz 2017, 73, 14–26. (In Polish) [Google Scholar] [CrossRef]
  29. Khoshbakht, F.; Azizzadeh, M.; Memarian, H.; Nourozi, G.H.; Moallemi, S.A. Comparison of electrical image log with core in a fractured carbonate reservoir. J. Pet. Sci. Eng. 2012, 86–87, 289–296. [Google Scholar] [CrossRef]
  30. Tian, F.; Lu, X.; Zheng, S.; Zhang, H.; Rong, Y.; Yang, D.; Liu, N. Structure and Filling Characteristics of Paleokarst Reservoirs in the Northern Tarim Basin; Revealed by Outcrop; Core and Borehole Images. Open Geosci. 2017, 9, 266–280. [Google Scholar] [CrossRef]
  31. Loucks, R.G.; Mescher, P.K.; McMechan, G.A. Three-dimensional architecture of a coalesced; collapsed-paleocave system in the Lower Ordovician Ellenburger Group, central Texas. AAPG Bull. 2004, 88, 545–564. [Google Scholar] [CrossRef]
  32. Yang, W.; Gong, X.; Li, W. Geological origins of seismic bright spot reflections in the Ordovician strata in the Halahatang area of the Tarim Basin, western China. Can. J. Earth Sci. 2018, 55, 1297–1311. [Google Scholar] [CrossRef]
  33. Qi, J.; Zhang, B.; Zhou, H.L.; Marfurt, K. Attribute expression of fault-controlled karst—Fort Worth Basin, Texas: A tutorial. Interpretation 2014, 2, SF91–SF110. [Google Scholar] [CrossRef]
  34. Zou, C. (Ed.) Chapter 6: Carbonate Fracture-Cavity Reservoir. In Unconventional Petroleum Geology; Elsevier: Amsterdam, The Netherlands, 2013; pp. 191–221. [Google Scholar] [CrossRef]
  35. Yu, J.; Li, Z.; Yang, L. Fault system impact on paleokarst distribution in the Ordovician Yingshan Formation in the central Tarim basin, northwest China. Mar. Pet. Geol. 2016, 71, 105–118. [Google Scholar] [CrossRef]
  36. Urbaniec, A.; Drabik, K.; Dohnalik, M.; Zagórska, U.; Kowalska, S. Representation of the selected features of carbonate rocks based on the computed tomography (CT) image and the borehole micro-imager (XRMI). Pr. Nauk. INiG-PIB 2019, 225, 1–230. (In Polish) [Google Scholar] [CrossRef]
  37. Urbaniec, A.; Łaba-Biel, A.; Kwietniak, A.; Fashagba, I. Seismostratigraphic Interpretation of Upper Cretaceous Reservoir from the Carpathian Foreland, Southern Poland. Energies 2021, 14, 7776. [Google Scholar] [CrossRef]
  38. Huggett, R.J. Fudamentals of Geomorfology, 2nd ed.; Routledge: New York, NY, USA, 2007; p. 398. [Google Scholar]
  39. Lu, X.; Wang, Y.; Yang, D.; Wang, X. Characterization of paleo-karst reservoir and faulted karst reservoir in Tahe Oilfield, Tarim Basin, China. Adv. Geo-Energy Res. 2020, 4, 339–348. [Google Scholar] [CrossRef]
  40. Dan, Y.; Lin, L.; Liang, B.; Zhang, Q.; Yu, Y.; Cao, J.; Li, J. Eogenetic Karst Control of Carbonate Reservoirs during a Transient Exposure: A Case Study of the Ordovician Yingshan Formation in the Northern Slope of the Tazhong Uplift, Tarim Basin, China. Minerals 2018, 8, 345. [Google Scholar] [CrossRef]
  41. Lin, C.; Yang, H.; Liu, J.; Rui, Z.; Cai, Z.; Li, S.; Yu, B. Sequence architecture and depositional evolution of the Ordovician carbonate platform margins in the Tarim Basin and its response to tectonism and sea-level change. Basin Res. 2012, 24, 559–582. [Google Scholar] [CrossRef]
  42. Sun, S.; Zhao, W.Z.; Zhang, B.M.; Liu, J.J.; Zhang, J.; Shan, X.Q. Observation and implication of the paleo-cave sediments in Ordovician strata of Well Lundong-1 in the Tarim Basin. Sci. China Earth Sci. 2013, 56, 618–627. [Google Scholar] [CrossRef]
  43. Zhang, Y.; Tan, F.; Qu, H.; Zhong, Z.; Liu, Y.; Luo, X.; Wang, Z.; Qu, F. Karst monadnock fine characterization and reservoir control analysis: A case from Ordovician weathering paleokarst reservoirs in Lungu area, Tarim Basin, NW China. Petrol. Explor. Develop. 2017, 44, 758–769. [Google Scholar] [CrossRef]
  44. Li, J.; Zhang, W.; Luo, X.; Hu, G. Paleokarst reservoirs and gas accumulation in the Jingbian field; Ordos Basin. Mar. Pet. Geol. 2008, 25, 401–415. [Google Scholar] [CrossRef]
  45. Xiao, D.; Tan, X.; Fan, L.; Zhang, D.; Nie, W.; Niu, T.; Cao, J. Reconstructing large-scale karst paleogeomorphology at the top of the Ordovician in the Ordos Basin, China: Control on natural gas accumulation and paleogeographic implications. Energy Sci. Eng. 2019, 7, 3234–3254. [Google Scholar] [CrossRef]
  46. Gao, B.; Tian, F.; Pan, R.; Zheng, W.; Li, R.; Huang, T.; Liu, Y. Hydrothermal Dolomite Paleokarst Reservoir Development in Wolonghe Gasfield; Sichuan Basin; Revealed by Seismic Characterization. Water 2020, 12, 579. [Google Scholar] [CrossRef]
  47. Moser, D.J. 3D Seismic Interpretation of Paleokarst Sinkholes, Boone Limestone, Lower Mississippian: Subsurface Eastern Arkoma Basin, Conway County, Arkansas. Master’s Thesis, University of Arkansas, Fayetteville, AR, USA, 2016; p. 1727. [Google Scholar]
  48. Skvortsov, A.; Kuleshov, V.; Ajiboye, M.; Agafonova, O. An Approach to Tight Paleokarst Zones Identification Based on Integrated Use of 3D Seismic Surveys, Core and Well-Log Dataand Implication to Reservoir Quality. In Proceedings of the SPE Russian Oil and Gas Exploration, Production Technical Conference and Exhibition, Moscow, Russia, 14–16 October 2014. [Google Scholar] [CrossRef]
  49. Farzadi, P.; Hesthammer, J. Diagnosis of the Upper Cretaceous palaeokarst and turbidite systems from the Iranian Persian Gulf using volume-based multiple seismic attribute analysis and pattern recognition. Pet. Geosci. 2007, 13, 227–240. [Google Scholar] [CrossRef]
  50. Zeng, H.; Wang, G.; Janson, X.; Loucks, R.; Xia, Y.; Xu, L.; Yuan, B. Characterizing seismic bright spots in deeply buried, Ordovician Paleokarst strata, Central Tabei uplift, Tarim Basin, Western China. Geophysics 2011, 76, B127–B137. [Google Scholar] [CrossRef]
  51. Waltham, A.C.; Fookes, P.G. Engineering Classification of Krast Ground Conditions. Q. J. Eng. Geol. Hydrogeol. 2003, 36, 101–118. [Google Scholar] [CrossRef]
  52. Andreychouk, V.; Eftimi, R.; Nita, J.; Klimchouk, A. Karst relief of the Mali me Gropa Massif, central Albania. Geol. Q. 2022, 66, 1–20. [Google Scholar] [CrossRef]
  53. Loucks, R.G. Paleocave Carbonate Reservoirs: Origins, Burial-Depth Modifications, Spatial Complexity, and Reservoir Implications. AAPG Bull. 1999, 83, 1795–1834. [Google Scholar] [CrossRef]
  54. Wright, V.P.; Esteban, M.; Smart, P.L. Palaeokarsts and Palaeokarstic Reservoirs: Postgraduate Research for Sedimentology Palaeokarst: Practical applications; University of Reading, PRIS Contribution: Reading, UK, 1991; Volume 152, pp. 89–119. [Google Scholar]
  55. Eruteya, O.E.; Crinière, A.; Moscariello, A. Seismic expression of paleokarst morphologies and associated Siderolithic infill in the Geneva Basin, Switzerland: Implications for geothermal exploration. Geothermics 2024, 117, 102868. [Google Scholar] [CrossRef]
Figure 1. Location of 3D seismic surveys and the analyzed wells: (a)—sketch of the ranges of geological formations in the research area; (b)—location of the study area (yellow rectangle) in relation to the distribution of the formations in extra-Carpathian Poland.
Energies 17 00838 g001
Figure 2. Scheme of development and distribution of karst surfaces in the central part of the Carpathian Foreland area.
Energies 17 00838 g002
Figure 3. Examples of karst features on borehole core samples (photos: R. Laskowicz and A. Urbaniec) from Po-3 well: (a) laminated limestone with visible system of multidirectional fractures mostly filled with calcite or olivine clayey-marginal material; and (b) carbonate breccia, fragments of Jurassic limestone cemented by green marl.
Energies 17 00838 g003
Figure 4. Recording of high-angle fracture from dissolution (marked by red arrows) in the record of six-arm dipmeter, SED (W-2 well).
Energies 17 00838 g004
Figure 5. Examples of paleokarst structures in the CAST image: (a,b) solution fractures, vugs and caves filled with clay material; (c) solution-enlarged fracture and high-angle fracture; (d) carbonate breccia suspended in muddy and silty matrix; (e) scattered solution vugs and fractures filled with calcite; and (f) unfilled cave and fractures. Based on Yu et al., 2016 [35].
Energies 17 00838 g005
Figure 6. Example of the succession of paleokarst formations in the XRMI image from the A-1 well in relation to the schematic model of buried paleocaves (according to Loucks et al., 2004 [31]; and Yang et al., 2018 [32]; modified).
Energies 17 00838 g006
Figure 7. Surface attributes calculated along the top of horizon J3 + K1 for the 0–30 ms window: (a) RMS amplitude and (b) extract value from instantaneous frequency.
Energies 17 00838 g007
Figure 8. (a) Time slice at -1480 ms through consistent dip volume; (b) seismic section AA’in chaos attribute; and (c) seismic section AA’ in local dip attribute. Dashed ellipses indicate the location of karst features.
Energies 17 00838 g008
Figure 9. (a,c) CAST images from the C-2 well; (b) seismic section AA’ in RMS amplitude; (d) horizon probe with extracted lowest values of instantaneous frequency and RMS amplitude; and (e) seismic section AA’ in instantaneous frequency. The dashed lines indicate zones of paleokarst link to interpreted CAST images; the location of seismic section AA’ is shown in Figure 8.
Energies 17 00838 g009
Figure 10. Time slices and seismic section BB’ through consistent dip volume. The location of the seismic section BB’ is marked with a dashed line.
Energies 17 00838 g010
Figure 11. Time surface attribute extract value from consistent dip volume along the top of carbonate platform.
Energies 17 00838 g011
Figure 12. Time slice at −842 ms: (a) seismic amplitude; (b) mixer of iso-frequency 15, 30 and 45 Hz; (c) variance and sweetness overlaid; (d) seismic section BB’: seismic amplitude; (e) relative acoustic impedance; and (f) instantaneous frequency. Location of the seismic section BB’ is marked with a dashed line.
Energies 17 00838 g012
Figure 13. Horizon probe along the top of carbonate platform: (a) dominant frequency and sweetness overlaid; (b) spectral decomposition 15, 30 and 65 Hz; (c) extract value from sweetness volume; and (d) diagram of the karst landscape (after Huggett [38]; modified).
Energies 17 00838 g013
Disclaimer/Publisher’s Note: The statements, opinions and data contained in all publications are solely those of the individual author(s) and contributor(s) and not of MDPI and/or the editor(s). MDPI and/or the editor(s) disclaim responsibility for any injury to people or property resulting from any ideas, methods, instructions or products referred to in the content.