Article

Optimization Method of Production System for Coalbed Methane Wells throughout Life Cycle

1
CNOOC Research Institute Ltd., CNOOC Building, Yard 6, Taiyanggong South Street, Chaoyang District, Beijing 100028, China
2
Faculty of Engineering, China University of Geosciences Wuhan, 388 Lumo Road, Wuhan 430074, China
3
College of Geosciences and Surveying Engineering, China University of Mining & Technology, No. 11, Xueyuan Road, Haidian District, Beijing 100091, China
4
College of Mining Engineering, Taiyuan University of Technology, No. 79 Yingze Xi Street, Wanbolin District, Taiyuan 030002, China
*
Author to whom correspondence should be addressed.
Energies 2024, 17(4), 789; https://doi.org/10.3390/en17040789
Submission received: 29 December 2023 / Revised: 19 January 2024 / Accepted: 1 February 2024 / Published: 6 February 2024
(This article belongs to the Special Issue Advances in the Development of Unconventional Oil and Gas Resources)

Abstract

:
Different from conventional gas reservoirs, the permeability of coalbeds is affected by stress sensitivity and matrix shrinkage during production. These two conditions lead to lower permeability in the reservoir and affect the production efficiency of the gas well. In addition, coalbed methane wells have single-phase water flow in the initial stage of production. When the reservoir pressure is reduced to its critical desorption pressure, the adsorbed gas in the reservoir desorbs into the pore space and participates in the flow. The flow state in the reservoir changes from single-phase to two phase, and the permeability of the reservoir decreases. The occurrence of these three damage mechanisms is related to the flow rate of fluid in the reservoir. At present, there is a lack of research on the optimization of drainage and production systems considering the damage mechanism of coal reservoirs. This study comprehensively considers how to optimize the production rate of coal reservoirs under the influence of stress sensitivity, matrix shrinkage and two phase flow in the production process to achieve the purpose of production with the least damage to the reservoir.

1. Introduction

Coalbed methane is methane gas adsorbed in coal seams. Coalbed methane is a dangerous gas that can easily cause explosions in the process of coal mine development. Around the world, many people lose their lives every year because of coal mine gas explosions. The main component of gas is methane; in essence, this gas is a kind of green and clean energy, so the development of coalbed methane turns waste into treasure by converting the gas that takes people’s lives into green and clean natural gas for the benefit of humankind. At present, coalbed methane can be extracted from the ground for human use [1]. The efficient development of coalbed methane benefits from the application of hydraulic fracturing technology. Hydraulic fracturing can create a high-speed channel in the coal seam, increase the permeability of the reservoir around the wellbore, and promote the reduction in pressure in the reservoir and the desorption of methane in the coal seam. Currently, conventional activated water fracturing technology is adopted in this field, while less-water or no-water fracturing technology is being actively explored; due to the complex and varied geological conditions of coal seams in our country, characteristics of strong heterogeneity, the research on the mechanism of fracture extension is not deep enough, and fracturing and fracturing fluid systems are not adapted to problems such as the problem of coal seams not matching. There are two main forms of coalbed methane in a reservoir: adsorption state and free state [2]. When the reservoir pressure is higher than the critical desorption pressure, single-phase water flows in the reservoir. When the reservoir pressure is lower than the critical desorption pressure, the adsorbed gas begins to desorb to the free state and participate in the flow. The flow in the reservoir becomes a two phase flow. The sum of the permeability of the two phase flow is less than the absolute permeability of the coal reservoir [3,4]. Liu et al. studied the gas–water two phase seepage model of a low-permeability coal seam by comprehensively considering the desorption effect of adsorbed gas in the coal seam, gas–water two phase seepage, non-Darcy seepage and formation stress sensitivity. Based on the assumption of a linearly decreasing distribution of gas saturation, a coupling model of gas–water two phase seepage in a coalbed methane reservoir was established [5]. On the basis of considering the desorption and diffusion effects of coalbed methane and the starting pressure gradient, Zhu Weiyao et al. analyzed the transport characteristics of the fluid in a low-permeability coalbed methane reservoir, established a mathematical model of the two phase nonlinear seepage of the low-permeability coalbed methane water, and deduced the governing equations of the gas–water two phase flow in the nonlinear seepage stage [6]. Aiming at the problem that there is no explicit equation of bottom-hole pressure and multiple factors for evaluating unsteady inflow behavior, Zhang Peng established an explicit calculation model of bottom-hole pressure involving time, a stress sensitivity coefficient, a skin coefficient, the total production and the starting pressure gradient by using theoretical derivation and a multi-factor fitting method [7]. The model was verified with production data. The factors influencing bottom-hole pressure were analyzed. Feng et al. considered the starting pressure gradient and stress sensitivity characteristics of low-permeability coal seams according to the change in fluid flow law after coal seam fracturing. Based on gas reservoir engineering and the stable seepage theory, a gas–water two phase productivity equation of a vertically fractured coalbed methane reservoir was established. It was combined with a coalbed methane reservoir material balance equation and coalbed methane well production data, and the real-time gas recovery index curve of a coalbed methane well was obtained. The optimal production pressure difference can be determined in real time according to the principle of the maximum gas production index. A set of real-time optimization methods for the gas and water two phase flow in vertically fractured coalbed methane wells was established [8]. According to the desorption characteristics of a coalbed methane reservoir in the process of drainage and production, Niu Congcong proposed an unstable well test model of a coalbed methane well which is related to the size of the desorption area by considering the permeability relationship of the gas–water two phase distribution. This model describes the flow state of gas and water in a coal seam during the process of coal seam gas drainage. The model describes the gas–water phases by using the zoning model. The well test model was solved by the finite volume method. The theoretical test curve of the gas–water two phase distribution in a coalbed methane well was calculated. The influence of the desorption coefficient, desorption radius and gas water saturation distribution on the well test curve was analyzed [9].
Due to the soft texture of a coal reservoir, there is a large amount of pulverized coal. There are two situations in the process of reservoir fluid flow: 1. The fluid will drive the coal powder to flow together. 2. The fluid will strip the pulverized coal in the reservoir. Both of these conditions will reduce the permeability of the reservoir. Han Wenlong systematically carried out experiments on the effect of different-diameter bubbles on different particle sizes and densities of pulverized coal through the experimental device of bubble-pulverized coal microscopic interaction. The influence of bubbles on the trajectory and velocity of pulverized coal migration and the characteristics of pulverized coal capture were analyzed [10]. Wei Yingchun carried out a systematic study on the mechanism of pulverized coal production and its control measures from the aspects of influencing factors and causes of pulverized coal production, the rules of pulverized coal production and control measures by using the methods of on-site monitoring of coalbed methane wells, experimental testing and analysis, physical simulation experiments and on-site engineering applications [11]. Han et al. used the piecewise regression method to calculate the critical migration velocity of pulverized coal with different particle sizes. This method can be used to determine the critical migration velocity of pulverized coal in the wellbore. By keeping the flow rate in the wellbore higher than the critical migration rate of the pulverized coal, one can ensure that the fluid in the wellbore can carry the pulverized coal out of the wellbore, reducing the frequency of workover and the associated operating costs [12]. Zhao et al. used grain size analysis, environmental scanning electronic microscopy (ESEM) and X-ray diffraction (XRD) to carry out particle size measurements and micro-morphology and mineralogy analyses. The experimental results showed that the characteristics and genetic mechanism of pulverized coal determine its particle size, its total amount and the degree of fluid migration. Pulverized coal plays a decisive role in the structure of a coal body, the development of coal seams and the output of coalbed gas [13]. Bai Aiming at the problem of pulverized coal generated in the process of coalbed methane development, the process of pulverized coal generated in micro-scale coal gangue was numerically characterized, scanning electron microscopy (SEM) images of coal samples from Bulli coal seam in Sydney Basin, Australia were analyzed, and the geometric shape and distribution characteristics of coal samples were determined [14]. Guo conducted a systematic experiment to study the change in the permeability of the reservoir during the migration of pulverized coal. The experimental study showed that after 33 days of water flow, the permeability of the test core was reduced by 35%. The particles produced were mainly mixtures of pulverized coal and slime. The experimental study also showed that the main parameters controlling pulverized coal particle migration are the flow rate, interaction energy and coal characteristics. Most of the pulverized coal was produced at the beginning of the flow [15].
In the process of coalbed methane development, the reservoir will be affected by stress sensitivity and matrix shrinkage effects, resulting in a change in reservoir permeability. In the early stage of development, the permeability of the coal reservoir decreases with the decrease in reservoir pressure. In the later stage of development, with a large amount of adsorbed gas desorption, the matrix shrinkage effect becomes more and more obvious and dominant, the stress sensitivity effect becomes weaker, and the permeability of the coal reservoir increases with the decrease in reservoir pressure. Yang Yanhui et al. studied the changes in coal reservoir permeability under effective stress through permeability tests under different stresses. Based on the analysis of the existing stress sensitivity evaluation parameters, a new stress sensitivity coefficient was put forward to reveal the law of the effect of effective stress on the permeability of a coal reservoir [16]. At present, there are four main equations used to characterize the change in coal reservoir porosity and permeability with pressure: the Seidle and Huit model, the Palmer and Mansoori model, the Shi and Durucan model and the constant exponential permeability model. The Seidle and Huit model was proposed by Seidle and Huitt in 1995, based on their experimental analysis of highly volatile asphaltic coal seams in the San Juan Basin. Through research, Seidle and Huitt put forward the variation in porosity permeability caused by gas resolution, adsorption and diffusion during coal seam production [17]. The Palmer and Mansoori model was proposed by Palmer and Mansoori in 1998. The Palmer and Mansoori model mainly describes the change in porosity and permeability of a coalbed methane reservoir with pressure. The Palmer and Mansoori model is used to calculate the volume compression coefficient and permeability of the pores in a coal seam by the effective stress acting on the matrix, which is suitable for the case of uniaxial strain and the case of a porosity change rate less than 30% [18]. The Shi and Durucan model was proposed by Shi and Durucan in 2004. The Shi and Durucan model mainly describes the relationship between the volume tension strain and the total volume of desorbed gas. The Shi and Durucan model can be used to calculate the amount of matrix expansion with adsorption and the amount of matrix shrinkage caused by EOR methods such as gas injection. Therefore, the Shi and Durucan model is more suitable for a formation with gas injection. The compression parameters used in the Shi and Durucan model are similar to those used in the Palmer and Mansoori model. But the Shi and Durucan model uses a more sensitive matrix compression parameter. During the development process, the matrix compression parameter will produce a more significant increase in permeability with the consumption of formation energy [19]. The constant exponential permeability model is an empirical model. The constant exponential permeability model was developed by BP and Fekete based on observations of the shrinkage effect of the coal matrix in the San Juan Basin. The constant exponential permeability model was proposed based on coalbed methane deposits in the San Juan Basin but has since been widely applied to other coalbed methane basins and other types of reservoirs [20]. For the problem of the long-term stability control of the surrounding rock of deep high-stress soft rock tunnels, Wei Jing analyzed the formation mechanism of surrounding rock deformation zones of deep high-stress soft rock tunnels while considering rock rheology and provided a method for designing and evaluating the long-term stability of deep soft rock tunnels [21]. Jia Qifeng, based on an analysis of representative academic works, specified that the characterization of pore–fracture has gone through three stages. The effects of an acoustic field can promote the desorption of adsorbed gas and increase the permeability of a reservoir [22]. Ali Altowilib studied the influence of rock characteristics on coalbed methane development. He developed a technique for determining the gas content of coal reservoirs and provided a comprehensive analysis of the economic challenges in coalbed methane development [23].
Previous studies mainly focused on the damage mechanisms of coal reservoirs and have not been used in the actual coalbed methane production process optimization. The three main damage mechanisms in coal reservoirs are the stress sensitivity effect, matrix shrinkage effect and gas–water two phase flow. The extent of these three damages is related to the rate of pressure drop in the reservoir. In the process of coalbed methane development, the pressure drop rate of the reservoir is affected by the production system. In this study, three kinds of reservoir damage mechanisms in the process of coal reservoir production are comprehensively considered, and the optimal drainage rate of a coalbed methane well under the combined action of three kinds of damage mechanisms is obtained. In addition, in view of the large amount of foreign water in the produced fluid of coalbed methane wells, this study proposed for the first time a flow material balance equation for a reservoir combined with a Langmuir isothermal adsorption equation to correct the foreign water in the produced water. The produced water in the coal reservoir is determined after correction. The use of corrected production data can increase the accuracy of production system optimization and better guide on-site production.

2. Production System Optimization Mechanism of Coalbed Methane Wells

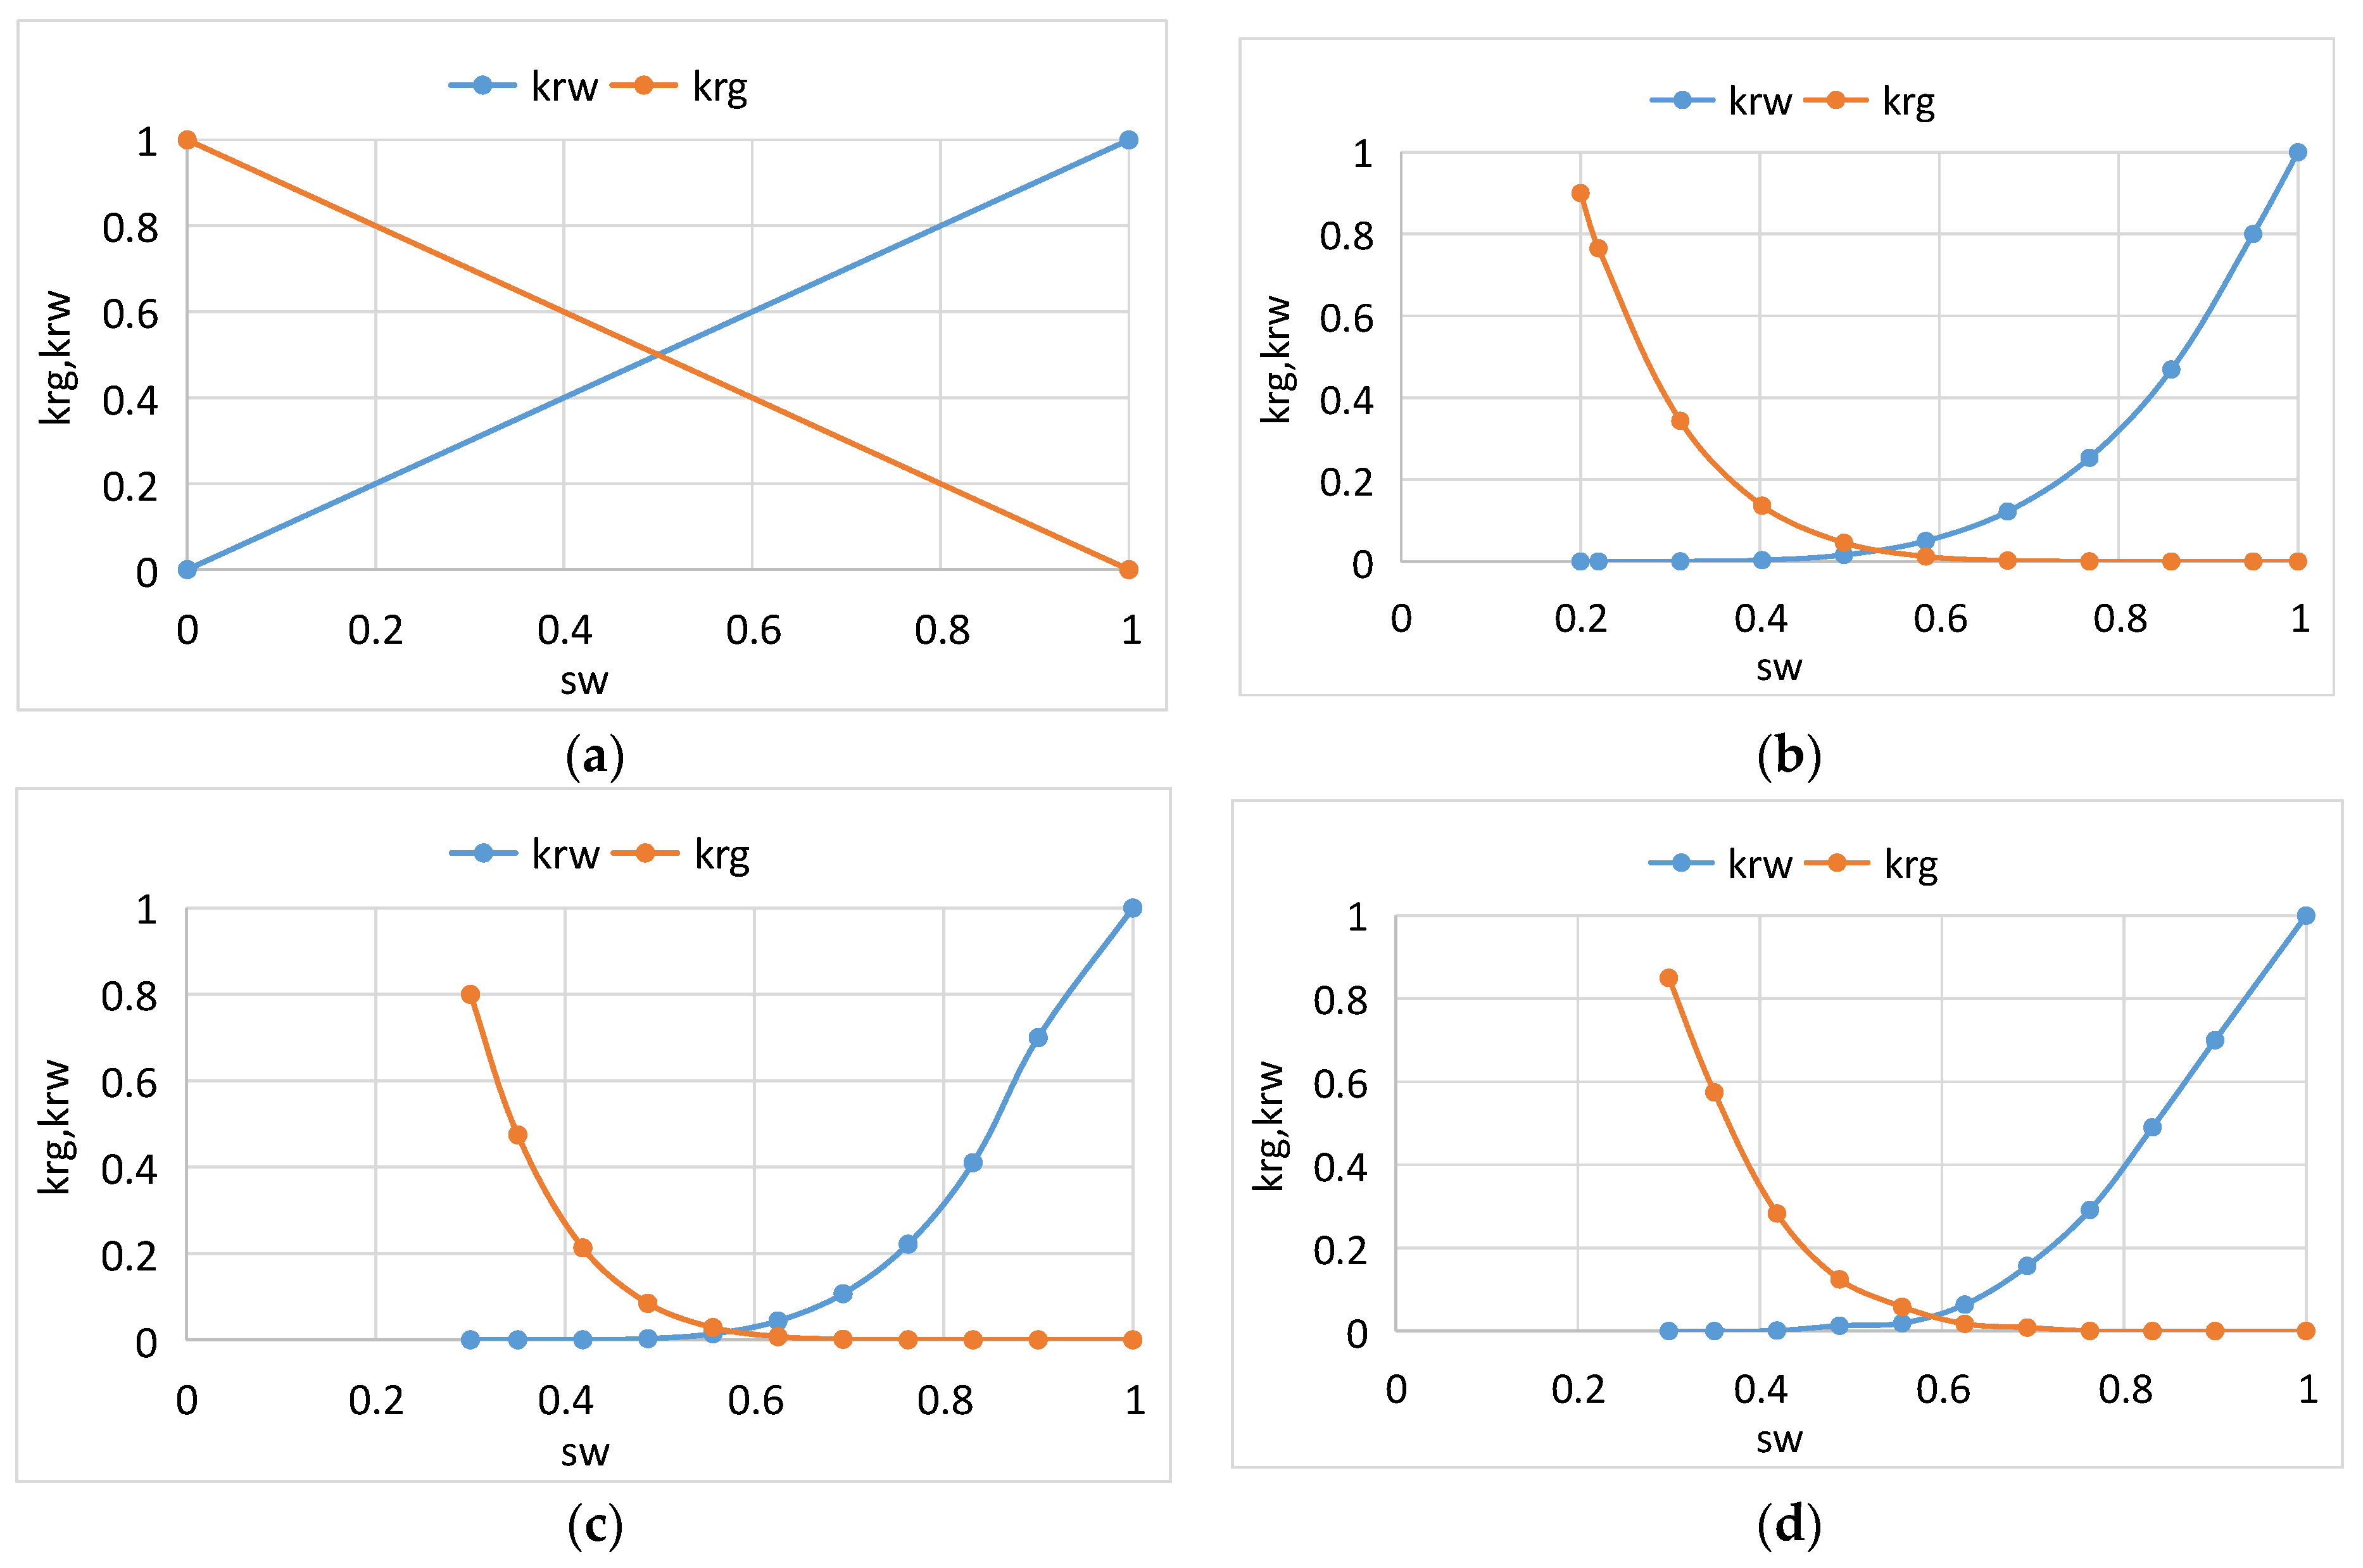
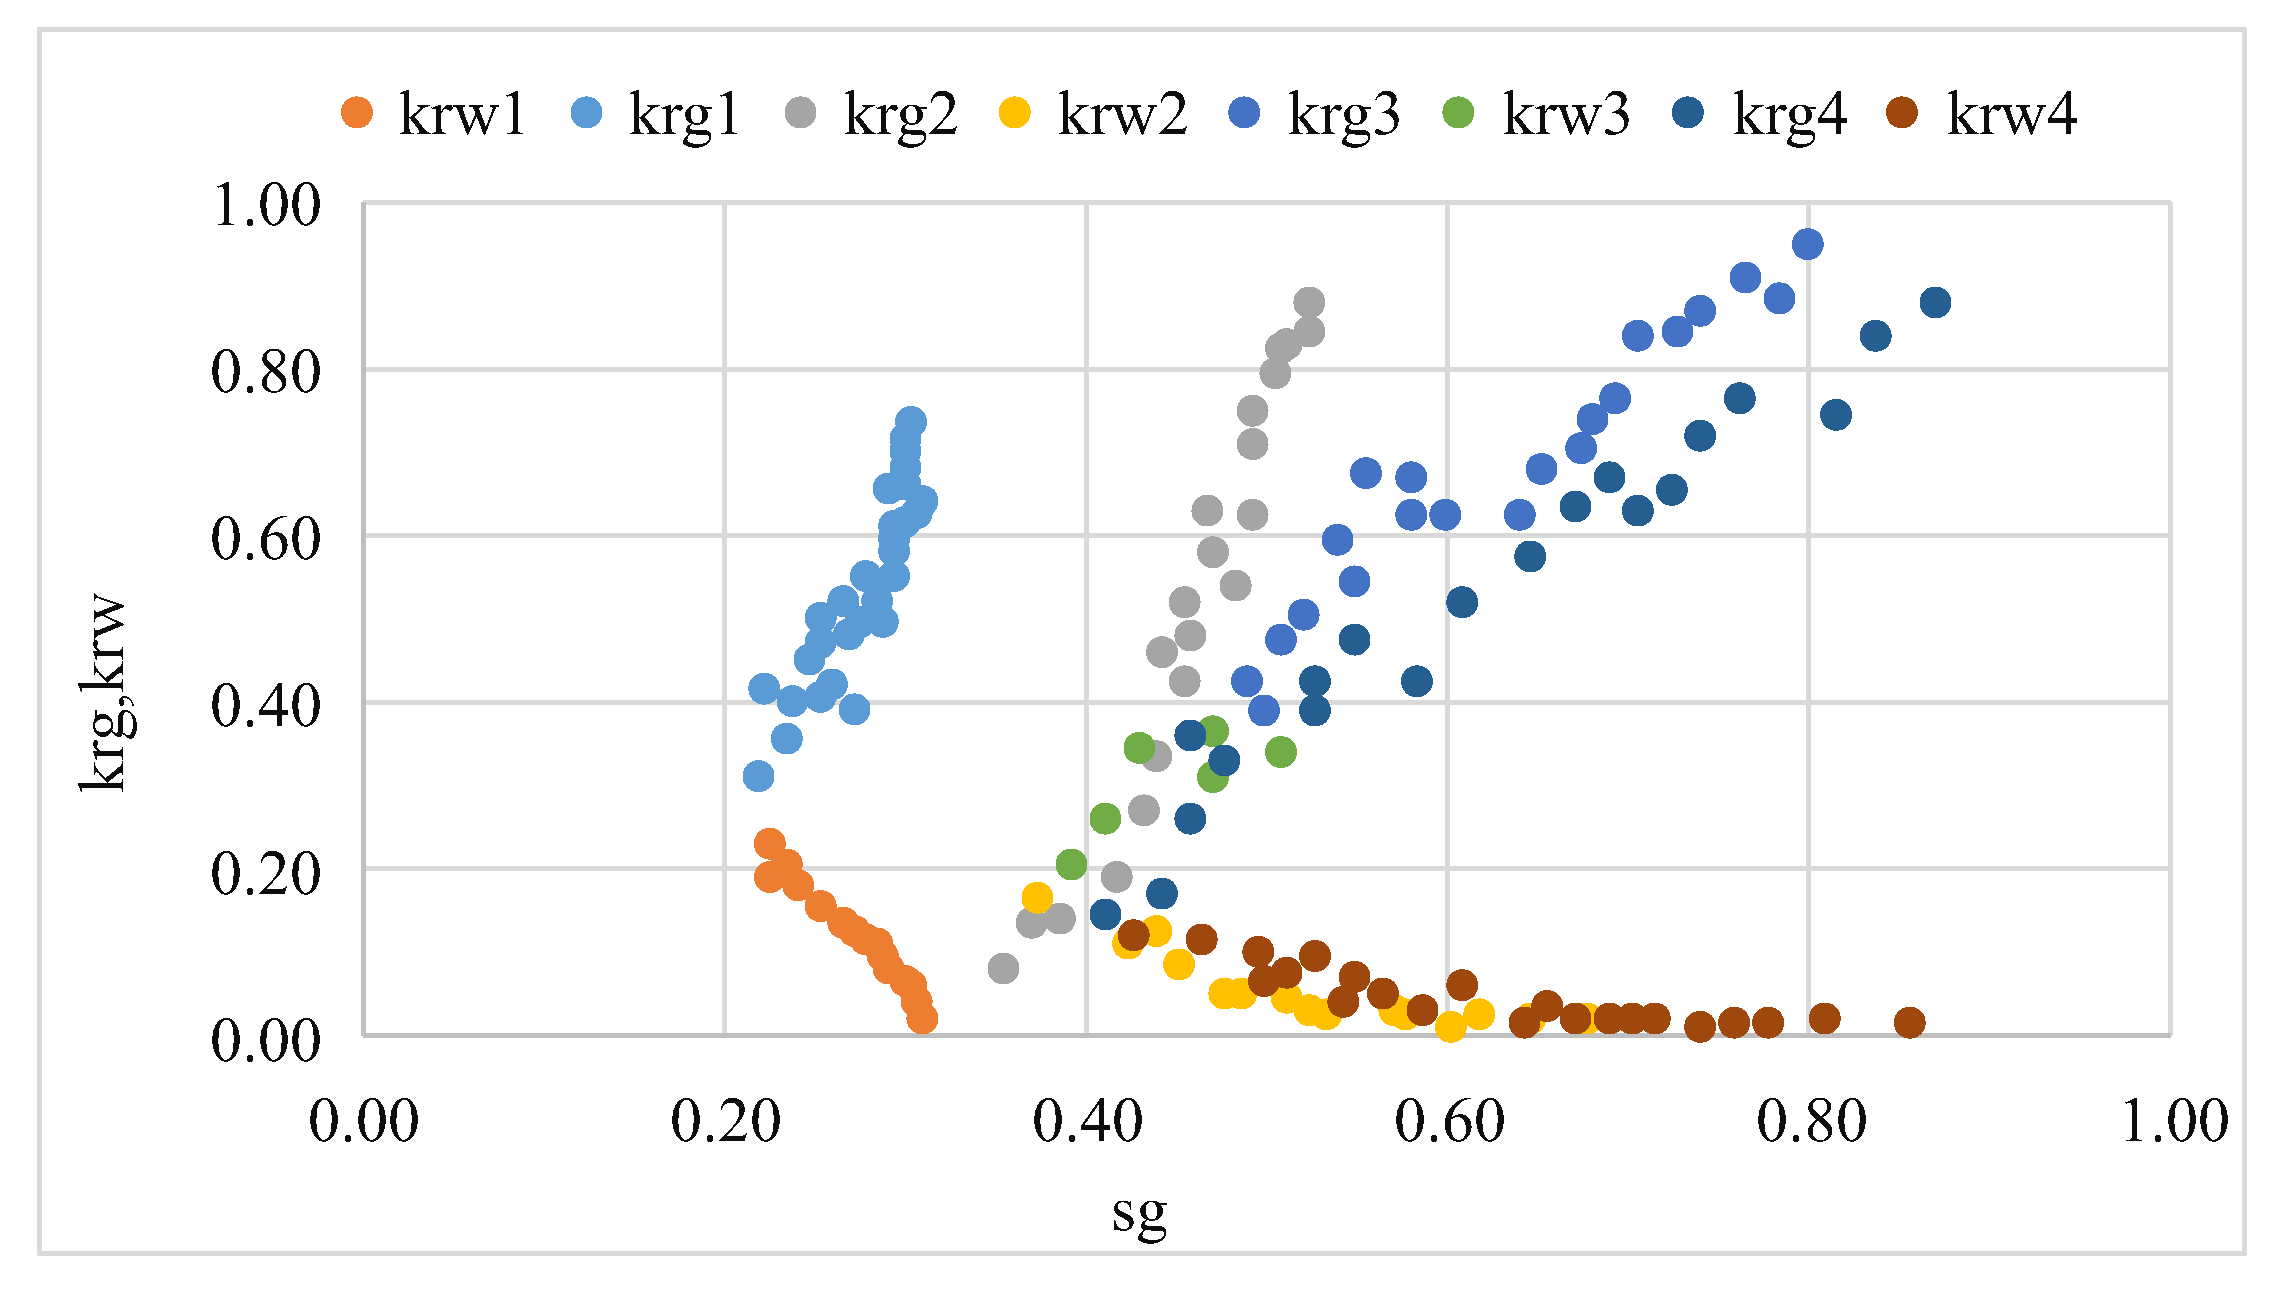
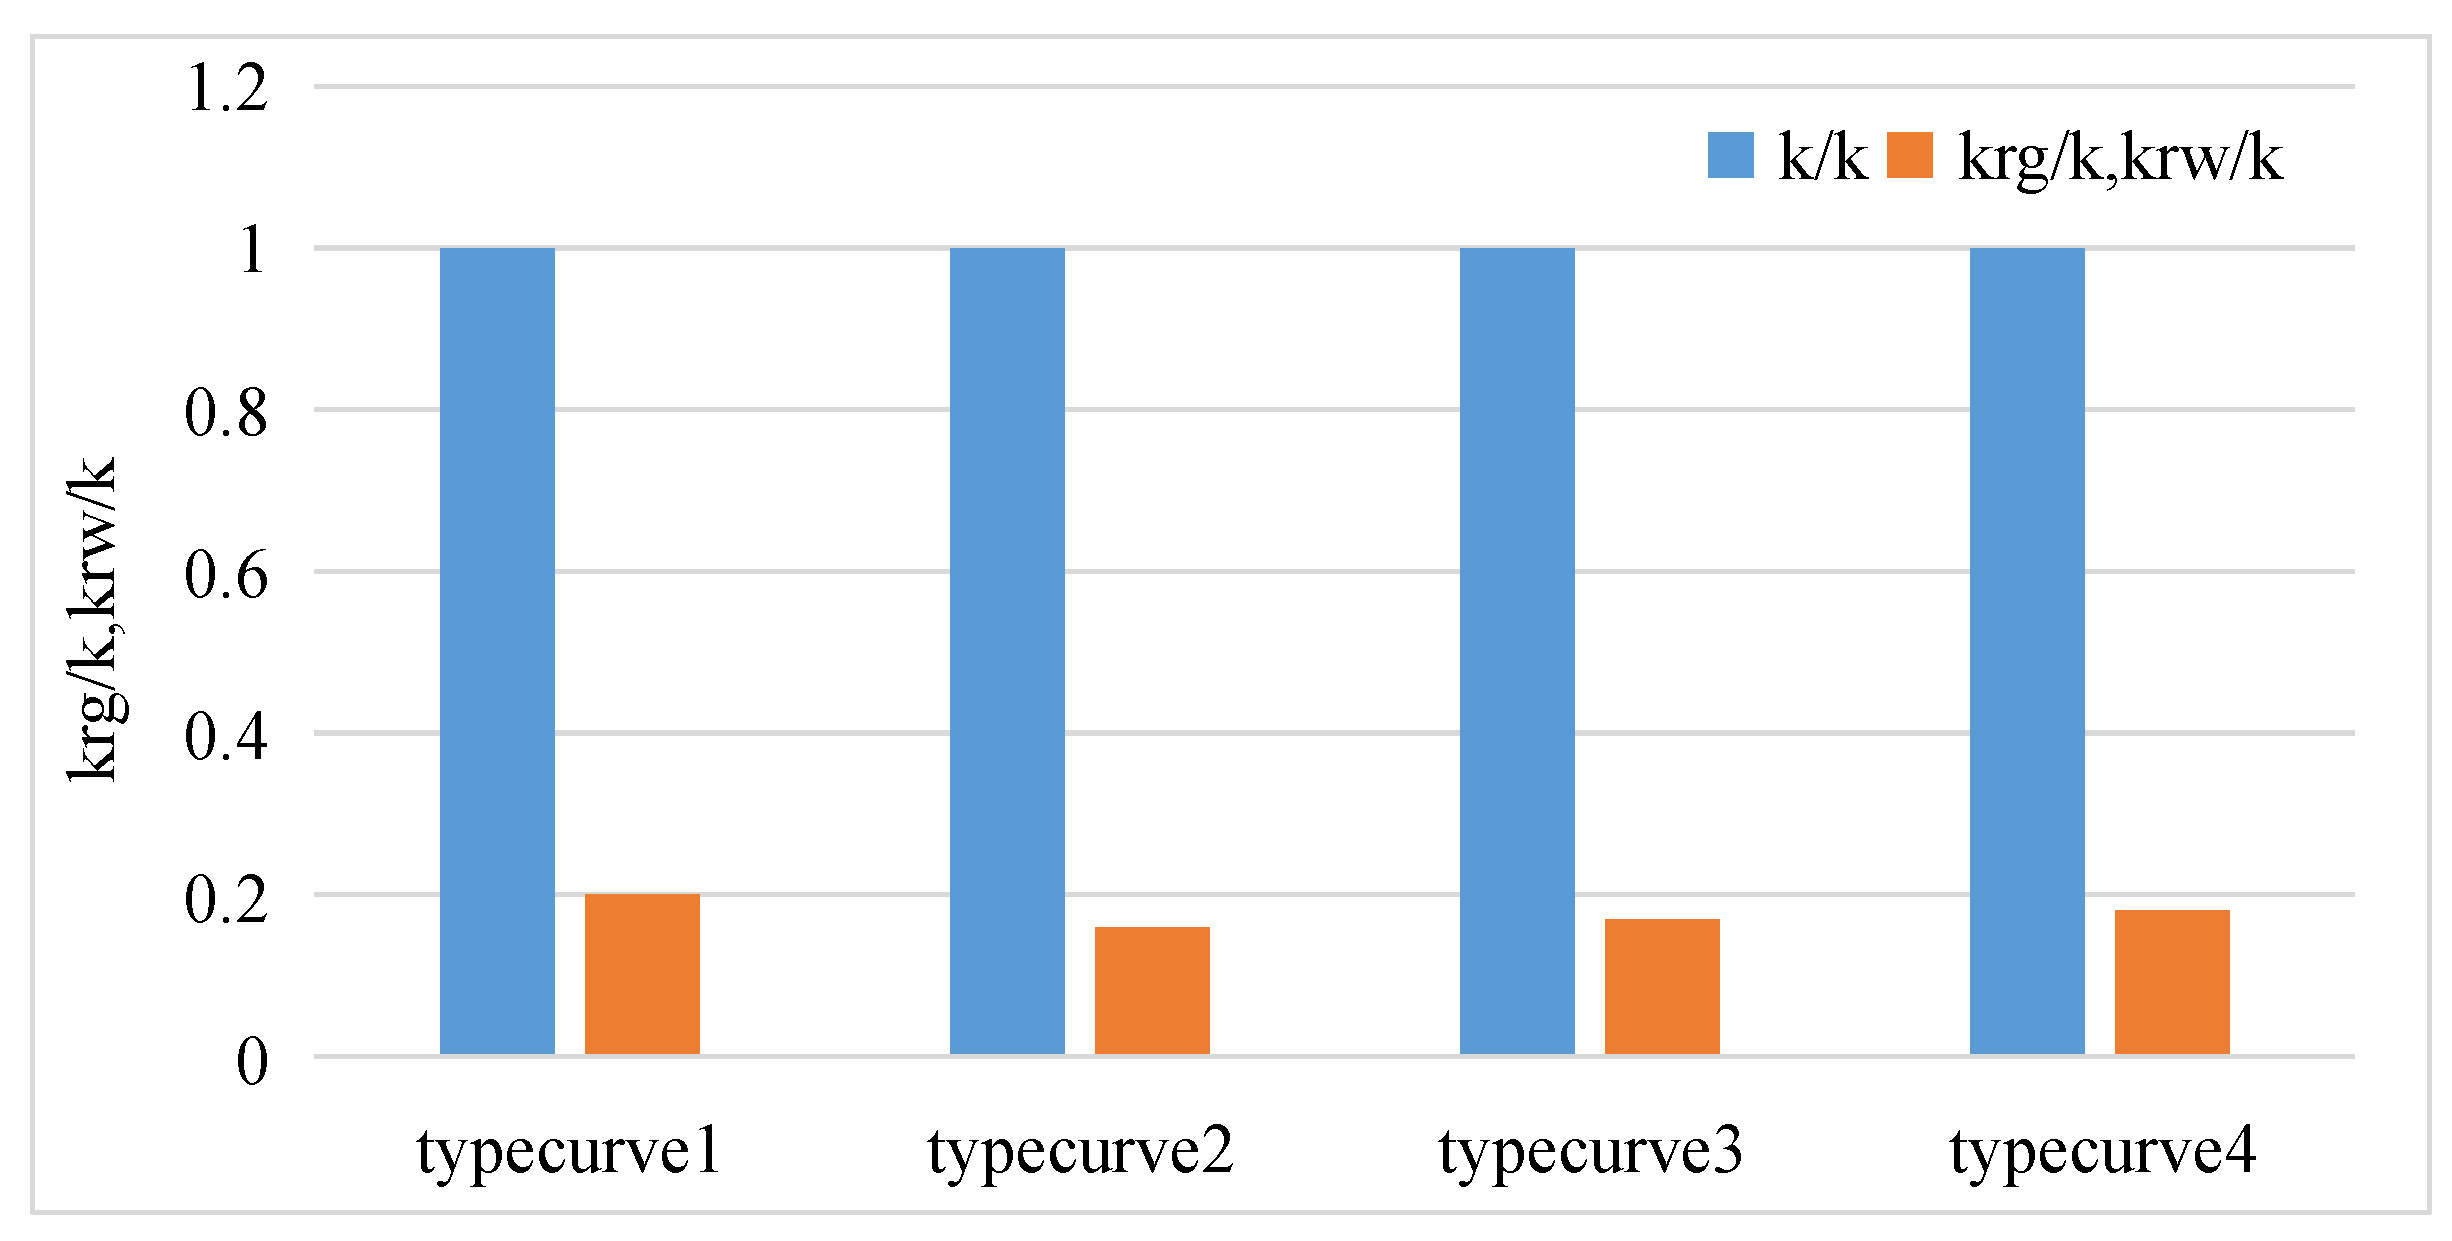
2.1. Influence of Two Phase Flow on Coalbed Methane Reservoir Production

Gas–water two phase seepage is mainly manifested by the changes in the relative permeability of the liquid and gas phases in reservoirs with different gas saturation levels. Because a coal reservoir is considered as a kind of reservoir with relatively developed fractures, the phase permeability curve of coalbed methane is usually of the “X” type at present. However, through testing the phase permeability curve of a coal reservoir, it is considered that the phase permeability curve of a coal reservoir is consistent with that of a porous medium reservoir [24] (Figure 1); the gas phase permeability and water phase permeability near the isotonic point can drop to 0.2 times the absolute permeability, and the seepage efficiency in the reservoir is greatly reduced (Figure 2). Therefore, the phase permeability curve can be used to characterize the influence of gas–water two phase flow on reservoir seepage capacity.
The entire life cycle of a coalbed methane well refers to the whole stage from the first day of production until the gas production drops to the economic limit and is abandoned. The entire life cycle of a coalbed methane well can be divided into four stages (Figure 3):
Stage 1: The single-phase water flow stage. When the fluid in the coal seam is single-phase water, with the removal of formation water, the reservoir pressure gradually decreases, and the end point of this stage is that the bottom-hole flow pressure drops to 1.2 times the predicted critical desorption pressure. The boundary point between stage 1 and stage 2 is where coalbed methane is about to burst gas, and 1.2 times the bottom flow pressure of the burst gas well is only an empirical node.
Stage 2: The pressure control stage before gas is seen. When entering this stage, the coal reservoir is about to exhibit desorption. At this stage, it is necessary to control the drop rate of flow pressure at the bottom hole and gradually transition from single-phase flow to two phase flow. The dividing point between stage 2 and stage 3 is where gas production reaches stable gas production. In general, the gas production in the stable production period is predicted according to the geological conditions of coalbed methane wells.
Stage 3: The gas–water two phase flow stage, in which the adsorbed gas in the coal seam is desorbed from the matrix to free gas and flows into the reservoir to the wellbore. In this stage, the production is carried out according to the predicted stable production period of the coalbed methane well. The dividing point between stage 3 and stage 4 is bottom-hole flow pressure. The stable gas production process of a coalbed methane well is the process of flow pressure exchange for gas production. When the bottom-hole flow pressure is reduced to atmospheric pressure and cannot be further reduced, the CBM well enters stage 4 from stage 3; that is, it moves from the stable production stage to the decline stage.
Stage 4: In this stage, the bottom-hole flow pressure decreases to atmospheric pressure, the production pressure difference can no longer maintain the stable production of coalbed methane wells, and the coalbed methane wells enter the decline stage until the end of the production cycle. Stage 4 ends when the gas production of coalbed methane wells is below the economic limit. The production of coalbed methane wells has no economic benefit when the gas production is below the economic limit. The gas wells will be shut down after the completion of stage 4. The whole life cycle of the coalbed methane well ends.
The process of coalbed methane production will progress from single-phase water flow to gas–water two phase flow, and the permeability of the reservoir will decrease after the two phase flow begins. In the process of coalbed methane production, we should extend the single-phase water flow time as far as possible under economic conditions, which can improve the depressurization efficiency of coal reservoirs and is conducive to the desorption of coalbed methane.
Numerical simulation is used to demonstrate the influence of the reservoir phase permeability curve on gas well production. The specific parameters of numerical simulation were derived from an actual coalbed methane reservoir. PRTREL RE (version: 2021.3.0) reservoir numerical simulation software of Schlumberger was used for numerical simulation, and the basic model adopted was a two-hole and single-permeability model suitable for simulating coalbed methane reservoirs. Schlumberger is a French oil and gas exploration and development technology service provider, our company purchased the software from Schlumberger China. Through numerical simulation, it was found that the productivity of coalbed methane wells varies greatly under different phase permeability conditions (Figure 4). Under the same geological conditions, the gas production of a single well can reach 1000 m/day when using the conventional fracture system phase permeability curve, while the output of a single well is only 790 m/day, 330 m/day and 260 m/day when using curves b, c and d respectively (Figure 5). The shape of the phase permeability curve has a great influence on the gas production of coalbed methane wells. In the numerical simulation of a reservoir, the permeability curve of the fracture system cannot be simply used, but the actual permeability curve or the adjacent permeability curve under the same geological conditions should be used for numerical simulation and production system optimization.
Through the relationship between pressure control time and peak gas production per unit abundance of different coalbed methane blocks, it can be seen that different blocks have higher peak gas production and higher gas well productivity at one or several pressure control times (from Figure 6, Figure 7 and Figure 8).
On the basis of the same geological model, different pressure control times were set to simulate the reservoir pressure drop during production. The final pressure drop funnel shows that when the pressure control time of well A is 4 months, the final pressure drop funnel is the lowest, and the reservoir desorption effect is the best (Figure 9 and Figure 10).

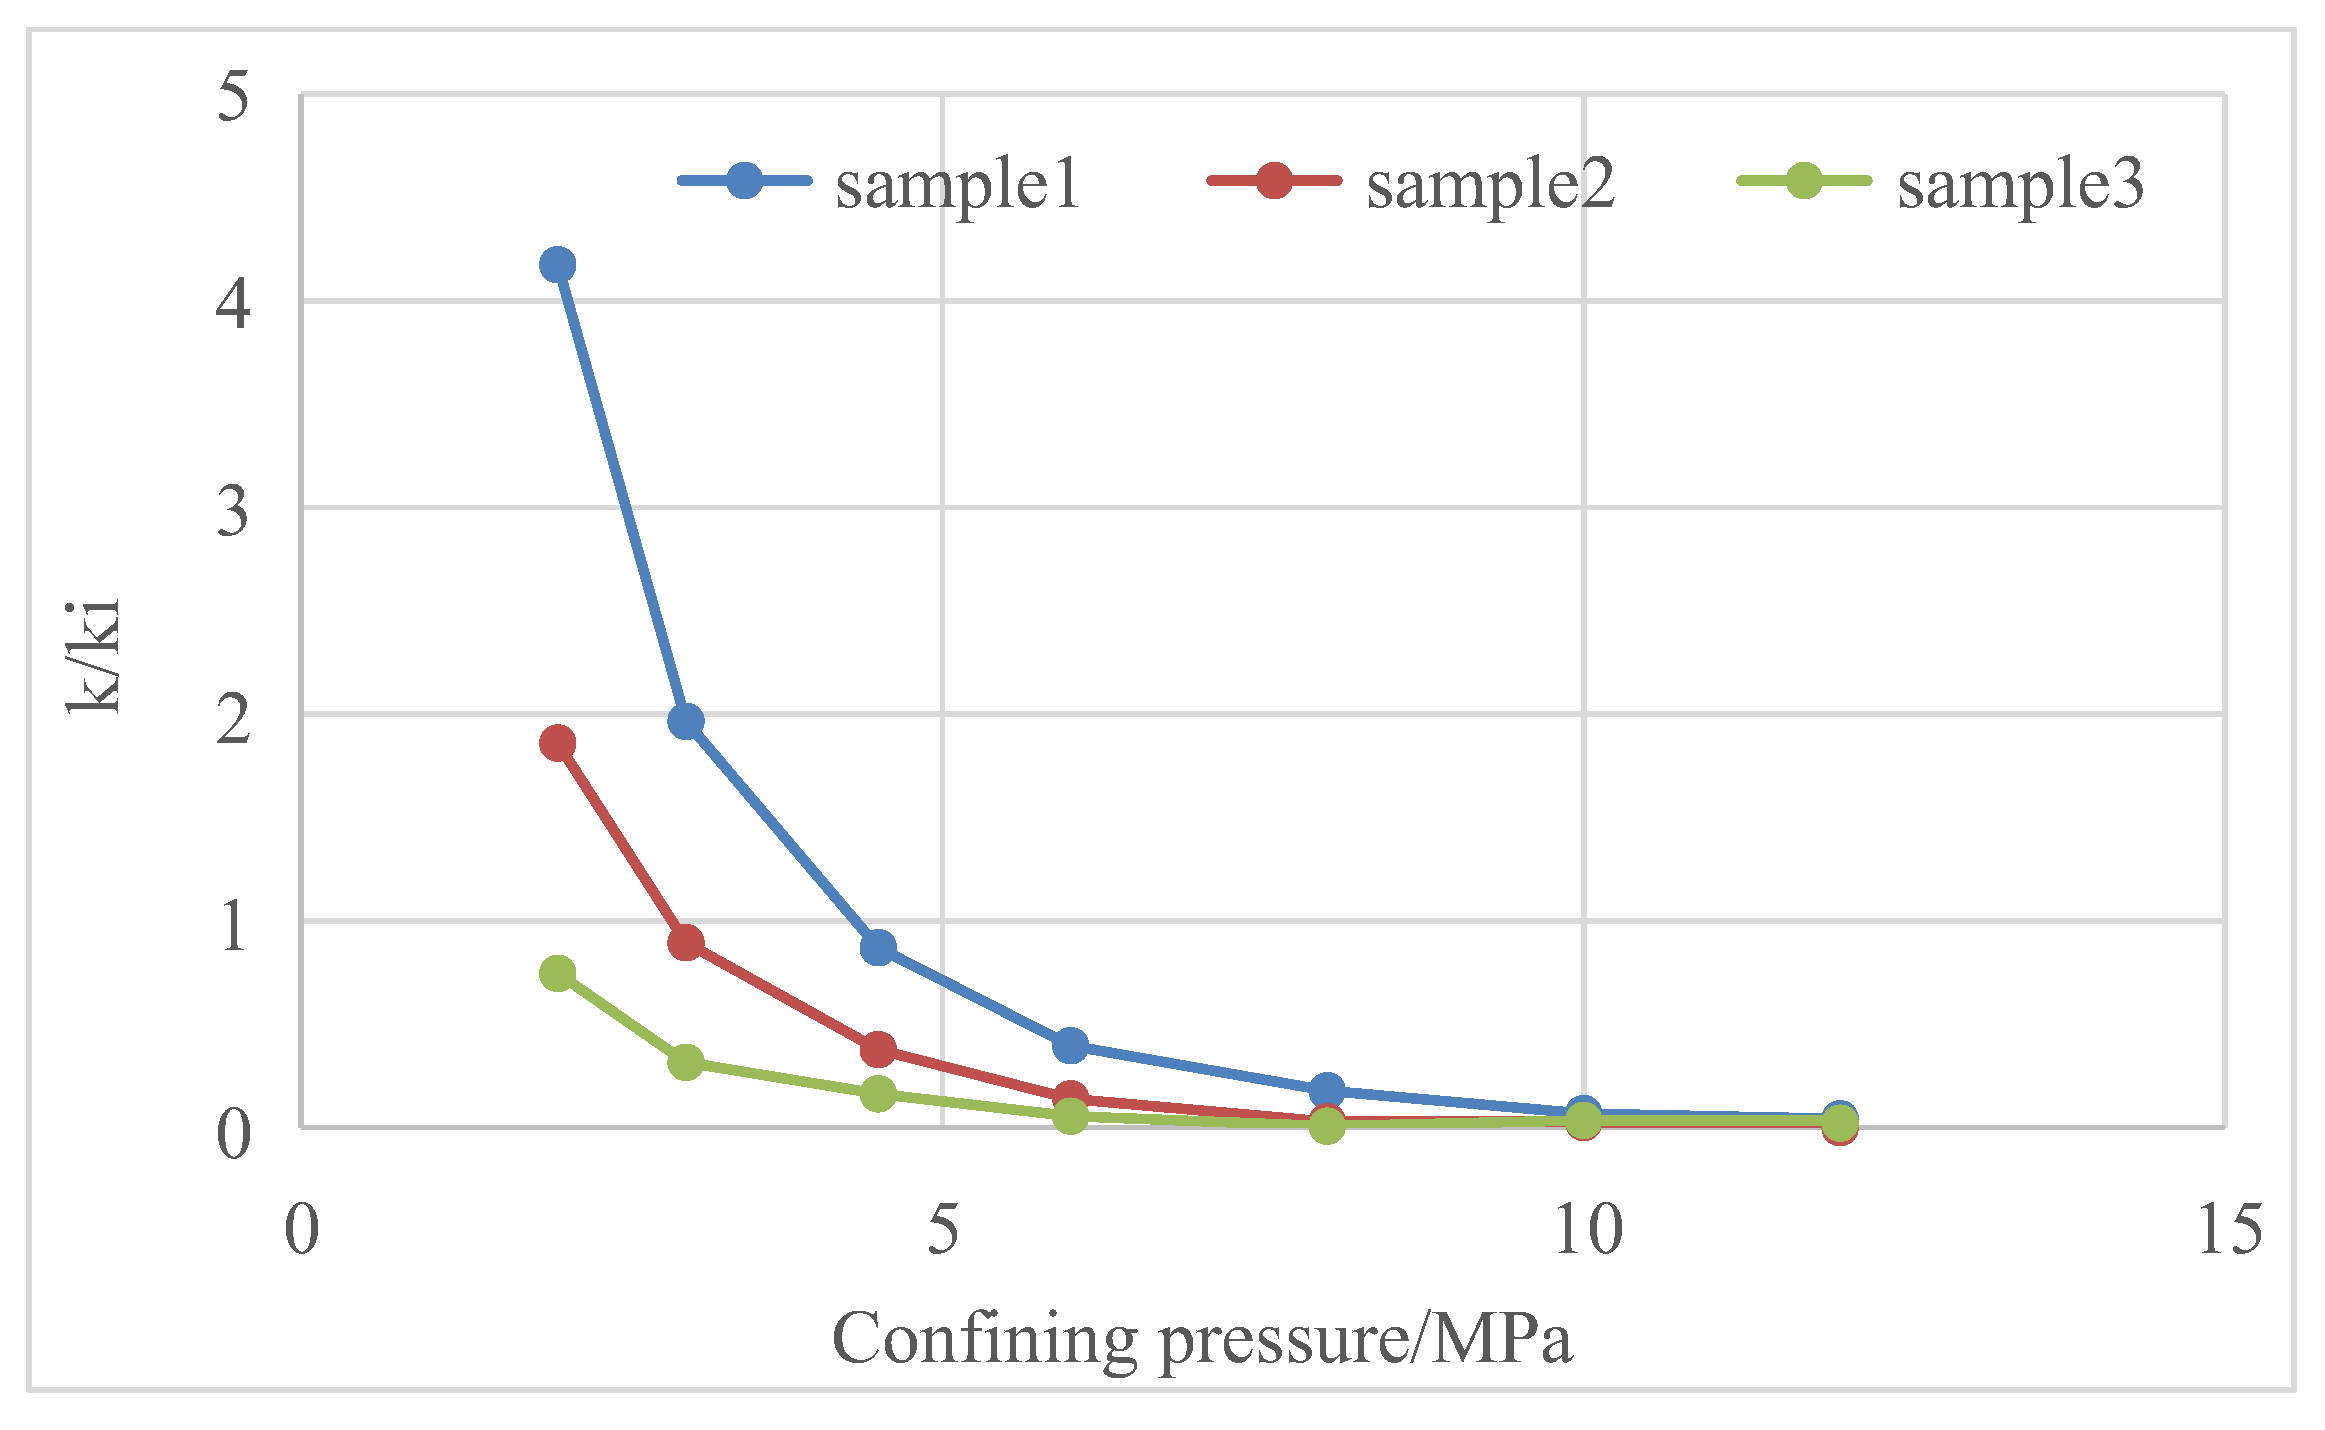
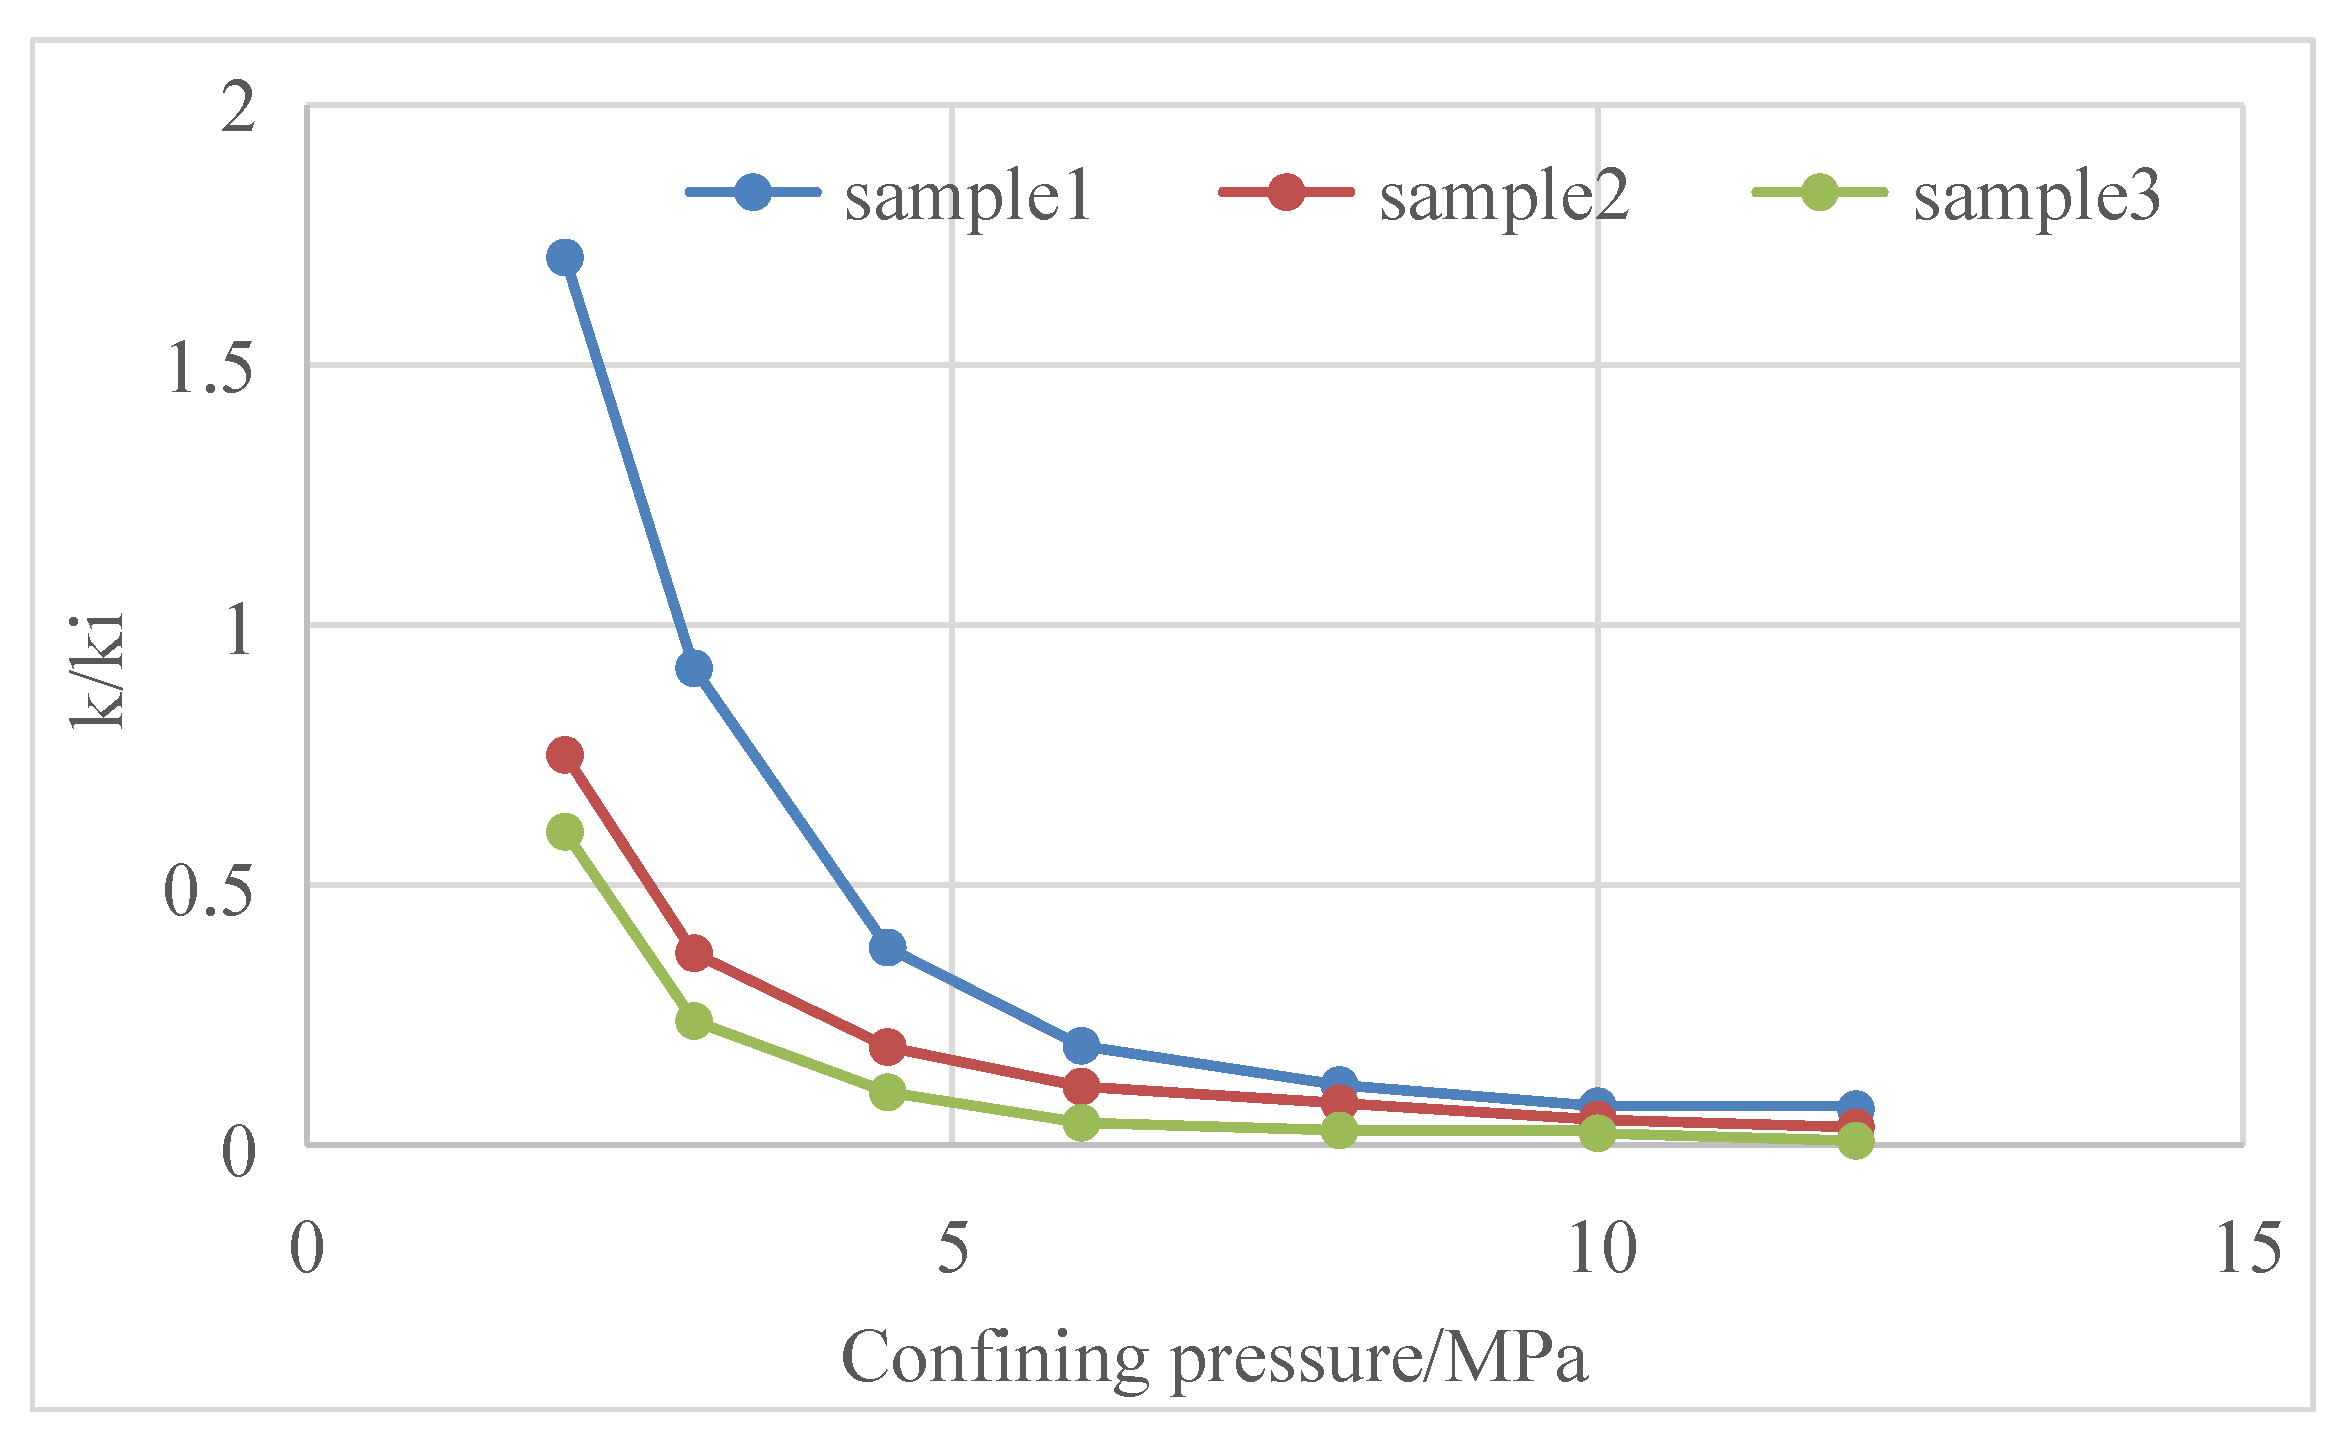
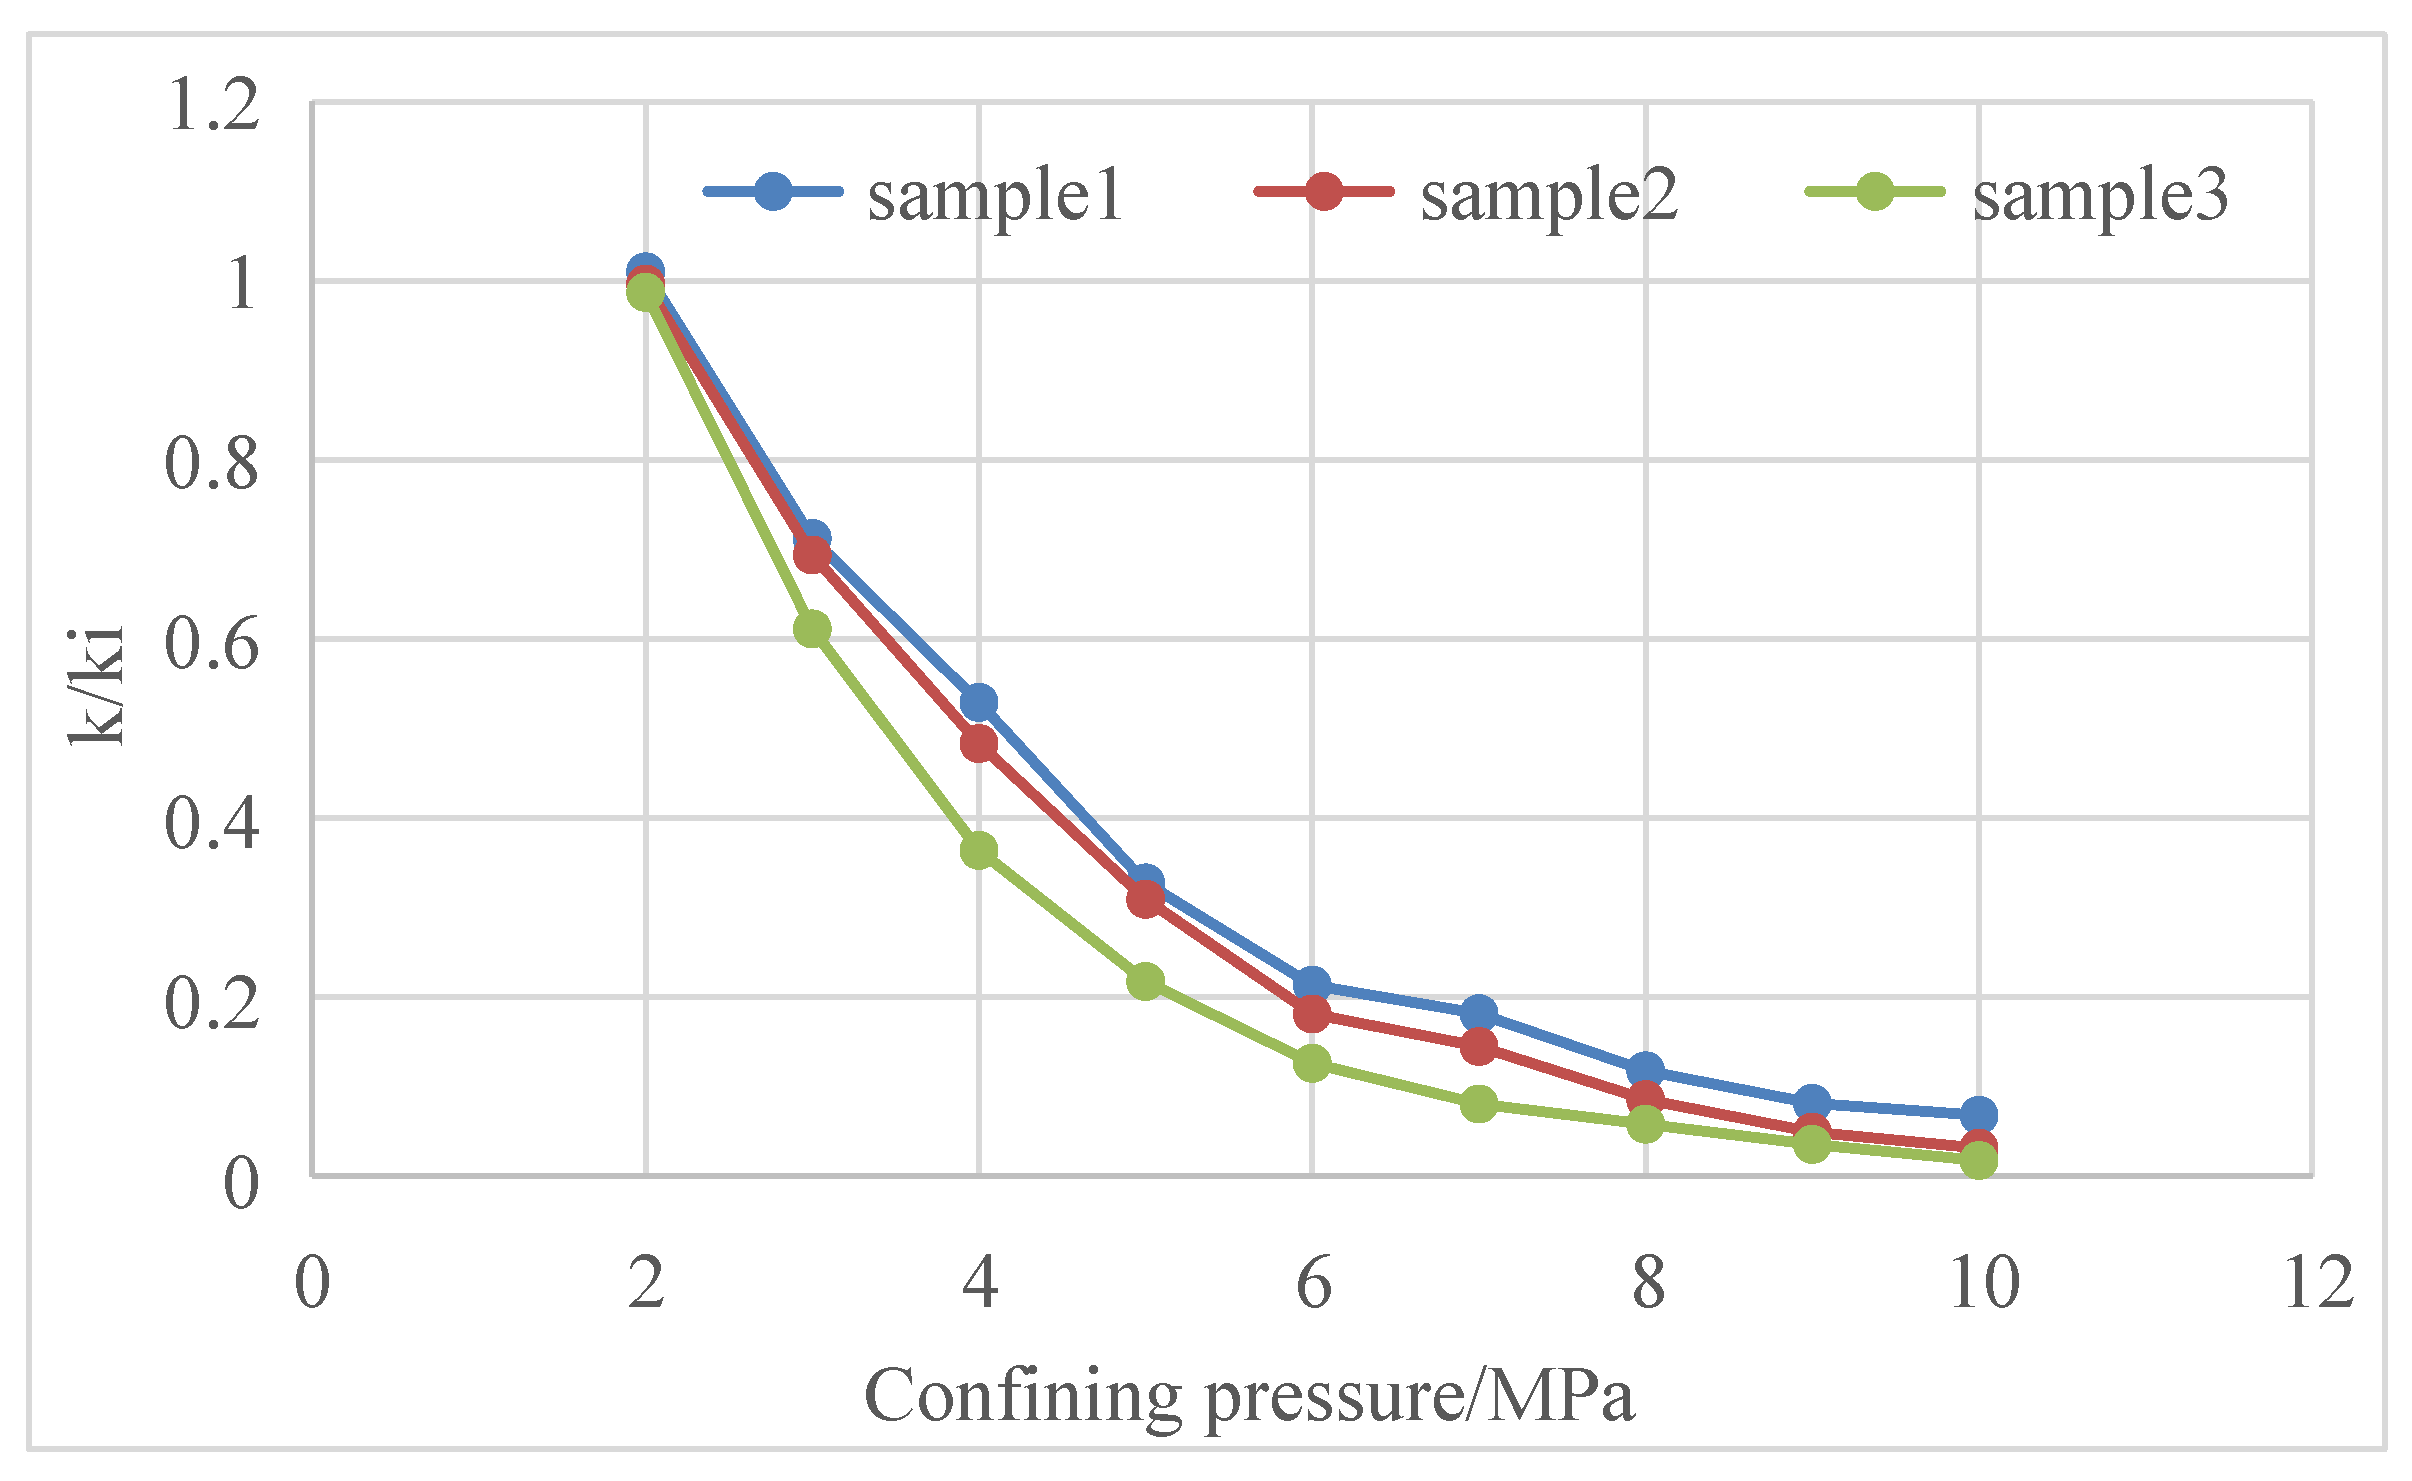
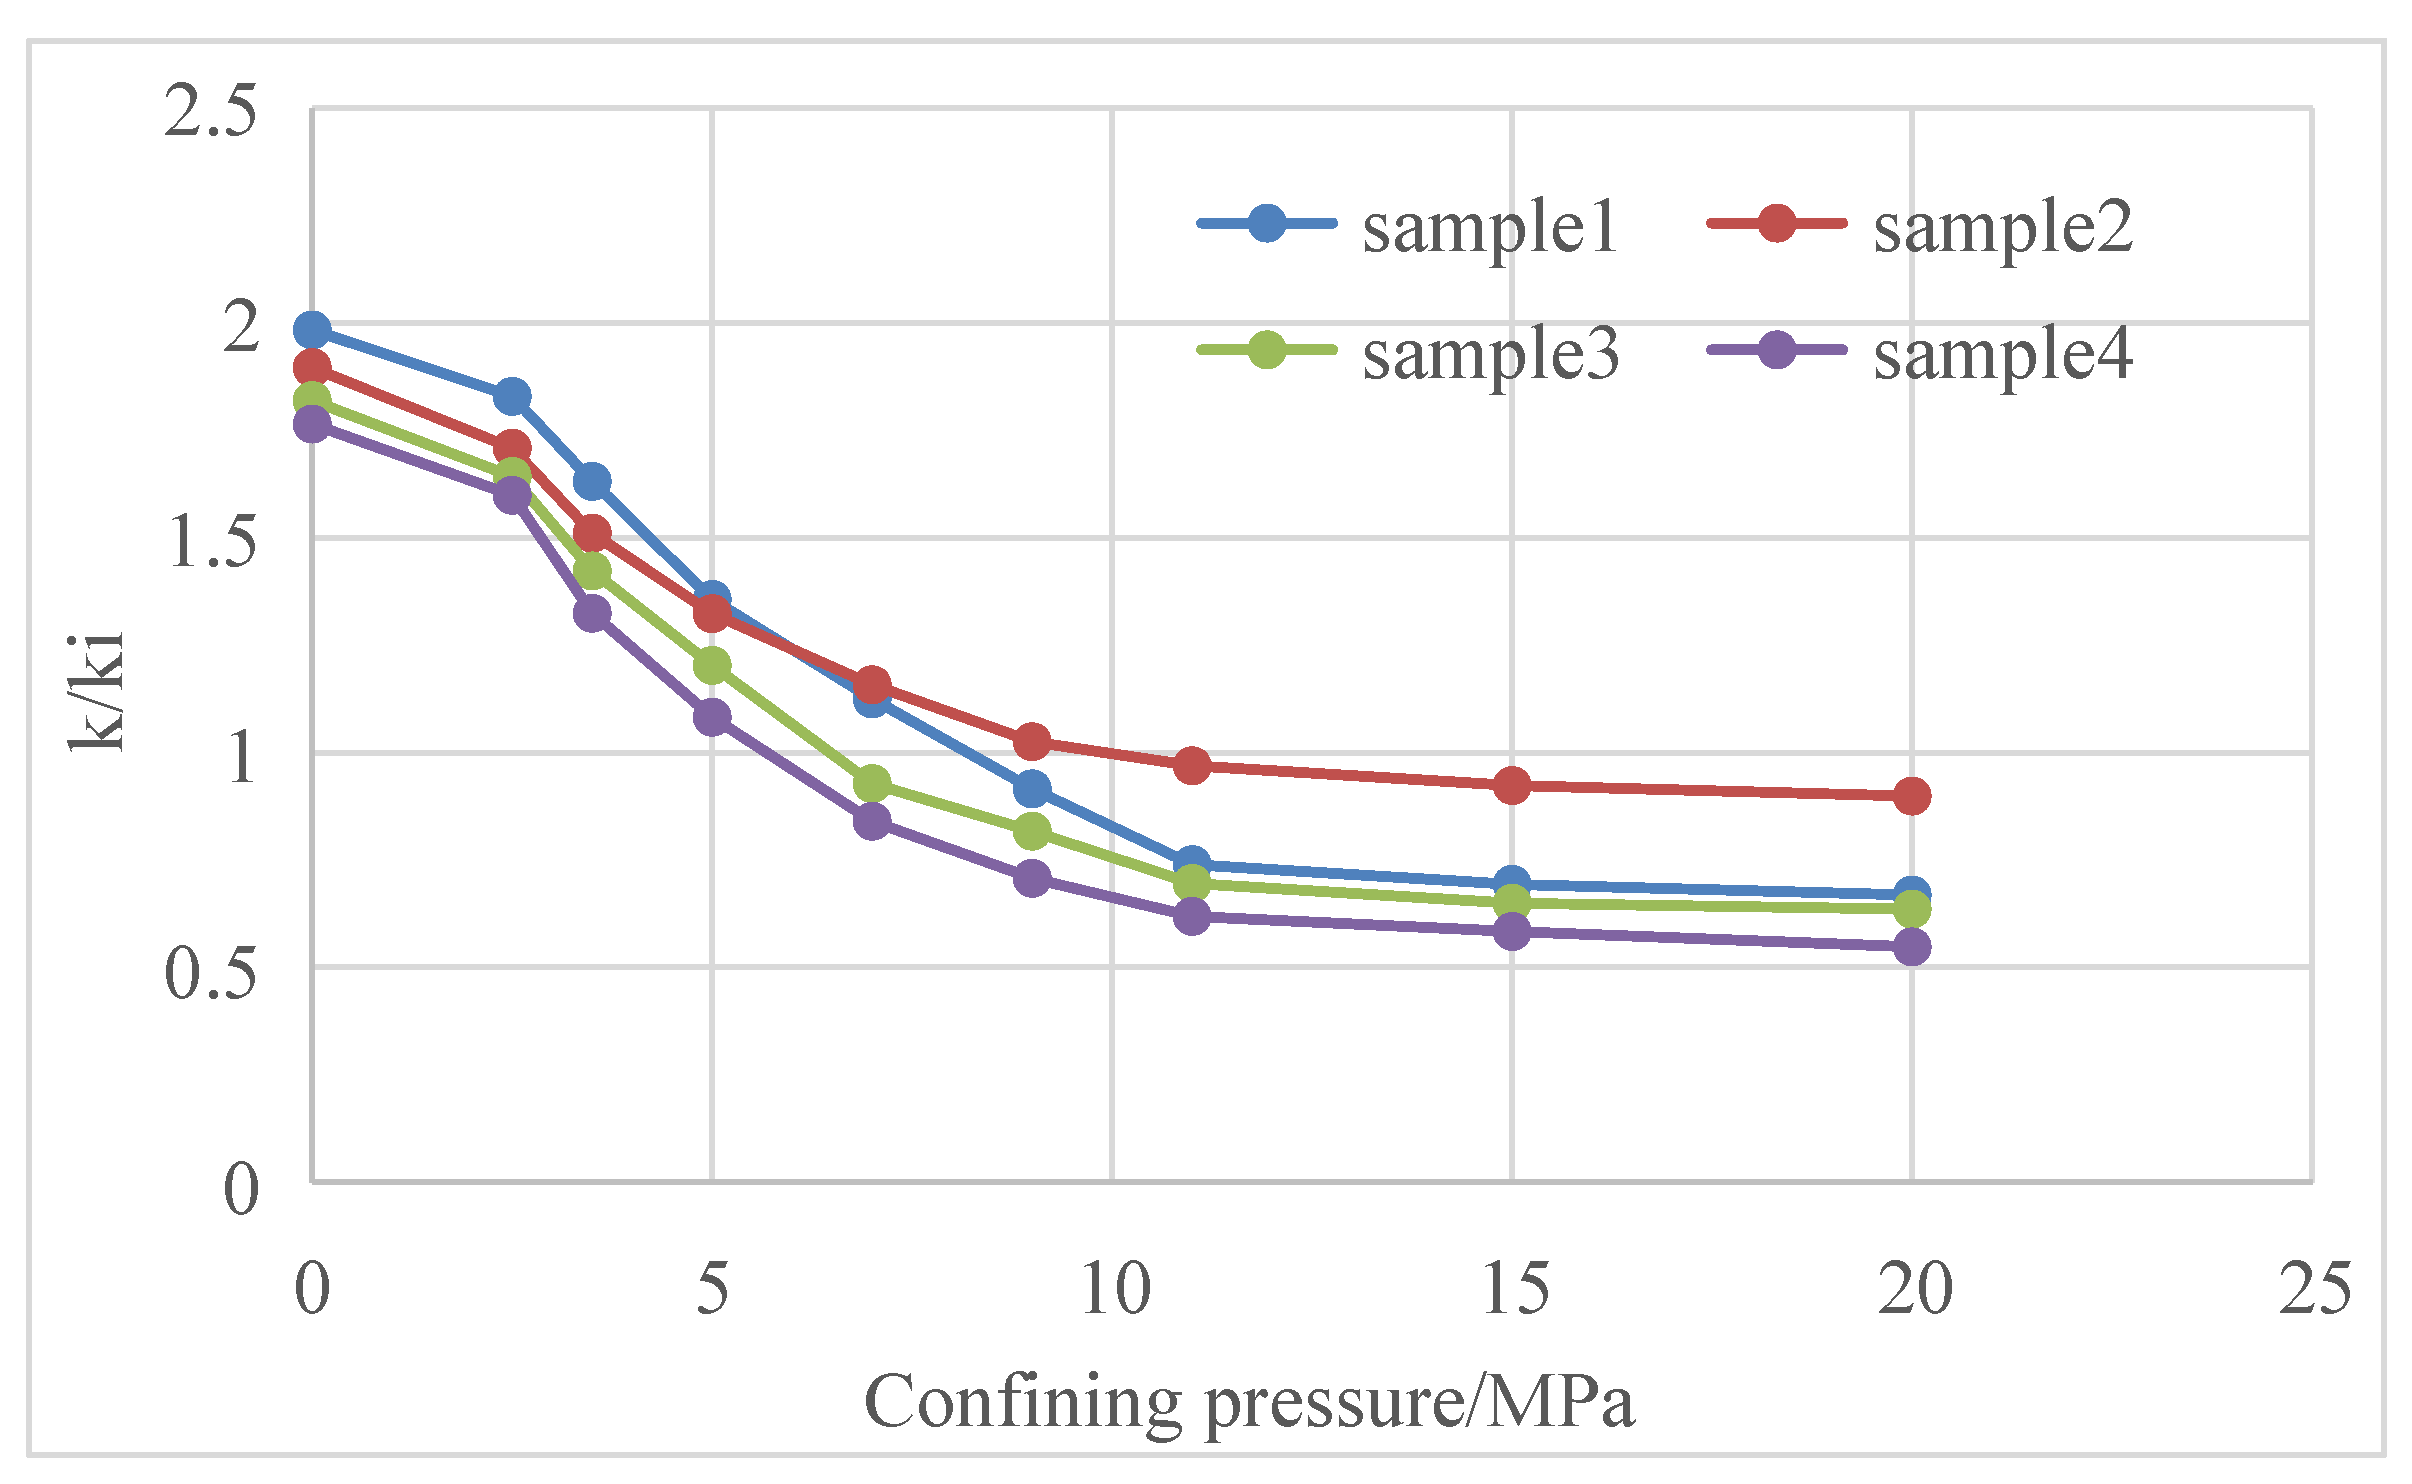
2.2. Influence of Stress Sensitivity and Matrix Shrinkage Effects on Coalbed Methane

Both reservoir stress sensitivity and matrix shrinkage effects show that reservoir permeability changes with the change in reservoir fracturing [25,26,27]. Core tests have tested the changes in core permeability with confining pressure in Baode block on the eastern edge of Ordos Basin, Mabi block in the southern part of Qinshui Basin, Zhengzhuang block and Fanzhuang block in the southern part of Qinshui Basin and Qilihe block in the northern part of Qinshui Basin [28,29,30] (Figure 11, Figure 12, Figure 13, Figure 14, Figure 15, Figure 16, Figure 17 and Figure 18).
At present, there are many equations describing stress sensitivity and matrix shrinkage, but the four mentioned in the introduction are more widely used.
The Seidle and Huitt model is as follows:
ϕ ϕ i = 1 + 1 + 2 ϕ i C m 10 6 V L p i p L + p i + p p L + p
The Palmer and Mansoori model is as follows:
ϕ ϕ i = 1 + C m a ϕ i p p i + ε l ϕ i K M V L p i p L + p p i p L + p i
The Shi and Durucan model is as follows:
k = k i e 3 c f σ σ i
when the local layer pressure is higher than the desorption pressure pd (pi > p > pd),
σ σ i = ν 1 ν p p i
when the layer pressure is lower than or equal to the desorption pressure (pdp > 0),
σ σ i = ν 1 ν p p i + E 3 1 ν ε l p p + p ε p i p ε + p i
The Constant exponential permeability model is as follows:
I = 1 k k p
The symbol in this formula indicates that the change in permeability is inversely proportional to the change in pressure. Equation (6) is integrated, and the initial conditions are taken into account. When the permeability is the original permeability of the reservoir and the pressure is the original pressure of the reservoir, we obtain
k k i = e I p i p
The matrix shrinkage and stress sensitivity effects of coal reservoirs can be evaluated by analytical solution simulation. After taking into account the time-varying effects of permeability, the mass balance equation of coalbed methane becomes
1 r r r · ψ r = ϕ μ K c g + c d ψ t
At this time, in order to integrate the adsorption term in the equation, it is necessary to introduce a pseudo-time function, whose expression is as follows:
t a * p = μ i c t i * 0 t d t K ϕ μ c t * p
c t i * is the total adsorption compression coefficient in the original state, MPa−1; c t * is the total compression coefficient, MPa−1.
c t * = c g + c d = p s c T V L p L Z T s c ϕ p p + p L 2
The pseudo-time function can consider the variation in permeability and porosity with respect to time, and it can be used in combination with the time superposition principle. It is only necessary to input the relation of pore permeability with time, and there have been many studies on the relation of pore permeability with time in coal seams. The quasi-time function can be brought into Equation (8) as follows:
1 r r r ψ r = μ i c t i * ψ t a *
By setting the diffusion state reasonably and introducing the quasi-time function, the right side of the material balance equation can be completely transformed into a constant. After Equation (11) is dimensionless, its solution can be obtained according to the boundary conditions and initial conditions:
p ~ D x D , 0 , s = 1 2 1 1 q ~ D α , s A K 0 x D α 2 s + B I 0 x D α 2 s d α
A and B are constants, representing different boundaries. The values of A and B are shown in Table 1.

2.3. Coal Reservoir External Water Correction

In the process of coalbed methane production, the optimization of all production systems is based on the water in the reservoir. When there is external water intrusion in the coal seam, it will bring errors in calculating the pressure drop funnel by using the material balance equation in the coalbed methane reservoir.
Assuming that the pressure drop funnel of the coal reservoir is a straight line, in the absence of external water, the triangle formed by the gas production funnel is similar to that formed by the water production funnel, and the ratio of the pressure drop in the reservoir is the ratio of the deflating radius to the drainage radius (Figure 19).
P i P c = R w R g
If there is external water intrusion at this time, compared with a closed gas reservoir, the water production will increase, and the corresponding water production funnel calculated based on the material balance equation will increase, as shown in Figure 20. If the parameters at this time are used to optimize the drainage and production system, the optimized parameters will become smaller, affecting the actual production effect. Therefore, for gas reservoirs with external water intrusion in the production process, external water correction should be carried out before the optimization of the production system (Figure 20).

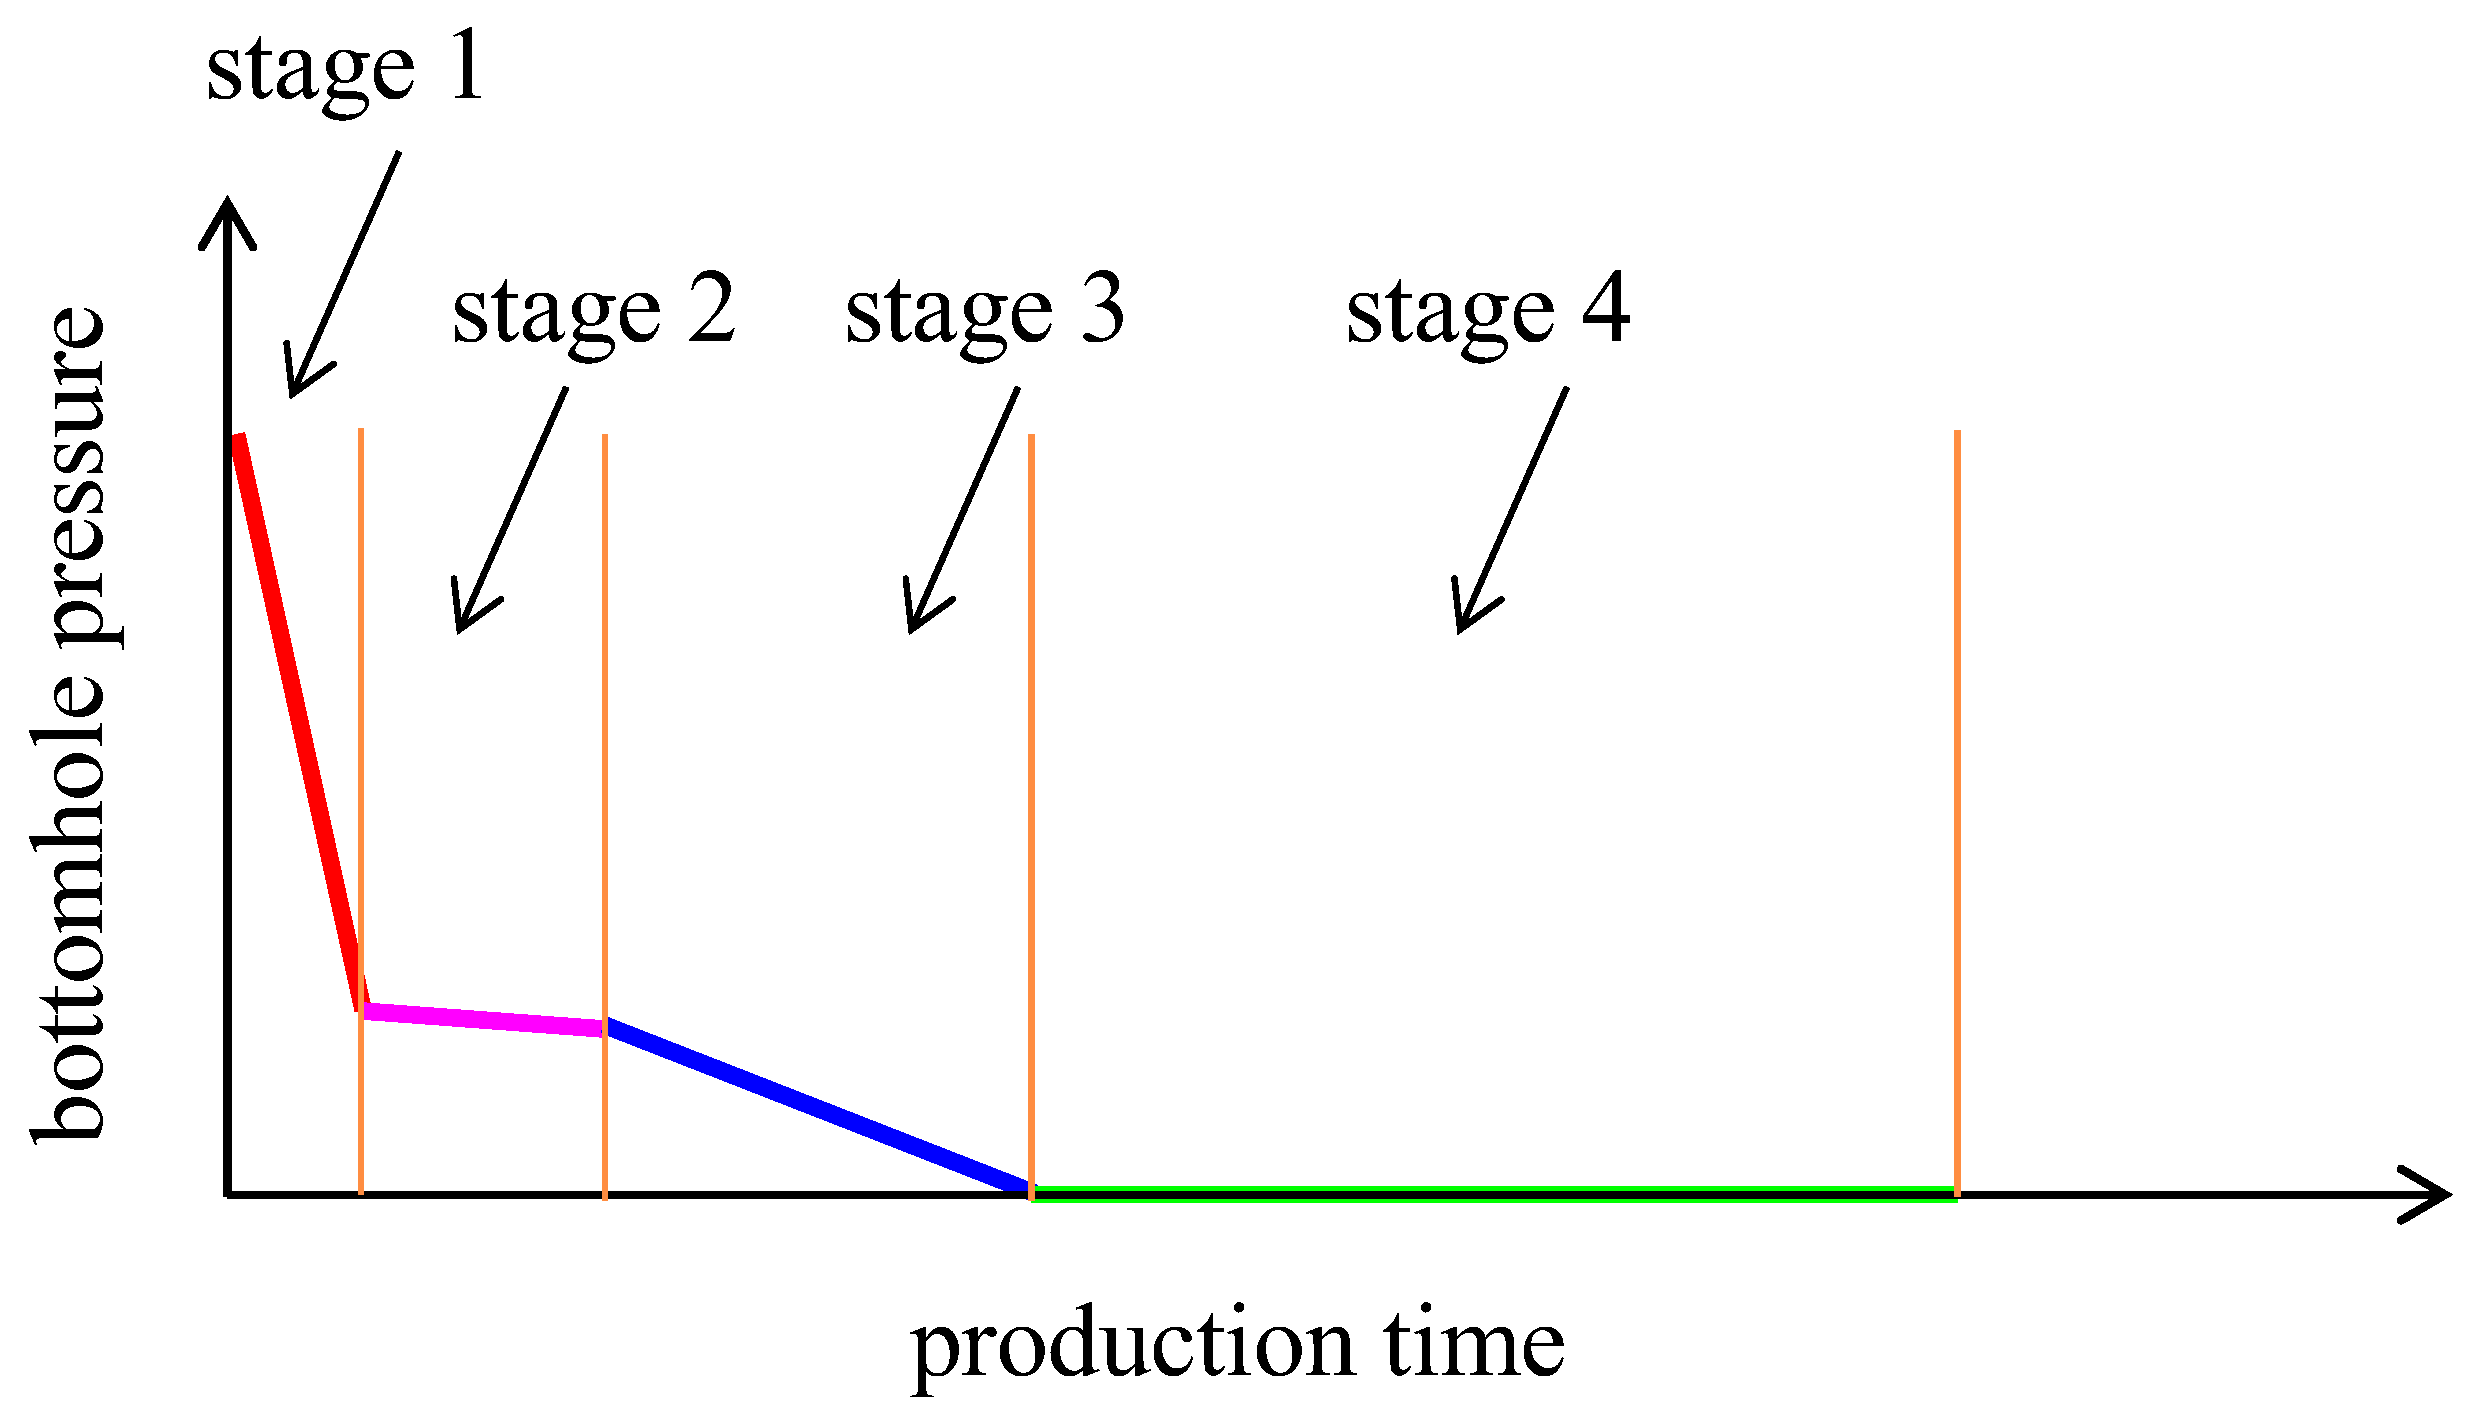
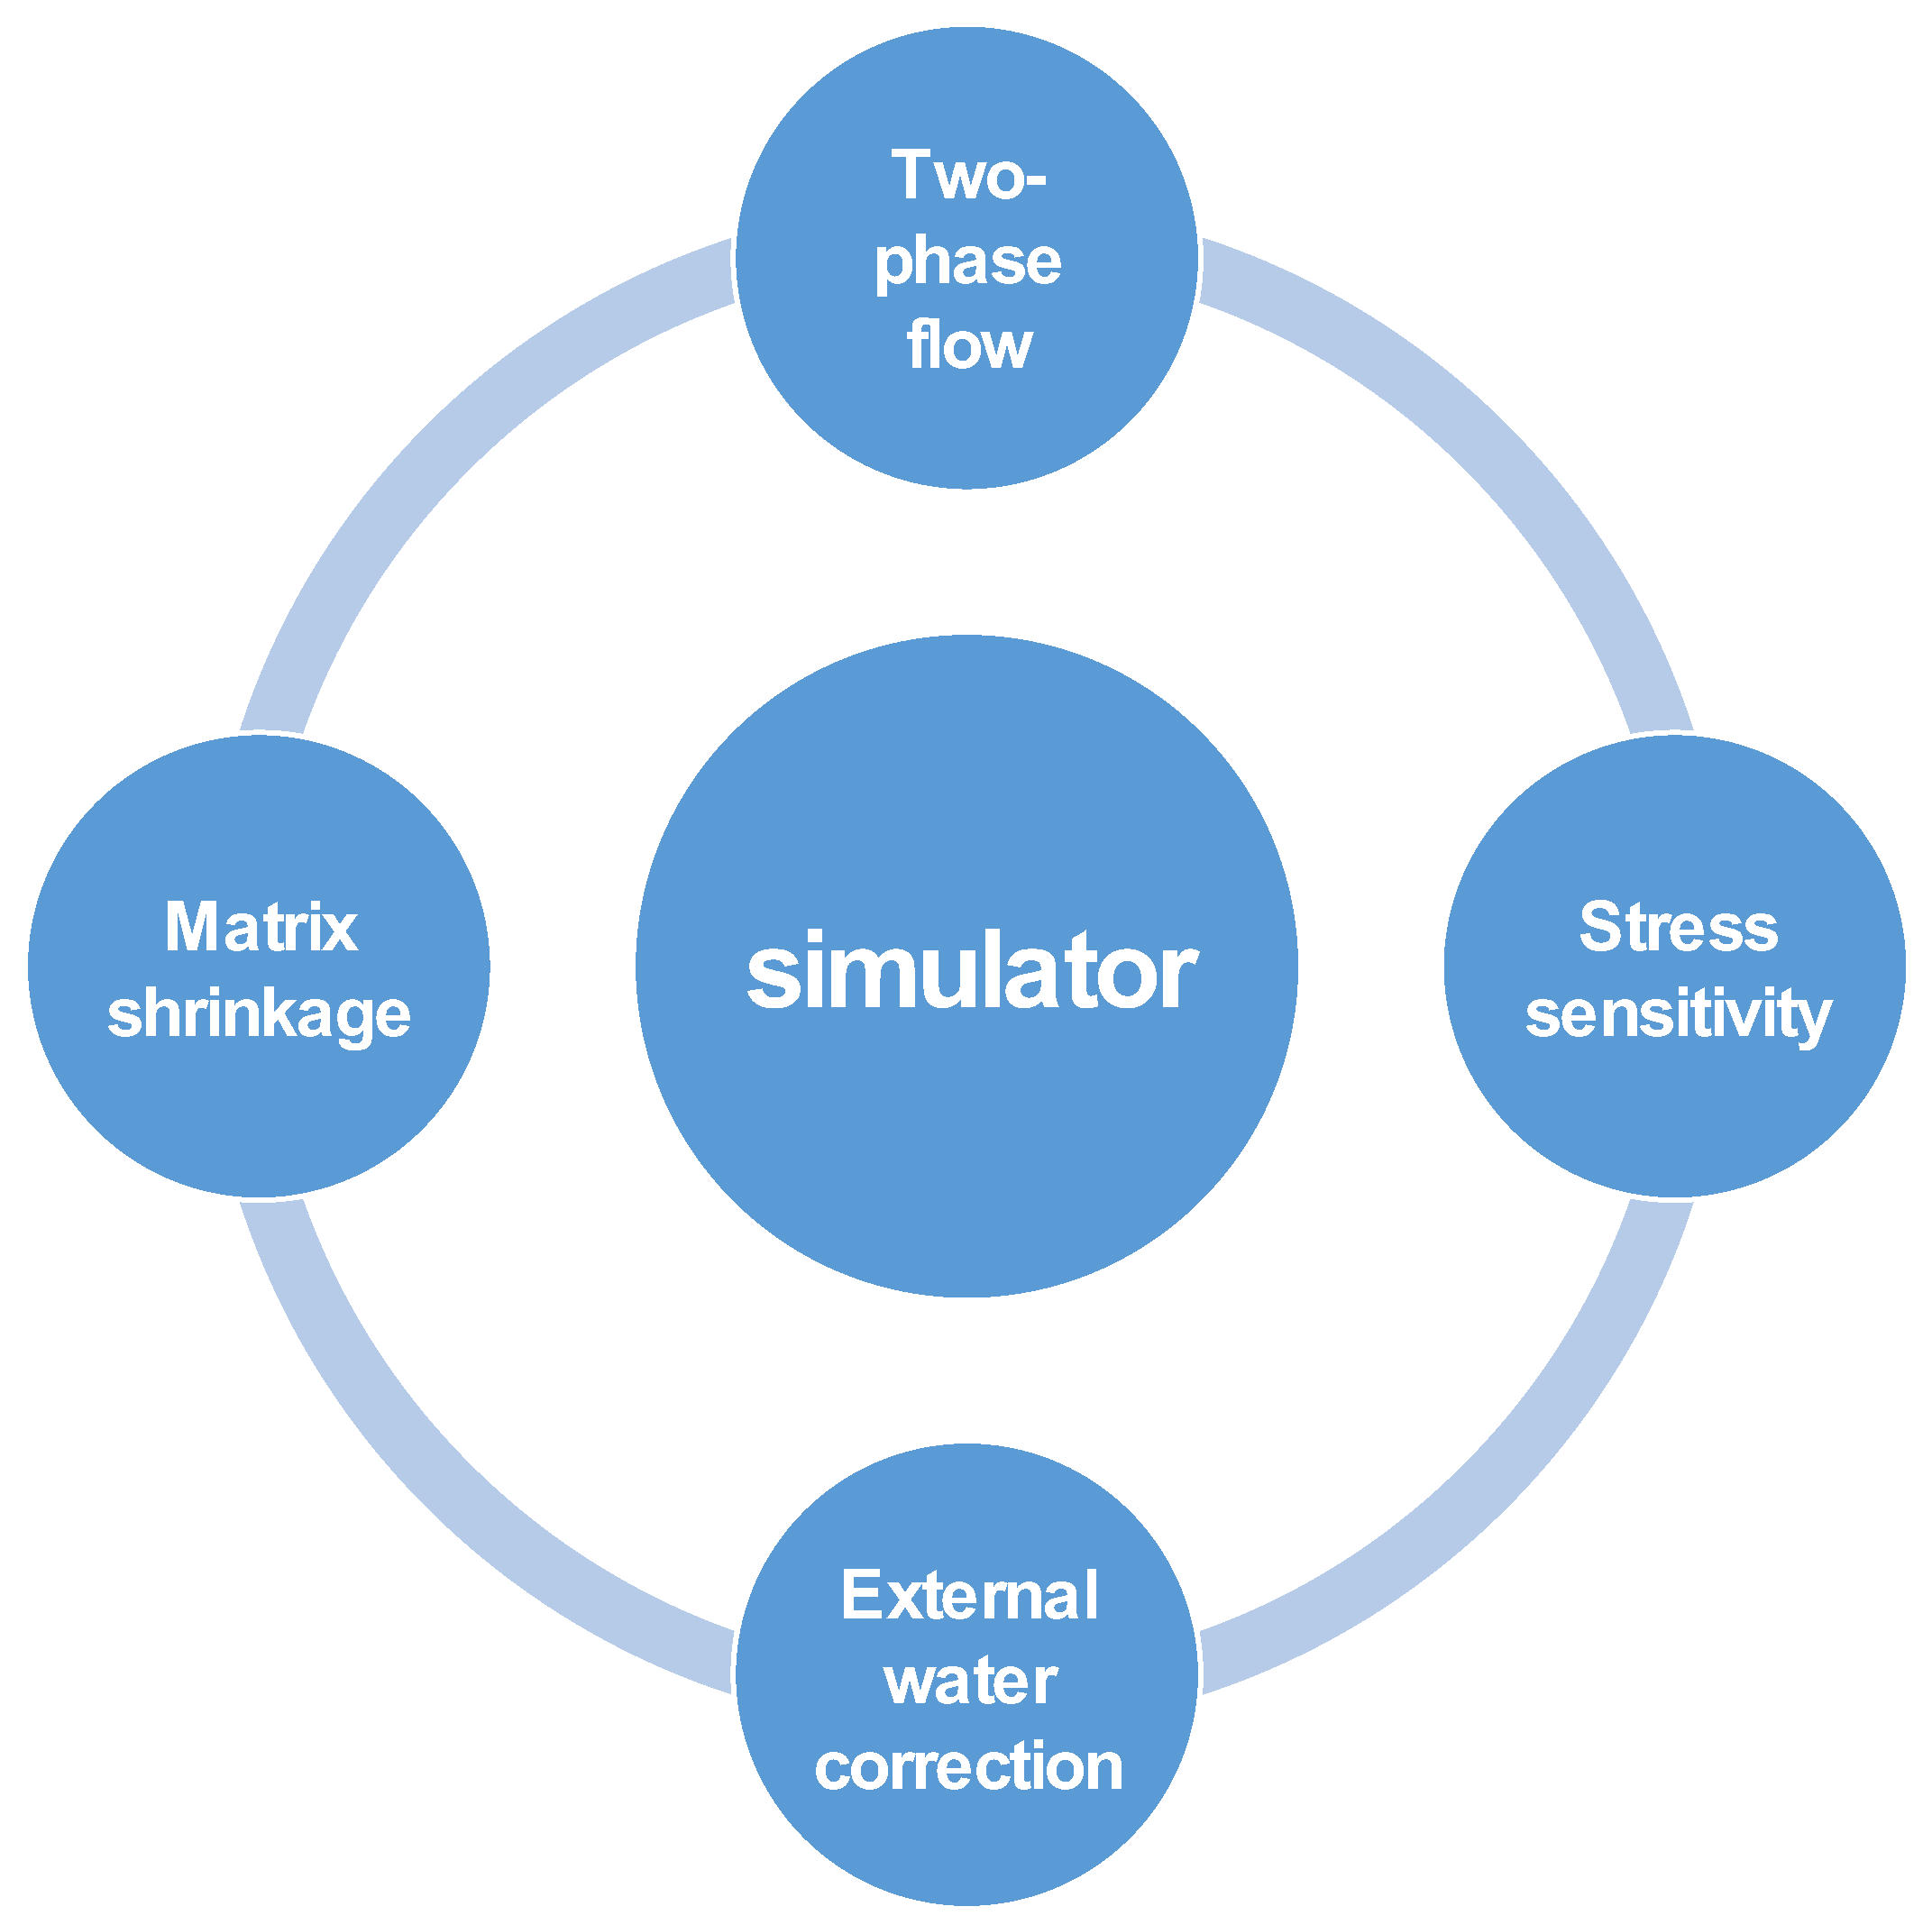
2.4. Production System Optimization for Coalbed Methane Wells

The optimization of the production system of a coalbed methane well is a comprehensive process, and the more mechanisms are considered in the optimization process, the less harmful the optimization results will be to the reservoir. In general, a production system that is too fast will hurt the reservoir, and a production system that is too slow will affect the economic benefits, so the principle of production system optimization is that a faster production system is better as long as it does not harm the reservoir.
The damage mechanisms mainly considered in this study include the transition from single-phase flow to two phase flow, the stress sensitivity of the coal reservoir, the effect of matrix shrinkage and the quantitative identification of external water in the coal reservoir. Single-phase flow and two phase flow are mainly manifested as gas phase permeability and water phase permeability changing with a change in gas saturation. We obtained a typical curve of two phase permeability change with gas saturation through actual core testing, and we can use the combination of the typical curve and numerical simulation to characterize the influence of two phase flow on the drainage and production system. The mechanism of stress sensitivity and matrix shrinkage in coal reservoirs is different, but the manifestations are the same, and the representation method is that permeability and porosity change with the change in reservoir pressure. The permeability change curve under different confining pressures is measured through a confining pressure test of the core, and the curve is combined with numerical simulation to characterize the influence of two phase flow on the drainage and production system (Figure 21).
When considering the four flow mechanisms of the gas–water two phase flow, the stress sensitivity effect, the matrix shrinkage effect and external water correction, the steps for the coalbed methane well life cycle production system are as follows:
  • The flow material balance equation method is used to correct the water production of gas wells. The corrected water production is input into the numerical simulation model as the actual water production of coalbed methane wells.
  • Both the stress sensitivity effect and matrix contraction effect represent the variation in reservoir permeability with reservoir pressure. In production, they are only reflected in the relation curve between reservoir pressure and reservoir permeability. The relationship between reservoir pressure and reservoir permeability can be measured in a laboratory. If no laboratory data are available, the typical curve recommended by the software or the typical curve from the survey is selected based on the geological conditions of the reservoir. The curve is then prepared and fed into a numerical simulation model.
  • The phase permeability curve is mainly from laboratory tests. The core permeability test data that are close to the optimized target well are selected and input into the numerical simulation model.
  • In the numerical simulation model, the production system is optimized by setting different production systems and setting optimal targets (the optimal targets can be stable production time, peak gas production, cumulative gas production, etc.).

3. Discussion

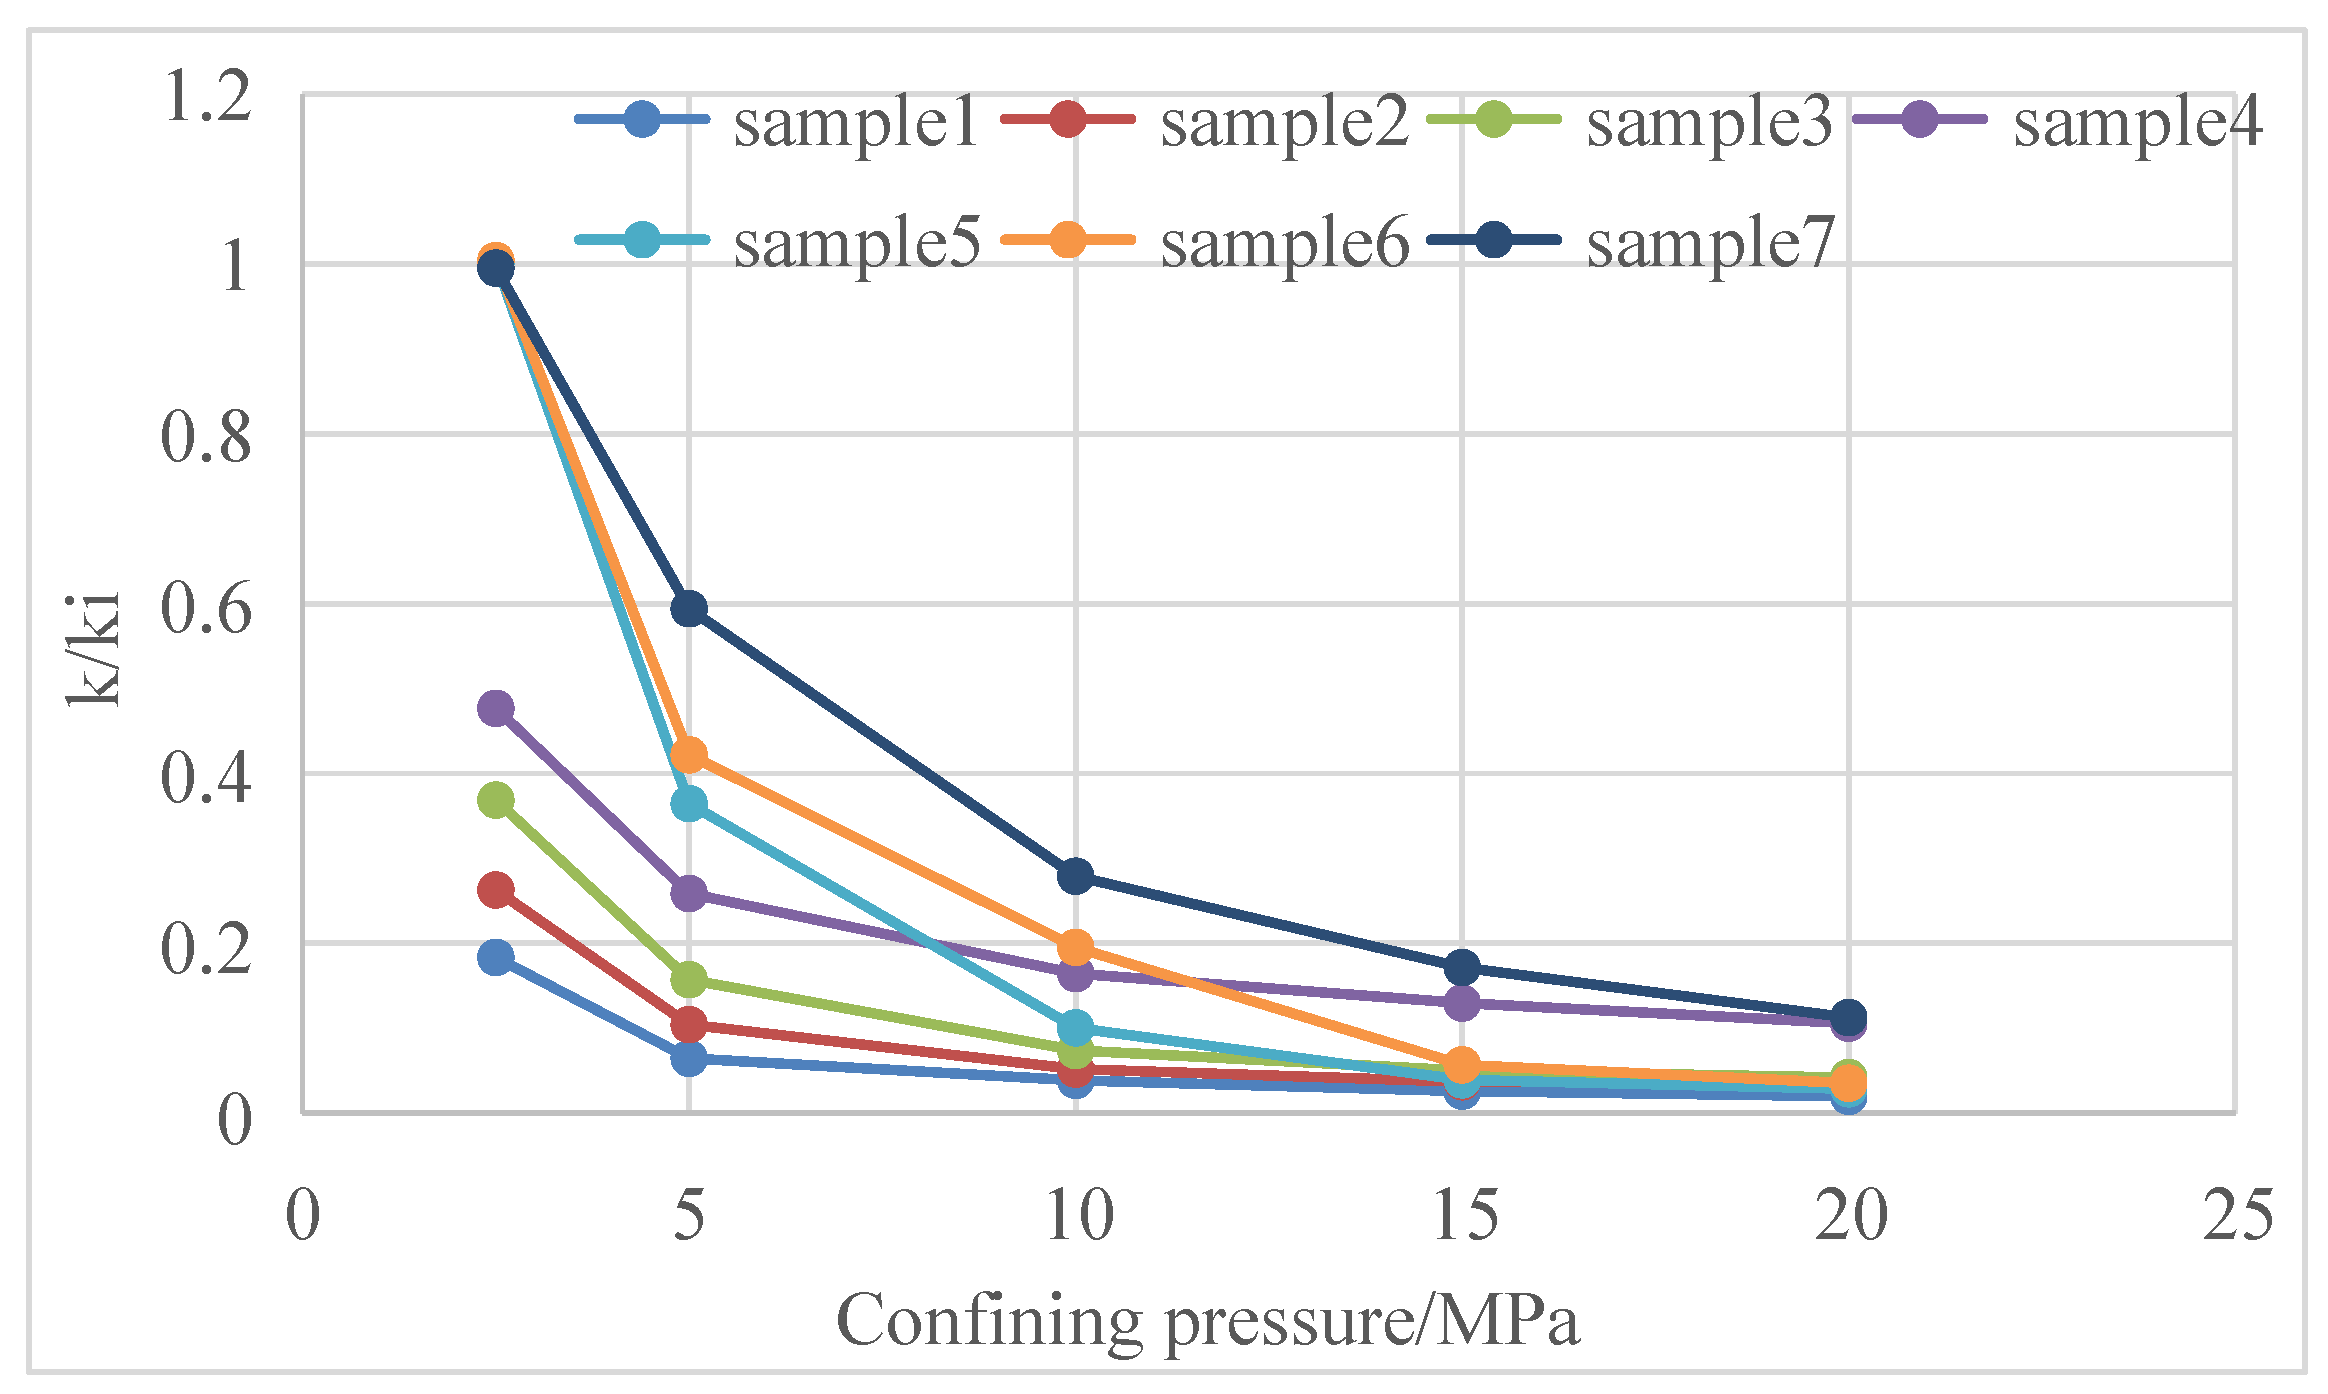
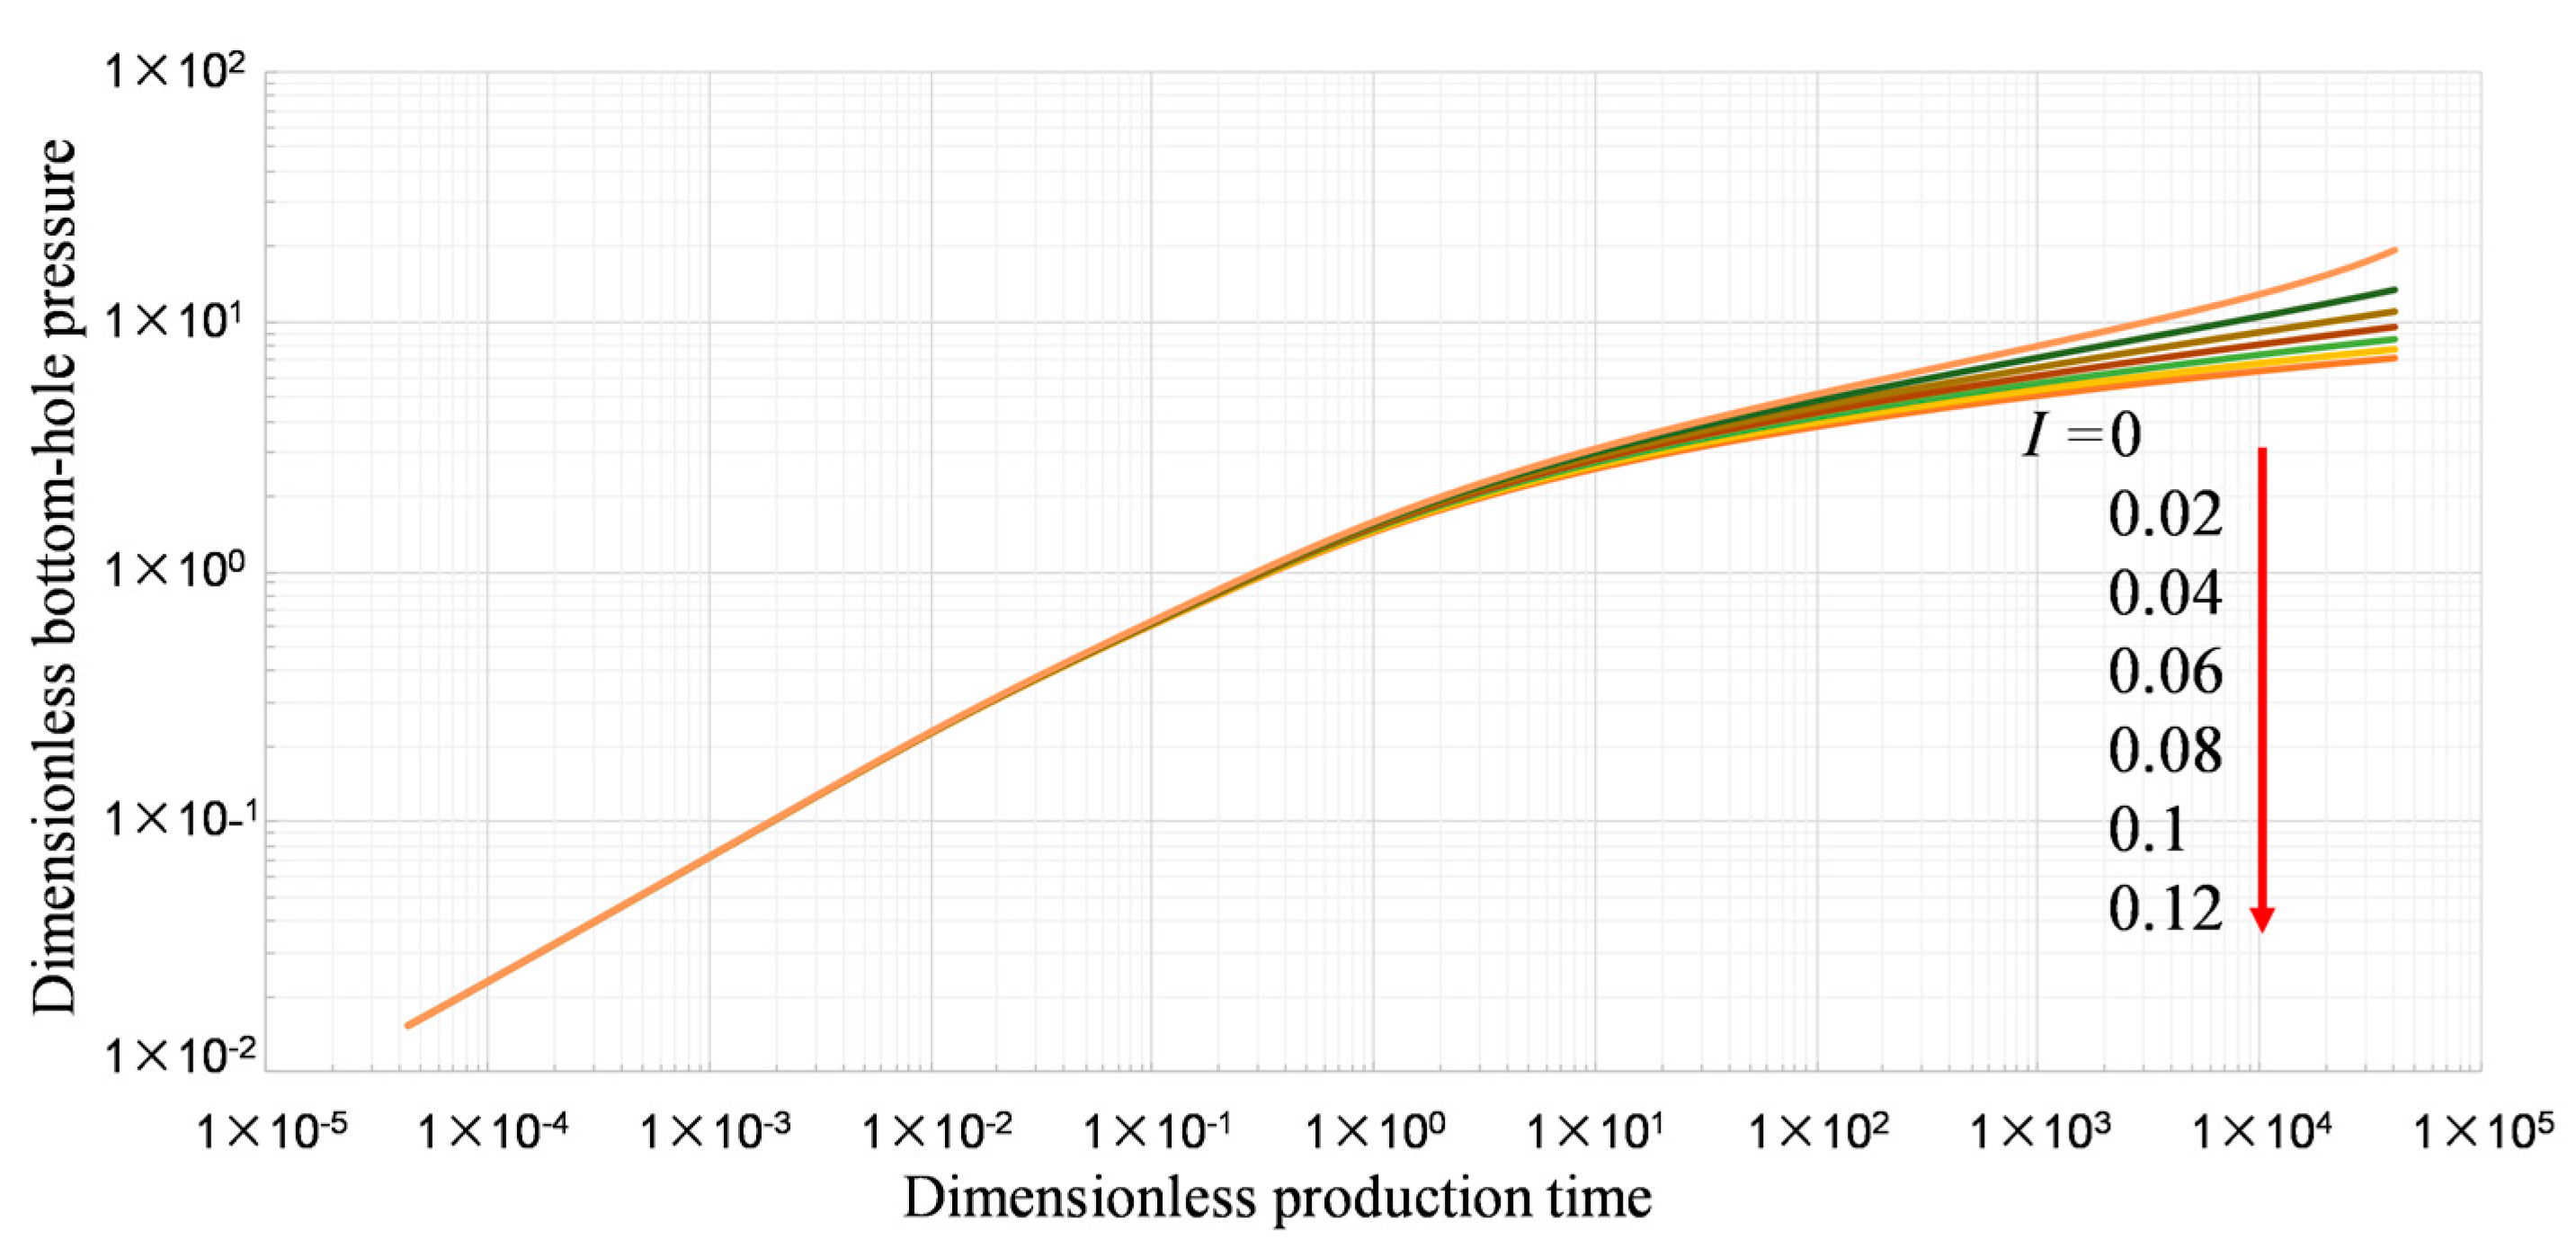
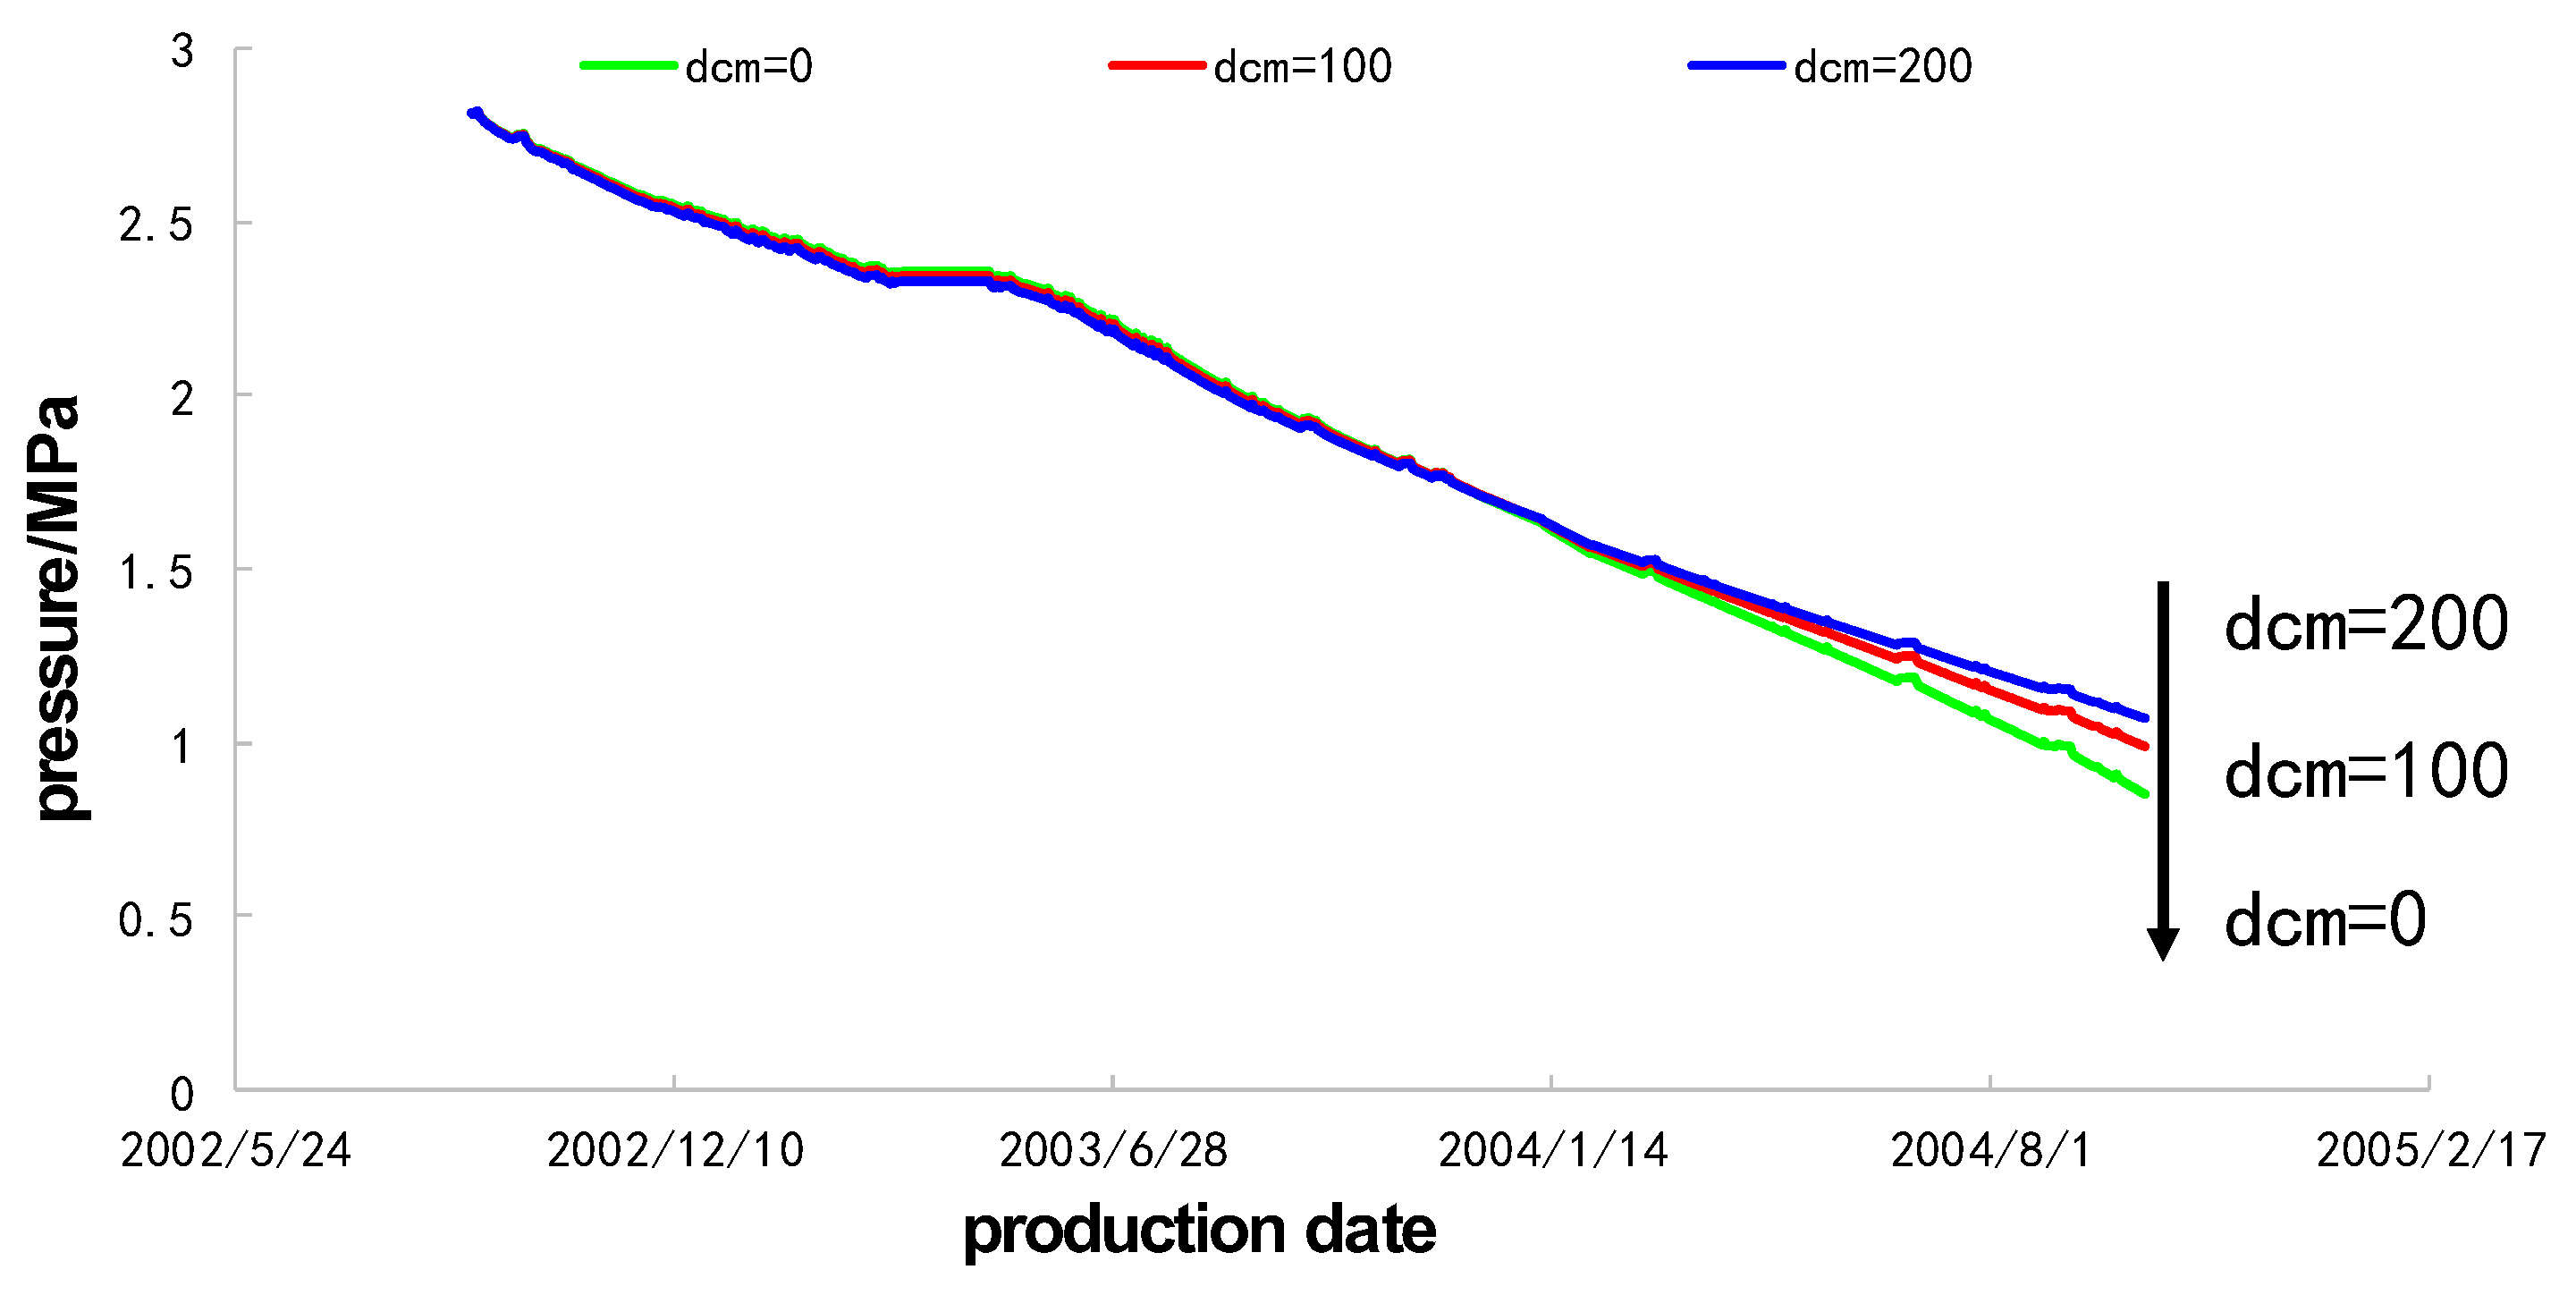
3.1. Effect of Stress Sensitivity and Matrix Shrinkage on Productivity of Coalbed Methane Wells

The constant exponential matrix shrinkage model was selected to study the effect of matrix shrinkage on dimensionless bottom-hole pressure. In order to facilitate the study, the ratio of internal and external permeability was set as 1; that is, the mean value model was reduced. The matrix shrinkage coefficient I increases from 0 to 0.12 at a rate of 0.02. When I is 0, there is no shrinkage effect. The unit of the I value is %/pa (Figure 22).
The matrix shrinkage phenomenon is mainly caused by the desorption of matrix gas and the matrix shrinkage effect, so the matrix shrinkage phenomenon is not obvious when the current desorption phenomenon and the shrinkage effect are not obvious. With the development of a coalbed methane reservoir, the formation pressure decreases, the effect of desorption and matrix shrinkage becomes more and more obvious, and the matrix shrinkage phenomenon becomes more and more obvious.
The presence of matrix shrinkage will increase the porosity and permeability of the gas reservoir, so the seepage condition of the formation will be improved, and the energy utilization rate of the formation will be increased. Therefore, under the condition of the same flow rate, the more obvious the matrix shrinkage phenomenon is, the higher the bottom-hole pressure will be.
Production data of actual wells were obtained from examples in FEKETE software (version: 2016 V3) (FEKETE > coalbed methane > dry coal), and the basic parameters are shown in Table 2. The matrix shrinkage model adopted was the Seidle and Huitt model, and its parameter values were dcm = 0, 100, 200, where dcm = 0 indicated that the matrix had no shrinkage effect.
The effect of matrix shrinkage on the actual bottom-hole pressure is similar to that on the dimensionless bottom-hole pressure. Matrix shrinkage is caused by the desorption and shrinkage of the matrix, so the formation pressure in the early stage of the change range is small, the matrix desorption and shrinkage phenomenon is not obvious, so the matrix shrinkage phenomenon has little influence on the bottom-hole pressure. With the development of coalbed methane reservoirs, the range of formation pressure changes more and more, which also leads to a more and more obvious matrix desorption and shrinkage phenomenon, so the matrix shrinkage phenomenon has more and more influence on the bottom-hole pressure (Figure 23). In the Seidle and Huitt model, with the development, the decrease in pressure leads to the matrix shrinkage effect, which increases the matrix permeability and improves the seepage environment. In the case of the same flow rate, the higher the energy utilization rate, the higher the bottom-hole flow pressure.

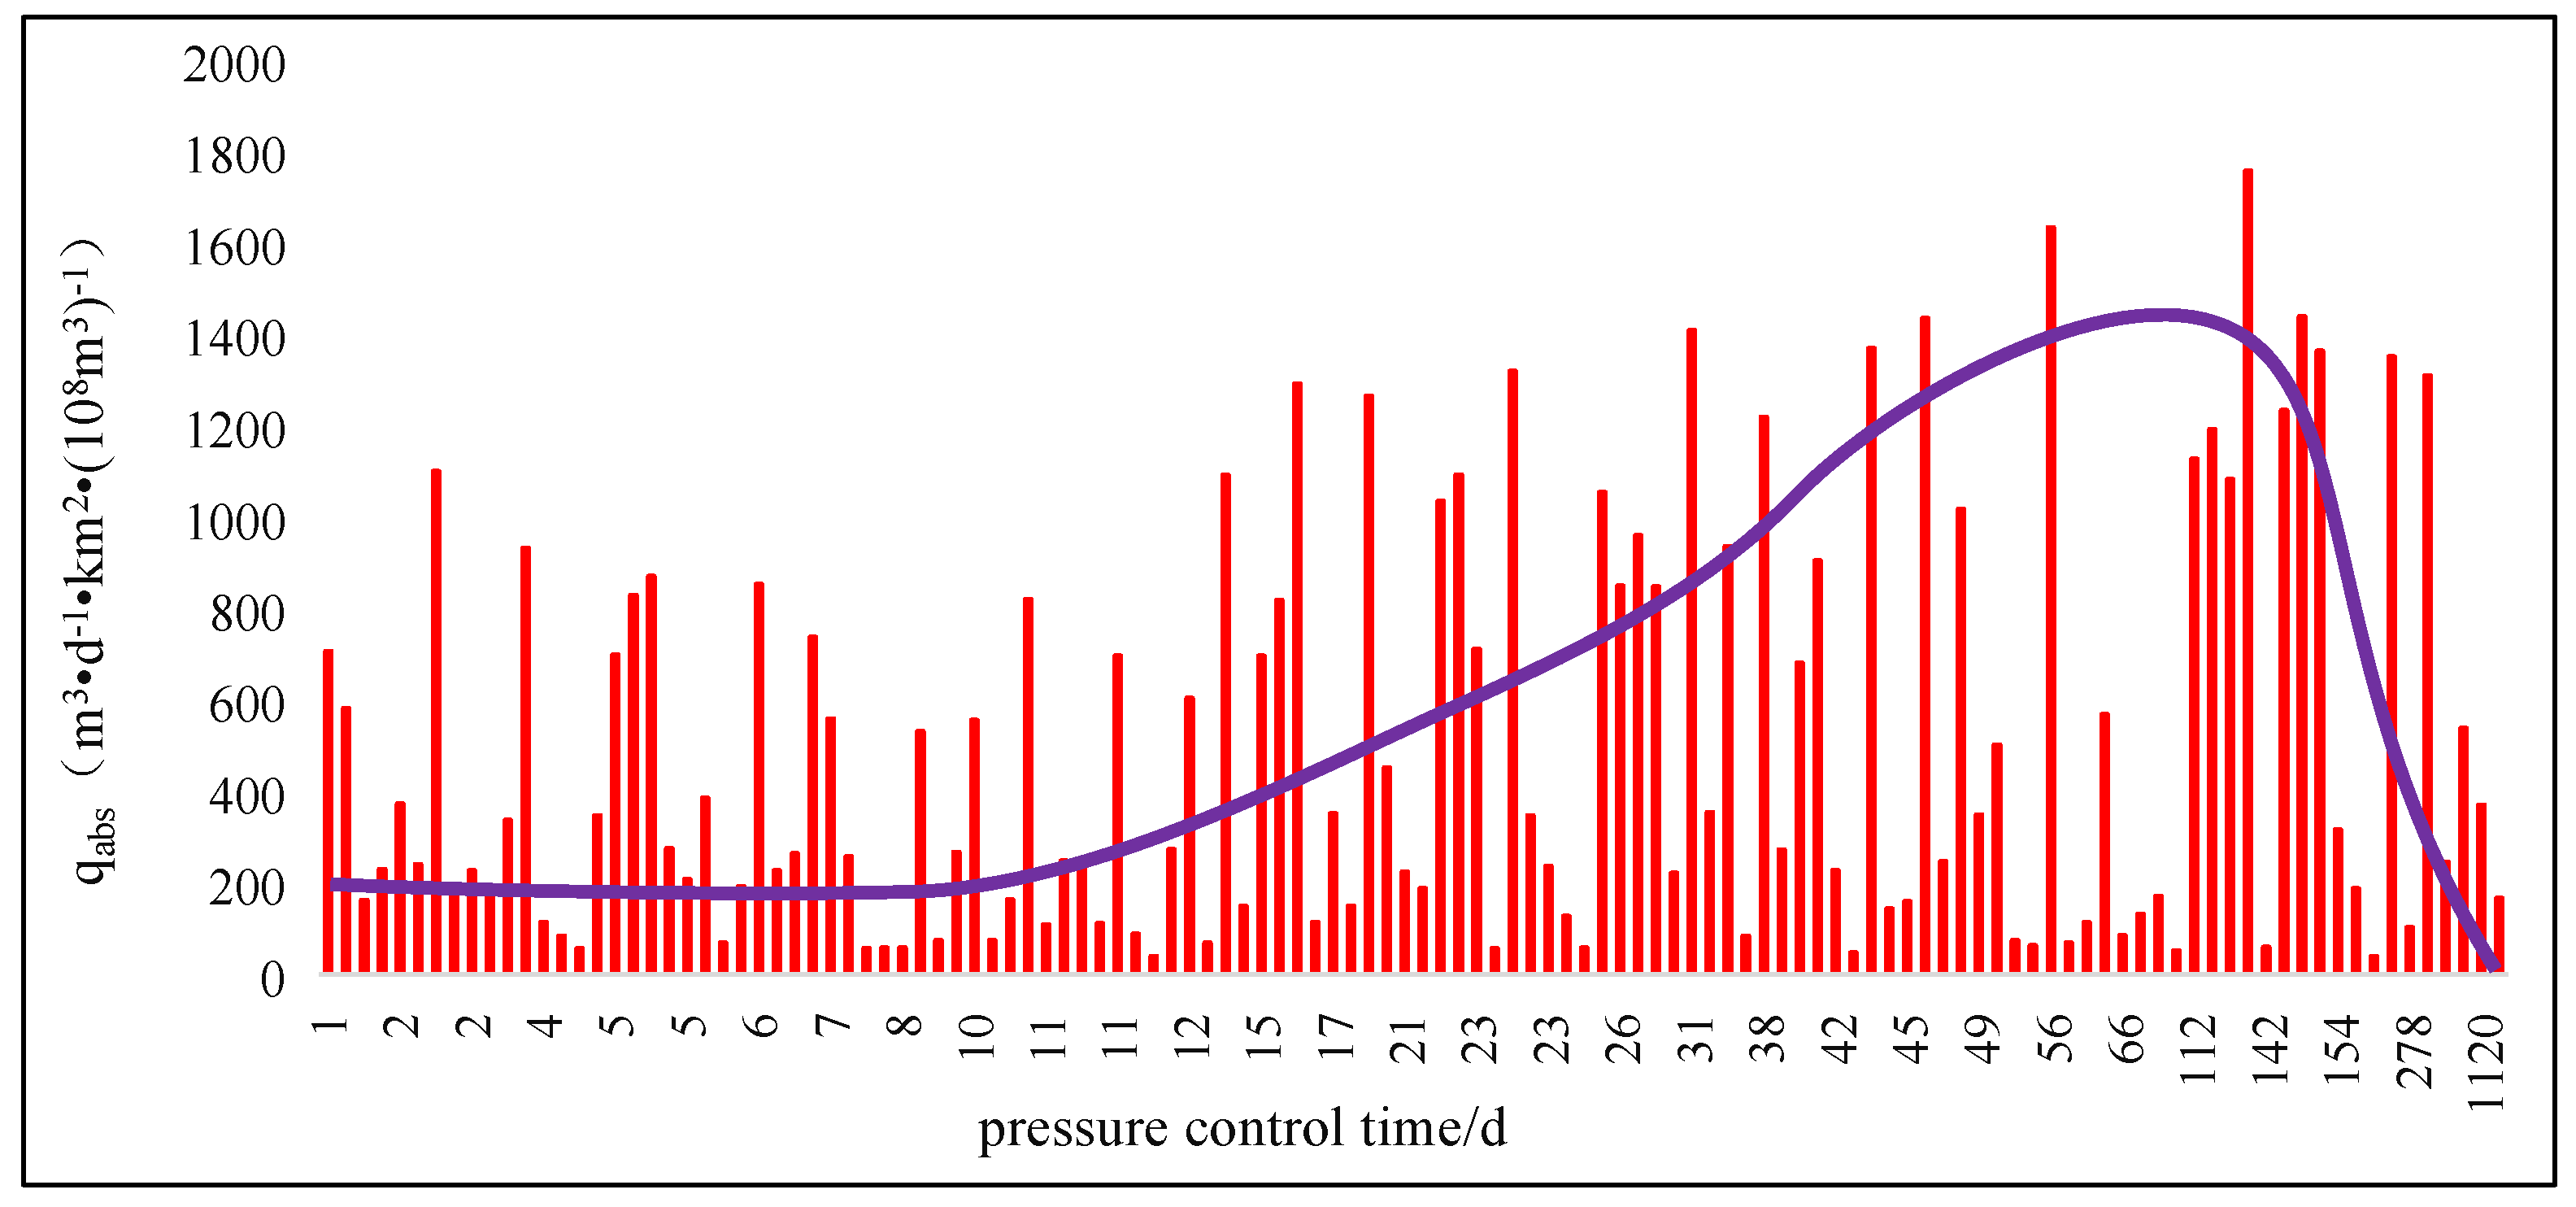
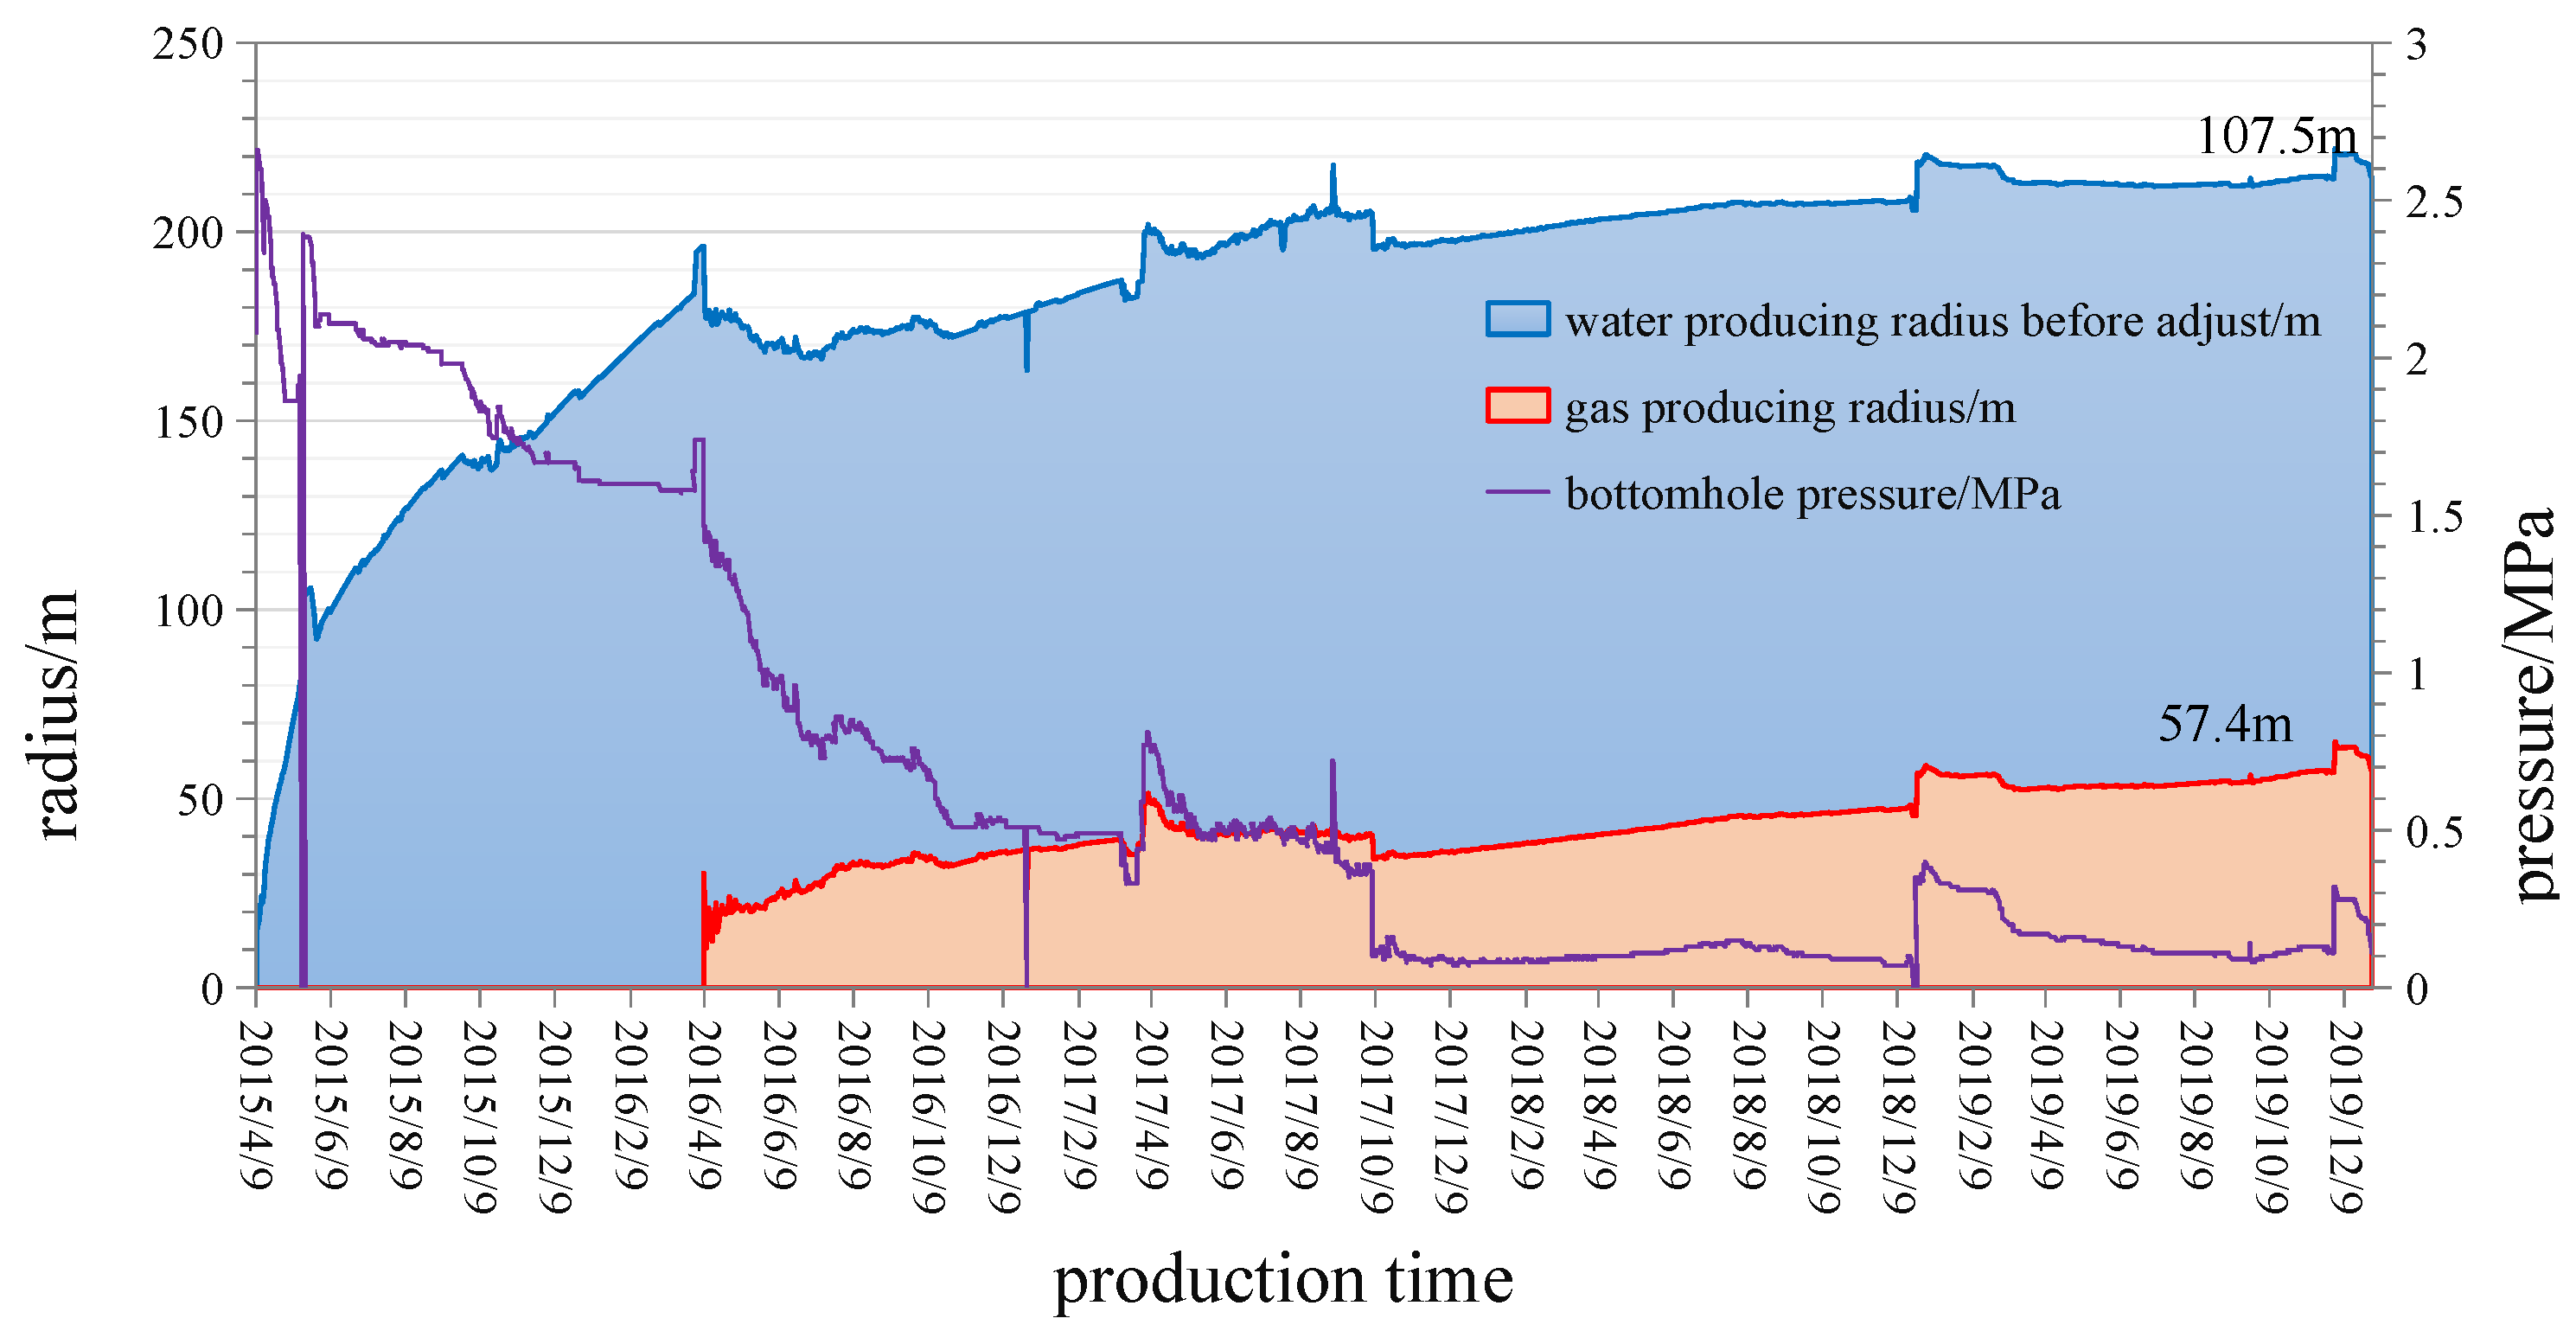
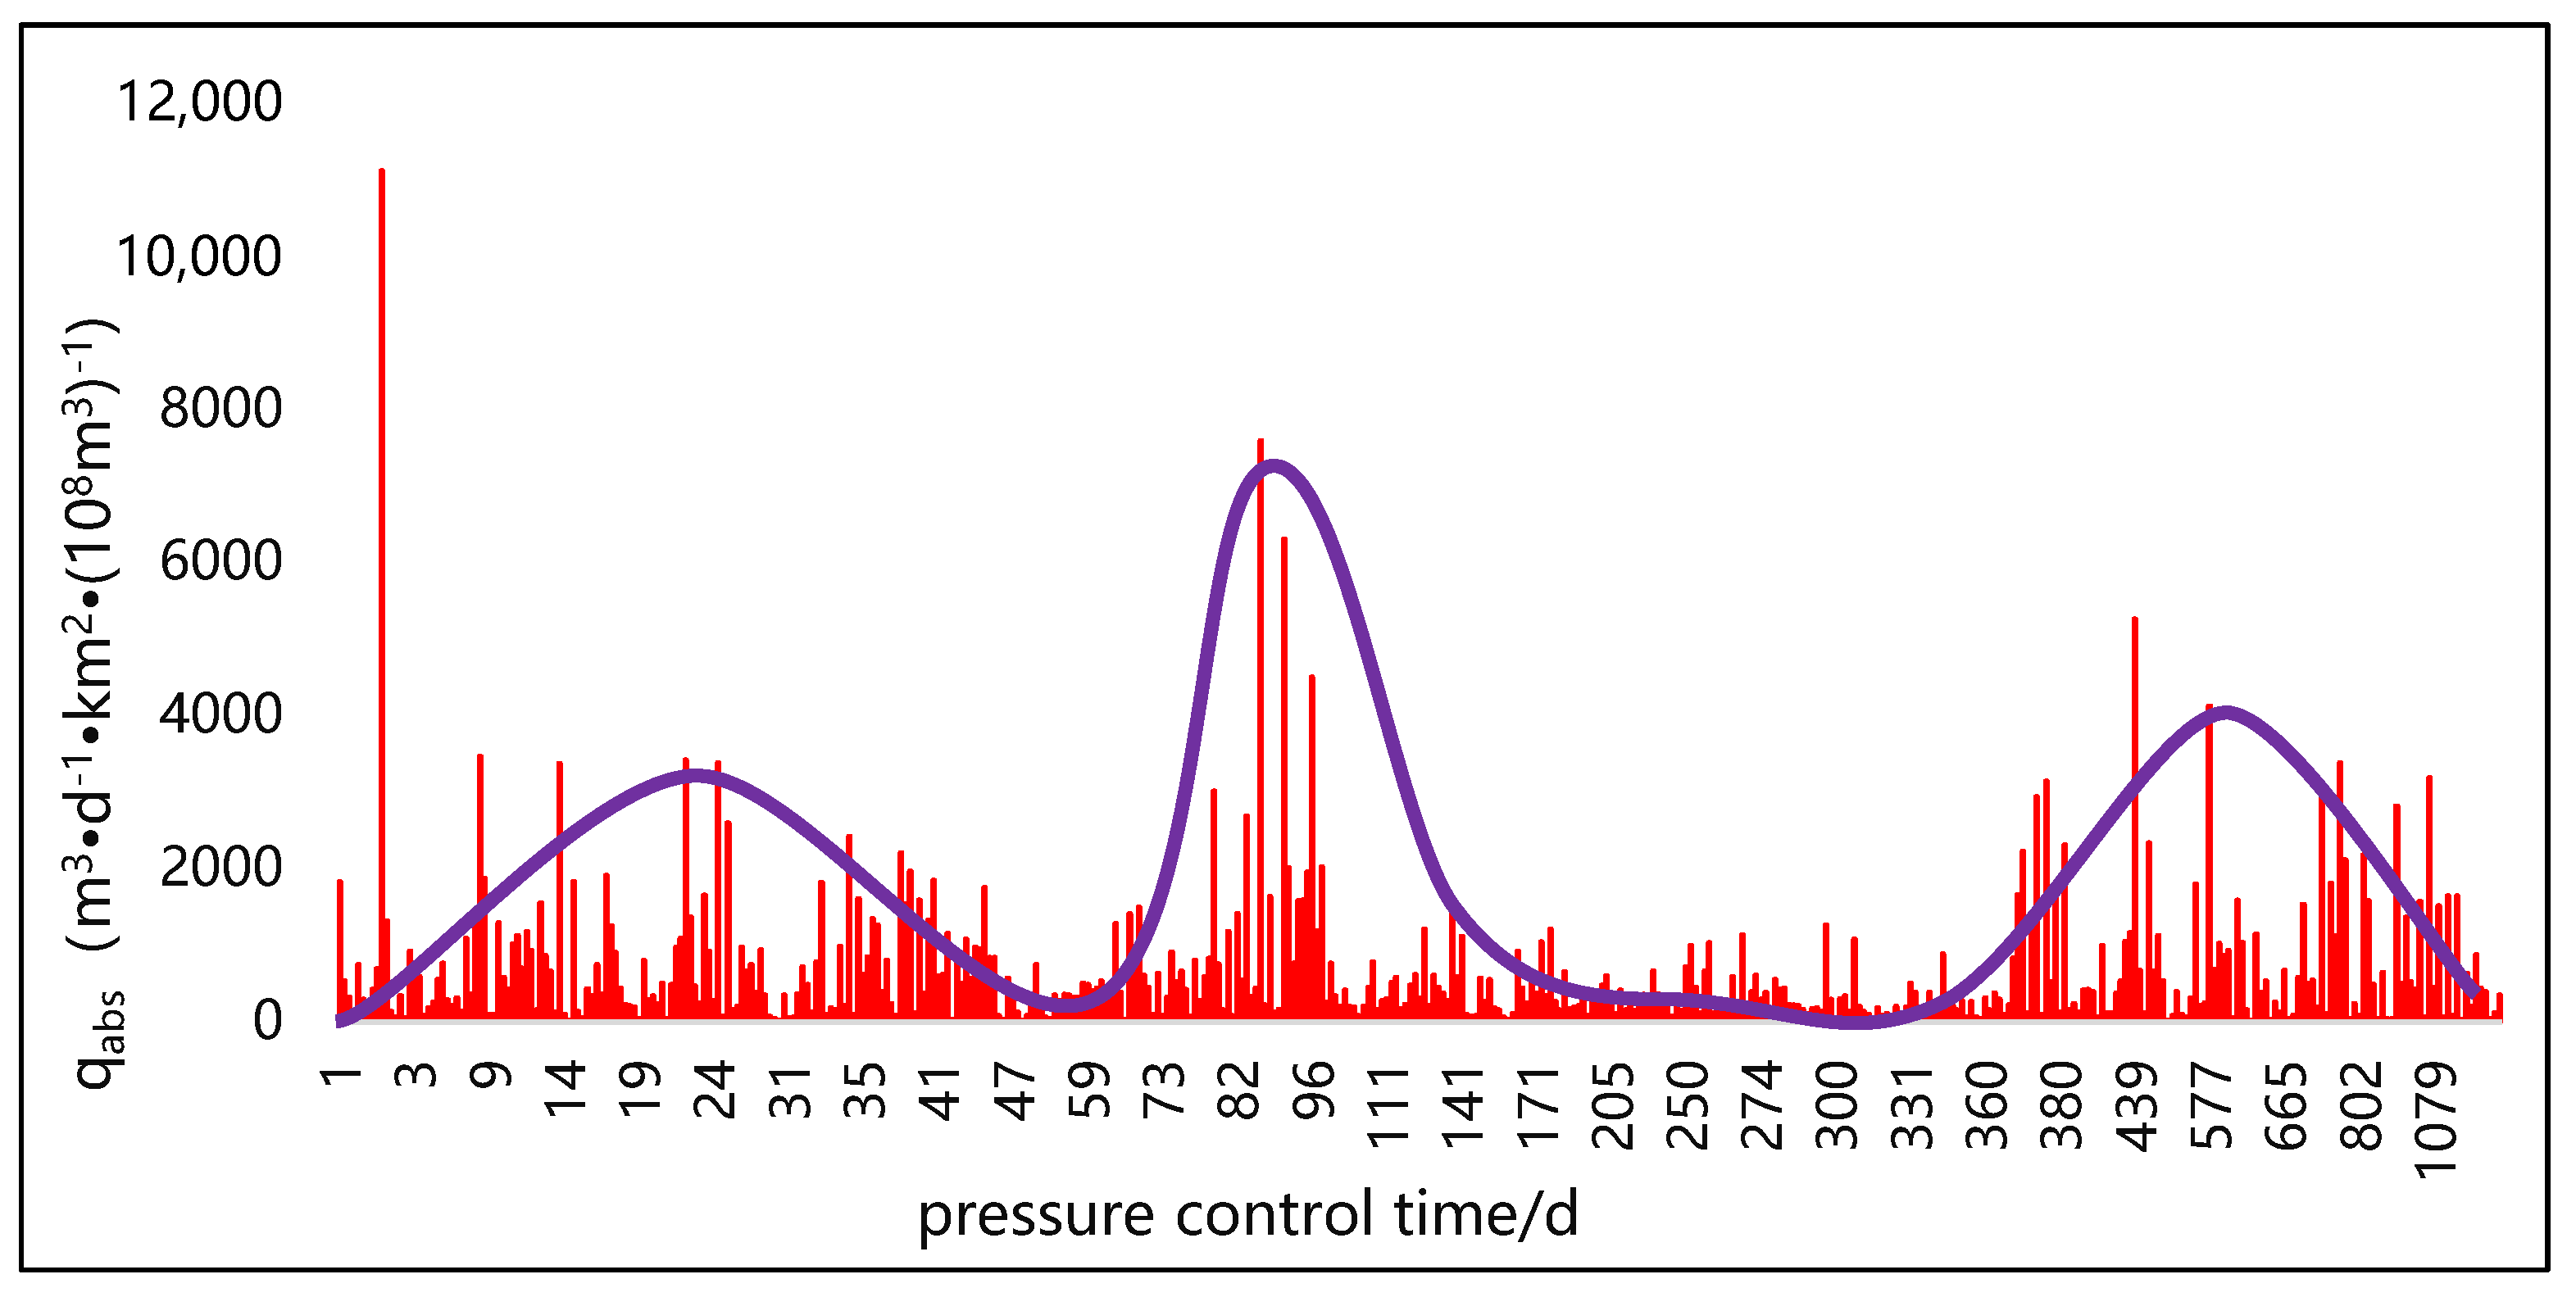
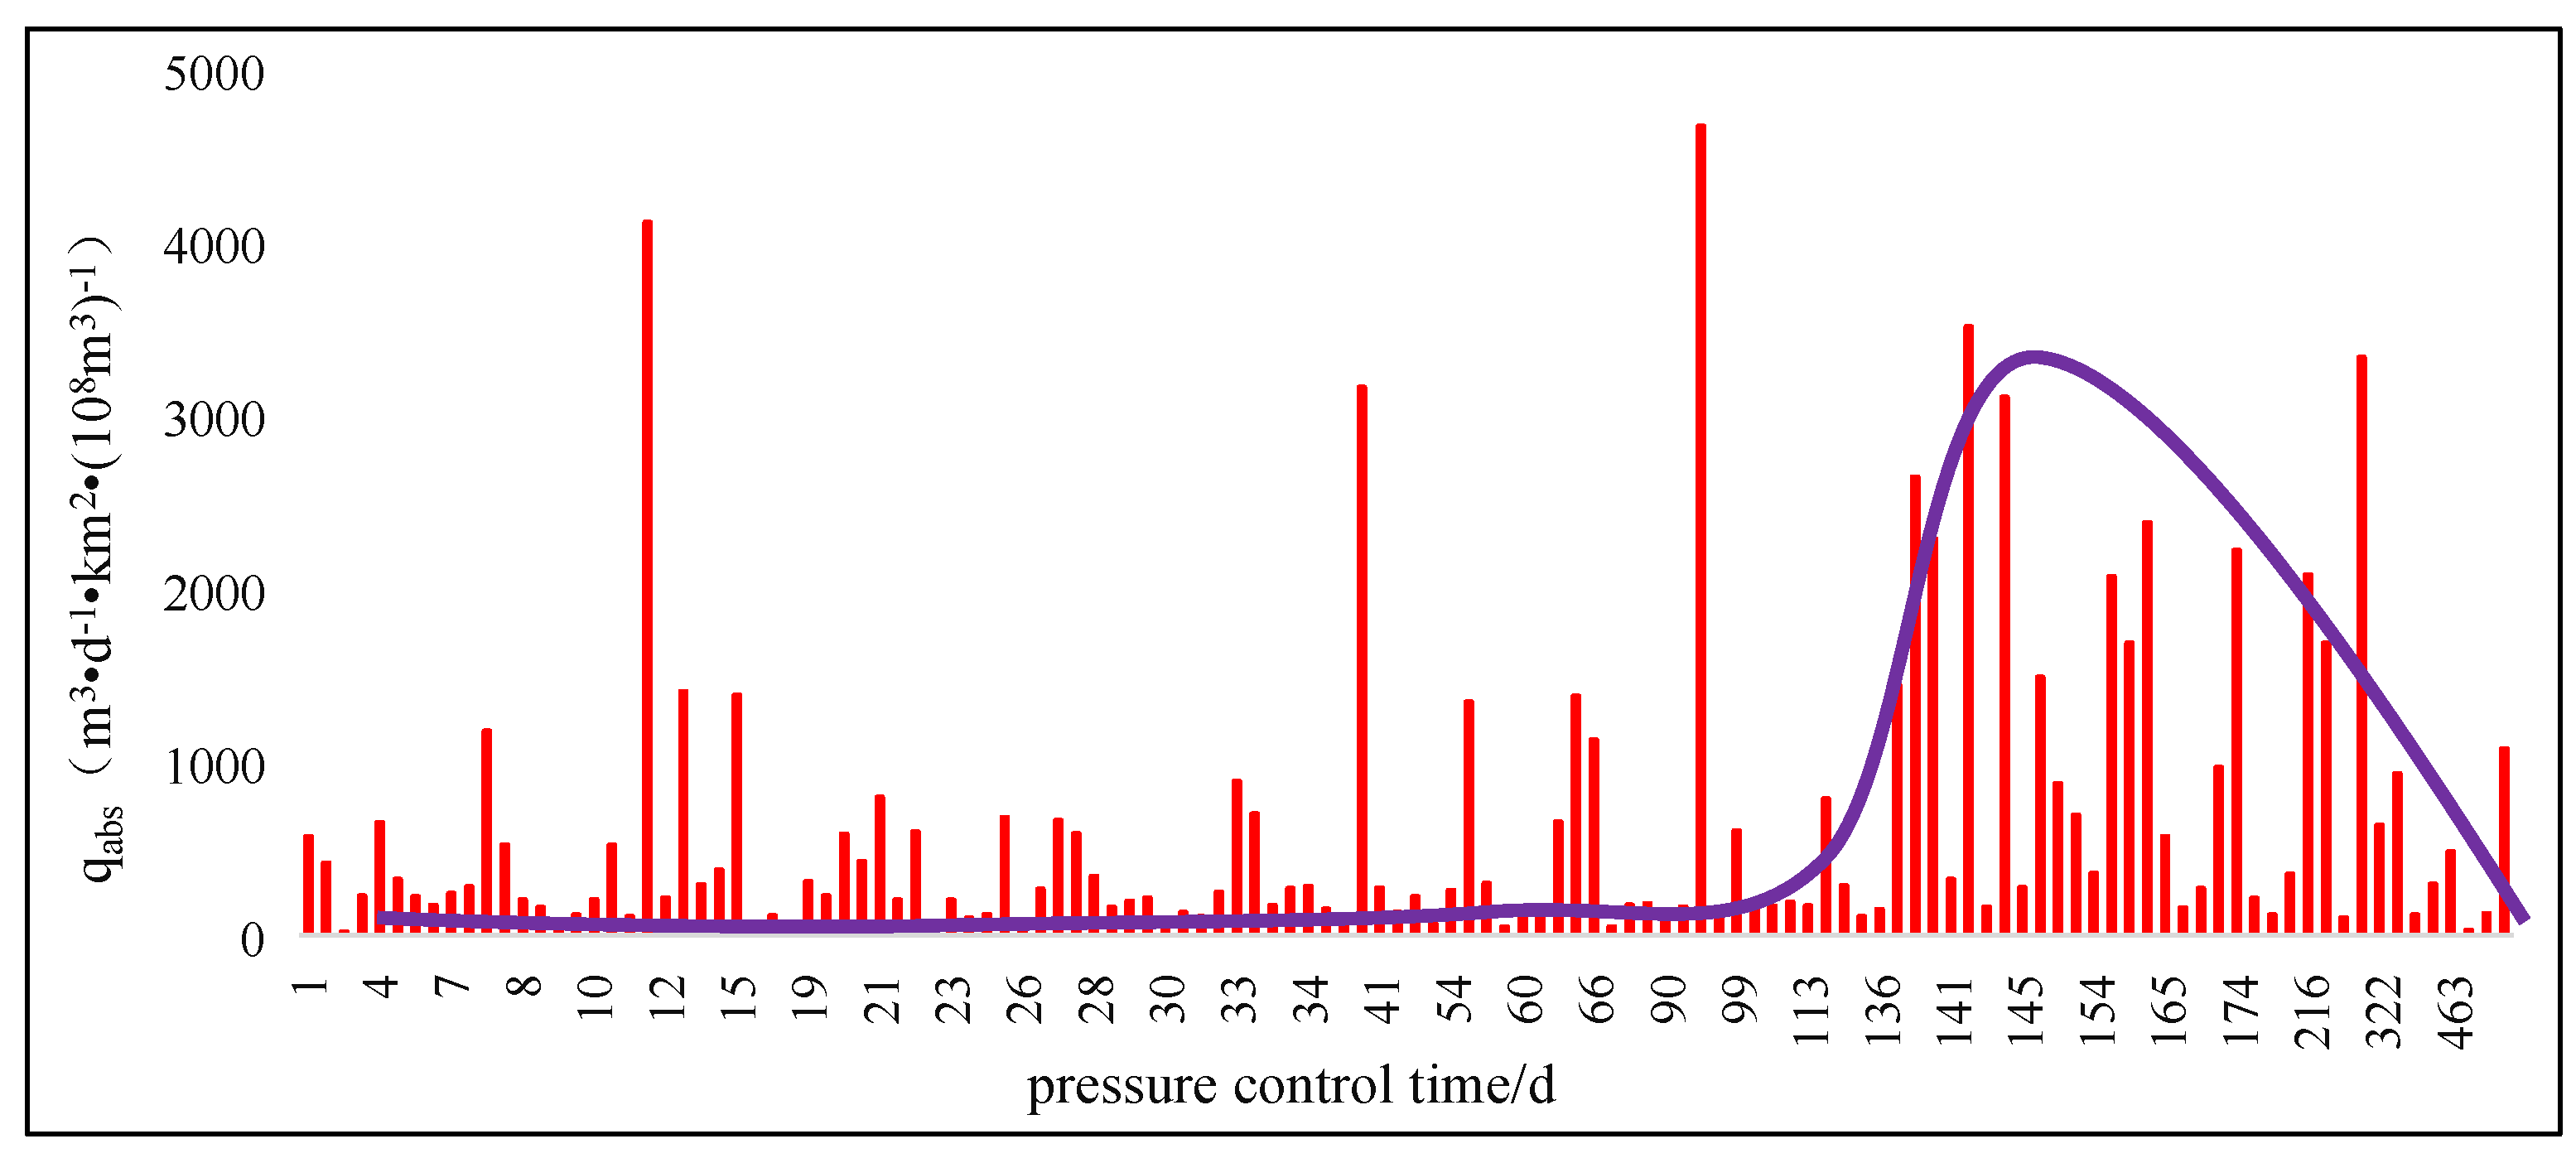
3.2. External Water Correction for Coalbed Methane Wells

Taking a specific well as an example, the average daily water of the well is 15.4 cubic meters, and the average daily gas is 225 cubic meters. If the produced water is coal seam water, the current pressure relief radius should reach 214 m, and the radius of the part below the desorption pressure in the pressure drop funnel should be 114.3 m. However, the actual gas production radius fitted by the current gas production is only 57.4 m, indicating that a considerable part of the water produced does not contribute to the pressure drop, and the difference between the water produced based on the actual gas production and the actual water produced is the external water. According to the gas production radius of 57.4 m, the water production radius is 107.5 m, and the proportion of ineffective production water, that is, external water, is 72.95% (Figure 24).

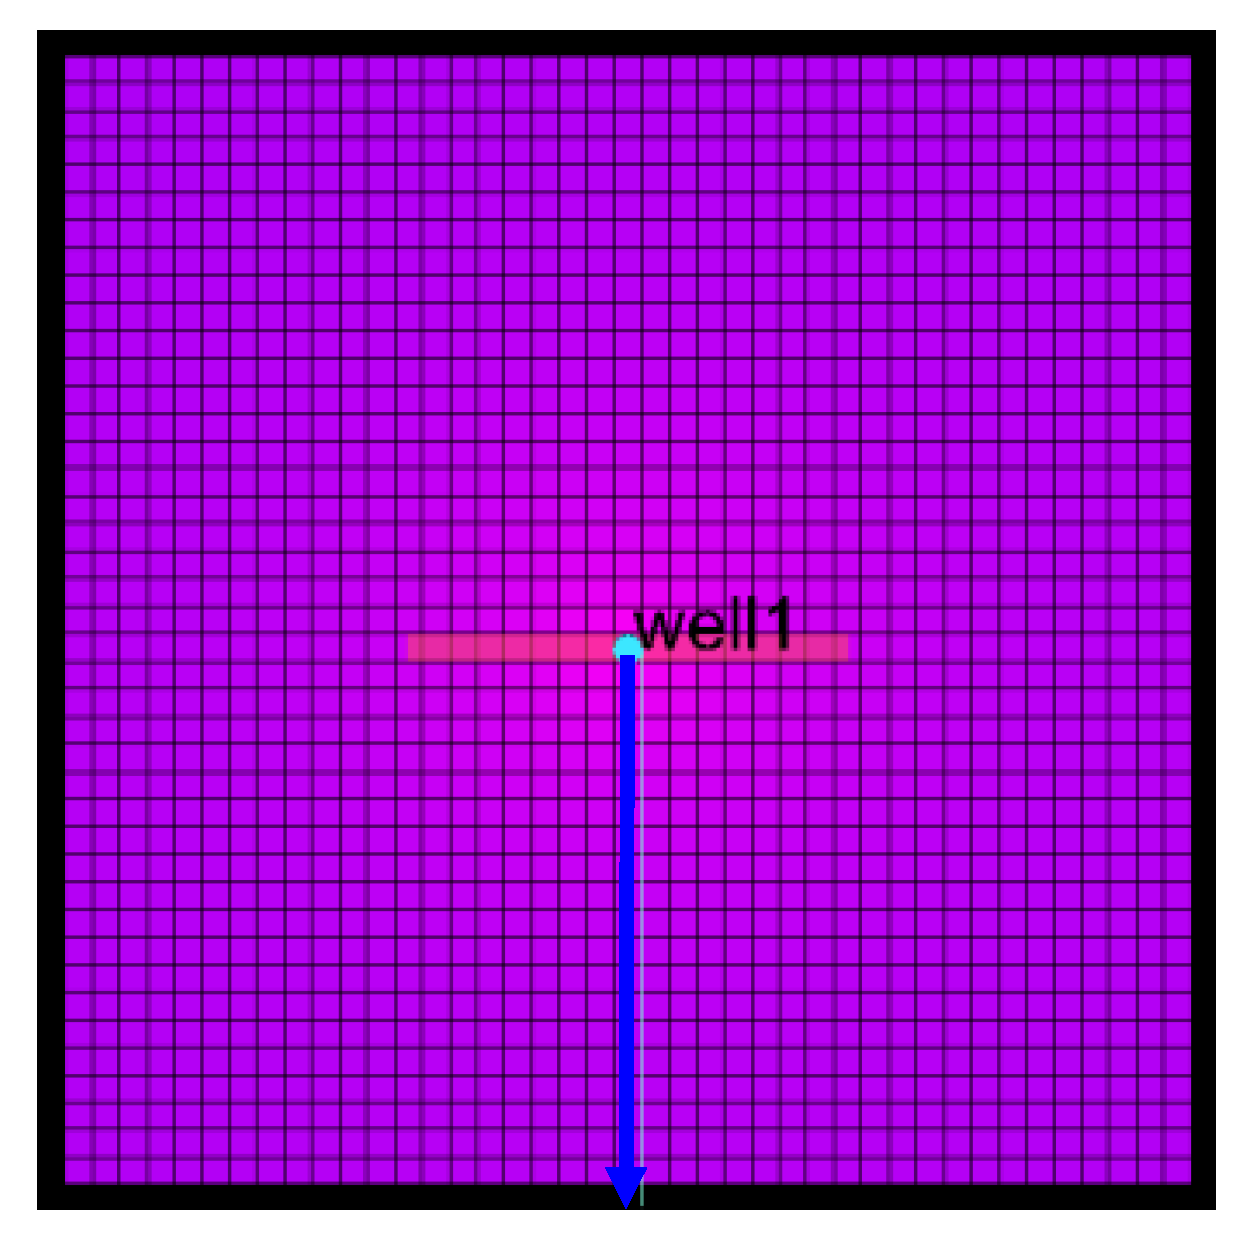
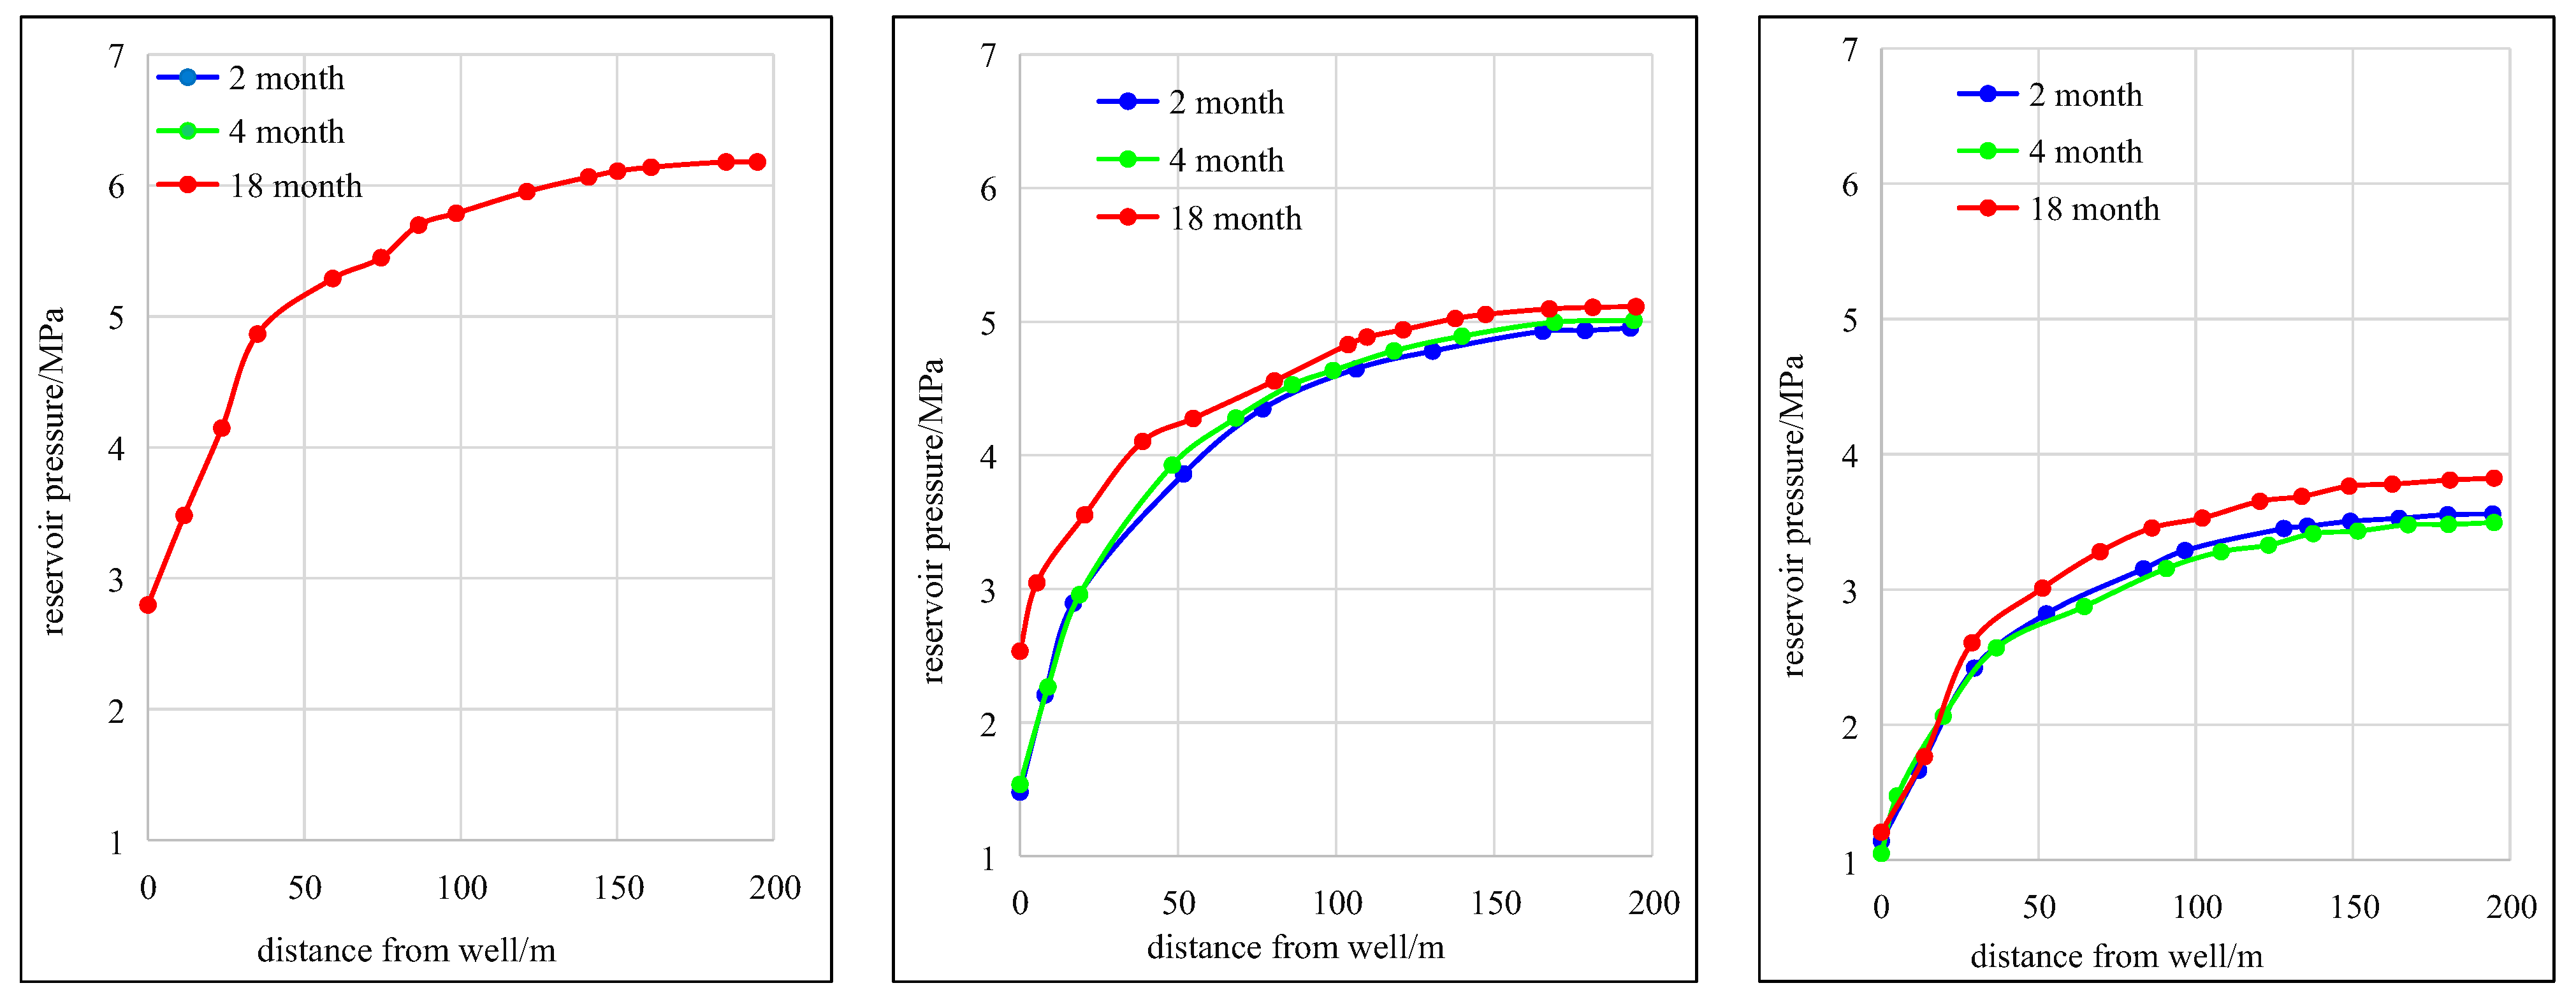
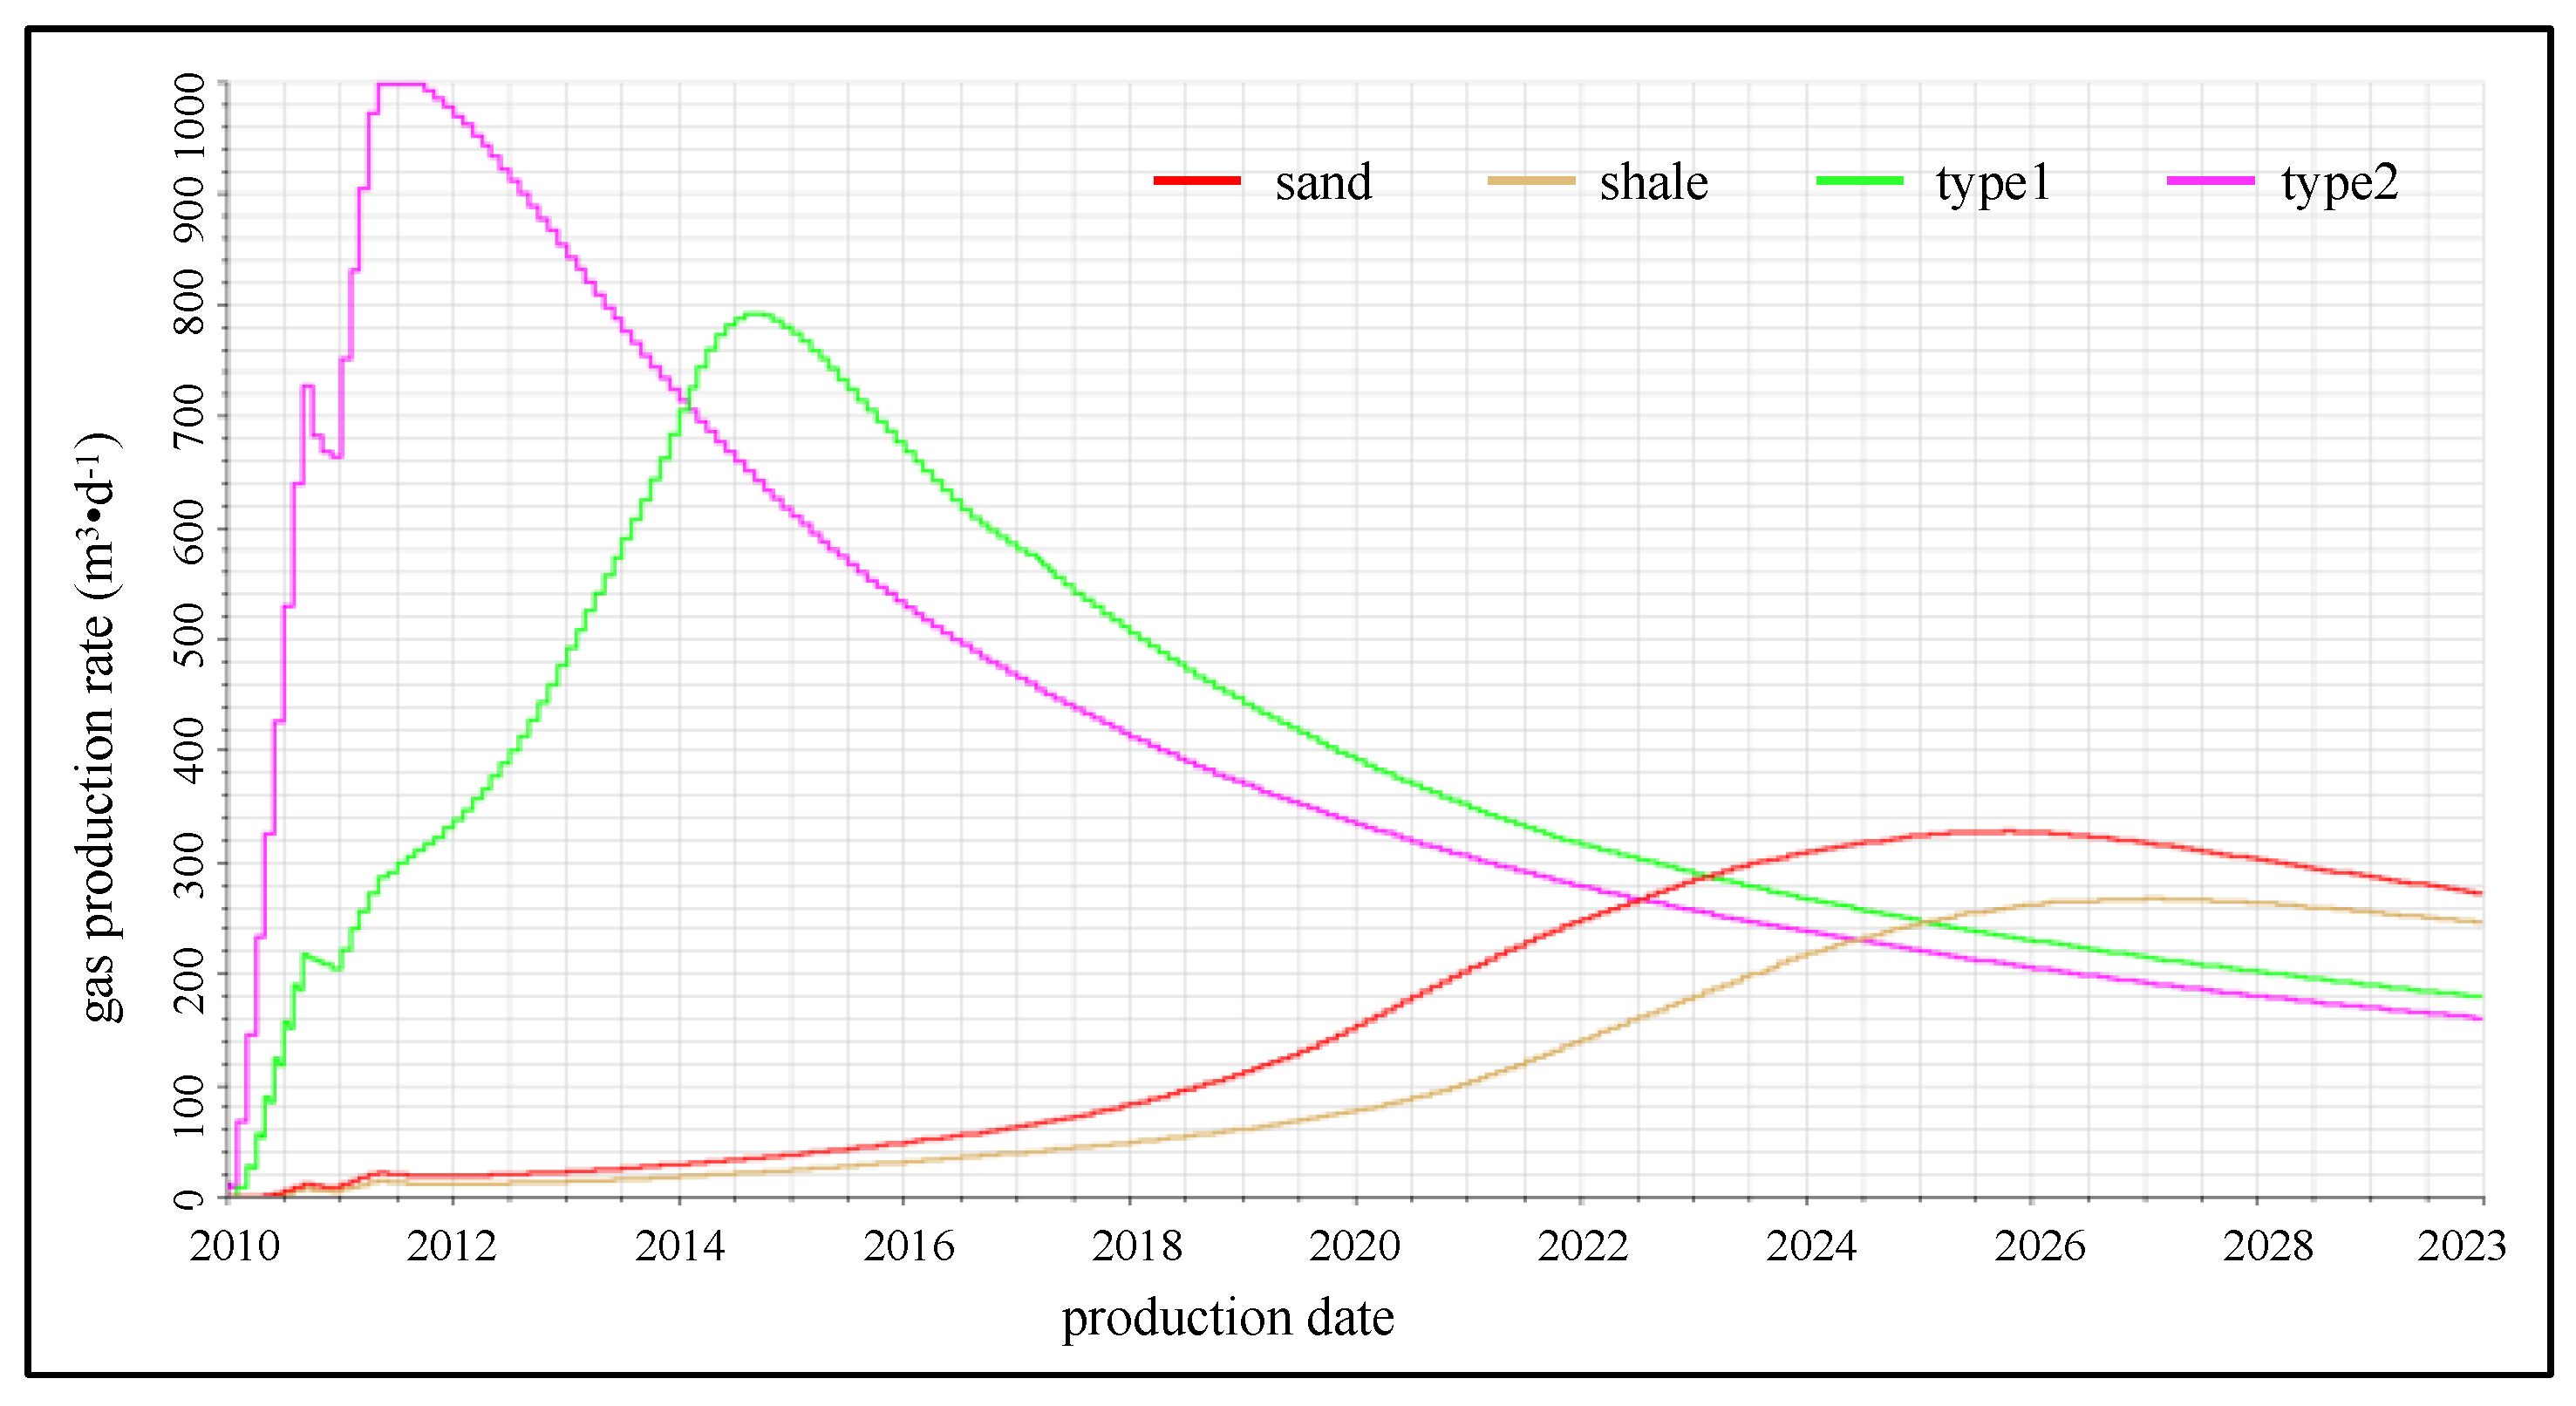
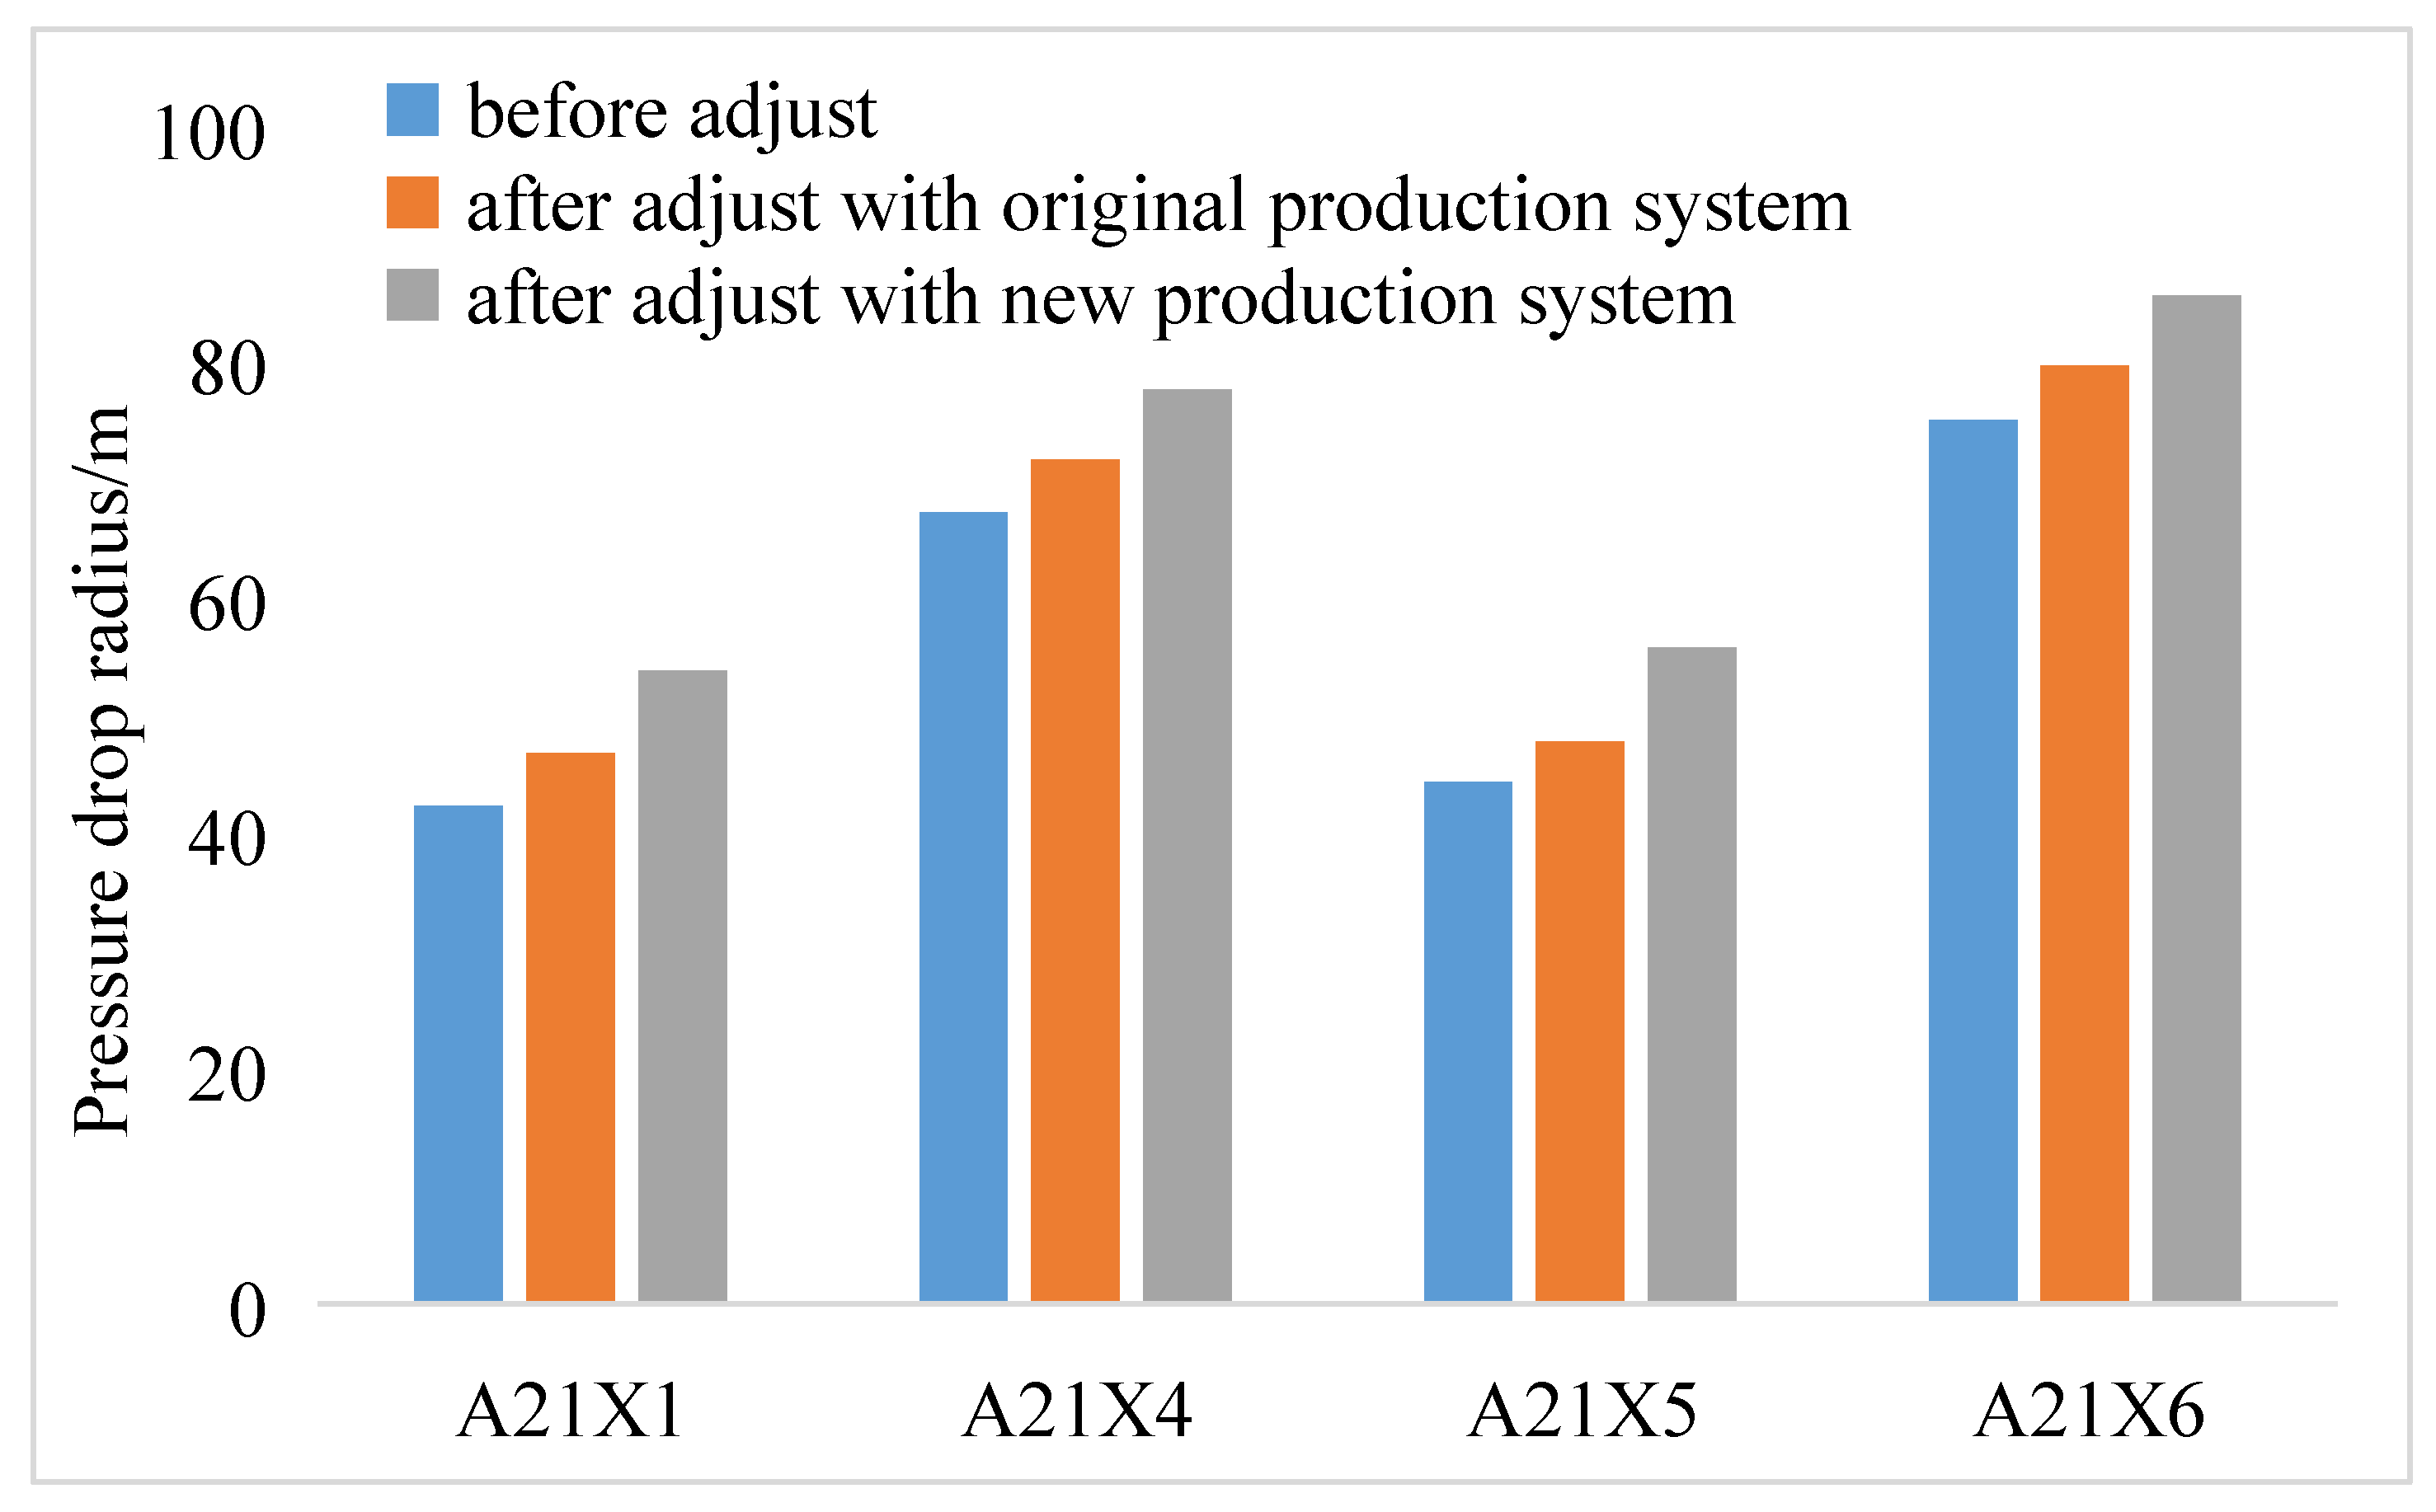
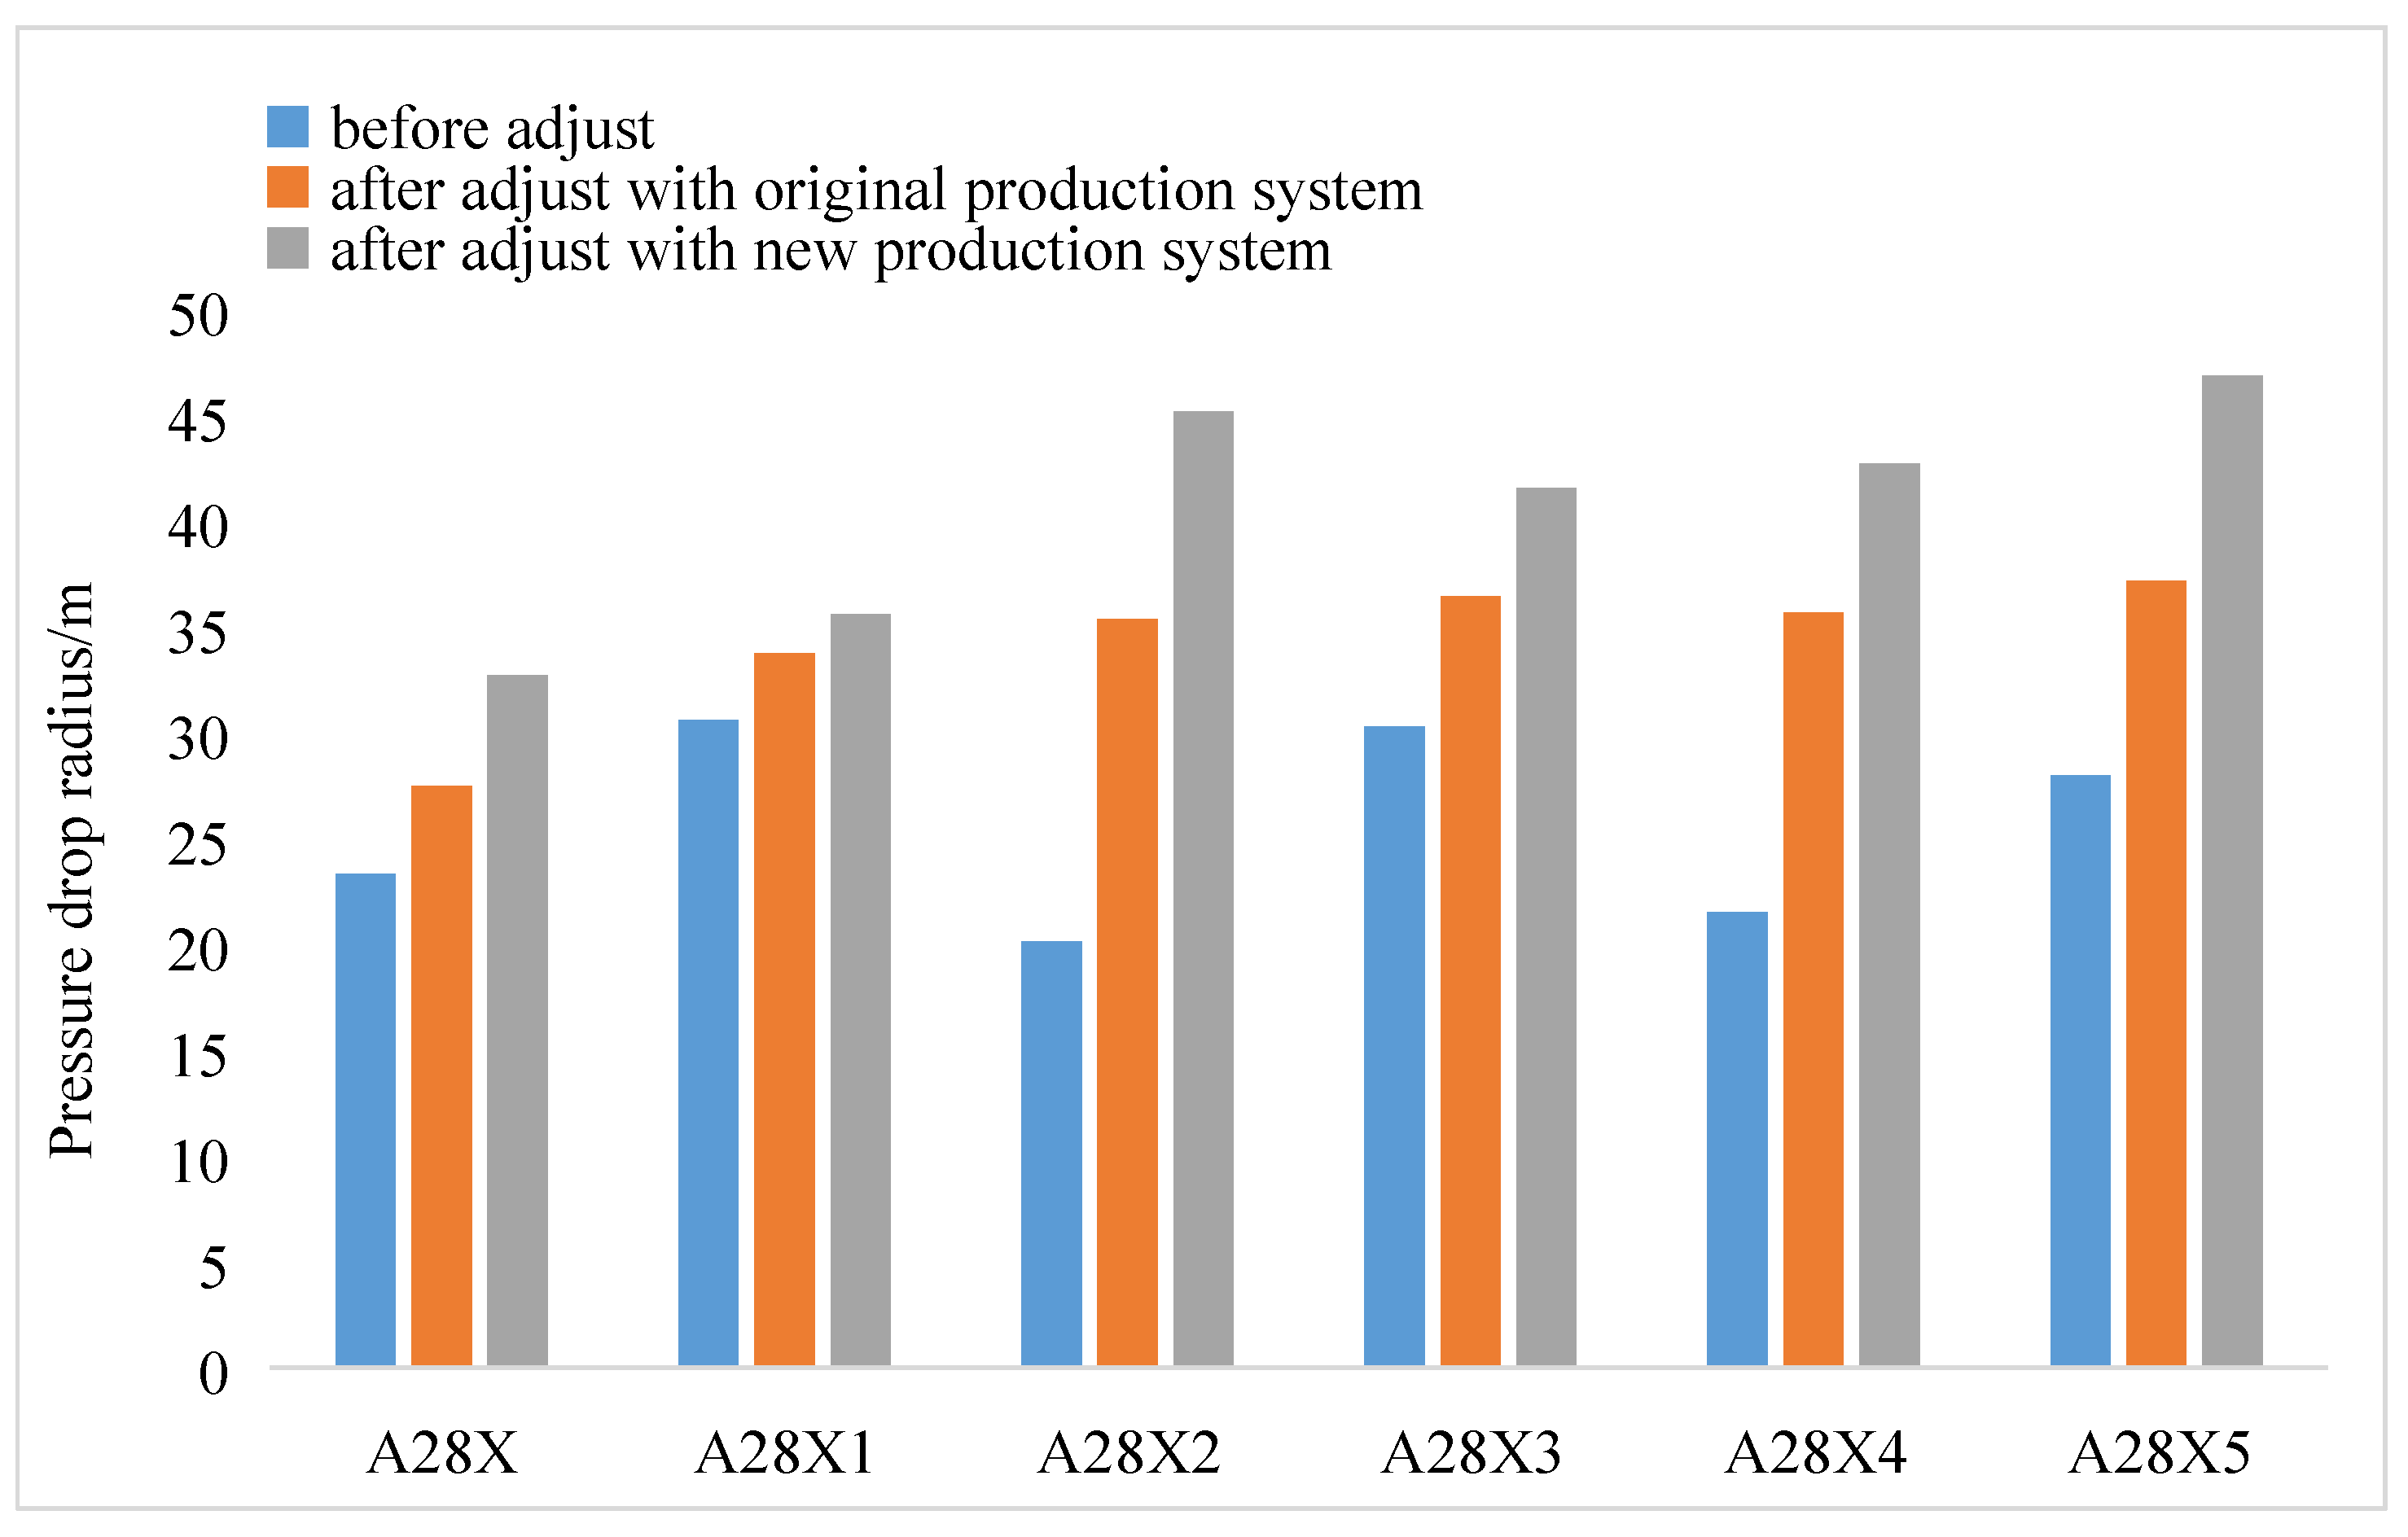
3.3. Production System Optimization for Coalbed Methane Wells

Well groups A28 and A21 are located in the northern part of Qinshui Basin and are characterized by large water production and a need to optimize the production system. On the basis of considering the matrix shrinkage effect, the stress sensitivity effect and external water correction, the production systems of the two well groups were optimized. The final optimization results showed that the average pressure drop radius of the four wells in the A21 well group was increased by 11 m with the new working system, and the pressure relief radius was increased by 6.75 m compared with the situation without the system optimization (Figure 25). With the new system, the average pressure drop radius of the six wells in the A28 group increased by 15.2 m, and the pressure relief radius increased by 6.5 m compared to the situation without the system optimization (Figure 26). The pressure relief area of the two well groups increased significantly.

4. Conclusions

  • The conversion from single-phase flow to two phase flow in a coal reservoir has a great impact on the seepage capacity of the coal reservoir. The gas phase permeability and water phase permeability near the isotonic point can drop to 0.2 times the absolute permeability. The linear phase seepage curve of the fracture system is not suitable for a coal reservoir; the core should be actually used for testing.
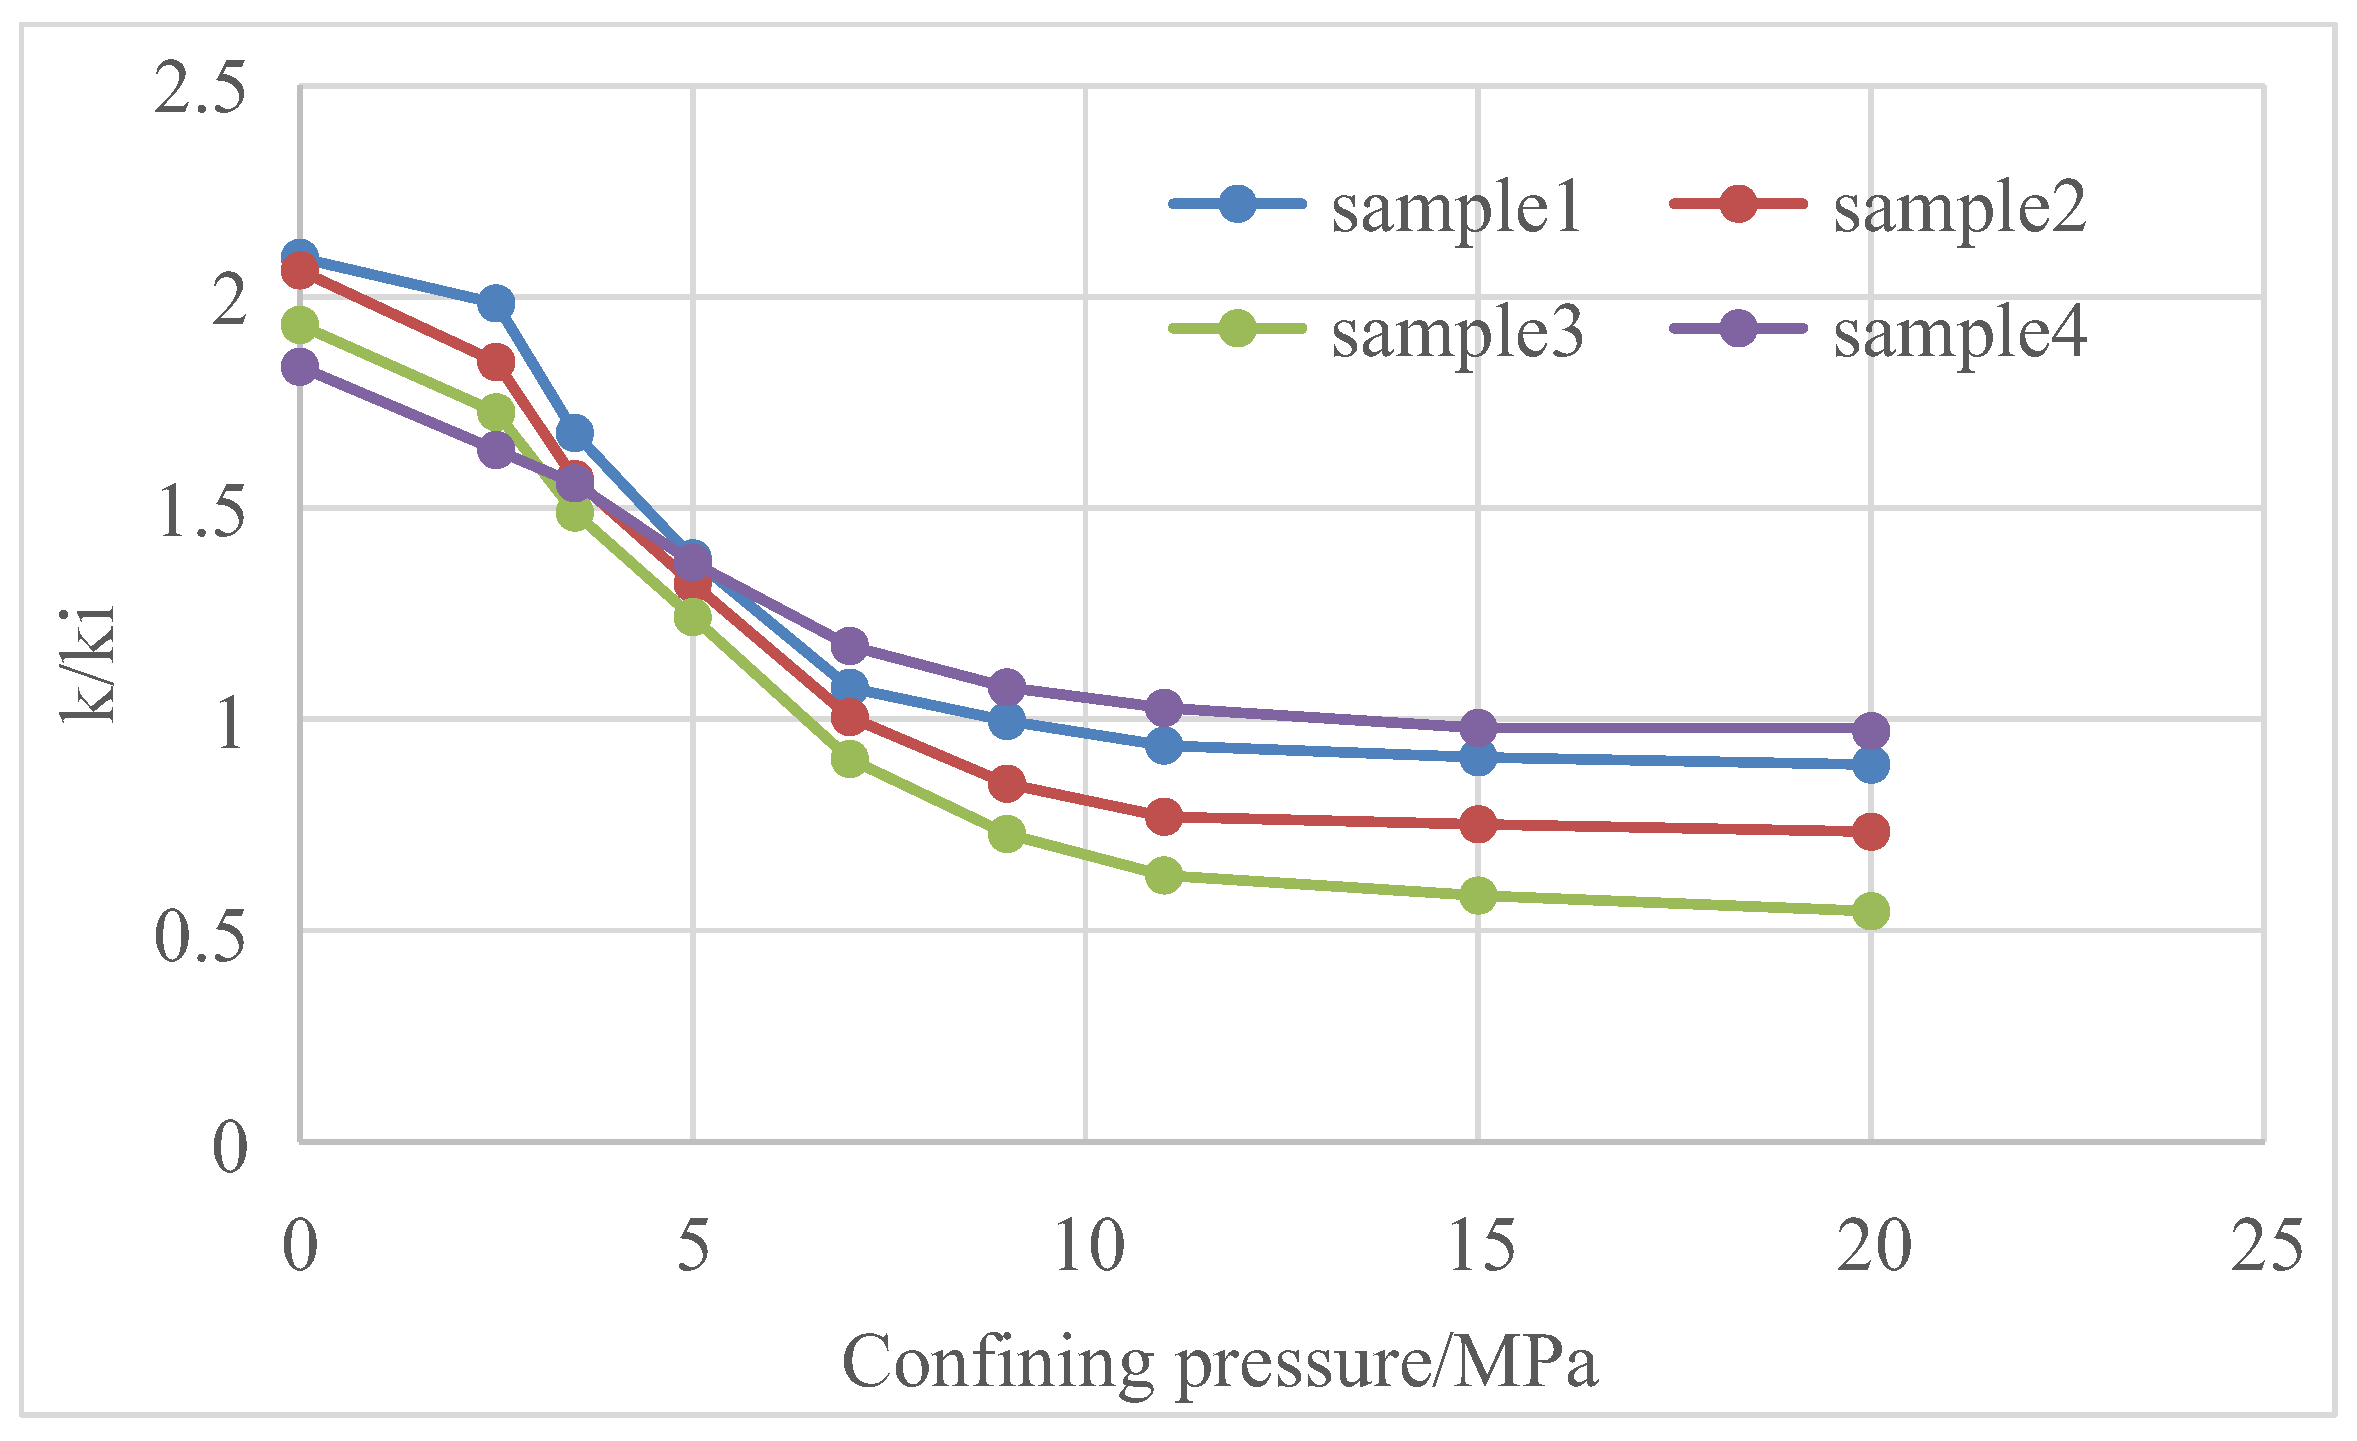
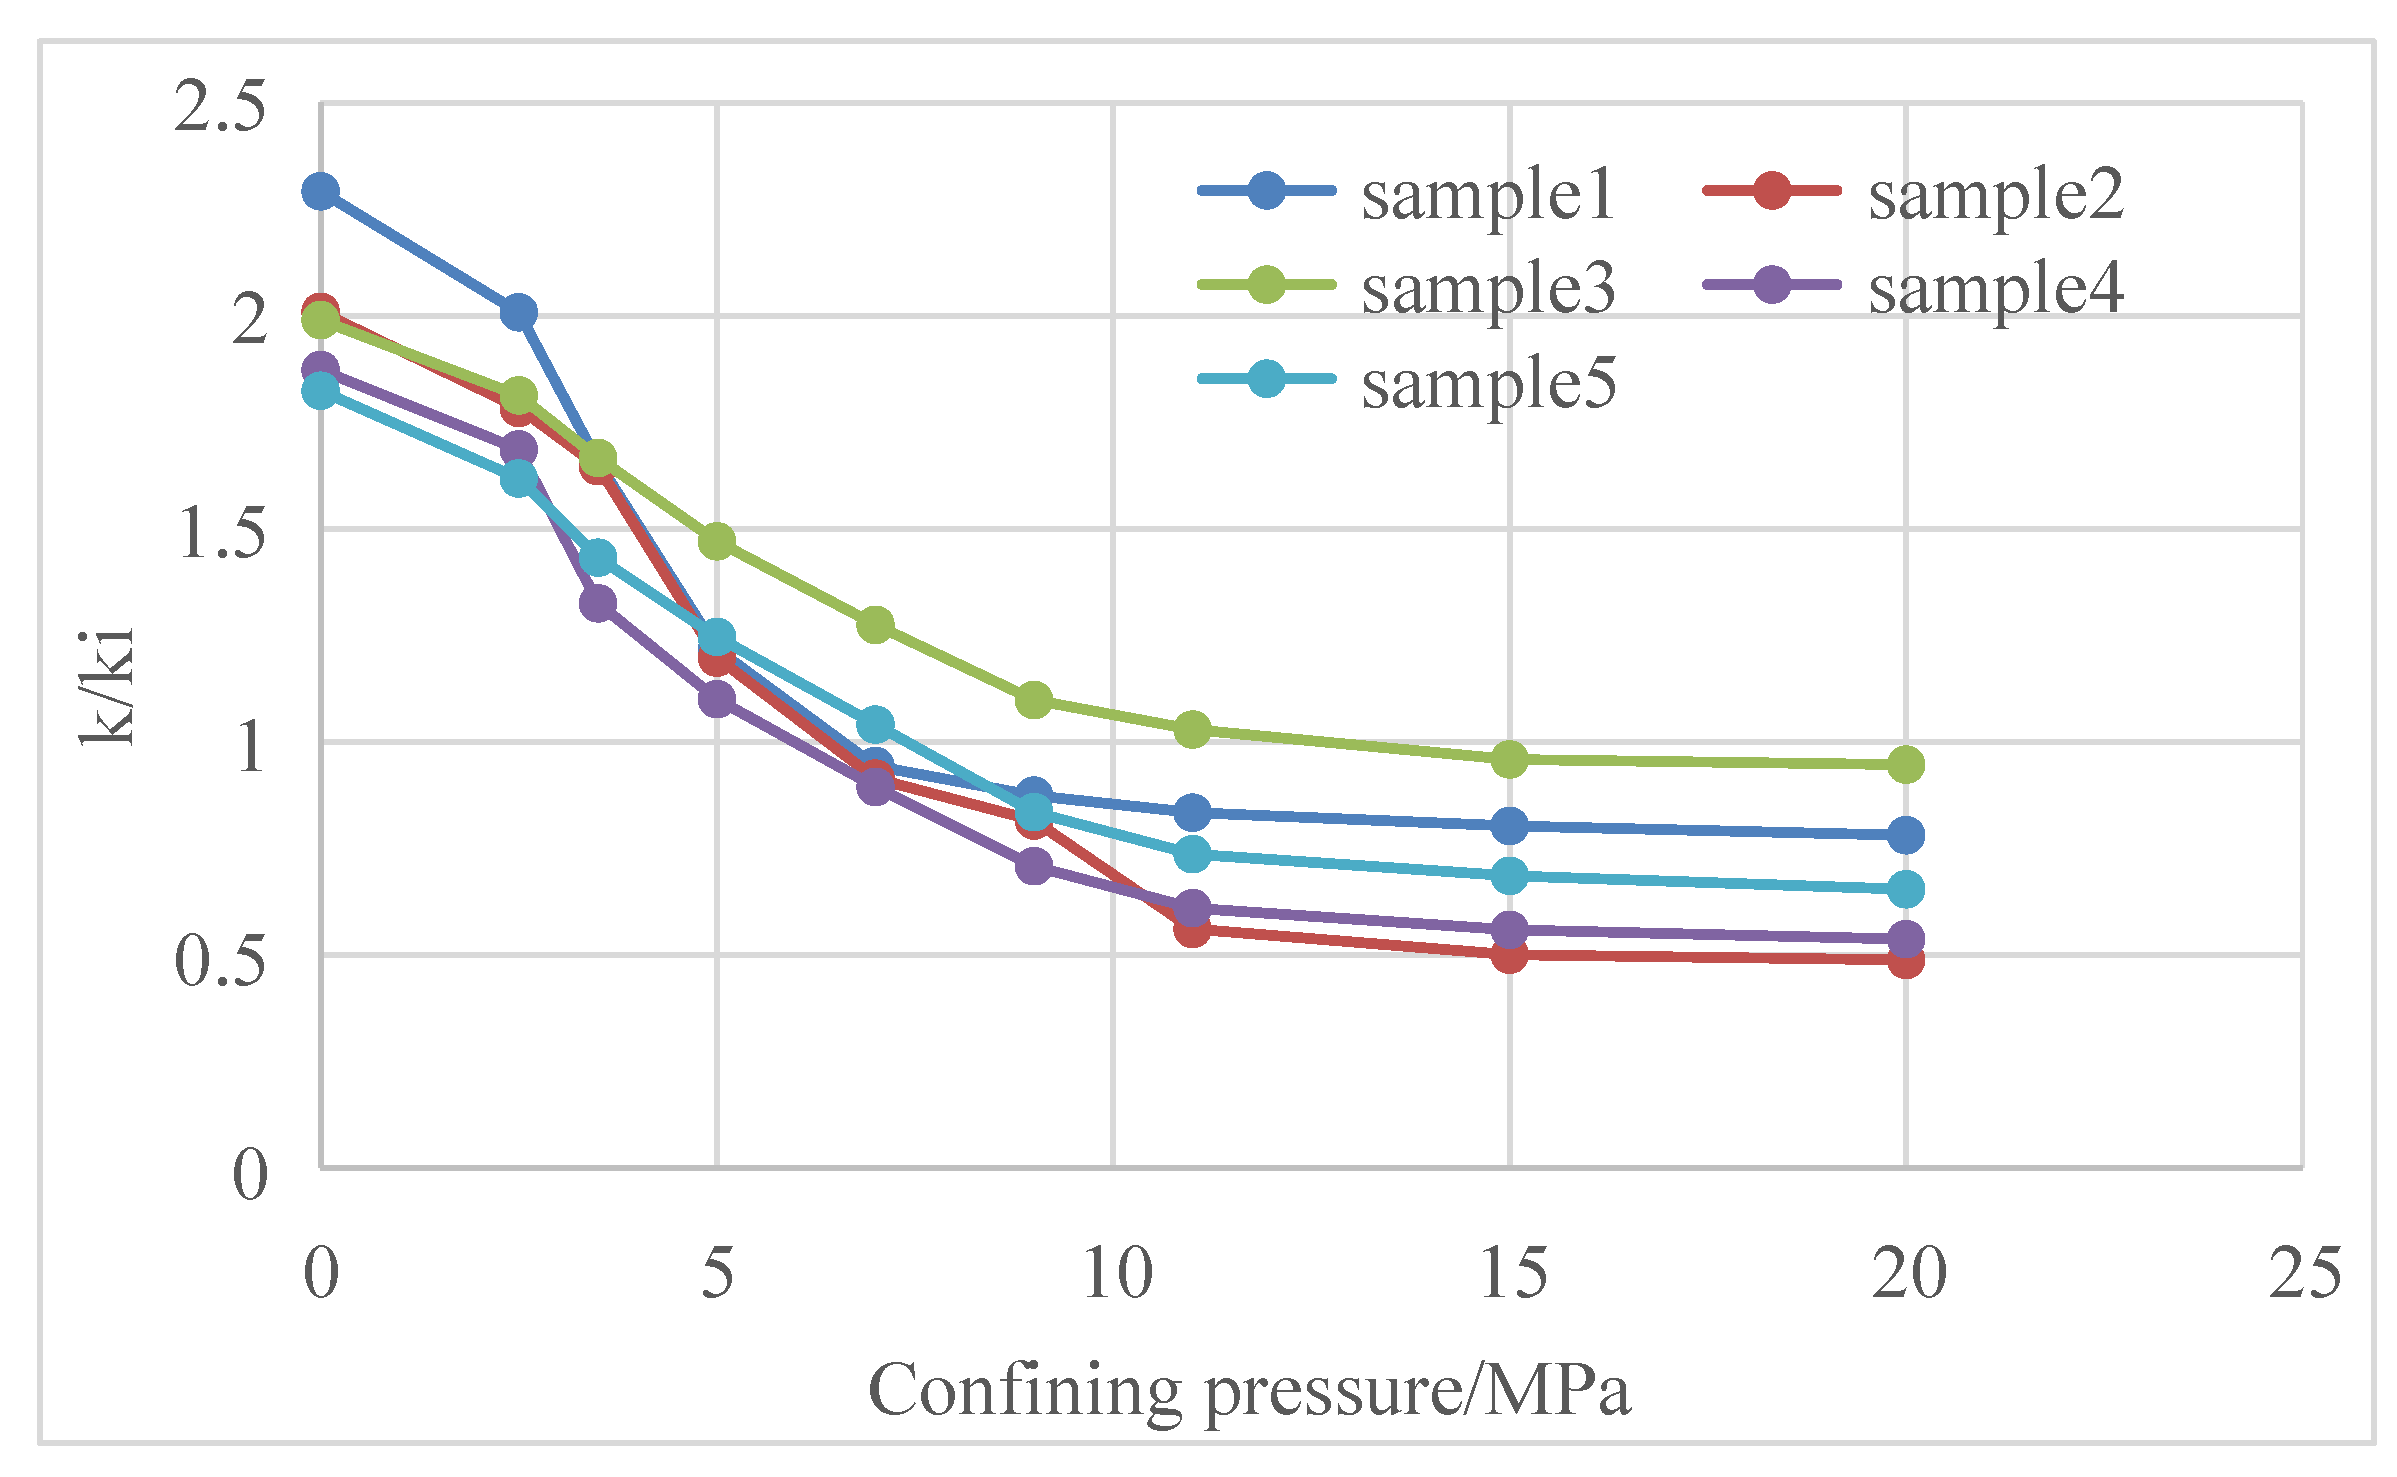
  • Stress sensitivity and matrix shrinkage effects affect the permeability of coal reservoirs. Stress sensitivity mainly occurs in the early stage, and matrix shrinkage mainly acts in the late stage; the influence of the matrix shrinkage effect is greater than that of stress sensitivity. The actual test data of some coalbed methane blocks show that the permeability of the reservoir can change up to 60 times during the initial production and abandonment. The influence of stress sensitivity and matrix shrinkage effects on the productivity of coalbed methane wells should be fully considered in the formulation of production systems.
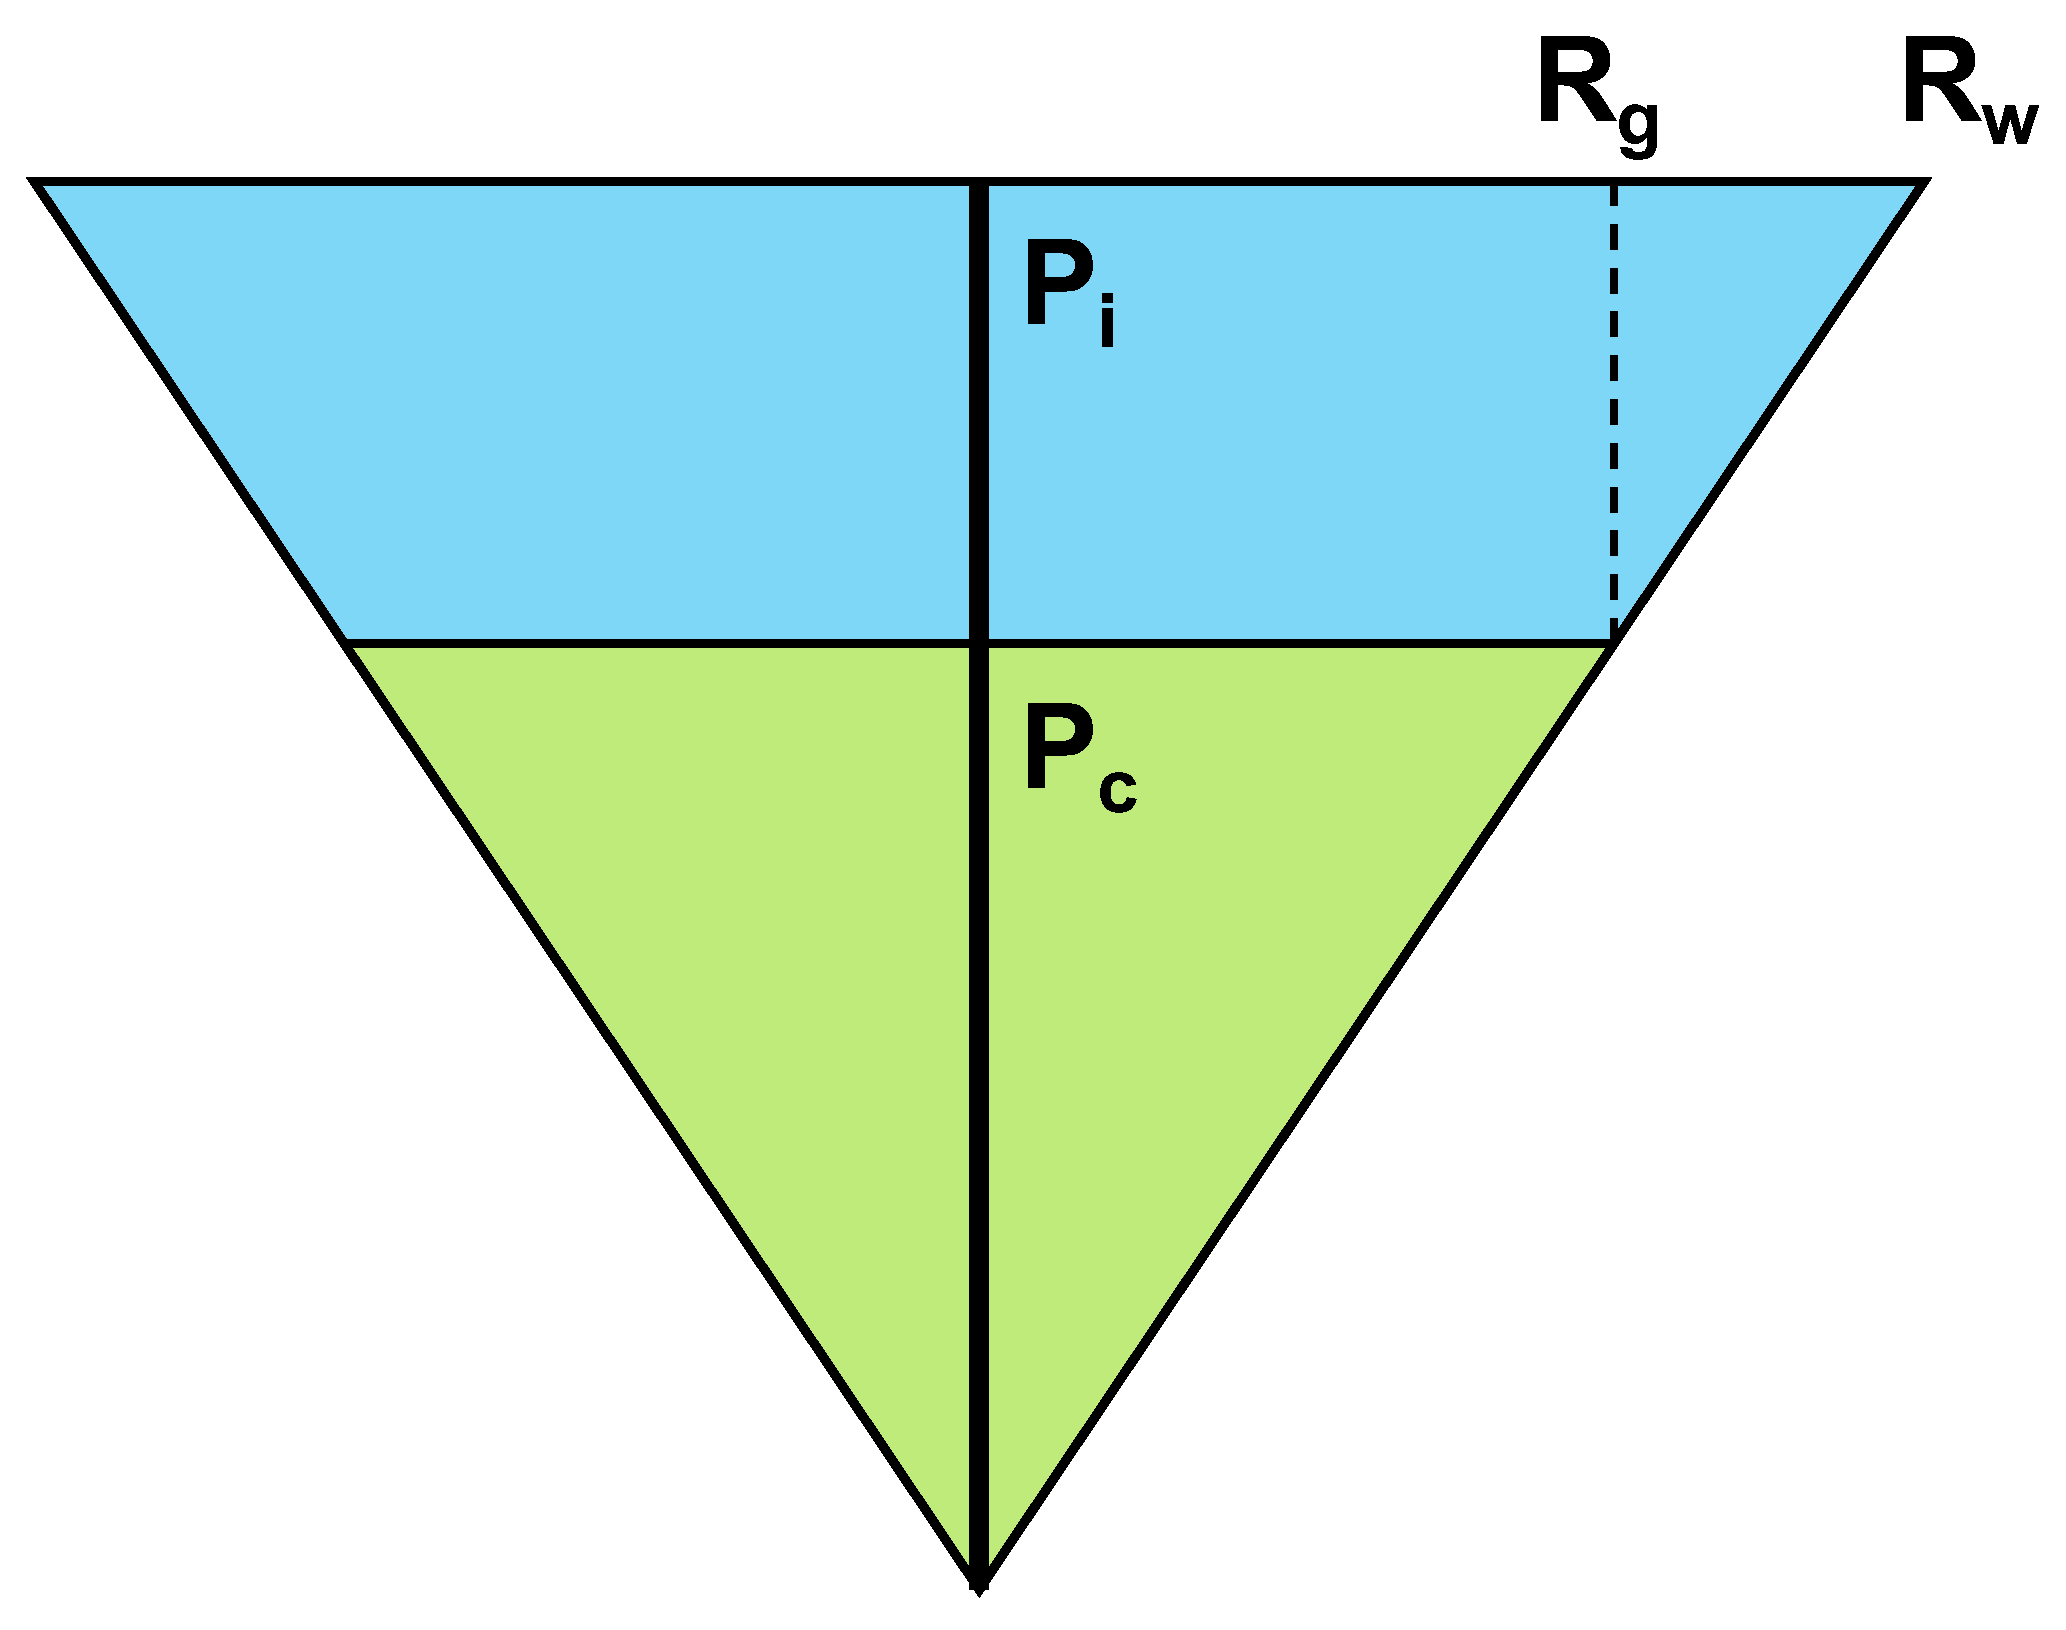
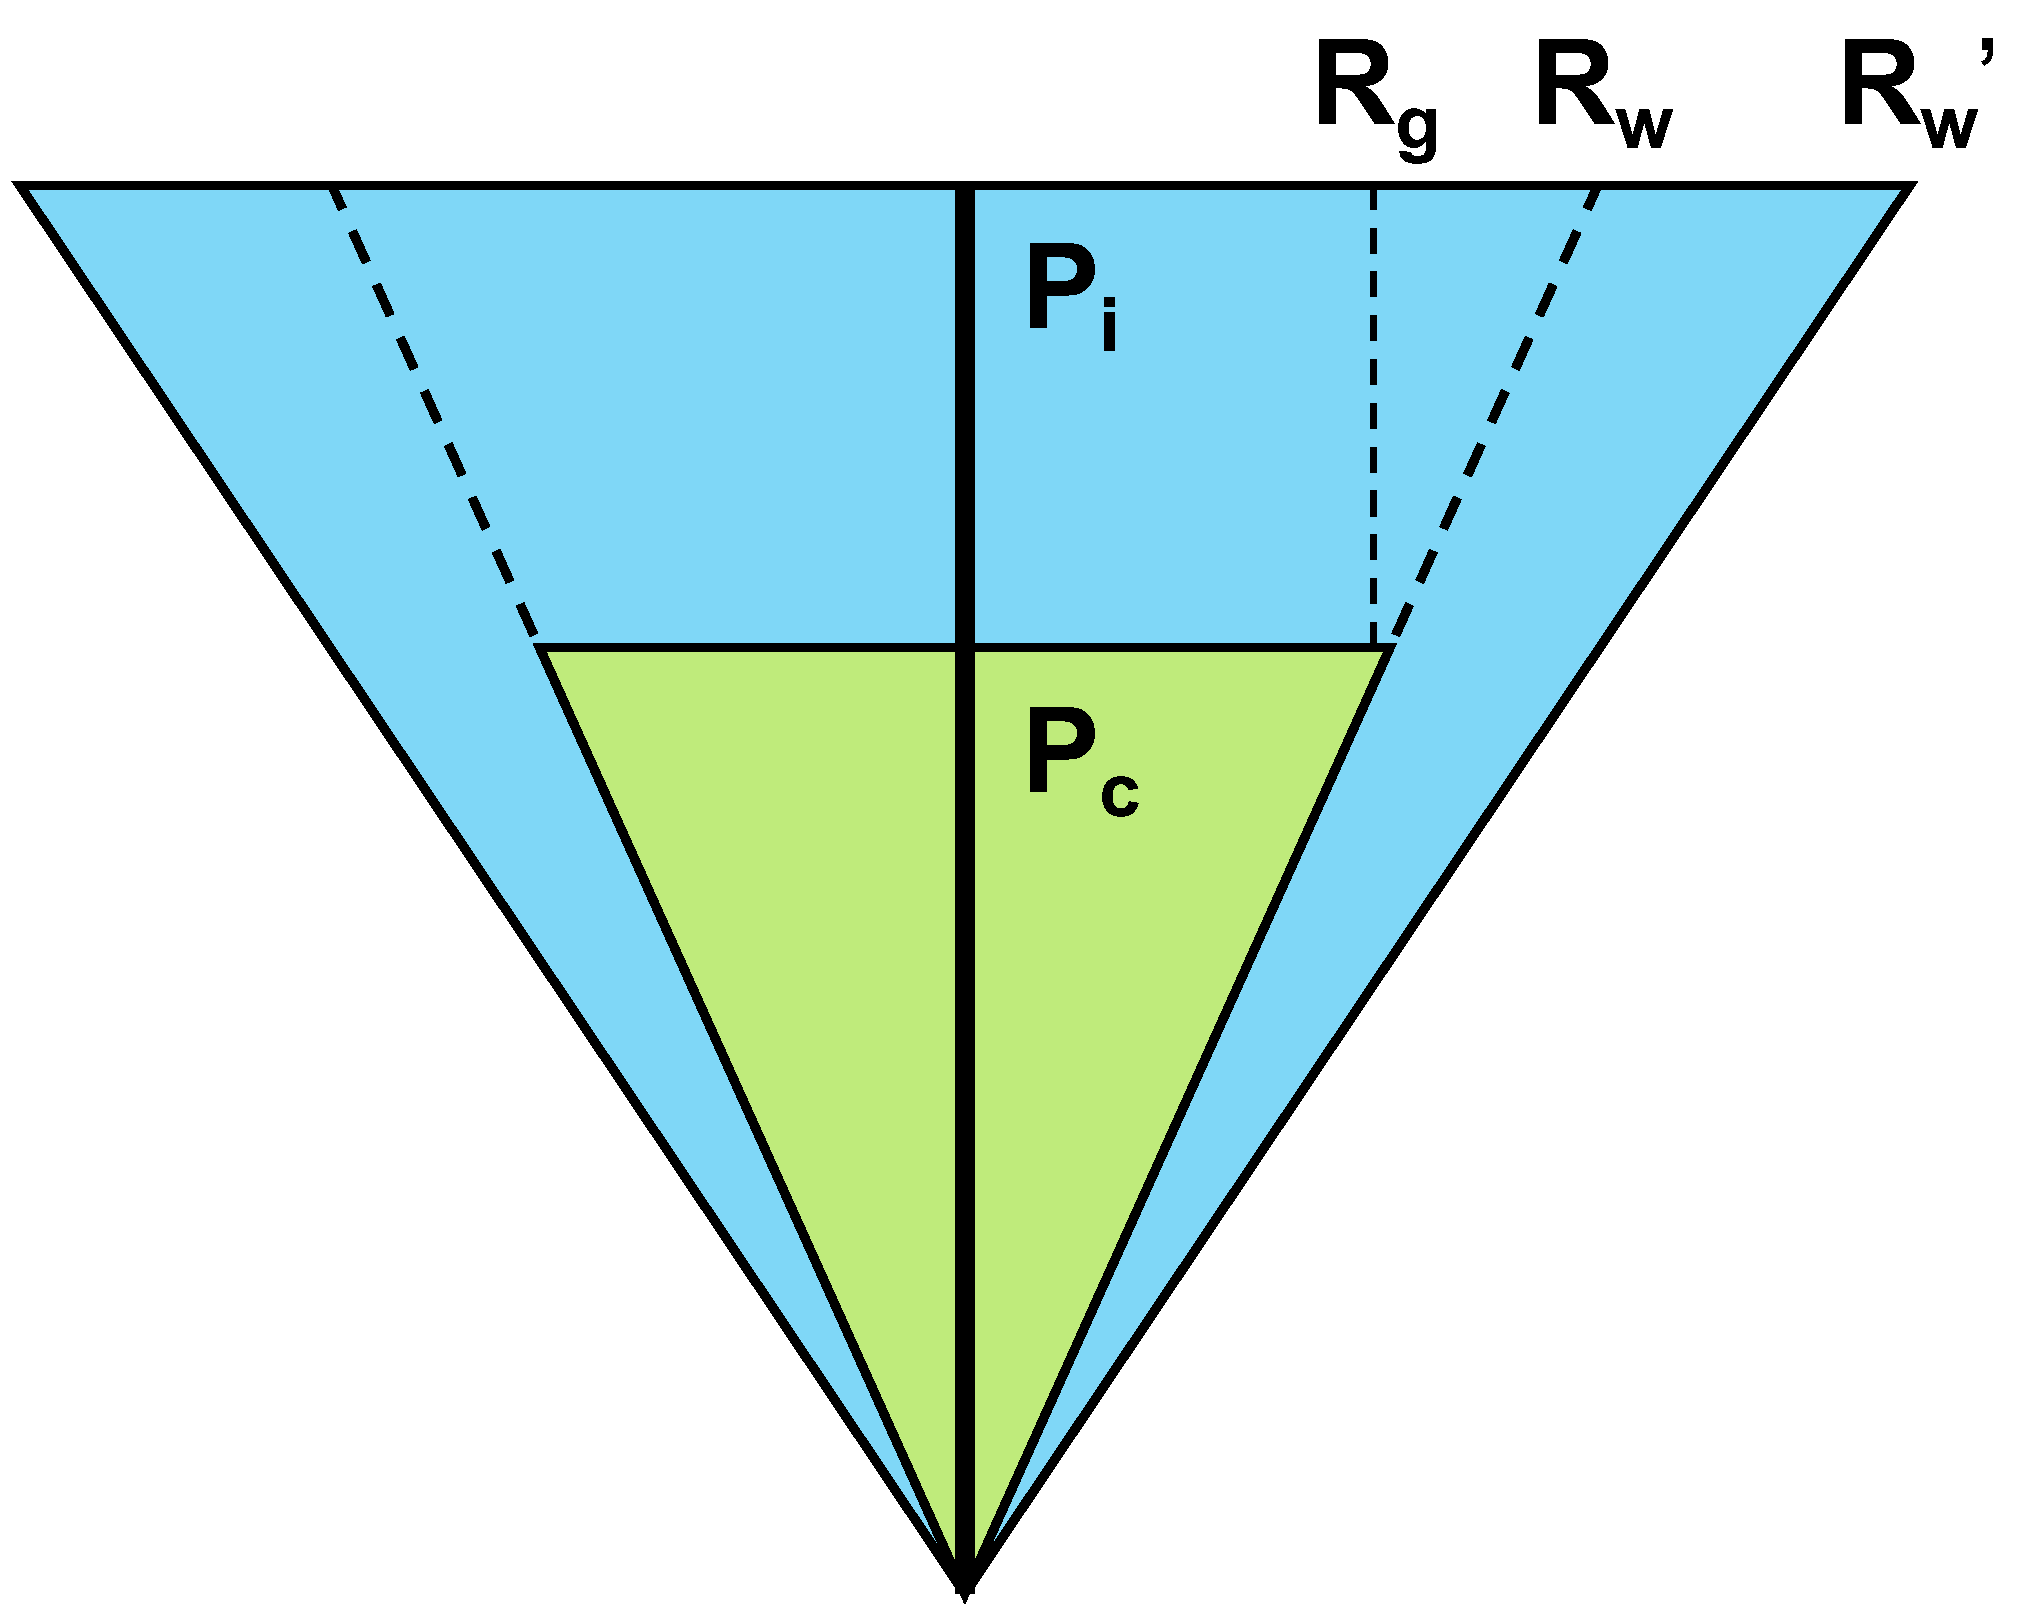
  • In some coalbed methane blocks, the inflow of external and domestic water is relatively large. The amount of external water in some blocks reaches more than 70% of the produced water. It is necessary to adjust the inflow of water first in the optimization of the production system, which will make the optimized production system more suitable for the production of coalbed methane wells.
  • Considering the matrix shrinkage effect, the stress sensitivity effect and external water correction in the optimization of the production system of a coalbed methane well can greatly increase the discharge area (actual field examples show that the optimized gas well has a 65% increase in drainage area) and increase the desorption area of coal reservoirs, thus increasing the production of coalbed methane wells.
  • This research work can well guide the on-site production of coalbed methane and reverse the situation of the optimization of production systems of coalbed methane wells depending only on experience. At the same time, the current research on damage mechanisms is only in the experimental stage, and the damage mechanisms can be further studied in the future to form relevant formulas that can be directly used.

Author Contributions

Conceptualization, C.L., C.W. and Y.L.; Methodology, L.S.; Formal analysis, J.Z.; Writing—original draft, C.L.; Supervision, L.S., Z.Z., J.Z., G.L., Y.L. and Y.M.; Project administration, C.L. All authors have read and agreed to the published version of the manuscript.

Funding

This research received no external funding.

Data Availability Statement

Data is contained within the article.

Conflicts of Interest

Authors Chen Li, Lichun Sun, Zhigang Zhao, Jian Zhang and Cunwu Wang were employed by the company CNOOC Research Institute Ltd. The remaining authors declare that the research was conducted in the absence of any commercial or financial relationships that could be construed as a potential conflict of interest.

Abbreviation

Symbol Explanation
Symbol in Article
k r g relative permeability of gas phase in two phase flow, μm2
k r w relative permeability of water phase in two phase flow, μm2
s g gas saturation in reservoir, dimensionless
s w water saturation in reservoir, dimensionless
S Z N , S Z B , S Y short for coalbed methane block name
q a b s gas production in coalbed methane wells with normalized reserve abundance
k i reservoir permeability under original conditions, μm2
ϕ reservoir porosity, dimensionless
ϕ i reservoir porosity in the initial condition, dimensionless
V L Langmuir volume, m3/t
p i pressure in the original condition, MPa
p L Langmuir pressure, MPa
p pressure, MPa
ε e x p experiment strain, dimensionless
C p mechanical compliance coefficient, MPa−1
M constrained axial modulus, MPa
K bulk modulus, MPa
f a fraction from 0 to 1, dimensionless
ε l parameters of Langmuir curve matching volumetric strain change, dimensionless
k reservoir permeability, D
k i reservoir permeability in the initial condition, D
C f compression coefficient of the matrix, MPa−1
σ effective stress–strain, dimensionless
σ i effective stress–strain in the initial condition, dimensionless
ν Poisson’s ratio, dimensionless
E Young’s modulus, MPa−1
p ε Langmuir-type matrix shrinkage constants, dimensionless
I permeability modulus, MPa−1
r radius of coalbed methane reservoir, m
ψ Hussainy pseudo-pressure, MPa2·cp−1
μ gas viscosity, mpa·s
c g coal compressibility, MPa−1
c d adsorption compression coefficient, MPa−1
t time variable, h
μ i gas viscosity in the initial condition, mpa·s
c t i * total adsorption compression coefficient in the original state, MPa−1
c t * total compression coefficient, MPa−1
p s c pressure in the standard state, MPa
T temperature, K
Z gas deviation factor, dimensionless
T s c standard temperature, K
p ~ D dimensionless bottom-hole pressure in Laplace transform, dimensionless
x D dimensionless length of the x coordinates, dimensionless
sLaplace variable, dimensionless
q ~ D dimensionless flow rate in Laplace transform, dimensionless
α integral variable, dimensionless
K 0 zero-order Bessel function
I 0 zero-order Bessel function
Aa constant, representing different boundaries
Ba constant, representing different boundaries
K 1 one-order Bessel function
I 1 one-order Bessel function
r e D dimensionless reservoir radius, dimensionless
d c m matrix shrinkage coefficient, t/m3
p c critical desorption pressure, MPa
R w discharge radius of water production, m
R g discharge radius of gas production, m
nPore permeability relation characteristic index, dimensionless
Intermediate Variable
C m = ε e x p + C p p V L p p L + p
C m a = 1 M K M + f 1
K M = 1 3 1 + υ 1 υ
ψ p = 2 p b p p μ Z d p

References

  1. Seidle, J. Principle of Coalbed Gas Reservoir Engineering; Shi, X., Translator; Petroleum Industry Press: Beijing, China, 2016. [Google Scholar]
  2. Zheng, C.; Ma, D.; Chen, Y.; Ji, Y.; Ma, Z.; Wang, L.; Wang, X. Research progress micro effect of water on coalbed methane adsorption/desorption. Coal Sci. Technol. 2023, 51, 256–268. [Google Scholar]
  3. Reng, J. Effect of dynamic permeability variation on production of coalbed methane wells. Nat. Gas Ind. 2018, 38, 62–64. [Google Scholar]
  4. Yang, M.; Wang, G.; Xu, S.; Gao, C. Steady Flow Productivity Equation for Stress Sensitivity Coal-bed Methane Gas Well. Nat. Gas Geosci. 2011, 22, 347–351. [Google Scholar]
  5. Liu, W.; Liu, Y. Dynamic analysis on gas-water two-phase unsteady seepage flow in low-permeable coalbed gas reservoirs. Chin. J. Theor. Appl. Mech. 2017, 49, 828–835. [Google Scholar]
  6. Zhu, W.; Dong, H.; Song, H.; Yang, J.; Yue, M. A Mathematical Model for Gas-water Two-phase Nonlinear Flow in Low Permeability Coal Reservoirs and Calculation Analysis. Sci. Technol. Rev. 2013, 3, 36–39. [Google Scholar]
  7. Zhang, P.; Wang, X.; Feng, C.; Zheng, L.; Zhang, Y.; Sun, M. Evaluation method and application of gas-water two-phase unsteady inflow performance of coal reservoir based on multiple factors. Nat. Gas Geosci. 2023, 34, 1641–1651. [Google Scholar]
  8. Feng, Q.; Shu, C.; Zhang, X.; Zhang, J.; Wang, B. Real-time optimization of drainage schedule for coalbed methane wells at gas-water two-phase flow stage. J. China Coal Soc. 2015, 40, 142–148. [Google Scholar]
  9. Niu, C.; Liu, Y.; Cai, Q.; Li, H. Transient well test model for the well with gas and water distributed in coalbed. Mech. Eng. 2013, 35, 35–41. [Google Scholar]
  10. Han, W.; Li, Y.; Chen, X.; Zhuo, Q.; Wang, Y. Mechanism of coal fine-bubble coupling in the unsaturated flow stage of coalbed methane drainage. Coal Geol. Explor. 2023, 51, 46–53. [Google Scholar]
  11. Wei, Y.; Li, C.; Cao, D.; Zhang, A.; Yao, Z.; Xiong, X. The output mechanism and control measures of the pulverized coal in coalbed methane development. Coal Geol. Explor. 2018, 46, 68–73. [Google Scholar]
  12. Han, G.; Ling, K.; Wu, H.; Gao, F.; Zhu, F.; Zhang, M. An experimental study of coal-fines migration in Coalbed-methane production wells. J. Nat. Gas Sci. Eng. 2015, 26, 1542–1548. [Google Scholar] [CrossRef]
  13. Zhao, X.; Liu, S.; Sang, S.; Pan, Z.; Zhao, W.; Yang, Y.; Hu, Q.; Yang, Y. Characteristics and generation mechanisms of coal fines in coalbed methane wells in the southern Qinshui Basin, China. J. Nat. Gas Sci. Eng. 2016, 34, 849–863. [Google Scholar] [CrossRef]
  14. Bai, T.; Chen, Z.; Saiied, M.; Pan, Z.; Liu, J.; Li, L. Characterization of coal fines generation: A micro-scale investigation. J. Nat. Gas Sci. Eng. 2015, 27, 862–875. [Google Scholar] [CrossRef]
  15. Guo, Z.; Hussain, F.; Cinar, Y. Physical and analytical modelling of permeability damage in bituminous coal caused by fines migration during water production. J. Nat. Gas Sci. Eng. 2016, 35, 331–346. [Google Scholar] [CrossRef]
  16. Yang, Y.; Meng, Z.; Zhang, J. Research on stress sensitivity of coal reservoir and a new method for its evaluation. Coal Geol. Explor. 2016, 44, 38–46. [Google Scholar]
  17. Seidle, J.; Huitt, L. Experimental Measurement of Coal Matrix Shrinkage Due to Gas Desorption and Implications for Cleat Permeability Increases. In Proceedings of the International Meeting on Petroleum Engineering, Beijing, China, 14–17 November 1995; Society of Petroleum Engineers: Beijing, China, 1995; pp. 575–582. [Google Scholar]
  18. Palmer, I.; Mansoori, J. How Permeability Depends on Stress and Pore Pressure in Coalbeds: A New Model. SPE Reserv. Eval. Eng. 1998, 1, 539–544. [Google Scholar] [CrossRef]
  19. Shi, J.Q.; Durucan, S. Drawdown Induced Changes in Permeability of Coalbeds: A New Interpretation of the Reservoir Response to Primary Recovery. Transp. Porous Media 2004, 56, 1–16. [Google Scholar] [CrossRef]
  20. Pedrosa, O.A. Pressure Transient Response in Stress-Sensitive Formations. In Proceedings of the SPE California Regional Meeting Society of Petroleum Engineers, Oakland, CA, USA, 2–4 April 1986; Society of Petroleum Engineers: Oakland, CA, USA, 1986; pp. 203–214. [Google Scholar]
  21. Jing, W.; Zhou, J.; Yang, L.; Jin, R.; Jing, L. Deformation and Failure Mechanism of Surrounding Rock in Deep Soft Rock Tunnels Considering Rock Rheology and Different Strength Criteria. Rock Mech. Rock Eng. 2023, 2024, 545–580. [Google Scholar] [CrossRef]
  22. Jia, Q.; Liu, D.; Cai, Y.; Fang, X.; Li, L. Petrophysics characteristics of coalbed methane reservoir: A comprehensive review. Front. Earth Sci. 2021, 15, 202–223. [Google Scholar] [CrossRef]
  23. Altowilib, A.; AlSaihati, A.; Alhamood, H.; Alafnan, S.; Alarifi, S. Reserves Estimation for Coalbed Methane Reservoirs: A Review. Sustainability 2020, 12, 10621. [Google Scholar] [CrossRef]
  24. Zhu, S.; Peng, X.; Li, C.; Deng, P.; Ma, Y.; Peng, C.; Sun, H.; Jia, H. An approximation of the relative permeability and discussion on curve shapes in coalbed methane reservoirs. Chin. J. Rock Mech. Eng. 2019, 38, 1659–1666. [Google Scholar]
  25. Zhang, S. Change and Stress Sensitivity of Physical Properties and Gas Content of Coal Reservoir with Depth in Qinshui Basin. China Coalbed Methane 2016, 13, 7–9. [Google Scholar]
  26. Wan, J.; Li, K.; Ran, C.; Hou, D. Coalbed Methane Deliverability Correlation Research Considering Stress Sensitivity. Coal Technol. 2016, 35, 311–313. [Google Scholar]
  27. Zhang, H.; Li, B.; Li, Z.; Reng, G. Study on dynamic curves of coalbed methane well flow rate considering stress sensitivity. Petrochem. Ind. Appl. 2012, 31, 33–34+53. [Google Scholar]
  28. Liu, H.; Sang, S.; Feng, Q.; Hu, B.; Hu, Y.; Xu, H.; Cheng, Q. Study on stress sensitivity of coal reservoir during drainage of coal-bed methane well in Southern Qinshui Basin. J. China Coal Soc. 2014, 39, 1873–1878. [Google Scholar]
  29. Kang, Y.; Chen, D.; Li, X.; Zhou, L.; Chen, F. Influence of dvilling fluid on stress sensitivity of coalbed reservoir. Coal Geol. Explor. 2014, 42, 39–43. [Google Scholar]
  30. Chen, Z.; Wang, Y.; Guo, K.; Sun, Q.; Zhang, Y. Stress Sensitivity of High-rank Coalbed Methane Reservoir. Acta Geol. Sin. 2008, 82, 1390–1395. [Google Scholar]
Figure 1. SZN Block phase permeability curve test.
Energies 17 00789 g001
Figure 2. Ratio of relative permeability to absolute permeability at isotonic point.
Energies 17 00789 g002
Figure 3. The whole life cycle of a coalbed methane well divided into stages.
Energies 17 00789 g003
Figure 4. Typical facies permeability curves of different reservoirs ((a) fracture system, (b) sandstone system, (c) shaly sand system, (d) coal reservoir).
Energies 17 00789 g004
Figure 5. Gas production under typical phase permeability curves of different reservoirs.
Energies 17 00789 g005
Figure 6. Histogram of peak gas production per unit resource abundance and pressure control time in SZN block.
Energies 17 00789 g006
Figure 7. Histogram of peak gas production per unit resource abundance and pressure control time in SY block.
Energies 17 00789 g007
Figure 8. Histogram of peak gas production per unit resource abundance and pressure control time in SZB block.
Energies 17 00789 g008
Figure 9. Pressure distribution in well A.
Energies 17 00789 g009
Figure 10. Production of 10/20/38-month pressure drop funnel.
Energies 17 00789 g010
Figure 11. Stress sensitivity curve of Baode block in the eastern margin of Ordos Basin.
Energies 17 00789 g011
Figure 12. Stress sensitivity curve of Mabi block, southern Qinshui Basin (well 1).
Energies 17 00789 g012
Figure 13. Stress sensitivity curve of Mabi block, southern Qinshui Basin (well 2).
Energies 17 00789 g013
Figure 14. Stress sensitivity curve of Zhengzhuang block in southern Qinshui Basin.
Energies 17 00789 g014
Figure 15. Stress sensitivity curve of Qilihe block in northern Qinshui Basin.
Energies 17 00789 g015
Figure 16. Stress sensitivity curve of Fanzhuang block in southern Qinshui Basin (well 1).
Energies 17 00789 g016
Figure 17. Stress sensitivity curve of Fanzhuang block in southern Qinshui Basin (well 2).
Energies 17 00789 g017
Figure 18. Stress sensitivity curve of Fanzhuang block in southern Qinshui Basin (well 3).
Energies 17 00789 g018
Figure 19. Pressure drop funnel of coal reservoir in the absence of external water.
Energies 17 00789 g019
Figure 20. Pressure drop funnel of coal reservoir in the presence of external water.
Energies 17 00789 g020
Figure 21. Optimization process of coal-bed methane well production with full life cycle.
Energies 17 00789 g021
Figure 22. Influence of matrix shrinkage on dimensionless bottom-hole pressure.
Energies 17 00789 g022
Figure 23. Effect of matrix shrinkage on bottom-hole pressure.
Energies 17 00789 g023
Figure 24. Water production funnel and gas production funnel calculated by gas production.
Energies 17 00789 g024
Figure 25. Analysis of production system optimization effect of well group A21.
Energies 17 00789 g025
Figure 26. Analysis of production system optimization effect of well group A28.
Energies 17 00789 g026
Table 1. The values of A and B under different boundary conditions.
Boundary A B
Infinite boundary10
Closed boundary1 K 1 r e D s / I 1 r e D s
Constant-pressure boundary1 K 0 r e D s / I 0 r e D s
Table 2. Basic parameters of matrix shrinkage effect comparison.
ParameterValueParameterValue
Pi/pa2.83 × 106sk0
k1/ μ m 2 0.001k2/ μ m 2 0.002
rm/m110re/m500
h/m19.812Lf/m110
n3dcm0, 100, 200
φ0.2sg/%100
Disclaimer/Publisher’s Note: The statements, opinions and data contained in all publications are solely those of the individual author(s) and contributor(s) and not of MDPI and/or the editor(s). MDPI and/or the editor(s) disclaim responsibility for any injury to people or property resulting from any ideas, methods, instructions or products referred to in the content.

