Article

A Comparative Analysis of Actuator-Based Turbine Structure Parametrizations for High-Fidelity Modeling of Utility-Scale Wind Turbines under Neutral Atmospheric Conditions

by
Christian Santoni
1,
Fotis Sotiropoulos
2 and
Ali Khosronejad
1,*
1
Department of Civil Engineering, Stony Brook University, Stony Brook, NY 11794, USA
2
Mechanical and Nuclear Engineering, Virginia Commonwealth University, Richmond, VA 23284, USA
*
Author to whom correspondence should be addressed.
Energies 2024, 17(3), 753; https://doi.org/10.3390/en17030753
Submission received: 16 January 2024 / Revised: 28 January 2024 / Accepted: 2 February 2024 / Published: 5 February 2024
(This article belongs to the Special Issue Advances in Fluid Dynamics and Wind Power Systems)

Abstract

:
This study compared the efficacy of the actuator line and actuator surface models in carrying out large-eddy simulations of a utility-scale wind turbine. A large-eddy simulation with the actuator surface and line models was employed to study the wake flow and power production of the turbine. While both the actuator models were employed for the blade representation, the nacelle was modeled using the actuator surface approach. Both of the actuator models demonstrated agreement in the mean velocity field, power production, and turbulence kinetic energy of the wake flow. Comparing the wake flow, power production, and turbulence kinetic energy results, it was found that the mean discrepancy between the two models was 0.6 % , 0.3 % , and 2.3 % , respectively. Despite the minor discrepancies, both actuator models accurately captured the hub vortex in the wake of the nacelle, evidenced by an energy peak in wind speed spectra at f / f ω 0.34 .

1. Introduction

The accurate description of the flow past wind turbine arrays has remained a subject of discussion in the past few decades, with a keen interest in understanding the performance of wind turbine arrays under various atmospheric boundary layer conditions. Due to their large scale, wind farms are often studied and designed using engineering wake models that offer a simplified description of the turbine wakes and their interaction to reasonably accurately predict the power production [1,2,3,4,5]. However, such wake models often suffer from a lack of adequate description of the turbine wake for control and optimization applications, owing to the oversimplifications considered in their implementation [6]. For this reason, high-fidelity simulations of wind turbines and wind farms have been shown to be essential in developing, tuning, and validating more accurate wake models [7,8,9,10,11,12,13]. The high-fidelity models often combine a momentum equation solver with a simplified description of the turbine loads that are applied as a body force to the flow [14,15,16,17,18,19,20,21,22,23].
One of the earliest high-fidelity turbine model applications used the actuator disk model (ADM) [14,24]. As the name suggests, the turbine rotor is a two-dimensional disk (refer to Figure 1a), with loads calculated using one-dimensional momentum theory. These loads are then applied and distributed across the Eulerian grid using either an elliptic or Gaussian distribution. Sørensen et al. [16] studied the relation of the thrust coefficient ( C T )—on the axial interference factor (a)—by applying a constant load. They showed that the thrust coefficient follows the axial interference factor predicted by the one-dimensional momentum theory and Glauert empirical relation [25]. Variations of the actuator disk model have been developed by considering or neglecting the tangential loads of the rotor [14,24,26,27]. Moreover, Meyers et al. [27] performed large-eddy simulations of infinite wind farms with the ADM with and without tangential loads. They showed that although the wake rotation caused by the tangential load provided a more accurate description of the turbine wake, it had a negligible effect on the mean streamwise velocity and average power on their infinite wind farm array.
Although ADMs provide a better description of the turbine than wake models, it has been shown that—due to their inability to capture correctly the stall behavior of the blades—they might have issues in predicting the power production and turbine wake flow at high wind speeds [28]. As a solution to this constraint, Sørensen et al. [16] developed the actuator line model (ALM), which couples a three-dimensional Navier–Stokes equation solver with the blade element momentum (BEM) theory to compute the loads along each blade (see Figure 1b). Their work with the ALM [16] showed good agreement for power production results, compared to the Nordtank 500 kW turbine, for low to high wind speeds. Moreover, they were able to capture the root and tip vortex formation in the near wake region. Furthermore, by performing large-eddy simulations (LES) of a single turbine with the ALM and the ADM, Martinez-Tossas et al. [29] showed that the presence of a tip vortex in the ALM disrupted the axisymmetry of the turbine wake typically observed in the wake of the ADM. In addition, they observed that the momentum deficit in the inner wake region was underpredicted due to the absence of the nacelle, and the prediction of the power production of the ADM and ALM showed sensitivity to the force spreading parameter ( ϵ ).
Further attention was paid to the effect of the turbine geometry on the improvement of the actuator line model. For example, Martinez-Tossas et al. [30,31] developed and applied the filtered lifting line theory to compute the optimal Gaussian spreading for the actuator line model. They have shown that the optimal spreading is a function of the blade geometry, specifically the chord length c ( ϵ / c 0.25 ). Moreover, PIV measurements [32] and smoke visualization [33] have shown the formation of a vortex in the hub region of the near wake similar to that of propellers [34]. In a comparative analysis between the actuator line model and a turbine resolved model, using the immersed boundary method, of a hydrokinetic turbine, Kang et al. [35] showed that the nacelle plays an essential role in the formation of the hub vortex that is not capture by the ALM. Furthermore, Santoni et al. [36] combined the actuator line model with the immersed boundary method to model the turbine rotor, tower, and nacelle using LES. They showed that the tower and nacelle play a role in the breakdown of the tip vortex and the nonsymmetric wake recovery due to the turbulent mixing and the wake rotation.
To consider the geometry of the blades and the turbine nacelle, Yang et al. [21] proposed a new actuator surface model (ASM) (see Figure 1c). In their work, Yang and Sotiropoulos [21] showed good agreement with measurements of a hydrokinetic turbine in terms of the velocity deficit, turbulence kinetic energy, and wake meandering frequency. Subsequently, Foti et al. [37] performed LES of a turbine with the ASM, where their spectral analysis in the near wake revealed a highly energetic oscillation at the Strouhal frequency of S t = 0.7 0.8 , in agreement with the experimental observations of Iungo et al. [38] and the numerical results in [35,39].
Although the ASM and ALM capture the wake dynamics with greater fidelity than the actuator disk model [21,29], due to grid resolution constraints for the simulation of large wind farms, continuous improvements to the actuator disk model have been made [19,20,22]. However, using BEM to calculate loads over the blade for the ALM is of particular interest in studying the aeroelastic response of the blades [40,41,42,43,44,45,46,47]. Moreover, Draper et al. [48,49] conducted a grid sensitivity analysis on the performance of the actuator line model for coarse resolutions, i.e., larger than the recommended ( D / Δ g r i d < 50 ). They showed that although the actuator line model did present sensitivity in the prediction of power production, this was not the case for the momentum deficit. Moreover, they demonstrated that the ALM obtained better agreement with the experimental measurements than the ADM with a similar resolution. In other words, the ALM accurately described the wind turbine wake, even with coarse grid resolutions. However, as Kang et al. [35] demonstrated, geometrical details such as the nacelle are critical to accurately resolve the mean flow and the dynamics in the far wake. Although the ASM may accurately resolve the near and far wake dynamics, its computational cost for the modeling of large-scale wind farms may be prohibitive. To mitigate computational costs, this study integrates the actuator line and actuator surface models to parameterize the turbine blades and the nacelle, respectively (refer to Figure 1d). However, it is uncertain whether employing the ALM alongside the nacelle ASM might enhance the accuracy of the wake, particularly in addressing the meandering induced by the hub vortex.
To address the mentioned knowledge gap, large-eddy simulations of a utility-scale wind turbine using the blade actuator line model and the nacelle actuator surface model have been performed. The turbine considered in this work is the Clipper Liberty wind turbine, located at the Eolos facility at the University of Minnesota, featuring a rotor diameter of 96 m and a nameplate capacity of 2.5 MW at a rated wind speed of 12.5 m/s. An additional set of benchmark simulations of the actuator surface model for the blade and the nacelle has been carried out. Further, to examine the accuracy of the actuator surface model over a coarse grid, a sensitivity analysis has been performed using three different resolutions: D / Δ g r i d = 40 , 20, and 14.
The paper is organized as follows. A summary of the governing equations and the turbine ASM and ALM is given in Section 2, and a description of the numerical setup is given in Section 3. The discussion of the grid sensitivity analysis and the comparison between the blade ALM and ASM is given in Section 4 and Section 5, respectively. A summary and final remarks are given in Section 6.

2. Methodology

2.1. Equations of Flow Motion

Large-eddy simulations were performed using the VFS Wind model, which solves the spatially filtered Navier–Stokes equations in a generalized curvilinear coordinate system given by
U i t = ξ l i U j u l ξ j + 1 R e ξ j g j k J u l ξ k ξ j ξ l j p J τ l j ξ j + f l ,
J U i ξ i = 0 ,
where p is the pressure and u l is the filtered Cartesian velocity component along the l-direction. The contravariant volume flux U i is given by U i = ( ξ m i / J ) u m , where ξ m i is the Jacobian of the curvilinear transformation and J its determinant, respectively. The contravariant tensor components are given by g i k = ξ l i ξ l k . The Reynolds number is R e = U D / ν , where U is the wind velocity far from the bottom surface, D is the wind turbine rotor diameter, and ν is the kinematic viscosity. The dynamic eddy viscosity model [50] was used for the modeling of the sub-grid stresses. The external forces per unit volume, f l , were computed using the ASM [21] and ALM [17] for the wind turbine blades and nacelle. The momentum equations were discretized in space using the second-order central-differences scheme and advanced in time using the semi-implicit Crank–Nicolson scheme. The fractional step method was used to project the resulting non-solenoidal velocity field into a solenoidal space [51].

2.2. Actuator Line and Surface Models

2.2.1. Blade Model

The ASM and the ALM represent the turbine blade by computing the lift and drag forces using the BEM theory [52], as follows:
f L = 1 2 C L α ρ U r e l 2 c ,
f D = 1 2 C D α ρ U r e l 2 c ,
where C L and C D are the lift and drag coefficients, respectively, which are a function of the angle of attack α given by
α = tan 1 U x U θ ω r ϕ ,
where ϕ is the blade twist angle. The relative velocity, U r e l , is computed as
U r e l = U x 2 + U θ ω r 2 ,
where ω is the rotor angular velocity, and r is the distance from the rotor center to the blade element. The axial velocity U x and azimuthal velocity U θ are interpolated from the background Eulerian flow grid, x , into the blade discrete Lagrangian grid, X (Figure 1c,d), using a discrete delta function approach given by
U ( X ) = x U ( x ) δ ( x X ) V ( x ) ,
where δ is the smoothed four-point cosine function of Yang et al. [53] and V is the background grid cell volume.
In the case of the actuator surface model, the velocity computed over the Lagrangian grid is averaged over the chord length, c, for the computation of the aerodynamic loads (Equations (2) and (3)) and redistributed back into the Lagrangian grid in each radial location as
f ( X ) = ( f L + f D ) / c .
The resulting force is distributed from the blade Lagrangian grid into the Eulerian flow grid using a similar approach as in Equation (6),
f ( x ) = X f ( X ) δ ( x X ) A ( x ) ,
where f is the aerodynamic force vector, and A is the length of the actuator line segment or the area of the actuator surface grid cell.
In Du et al. [54], the stall delayed model was used to correct the lift and drag coefficients to account for the three-dimensional (3D) and rotational effects. In addition, to consider the tip losses caused by the formation of the blade tip vortex, the loss correction factor of Shen et al. [55] was applied to the computed forces.

2.2.2. Nacelle Model

The nacelle was modeled by considering the normal and tangential forces over its surface. The normal force component per unit area that results from the impermeability condition was computed using a direct forcing, as follows [21]:
f n = h u ˜ n Δ t ,
where h = ( Δ x Δ y Δ z ) 1 / 3 is the length scale of the Eulerian grid and u ˜ n is the velocity normal to the actuator surface of the nacelle. The tangential force per unit area is given by
f τ = 1 2 ρ C f U 2 ,
where C f is the friction coefficient that is obtained from the following empirical relation [56]:
C f = 0.37 l o g R e X 2.584 ,
where R e X is the Reynolds number computed from the incoming velocity and the distance from the leading edge of the nacelle. The resulting forces were projected from the nacelle Lagrangian grid into the flow Eulerian background grid using a smoothed cosine discrete delta function and considered in the equations of motion (Equation (1)).

2.3. Turbine Control System

The angular velocity of the turbine rotor, ω , is computed from the balance of angular momentum equation given by
I d ω d t = τ a + τ g ,
where I is the rotational inertia, and τ a and τ g are the aerodynamic and the generator torque, respectively. At wind speeds below those rated by the manufacturer (region 2), the turbine controller maximizes the power production by regulating the angular velocity of the rotor by setting the generator torque at [57]
τ g = π ρ R 5 C p , m a x 2 λ o p t 3 G 3 ω g 2 ,
where C P , m a x is the maximum power coefficient at the optimal tip speed ratio λ o p t , R is the rotor radius, G is the gearbox ratio, and ω g is the generator angular velocity.
For wind speeds higher than the rated one (region 2.5–3), the controller objective is to maintain the angular velocity at its rated value. This control procedure is performed to avoid any structural damage that the aerodynamic and inertial forces could cause to the rotor. Therefore, a single-input single-output (SISO) proportional-integral controller increases the generator torque until it reaches its rated value and collectively pitches the turbine blade to reduce the angle of attack, consequently reducing the aerodynamic torque. Details of the controller can be found in Santoni et al. [58].

3. Computational Details

In this work, the turbine considered is the Clipper Liberty turbine. The Clipper Liberty is a utility-scale wind turbine with a nameplate capacity of P N = 2.5 MW at a rated wind speed of 12.5 m/s. The turbine rotor has a diameter of 96 m and a hub height of 80 m. The control parameters of the wind turbine can be found in Table 1.
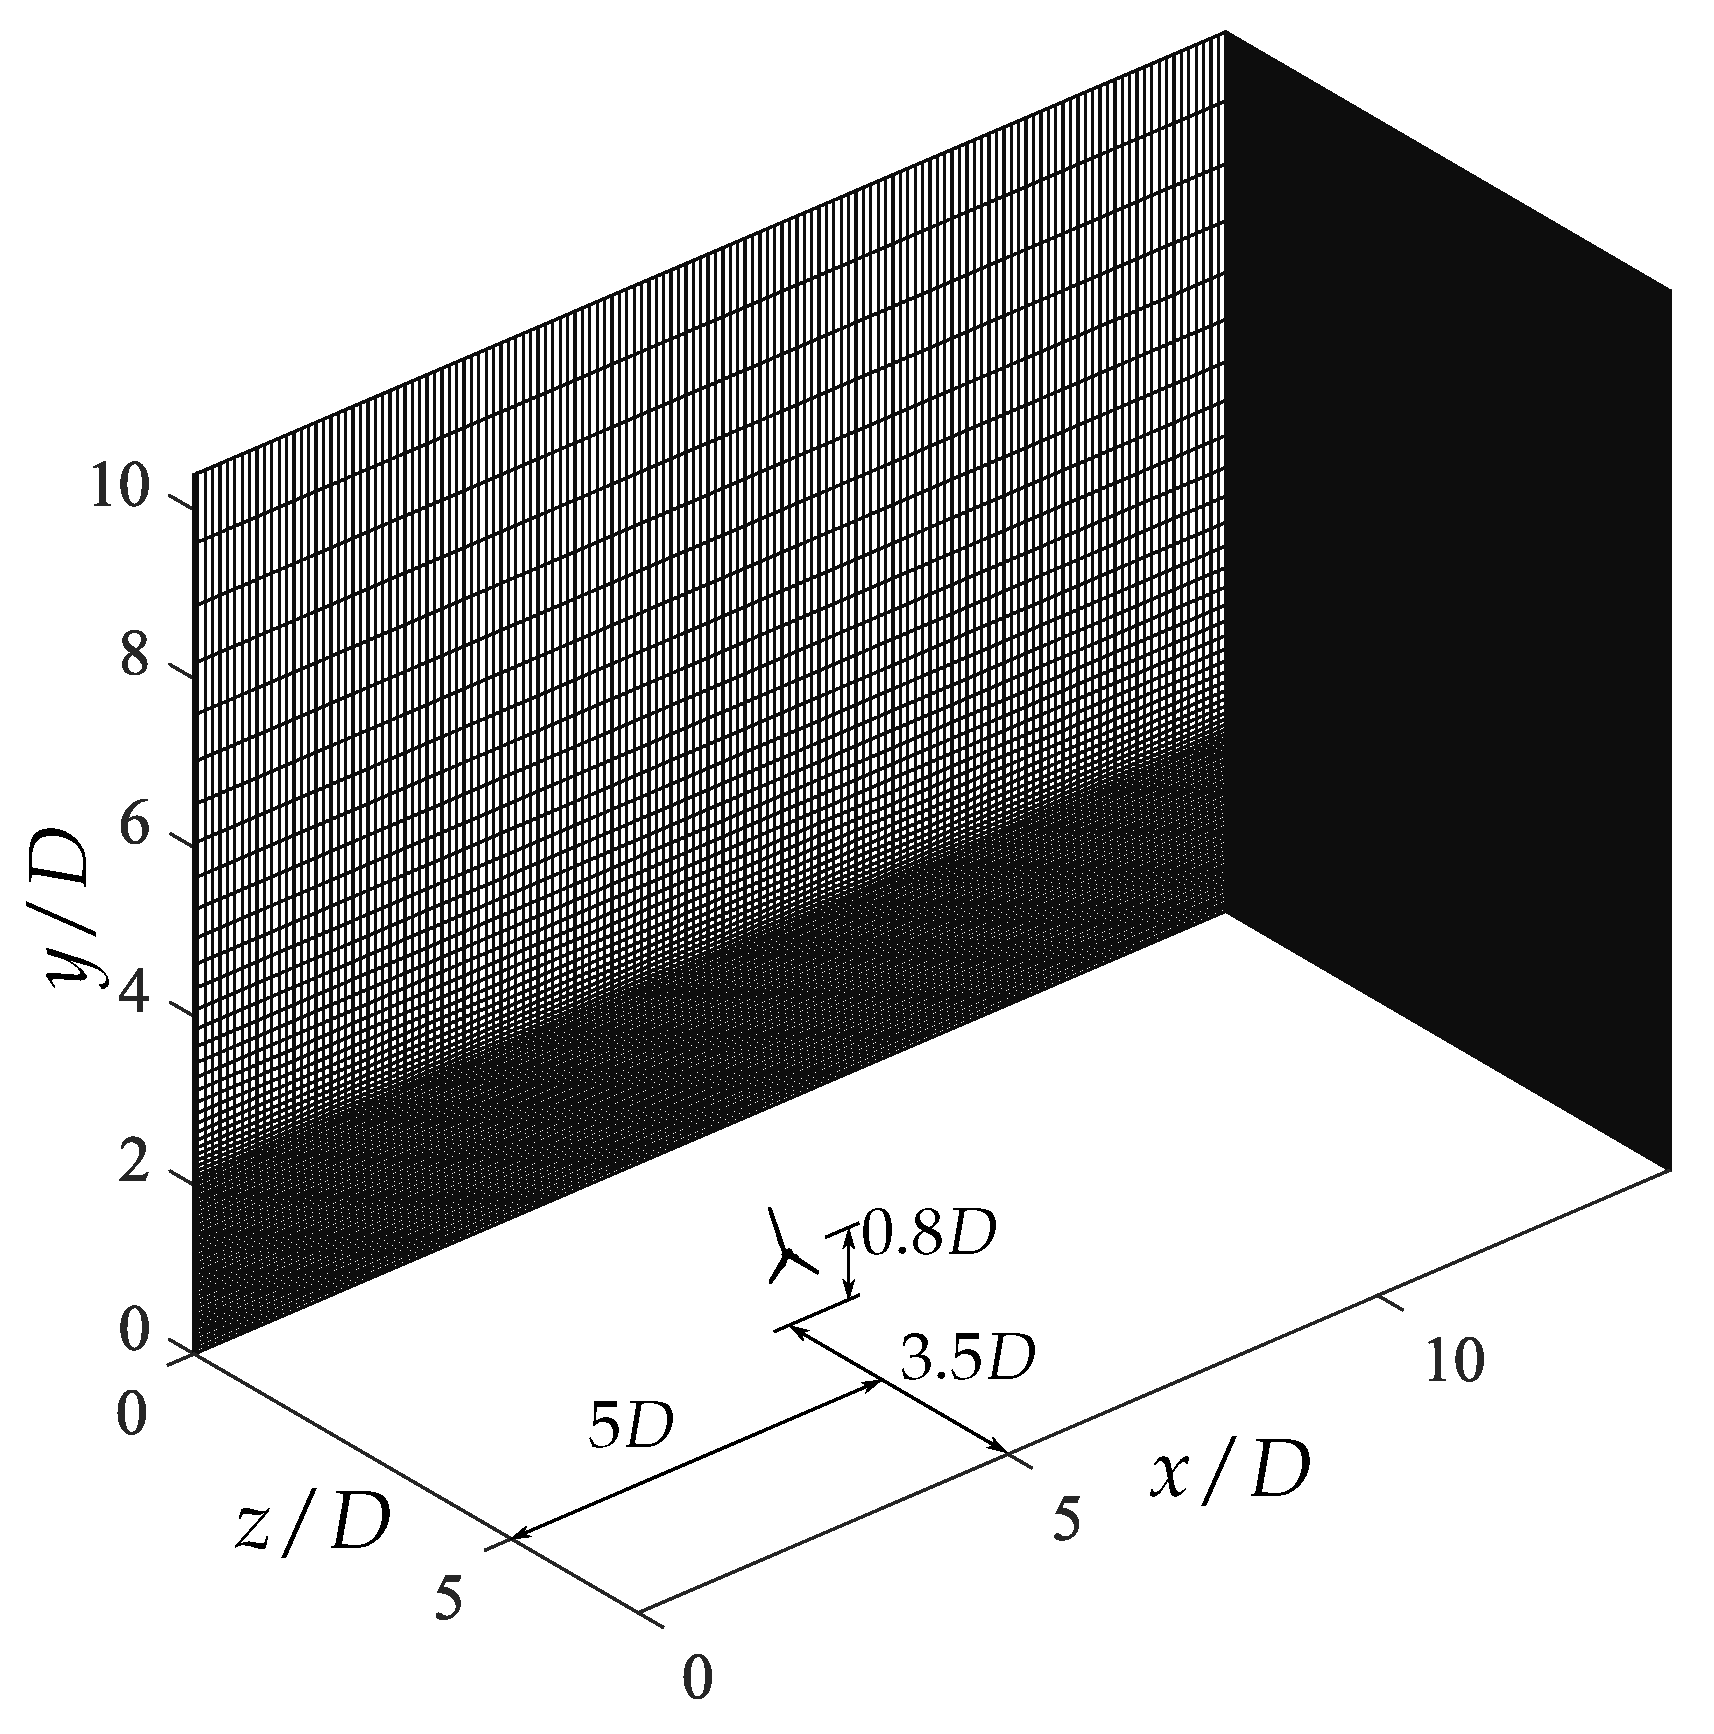
In this study, the turbine was placed on flat terrain with a dimension of 14 D × 7 D × 10.4 D along the streamwise, spanwise, and vertical directions, respectively (Figure 2), and was located at x / D = 5 from the inlet and centered in the spanwise direction. The number of computational grid points is 281 × 143 × 281 in the streamwise, spanwise, and vertical directions, respectively, which correspond to a resolution of Δ x / D = 0.050 in the streamwise direction and Δ z / D = 0.025 in the spanwise direction. In the vertical direction, the grid has a uniform resolution of Δ y / D = 0.025 up to a height of y / D = 2.1 , above which the grid is stretched to the top of the domain. Thus, the resolution along the streamwise direction is twice that of the resolution at the rotor plane. While employing a uniform grid along the three directions at the rotor plane is a common practice, prior studies have demonstrated that it is not necessary to achieve accurate results in turbine parameterizations using actuator-like models [19,26,36,49,59,60,61].
The numerical simulations Reynolds number ( R e = U D / ν ) is 5 × 10 8 . Periodic boundary conditions are imposed along the spanwise direction, with free slip at the top boundary. At the bottom boundary, the logarithmic law of the wall is applied, given by
U = U * κ ln z z 0 ,
where U * is the friction velocity, κ is the von Karman constant, and z 0 is the roughness length (=0.1 m).
A precursor simulation with periodic boundary conditions was performed to obtain a fully developed neutral atmospheric boundary layer. The transient developing boundary layer of the precursor simulation was discarded until the total kinetic energy reached a quasi-steady state. Subsequently, once statistically converged, the instantaneous velocity fields of the precursor simulation were recorded on a cross-sectional plane. This velocity field was then fed at the inlet of the domain of the wind turbine simulations.
For the sake of simplicity, in the rest of the paper, the turbine parameterization with the actuator surface model for the blade and nacelle is referred to as AS-BN (Figure 1c), while the actuator line model for the blade and actuator surface for the nacelle is referred to as ALB-ASN (Figure 1d). In addition, comments made specifically on the actuator line model and actuator surface model will refer to ALM and ASM, respectively. A comparison between the ALB-ASN and AS-BN models was performed for a hub height wind speed of U h u b = 7.0 and 14.0 m/s. This corresponds to the turbine operating in region 2 ( U h u b = 7.0 ) and region 3 ( U h u b = 14.0 ). The total amount of Lagrangian grid points for the ALM was 81 per blade, 790 unstructured grid cells per blade for the ASM, and 736 unstructured grid cells for the nacelle. The time step of the simulations was Δ t = 2 × 10 4 H / U , where H is the height of the domain and U is the velocity far away from the turbine near the top boundary. The numerical simulations were run at the University of Minnesota’s Minnesota Supercomputing Institute Mesabi on 96 cores using Intel Xeon E5-2680v3 processors. For the high-resolution simulations ( D / Δ g r i d = 40 ), the AS-BN model had a total computational time of 56 , 000 CPU hours, whereas the ALB-ASN model had 69,000 CPU hours.

4. Grid Sensitivity Analysis

A grid sensitivity analysis was performed to study the performance of the AS-BN model on three consecutively refined grid resolutions. The hub height wind speed was U h u b = 7.0 , corresponding to the turbine operating in region 2. The large-eddy simulations of the Clipper Liberty turbine were performed for three different resolutions at the turbine rotor. The number of grid points along the rotor diameter was D / Δ g r i d = 40 , 20, and 14.
Figure 3 shows the contours of the time-averaged windwise velocity at a plane located at the center of the turbine wake.
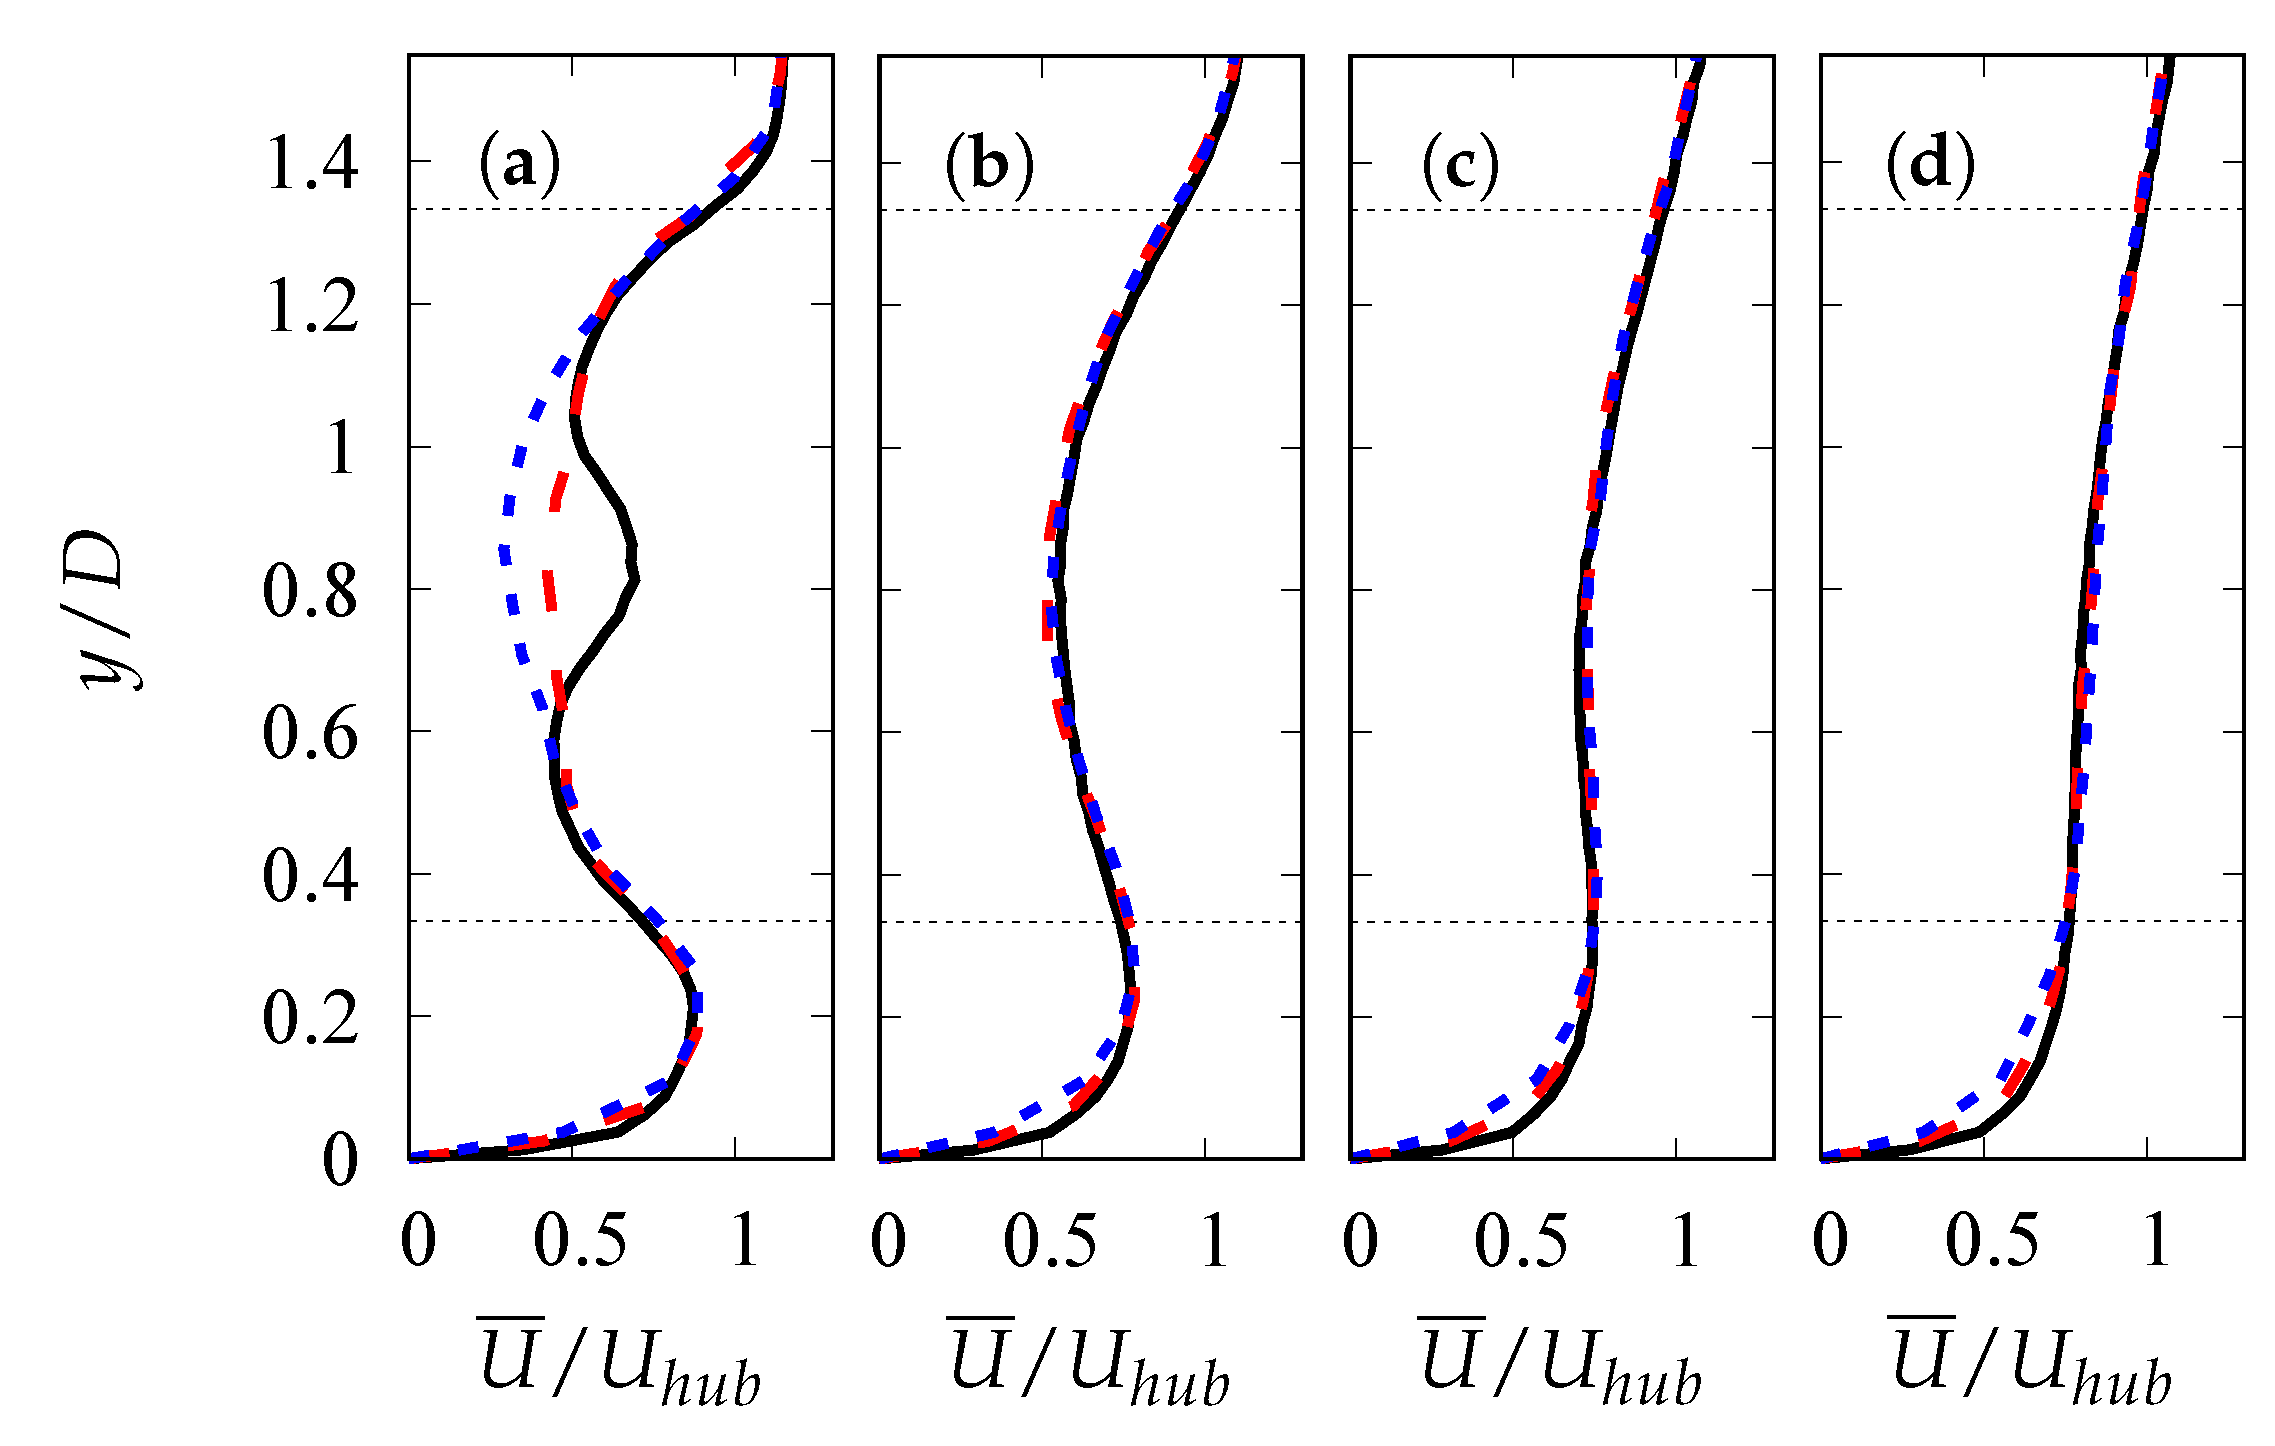
A qualitative comparison of the wake of the turbines between the three cases shows that the momentum deficit due to the nacelle increases with the decrease in grid resolution. The time-averaged velocity of the high-resolution case (Figure 3a) presents a higher wind speed near the surface of the nacelle. This is because the turbine rotor in this region, considered for structural purposes, is a cylinder that holds the rest of the blade to the hub and has a low thrust force compared to the outer regions of the blade. However, due to the grid resolution, the nacelle model slightly overestimates the normal and skin friction forces, showing a larger reduction in the wind speed directly behind the nacelle (Figure 3b,c). Nevertheless, the difference observed seems to be located in the near wake region at 0 < x / D < 3 . This is confirmed by the time-averaged velocity profiles shown in Figure 4, where the momentum deficit of the nacelle is only observed in the center of the wake at x / D = 1 in Figure 4a. Further downstream, x / D 3 , the velocity profiles collapse on top of each other (Figure 4b–d). This also suggests that although the nacelle model shows sensitivity to coarser grid resolutions, the blade ASM does not present similar sensitivity.
To examine the impact of the coarser grid resolution on the wake recovery, the time-averaged velocity over the rotor-swept area, U R , in the streamwise direction was computed as follows:
U R = 1 A rot A rot U ¯ 1 d A ,
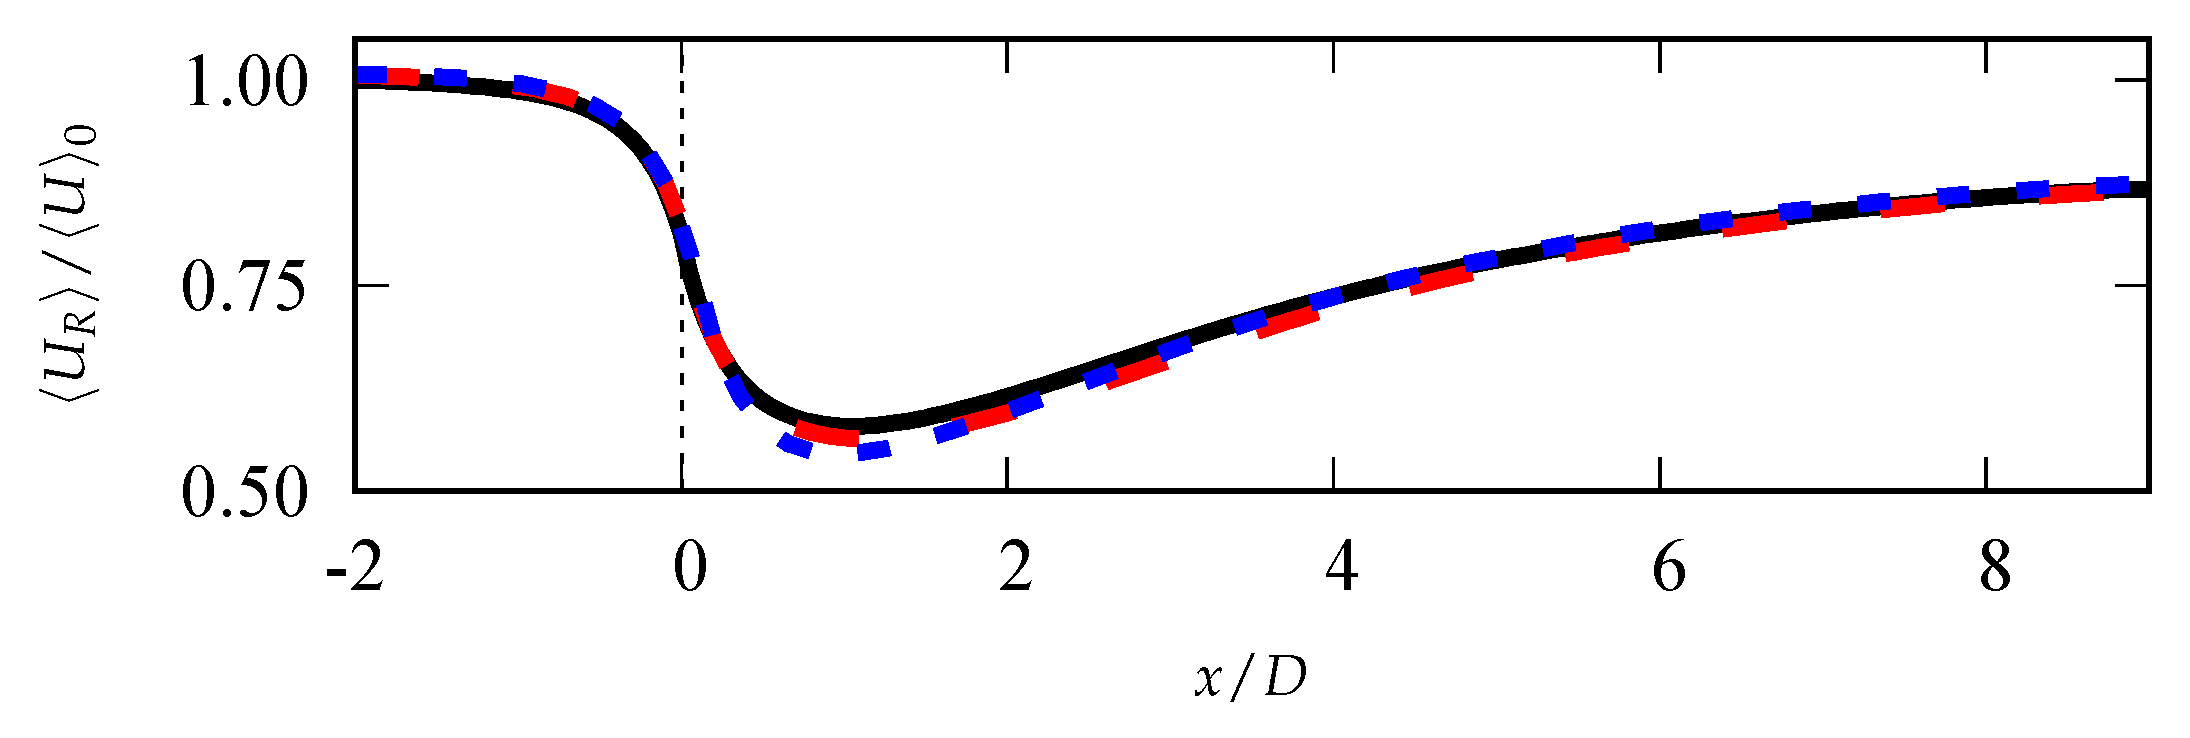
where U 1 ¯ is the time-averaged streamwise velocity, and A rot is the rotor area. A comparison of the time-averaged velocity over the rotor-swept area is shown in Figure 5. The difference between the three resolution cases is mostly observed in the near wake at x / D = 1 , which corresponds to the location of the highest momentum deficit observed in the velocity contours in the wake of the nacelle for D / Δ g r i d = 20 and 14 (Figure 3). Further downstream x / D 3 , the curves collapse on top of each other, indicating that the momentum deficit over the rotor area is the same for all cases.
Contours of the turbulence kinetic energy ( 1 / 2 U i U i ¯ / U h u b 2 ) for the three grid resolutions ( D / Δ g r i d = 40 , 20, and 14) are shown in Figure 6. As seen for the velocity contours (Figure 3), the most considerable difference in the turbulence kinetic energy (TKE) between the results of the three grid resolutions is observed in the wake of the nacelle. Due to the shear layer near the surface of the nacelle on the high-resolution case (Figure 3a), it can be seen that there is a relatively high TKE region extending from the nacelle into the wake of the turbine ( x / D 2 ). The lower-resolution grids ( D / Δ g r i d = 20 and 14) also present a high TKE region in the wake of the nacelle, where the lowest-resolution case shows this region to be the largest. However, this region is localized to the wake of the nacelle and coincides in location and size with the low-momentum region observed in the velocity contours.
Further, the TKE profiles downstream from the turbine rotor are shown in Figure 7. In addition to the difference observed in the near nacelle region at x / D = 1 in Figure 7, it is observed that the lower-resolution cases ( D / Δ g r i d = 20 , and 14) underestimate the TKE near the edge of the wake. This suggests that the tip vortex that detaches from the blade and propagates downstream before its breakdown is underresolved by the coarser grid cases. Nevertheless, further downstream x / D 3 , the difference in the TKE observed between the three cases decreases, showing more significant similarity than in the near wake region. However, it is observed that the coarser grid cases slightly overestimate the TKE compared to the highest-resolution case.
The power production of the three cases is slightly over 30 % of its nominal power. Moreover, the relative error observed was of 2.8 % for D / Δ g r i d = 14 and 0.7 % for D / Δ g r i d = 20 when compared to the D / Δ g r i d = 40 case. Therefore, the blade actuator surface model shows no significant sensitivity to the grid resolution down to 14 grid cells at the rotor, showing a similar momentum deficit, wake recovery, and power production. On the contrary, the nacelle actuator surface model did show sensitivity to the grid resolution, showing a larger momentum deficit and turbulence kinetic energy in the near wake.

5. Results and Discussion

A comparison of the performance of the AS-BN against the ALB-ASN model was performed using the high-resolution grid system D / Δ g r i d = 40 for a hub height wind speed of U h u b = 7 and 14 m/s. The velocity profiles of the streamwise velocity component in the turbine wake are shown in Figure 8. As seen in this figure, the profiles of both the AS-BN and ALB-ASN models are collapsed on top of each other, showing no difference in the momentum deficit between the models for both wind speeds U h u b = 7 m/s (Figure 8a–d) and U h u b = 14 m/s (Figure 8e–h). Moreover, blade pitching occurs on the turbine while operating in region 3 ( U h u b = 14 m/s). This also suggests that the blade pitching (when the turbine operates in region 3) of the blade actuator surface model Lagrangian grid does not significantly impact the computed loads over the blade.
To quantify the difference in the time-averaged velocity field, the relative difference ( δ ) was computed as
δ U = U ¯ A L U ¯ A S U ¯ A L + U ¯ A S 2 × 100 ,
where the subscripts A L and A S stand for the ALB-ASN and AS-BN, respectively. Contours of the relative difference of the time-averaged velocity field are shown in Figure 9. The largest relative difference is consistently observed in the regions surrounding the nacelle for both wind speeds (Figure 9a,b). This is caused by the larger Lagrangian grid region near the root of the blade of the actuator surface model (see Figure 1c), which decreases the momentum deficit as the body force is spread over a larger region when the turbine operates in region 2 (Figure 9a). On the contrary, when the blade pitch ( U h u b = 14 m/s), there is a slight increase in the momentum deficit (Figure 9b). This is caused by the rotation of the Lagrangian blade grid along the blade axis, showing the effect of spreading the loads from the Lagrangian blade grid to the background Eulerian flow grid. However, the absolute relative difference is | δ U |     2 % , and the mean absolute relative difference in the wake of the nacelle is 0.6 % .
The profiles of TKE downstream of the turbine rotor are shown in Figure 10. Similar to the velocity profiles, the TKE values from the ALB-ASN and AS-BN models closely follow each other. Hence, these profiles demonstrate the similarity between these two models in describing the momentum deficit and TKE. The main difference between the two models is in the projection of the velocity from the Eulerian grid into the Lagrangian grid cells, which, in the case of the actuator surface model, is a bi-dimensional unstructured grid, contrary to the one-dimensional grid of the actuator line model. Therefore, considering that the chord length is the largest at the root c / D = 0.04 , which is Δ g r i d / c 1.6 , it is noteworthy that the computed force using the actuator surface model aligns with that of the actuator line model.
Contours of the relative difference in the TKE ( δ T K E ), computed as given by Equation (16), are shown in Figure 11. Although the absolute relative value of the TKE ( | δ T K E |     10 % ) is larger than that of the time-averaged wind speed, it does not present a localized region of larger error near the nacelle. Moreover, the relative error does not present any discernible pattern, showing that it is aleatory. Nevertheless, the mean absolute relative difference in the TKE in the wake of the turbine is | δ T K E |   =   2.3 % .
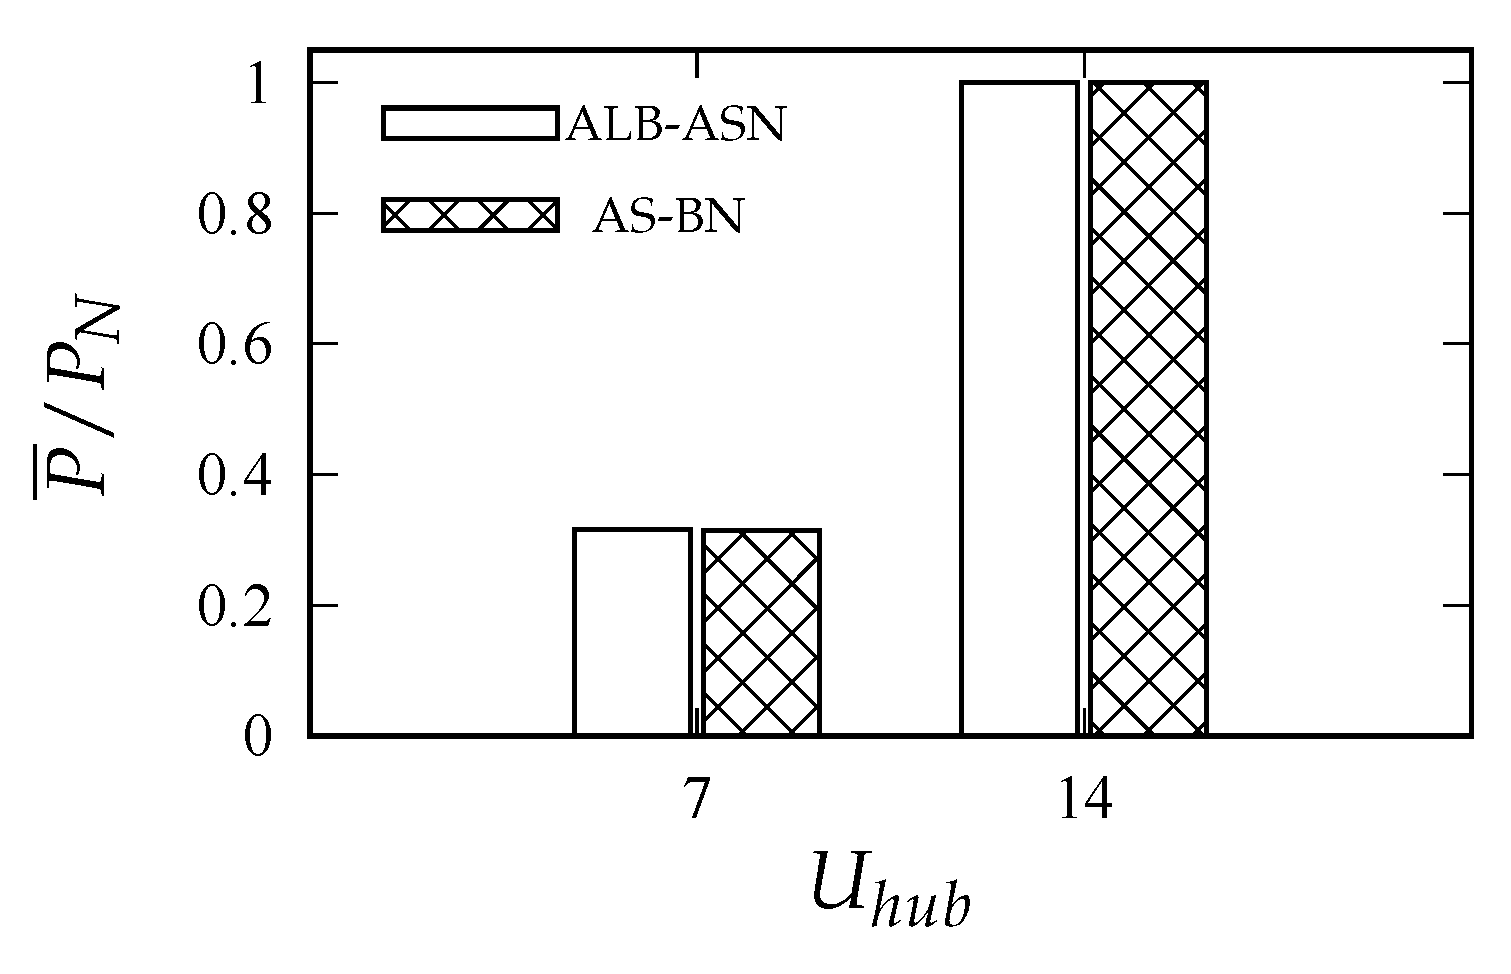
A comparison of the time-averaged power production is shown in Figure 12. Both the ALB-ASN and AS-BN model turbines have power production of approximately 31 % and 100 % of the nominal power production for U h u b = 7 and 14 m/s, respectively. Although the difference is not appreciable, the absolute relative difference between the turbine models is 0.3 % for U h u b = 7 m/s. However, in region 3 ( U h u b = 14 m/s), when the generator torque saturates to its rated value, the turbine controller pitches the blade to maintain a constant angular speed. Therefore, the absolute relative difference in the power production for the turbine with a hub height wind speed of U h u b = 14 m/s is 0.01 % .
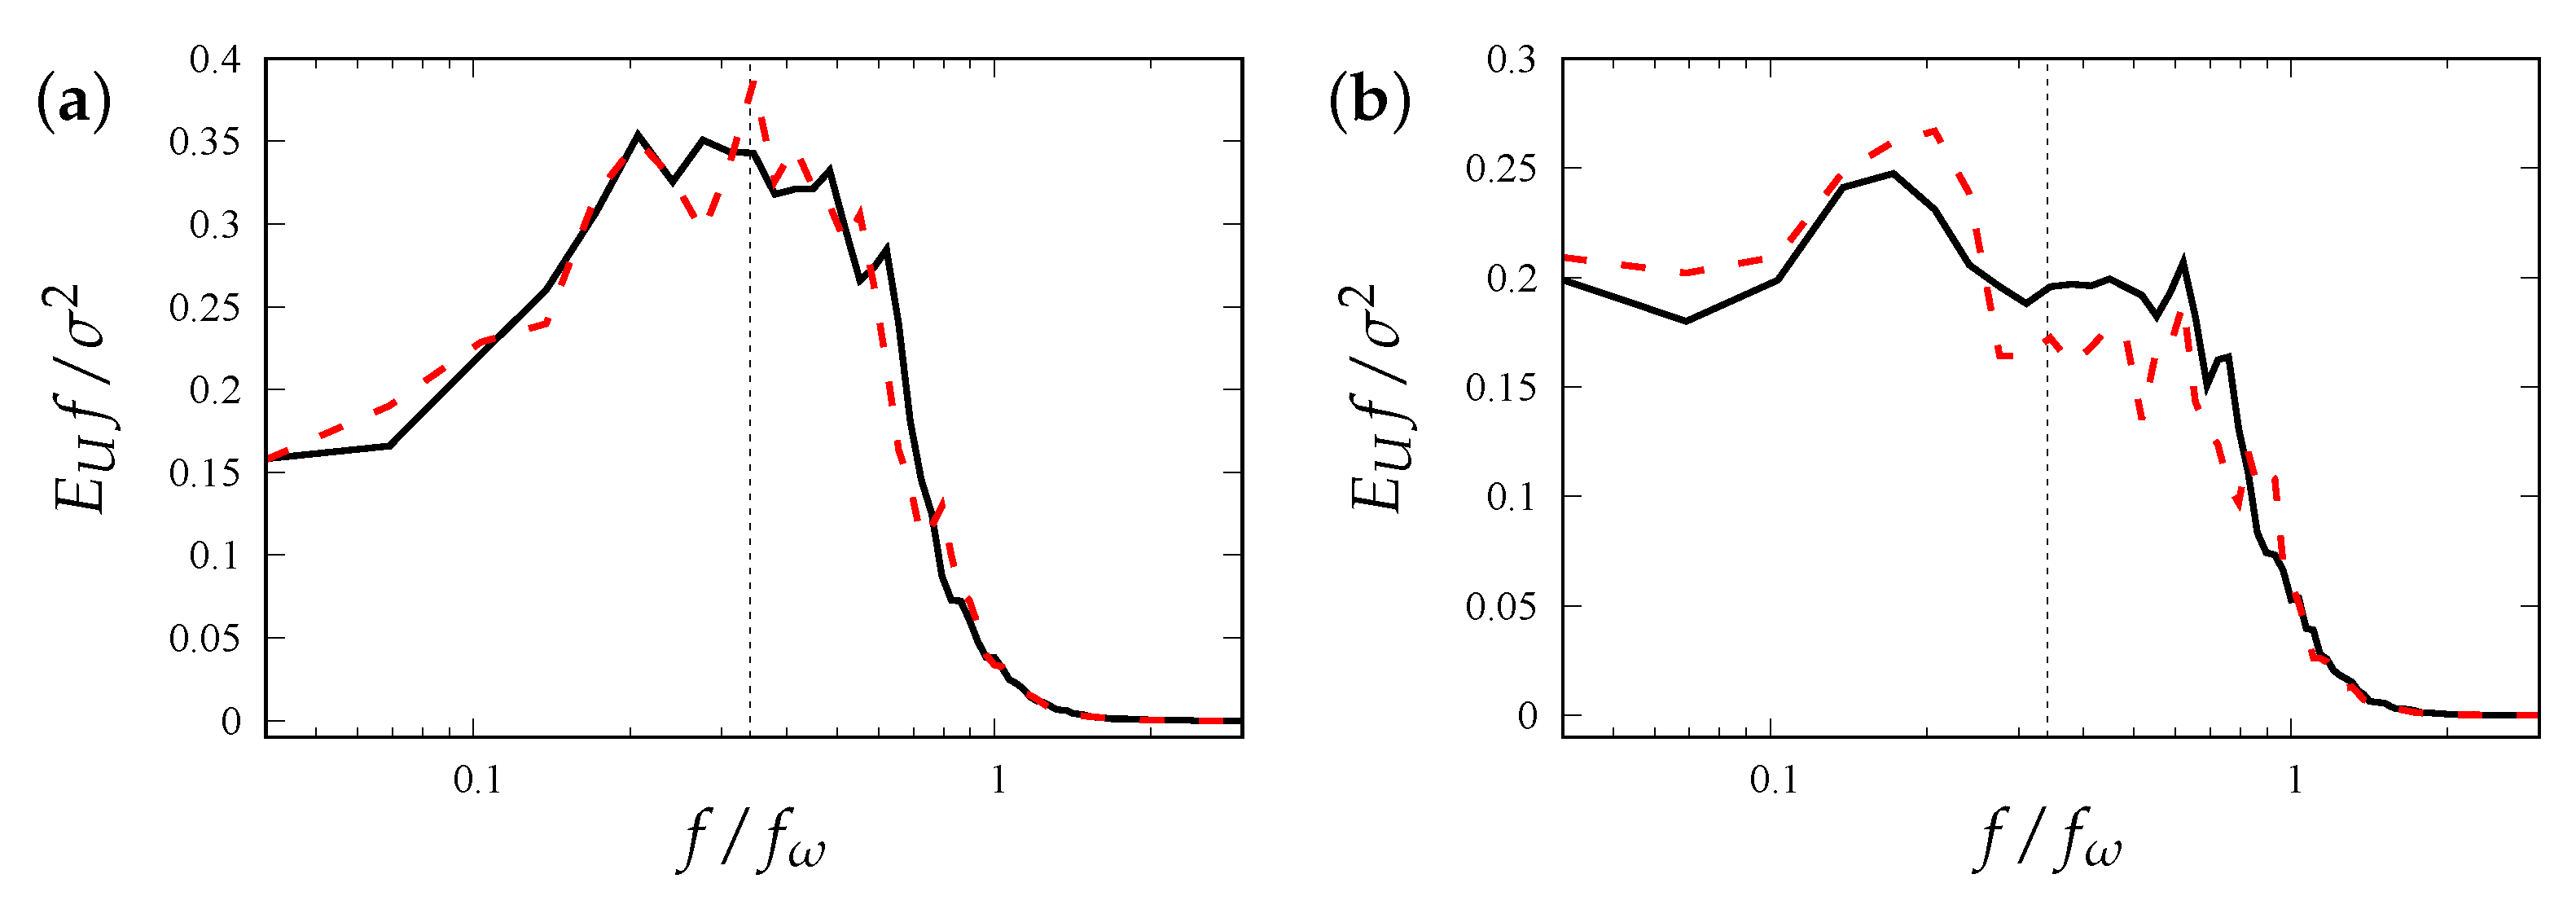
As has been extensively reported in [32,35,37,38,39,62,63], the wind turbine wake has two distinct regions, the near and the far wake. In the near wake, a coherent structure is observed to detach from the nacelle region, known as the hub vortex, owing to the interaction of the rotating wake of the blades and the nacelle. Further downstream, in the far wake, the hub vortex breaks down, and the tip vortex that detaches from the blade dissipates. To characterize the meandering of the near wake hub vortex and that of the far wake, wind speed spectra were computed as
E u ( f ) = R u ( s ) e i 2 π f s d s ,
where the autocovariance, R u , of the wind speed fluctuations, u , is given by
R u ( s ) = u ( t ) u ( t + s ) ¯ .
The premultiplied wind speed spectra of the ALB-ASN and AS-BN models in the near and far wake are shown in Figure 13. Due to the hub vortex that meanders in the wake of the nacelle, the near wake spectra show (Figure 13) a peak in energy at f / f ω 0.34 . Although the peak appears to be diffused within 0.2 < f / f ω < 0.4 , we note that, for the region 2 case, the angular velocity is regulated by the baseline turbine control, whose objective is to maintain the angular velocity of the rotor at the optimum tip speed ratio. Nevertheless, the peak in the energy spectra agrees with previous observations of the hub vortex meandering frequency, reported in [35,38,39]. Further downstream, at x / D = 9 , in the spectra of the ALB-ASN and AS-BN models, we observe an energy peak at a frequency of 0.10 < f / f ω < 0.15 . This frequency corresponds to a Strouhal number ( S t = f D / U h u b ) of S t 0.3 , which is in agreement with the observations of Foti et al. [39] in the far wake. Given that both the ALB-ASN and AS-BN models show agreement in the peaks in energy in the near wake, we argue that the driving factor of the near hub vortex is not due to the specifics of the blade model but rather the presence of the nacelle. Moreover, this confirms that the blade ASM yields a solution similar to the ALM for moderately coarse grid resolutions.

6. Conclusions

We carried out large-eddy simulations of the Clipper Liberty C96 turbine to compare the performance of the AS-BN and ALB-ASN models for wake flow and power production. The turbine was located in flat terrain with a neutrally stratified atmospheric boundary layer for two wind speeds, U h u b = 7 and 14 m/s. The turbine blades were modeled using the ASM and ALM, whereas the nacelle was modeled using the actuator surface model. The rotation of the turbine was given by the balance of angular momentum at the rotor, where the baseline controller was set at the generator torque. In addition, for the region 3 cases U h u b = 14 , the blades were pitched by the SISO proportional-integral controller to reduce the aerodynamic torque once the generator torque increased to its rated value. The objective of this investigation was to identify the optimal trade-off between numerical accuracy and computational cost.
A grid sensitivity analysis was performed for the AS-BN model (Figure 1c). The numerical simulations were carried out with grid resolutions of 40, 20, and 14 grid points at the turbine rotor ( D / Δ g r i d ). The results indicated that coarser grid resolutions led to an overprediction of the momentum deficit in the nacelle wake. This overestimation is attributed to the simplicity of the model, which applies normal and tangential forces in the first grid node from the nacelle surface, resulting in an exaggerated representation in the Eulerian grid due to the coarse resolution. This is also confirmed by the turbulence kinetic energy, where the coarser grid resolutions showed a larger region constraint to the leeward side of the nacelle. Nevertheless, time-averaged velocity and turbulence kinetic energy in the far wake x / D > 3 showed agreement with the high-resolution grid system D / Δ g r i d = 40 . The relative error of the power production between the high-resolution case and the other two lower-resolution grid systems was 2.8 % and 0.7 % , respectively. These results suggest that the performance of the AS-BN model is not significantly affected by the grid resolution ( x / D > 3 ). However, the substantial impact of the nacelle on the near wake dynamics and its influence in the far wake, as evidenced by both numerical simulations [21,35,36,37,39] and experimental measurements [32,33,38,62,64,65,66], emphasizes the indispensability of its accurate modeling. Consequently, additional investigations into refining the nacelle model become imperative to mitigate potential overestimations of the momentum deficit in the near wake induced by the ASM when applied to numerical simulations using a coarse grid.
A comparative analysis between the ASM and ALM for blade representation was conducted for wind speeds of U h u b = 7 and 14 m/s at a grid resolution of D / Δ g r i d = 40 . In both scenarios, the nacelle was characterized using the ASM. The numerical results of the time-averaged velocity and turbulence kinetic energy within the wind turbine wake demonstrated strong agreement between the ALB-ASN and AS-BN models. Notably, both models captured the meandering of the hub vortex from the nacelle, revealing an energy peak in the wind speed spectra at a frequency of f / f ω 0.34 . This frequency concurs with numerical and experimental results in the literature [35,38,39]. Both models accurately depicted the wake meandering observed in the turbine far wake, exhibiting a wind speed spectra peak at S t = 0.3 . Hence, our study confirms that both the AS-BN and ALB-ASN models effectively capture the turbine wake dynamics.
Despite these similarities, it is crucial to acknowledge the computational cost difference. The computational cost of the AS-BN model was approximately 23 % higher than that of the ALB-ASN model simulations. This underscores the potential for conducting high-fidelity simulations at a significantly reduced computational expense using the blade actuator line and nacelle actuator surface models.

Author Contributions

Conceptualization, F.S.; Methodology, C.S., F.S. and A.K.; Software, C.S., F.S. and A.K.; Validation, C.S. and A.K.; Formal analysis, C.S. and A.K.; Investigation, C.S. and A.K.; Resources, F.S. and A.K.; Writing—original draft, C.S.; Writing—review & editing, C.S., F.S. and A.K.; Visualization, C.S.; Supervision, A.K.; Project administration, A.K. All authors have read and agreed to the published version of the manuscript.

Funding

This research was supported by the National Offshore Wind Research and Development Consortium (NOWRDC) under agreement number 147503. In addition, this work was partially supported by the U.S. Department of Energy’s Office of Energy Efficiency and Renewable Energy (EERE) under the Water Power Technologies Office (WPTO), Award Number DE-EE0009450. The views expressed herein do not necessarily represent the views of the U.S. Department of Energy or the United States Government.

Data Availability Statement

Data are contained within the article.

Conflicts of Interest

The authors declare no conflicts of interest.

References

  1. Newman, B. The spacing of wind turbines in large arrays. Energy Convers. 1977, 16, 169–171. [Google Scholar] [CrossRef]
  2. Lissaman, P. Energy Effectiveness of Arbitrary Arrays of Wind Turbines. J. Energy 1979, 3, 323–328. [Google Scholar] [CrossRef]
  3. Jensen, N. A Note on Wind Generator Interaction; Risø National Laboratory: Roskilde, Denmark, 1983. [Google Scholar]
  4. Katić, I.; Højstrup, J.; Jensen, N. A simple model for cluster efficiency. In Proceedings of the EWEC’86, Rome, Italy, 7–9 October 1986; Volume 1, pp. 407–410. [Google Scholar]
  5. Frandsen, S. On the wind speed reduction in the center of large clusters of wind turbines. J. Wind. Eng. Ind. Aerodyn. 1992, 39, 251–265. [Google Scholar] [CrossRef]
  6. Santoni, C.; Ciri, U.; Rotea, M.; Leonardi, S. Development of a high fidelity CFD code for wind farm control. In Proceedings of the American Control Conference, Chicago, IL, USA, 1–3 July 2015; Volume 2015. [Google Scholar] [CrossRef]
  7. Bastankhah, M.; Porté-Agel, F. A new analytical model for wind-turbine wakes. Renew. Energy 2014, 70, 116–123. [Google Scholar] [CrossRef]
  8. Bastankhah, M.; Porté-Agel, F. Experimental and theoretical study of wind turbine wakes in yawed conditions. J. Fluid Mech. 2016, 806, 506–541. [Google Scholar] [CrossRef]
  9. Niayifar, A.; Porté-Agel, F. A new analytical model for wind farm power prediction. J. Physics Conf. Ser. 2015, 625, 012039. [Google Scholar] [CrossRef]
  10. Blondel, F.; Cathelain, M. An alternative form of the super-Gaussian wind turbine wake model. Wind. Energy Sci. 2020, 5, 1225–1236. [Google Scholar] [CrossRef]
  11. King, J.; Fleming, P.; King, R.; Martínez-Tossas, L.; Bay, C.; Mudafort, R.; Simley, E. Control-oriented model for secondary effects of wake steering. Wind. Energy Sci. 2021, 6, 701–714. [Google Scholar] [CrossRef]
  12. Sood, I.; Meyers, J. Tuning of an engineering wind farm model using measurements from Large Eddy Simulations. J. Physics Conf. Ser. 2022, 2265, 022045. [Google Scholar] [CrossRef]
  13. Bay, C.; Fleming, P.; Doekemeijer, B.; King, J.; Churchfield, M.; Mudafort, R. Addressing deep array effects and impacts to wake steering with the cumulative-curl wake model. Wind. Energy Sci. 2023, 8, 401–419. [Google Scholar] [CrossRef]
  14. Sørensen, J.; Kock, C. A model for unsteady rotor aerodynamics. J. Wind. Eng. Ind. Aerodyn. 1995, 58, 259–275. [Google Scholar] [CrossRef]
  15. Masson, C.; Ammara, I.; Paraschivoiu, I. An Aerodynamic Method for the Analysis of Isolated Horizontal-Axis Wind Turbines. Int. J. Rotating Mach. 1997, 3, 21–32. [Google Scholar] [CrossRef]
  16. Sørensen, J.; Shen, W.; Munduate, X. Analysis of wake states by a full-field actuator disc model. Wind Energy 1998, 1, 73–88. [Google Scholar] [CrossRef]
  17. Sørensen, J.N.; Shen, W.Z. Numerical Modeling of Wind Turbine Wakes. J. Fluids Eng. 2002, 124, 393–399. [Google Scholar] [CrossRef]
  18. Jimenez, A.; Crespo, A.; Migoya, E.; Garcia, J. Large-eddy simulation of spectral coherence in a wind turbine wake. Environ. Res. Lett. 2008, 3, 015004. [Google Scholar] [CrossRef]
  19. Wu, Y.; Porté-Agel, F. Large-Eddy Simulation of Wind-Turbine Wakes: Evaluation of Turbine Parametrisations. Bound.-Layer Meteorol. 2011, 138, 345–366. [Google Scholar] [CrossRef]
  20. Ciri, U.; Rotea, M.; Santoni, C.; Leonardi, S. Large-eddy simulations with extremum-seeking control for individual wind turbine power optimization. Wind Energy 2017, 20, 1617–1634. [Google Scholar] [CrossRef]
  21. Yang, X.; Sotiropoulos, F. A new class of actuator surface models for wind turbines. Wind Energy 2018, 21, 285–302. [Google Scholar] [CrossRef]
  22. Shapiro, C.; Gayme, D.; Meneveau, C. Filtered actuator disks: Theory and application to wind turbine models in large eddy simulation. Wind Energy 2019, 22, 1414–1420. [Google Scholar] [CrossRef]
  23. Bontempo, R.; Manna, M. A ring-vortex actuator disk method for wind turbines including hub effects. Energy Convers. Manag. 2019, 195, 672–681. [Google Scholar] [CrossRef]
  24. Sørensen, J.; Myken, A. Unsteady actuator disc model for horizontal axis wind turbines. J. Wind Eng. Ind. Aerodyn. 1992, 39, 139–149. [Google Scholar] [CrossRef]
  25. Glauert, H. The Elements of Aerofoil and Airscrew Theory; Cambridge University Press: Cambridge, UK, 1983; Volume 69, p. 100. [Google Scholar] [CrossRef]
  26. Jimenez, A.; Crespo, A.; Migoya, E.; Garcia, J. Advances in large-eddy simulation of a wind turbine wake. J. Physics Conf. Ser. 2007, 75, 012041. [Google Scholar] [CrossRef]
  27. Meyers, J.; Meneveau, C. Large Eddy Simulations of Large Wind-Turbine Arrays in the Atmospheric Boundary Layer. In Proceedings of the 48th AIAA Aerospace Sciences Meeting Including the New Horizons Forum and Aerospace Exposition, Orlando, FL, UDA, 4–7 January 2010; American Institute of Aeronautics and Astronautics: Reston, VI, USA, 2010. [Google Scholar] [CrossRef]
  28. Sorensen, N.; Michelsen, J. Aerodynamic predictions for the Unsteady Aerodynamics Experiment Phase-II rotor at the National Renewable Energy Laboratory. In Proceedings of the 2000 ASME Wind Energy Symposium, Reston, VI, USA, 10–13 January 2000; American Institute of Aeronautics and Astronautics: Reston, VI, USA, 2000. [Google Scholar] [CrossRef]
  29. Martínez-Tossas, L.; Churchfield, M.; Leonardi, S. Large eddy simulations of the flow past wind turbines: Actuator line and disk modeling. Wind Energy 2015, 18, 1047–1060. [Google Scholar] [CrossRef]
  30. Martínez-Tossas, L.; Churchfield, M.; Meneveau, C. Optimal smoothing length scale for actuator line models of wind turbine blades based on Gaussian body force distribution. Wind Energy 2017, 20, 1083–1096. [Google Scholar] [CrossRef]
  31. Martínez-Tossas, L.; Meneveau, C. Filtered lifting line theory and application to the actuator line model. J. Fluid Mech. 2019, 863, 269–292. [Google Scholar] [CrossRef]
  32. Zhang, W.; Markfort, C.; Porté-Agel, F. Near-wake flow structure downwind of a wind turbine in a turbulent boundary layer. Exp. Fluids 2012, 52, 1219–1235. [Google Scholar] [CrossRef]
  33. Schito, P. Large Eddy Simulation of Wind Turbines: Interaction with Turbulent Flow. Ph.D. Thesis, Politecnico di Milano, Milan, Italy, 2011. [Google Scholar]
  34. Felli, M.; Camussi, R.; Di Felice, F. Mechanisms of evolution of the propkller wake in the transition and far fields. J. Fluid Mech. 2011, 682, 5–53. [Google Scholar] [CrossRef]
  35. Kang, S.; Yang, X.; Sotiropoulos, F. On the onset of wake meandering for an axial flow turbine in a turbulent open channel flow. J. Fluid Mech. 2014, 744, 376–403. [Google Scholar] [CrossRef]
  36. Santoni, C.; Carrasquillo, K.; Arenas-Navarro, I.; Leonardi, S. Effect of tower and nacelle on the flow past a wind turbine. Wind Energy 2017, 20, 1927–1939. [Google Scholar] [CrossRef]
  37. Foti, D.; Yang, X.; Sotiropoulos, F. Similarity of wake meandering for different wind turbine designs for different scales. J. Fluid Mech. 2018, 842, 5–25. [Google Scholar] [CrossRef]
  38. Iungo, G.; Viola, F.; Camarri, S.; Porté-Agel, F.; Gallaire, F. Linear stability analysis of wind turbine wakes performed on wind tunnel measurements. J. Fluid Mech. 2013, 737, 499–526. [Google Scholar] [CrossRef]
  39. Foti, D.; Yang, X.; Guala, M.; Sotiropoulos, F. Wake meandering statistics of a model wind turbine: Insights gained by large eddy simulations. Phys. Rev. Fluids 2016, 1, 044407. [Google Scholar] [CrossRef]
  40. Churchfield, M.; Lee, S.; Michalakes, J.; Moriarty, P. A numerical study of the effects of atmospheric and wake turbulence on wind turbine dynamics. J. Turbul. 2012, 13, N14. [Google Scholar] [CrossRef]
  41. Meng, H.; Lien, F.S.; Li, L. Elastic actuator line modelling for wake-induced fatigue analysis of horizontal axis wind turbine blade. Renew. Energy 2018, 116, 423–437. [Google Scholar] [CrossRef]
  42. Yu, Z.; Hu, Z.; Zheng, X.; Ma, Q.; Hao, H. Aeroelastic Performance Analysis of Wind Turbine in the Wake with a New Elastic Actuator Line Model. Water 2020, 12, 1233. [Google Scholar] [CrossRef]
  43. Spyropoulos, N.; Prospathopoulos, J.; Manolas, D.; Papadakis, G.; Riziotis, V. Development of a fluid structure interaction tool based on an actuator line model. J. Physics Conf. Ser. 2020, 1618, 052072. [Google Scholar] [CrossRef]
  44. Della Posta, G.; Ciri, U.; Leonardi, S.; Bernardini, M. A Novel Two-Way Coupling Method for the Study of the Aeroelasticity of Wind Turbines in A Large Eddy Simulation Framework. In Proceedings of the European Conference on Turbomachinery Fluid Dynamics and Thermodynamics, Virtual, 12–16 April 2021. [Google Scholar] [CrossRef]
  45. Della Posta, G.; Leonardi, S.; Bernardini, M. A two-way coupling method for the study of aeroelastic effects in large wind turbines. Renew. Energy 2022, 190, 971–992. [Google Scholar] [CrossRef]
  46. Hodgson, E.; Grinderslev, C.; Meyer Forsting, A.; Troldborg, N.; Sørensen, N.; Sørensen, J.; Andersen, S. Validation of Aeroelastic Actuator Line for Wind Turbine Modelling in Complex Flows. Front. Energy Res. 2022, 10, 864645. [Google Scholar] [CrossRef]
  47. Santoni, C.; Khosronejad, A.; Yang, X.; Seiler, P.; Sotiropoulos, F. Coupling turbulent flow with blade aeroelastics and control modules in large-eddy simulation of utility-scale wind turbines. Phys. Fluids 2023, 35, 015140. [Google Scholar] [CrossRef]
  48. Draper, M.; Usera, G. Evaluation of the Actuator Line Model with coarse resolutions. J. Physics Conf. Ser. 2015, 625, 012021. [Google Scholar] [CrossRef]
  49. Draper, M.; Guggeri, A.; Usera, G. Validation of the Actuator Line Model with coarse resolution in atmospheric sheared and turbulent inflow. J. Physics Conf. Ser. 2016, 753, 082007. [Google Scholar] [CrossRef]
  50. Germano, M.; Piomelli, U.; Moin, P.; Cabot, W.H. A dynamic subgrid-scale eddy viscosity model. Phys. Fluids Fluid Dyn. 1991, 3, 1760–1765. [Google Scholar] [CrossRef]
  51. Kim, J.; Moin, P. Application of a fractional-step method to incompressible Navier-Stokes equations. J. Comput. Phys. 1985, 59, 308–323. [Google Scholar] [CrossRef]
  52. Froude, W. On the Elementary Relation between Pitch, Slip and Propulsive Efficiency; Institution of Naval Architects: London, UK, 1878. [Google Scholar]
  53. Yang, X.; Zhang, X.; Li, Z.; He, G.W. A smoothing technique for discrete delta functions with application to immersed boundary method in moving boundary simulations. J. Comput. Phys. 2009, 228, 7821–7836. [Google Scholar] [CrossRef]
  54. Du, Z.; Selig, M. A 3-D stall-delay model for horizontal axis wind turbine performance prediction. In Proceedings of the 1998 ASME Wind Energy Symposium, Reno, NV, USA, 12–15 January 1998. [Google Scholar] [CrossRef]
  55. Shen, W.Z.; Mikkelsen, R.; Sørensen, J.N.; Bak, C. Tip loss corrections for wind turbine computations. Wind Energy 2005, 8, 457–475. [Google Scholar] [CrossRef]
  56. Schultz-Grunow, F. Neues Reibungswiderstandsgesetz für glatte Platten. Luftfahrtforschung 1940, 17, 239–246. [Google Scholar]
  57. Burton, T.; Sharpe, D.; Jenkins, N.; Bossanyi, E. Wind Energy Handbook; Wiley: Hoboken, NJ, USA, 2011. [Google Scholar]
  58. Santoni, C.; Khosronejad, A.; Seiler, P.; Sotiropoulos, F. Toward control co-design of utility-scale wind turbines: Collective vs. individual blade pitch control. Energy Rep. 2023, 9, 793–806. [Google Scholar] [CrossRef]
  59. Shen, W.; Zhu, W.J.; Sørensen, J. Actuator line/Navier–Stokes computations for the MEXICO rotor: Comparison with detailed measurements. Wind Energy 2012, 15, 811–825. [Google Scholar] [CrossRef]
  60. Nilsson, K.; Shen, W.; Sørensen, J.; Breton, S.; Ivanell, S. Validation of the actuator line method using near wake measurements of the MEXICO rotor. Wind Energy 2015, 18, 499–514. [Google Scholar] [CrossRef]
  61. Zhang, Z.; Santoni, C.; Herges, T.; Sotiropoulos, F.; Khosronejad, A. Time-Averaged Wind Turbine Wake Flow Field Prediction Using Autoencoder Convolutional Neural Networks. Energies 2022, 15, 41. [Google Scholar] [CrossRef]
  62. Chamorro, L.; Porté-Agel, F. Effects of Thermal Stability and Incoming Boundary-Layer Flow Characteristics on Wind-Turbine Wakes: A Wind-Tunnel Study. Bound.-Layer Meteorol. 2010, 136, 515–533. [Google Scholar] [CrossRef]
  63. Viola, F.; Iungo, G.; Camarri, S.; Porté-Agel, F.; Gallaire, F. Prediction of the hub vortex instability in a wind turbine wake: Stability analysis with eddy-viscosity models calibrated on wind tunnel data. J. Fluid Mech. 2014, 750, R1. [Google Scholar] [CrossRef]
  64. Medici, D.; Alfredsson, P. Measurements on a wind turbine wake: 3D effects and bluff body vortex shedding. Wind Energy 2006, 9, 219–236. [Google Scholar] [CrossRef]
  65. Medici, D.; Alfredsson, P. Measurements behind model wind turbines: Further evidence of wake meandering. Wind Energy 2008, 11, 211–217. [Google Scholar] [CrossRef]
  66. Chamorro, L.; Porté-Agel, F. A wind-tunnel investigation of wind-turbine wakes: Boundary-Layer turbulence effects. Bound.-Layer Meteorol. 2009, 132, 129–149. [Google Scholar] [CrossRef]
Figure 1. Schematic of the (a) turbine rotor actuator disk model unstructured grid (⎯⎯) (ADM), (b) actuator line model blade grid (•) (ALM), (c) actuator surface model unstructured grid of the blades (⎯⎯) and nacelle (⎯⎯) (AS-BN), and (d) actuator line model grid of the blades (•) and unstructured grid of the actuator surface model of the nacelle (⎯⎯) (ALB-ASN).
Energies 17 00753 g001
Figure 2. Geometrical configuration of the computational domain. The Eulerian grid system (⎯⎯) is shown for every other computational cell.
Energies 17 00753 g002
Figure 3. Contours of the time-averaged streamwise velocity at an x-y plane (side view) centered at the turbine rotor of the AS-BN model: grid resolution (a) D / Δ g r i d = 40 , (b) D / Δ g r i d = 20 , and (c) D / Δ g r i d = 14 .
Energies 17 00753 g003
Figure 4. Vertical profiles of time-averaged velocity at (a) 1 D , (b) 3 D , (c) 5 D , and (d) 7 D downstream from the turbine rotor of the AS-BN model: (⎯⎯) D / Δ g r i d = 40 , (-----) D / Δ g r i d = 20 , and (-----) D / Δ g r i d = 14 . Horizontal dashed lines (-----) denotes the rotor region.
Energies 17 00753 g004
Figure 5. Rotor averaged velocity along the streamwise direction: (⎯⎯) D / Δ g r i d = 40 , (-----) D / Δ g r i d = 20 , and (-----) D / Δ g r i d = 14 . Vertical dashed line (-----) denotes the location of the turbine rotor.
Energies 17 00753 g005
Figure 6. Contours of the turbulence kinetic energy at an x-y plane (side view) centered at the turbine rotor: grid resolution (a) D / Δ g r i d = 40 , (b) D / Δ g r i d = 20 , and (c) D / Δ g r i d = 14 .
Energies 17 00753 g006
Figure 7. Vertical profiles of turbulence kinetic energy at (a) 1 D , (b) 3 D , (c) 5 D , and (d) 7 D downstream from the turbine rotor: (⎯⎯) D / Δ g r i d = 40 , (-----) D / Δ g r i d = 20 , and (-----) D / Δ g r i d = 14 . Horizontal dashed lines (-----) denotes the rotor region.
Energies 17 00753 g007
Figure 8. Vertical profiles of time-averaged velocity at (a,e) 1 D , (b,f) 3 D , (c,g) 5 D , and (d,h) 7 D downstream from the turbine rotor for a hub height wind speed of (ad) U h u b = 7 m/s and (eh) U h u b = 14 m/s: (⎯⎯) ALB-ASN model, and (-----) AS-BN model. Horizontal dashed lines (-----) denotes the rotor region.
Energies 17 00753 g008
Figure 9. Contours of the relative difference in the time-averaged velocity between the ALB-ASN and AS-BN models at an x-y plane (side view) centered at the turbine rotor for a hub height wind speed of (a) U h u b = 7 and (b) 14 m/s.
Energies 17 00753 g009
Figure 10. Vertical profiles of turbulence kinetic energy at (a,e) 1 D , (b,f) 3 D , (c,g) 5 D , and (d,h) 7 D downstream from the turbine rotor for a hub-height wind speed of (ad) U h u b = 7 m/s and (eh) U h u b = 14 m/s: (⎯⎯) ALB-ASN model and (-----) AS-BN model. Horizontal dashed lines (-----) denotes the rotor region.
Energies 17 00753 g010
Figure 11. Contours of the relative difference in the turbulence kinetic energy between the ALB-ASN and AS-BN models at an x-y plane (side view) centered at the turbine rotor for a hub height wind speed of (a) U h u b = 7 and (b) 14 m/s.
Energies 17 00753 g011
Figure 12. Time-averaged power production ( P ¯ ) as a function of the hub height wind speed.
Energies 17 00753 g012
Figure 13. Premultiplied spectra of the wind speed in the (a) near wake ( x / D = 2 , y / D = 0.8 , and z / D = 3.5 ) and (b) far wake ( x / D = 9 , y / D = 0.8 , and z / D = 3.5 ) of the (⎯⎯) ALB-ASN model and (-----) AS-BN model for U h u b = 7 m/s. Vertical dashed line (-----) denotes f / f ω = 0.34 .
Energies 17 00753 g013
Table 1. Turbine control parameters. C p , m a x is the maximum power coefficient in the optimal tip speed ratio λ o p t , R is the rotor radius, G is the gearbox ratio, K P , P and K I , P are the pitch control gain coefficients, and K P , T and K I , T are the torque control gain coefficients.
C p , m a x 0.49 K P , P 3.11 × 10 2 s
λ o p t 8.3 K I , P 3.87 × 10 3
R48 m K P , T 88.47 N m s
G 73.13 K I , T 11.05 N m
Disclaimer/Publisher’s Note: The statements, opinions and data contained in all publications are solely those of the individual author(s) and contributor(s) and not of MDPI and/or the editor(s). MDPI and/or the editor(s) disclaim responsibility for any injury to people or property resulting from any ideas, methods, instructions or products referred to in the content.