Article

On the Preferential Concentration of Particles in Turbulent Channel Flow: The Effect of the Added-Mass Factor

Dipartimento di Ingegneria Meccanica e Aerospaziale, Politecnico di Torino, Corso Duca degli Abruzzi 24, 10129 Torino, Italy
*
Author to whom correspondence should be addressed.
Energies 2024, 17(4), 783; https://doi.org/10.3390/en17040783
Submission received: 31 December 2023 / Revised: 31 January 2024 / Accepted: 1 February 2024 / Published: 6 February 2024
(This article belongs to the Special Issue Advances in Fluid Dynamics and Wind Power Systems)

Abstract

:
Preferential concentration, observed in turbulent flows when particle response times are of the same order of the flow’s characteristic timescales, manifests as non-uniform particle distributions in space. Unraveling its governing mechanisms holds crucial implications for both natural and industrial processes reliant on particle-laden flows. Focusing on particles with small inertia, this study employs Direct Numerical Simulations coupled with Lagrangian particle tracking to investigate the influence of the added-mass factor on the preferential concentration of particles denser than the fluid in the one-way coupling regime. It is shown how the added-mass factor β affects particle distribution within the channel through the statistical correlations between particle concentration and typical descriptors of the flow topology. The results suggest that increasing values of β (corresponding to lighter particles) significantly reduce the effectiveness of turbophoresis in producing particle accumulation in the near-wall region. Resulting in a gradual decorrelation between particle concentration and both the strain-rate and the vorticity tensors, higher values of β lead to a more uniform particle distribution, regardless of the Stokes number.

1. Introduction

Over the past two decades, particle-laden turbulent flows have garnered renewed attention, primarily driven by substantial advancements in measurement and simulation capabilities, as evidenced by the extensive research on the topic recently reviewed in [1]. Most of the work has predominantly focused on small, heavy particles, as they are more easily tractable than large and light particles in both experiments and numerical simulations [2]. Particles smaller than the smallest dynamically significant flow scale can indeed be treated as material points, and their evolution can be individually tracked by solving a set of ordinary differential equations for each particle while simultaneously carrying out a direct numerical simulation for the carrier flow on a Eulerian grid [3]. Since the pioneering study on the evolution of particles suspended in decaying isotropic turbulence by Riley and Patterson [4], this mixed Lagrangian–Eulerian approach, usually referred to as Point-Particle Direct Numerical Simulation (PP-DNS), has established itself as the preferred method for simulating flows laden with small particles.
In the majority of PP-DNS applications, the Maxey–Riley equation [5] is commonly adopted as the ordinary differential equation governing the dynamics of small, rigid spheres immersed in viscous flows. In this model, particle motion is determined by the forces exerted by the surrounding fluid, and due to their distinct nature, various force contributions can be distinguished [5]. Armenio and Fiorotto [6] numerically assessed the relative importance of force contributions in the Maxey–Riley equation for particle-to-fluid mass density ratios ρ p / ρ f ranging from 2.65 to 2650. They observed that for particles with mass density much greater than that of the fluid, often referred to as “heavy”, the two most significant forces acting on the particle are the gravitational and Stokes drag forces. The computation of these two forces is also considerably less demanding compared to the others—namely, the added-mass, pressure gradient, and Basset history forces—which require the evaluation of either the material derivatives of the flow field at the particle location or integrals over the particle history, simplifying the numerical simulation. When the Stokes drag is the most important fluid dynamic action on particles much denser than the fluid, the key parameter governing heavy particle dynamics is the Stokes response time, defined as τ p = 2 ρ p r p 2 / ( 9 ρ f ν ) , where r p is the particle radius and ν is the kinematic viscosity of the fluid. This quantity is the time it takes for a particle to relax its velocity to that of the surrounding fluid. Therefore, the motion of a particle is governed by the ratio between τ p and the timescale τ f of fluid velocity changes, the Stokes number St = τ p / τ f .
Despite its well-known limitations [1], the PP-DNS, rooted in a simplified Maxey–Riley equation for heavy particles, has proven essential in providing valuable insights into particle-related phenomena for a wide range of flow configurations, from homogeneous isotropic turbulence [7,8,9,10,11] to wall-bounded turbulence [12,13,14,15,16]. In these studies, the phenomenon of preferential concentration has been recognized as a typical particle response to turbulence: particles tend to distribute in a highly non-uniform manner, accumulating in regions of the flow characterized by specific topology. For instance, heavy particles have been found to avoid high-vorticity regions and to dwell in strain-dominated regions in both simulations [8,17,18,19] and experiments [20]. For small Stokes numbers, the main mechanism responsible for the tendency of particles to avoid vortical structures, as identified in [17], is the centrifuge mechanism, which drives particles away from the core of vortices towards high-strain regions. In wall-bounded flows, distinct manifestations of preferential concentration are particle drift towards the walls and their accumulation in low-speed streaks [13]. In these flows, strongly coherent flow structures, namely sweeps and ejections, play a crucial role in influencing particle motion and, consequently, their spatial distribution [15]. Instantaneous sweeps and ejections have indeed been identified as the primary mechanisms through which the carrier flow drives particles toward and away from the walls, respectively. Bragg and Collins [21] also observed that in inhomogeneous flows, the centrifuge mechanism is effective in driving particle migration towards the wall only for very small Stokes numbers, while a path-history effect, wherein the particle’s past interaction with turbulence becomes important, is the leading mechanism for a larger inertia. Numerical and experimental results on heavy particles suspended in both homogeneous isotropic turbulence [8,22] and channel flow turbulence [14,23,24] have consistently indicated that preferential concentration, along with other related phenomena such as inertial clustering, is most intense when particle time scales are on the same order as the Kolmogorov timescale.
In stark contrast to heavy particles, which are ejected from vortices and sample high-strain flow regions, both numerical and experimental observations [25,26] suggest that light particles ( ρ p / ρ f < 1 ) tend to accumulate in the core of vortices, so they are most likely to be found in regions characterized by low pressure and high vorticity. When the particle mass density is comparable to the fluid density, in addition to the Stokes drag and gravitational forces, the influence of the added-mass, pressure gradient, and Basset history forces becomes appreciable [6], with the pressure gradient force generally directed toward the core of the vortices. Due to its dependence on various particle characteristics, including size and mass density, and the presence of competing mechanisms affecting particle dispersion in turbulent flows, the understanding of preferential concentration is still incomplete.
Building upon this gap, this exploratory study investigates the behavior of particles that, while denser than the fluid, have a density comparable to that of the fluid. By incorporating the pressure gradient force alongside other key forces, while excluding the Basset force, our work aims to elucidate how these forces influence particle distribution in a wall-turbulent shear flow. Specifically, we analyze the impact of the pressure gradient force at low Stokes numbers, altering the established centrifugal effect on particle distribution. Through an exploratory approach, adopting a simplified Maxey–Riley equation as in Boffetta et al. [27], our study seeks to unravel some aspects of the nuanced interplay of these forces, shedding light on the intricate dynamics of particles with densities closer to that of the fluid in turbulent environments. This type of investigation is crucial for various industrial applications, especially in energy-related sectors, like the oil industry, which utilize pipes and channels to transport working fluids, often containing a dispersed phase. Particle preferential concentration is not only relevant for combustion chambers, where the distribution of fuel particles, influenced by their density, can impact combustion [28], but also in processes involving the conveyance of corrosive fluids. Corrosion poses a significant challenge to energy transition, affecting the equipment used in geothermal energy and biomass conversion processes, as well as hydrogen storage and transport. Corrosion inevitably leads to wear, seeding the flow with solid particles that, in the case of liquids, can have a density comparable to that of the carrier fluid. The structure of the paper is as follows: the physical model adopted is described in Section 2, along with the numerical methodology, results are presented in Section 3, and the final conclusions are drawn in Section 4.

2. Materials and Methods

In this section, we provide a brief description of the physical model and numerical methods used in particle-laden channel flow simulations, in particular, in regards to the adopted simplified version of the Maxey–Riley equation under the assumption of small Stokes numbers.

2.1. Physical Model

We investigate the isothermal turbulent flow in the plane channel, i.e., the flow between two infinite, flat, and parallel walls driven by a uniform mean pressure gradient, p / x . The x, y, and z axes correspond to the streamwise, wall-normal, and spanwise directions, respectively, as shown in Figure 1.
The channel is 2 h -high in the y coordinate, and its extension in both x and z can be reduced to a finite length by assuming statistical homogeneity of turbulence in these directions and imposing periodic boundary conditions. We have set the domain size equal to 2 π h in both the x and z direction, which is much larger than the minimum size required for a direct numerical simulation according to the analysis by Jiménez and Moin [29].
The evolution of the carrier flow is described by the incompressible Navier–Stokes equations. In tensorial notation ( x 1 = x , x 2 = y , x 3 = z ), by decomposing the pressure as p = ( p / x ) x + p , they are expressed as follows:
u j x j = 0 ,
u i t + ( u i u j ) x j = δ i , 1 p x i + 1 Re τ 2 u i x j 2 , i = 1 , 2 , 3 .
Here, u i t , x represents the component of the fluid’s velocity in the i-th direction, p t , x denotes the fluctuating pressure field, and δ i , 1 is the mean pressure gradient driving the flow in the x-direction. Equations (1) and (2) have been made dimensionless by rescaling variables with the channel half-height h, the fluid density ρ f , and the friction velocity
u τ = h ρ f p x .
The only non-dimensional parameter governing the channel flow is the friction Reynolds number, Re τ = u τ h / ν , where ν is the kinematic viscosity of the fluid. No-slip conditions are applied at the walls,
u i t , x , ± 1 , z = 0 ,
while periodic boundary conditions for the velocity field u i and the fluctuating pressure field p are imposed in both the x and z directions, i.e.,
u i t , 0 , y , z = u i t , 2 π , y , z , p t , 0 , y , z = p t , 2 π , y , z , u i t , x , y , 0 = u i t , x , y , 2 π , p t , x , y , 0 = p t , x , y , 2 π .
The flow is seeded with small and rigid spheres with mass density ρ p , which can be comparable to the density of the fluid, ρ f . The particle size is assumed to be smaller than the smallest scale of the flow, i.e., the viscous scale, so that the mixed Eulerian–Lagrangian description can be adopted [3]. Therefore, particles are seen as material points moving in a locally uniform environment, and their motion is thus described by the Maxey–Riley equations [5]. In their compact dimensional form, these equations can be written as
d x p ( t ) d t = v p ( t ) ,
m p d v p ( t ) d t = F p ( t ) ,
where m p , x p ( t ) , and v p ( t ) are, respectively, the mass, the position, and the velocity of the p-th particle, while F p ( t ) is the force acting on the particle, including the force exerted by the fluid phase. According to [5], this force can be expressed as
F p ( t ) = m p m f g + m f D u D t x p ( t ) + 1 2 m f d d t u x p ( t ) , t v p ( t )          + 6 π r p μ u x p ( t ) , t v p ( t ) 6 π r p 2 μ 0 t d / d τ v p ( t ) u x p ( t ) , t π ν t τ 1 / 2 d τ .
Here, μ and ν are, respectively, the dynamic and kinematic viscosity of the fluid, r p is particle radius, m f is the mass of the fluid displaced by the immersed particle, and g is the gravitational acceleration. Additionally, u x p ( t ) , t and D u / D t x p ( t ) denote, respectively, the fluid velocity and its material derivative evaluated at the particle location x p ( t ) . The terms on the right-hand side of Equation (6) represent, in order, the net buoyancy force, the force exerted by the undisturbed velocity field (commonly referred to as the pressure gradient force), the added-mass force, the viscous Stokes drag, and the Basset history force. In order to account for the effects of finite particle Reynolds numbers, the Stokes drag force contribution is often corrected with the empirical factor proposed in [30] as follows:
F S D = m p u x p ( t ) , t v p ( t ) τ p 1 + 0.15 Re p 0.687 .
Here, τ p is the particle Stokes response time, defined as
τ p = 2 9 ρ p ρ f r p 2 ν ,
and Re p is the Reynolds number of the relative motion between the particle and the fluid, given by
Re p = 2 r p u x p ( t ) , t v p ( t ) ν .
Using the corrected Stokes drag expression (7), Equation (5) for particle momentum is rewritten as follows:
m p d v p ( t ) d t = m p m f g + m f D u D t x p ( t ) + 1 2 m f d d t u x p ( t ) , t v p ( t )        + m p u x p ( t ) , t v p ( t ) τ p Φ Re p 6 π r p 2 μ 0 t d / d τ v p ( t ) u x p ( t ) , t π ν t τ 1 / 2 d τ ,
with
Φ Re p = 1 + 0.15 Re p 0.687 .
In this work, we do not consider the effect of gravity, which would lead to particle deposition and sedimentation. In such a situation, Boffetta et al. [27] suggested a formulation of the Maxey–Riley equations that neglects the Basset history force, which is expected to be the least important force. Under the hypothesis of small particle response times, the material derivative of the fluid velocity evaluated at the particle location can be approximated with the time derivative of fluid velocity following the particle motion. Thus, Equation (10) for particle momentum becomes
m p d v p ( t ) d t = m f d d t u x p ( t ) , t + 1 2 m f d d t u x p ( t ) , t v p ( t ) + m p u x p ( t ) , t v p ( t ) τ p Φ Re p .
Dividing Equation (12) by the particle mass and rearranging its terms, it becomes
d d t v p ( t ) β u x p ( t ) , t = u x p ( t ) , t v p ( t ) τ ^ p Φ Re p ,
where β is the so-called added-mass factor, defined as
β = 3 2 ρ p / ρ f + 1 ,
and τ ^ p is a modified particle response time, given by
τ ^ p = τ p 1 + ρ f 2 ρ p = r p 2 3 β ν .
Equation (13) can be put in a simple form by defining the particle covelocity w p ( t ) as
w p ( t ) = v p ( t ) β u x p ( t ) , t ,
so that the resulting equations can be recast in a form close to the equations valid for particles much denser than the fluid,
d x p ( t ) d t = v p ( t ) = w p ( t ) + β u x p ( t ) , t ,
d w p ( t ) d t = 1 β u x p ( t ) , t w p ( t ) τ ^ p Φ Re p .
Equations (17) and (18) state that particle motion is governed by two parameters: the added-mass factor ( β ) and the modified response time ( τ ^ p ). Both these parameters are determined by the particle-to-fluid density ratio and particle radius. The non-dimensional form of the particle equations (Equations (17) and (18)) maintains the same structure as their dimensional counterparts when scaled with the flow reference scales (specifically, h, ρ f , and u τ ). In the dimensionless equations, the resulting particle response time would be given by τ ^ p = Re τ r p 2 / ( 3 β ) , where r p represents henceforth the non-dimensional particle radius. As non-dimensional governing parameters, we selected the added-mass factor, β , and the Stokes number obtained with the wall viscous timescale, i.e., St + = τ ^ p / τ η , where τ η is non-dimensional and given by τ η = 1 / Re τ .
In this work, we consider the one-way coupling regime only, so that no particle force on the fluid is present in Equation (2) and the particle volume fraction plays no dynamical role. Indeed, the primary goal of this work is not to investigate flow modifications caused by particles, nor the effect of particle collisions, but to assess how the finite ratio ρ p / ρ f influences the particle distribution in the near-wall region.

2.2. Numerical Methods

The Navier–Stokes equations (Equations (1) and (2)) are reformulated in terms of the wall-normal component of the vorticity vector, η = u / z w / x , and the wall-normal component of the velocity field, v, as in [31]. This formulation consists of a second-order equation for η and a fourth-order equation for v, in which pressure does not appear. Spectral methods are employed for spatial discretization: Fourier–Galërkin in the two homogeneous directions (x and z) and Chebyshev–Tau in the wall-normal direction (y), as detailed in [31]. The 2 / 3 -rule [32] is employed to remove the aliasing error arising from the pseudo-spectral evaluation of non-linear terms. The fluid equations are advanced in time using the implicit Crank–Nicolson scheme for the viscous terms and the explicit two-step Adams-Bashforth method for the convective terms. The application of these integration schemes results in one-dimensional Helmholtz equations for η and φ = 2 v for each pair of Fourier modes, k x , k z . The resulting algebraic formulation involves a quasi-tridiagonal matrix where even and odd Chebyshev coefficients are decoupled. This allows the problem to be split into two smaller problems, which are solved using the Thual algorithm [33] for quasi-tridiagonal systems of equations. In order to ensure consistency between the wall boundary conditions for v and φ = 2 v , the Kleiser–Schumann algorithm proposed in [34] is applied.
Particle equations are advanced in time by means of the same explicit Adams–Bashforth scheme employed for the carrier flow. In each time step, the computation of the fluid velocity at the particle location, necessary for evaluating the Stokes drag, is performed through trilinear interpolations. Wall collisions are assumed to take place when the particle center is within one radius’s distance from the walls, and these collisions are modeled as perfectly elastic, i.e., kinetic energy is conserved: at the end of each time-integration step, if a particle has crossed a solid wall, it is reintroduced into the domain by mirroring its new position with respect to the crossed solid boundary. The streamwise and spanwise components of the particle velocity remain unaltered, while the wall-normal velocity changes sign. Furthermore, particles exiting the domain through a periodic boundary reenter through the opposite side with the same velocity.

3. Results and Discussion

Three particle-laden channel flow simulations have been performed at a single friction Reynolds number, Re τ = 180 , and three added-mass factors: β = 0.1 , β = 0.4 , and β = 0.9 . Each simulation involved three groups of N p = 5,120,000 particles, with each group characterized by a specific Stokes number: St + = 0.1 , St + = 0.4 , and St + = 0.9 . The parameters set for these simulations are presented in Table 1. The number of particles we have simulated results in volume fractions higher than the upper limit of validity of the one-way coupling regime [35]. However, not considering collisions, particles move independently of each other: a larger particle number allows for a larger ensemble of particles, which improves the accuracy of statistics without the need to repeat the simulations in order to have more realizations of the flow. Thus, this expedient only serves to obtain more accurate statistics while limiting the computational burden, as observed in [36], and is not meant in any way to represent the actual behavior of a concentrated suspension.
For all computations, the Fourier representation employed 192 modes in both the streamwise and spanwise directions, while 201 Chebyshev polynomials were used in the wall-normal direction. The physical grid resolution in the homogeneous directions was uniform, with a spacing Δ x + = Δ z + 5.9 in wall units. In the wall-normal direction, Chebyshev–Gauss–Lobatto points were used, resulting in a grid spacing ranging between Δ y + 0.02 and Δ y + 2.9 , respectively, at the walls and the center of the channel. Each run simulated 24 non-dimensional temporal scales, starting from an initial velocity field obtained from a previous simulation that had reached statistical stationarity at the same friction Reynolds number. At the beginning of the simulation, the flow is seeded with particles uniformly introduced at random positions in the computational domain. Their velocities have been initialized with the values of the fluid velocity at their locations. Initial positions and velocity of particles determine only the length of transient toward the statistically steady state but do not affect the resulting asymptotic condition. Post-processing was performed over the last 14 temporal scales to ensure that particle variables had reached statistical stationarity as well. All statistics have been computed by averaging both in time and on planes parallel to the walls to take advantage of the statistical homogeneity in the streamwise and spanwise directions.

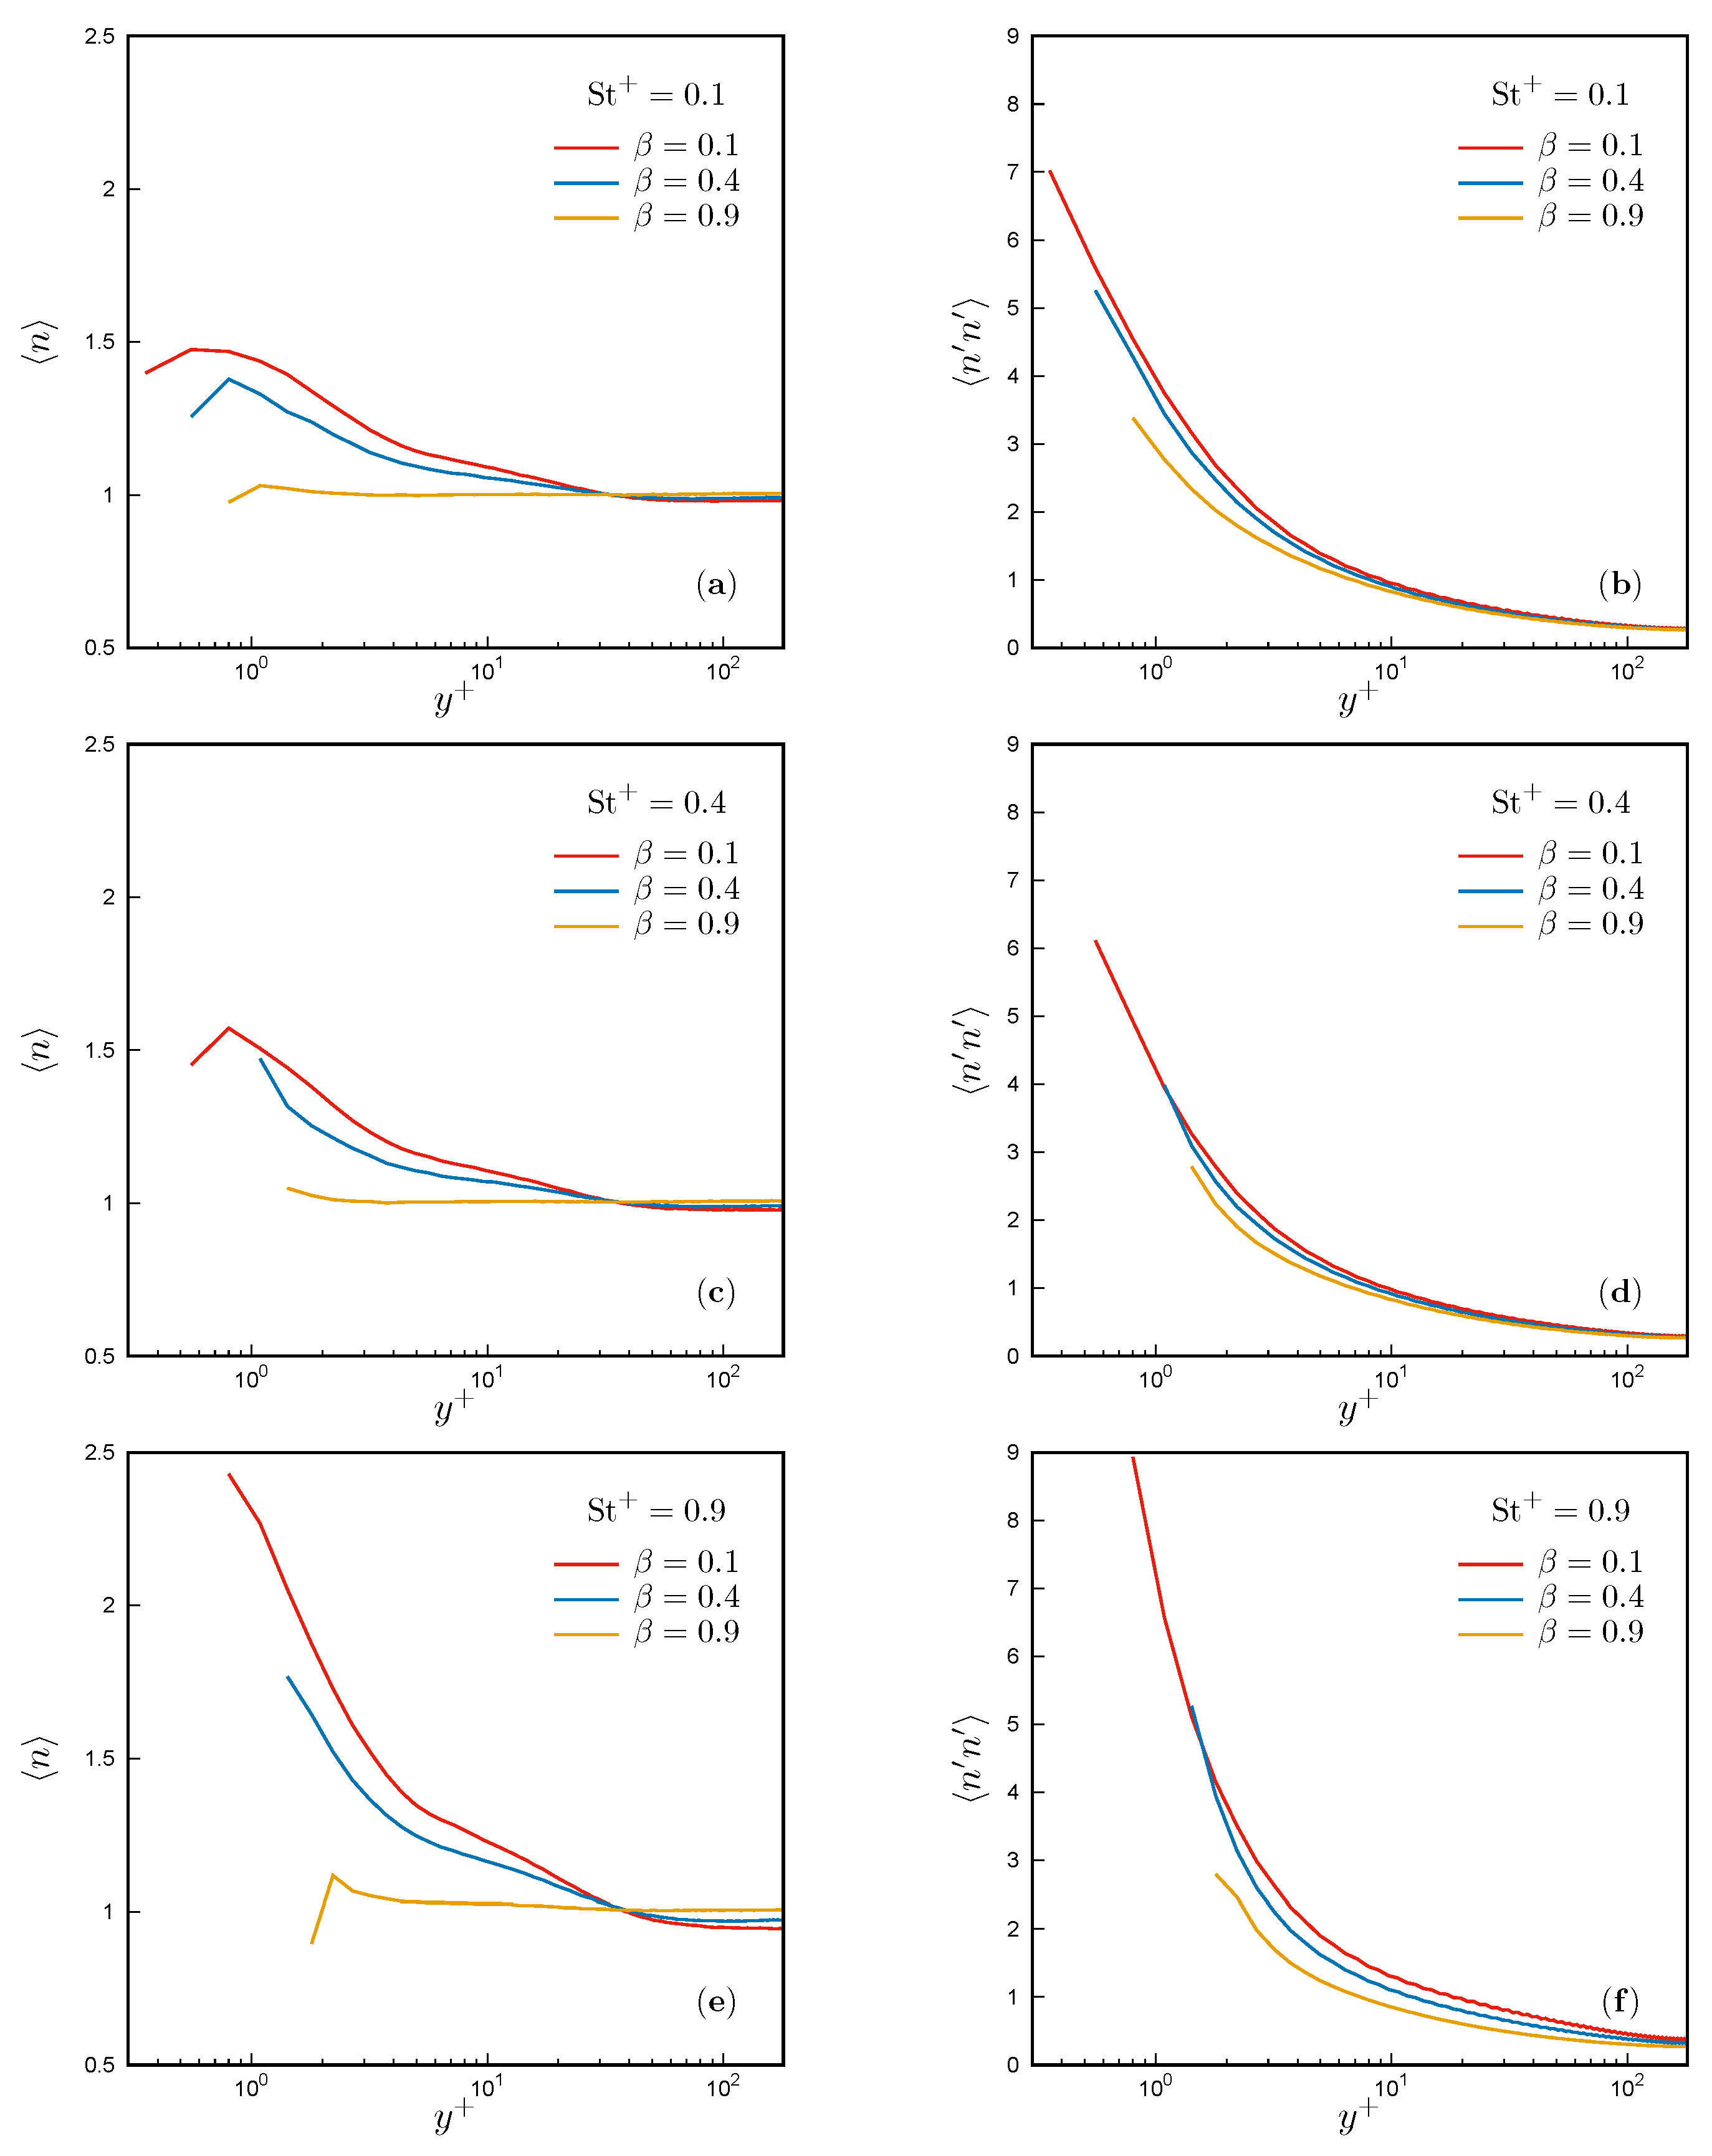
3.1. Particle Distribution
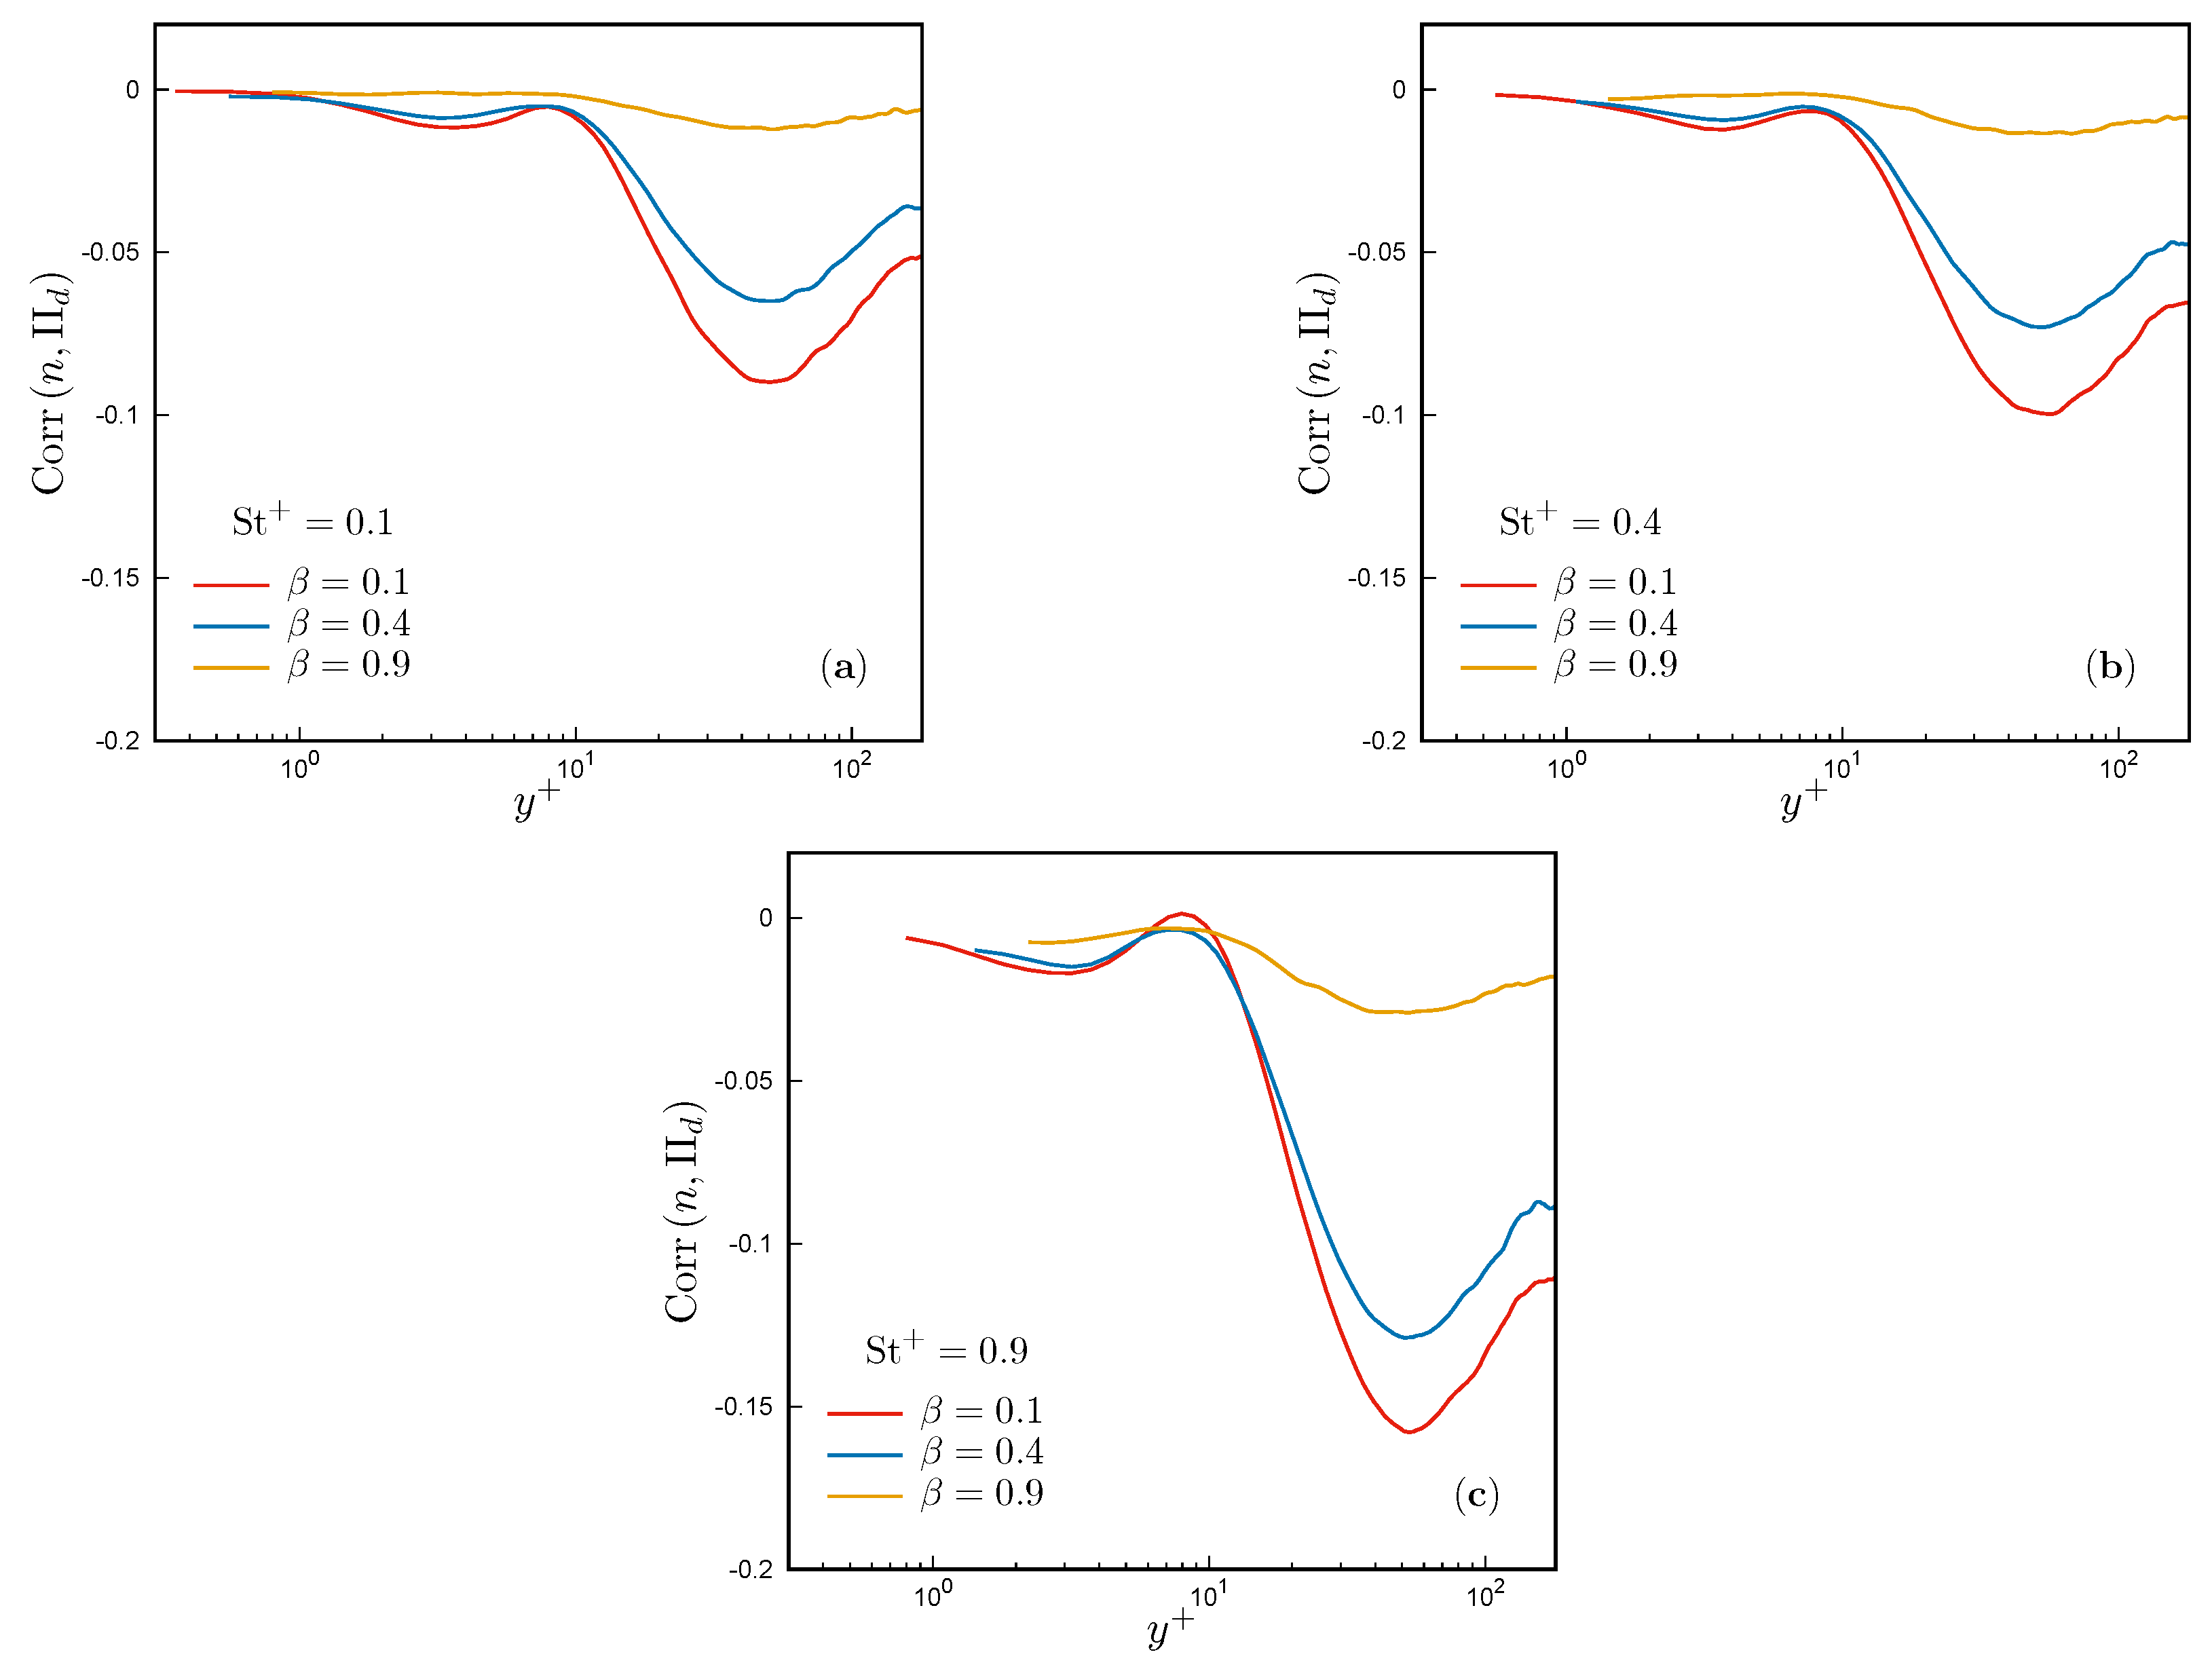
In order to analyze the effect of the added-mass factor β on particle spatial distribution, we study the statistics of the particle number density n, i.e., the number of particles per unit volume, which in the following will be implicitly rescaled with the mean concentration of particles in the channel (which, in dimensionless form, is equal to N p / 8 π 2 ). The time-averaged particle concentration, n , and its variance, n n , are shown in Figure 2, plotted against y + = y Re τ for various St + . Particle concentration profiles reveal that heavier particles, characterized by β = 0.1 and β = 0.4 , exhibit a notable tendency to accumulate very close to the walls. Furthermore, the concentration peak occurring in the viscous sublayer ( y + < 5 ) strengthens with higher Stokes numbers. This observation aligns with previous findings described in the literature [14,23,24], confirming that particle drift toward the walls is more pronounced as the particle response times approach the viscous timescale of the flow. Interestingly, as the added-mass factor increases, particles exhibit a progressive shift toward a more uniform spatial distribution. Regardless of the Stokes number, concentration profiles flatten out around the mean value (yellow lines in Figure 2a,c,e), and the concentration variance consistently decreases, even if the wall regions still keep a much higher variance than the channel center.
The increased uniformity in the spatial distribution of particles with higher values of β at a fixed Stokes number ( St + = 0.9 ) is also visible in the visualizations of instantaneous particle positions in wall-parallel planes (Figure 3). In the viscous sublayer, heavier particles form distinctive elongated accumulation patterns, which are streamwise-oriented, as shown in Figure 3a. The formation of these particle necklaces, first observed in [37], occurs in low-velocity flow regions as a direct consequence of turbophoresis: inertial particles tend to disperse more rapidly where velocity fluctuations are more intense, consequently drifting toward low-turbulence regions [38]. However, as the added-mass factor increases, these elongated clusters become less visible, and particle instantaneous distribution progressively appears more uniform, as shown in Figure 3c,e. Lighter particles are found to visit high-velocity flow regions as well. This redistributive effect of the added-mass factor, resulting in a more homogeneous particle concentration, is observed across the entire domain. Figure 3b,d,f, which shows particle instantaneous distribution in the buffer layer for y + 20 , confirms that while heavier particles disperse inhomogeneously, tending to avoid high-velocity regions, lighter ones uniformly sample the domain.

3.2. Flow Topology

A better understanding of particle distribution in the channel can be obtained by analyzing how particle distribution relates to flow topology under the influence of the added-mass factor, evaluating the correlation coefficients between the particle concentration field and fluid variables representative of the main flow structures. Hereafter, the correlation coefficient between particle concentration n and any other variable ζ is defined as
Corr n , ζ = n ζ n n ζ ζ ,
where primes denote temporal fluctuations and the brackets · represent the average, so that ζ = ζ ζ .
Figure 4 illustrates the correlation between particle concentration, n, and the streamwise and wall-normal components of the fluid velocity along the channel half-height for various values of St + and β .
These correlation profiles indicate that in the buffer layer ( 5 < y + < 30 ), the concentration of heavier particles ( β = 0.1 and β = 0.4 ) correlates with negative values of streamwise velocity fluctuations and positive values of wall-normal velocity fluctuations. This result suggests that heavier particles tend to collect and dwell longer in low-speed streaks near the wall, as negative values of u and positive values of v are distinctive features of these flow structures, which are generated and lifted away from the wall by the most energetic streamwise vortices occurring in the buffer layer [39]. The peaks of the red and blue curves in Figure 4, corresponding to β = 0.1 and β = 0.4 , respectively, become more pronounced as the Stokes number increases, indicating that preferential concentration in low-speed streaks is more intense as particle response time approaches the viscous timescale, as observed in previous studies [14,23,24]. In clear contrast is the influence of the added-mass factor. Indeed, with an increase in β , the concentration of particles gradually decorrelates from both the streamwise and wall-normal velocity components of the fluid. These results are consistent with the findings on the redistributive effect of β on particles presented in the previous section and suggest that the centrifugal mechanism, primarily responsible for turbophoresis at the relatively small Stokes numbers considered, weakens as particle mass density decreases, regardless of the Stokes number. This result can be expected by considering that the pressure-gradient force is directed toward the centers of vortices, where pressure is expected to have a local minimum, and is proportional to the fluid density. Since particles with β = 0.9 have a mass density only 1.17 times greater than the density of the fluid, this force is able to almost balance the centrifugal effect, proportional to the particle density, so that in such conditions, particles tend to behave almost like spherical and rigid fluid particles. Consequently, even if their velocity field is not solenoidal, and a weak clustering is still possible, these particles are able to closely trace the carrier flow.
Given the well-known tendency of heavy particles to preferentially sample high-strain regions of the flow, further insight can be obtained by examining the correlation between particle concentration and three other quantities representative of the local flow topology: the magnitude of the strain-rate tensor, defined as
S = S i j S i j ,
with S i j = 1 / 2 u i / x j + u j / x i , the magnitude of the vorticity,
ω = ω i ω i ,
with ω i = ε k j i u i / x j , and the second invariant of the velocity gradient tensor, defined as
II d = 1 2 S i j S i j 1 2 ω i ω i .
Figure 5 shows the influence of the added-mass factor on the correlation coefficients Corr n , S and Corr n , ω for various Stokes numbers. Heavier particles show a positive correlation between n and S within the range 5 < y + < 100 , i.e., in the buffer layer, logarithmic layer, and a segment of the outer layer, with a peak value at y + 35 . In contrast, the correlation between n and ω is positive throughout the buffer layer and turns negative from the logarithmic layer onward, reaching its minimum near the centerline of the channel. Despite being small, these correlations indicate that heavier particles tend to sample high-strain and low-vorticity flow regions across most of the domain, supporting the existing literature on the preferential concentration of heavy particles [14]. Consistently, the effects of St + and β observed so far are confirmed. Higher Stokes numbers are associated with stronger correlations. Conversely, as the added-mass factor increases, and particle density becomes closer to the fluid density, particle concentration gradually decorrelates from the magnitude of both the strain rate and the vorticity. This effect of β strongly suggests that the centrifuge mechanism weakens, as particles are allowed to visit and collect in high-vorticity regions as well. Ultimately, no particle preferential concentration is observed for β = 0.9 .
These findings are also supported and summarized by the correlation coefficients between n and the second invariant of the velocity gradient ( II d ), which are illustrated in Figure 6 for the three St + simulated. From Equation (22), it can be noticed that large positive values of II d correspond to high-enstrophy/low-strain flow regions, and conversely, large negative values of II d correspond to low-enstrophy/high-strain regions. The concentration of particles at β = 0.1 and β = 0.4 is observed to correlate with negative values of II d across the entire height of the channel (red and blue curves in Figure 6), highlighting the tendency of heavier particles (strengthened by growing St + ) to concentrate preferentially in strain-dominated regions and elude vortices. For nearly neutrally buoyant particles ( β = 0.9 ), the correlation coefficients Corr n , II d vanish, in agreement with the individual correlations between n and S, and between n and ω , discussed earlier.
We conclude our analysis with the investigation of the influence of β on the Joint Probability Mass Function (Joint-PMF) characterizing the relationship between particle concentration and the second invariant of the velocity gradient tensor ( II d ) across the entire computational domain. While the Joint-PMF has been calculated for each simulation, for the sake of clarity and to highlight the role of the added-mass factor, we present, in Figure 7, specific instances corresponding to a single Stokes number ( St + = 0.9 ). The peaks in the Joint Probability Mass Function (Joint-PMF) at II d = 0 can be attributed to the inherent characteristic of the second invariant of the velocity gradient tensor, which consistently assumes a zero value for the mean flow. Consequently, zero emerges as the most probable outcome for the instantaneous realizations of II d . Notably, irrespective of the added-mass factor, all Joint-PMFs exhibit an asymmetric distribution around II d = 0 , which distinctly protrudes towards negative values of II d . This observation implies that both heavier and lighter particles are more likely to be found in regions characterized by negative II d , where strain dominates over vorticity. However, as the added-mass factor grows, the II d < 0 lobe of the Join-PMFs shrinks, while higher values of joint probability between n and II d gradually populate the positive semi-axis of II d , as evident from Figure 7b,c. Consistent with prior observations regarding the role of β in decorrelating particle concentration from the local flow topology, this outcome indicates that lighter particles exhibit a comparable likelihood of being found in regions characterized by high vorticity as they do in those dominated by strain.

4. Conclusions

The influence of the added-mass factor β on particle preferential concentration in turbulent channel flows has been numerically investigated using Point-Particle Direct Numerical Simulations under the assumption of small particle Stokes numbers. Specifically, this study explored how β , along with the Stokes number determined with the wall viscous timescale, influences the spatial distribution of particles within the channel and the statistical relationship between their concentration and the local flow topology. The analysis of particle spatial distribution highlighted a distinct trend: heavier particles (lower β ) tend to accumulate in elongated low-speed regions very close to the walls, as a direct manifestation of turbophoresis [38]. This tendency is strengthened as the particle response time approaches the viscous timescale of the flow, in agreement with the current literature on heavy particles [14,23,24]. Notably, this phenomenon diminished at higher β , leading to a more uniform particle distribution across the entire domain. Exploring the statistical relation between particle concentration and the flow topology, the study demonstrated that, regardless of the Stokes number, higher β result in a gradual decorrelation between particle concentration and various fluid variables, including the strain-rate tensor, the vorticity tensor, and the second invariant of the velocity gradient. This suggests that the main mechanism responsible for driving particles away from the stronger vortices at the relatively low Stokes numbers considered, namely the centrifuge mechanism, becomes ineffective as the particle’s density approaches the fluid’s density. The Joint Probability Mass Function of particle concentration and the second invariant of the velocity gradient corroborated these findings, indicating that the probability of particles being found in strain-dominated regions, as opposed to vortical regions, decreases with increasing β . The implications of these findings extend to a wide range of processes involving particle-laden flows, from natural to industrial, and emphasize the importance of considering the effects of the added-mass factor in particle predictive models and simulations. Future studies should encompass the effect of Basset’s forces, which cannot be ignored when β ∼1.

Author Contributions

Conceptualization, D.Z. and M.I.; methodology, D.Z. and M.I.; software, D.Z.; formal analysis, D.Z. and M.I.; investigation, D.Z. and M.I.; writing—original draft preparation, D.Z. and M.I.; writing—review and editing, D.Z. and M.I.; visualization, D.Z.; supervision, M.I. All authors have read and agreed to the published version of the manuscript.

Funding

This research received no external funding.

Data Availability Statement

The data that support the findings of this study are available from the authors upon reasonable request.

Acknowledgments

The authors acknowledge the computer resources provided by CINECA under the ISCRA initiative. Additional resources were provided by HPC@POLITO (http://www.hpc.polito.it (accessed on 1 December 2023)).

Conflicts of Interest

The authors declare no conflicts of interest.

References

  1. Brandt, L.; Coletti, F. Particle-Laden Turbulence: Progress and Perspectives. Annu. Rev. Fluid Mech. 2022, 54, 159–189. [Google Scholar] [CrossRef]
  2. Lohse, D. Bubble puzzles: From fundamentals to applications. Phys. Rev. Fluids 2018, 3, 110504. [Google Scholar] [CrossRef]
  3. Kuerten, J.G.M. Point-Particle DNS and LES of Particle-Laden Turbulent flow—A state-of-the-art review. Flow Turbul. Combust. 2016, 97, 689–713. [Google Scholar] [CrossRef]
  4. Riley, J.J.; Patterson, G.S., Jr. Diffusion experiments with numerically integrated isotropic turbulence. Phys. Fluids 1974, 17, 292–297. [Google Scholar] [CrossRef]
  5. Maxey, M.R.; Riley, J.J. Equation of motion for a small rigid sphere in a nonuniform flow. Phys. Fluids 1983, 26, 883–889. [Google Scholar] [CrossRef]
  6. Armenio, V.; Fiorotto, V. The importance of the forces acting on particles in turbulent flows. Phys. Fluids 2001, 13, 2437–2440. [Google Scholar] [CrossRef]
  7. Squires, K.D.; Eaton, J.K. Particle response and turbulence modification in isotropic turbulence. Phys. Fluids A Fluid Dyn. 1990, 2, 1191–1203. [Google Scholar] [CrossRef]
  8. Squires, K.D.; Eaton, J.K. Preferential concentration of particles by turbulence. Phys. Fluids A Fluid Dyn. 1991, 3, 1169–1178. [Google Scholar] [CrossRef]
  9. Boivin, M.; Simonin, O.; Squires, K. Direct numerical simulation of turbulence modulation by particles in isotropic turbulence. J. Fluid Mech. 1998, 375, 235–263. [Google Scholar] [CrossRef]
  10. Goto, S.; Vassilicos, J. Sweep-stick mechanism of heavy particle clustering in fluid turbulence. Phys. Rev. Lett. 2008, 100, 054503. [Google Scholar] [CrossRef]
  11. Salazar, J.P.L.C.; Collins, L.R. Inertial particle relative velocity statistics in homogeneous isotropic turbulence. J. Fluid Mech. 2012, 696, 45–66. [Google Scholar] [CrossRef]
  12. McLaughlin, J.B. Aerosol particle deposition in numerically simulated channel flow. Phys. Fluids A Fluid Dyn. 1989, 1, 1211–1224. [Google Scholar] [CrossRef]
  13. Brooke, J.W.; Kontomaris, K.; Hanratty, T.J.; McLaughlin, J.B. Turbulent deposition and trapping of aerosols at a wall. Phys. Fluids A Fluid Dyn. 1992, 4, 825–834. [Google Scholar] [CrossRef]
  14. Rouson, D.W.I.; Eaton, J.K. On the preferential concentration of solid particles in turbulent channel flow. J. Fluid Mech. 2001, 428, 149–169. [Google Scholar] [CrossRef]
  15. Marchioli, C.; Soldati, A. Mechanisms for particle transfer and segregation in a turbulent boundary layer. J. Fluid Mech. 2002, 468, 283–315. [Google Scholar] [CrossRef]
  16. Vreman, A.W. Turbulence characteristics of particle-laden pipe flow. J. Fluid Mech. 2007, 584, 235–279. [Google Scholar] [CrossRef]
  17. Eaton, J.; Fessler, J. Preferential concentration of particles by turbulence. Int. J. Multiph. Flow 1994, 20, 169–209. [Google Scholar] [CrossRef]
  18. Coleman, S.W.; Vassilicos, J.C. A unified sweep-stick mechanism to explain particle clustering in two- and three-dimensional homogeneous, isotropic turbulence. Phys. Fluids 2009, 21, 113301. [Google Scholar] [CrossRef]
  19. Baker, L.; Frankel, A.; Mani, A.; Coletti, F. Coherent clusters of inertial particles in homogeneous turbulence. J. Fluid Mech. 2017, 833, 364–398. [Google Scholar] [CrossRef]
  20. Petersen, A.J.; Baker, L.; Coletti, F. Experimental study of inertial particles clustering and settling in homogeneous turbulence. J. Fluid Mech. 2019, 864, 925–970. [Google Scholar] [CrossRef]
  21. Bragg, A.D.; Collins, L.R. New insights from comparing statistical theories for inertial particles in turbulence: I. Spatial distribution of particles. New J. Phys. 2014, 16, 055013. [Google Scholar] [CrossRef]
  22. Wang, L.P.; Maxey, M.R. Settling velocity and concentration distribution of heavy particles in homogeneous isotropic turbulence. J. Fluid Mech. 1993, 256, 27–68. [Google Scholar] [CrossRef]
  23. Pedinotti, S.; Mariotti, G.; Banerjee, S. Direct numerical simulation of particle behaviour in the wall region of turbulent flows in horizontal channels. Int. J. Multiph. Flow 1992, 18, 927–941. [Google Scholar] [CrossRef]
  24. Fessler, J.R.; Kulick, J.D.; Eaton, J.K. Preferential concentration of heavy particles in a turbulent channel flow. Phys. Fluids 1994, 6, 3742–3749. [Google Scholar] [CrossRef]
  25. Wang, L.P.; Maxey, M.R. The Motion of Microbubbles in a Forced Isotropic and Homogeneous Turbulence. In Proceedings of the Advances in Turbulence IV, Lyon, France, 1–4 July 1986; Nieuwstadt, F.T.M., Ed.; Springer: Dordrecht, The Netherlands, 1993; pp. 291–296. [Google Scholar]
  26. Aliseda, A.; Lasheras, J.C. Preferential concentration and rise velocity reduction of bubbles immersed in a homogeneous and isotropic turbulent flow. Phys. Fluids 2011, 23, 093301. [Google Scholar] [CrossRef]
  27. Boffetta, G.; Celani, A.; Lillo, F.D.; Musacchio, S. The Eulerian description of dilute collisionless suspension. Europhys. Lett. 2007, 78, 14001. [Google Scholar] [CrossRef]
  28. Behera, D.; Nandi, B.K. Effect of coal particle density on coal properties and combustion characteristics. Powder Technol. 2021, 382, 594–604. [Google Scholar] [CrossRef]
  29. Jiménez, J.; Moin, P. The minimal flow unit in near-wall turbulence. J. Fluid Mech. 1991, 225, 213–240. [Google Scholar] [CrossRef]
  30. Morsi, S.A.; Alexander, A.J. An investigation of particle trajectories in two-phase flow systems. J. Fluid Mech. 1972, 55, 193–208. [Google Scholar] [CrossRef]
  31. Kim, J.; Moin, P.; Moser, R. Turbulence statistics in fully developed channel flow at low reynolds number. J. Fluid Mech. 1987, 177, 133–166. [Google Scholar] [CrossRef]
  32. Canuto, C.; Hussaini, M.Y.; Quarteroni, A.; Zang, T.A. Spectral Methods in Fluid Dynamics; Springer: Berlin/Heidelberg, Germany, 1988. [Google Scholar] [CrossRef]
  33. Thual, O. Transition Vers La Turbulence dans Des Systèmes Dynamiques Apparentés a La Convection. Ph.D. Thesis, Universitè de Nice-Sophia Antipolis, Nice, France, 1986. [Google Scholar]
  34. Kleiser, L.; Schumann, U. Treatment of incompressibility and boundary conditions in 3-D numerical spectral simulations of plane channel flows. In Proceedings of the 3rd GAMM Conference on Numerical Methods in Fluid Mechanics, Cologne, Germany, 10–12 October 1979; (Notes on Numerical Fluid Mechanics. Volume 2). Hirschel, E.H., Ed.; Vieweg: Braunschweig, Germany, 1980; pp. 165–173. [Google Scholar]
  35. Elghobashi, S. On predicting particle-laden turbulent flows. Appl. Sci. Res. 1994, 52, 309–329. [Google Scholar] [CrossRef]
  36. Zandi Pour, H.R.; Iovieno, M. Heat Transfer in a Non-Isothermal Collisionless Turbulent Particle-Laden Flow. Fluids 2022, 7, 345. [Google Scholar] [CrossRef]
  37. Young, J.B.; Hanratty, T.J. Trapping of solid particles at a wall in a turbulent flow. AIChE J. 1991, 37, 1529–1536. [Google Scholar] [CrossRef]
  38. Reeks, M.W. The transport of discrete particles in inhomogeneous turbulence. J. Aerosol Sci. 1983, 14, 729–739. [Google Scholar] [CrossRef]
  39. Smith, C.R.; Metzler, S.P. The characteristics of low-speed streaks in the near-wall region of a turbulent boundary layer. J. Fluid Mech. 1983, 129, 27–54. [Google Scholar] [CrossRef]
Figure 1. Flow configuration.
Energies 17 00783 g001
Figure 2. (a,c,e) Time-averaged particle concentration, n , as a function of y + . (b,d,f) Particle concentration variance, n n , as a function of y + . Results are shown for various Stokes numbers: St + = 0.1 (a,b), St + = 0.4 (c,d), and St + = 0.9 (e,f).
Energies 17 00783 g002
Figure 3. Visualizations of the instantaneous position of particles (shown out of scale), superimposed on the fluid streamwise velocity fluctuations, u x , t , in the wall-parallel planes at y + 3 (a,c,e) and y + 20 (b,d,f) at t = 24 for St + = 0.9 and different added-mass factors β . The particles shown in the left column are those contained between the wall-parallel planes at y + = 2.1 and y + = 4.2 , while the particles in the right column are those contained between the planes at y + = 18.2 and y + = 21.0 .
Energies 17 00783 g003
Figure 4. (a,c,e) Correlation coefficient between particle concentration, n, and the streamwise velocity, u, as a function of y + . (b,d,f) Correlation coefficient between particle concentration and the wall-normal velocity, v, as a function of y + . Both correlations are shown for different Stokes numbers: St + = 0.1 (a,b), St + = 0.4 (c,d), and St + = 0.9 (e,f).
Energies 17 00783 g004
Figure 5. (a,c,e) Correlation coefficient between particle concentration, n, and the magnitude of strain-rate tensor, S, as a function of y + . (b,d,f) Correlation coefficient between particle concentration and vorticity magnitude, ω , as a function of y + . Both correlations are represented for different Stokes numbers: St + = 0.1 (a,b), St + = 0.4 (c,d), and St + = 0.9 (e,f).
Energies 17 00783 g005
Figure 6. Correlation between particle concentration, n, and the second invariant of the velocity gradient, II d , as a function of y + . Correlations are represented for various Stokes numbers: (a) St + = 0.1 , (b) St + = 0.4 , and (c) St + = 0.9 .
Energies 17 00783 g006
Figure 7. Joint Probability Mass Function (Joint-PMF) of particle concentration n and the second invariant II d of the velocity gradient tensor at a fixed Stokes number St + = 0.9 and various added-mass factors: (a) β = 0.1 , (b) β = 0.4 , and (c) β = 0.9 .
Energies 17 00783 g007
Table 1. Added-mass factor, density ratio, Stokes number, number of particles, non-dimensional particle radius, and non-dimensional temporal scales simulated in the three PP-DNS.
β ρ p / ρ f St + N p r p t
Run 10.114.500.15,120,000 9.62 × 10 4 24
0.45,120,000 1.93 × 10 3
0.95,120,000 2.89 × 10 3
Run 20.43.250.15,120,000 1.93 × 10 3 24
0.45,120,000 3.85 × 10 3
0.95,120,000 5.77 × 10 3
Run 30.91.170.15,120,000 2.89 × 10 3 24
0.45,120,000 5.77 × 10 3
0.95,120,000 8.66 × 10 3
Disclaimer/Publisher’s Note: The statements, opinions and data contained in all publications are solely those of the individual author(s) and contributor(s) and not of MDPI and/or the editor(s). MDPI and/or the editor(s) disclaim responsibility for any injury to people or property resulting from any ideas, methods, instructions or products referred to in the content.

