Article

Locational Role Analysis of Energy Storage Systems Based on Optimal Capacity Needs and Operations under High Penetration of Renewable Energy

School of Energy Engineering, Kyungpook National University, Daegu 41566, Republic of Korea
Energies 2024, 17(3), 743; https://doi.org/10.3390/en17030743
Submission received: 19 December 2023 / Revised: 12 January 2024 / Accepted: 31 January 2024 / Published: 4 February 2024
(This article belongs to the Section F1: Electrical Power System)

Abstract

:
As the need for energy storage systems (ESSs) capacity is increasing due to high accommodation of renewable resources, it is crucial to analyze in which location and for what purpose the ESSs are required to achieve the highest efficiency. Investors and system operators can place and operate the ESSs as expected based on this analysis. Therefore, this study assesses the specific roles of ESSs in a grid system based on their optimal capacity needs, locations, and operations. A long-term simulation model using mixed-integer programming is proposed to obtain these optimal solutions, such as ESS capacity and operational schedules for energy and reserves. Four-week operational simulations are performed for each month using data from the California Independent System Operator. ESSs are placed at sites with solar photovoltaic (PV) systems or wind farms, at baseload generator buses, and at load buses to verify the role of ESSs, depending on the locational differences. The detailed roles are analyzed from the aspects of flexible capacity supply, reserve deployments, time-shifting renewable and thermal energy generation, and costs. The results show that the ESSs on the baseload generation side provide flexibility by time-shifting baseload generation and turn on baseload generators, even when the net load is small. For instance, the required capacity of the flexible thermal generators, such as natural gas turbine generators, is about 3004 MW without the ESS operations in May. When 450 MW ESSs colocated with solar PVs are operated, the required flexible capacity of the thermal generators is lowered to 2404 MW. Moreover, ESSs are highly utilized as a downward reserve provider, although their costs for reserves are higher than thermal generators.

1. Introduction

The installed capacity of renewable energy generation increases in a power system, and some issues, such as curtailment of renewable energy generation and more requirements of flexible generation due to the variability of renewable resources, are driven. One practical solution is the implementation of energy storage systems (ESSs), and therefore the applicability of ESSs is examined within various scopes accordingly.
Potential and viable applications of ESSs in an electric grid system have been addressed in [1], and the benefits have been assessed comprehensively. The technological options of ESSs that can be used to achieve high renewable energy penetration levels have been investigated by exploring performance metrics such as efficiency and response time, based on the literature in [2,3], which provides information on the purpose for which ESSs can be used.
Various technologies of ESSs applied to power systems have been discussed, and practical applications are classified into several categories, with the application to grid-connected renewable energy projects taking the highest portion in [4]. For this application, sodium–sulfur batteries are the most frequently implemented technology. In [5], ESS applications based on the specification of different types of ESSs have been reviewed. The roles of ESSs in coping with potential issues caused by increasing renewable resources have been discussed in [6], where analysis of grid operations was performed based on the data from the Electric Reliability Council of Texas. In [7], bulk ESSs for mainly pumped hydro energy storage (PHES), distributed ESSs focusing on load side management, and ESSs for smart grid development have been discussed.
Benefits are expected when ESSs are operated, and their value can be estimated using several metrics such as monetary value. If the value is greater than the cost of the ESS, the ESS technology may be economically viable. In this context, the value of ESSs has been discussed in [8]. Specifically, the operational and capacity values of ESSs have been examined by simulating real-world scenarios using a commercial simulation tool. In [9], the value of ESSs, particularly battery ESSs, has been quantified by focusing on specific applications: load leveling, primary frequency control, and peak shaving.
In renewable energy generation, curtailment is a significant concern that can occur due to a lack of flexibility in the system or due to relatively low load levels when renewable energy generation is highly available and transmission congestion rarely occurs. Curtailment may be the main cause of problems in improving the penetration level of renewable energy, even though the installed capacity of renewable energy generation increases. Utility-scale ESSs are considered an effective means to reduce the curtailment of renewable energy generation and are discussed in the literature. The idea of mitigating curtailment using ESSs is to shift renewable energy from the time when renewable energy is highly available and electricity demand is low to the time when the demand is high. In [10], ESSs, as well as demand response, have been investigated as to how well they perform to mitigate wind power curtailment, and the quantified curtailment results have been compared when ESSs such as compressed air energy storage (CAES) systems, PHES systems, and NaS batteries are implemented. The economic value of operating CAES systems to mitigate wind power curtailment has been assessed in [11], and it has been verified that revenue losses are reduced by the CAES operation.
Along with renewable energy generation, carbon dioxide emissions are also a big concern, and discussions about whether ESSs can contribute to carbon dioxide emission reduction have been made in recent literature [12,13].
Reserve deployments of ESSs have been addressed as practical applications and implemented recently in the Midcontinent Independent System Operator (MISO) market. To accomplish this, optimal locations and sizes of ESSs considering providing reserves must be evaluated. Therefore, several studies have been performed to explore the locations and sizes of ESSs for reserves, as in [14]. Exploring a model to provide reserves optimally is one of the frequently discussed topics, as in [15], where a model to deploy reserves optimally from ESSs was presented, with consideration of the uncertainty of renewable resources and electric load. From the viewpoint of the electricity market, it is profitable when ESSs are used to provide both reserves and energy, as discussed in [16], where the revenue of ESSs more than doubles when the ESSs provide reserves.
Flexibility in power systems is receiving much attention due to the increased variability in renewable resources. ESSs have been identified as good candidates because of their fast response time and can be the best fit to provide flexibility when they are cost-effective. Reference [6] has addressed the need for flexible generation because of the increased renewable resources in a grid system. In line with this, the relationship between flexible capacity and wind penetration level was assessed in [17], and it was verified that operating ESSs mitigate curtailments of power generated by wind and solar resources. In [18], the authors investigated ESSs and demand response, as well as flexible thermal generators, as a means to provide flexibility in a power system, and measured their flexibility in a day-ahead scheduling model using indices. The resulting index value shows that ESSs can be a source of flexibility in the system.
Baseload generators are categorized as a generation technology providing energy at a low fuel cost, and are designed to be operated at their maximum output levels without changing the output levels frequently. However, a rapidly increasing proportion of renewable resources in a power system provide high variability, so the system requires more capacity that can be adjusted quickly rather than a firm capacity supplied by the baseload generators. A study has discussed whether baseload generators are affected by the increasing capacity of wind farms. Renewable resources with high variability require a more flexible capacity, which cannot be provided by baseload generators. Therefore, baseload generators, particularly generators with short start-up times, are affected by the increased renewable resources, as in [19].
In the literature addressed earlier, the impact of ESS applications is quantified, and the roles of ESSs are assessed primarily based on the characteristics and specifications of ESSs, rather than their capacity needs or operations such as charging and discharging. Physical characteristics such as duration time, generic capacity, and response time can determine the initial application of ESSs; however, it is not clear how these ESSs actually function without operational results. In addition, long-term operations that may affect operational schedules of ESSs are not considered, and the different roles of ESSs by season or month are not investigated. Therefore, this study analyzes the specific roles of ESSs based on the optimal charging and discharging schedules and capacity requirements for 12 months using a 4-week long-term operational model. To assess the detailed functions of ESSs, depending on their locations, ESSs colocated with solar photovoltaic (PV) systems or wind farms, ESSs located at baseload generator buses, and ESSs at load buses are used for operations. A mathematical model is proposed for optimal solutions, and the actual roles of the ESSs on the renewable energy generation side, baseload generation side, and load side are thoroughly analyzed based on the optimal ESS capacity needs and the operational schedules of generators and ESSs to provide energy and reserves.
The rest of the paper is organized as follows. The proposed mathematical formulation as the simulation model is presented in Section 2. Data and assumptions for a case study are described in Section 3, and the results are presented in Section 4. The results are discussed and conclusions are drawn in Section 5.

2. Simulation Model

This section provides a mathematical simulation model to determine an optimal solution for the ESS capacity needs and the operational schedules of the generators and ESSs. The simulation process to obtain optimal solutions is illustrated in Figure 1. The mathematical model is a 4-week long-term operational model, and the formulation is based on mixed-integer linear programming [20,21]. To represent the characteristics of the baseload generators, unit commitment decisions are applied, and these are modeled as binary decision variables. In addition, ramp-up and ramp-down constraints are adopted to represent ramping capability because of the variability of renewable resources.
min e E E B c o s t · Δ t · E S S e + t T c G c R c o s t c ( R ¯ t c + R ̲ t c ) + e E R E c o s t e ( R E ¯ t e + R E ̲ t e ) + h t T g G G c o s t g · P t g + d D U D c o s t · U D t d + e E E S S c o s t ( Δ Q t e + + Δ Q t e ) + C B c o s t · Δ C B + R P S c o s t · Δ R P S
subject to
c G c Λ c i · P t c + r G r Λ r i · P R t r l L Λ l i · f t l + e E Λ e i · Δ Q t e k E g Λ b i · Δ Q t k +
= d D Λ d i ( γ d · D t U D t d ) + m E l Λ m i · Δ Q t m + , t T , i I
c G c R ¯ t c + e E R E ¯ t e r t u p , t T
c G c R ̲ t c + e E R E ̲ t e r t d n , t T
P t c + R ¯ t c P c m a x , t T , c G c
R ¯ t c r u c · P t c , t T , c G c
P t b P b m i n · U b , t T , b G b
P t c R ̲ t c 0 , t T , c G c
P R t s + e E Λ e s · Δ Q t e + = δ s · s p t , t T , s G s
P R t w + e E Λ e w · Δ Q t e + = ϵ w · w p t , t T , w G w
P t c + R ¯ t c ( P t 1 , c R ̲ t 1 , c ) r u c , t = 2 , 3 , , T , c G c
P t c + R ¯ t c ( P t + 1 , c R ̲ t + 1 , c ) r d c , t = 1 , 2 , , T 1 , c G c
f t l f l m a x , t T , l L
f t l = i I Λ l i · θ t i / X l , t T , l L
E S S e E S S e m a x , e E
E S S e E S S e m a x · b G b Λ e b · U b , e E
Q t e Δ t · E S S e , t T , e E
Q t e = Q t 1 , e + η · Δ Q t e + Δ Q t e , t = 2 , 3 , , T , e E
Q t e = Q e 0 + η · Δ Q t e + Δ Q t e , t = 1 , e E
Δ Q t e + R E ¯ t e E S S e , t T , e E
Δ Q t e + + R E ̲ t e E S S e / η , t T , e E
Q t 1 , e Δ Q t e R E ¯ t e 0 , t = 2 , 3 , , T , e E
Q e 0 Δ Q t e R E ¯ t e 0 , t = 1 , e E
t T c G c e m i t c · P t c Δ C B c b c a p
t T P R t r + e s E s + Δ Q t e e w E w Δ Q t e + Δ R P S R P S r a t e · t T D t
U D t d γ d · D t , t T , d D
The objective function that minimizes the ESS building cost, reserve deployment cost, thermal generation cost, and ESS operating cost is represented in (1). Power balance constraints ensuring that the sum of the power flowing in and out of a bus is zero are represented in (2). The constraints in (3) and (4) deploy upward and downward reserves from thermal generators and ESSs up to the predetermined amounts r t u p and r t d n , respectively, where baseload generators such as coal and nuclear power plants are excluded from the reserve deployments.
The output of a thermal generator and the upward reserve deployments must not exceed the maximum capacity, as represented in (5). The upward reserve can be provided by a thermal generator when the output of the generator is greater than zero in (6). Baseload generators are generally operated around their maximum output levels, so a commitment status variable, U b , is implemented in (7) to make the output of the baseload generators more than P b m i n , where P b m i n is close to P b m a x . The constraints in (8) restrict the downward reserve deployments not to be greater than the output and the thermal generators not to provide the downward reserves when they are turned off.
Solar and wind power can be stored in ESSs or injected into the grid by (9) and (10), respectively. The thermal generators have ramping capacity limits, and these limits can be significant when the penetration level of renewable energy is high and the system experiences high variability. Therefore, ramp-up and ramp-down constraints are applied to reflect the impact of variability, as (11) and (12). Transmission line constraints are represented in (13)–(15), where the power flows are calculated using (15) based on the DC power flow.
ESS capacity requirements not to curtail renewable energy generation have upper bound limits, which are matched to the capacity of the generators or the reference electricity demand level. For instance, ESSs can be built up to 100 MW at a bus where a 100 MW generator is located, as in (16). In addition, the ESSs located at the baseload generator are assumed not to be operated when the baseload generators are not committed, which is denoted in (17). The stored energy in the ESSs has a maximum level, based on their installed capacity in (18), and is determined by the charged and discharged amounts of energy and the stored energy at the beginning of interval t in (19) and (20). The upward and downward reserve deployments of the ESSs are limited by the hourly charging and discharging capability, as in (21) and (22), respectively. The downward reserve and discharged power cannot be more than the stored energy, and these constraints are represented in (23) and (24), respectively.
In the constraints (25), a carbon dioxide emission cap is implemented, and the excess can be rolled over to the next period by Δ C B , which prevents infeasibility due to excessive CO2 emissions. The renewable portfolio standards are also implemented to improve renewable energy generation in (26). The unserved demand must be less than the demand, which is shown in (27). The nomenclature is listed in Abbreviations.

3. Case Study

According to the California Independent System Operator (CAISO), the available capacities of solar PV systems and wind turbine generators reached approximately 13 and 7 GW, respectively, as of 2020, which are large values in terms of renewable energy generation capacity. Hourly solar PV generation, wind power generation, and their curtailment data from the CAISO have been used for a case study in this paper [22].

3.1. Available Renewable Power and Electric Load

The available renewable power and electric load for each month are demonstrated by the box plots in Figure 2, where the loads are scaled down to fit the test system. The availability of solar and wind power is also scaled down on the basis of a 100 MW name plate unit. The maximum, minimum, and median values are represented in the figure. The bottom and top of the box indicate where the 25% and 75% points of the data, respectively, are located.
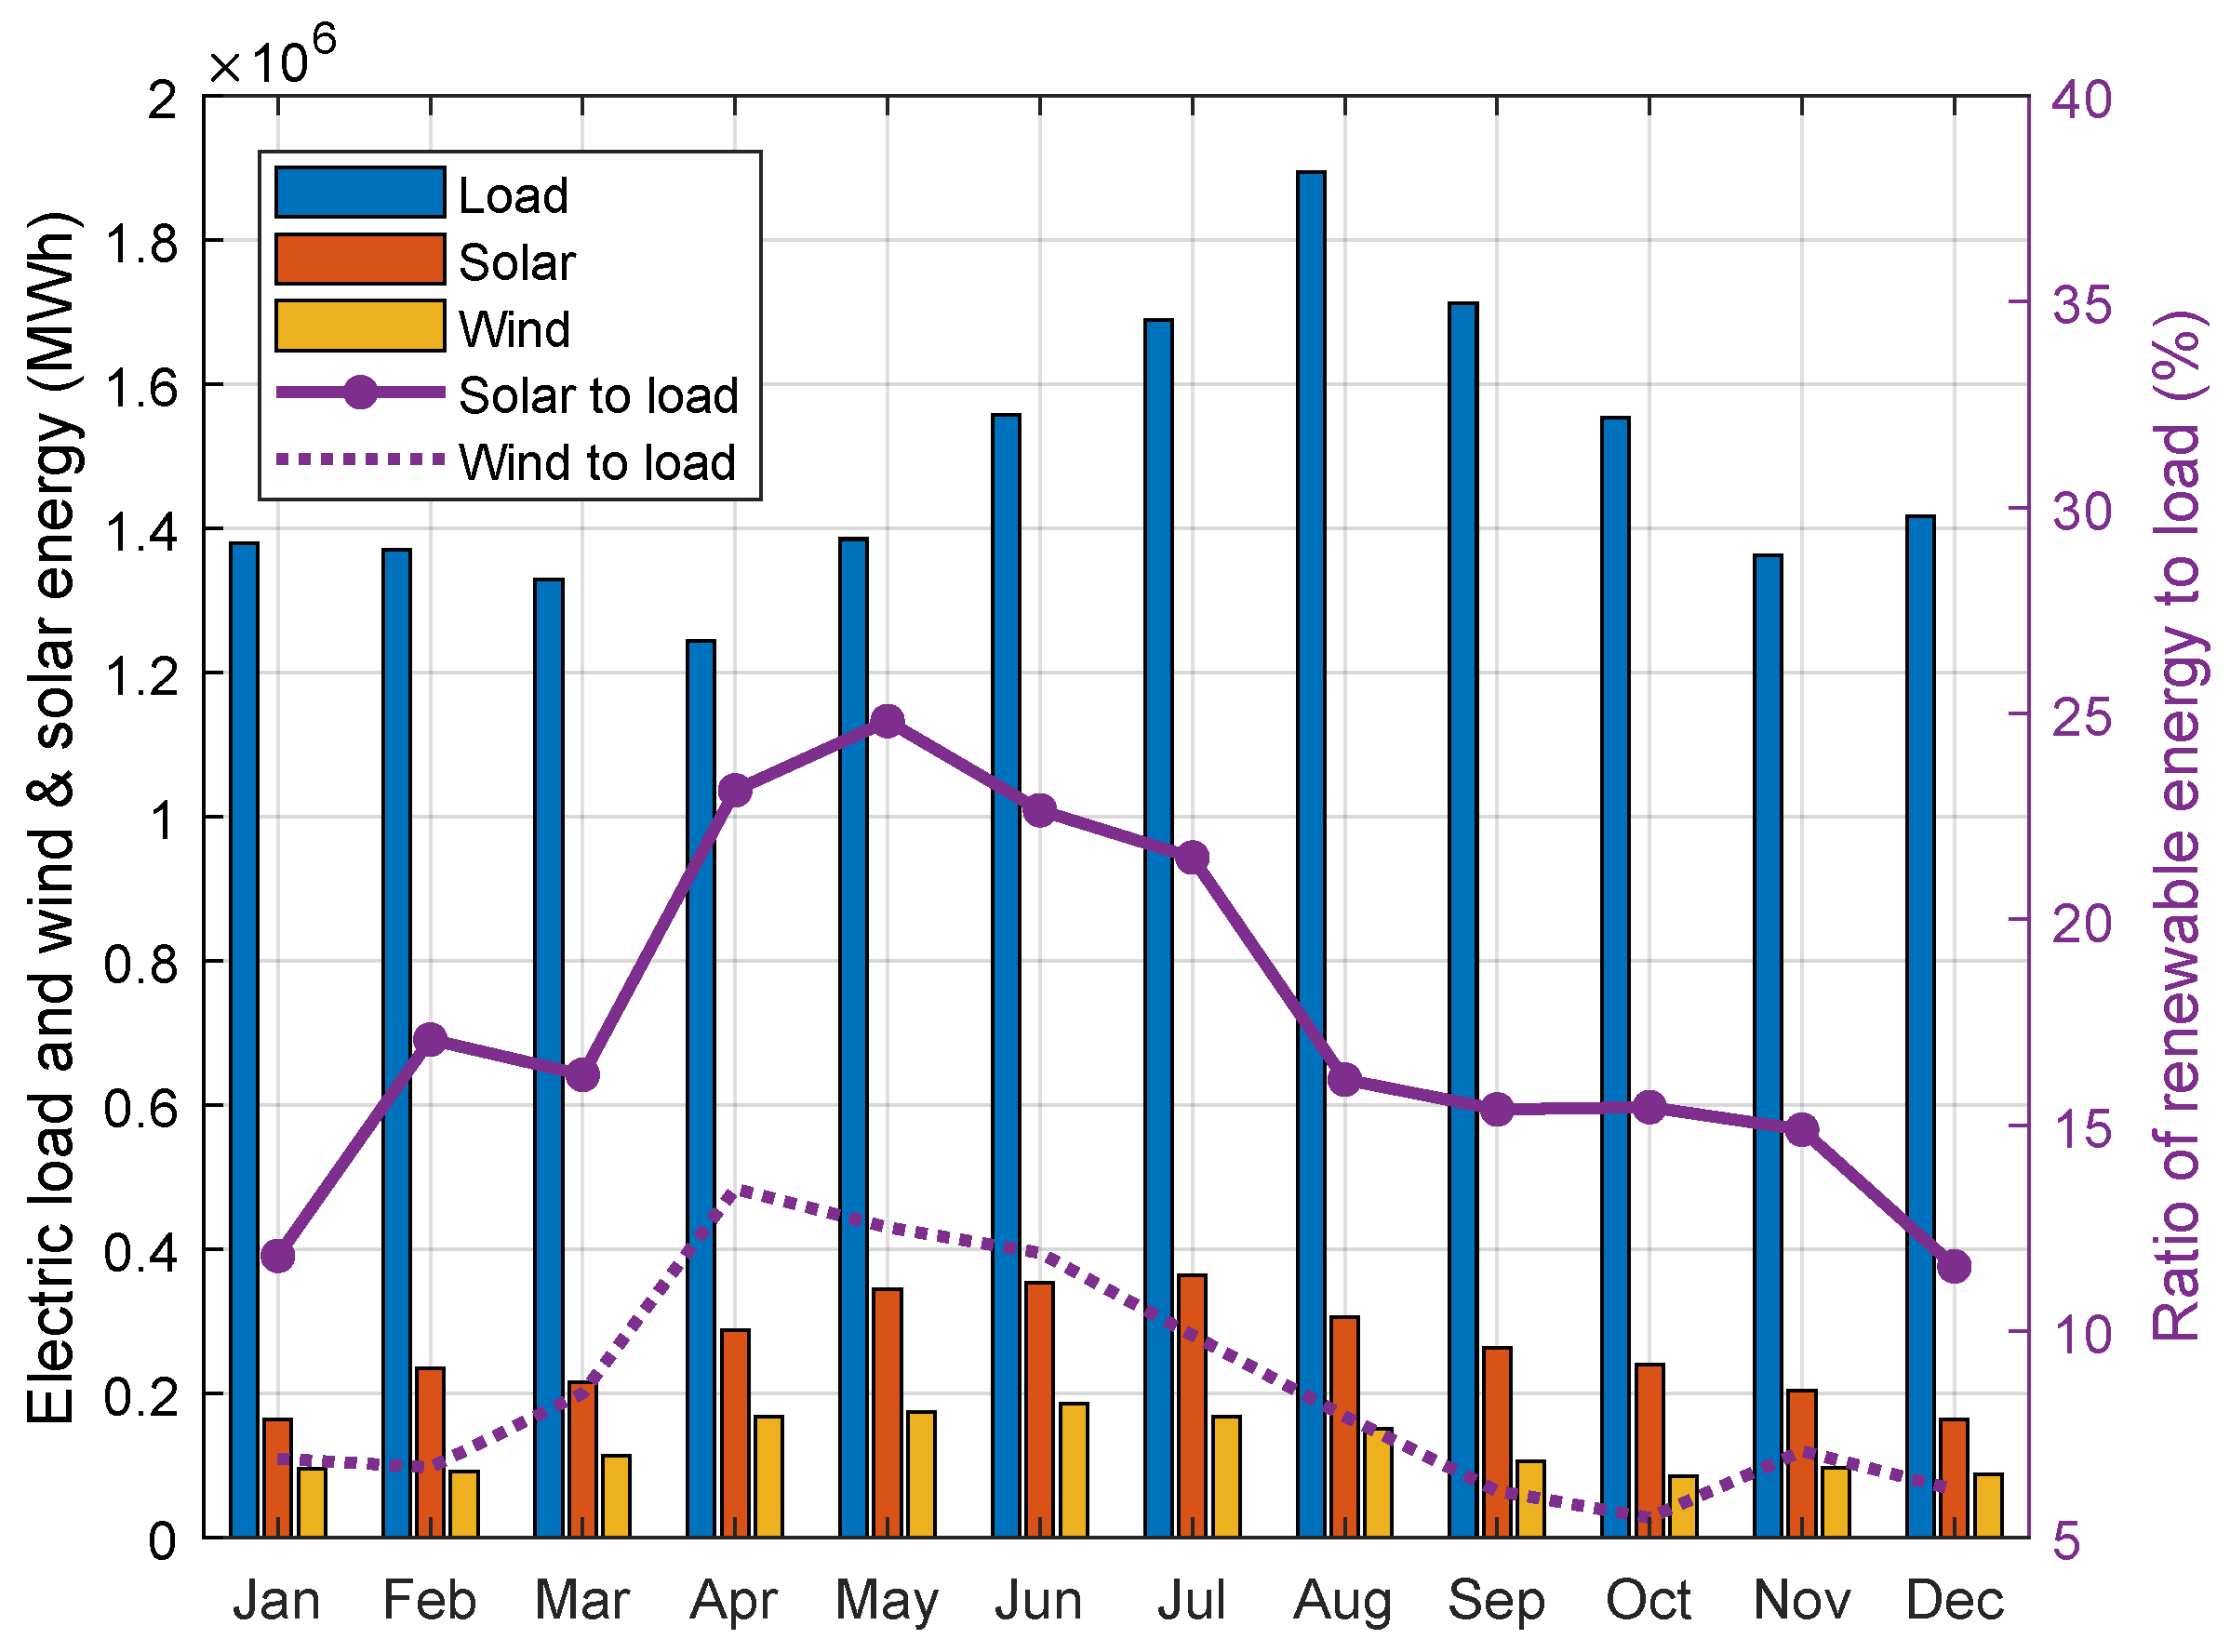
In Figure 3, the total load and wind and solar energy are illustrated. The ratio of renewable energy to the load is the highest in May and the lowest in December. Roughly speaking, curtailment is expected when the ratio is high; however, the actual curtailment depends not only on the available energy but also on the correlation between renewable energy availability and electric load, and some other aspects such as transmission congestion.

3.2. Test System and Simulation Conditions

Four types of ESSs were implemented to determine when and how much capacity of ESSs are needed for specific purposes. The ESSs colocated with wind farm or solar PV farms charge energy only from the farms and discharge the energy into the grid. These types of ESSs are intended to play a role that mitigates curtailment of renewable energy generation. Another type of ESS that is located at the bus with baseload generators is mainly supposed to provide flexibility to baseload generators that usually supply energy at the maximum output level. The other type of ESS at the load bus is aimed at providing flexibility to the load by absorbing or supplying power when the load level is high or low. However, these ESSs can be used to manage the power flowing in and out of the bus through the transmission lines as well.
A modified IEEE 118-bus system was applied as a test system, with assumed costs and operating conditions of the generators and transmission lines [23,24]. The transmission line capacity was adjusted up to 1000 MW to exclude the impact of transmission congestion. The reference peak load of the system was 4168 MW. In Table 1, the detailed data of the test system are provided. The ratio of the renewable energy generation capacity to the total generation capacity reaches approximately 30%. Compared with the reference peak load, the renewable energy generation capacity takes more than 50%.
The available capacity of ESSs is shown in Table 2. The round-trip efficiency and the duration of the ESSs are assumed to be 85% and 4 h, respectively. The investment cost of ESSs for the corresponding operating period is assumed to be approximately USD 2278/MWh, based on [25].

4. Simulation Results

The presented formulation was solved using GAMS/CPLEX 30.3.0 [26], and the average elapsed time in GAMS (General Algebraic Modeling System) for each run was 10,779 s when the ESSs were implemented. For the cases without operating ESSs, the average elapsed time was relatively shorter, at 656 s. The optimality gap was set to 0.1 throughout the simulations. The optimal ESS capacity needs, the commitment status of the baseload generators, and the operational schedules of the generators and ESSs for 4 weeks are presented for each month, and the contributions of the ESSs to the system operations are analyzed.

4.1. Optimal ESS Capacity Needs and Operations

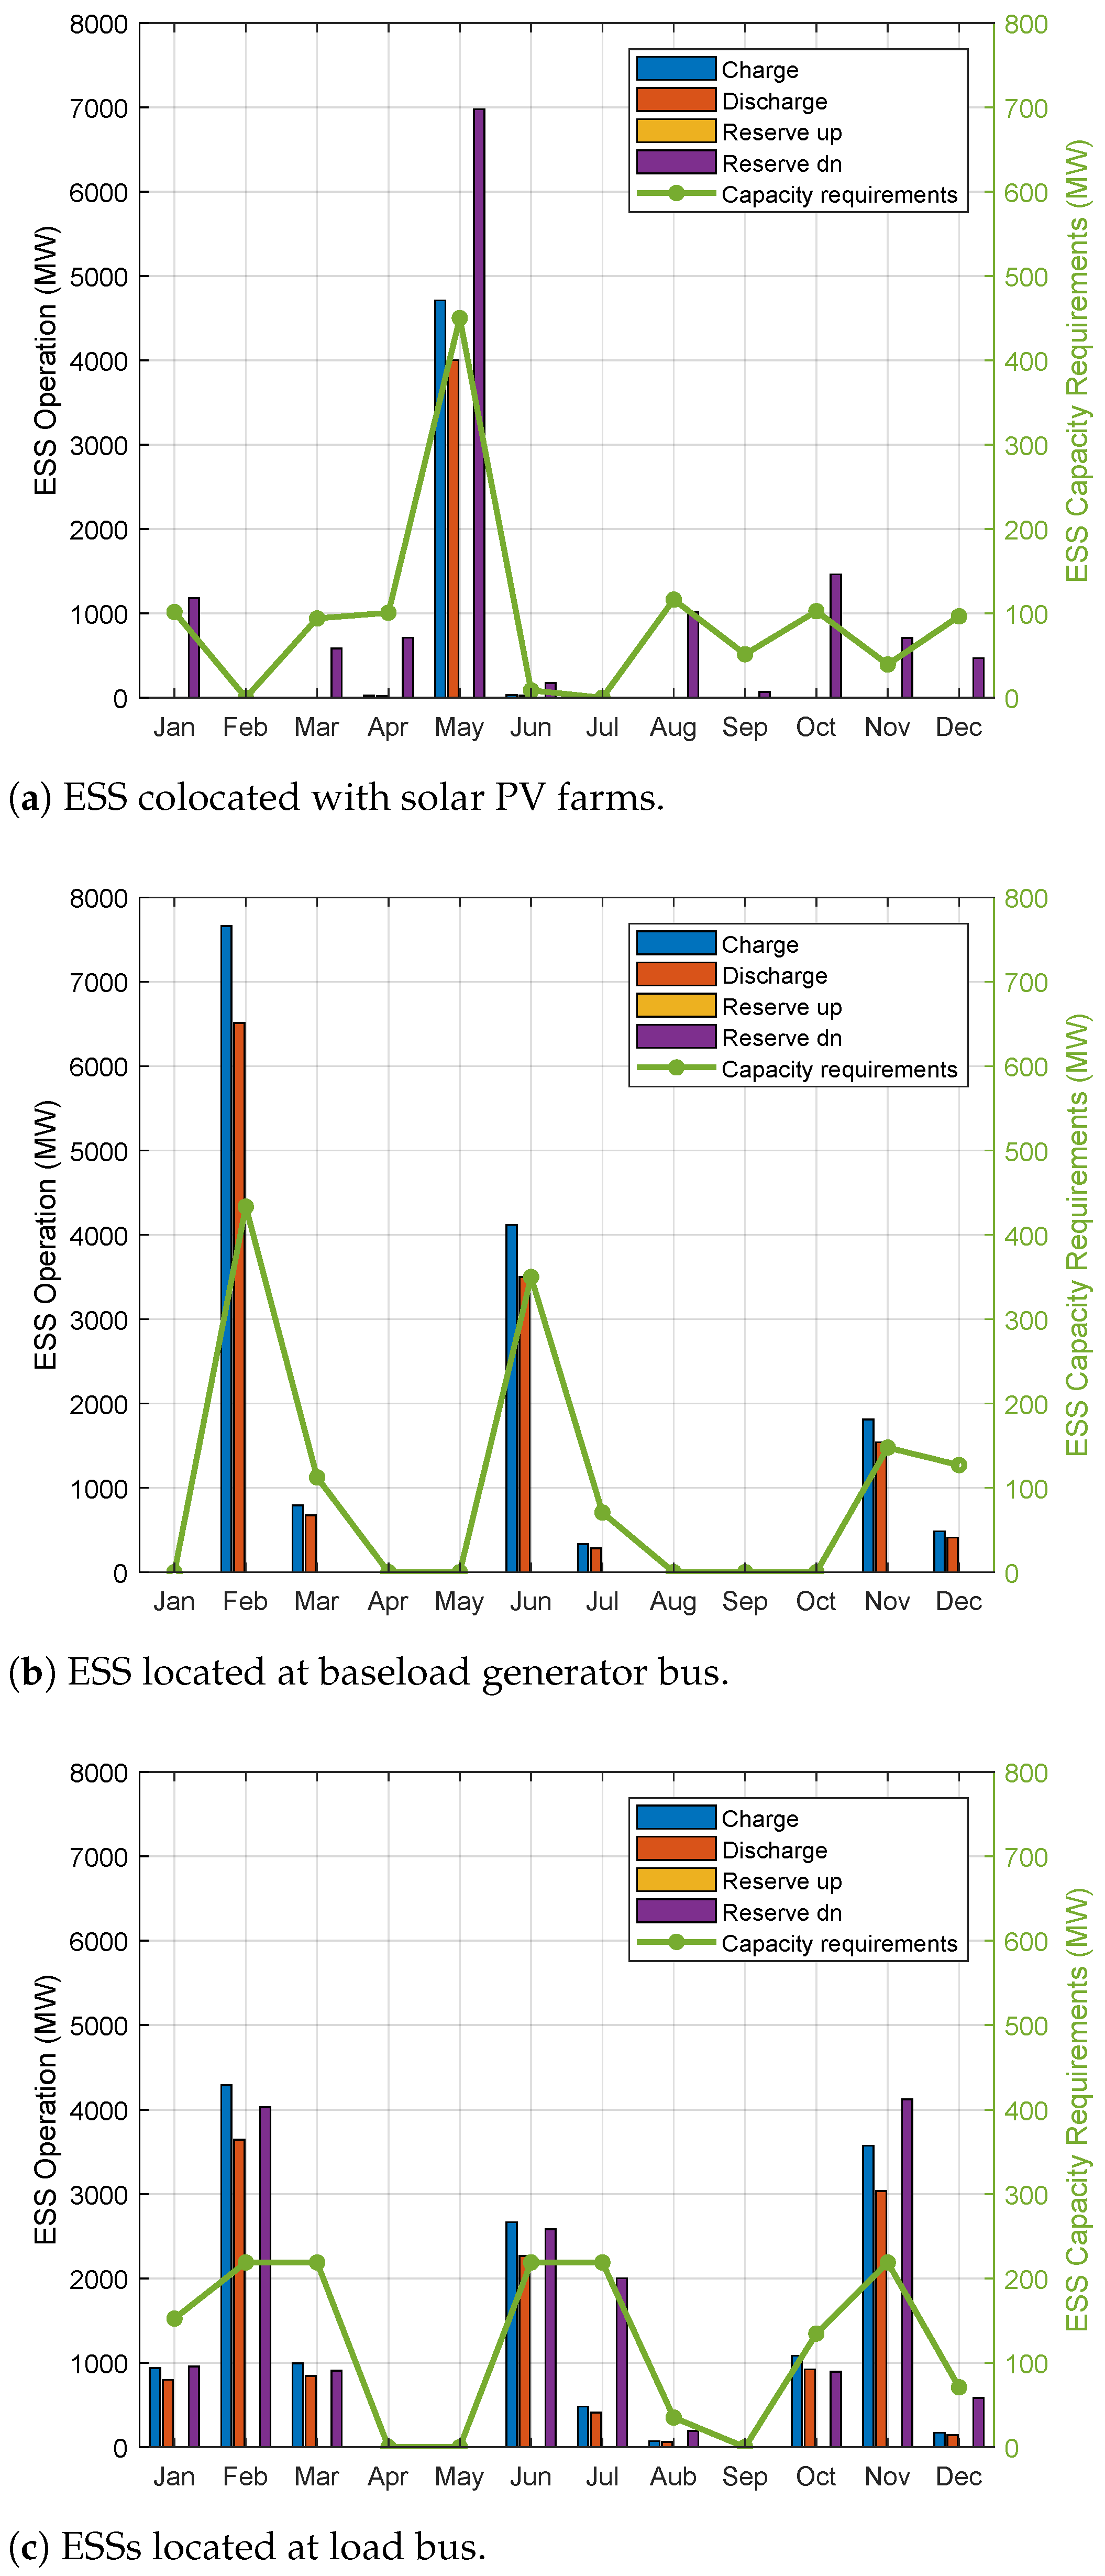
The optimal capacity needs for each type of ESS are illustrated in Figure 4. The sum of optimally charged and discharged power of the ESSs and the sum of reserve deployments for 12 months are depicted in Figure 5. The four types of ESSs are presented: the ESSs colocated with wind farms, the ESSs colocated with solar PV farms, the ESSs at the bus with baseload generators such as coal and nuclear power plants, and the ESSs at the load bus. The ESSs are assumed to be used mainly on renewable energy generation, baseload generation, and load sides, respectively. Curtailment of renewable energy generation was not allowed throughout the simulations when the ESSs were operated.
The largest capacity of ESSs colocated with solar PV farms was built in May when the available solar energy is large compared with the load. Curtailment of wind power generation did not occur, even when the ESSs were not operated; therefore, the capacity of the ESSs colocated with wind farms is not required. The capacity needs of the ESSs at the baseload generator bus are dominant in February and June, implying that flexibility of the ESSs is highly required when the baseload generators are operated. The ESSs are used to time-shift energy using charging and discharging operations or to provide reserves. Therefore, their roles can be assessed on the basis of their major utilization. Basically, the ESSs are not appropriate for providing the upward reserves in terms of optimal operations. In Figure 5a, the ESSs colocated with solar PV farms are mainly used for the downward reserve deployments. Exceptionally, in May, solar power was charged and discharged due to the high availability of renewable energy compared with the electricity demand level, so the ESSs time-shifted the solar PV generation to mitigate curtailment. The required capacity of the ESSs was 450.15 MW, where 4711 MWh energy from solar PVs was charged and the total 6979 MW downward reserves were deployed by the ESSs in May.
The ESSs located at the bus with baseload generators were used for charging and discharging the energy for the time-shift of the baseload generation in Figure 5b. In February, May, and November, the electricity demand levels were relatively low to accommodate all the available energy from solar PV and wind farms. Because the curtailment of renewable energy generation is not allowed, a decision must be made whether the baseload generators are turned on or off. The baseload generators are favorable when the load level (or net load when renewables exist) is far above their output levels and does not change frequently. Otherwise, flexible generators such as gas turbine generators are more favorable for providing reserves and energy. The ESSs with baseload generators do not provide reserves, showing that ESSs play a role in providing flexibility by time-shifting the baseload generation. The ESSs at the load buses store energy and provide downward reserves, as shown in Figure 5c. Like with the ESSs at the baseload generator buses, charging and discharging operations are actively conducted in February, June, and November, providing flexibility on the load side. In July, the ESSs mainly provide downward reserves.

4.2. Impact of ESS Operations on Flexible Generation Capacity

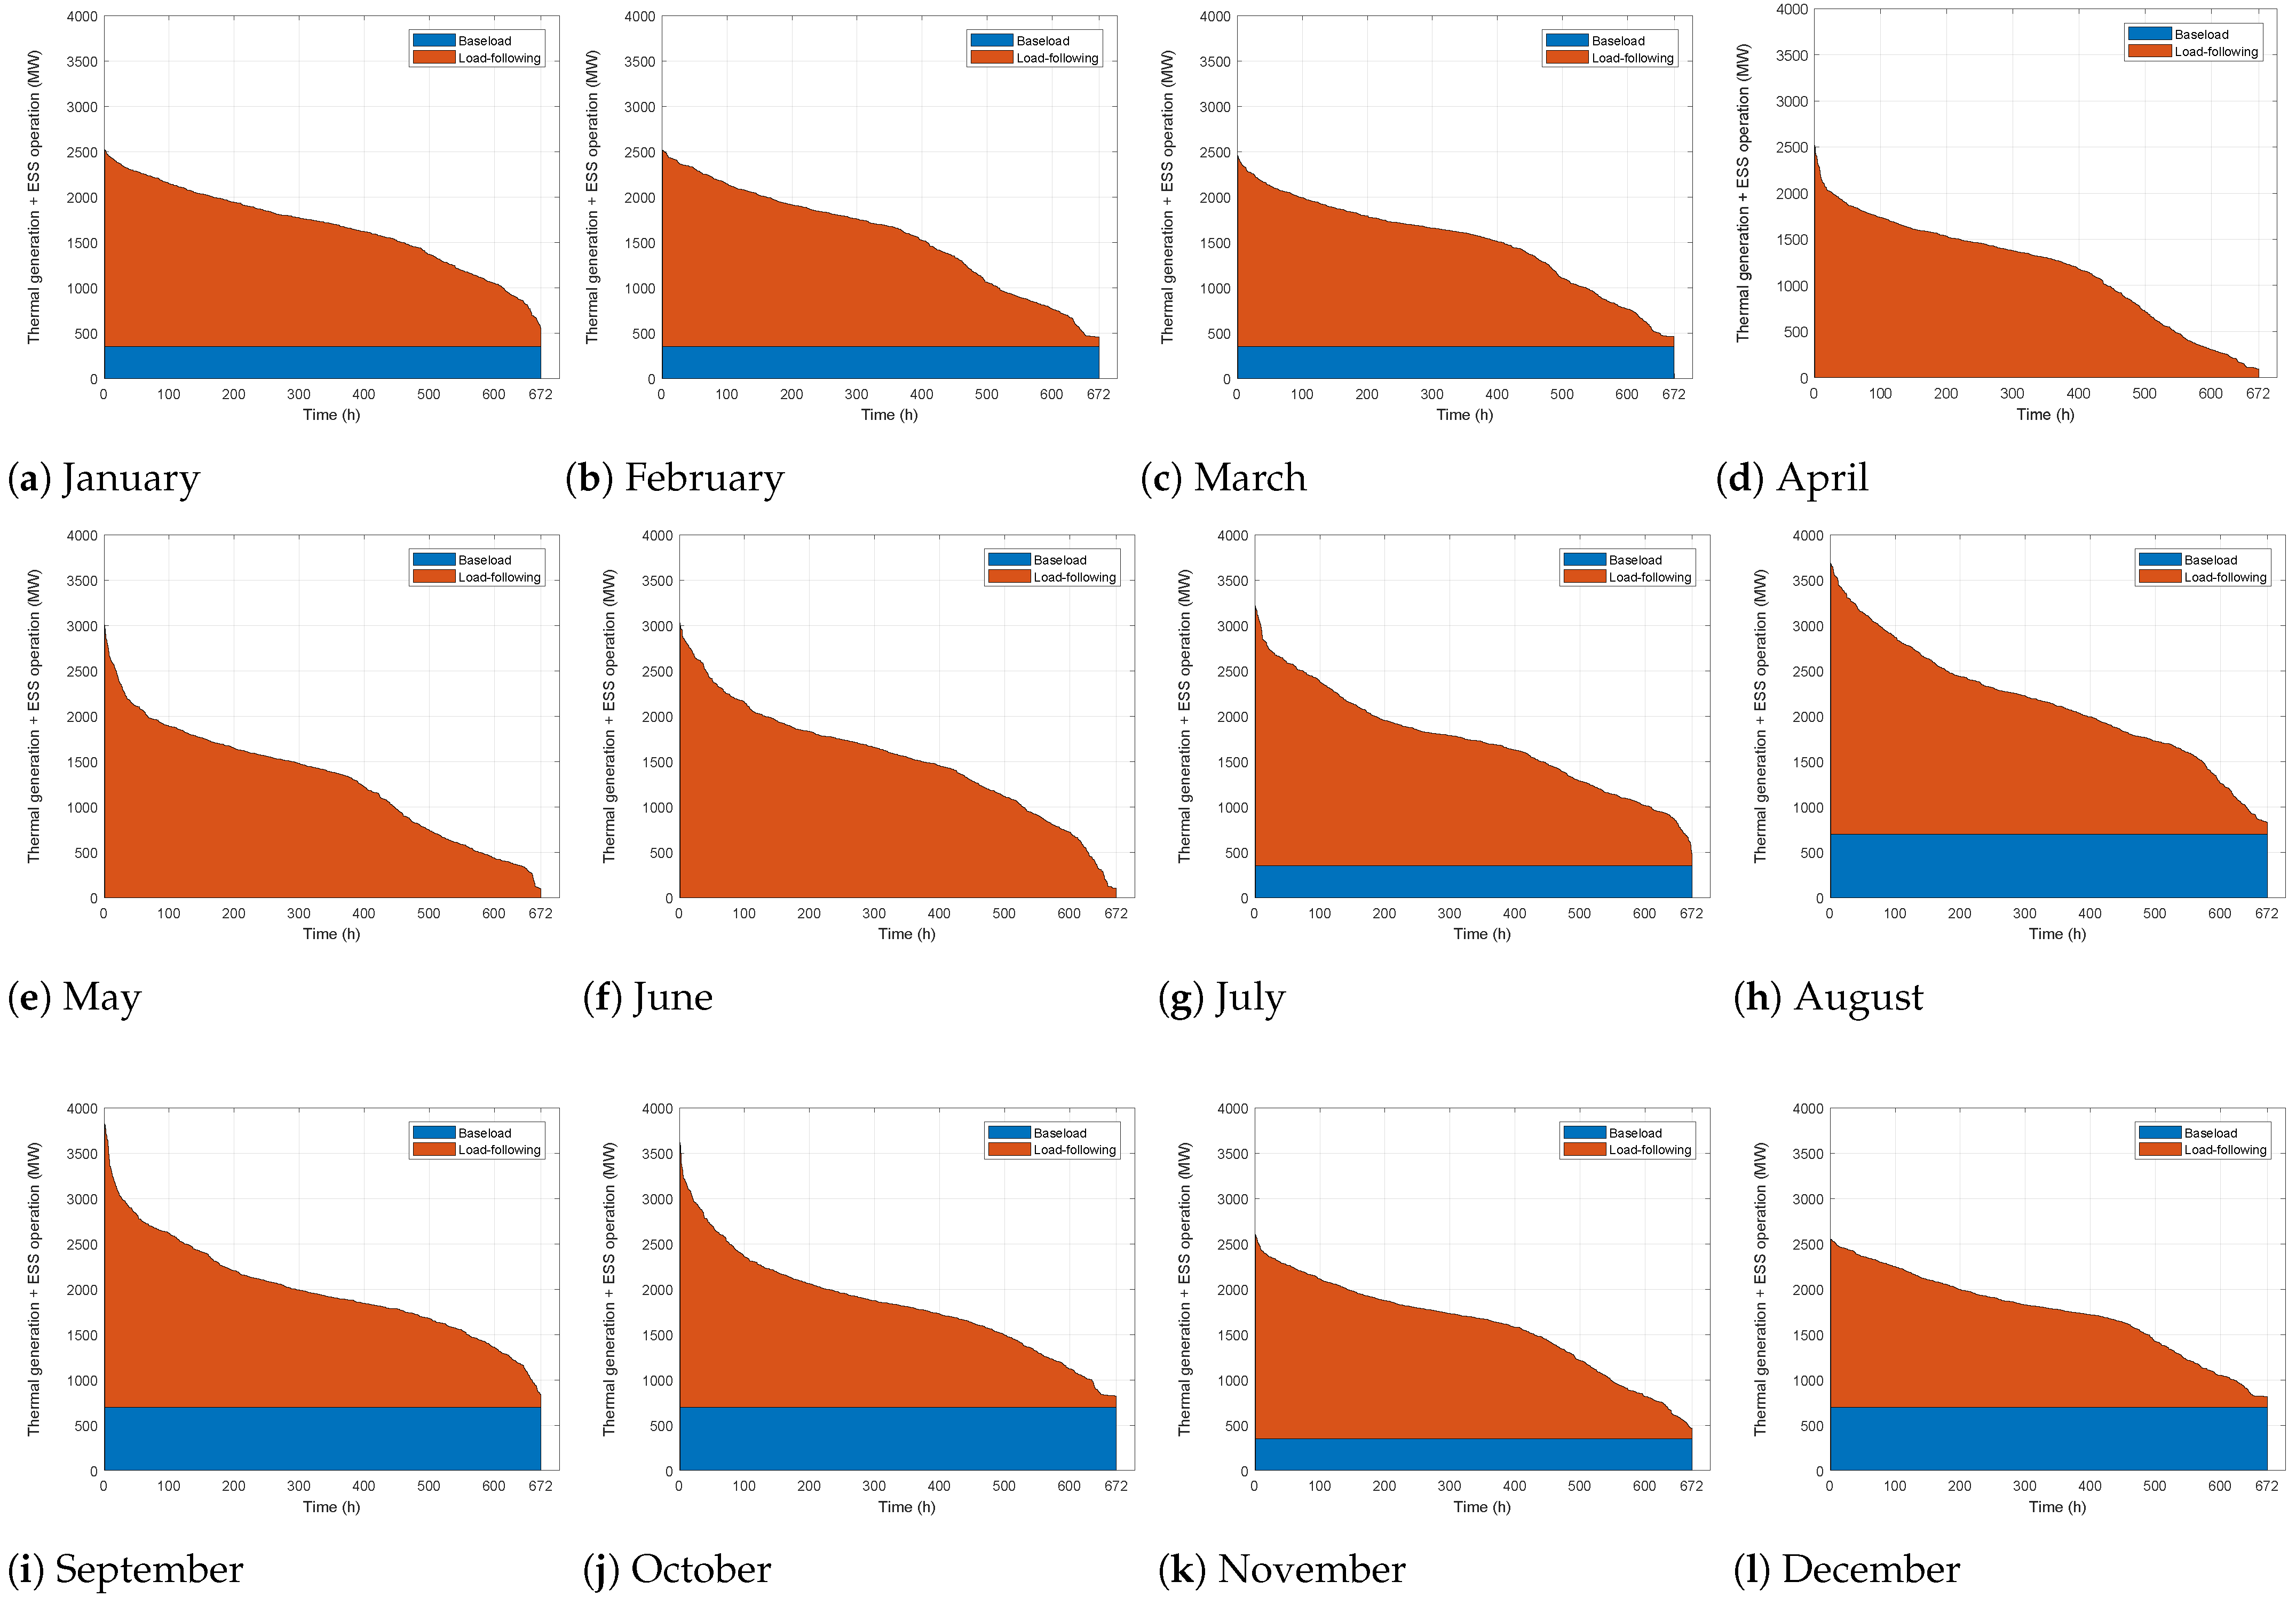
Power generation by the baseload generators and thermal generators with flexibility when the ESSs are not accommodated is shown in Figure 6, where curtailment of renewable energy generation is allowed with high penalty costs to obtain feasible solutions. The baseload generators were not operated in April, May, and June. The ratios of renewable energy to the load are high in these months, and the baseload generators tend to be turned off when the ratio is high. The baseload generators are designed and operated around their maximum capacity without changing the outputs frequently for cost-efficiency, implying that the baseload generators do not have ramping or flexible capability and do not provide reserves. Therefore, flexible load-following generators such as gas turbine generators that can quickly change their output levels within ramp rates are more appropriate to use when the need for ramping up or down the output of the generator is frequent and significant. With this feature, the baseload generators are turned off because a more flexible capacity is required as the proportion of renewable resources in the system increases. However, the baseload generators can be turned on in some cases depending on the correlation between renewable energy generation and the load.
The thermal generation and the charged and discharged power of the ESSs located at the baseload generator and load buses are shown in Figure 7, where the power of the ESSs at the renewable energy generation buses is not included. For one particular case in May, the flexible capacity of the thermal generators was required up to 3004 MW when the ESSs were not operated; however, this capacity decreased to 2404 MW by operating 450 MW ESSs colocated with solar PV farms. The baseload generation capacity was used up to 350 MW.
When comparing Figure 6 to Figure 7, it is noticed that more baseload generators are committed with the ESS operation. The flexible capacity needs from the thermal generators decrease by providing reserves and by committing baseload generators using the ESSs. The ESSs time-shift baseload generation when the net load including energy discharged by the ESSs at the renewable generation sides is lower than the baseload generation level.
It can be said that the commitment of baseload generators with the ESSs providing flexibility and reserves is more economical than the use of flexible thermal generators.

4.3. Renewable Energy Generation and Curtailment

The total available power from the solar PV and wind farms for 4 weeks is listed in Table 3. In addition, the curtailed energy when the ESSs were not operated is presented. When the ESSs are not operated, the curtailment of renewable energy generation is allowed, with high penalty costs. The penetration level of wind and solar energy for each month became slightly worse when the ESSs were not operated because curtailment of renewable energy generation is more economical even though high penalty costs are incurred. In February and March, more curtailment of solar PV generation occurred compared with other months when the ESSs were not operated, and the penetration level with the ESSs was more than 35% in April and May, regardless of operating the ESSs.

4.4. Cost Analysis

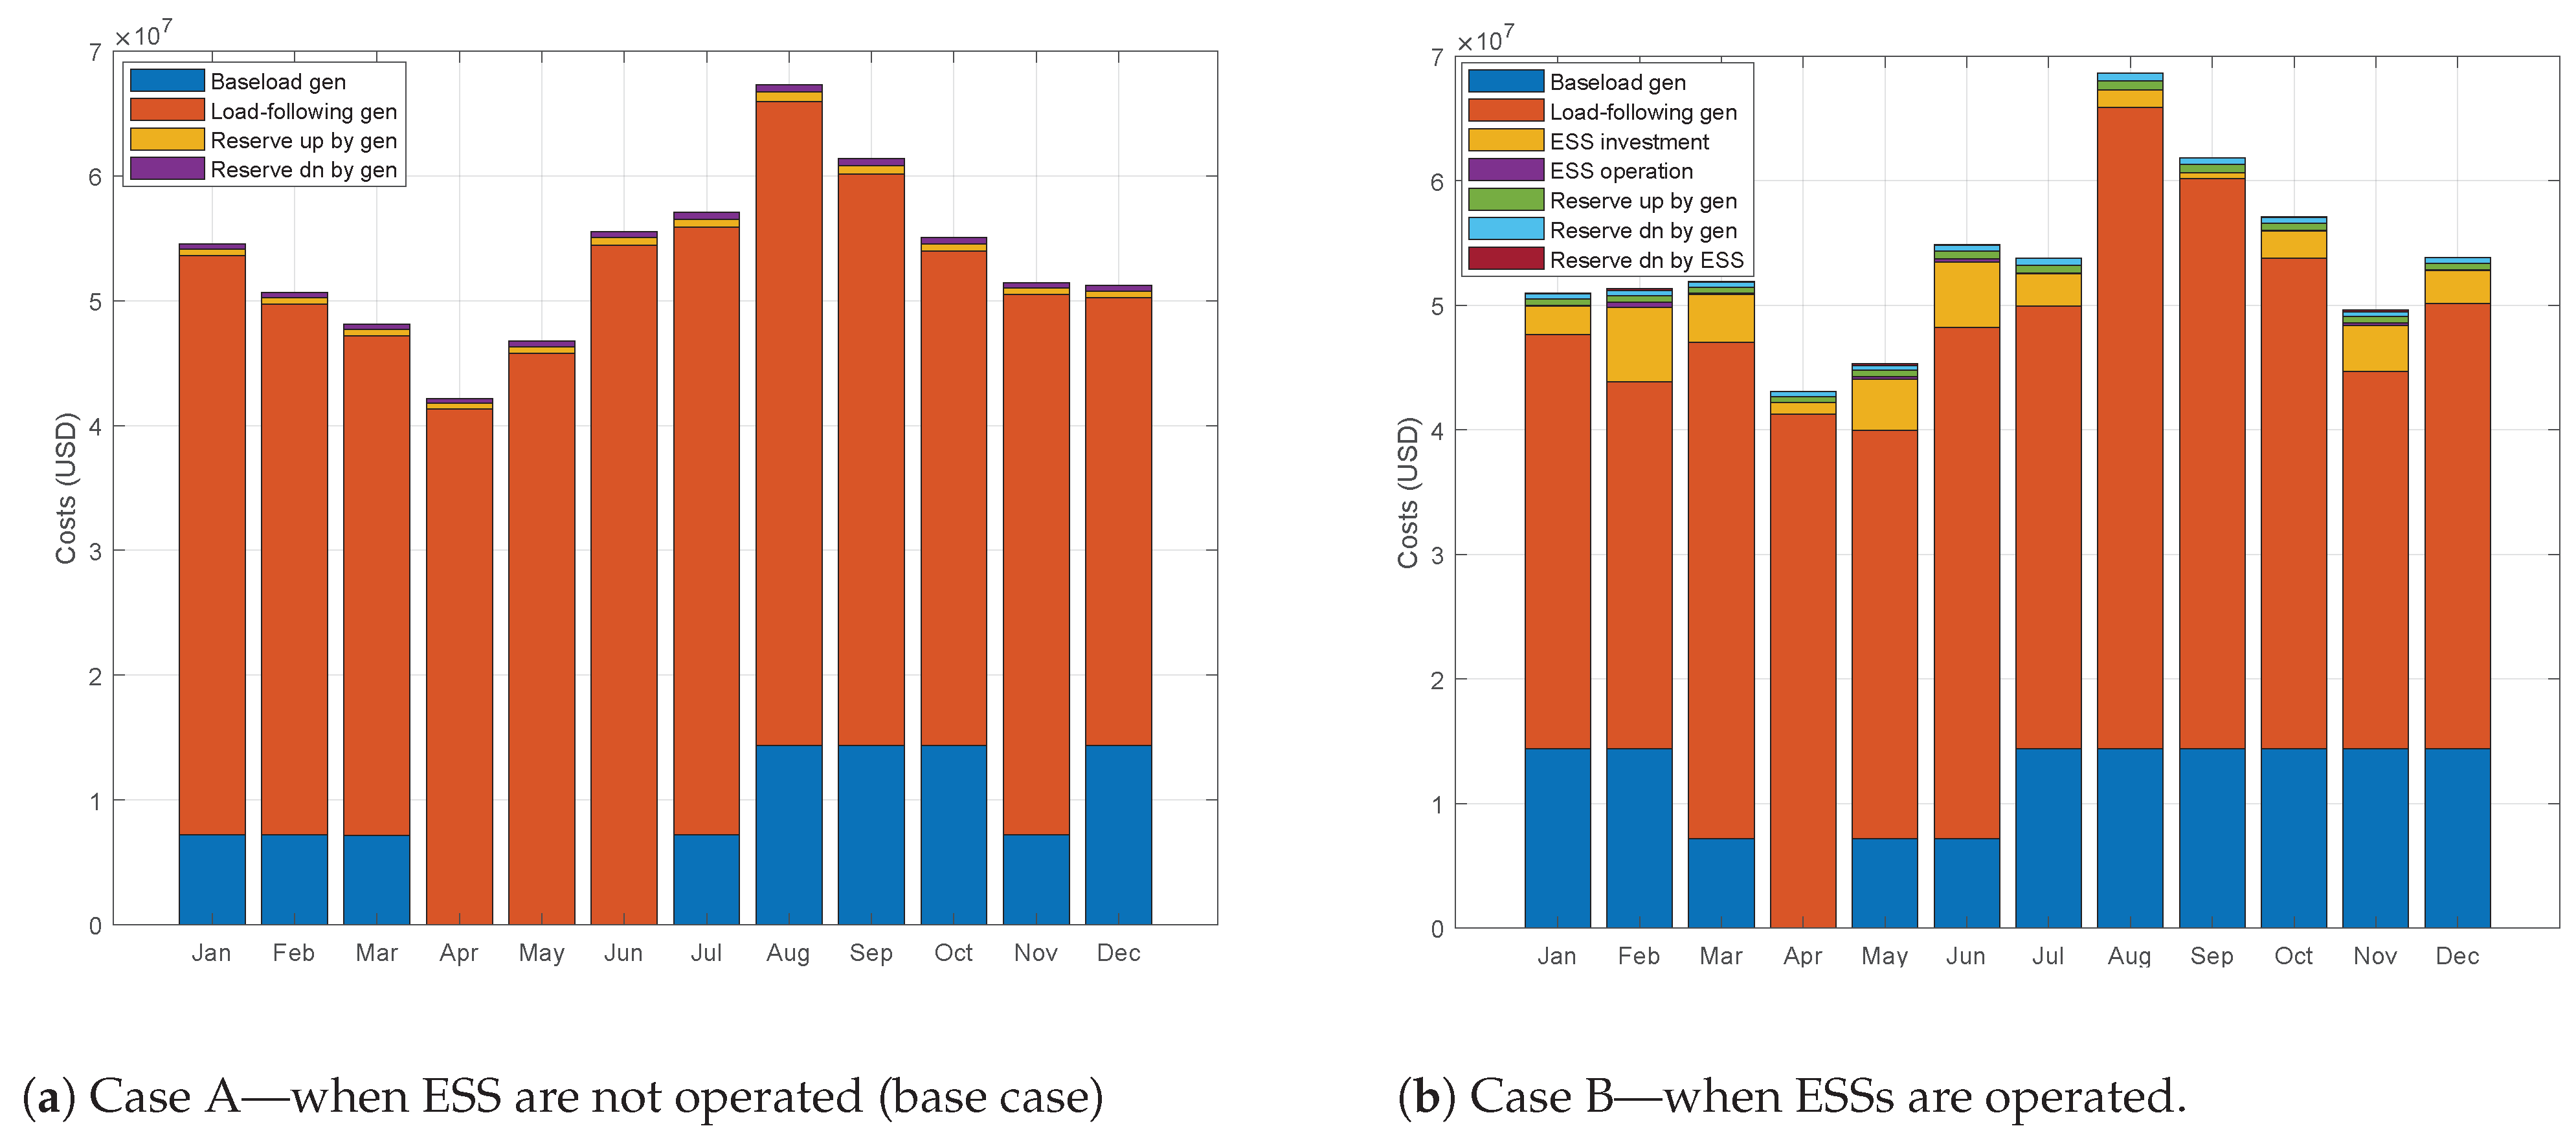
To see how the total costs change when the ESSs are operated, the broken-down costs for generation, reserves, building, and operation by the ESSs are illustrated in Figure 8. The detailed data for the figure are provided in Appendix A, where the unit costs for charging, discharging, and reserves by the ESSs are assumed to be USD 20 per charging or discharging. When the ESSs are not operated, the generation costs by the load-following generators and the upward reserve costs are relatively high compared with those when the ESSs are operated. The ESSs make the baseload generators run and provide flexible capability, replacing expensive load-following generators. Instead, the investment and operating costs of the ESSs are incurred. In general, the costs decrease when operating the ESSs; however, the costs increase when curtailment is observed in the case where the ESSs are not operated. These costs include the additional investment and operating costs of the ESSs to remove curtailment.

4.5. Analysis of the Roles in a Grid System

In the previous subsections, the optimal capacity needs and operations of the ESSs are presented. The major roles of the ESSs can be estimated for each month based on the capacity needs and utilization of the ESSs. The ESSs enable the baseload generators to be turned on by providing flexible capacity. The baseload generators cannot change their output levels frequently and are operated around the maximum output level for maximum efficiency; therefore, they do not provide ramp-up and ramp-down capability. In this context, when the electricity demand level is very low and there is a large amount of renewable energy generation, the baseload generators are possibly turned off because they cannot increase or decrease the outputs freely according to the variability of renewable resources. Moreover, the baseload generators are not prioritized to be committed for reserve deployments because of their inflexible characteristics. This situation leads to increased generation costs by turning on expensive thermal generators that provide flexibility, such as gas turbine generators. The baseload generators in a power system with a large amount of renewable resources require ESSs; otherwise, cost-effectiveness may be worse. Baseload generators generally have high building costs and relatively low fuel costs; therefore, they are more cost-effective when operated with a high capacity factor. Obviously, more capacity of baseload generators is committed with the ESS operations in CAISO. The charging operation of the ESSs occurs on the baseload generation and load sides during the time when the net load is very low and the thermal generation by the baseload generators is even more than the net load. This situation indicates that these ESSs are used to provide flexibility to the baseload generators rather than to shave the peak load.

5. Conclusions and Discussion

In this paper, the specified roles of ESSs based on their optimal capacity needs and operational schedules are investigated. A mathematical simulation model for optimal capacity needs and operational schedules of the ESSs to provide both energy and reserves is formulated using mixed-integer linear programming. The model aims to simulate a 4-week operation of the generators and ESSs. The long-term model comprises unit commitment decisions for the baseload generators and ramp-up and ramp-down constraints that are generally applied to a short-term operational model.
To verify what specific roles the ESSs play depending on their position, the ESSs were placed at four different locations in the system: at the site with solar PV farms, at the site with wind farms, at the baseload generator buses, and at the load buses. The ESSs at each location are expected to contribute mainly to the renewable energy generation side, baseload generation side, and load side, respectively. The ESSs colocated with solar PV farms generally play the role of reserve provider, particularly for downward reserves, and time-shift renewable energy generation in a particular month. Conversely, the ESSs at the baseload generator bus time-shift the energy of the baseload generators, and the baseload generators can be committed even when the net load is exceptionally low. This result implies that the ESSs enable the baseload generators to be committed by providing flexibility when the penetration level of renewable energy is high. Otherwise, the baseload generators must be turned off. From the simulation results, the contribution of the ESSs at the different positions can be categorized into three: time-shifting renewable energy generation, providing reserves, and adding flexibility to the baseload generators.

Funding

This work was supported by the National Research Foundation of Korea (NRF) grant funded by the Korea government (MSIT) (No. 2020R1F1A1064957).

Data Availability Statement

Data are contained within the article.

Conflicts of Interest

The author declares no conflict of interest.

Abbreviations

The abbreviations and nomenclature are provided in this section.
Sets/Indices
t T Time intervals, T = { 1 , 2 , , T }
g G All generators
c G c , b G b Conventional and baseload generators
r G r Renewable energy generators
w G w , s G s Wind generators and solar PV systems
e E Energy storage systems (ESSs)
k E g ESSs on baseload generation side, E g E
m E l ESSs on load side, E l E
i I Electric buses
d D Electric load
l L Transmission lines
Data/Parameters
E B c o s t ESS investment cost ($/MWh)
R c o s t c Reserve costs for thermal generators (USD/MW)
R E c o s t e Reserve costs for ESSs (USD/MW)
G c o s t g Generation cost (USD/MWh)
U D c o s t Penalty cost for unserved demand (USD/MWh)
E S S c o s t ESS charging and discharging cost (USD/MWh)
C B c o s t Penalty cost for excess of carbon emissions (USD/metric ton)
R P S c o s t Penalty cost for shortage of RPS requirement (USD/MWh)
R P S r a t e RPS requirements rate to the demand
hOperating hour for time interval (h)
Δ t Duration of ESS (h)
Λ c i , Λ r i Conventional generator-node, renewable farm-node incidence matrix
Λ l i Transmission line-node incidence matrix
Λ d i Demand-node incidence matrix
Λ e b , Λ e w , Λ e s Storage-baseload generator, storage-wind farm, and storage-solar PVs incidence matrices
Λ m i , Λ k i Storage at load-node, storage at generator bus-node incidence matrices
δ d Load distribution factor for demand, d
ϵ w Solar power distribution factor for solar PV farm, w
γ d Wind power distribution factor for wind farm, w
r t u p , r t d n Upward and down reserve requirements at time t (MW)
r u c , r d c Ramp up and down rates for generator c (MW/h)
P c m a x , P b m i n Maximum generation and minimum generation level for c and b (MW)
s p t , w p t Available solar and wind power at time t (MW)
E S S e m a x Maximum capacity of ESS, e (MW)
e m i t c C O 2 emissions rate for generator c (metric ton/MWh)
f l m a x Maximum power flow on line l (MW)
X l Reactance of line l (p.u.)
c b c a p CO2 emission cap (metric ton)
Q e 0 Stored energy in ESS, e, at time t = 0 (MWh)
η Round-trip efficiency of ESS
Binary decision variables
U b Unit commitment for baseload generators
Continuous decision variables
E S S e Capacity needs of ESS, e (MW)
P t g , P t c , P t r Power generation from g, c, and r at time t (MW)
P R t r , R P t s , R P t w Renewable power injection from r, s, and w at time t (MW)
R ¯ t c , R ̲ t c Upward and downward reserves of generator c at time t (MW)
R E ¯ t e , R E ̲ t e Upward and downward reserves of ESS, e, at time t (MW)
Q t e Stored energy in ESS, e [MWh]
Δ Q t e + , Δ Q t e Charging and discharging power of ESS, e, at time t (MW)
f t l Power flow on transmission line l (MW)
θ t i Bus voltage angle at bus i (radian)
U D t d Unserved electricity demand (MW)
Δ C B ω Excess of CO2 emissions (metric ton)
Δ R P S Shortage of renewable generation (MWh)

Appendix A

The detailed costs for electricity generation using conventional thermal generators and the costs of operating ESSs are listed in Table A1. The cost changes between two cases, with and without ESS operations, are also compared.
Table A1. Total costs of generators and ESSs for energy and reserves in each month.
MonthWithout ESS Operation (Thousand USD)With ESS Operation (Thousand USD)Cost
Change
(%)
Baseload GenLoad-
Following Gen
Res. Up by GenRes. dn by GenBaseload GenLoad-
Following Gen
ESS InvestESS Oper.Res. Up by GenRes. dn by GenRes. dn by ESSs
Jan719546,40753343814,39033,26123143552142943−6.56
Feb719542,51552343614,39029,49859444425133961751.36
Mar718440,003507423718439,835387766507415347.90
Apr041,311473395041,2769181473392142.12
May045,775535440719532,7864102174521408140−3.05
Jun054,436619495719541,027526425259847585−1.18
Jul719548,68266353714,39035,53626403064352649−5.72
Aug14,39051,57375860214,39051,51213803757597241.99
Sep14,39045,78667254414,39045,783469067254410.76
Oct14,39039,57560049414,39039,406216140600483473.76
Nov720543,27552243314,41130,2713700199511403133−3.51
Dec14,39035,86153945114,39035,747268424539442355.11
Total93,532535,20069445688136,711455,93635,4531267685455107800.18

References

  1. Sandia National Laboratories. Energy Storage for the Electricity Grid: Benefits and Market Potential Assessment Guide; Sandia National Laboratories: Albuquerque, NM, USA; Livermore, CA, USA, 2010. [CrossRef]
  2. Evans, A.; Strezov, V.; Evans, T.J. Assessment of utility energy storage options for increased renewable energy penetration. Renew. Sustain. Energy Rev. 2012, 16, 4141–4147. [Google Scholar] [CrossRef]
  3. Zayed, M.E.; Kabeel, A.; Shboul, B.; Ashraf, W.M.; Ghazy, M.; Irshad, K.; Rehman, S.; Zayed, A.A. Performance augmentation and machine learning-based modeling of wavy corrugated solar air collector embedded with thermal energy storage: Support vector machine combined with Monte Carlo simulation. J. Energy Storage 2023, 74, 109533. [Google Scholar] [CrossRef]
  4. Yao, L.; Yang, B.; Cui, H.; Zhuang, J.; Ye, J.; Xue, J. Challenges and progresses of energy storage technology and its application in power systems. J. Mod. Power Syst. Clean Energy 2016, 4, 519–528. [Google Scholar] [CrossRef]
  5. Luo, X.; Wang, J.; Dooner, M.; Clarke, J. Overview of current development in electrical energy storage technologies and the application potential in power system operation. Appl. Energ. 2015, 137, 511–536. [Google Scholar] [CrossRef]
  6. National Renewable Energy Laboratory. The Role of Energy Storage with Renewable Electricity Generation. Available online: https://www.nrel.gov/docs/fy10osti/47187.pdf (accessed on 12 January 2024).
  7. Roberts, B.P.; Sandberg, C. The Role of Energy Storage in Development of Smart Grids. Proc. IEEE 2011, 99, 1139–1144. [Google Scholar] [CrossRef]
  8. National Renewable Energy Laboratory. The Value of Energy Storage for Grid Applications. Available online: https://www.nrel.gov/docs/fy13osti/58465.pdf (accessed on 12 January 2024).
  9. Oudalov, A.; Chartouni, D.; Ohler, C.; Linhofer, G. Value Analysis of Battery Energy Storage Applications in Power Systems. In Proceedings of the 2006 IEEE PES Power Systems Conference and Exposition, Atlanta, GA, USA, 29 October–1 November 2006. [Google Scholar] [CrossRef]
  10. Bitaraf, H.; Rahman, S. Reducing Curtailed Wind Energy Through Energy Storage and Demand Response. IEEE Trans. Sustain. Energy 2018, 9, 228–236. [Google Scholar] [CrossRef]
  11. Cleary, B.; Duffy, A.; O’Connor, A.; Conlon, M.; Fthenakis, V. Assessing the Economic Benefits of Compressed Air Energy Storage for Mitigating Wind Curtailment. IEEE Trans. Sustain. Energy 2015, 6, 1021–1028. [Google Scholar] [CrossRef]
  12. Jafari, M.; Botterud, A.; Sakti, A. Decarbonizing power systems: A critical review of the role of energy storage. Renew. Sust. Energ. Rev. 2022, 158, 112077. [Google Scholar] [CrossRef]
  13. Levin, T.; Bistline, J.; Sioshansi, R.; Cole, W.J.; Kwon, J.; Burger, S.P.; Crabtree, G.W.; Jenkins, J.D.; O’Neil, R.; Korpøas, M.; et al. Energy storage solutions to decarbonize electricity through enhanced capacity expansion modelling. Nat. Energy 2023, 8, 1199–1208. [Google Scholar] [CrossRef]
  14. Xu, B.; Wang, Y.; Dvorkin, Y.; Fernández-Blanco, R.; Silva-Monroy, C.A.; Watson, J.P.; Kirschen, D.S. Scalable Planning for Energy Storage in Energy and Reserve Markets. IEEE Trans. Power Syst. 2017, 32, 4515–4527. [Google Scholar] [CrossRef]
  15. Tang, Z.; Liu, Y.; Wu, L.; Liu, J.; Gao, H. Reserve Model of Energy Storage in Day-Ahead Joint Energy and Reserve Markets: A Stochastic UC Solution. IEEE Trans. on Smart Grid 2021, 12, 372–382. [Google Scholar] [CrossRef]
  16. Byrne, R.H.; Silva-Monroy, C.A. Potential revenue from electrical energy storage in the Electricity Reliability Council of Texas (ERCOT). In Proceedings of the 2014 IEEE PES General Meeting, National Harbor, MD, USA, 27–31 July 2014. [Google Scholar] [CrossRef]
  17. Denholm, P.; Hand, M. Grid flexibility and storage required to achieve very high penetration of variable renewable electricity. Energy Policy 2011, 39, 1817–1830. [Google Scholar] [CrossRef]
  18. Nikoobakht, A.; Aghaei, J.; Shafie-Khah, M.; Cataláo, J.P.S. Assessing Increased Flexibility of Energy Storage and Demand Response to Accommodate a High Penetration of Renewable Energy Sources. IEEE Trans. Sustain. Energy 2019, 10, 659–669. [Google Scholar] [CrossRef]
  19. Troy, N.; Denny, E.; O’Malley, M. Base-Load Cycling on a System With Significant Wind Penetration. IEEE Trans. Power Syst. 2010, 25, 1088–1097. [Google Scholar] [CrossRef]
  20. Bertsimas, D.; Tsitsiklis, J.N. Introduction to Linear Optimization; Athena Scientific: Belmont, MA, USA, 1997. [Google Scholar]
  21. Wolsey, L. Integer Programming; John Wiley & Sons, Inc.: Hoboken, NJ, USA, 1998. [Google Scholar]
  22. California Independent System Operator. Available online: www.caiso.com (accessed on 12 January 2024).
  23. IEEE 118-Bus. Available online: http://motor.ece.iit.edu/data/JEAS_IEEE118.doc (accessed on 12 January 2024).
  24. Illinois Center for a Smarter Electric Grid (ICSEG). IEEE 118-Bus System. Available online: https://icseg.iti.illinois.edu/ieee-118-bus-system/ (accessed on 12 January 2024).
  25. National Renewable Energy Laboratory. Cost Projections for Utility-Scale Battery Storage: 2021 Update. Available online: https://www.nrel.gov/docs/fy21osti/79236.pdf (accessed on 12 January 2024).
  26. GAMS Documentation 33. Available online: https://www.gams.com/latest/docs/S_CPLEX.html (accessed on 12 January 2024).
Figure 1. Simulation process.
Energies 17 00743 g001
Figure 2. Available wind and solar power and electric demand. (a) Available power from a 100 MW solar PV farm. (b) Available power from a 100 MW wind farm. (c) Electricity demand.
Energies 17 00743 g002
Figure 3. Available solar and wind energy, and electric load in each month.
Energies 17 00743 g003
Figure 4. Monthly energy storage capacity requirements.
Energies 17 00743 g004
Figure 5. Monthly charge, discharge, and reserve deployments of ESSs.
Energies 17 00743 g005
Figure 6. Case A: when ESSs are not operated (base case). Thermal generation by baseload and load-following generators.
Energies 17 00743 g006
Figure 7. Case B: when ESSs are operated. Thermal generation and charged and discharged power of the ESSs at baseload generator and load buses.
Energies 17 00743 g007
Figure 8. Total costs of generators and ESSs for energy and reserves in each month.
Energies 17 00743 g008
Table 1. Number of generating units and capacity.
Gen. TypeNumber of UnitsCapacity (MW)Share (%)
Coal26508.99
Natural gas31373051.59
Nuclear27009.68
Wind47009.68
Solar10145020.06
Total497230100
Table 2. Number of energy storage systems and capacity.
ESS TypesNumber of UnitsCapacity (MW)
ESS colocated with wind4700
ESS colocated with solar101450
ESS at baseload gen bus41350
ESS at load bus3219
Total213719
Table 3. Total consumed energy, curtailments, and penetration level for 4 weeks in each month.
MonthConsumed Energy (GWh)Solar Energy (GWh)Wind Energy (GWh)Solar Curtail without ESSs (GWh)Wind Curtail without ESSs (GWh)Penetration Level with ESSs (%)Penetration Level without ESSs (%)
Jan1379.35163.2195.320.00018.7418.74
Feb1369.56233.9891.713.05023.7823.56
Mar1329.03215.67112.943.47024.7324.46
Apr1243.75287.72167.390.74036.5936.53
May1384.85343.66173.440.55037.3437.30
Jun1556.54352.55185.310.91034.5534.50
Jul1689.21363.23167.330.00031.4131.41
Aug1893.87305.17150.341.28024.0523.98
Sep1711.49263.35104.820.07021.5121.51
Oct1553.79239.9585.053.44020.9220.70
Nov1362.11202.9096.620.41021.9921.96
Dec1416.00163.9487.202.39017.7417.57
Total17,889.553135.311517.4716.30026.0125.92
Disclaimer/Publisher’s Note: The statements, opinions and data contained in all publications are solely those of the individual author(s) and contributor(s) and not of MDPI and/or the editor(s). MDPI and/or the editor(s) disclaim responsibility for any injury to people or property resulting from any ideas, methods, instructions or products referred to in the content.