1. Introduction
The no longer deferrable need to reduce the effects of greenhouse gas (GHG) emissions on climate calls us to face a big challenge. In the urban context, buildings have the potential for energy savings and indoor environmental quality improvement since they occupy one of the key places among the contributors to GHG emissions [
1].
As it is now well known that across Europe starting from 2020 dwellings should be built in compliance with nearly Zero-Energy Buildings (nZEB) standards, to respond to these challenges, it is strategic to retrofit and design new highly performing buildings according to the nZEB target. This target pursues low energy consumption and requires the integration of systems based on renewable sources [
2,
3,
4].
In accordance with the EPBD (Energy Performance of Buildings Directive), the nZEB is defined as “a building that has a very high energy performance […]. The nearly zero or very low amount of energy required should be covered to a very significant extent by energy from renewable sources, including energy from renewable sources produced on-site or nearby” [
5]. In compliance with the EPBD recast [
5], the requirements of the nZEB in Italy are defined in the Italian Decree of 26 June 2015, for new and existing constructions [
6].
Among the various elements that must be considered in the design and management of nZEBs, two important aspects have to be highlighted: the control of indoor microclimate conditions to ensure occupants’ well-being and the efficient regulation of the building energy systems. At the design stage, the objectives not only of high energy performance and energy saving but also of environmental comfort must be respected. Therefore, relevant attention has to be paid to the continuous control that supports or replaces occupants’ behavior and their building management [
7].
However, the difference between the theoretically calculated and the measured energy use and indoor microclimate parameters in the nZEB building can also be meaningful sometimes. Incorrect assumptions made in the calculation can be due to errors made at different stages, i.e., design, construction, installation, commissioning, and evaluation of the technical performance of the building components, and can significantly affect the results. For instance, an important difference can be recorded between the indoor temperature during the operation and what was theoretically considered for the calculation of heat losses. Indeed, the constant heating setpoint temperature of 20 °C is assumed for indoors by the assessment method of the regulatory energy performance, averaged for space and time, independent of the variation of outside temperature or the building energy performance [
8].
To verify the real effectiveness of the adopted nZEB strategies in the operational phase, occupant behavior has a strong influence on the real energy performance and specific post-occupancy evaluation should be undertaken [
9]. One of the primary goals of the post-occupancy evaluation is to investigate the potential reasons affecting the discrepancy between the real and predicted energy consumption and between the real and predicted indoor microclimate and comfort levels.
In general, the relationship between the building features (thermal resistance and inertia), systems (in particular, HVAC (heating, ventilation and air-conditioning systems) energy consumption, and Indoor Environmental Quality (IEQ) is not always easy to manage [
10]. As a matter of fact, not only design factors, such as the building and its equipment, but also human actions, as well as occupancy profiles (high or low occupancy), can deeply affect the real building energy use by regulating the HVAC systems, opening/closing the windows and the shading systems, and managing lighting to achieve and maintain excellent levels of perceived comfort [
11].
In this view, one of the main goals of a nZEB in comparison with other buildings is surely the attention paid to the indoor environmental quality (IEQ). Indeed, a nZEB has to guarantee very low energy consumption, mostly covered by renewable energy systems, but also an acceptable level of thermo-hygrometric, visual, and acoustic comfort, as well as air healthiness [
7].
To guarantee the achievement of the nZEB targets and to investigate the performance gap, the collection of extensive occupant-related data and the monitoring of real occupied buildings should be performed to comprehend both envelope performance in use, in terms of stationary and dynamic analysis, the relevant indoor microclimate parameters (e.g., air temperature, relative humidity, carbon dioxide concentration, etc.), and the accounting of real energy consumption matched with occupant comfort and satisfaction [
12,
13,
14].
The elements that need to be considered to ensure that an nZEB guarantees an optimal microclimate and environmental comfort are the effective design of the envelope and the technical systems, the smart management of the systems, and the setting of the set points for their optimal operation.
The gap between the actual situation and the theoretical design can be brought out thanks to long-time monitoring by relating it to some key parameters such as the indoor microclimate and the occupancy of the building. It is extremely important not only to design a suitable monitoring of the building in the occupational phase to underline these critical issues but also a careful analysis of the collected data. However, currently, a few examples of nZEBs have been monitored in the Mediterranean climate context [
15]. In these regions, the cooling energy demand in summer is comparable to or sometimes higher than the one for winter heating and it can be the most challenging issue due to the high external temperature and solar radiation. Nevertheless, the strong daily variation of temperature in summer may provide considerable potential for free-cooling through nigh-time ventilation [
16]. Therefore, proper passive and active strategies to reduce energy consumption are needed also in this climate context to maintain indoor environmental conditions within the comfort ranges suggested by the standards while reducing the energy needs [
17,
18].
In general, to achieve all objectives of an nZEB in Mediterranean climates the main design inputs consist of proper building shape and orientation, thermal insulation of the opaque and transparent building envelope, exploitation of the thermal mass, airtightness and mechanical ventilation with heat recovery, exploitation of natural ventilation (especially at night-time), adequate and adjustable solar shading devices [
19].
Furthermore, the use of sustainable materials in new nZEB is significant in reducing the carbon footprint in urban environments. For example, the use of wood is currently finding wider application. Actually, low energy buildings can be built with highly insulated wooden technologies (e.g., platform frame and X-lamm), often used in Southern Europe to reach the target of nZEBs. However, they must be revised and adapted to take into account the warm climate peculiarities, mainly in terms of the wall thermal inertia and the control of solar radiation impact on indoor air temperature. Sometimes, in Mediterranean areas, the seismic risk imposes further challenges on the design process. Consequently, designers prefer a hybrid structure with a reinforced concrete core to guarantee structural safety and wooden elements for the building envelope to improve energy performance [
20].
In this panorama, this work focuses on the results of experimental research undertaken in the post-occupancy phase of a newly built wooden single-family nZEB located in a small city in central Italy. The paper aims to discuss the performance of the nZEB based on the data from a one-year-long continuous monitoring. More in detail, the analysis of the experimental data on the envelope performance and the indoor microclimate parameters are discussed in real operational conditions. The purpose of the work is to exploit the monitored objective data to assess the real building performance and verify if it is really a high-performance building as designed. The Research Question is: Are design strategies of high-performance buildings really effective? Therefore, the paper analyzes the pros and cons of the building design in the occupation and management phase and provides insights into the development of high-performance residential buildings in the Mediterranean area.
The majority of the existing literature related to the analysis of the real performance of nZEBs mostly focuses on the evaluation of energy consumption. This study provides an alternative approach by underlining the importance of a suitable methodology for the building post-occupancy long-term analysis that must necessarily take into account also the thermal features of the building components and the indoor microclimate conditions that affect the well-being of the occupants. Moreover, the paper points out the real effectiveness of design strategies to achieve the nZEB target in the Mediterranean climate context.
The structure of the paper is as follows. First, it provides the research approach and methods (
Section 2).
Section 3 describes their application to the case study building and the specific monitoring campaign. The main results of the one-year monitoring in terms of the performance of the building envelope and the indoor microclimate are discussed in
Section 4. Finally,
Section 5 summarizes the main conclusions.
2. Materials and Methods
The goal of this paper is to verify if the real performance of an as-designed nZEB detached house in central Italy—in terms of the building physics properties, microclimate, and well-being-related parameters based on one-year monitored data—is consistent with what was expected at the design stage and, if not, identify the performance gap. To this aim, the following research approach is defined and applied to a case study building:
analysis of the building and its boundary conditions;
set up of the on-site monitoring apparatus;
assessment of the main building physics properties;
comparison between theoretical data (design data) and monitored data;
analysis of indoor microclimate conditions, i.e., temperature and relative humidity;
analysis of surface temperatures of the main opaque components and the windows;
assessment of well-being conditions in the building.
2.1. On-Site Experimental Monitoring
To analyze the envelope thermal-energy performance and indoor microclimate conditions, an on-site experimental monitoring was performed.
For the monitoring of the building envelope components performance, a tailored system was installed consisting of dataloggers connected with surface temperature probes [°C] and heat flow meters [W/m
2]. In detail, to collect information about the thermal behavior of the building components in steady state and dynamic conditions, some surface temperature probes were inserted within their different internal layers during the construction phase to collect data throughout an annual monitoring period. Moreover, to analyze the heat flow passing through the opaque envelope and to assess its thermal transmittance on-site according to UNI ISO 9869-1:2014 [
21], surface temperature probes and heat flow meters were used. They were fixed to the wall surface using a thin layer of heat conductive paste (λ = 10.3 W/m K) and a pale adhesive tape.
In the case of non-homogeneous walls, to ensure that the measurements performed are representative of the thermal behavior of the wall as a whole and to obtain an average value of the thermal transmittance, the surface temperature and heat flow meters have to be positioned both at the homogeneous wall and at the non-homogeneous wall. Following the UNI ISO 9869-1:2014 Standard [
21], the correct position of the heat flow meters was determined with the help of a thermographic survey as well as with the project drawings.
The position of the probes was determined also to avoid the proximity of heating or cooling equipment or elements that could cause errors in the measurement.
Table 1 shows the main characteristics of the probes.
According to the UNI ISO 9869-1:2014 Standard [
21], the acquisition rate of the surface temperatures and the heat flow meters was set to 60 s and the processing interval was set to 30 min. Moreover, when the components under analysis are classified as a heavy construction element (heat capacity referred to the surface C = 83 kJ/m
2 K), the selected and analyzed monitoring period has to be at least 6 days to ensure that the heat stored in the component was considered negligible compared to the heat transmitted through it.
As regards the monitoring of indoor microclimate (air temperature [°C] and relative humidity [%]), some small dataloggers were used—placed in the main rooms—and another datalogger was placed outdoors in a position protected from direct solar radiation and rain. The dataloggers were scheduled to record a measurement every 30 min.
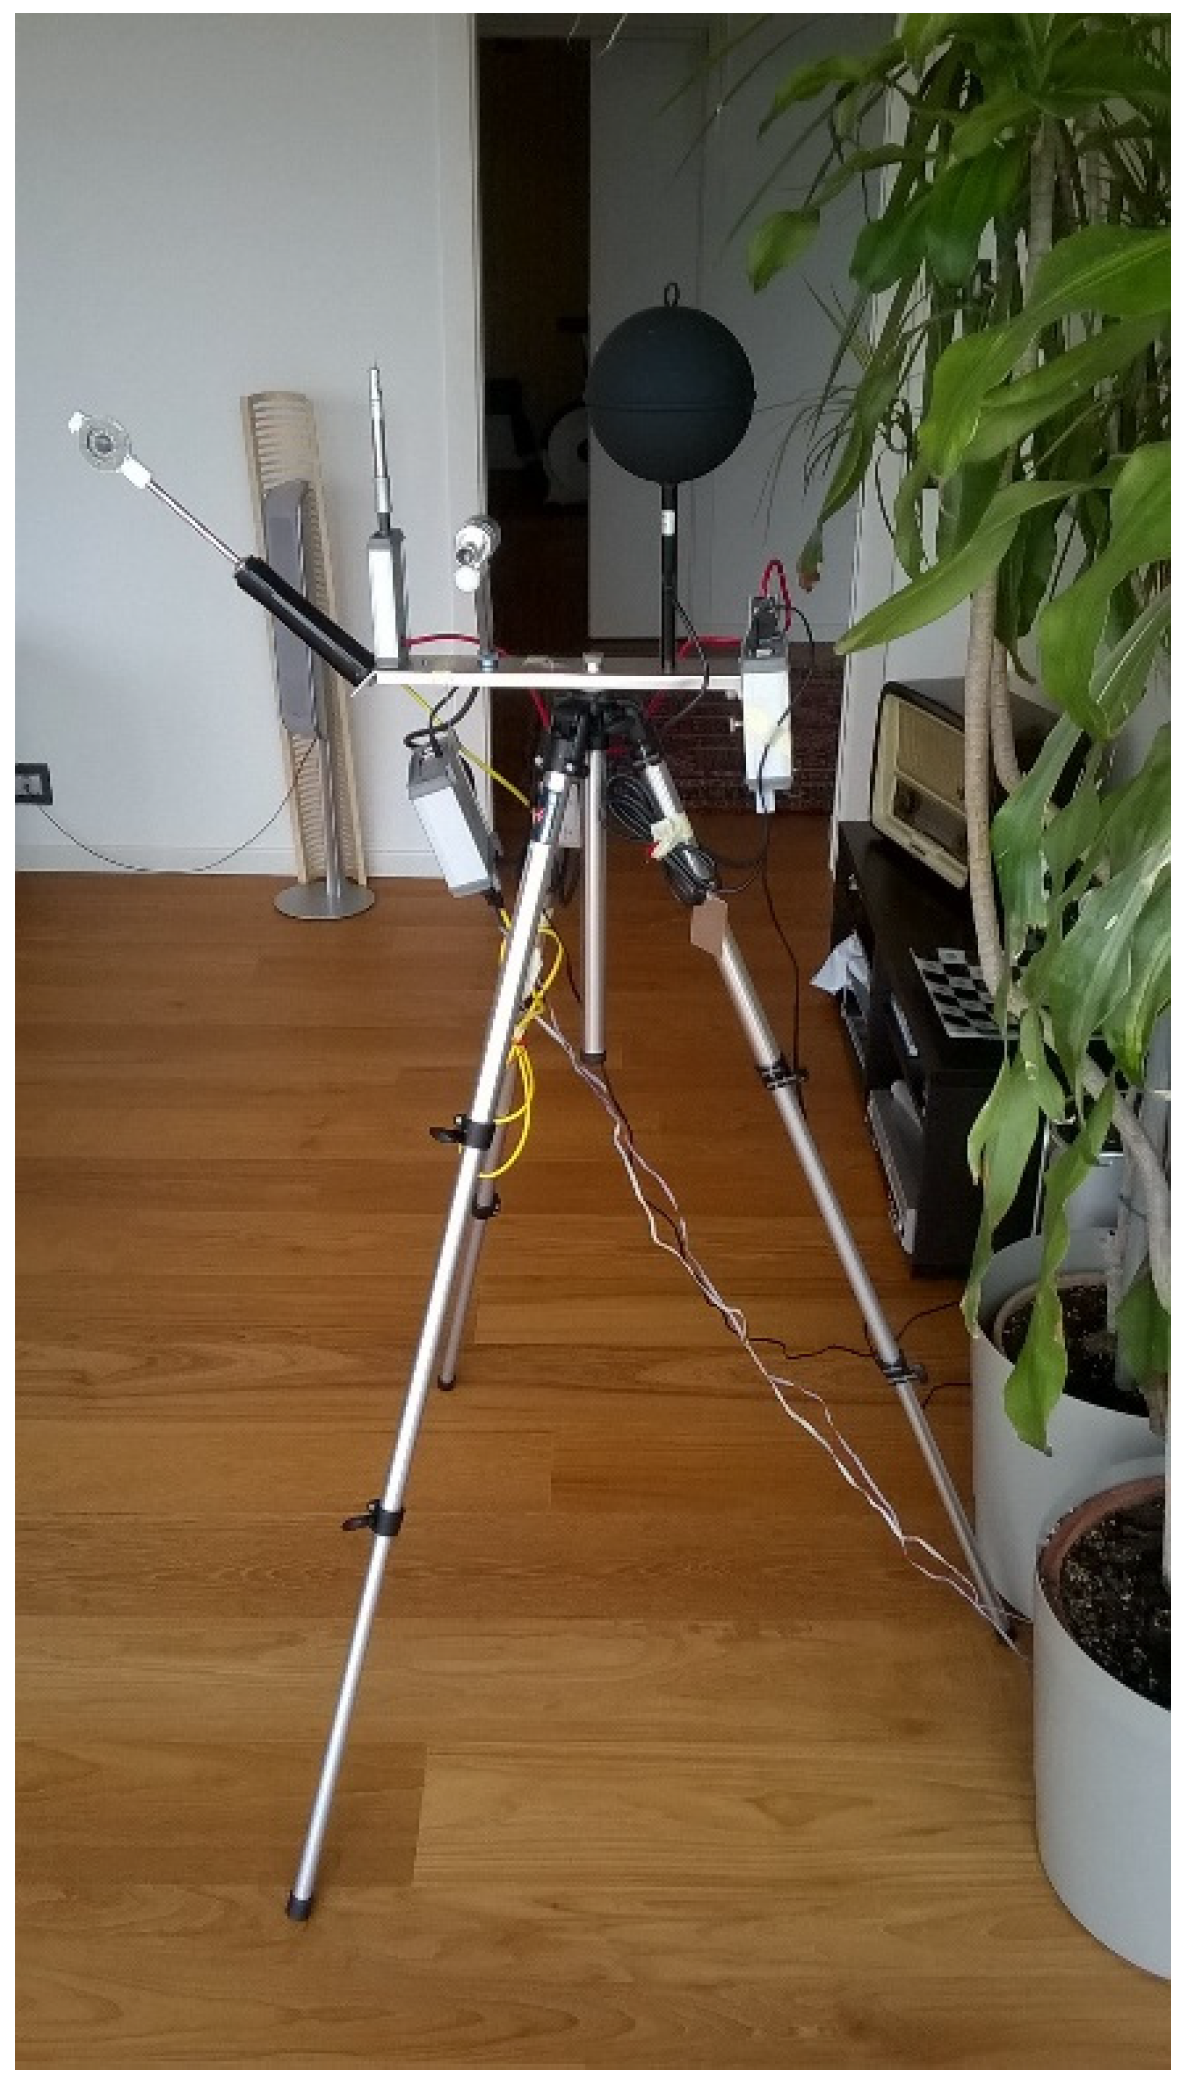
Finally, only in a selected representative room, the monitoring of indoor thermal comfort conditions was performed with a microclimate monitoring station equipped with a thermo-hygrometer (air temperature (T) [°C] and relative humidity (RH) [%]), a hot wire anemometer (air velocity [m/s]), a globe thermometer (mean radiant temperature [°C], and a net radiometer (net radiation [W/m2]). The measurements aimed to assess well-being were conducted during a representative period of the heating and cooling season.
Table 2 summarizes the instruments used for microclimate and comfort monitoring.
2.2. Analysis of Envelope Thermal-Energy Performance
To assess building envelope thermal-energy performance, a set of different analyses was proposed and carried out for the main external opaque building envelope components, as follows:
calculation of on-site thermal transmittance (U) [W/m2 K] and comparison against design values;
analysis of inertial properties, i.e., thermal inertia and thermal capacity.
The analysis of in-field thermal transmittance is carried out to verify if the high thermal insulating envelope components as designed are really effective. To analyze thermal transmittance, the so-called “average method” of the UNI ISO 9869-1:2014 standard [
21] was employed. This Standard was also used as a guideline for the definition of the measurement apparatus, the installation of the sensors, and the correct method of measurement, as described above, as well as the analysis of the data. Starting from the collected data, the thermal transmittance of roof and external walls was calculated. Indeed, it is possible to hypothesize that the average values of the surface temperatures and heat fluxes monitored during an appropriate measurement period provide a reliable evaluation of the thermal resistance
R [m
2 K/W] of the component in steady-state conditions. Therefore, the thermal resistance was calculated by dividing the mean measured density of heat flow rate (
qj) by the mean difference between the measured internal and external surface temperatures (
Tsij −
Tsej) with the following equation:
Thereafter, the thermal transmittance value
[W/m
2 K] was calculated by adding to the thermal resistance value (
R) the internal and external liminal resistances established by the UNI EN ISO 6946:2008 Standard [
22], which are equal to
Rsi = 0.13 m
2 K/W for the wall and to
Rsi = 0.10 m
2 K/W for the roof and
Rse = 0.04 m
2K/W, respectively, for horizontal flow, according to the following equations:
Starting from the partial uncertainties shown in
Table 3 the overall uncertainty of the measurement was also calculated.
Building envelope components thermal inertia and capacity are also fundamental to understanding the actual energy performance of the building envelope and, in particular, its heat storage capability, especially in summer. They were analyzed by calculating the time lag (
TL) [h] and the decrement factor (
DF) [-] according to the procedure described in [
23]. The first is the time required for a heat wave to propagate from the outer to the inner surface through a component. The second is the decreasing ratio of the heat wave temperature amplitude during its transient process penetrating through the component. Accordingly, they were calculated according to the following equations:
where
and
are the time when indoor surface temperature and outdoor surface temperature, respectively, of the component are at their maximum, while
Tsi,max,
Tsi,min,
Tse,max, and
Tse,min are the maximum and minimum temperatures on the internal and external surface, respectively.
2.3. Analysis of Indoor Microclimate Conditions
To evaluate the indoor microclimate and comfort conditions in the building, various complementary analyses were performed, as follows:
analysis of the trend of indoor air temperature (T) and relative humidity (RH) in various zones of the building to verify their fluctuation within the day and over months, also compared to the outdoor boundary conditions, and the deviation from the typically recommended values for thermal well-being in the different seasons;
specific verification of the temperatures of and behind transparent surfaces, which are usually the weakest envelope components;
evaluation of thermal comfort in selected areas within the building more vulnerable to the variability of outdoor microclimate conditions, e.g., characterized by a high ratio of transparent surfaces.
The measurement of the globe temperature and the indoor air temperature allows the calculation of the mean radiant temperature and, therefore, the operative temperature in indoor environments.
Following the UNI EN ISO 7726:2002 standard [
24], the calculation of the mean radiant temperature (
Tr) as a function of the air temperature (
T), and of the globe temperature (
Tg), for globe thermometers with the characteristics reported in
Table 2, can be calculated with the following equation:
In practical cases, where the difference between the air temperature and the mean radiant temperature is <4 °C and the air velocity is <0.2 m/s, the operative temperature (
To) can be calculated using the following equation:
The UNI EN ISO 7730:2006 standard [
25] allows evaluating the subjective judgment of a group of people towards the thermal environment according to the Fanger method, through the PMV (predicted mean vote) and PPD (percentage of people dissatisfied) indices.
Table 4 shows the three global thermal comfort quality classes of the indoor environments in terms of PMV and PPD reported in the standard.
As regards summer comfort, according to the UNI EN 16798-1:2019 standard [
17], the limits of acceptable temperature so that the environment is perceived as comfortable by users depend on the category of expectation in the building, which identifies the level of well-being to be guaranteed, and the type of system used in the building to provide comfort. For example, if an active system is used for cooling, the internal temperatures must respect the limits defined by the Fanger comfort model. However, if comfort is maintained through passive cooling strategies, such as opening windows by users, then the adaptive model dictates the temperature limits.
Table 5 shows the categories of buildings and the related quality levels of indoor thermal comfort in terms of PPD and PMV proposed by the UNI EN 16798-1:2019 standard [
17].
Because the analyzed nZEB is a newly built residential building, which during the comfort monitoring campaign was air-conditioned, the analysis was developed based on the Fanger comfort model.
Table 6, relating to category II reported in
Table 5, shows the winter and summer acceptable operative temperature ranges, corresponding to default values for the thermal insulation of clothing (I
cl) (for winter clothing I
cl = 1 clo; for summer clothing I
cl = 0.5 clo), for the metabolic activity level (M) (for light sedentary activity M < 1.2met), for air velocity (v) (v < 0.2 m/s), and for relative humidity (RH) (40% < RH < 60%).
3. Case Study
The case study building, which is extensively described in [
15], is a detached single-story dwelling located in central Italy (in Arezzo, Tuscany). According to the Italian regulation [
26], the city of Arezzo is located in climate zone E (Italy is divided in six climate zones from A to F) and is characterized by 2014 HDD (Heating Degree Days). In this climate zone, the maximum number of daily hours when the heating system can be switched on is equal to 14 [
26]. Moreover, the heating period is 15/10–15/04 and the cooling period is 11/06–08/09.
The building was constructed in 2017 and is an nZEB based on the previously mentioned Italian energy labeling standard [
6]. The dwelling consists of an unheated basement dedicated to accommodate the HVAC system equipment, the cellar, and the garage. The building is designed for 2 inhabitants (a couple). However, it includes three bedrooms, three bathrooms, a kitchen, a living room, and one study room. There are windows towards all orientations and the openings are equipped with different shading systems. In particular, external roller blinds are installed on the almost completely glazed SW façade to mitigate the risk of summer overheating, while the shutters are installed on the other orientations. Moreover, the SW façade has also an overhang with an extension of 1.2 m.
As regards the geometrical characteristics, the net conditioned area is 186 m2, the conditioned volume is 631 m3, and the surface-to-volume ratio is equal to 0.82 m2/m3. The global window-to-wall ratio for the different building orientations is 8.1% in the NE façade, 20.3% in the SE façade, 51.8% in the SW façade, and 22.6% in the NW façade.
The platform frame is the structural frame combined with a reinforced concrete slab for the floors. The structure is coupled with an oriented strand board and large layers of insulating materials (rock wool and expanded polystyrene). The overall thickness is 34 cm for the external walls, 53.7 cm for the roof, and 50 cm for the floor. Triple-pane low-energy with aluminum frame windows are installed.
In [
15], the thermal performance properties of the envelope were partially analyzed. It was highlighted that all over the building envelope there are very small thermal bridges due to the heterogeneity of the materials. The transmittance of all the opaque components presents very low values in comparison with the reference ones of the nZEB target (according to the national standard) and good inertial performance, as calculated at the design stage. No condensation risk was highlighted.
Table 7 summarizes the design U-values against the reference values for the nZEB defined by the DM 26/06/2015 [
6], as well as the periodic thermal transmittance Yie.
The use of natural ventilation is possible because all windows are fully openable, and, when the indoor doors are open, natural ventilation involves the whole house thanks to cross ventilation, with suitable climate conditions.
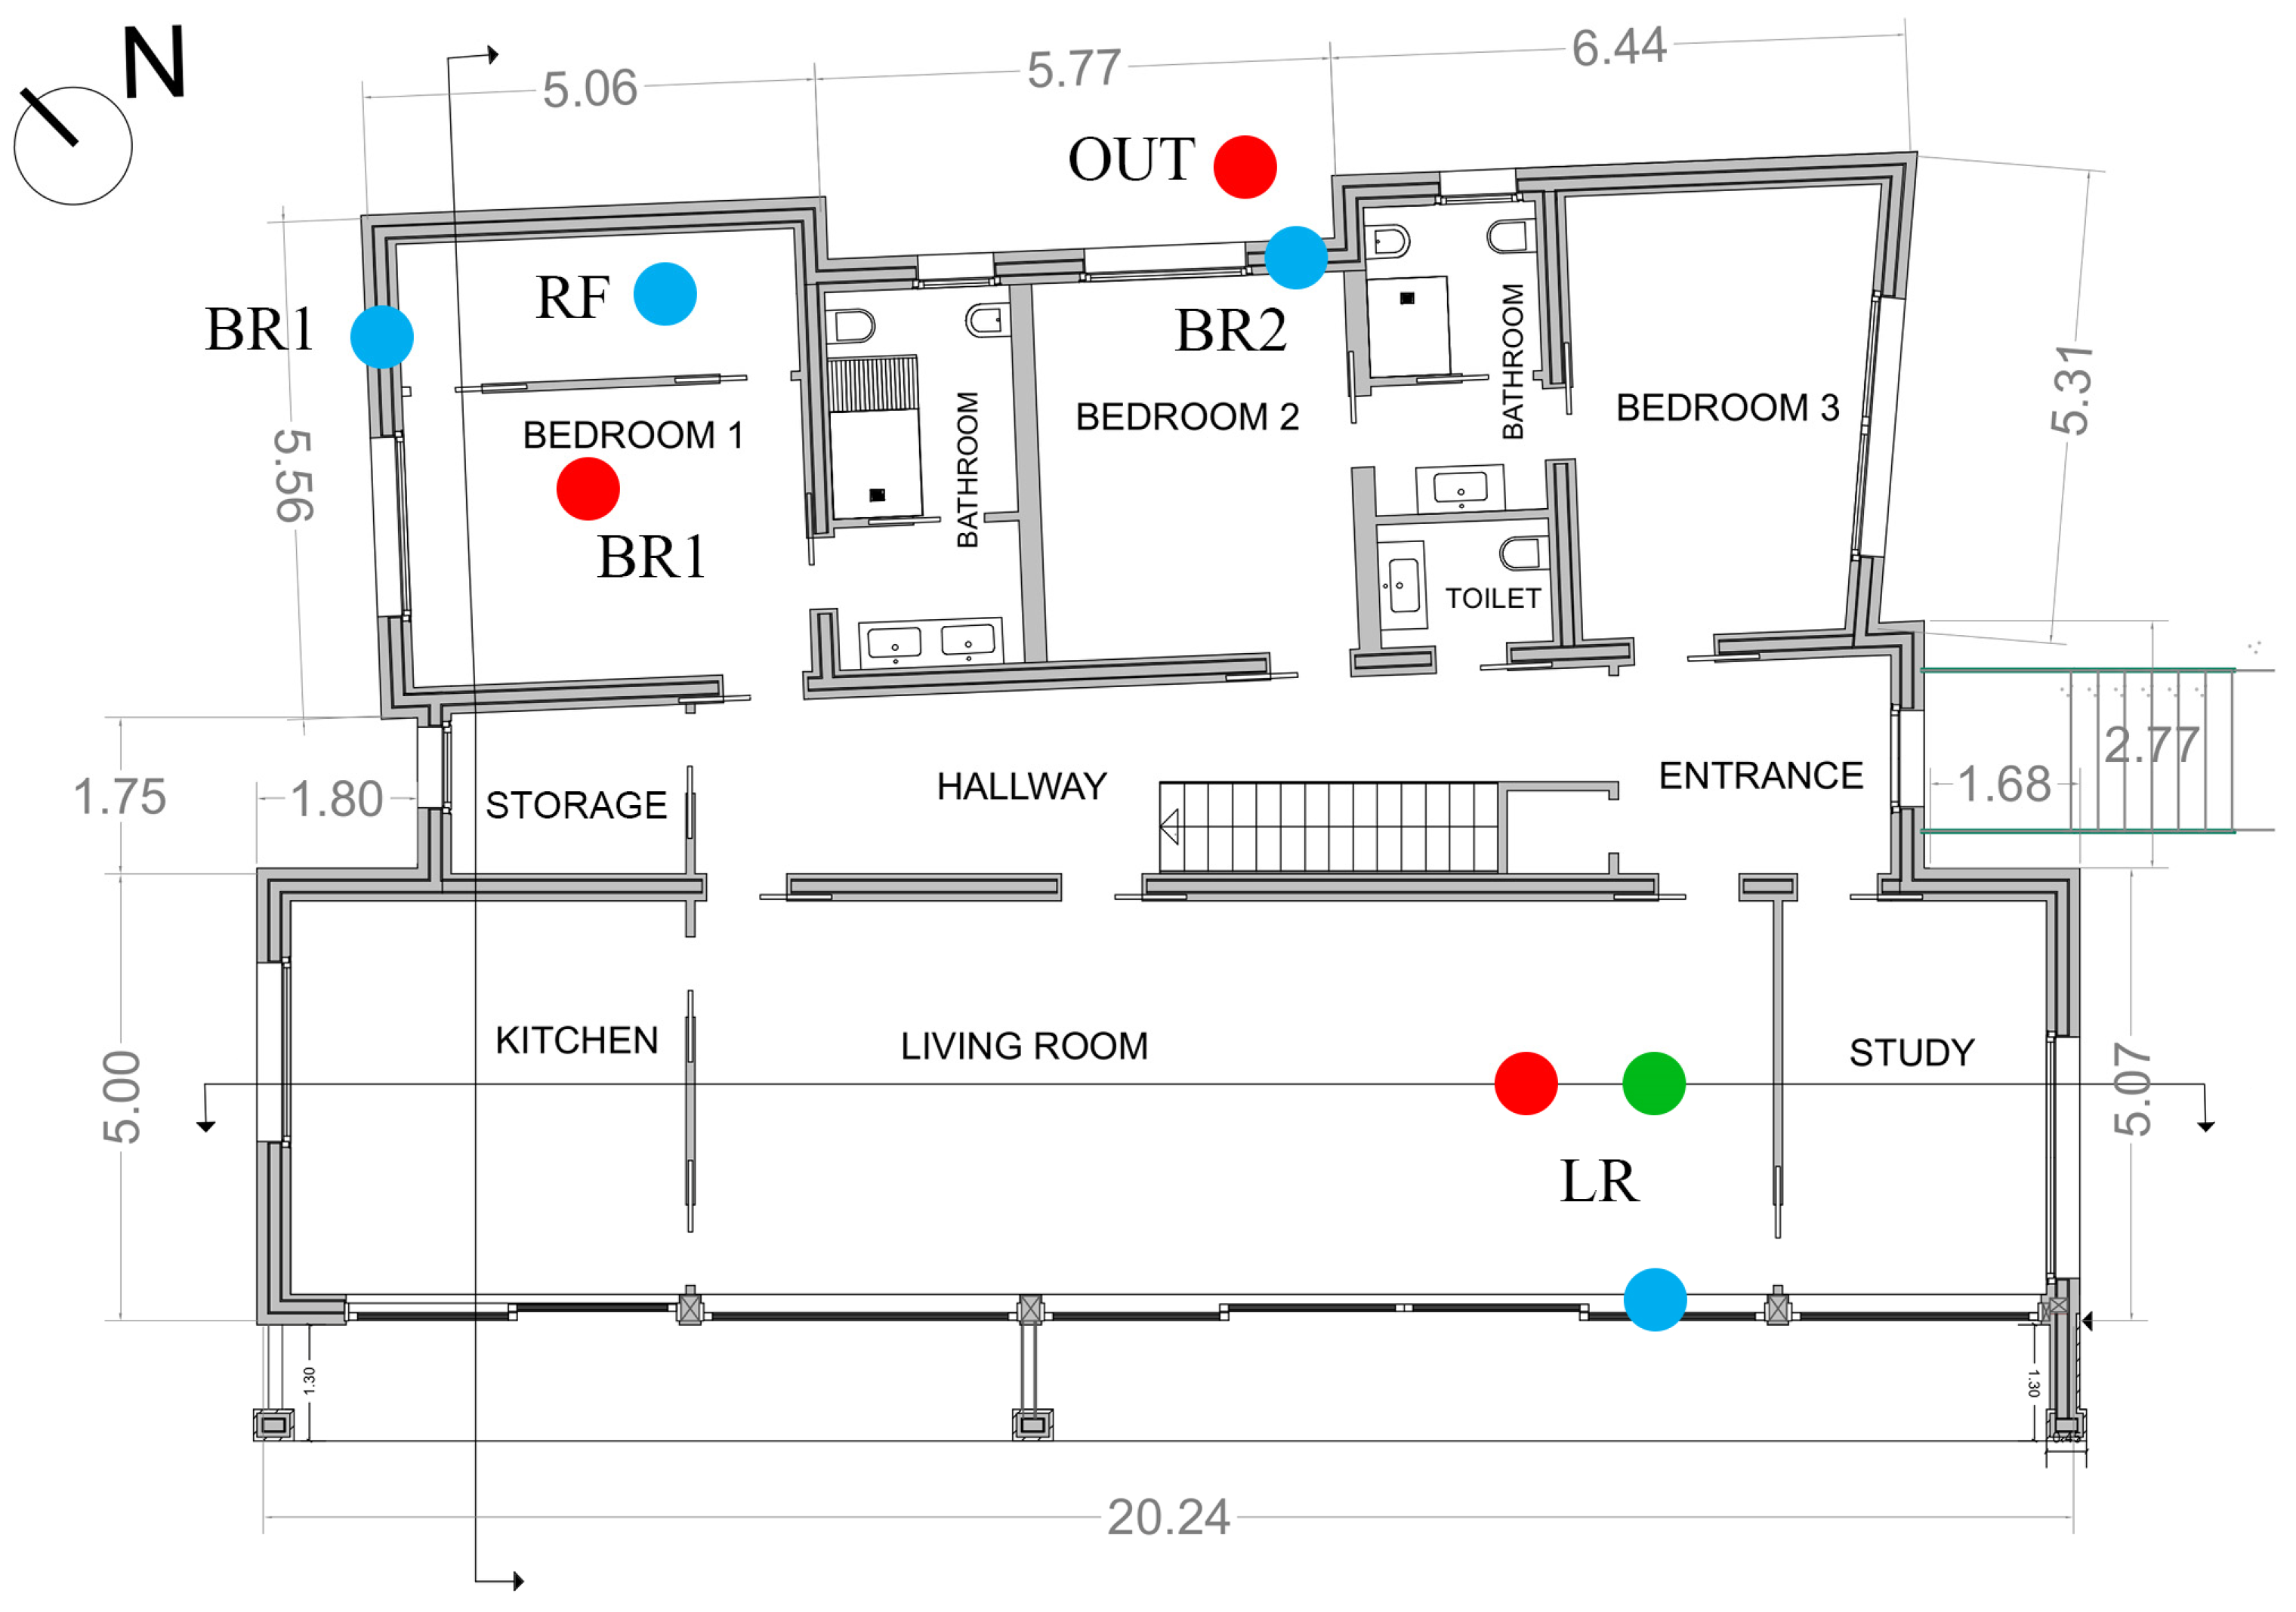
Figure 1 shows the plan of the main floor of the dwelling, while
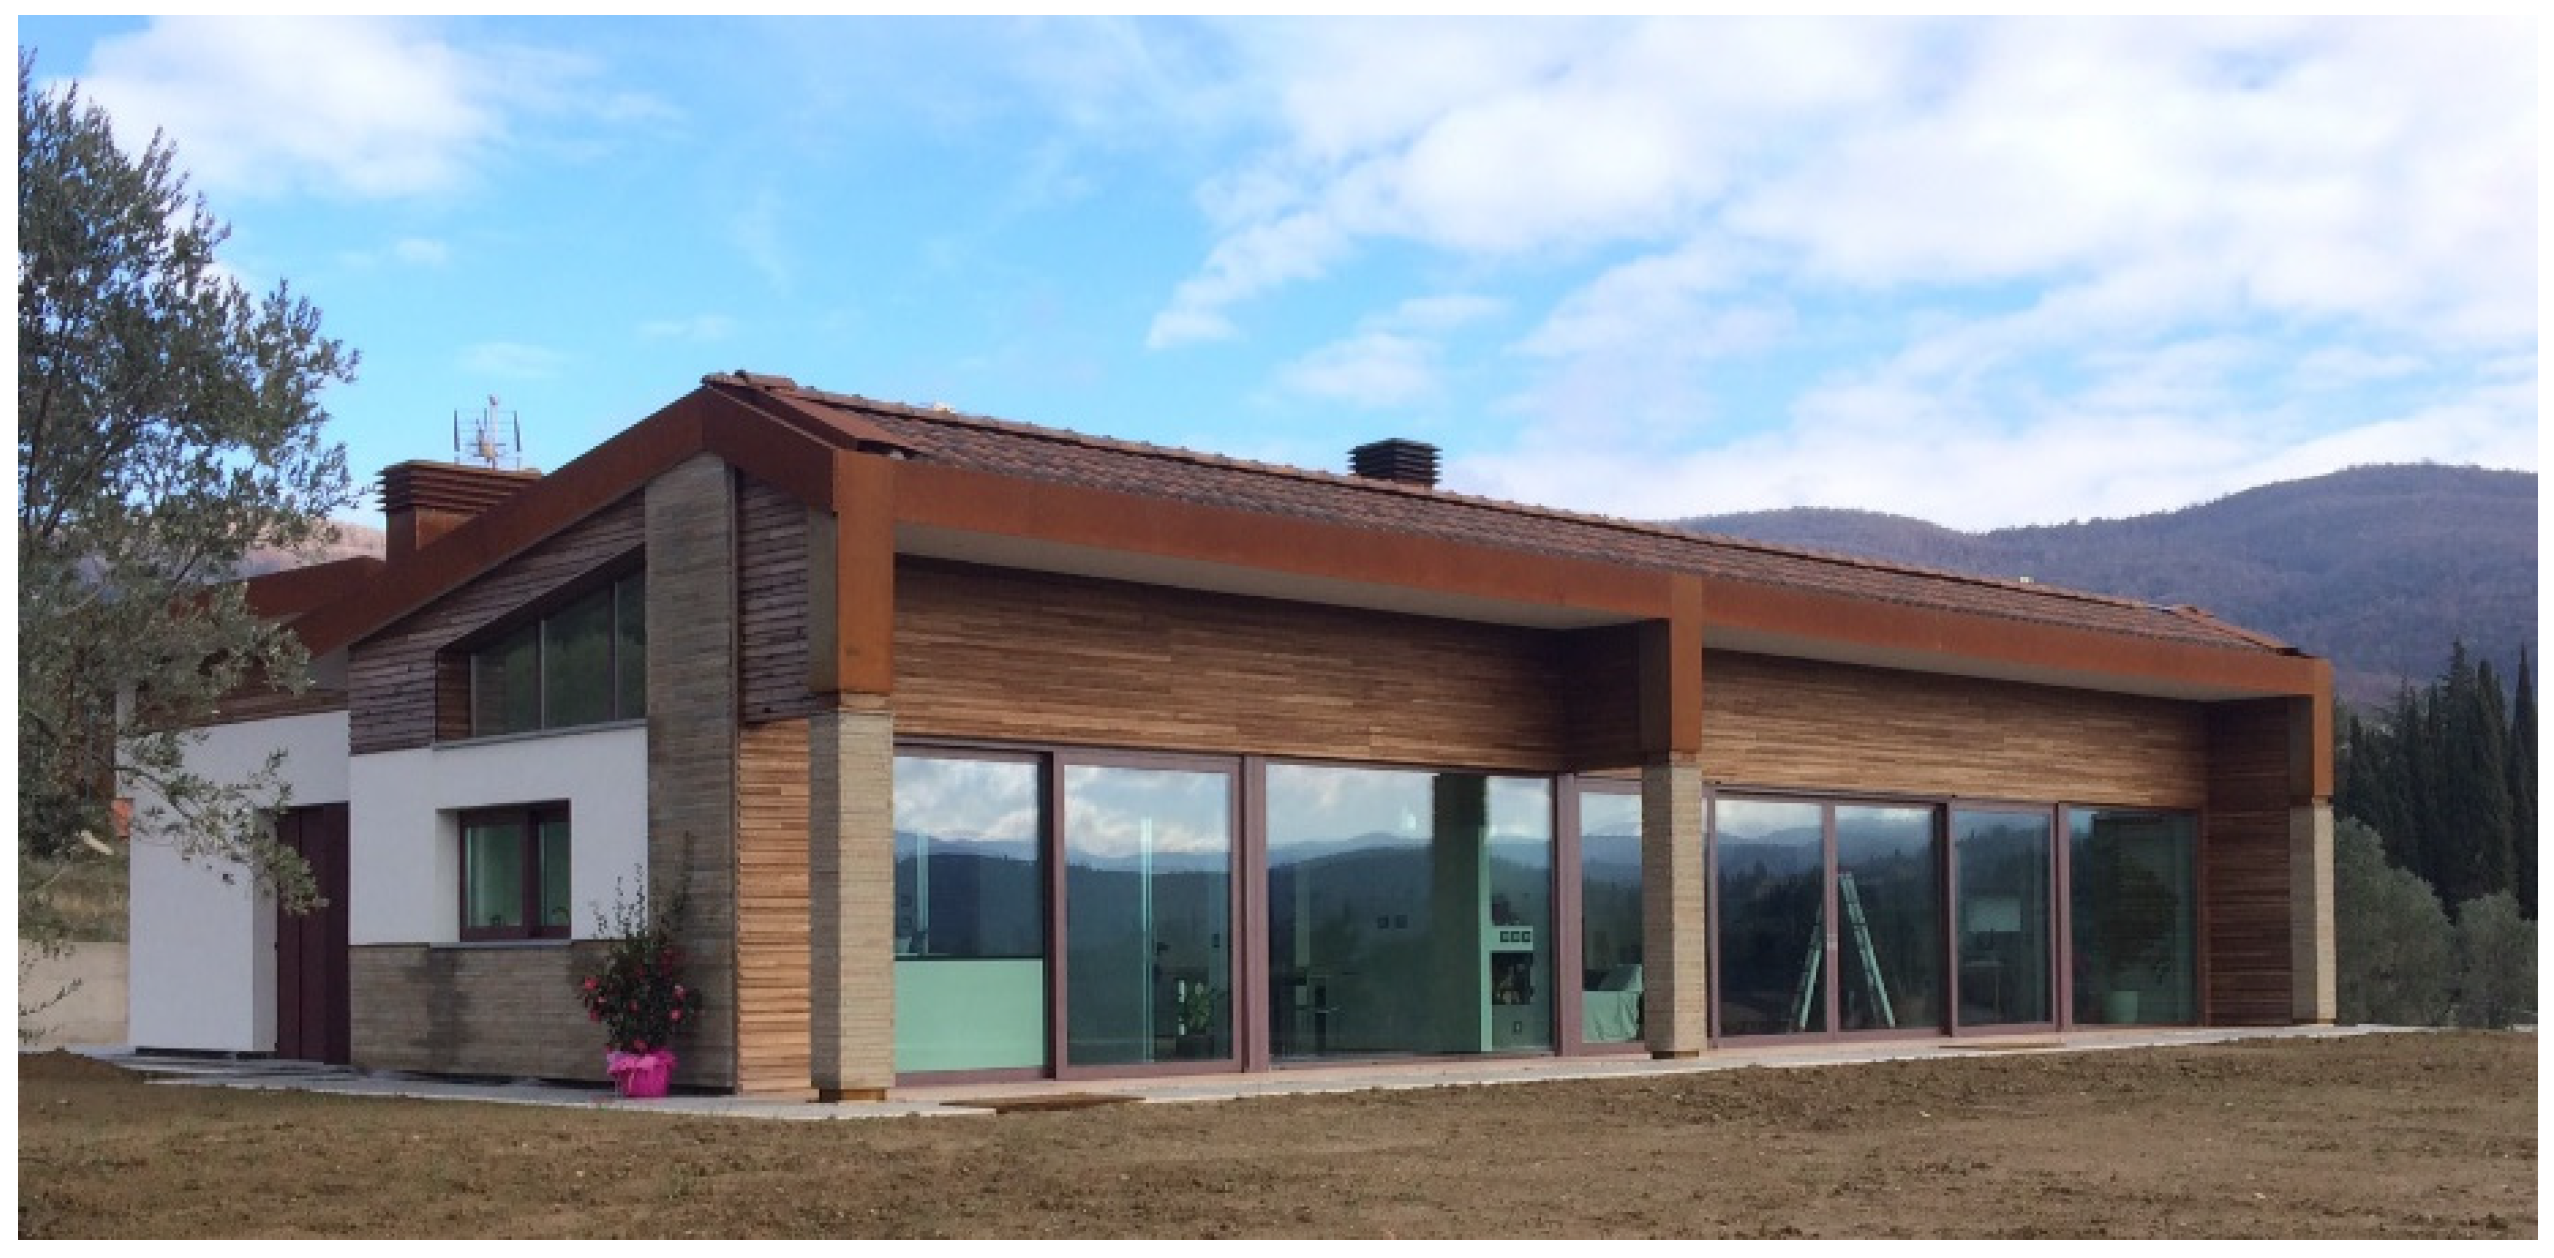
Figure 2 gives the external view of the west side of the house.
The HVAC system consists of a balanced mechanical ventilation system equipped with a heat recovery system (efficiency of the heat recovery unit equal to 0.89). The system creates a 24-h airflow in every room varying from 1 vol/h to 1.5 vol/h.
The heating and cooling system provides a continuous operating mode with night attenuation and it is equipped with 16 inlet vents for the treated air and with a zone and climate regulation system (on-off). There are two levels of air temperature programming within 24 h.
As for the HVAC system, two air-water heat pumps are installed and connected to the photovoltaic (PV) plant. One is placed outside and is used for heating and cooling, while the other, for hot water production, is placed in the basement. The latter is combined with a thermal solar system consisting of 2 selective flat solar collectors with a net capturing surface area of 4.6 m
2 installed on the roof on special supports (30% inclination, southern exposure to maximize the efficiency), a 280 L solar boiler, a hydraulic group, and an electronic management unit. Renewable energies are integrated in the roof with photovoltaic (PV) panels to produce about 5000 kWh per year. The synergy of the solar thermal, PV, and heat pump systems guarantees the minimum coverage of 50% (effective 70.7%) of hot domestic water consumption and minimum coverage of 50% (effective 82.4%) of the sum of expected consumption for domestic hot water, heating, and cooling required by the national regulation [
6].
During winter, the occupants control the heating system (set point temperature and hours of operation) according to their presence and with night-time attenuation. Moreover, when the building is not occupied (e.g., holidays) the system is turned off. Moreover, the building is equipped with a home automation system (BACS, minimum class B according to UNI EN 15232 [
27]) for the management of building energy systems.
The calculated energy performance of the building according to the national regulation are: energy performance index for heating equal to 92.41 kWh/m2/year and energy performance index for cooling equal to 10.64 kWh/m2/year.
Monitoring Campaign
Within the scope of the on-site monitoring campaign, the above-mentioned parameters (
Section 2.1) were collected, which will be analyzed and evaluated in
Section 4. These parameters refer to both the thermal performance of some building components and the microclimatic conditions of some rooms. In particular, the collected parameters are the following:
surface temperatures [°C];
thermal fluxes [W/m2];
air temperature [°C];
air relative humidity [%];
air velocity [m/s];
mean radiant temperature [°C];
radiant heat flow [W/m2].
For the on-site monitoring campaign of the building opaque components performance, the experimental apparatus consisting of dataloggers connected with surface temperature probes and heat flow meters was used to analyze three different envelope components: the external NW oriented wall of the bedroom 1 (BR1) (plastered), the external NE oriented wall of the bedroom 2 (BR2) (stone-coated), and the roof (RF).
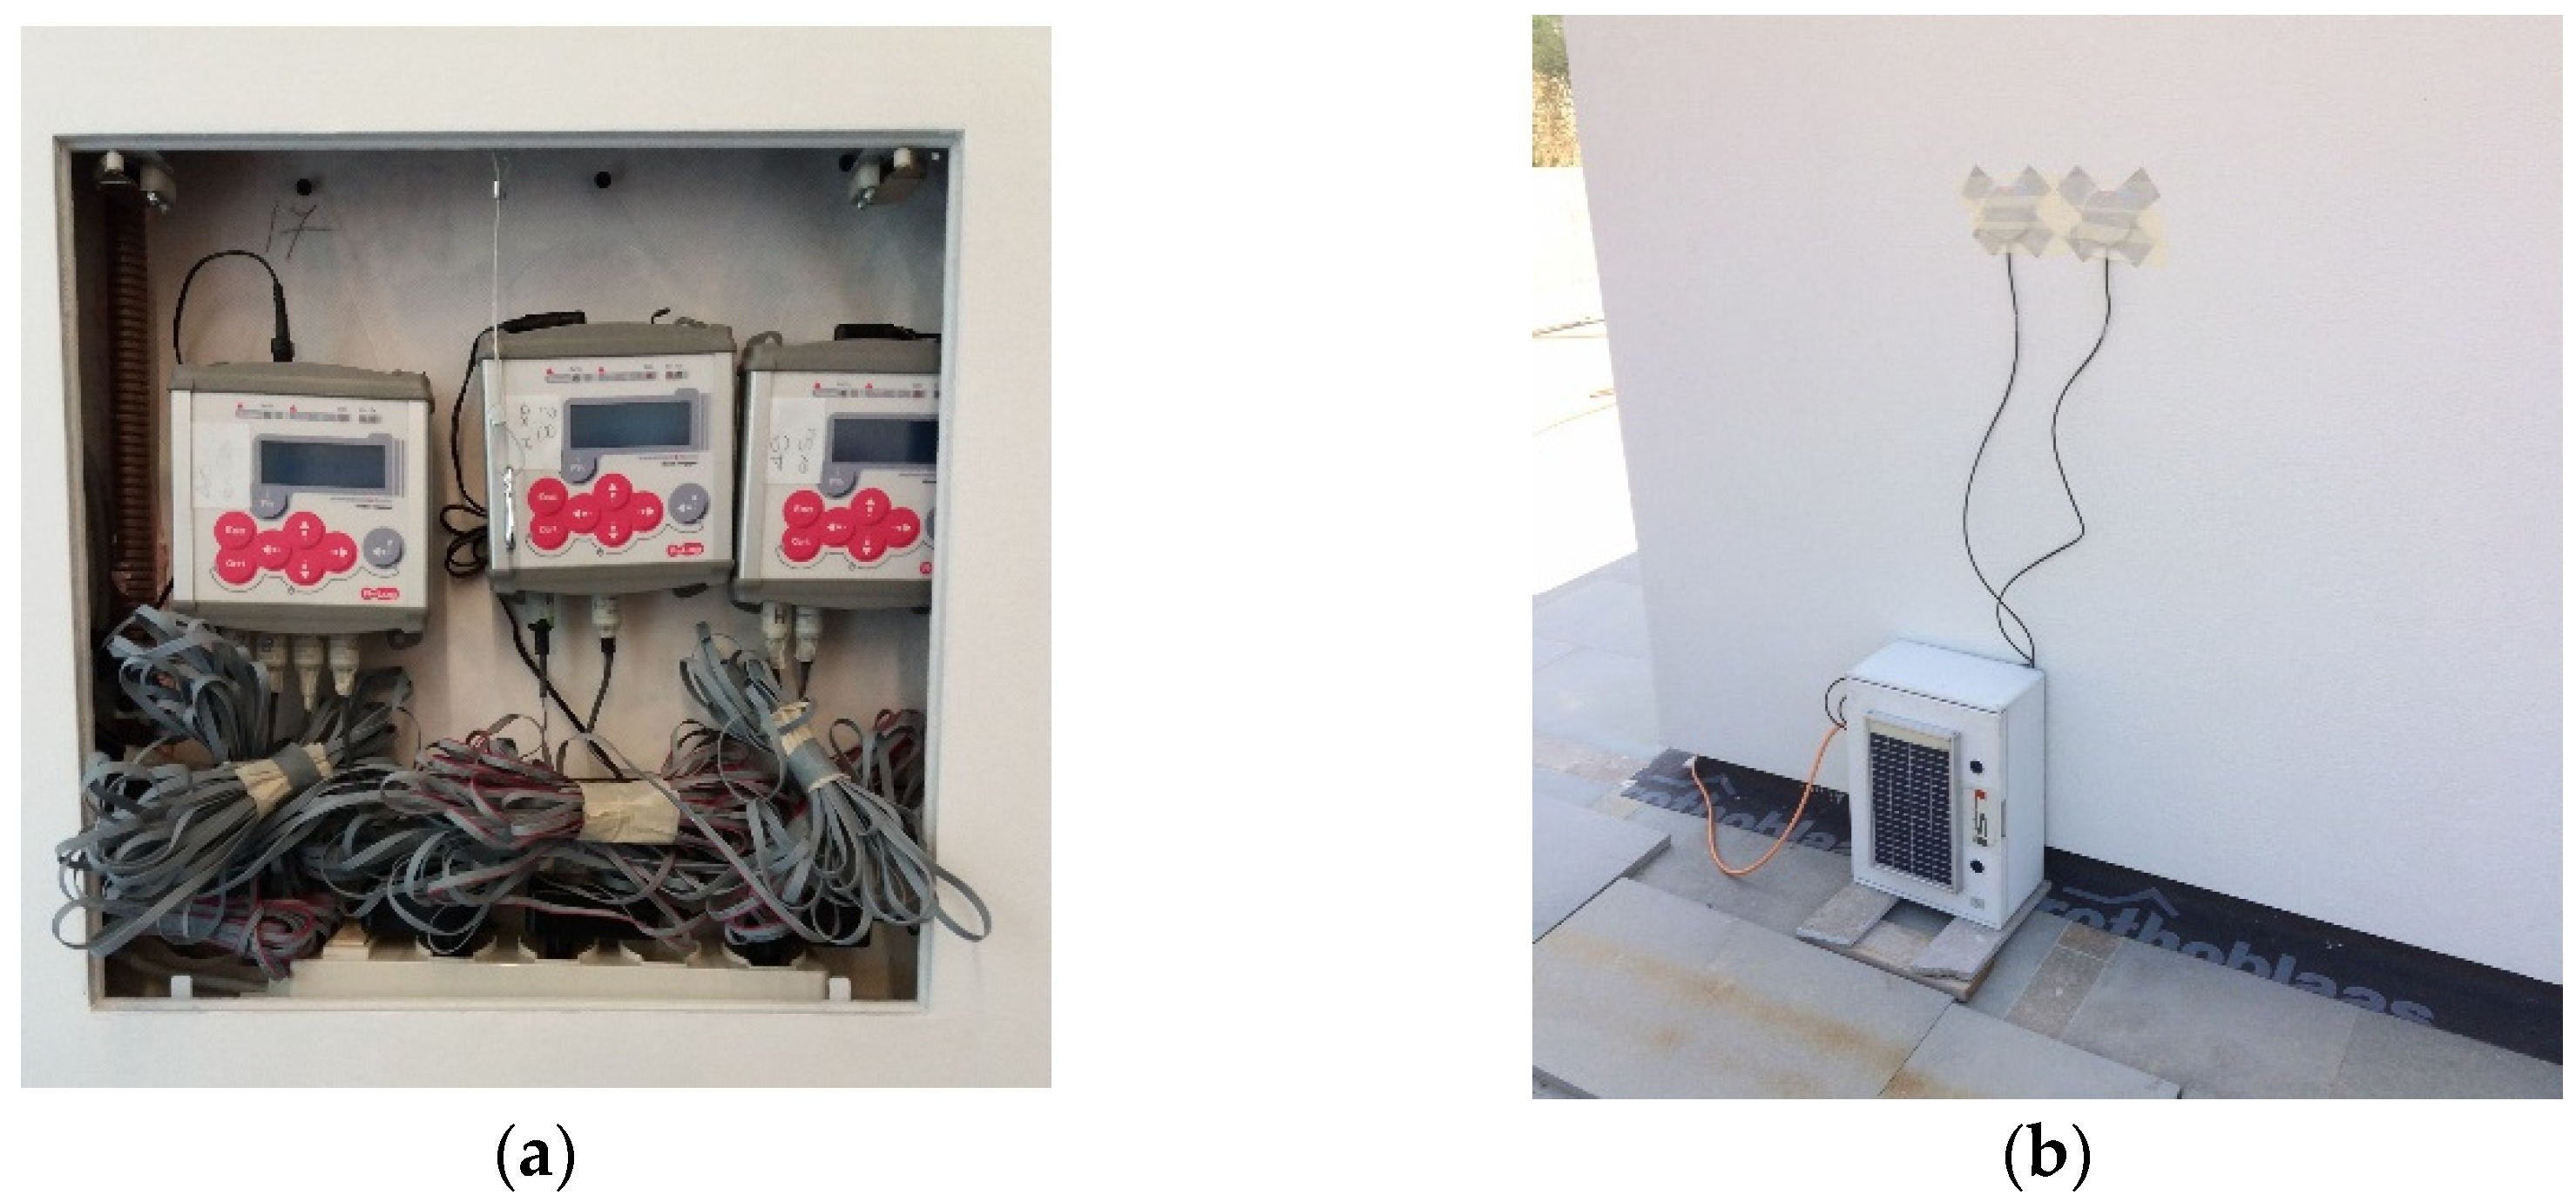
The internal dataloggers are positioned inside a specially designed cavity created in the building envelope, while the external dataloggers are put outside in an airtight box powered by a photovoltaic panel (
Figure 3).
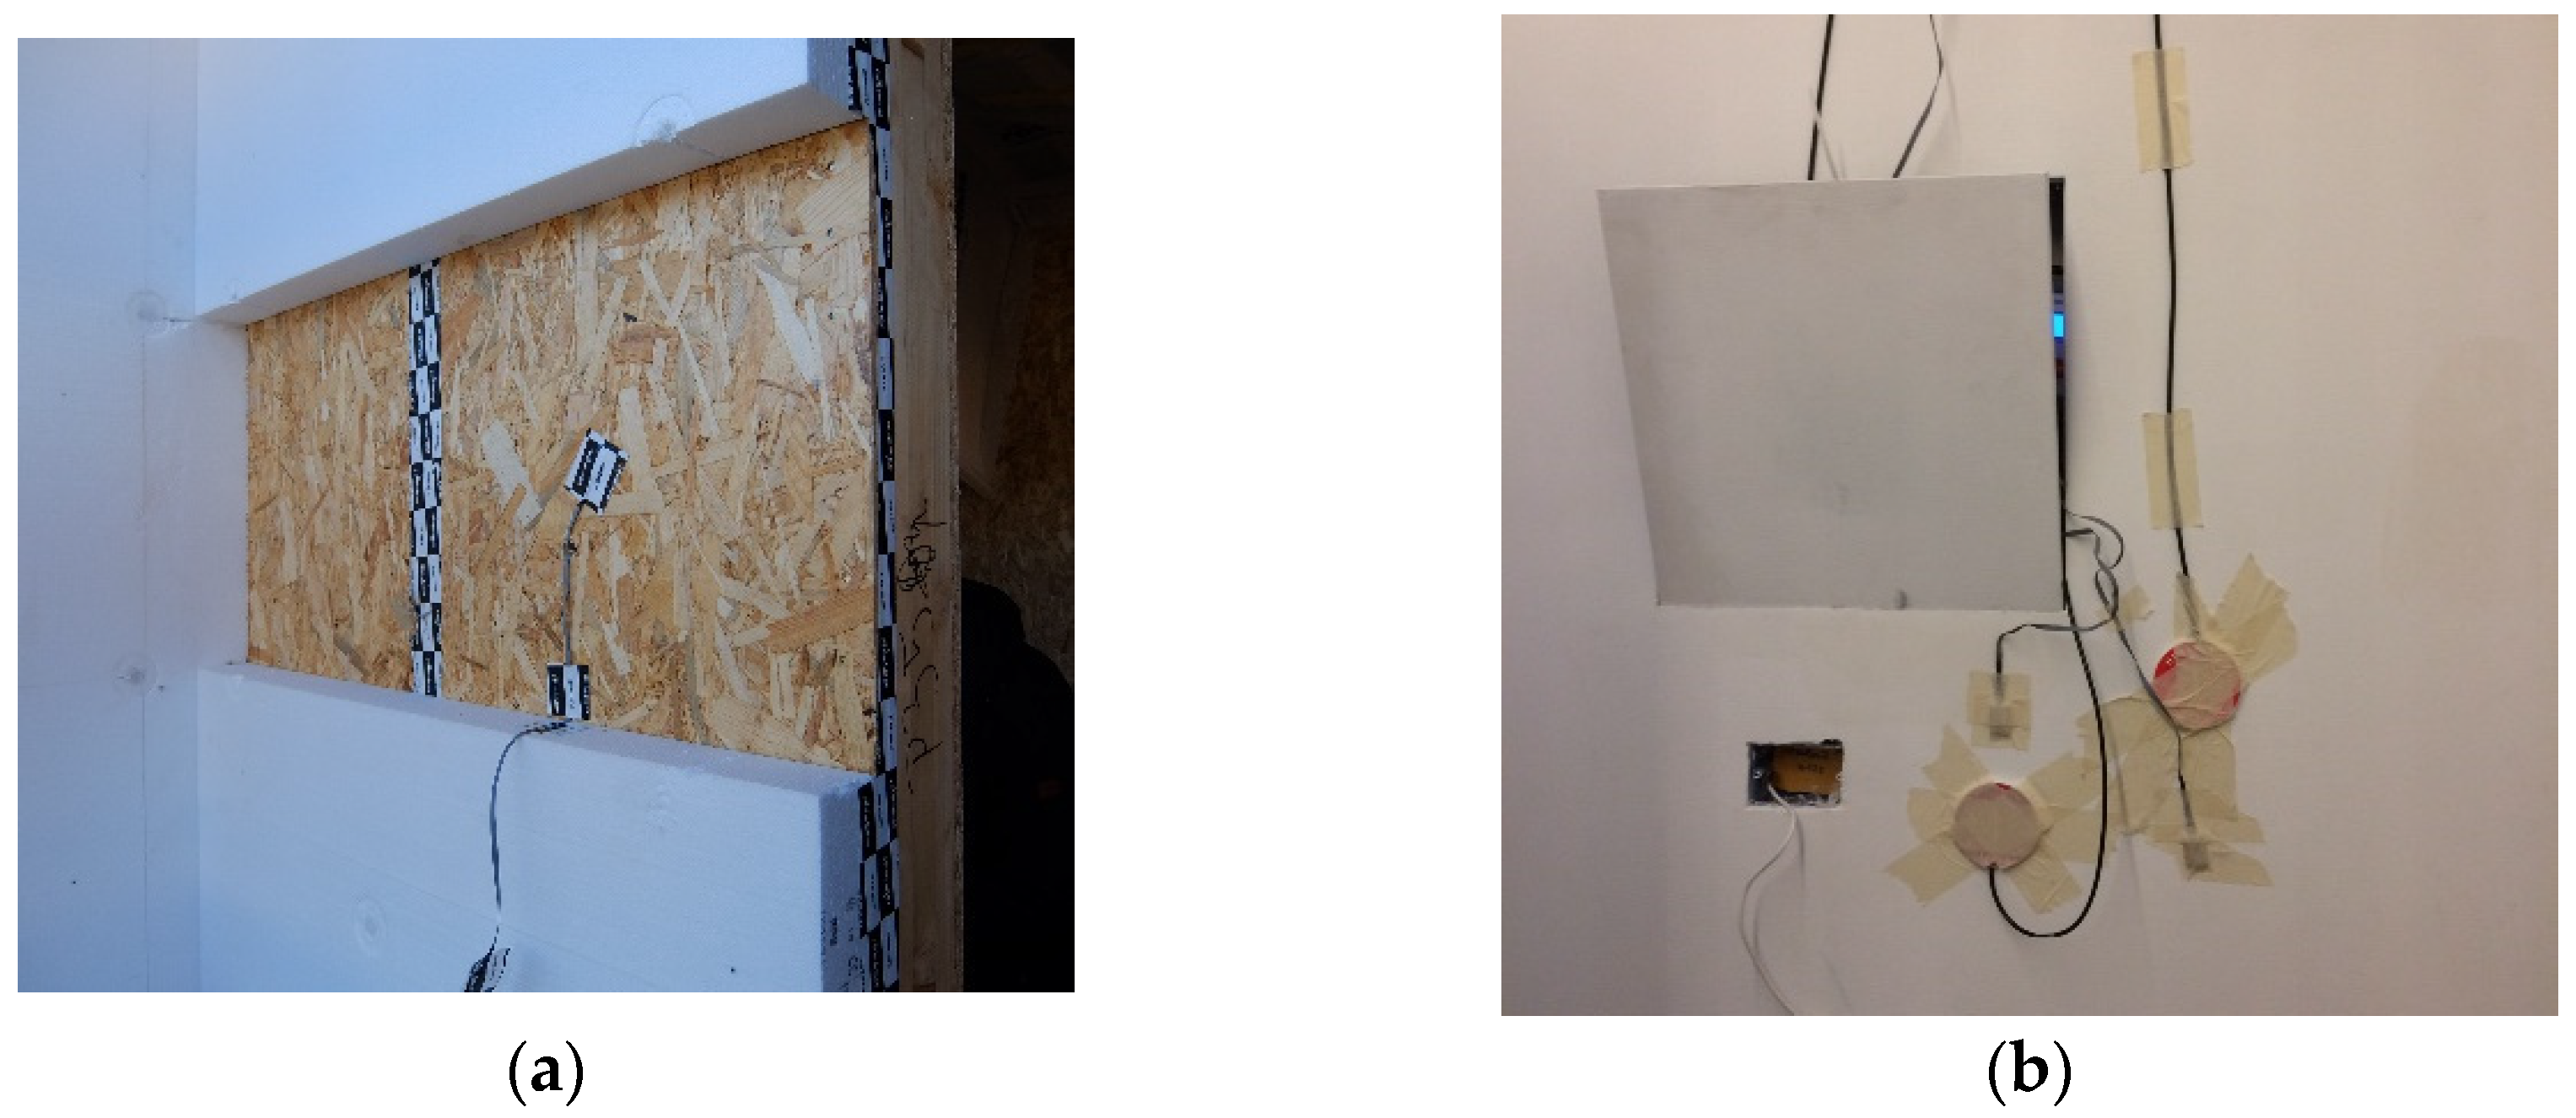
The surface temperature probes were positioned on the internal and external surfaces of the components and within their different layers during the construction phase, while the heat flow meters were fixed to the internal and external surfaces of the components of the analyzed building (
Figure 4).
To detect the position of studs and joists that characterize the platform frame wooden technology structure, an infrared camera was used. This thermographic survey was useful to define the correct position of the probes, to analyze the influence of the thermal bridges that characterize this construction technology.
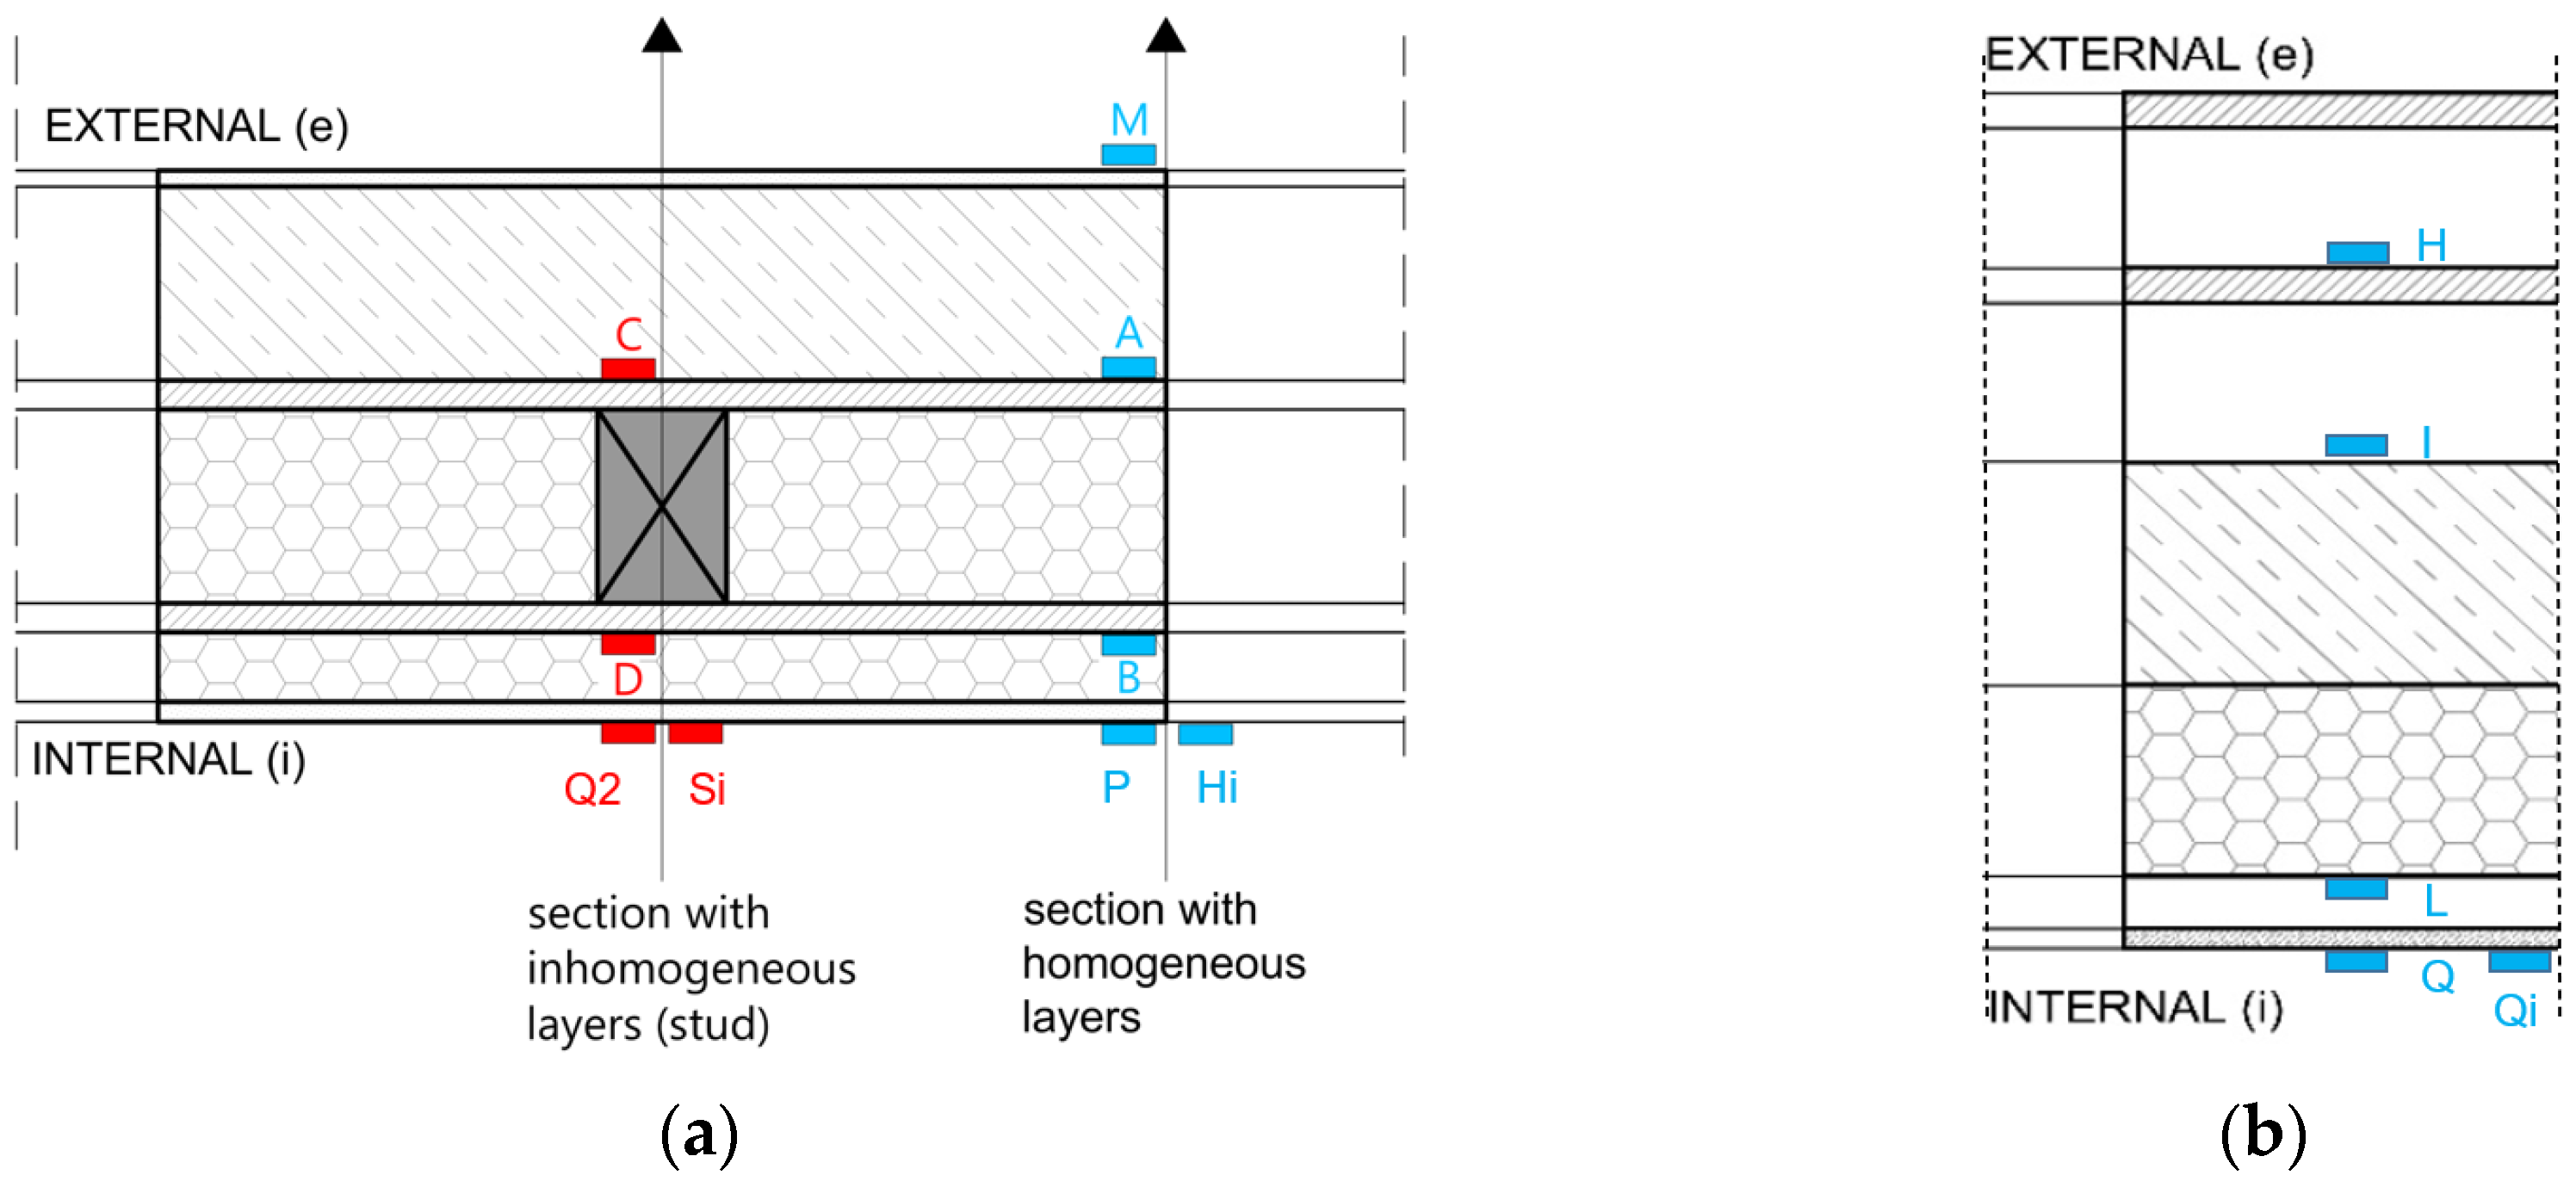
Figure 5a shows the position of the probes on the NW wall of bedroom 1. In the figure, on the right (light blue), there are the monitoring points on the homogeneous wall, while on the left (red), there are the monitoring points on the non-homogeneous wall, with the jamb. The monitoring system used is composed of the following probes:
two surface temperature probes placed on the inner surface of the wall at the homogeneous section (P) and the jamb (Q2), respectively;
two heat flow meters placed on the inner surface of the wall at the homogeneous section (Hi) and the jamb (Si), respectively;
four surface temperature probes placed within the different insulation layers of the wall (A, B, C, D);
a surface temperature probe placed on the external surface of the wall at the homogeneous section (M).
Figure 5b shows the position of the probes on the roof of bedroom 1. The monitoring system used is composed of the following probes:
one surface temperature probe placed on the inner surface of the roof (Q);
one heat flow meter placed on the inner surface of the roof (Qi);
two surface temperature probes placed within the different layers of the roof (I, L);
a surface temperature probe placed on the external surface of the roof before the ventilation layer (H).
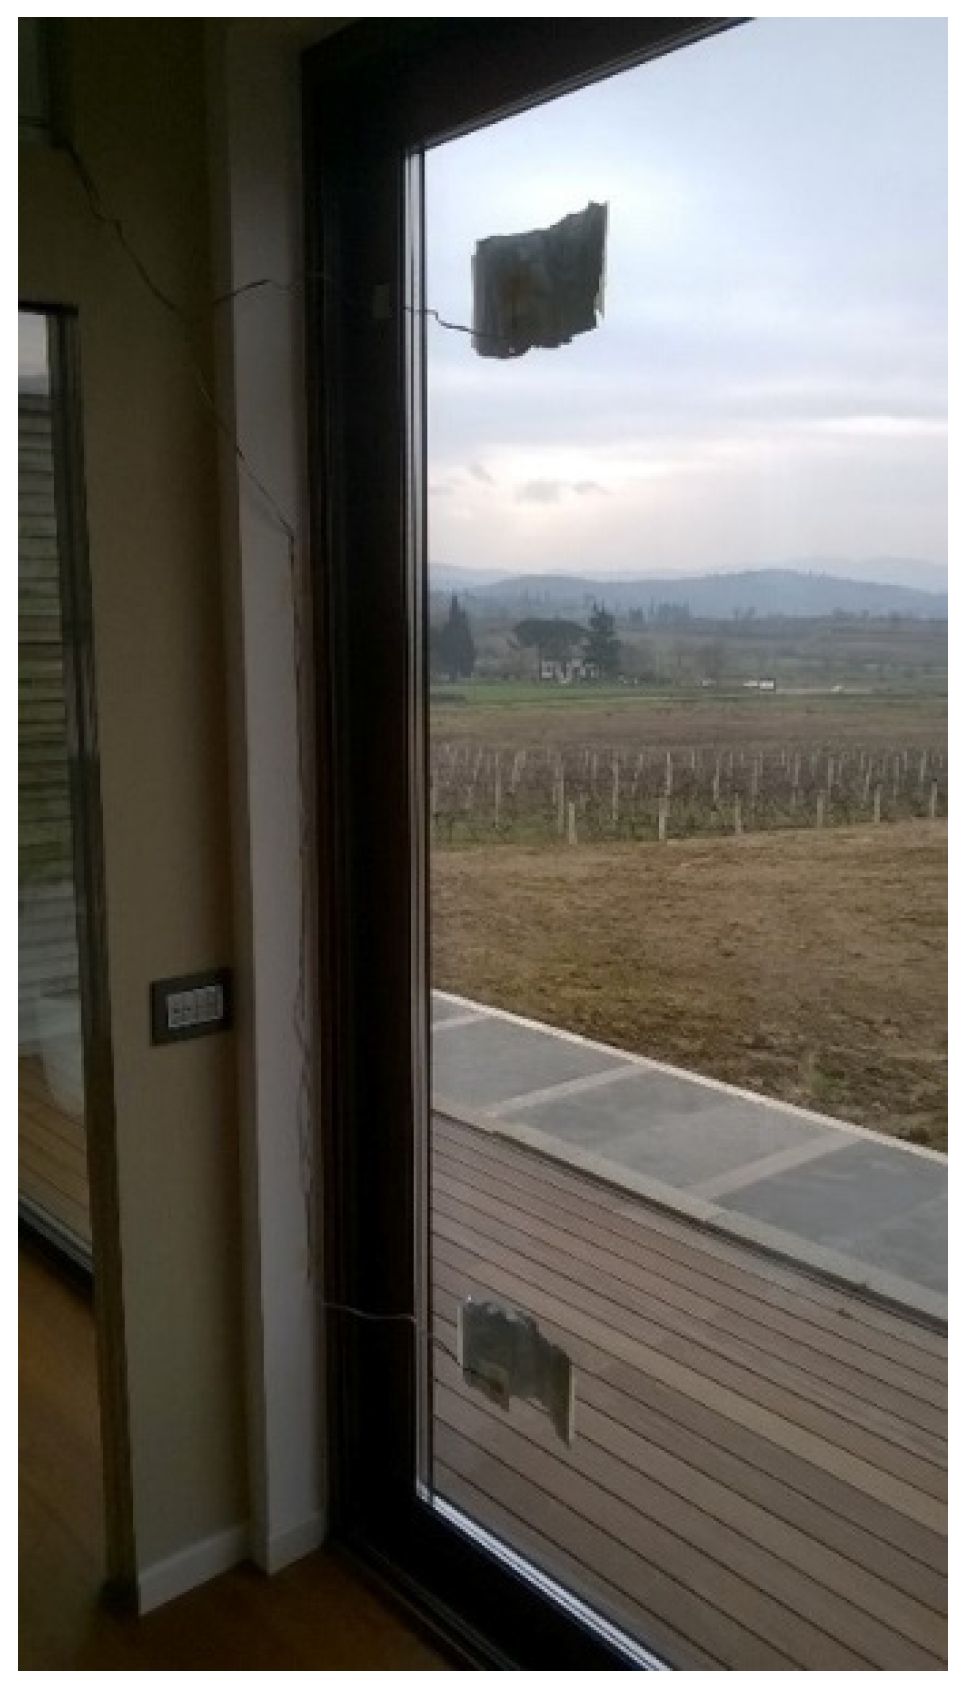
As regards the analyzed transparent components, the monitoring system was composed of dataloggers connected with surface temperature probes positioned on the internal and external surfaces of the glass (
Figure 6). This apparatus was used to analyze the wide window SW oriented of the living room (LR).
As regards the microclimate monitoring campaign, one datalogger to collect air temperature and relative humidity was placed in two representative rooms of the building with different orientations, bedroom 1 (BR1), and living room (LR). Also, one datalogger was placed outdoors (OUT), protected from direct solar radiation and rain. Both the on-site monitoring campaign aimed at the evaluation of the building components performance and the microclimate monitoring campaign ran from the 24 October 2017 to the 25 October 2018.
Because of the presence of wide windows SW oriented without any shading system, in the living room, the parameters relating to indoor thermal comfort were also collected. The monitoring system (
Figure 7) is composed of the microclimate monitoring station described in
Section 2.1 and two surface temperature probes (for the glass surface temperature monitoring). The monitoring aimed to assess both summer and winter thermal comfort was conducted in a representative period in the cooling season (from the 12 July to the 25 July 2018) and one in the heating season (from the 31 January to the February 2018).
The positioning of the building envelope components analyzed, the dataloggers used for the microclimate conditions monitoring, and the thermal comfort monitoring station in the representative rooms are depicted in
Figure 8.
4. Results and Discussion
4.1. Actual Thermal-Energy Performance of the nZEB Opaque Envelope
This section analyzes the results of the calculation based on on-site measured data of the properties describing the thermal-energy performance of the main opaque envelope components, i.e., external walls and roof.
Table 8 reports the on-site measured U-values, calculated according to UNI ISO 9869-1:2014 [
21], compared to those calculated at the design stage according to UNI EN ISO 6946:2008 [
22] for the two analyzed wall typologies and the roof. As for the wall of BR1, the values for the homogeneous section, the one at the jamb, and the geometric average are evaluated. Starting from the partial uncertainties previously shown in
Table 3, the calculated overall uncertainty of the measurement was equal to 16%.
Although the on-site measured U-values are lower than the reference values for an nZEB in climate zone E (U
ref values in
Table 7), they are slightly higher than those calculated at the design stage for both the walls (BR1 and BR2). On the contrary, the on-site measured U-value of the roof (RF) is slightly lower than the calculated one. However, it should be noted that the external surface temperature for the roof was measured under the ventilation layer and, thus, the contribution of this layer is not considered–while it is in the design stage calculation. The discrepancy between the as-designed U-values and the measured ones seems negligible, but the percentage difference between the measured and the calculated values, including the uncertainty of the measurement, varies between 32% and −2% for the weighted average of the plastered wall (BR1), 56% and 12% for the stone-coated wall (BR2), and −1% and −34% for the roof (RF).
Moreover,
Table 9 reports the values of calculated TL and DF based on the measured values of internal and external surface temperature [
23] for the plastered wall (BR1) and the roof (RF) in a reference summer period in July. In particular, the hourly mean values of external and internal surface temperature were used for the calculation.
In
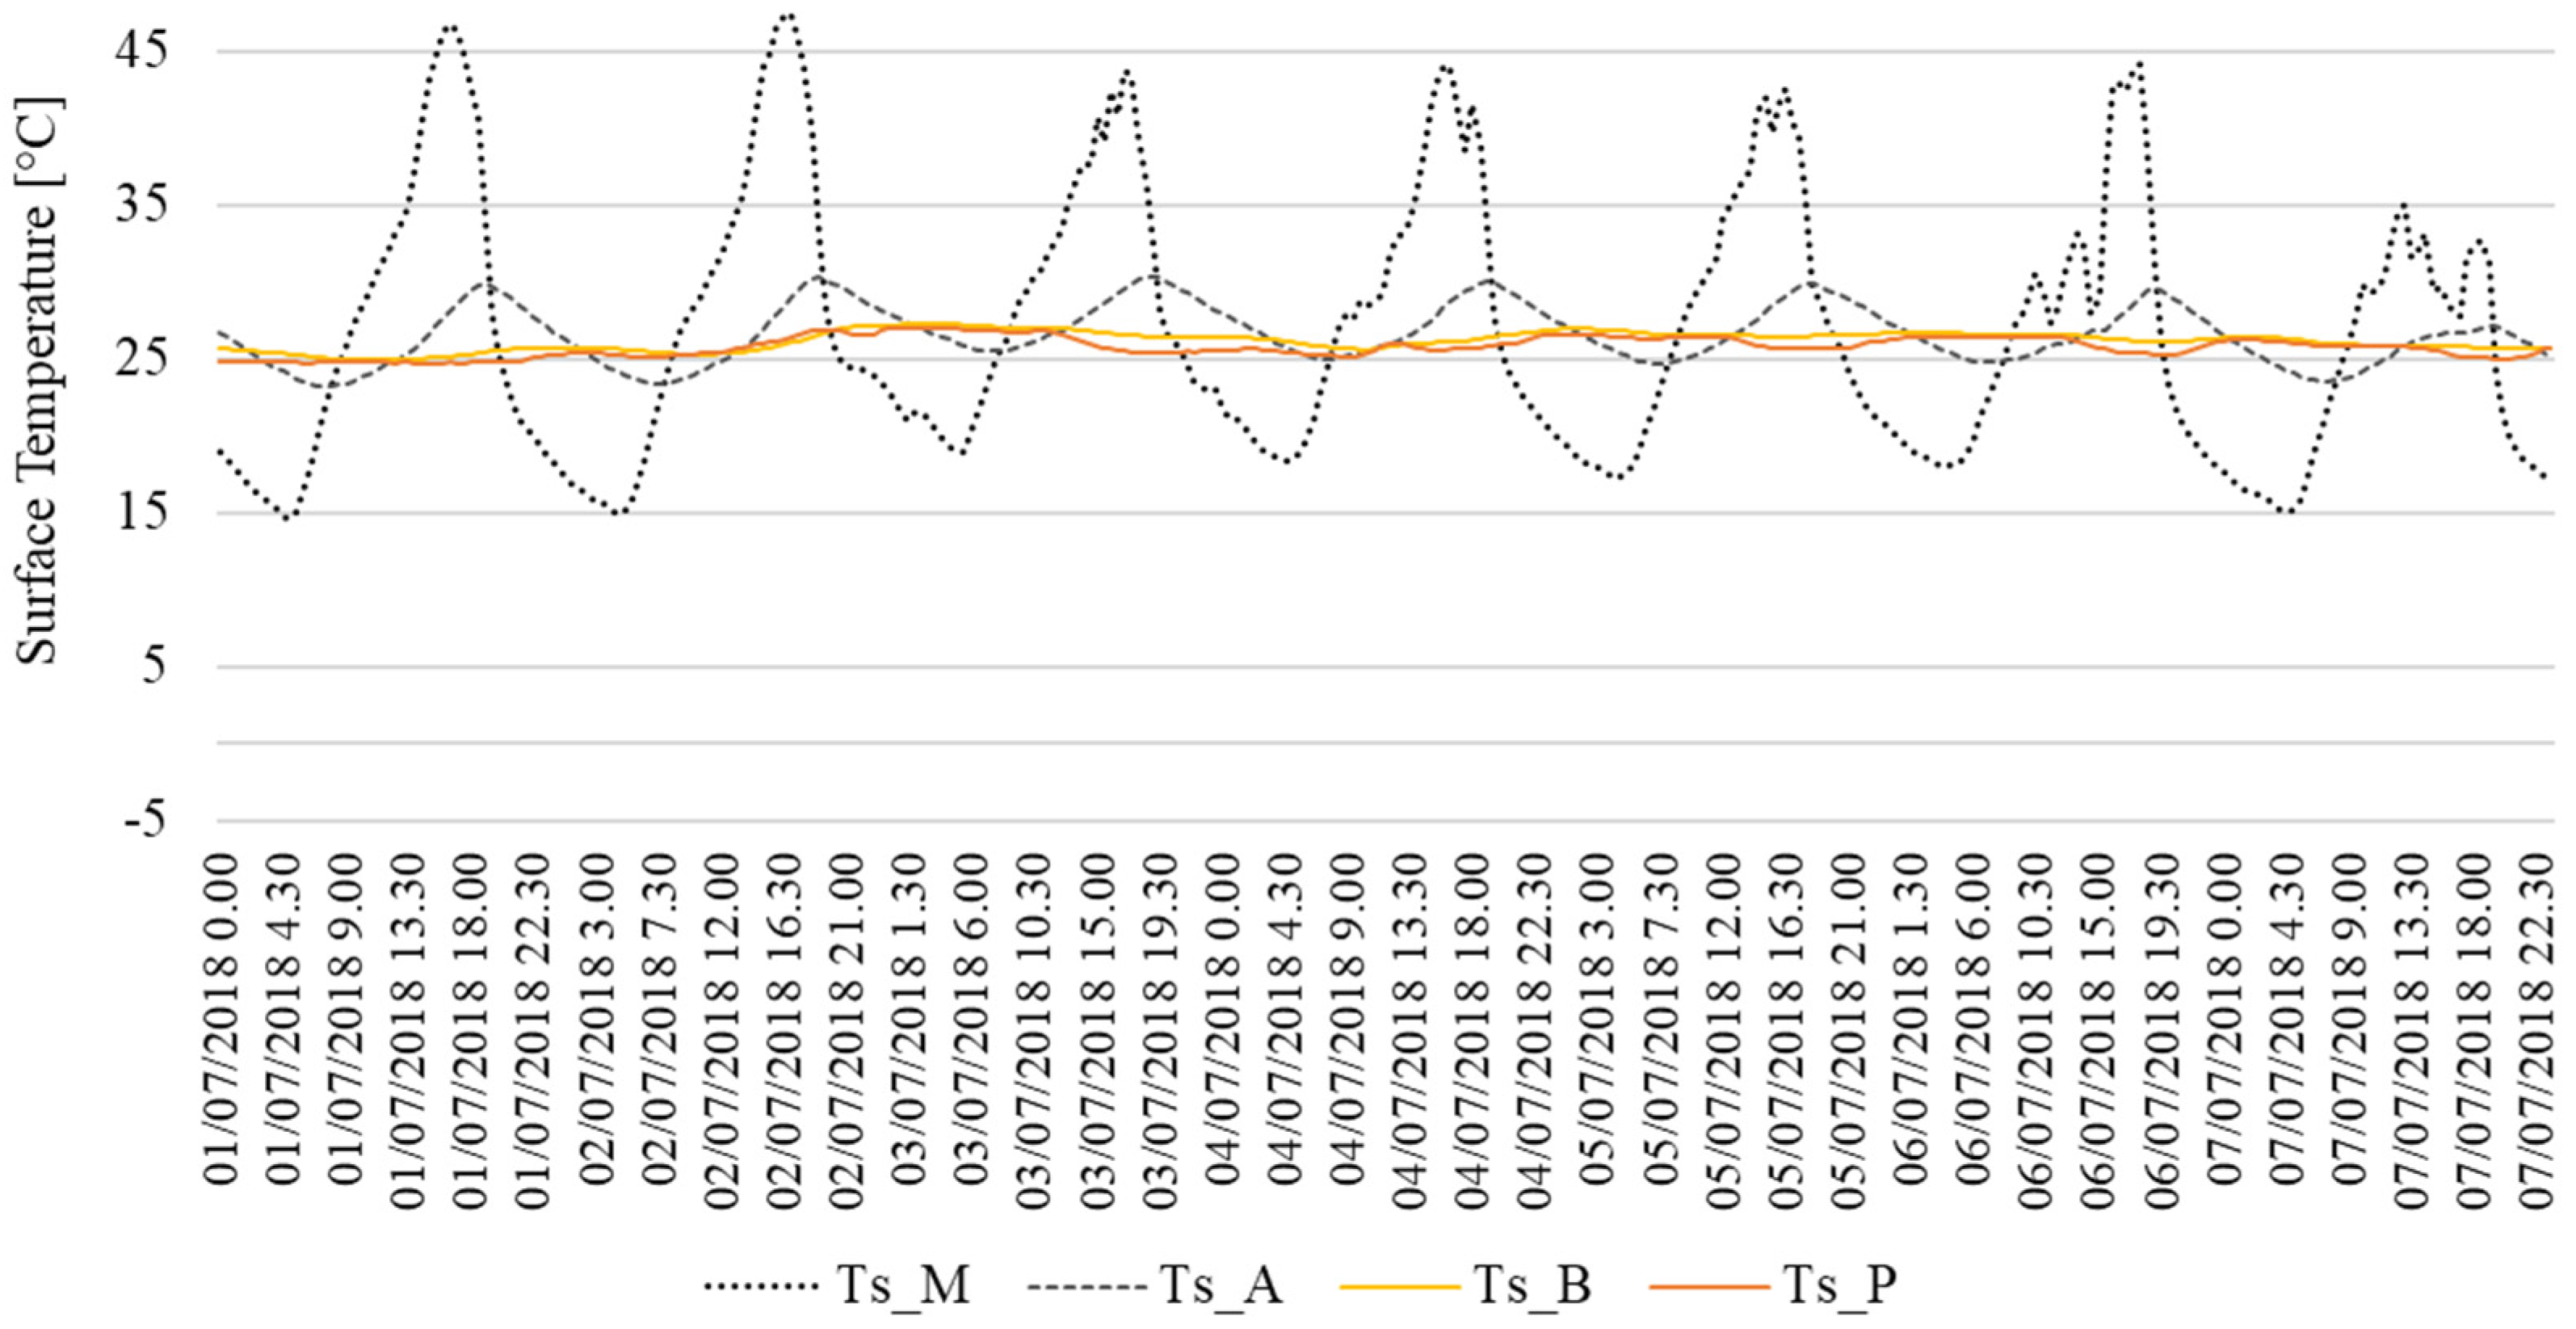
Figure 9 and
Figure 10, as an example, the time profiles of T
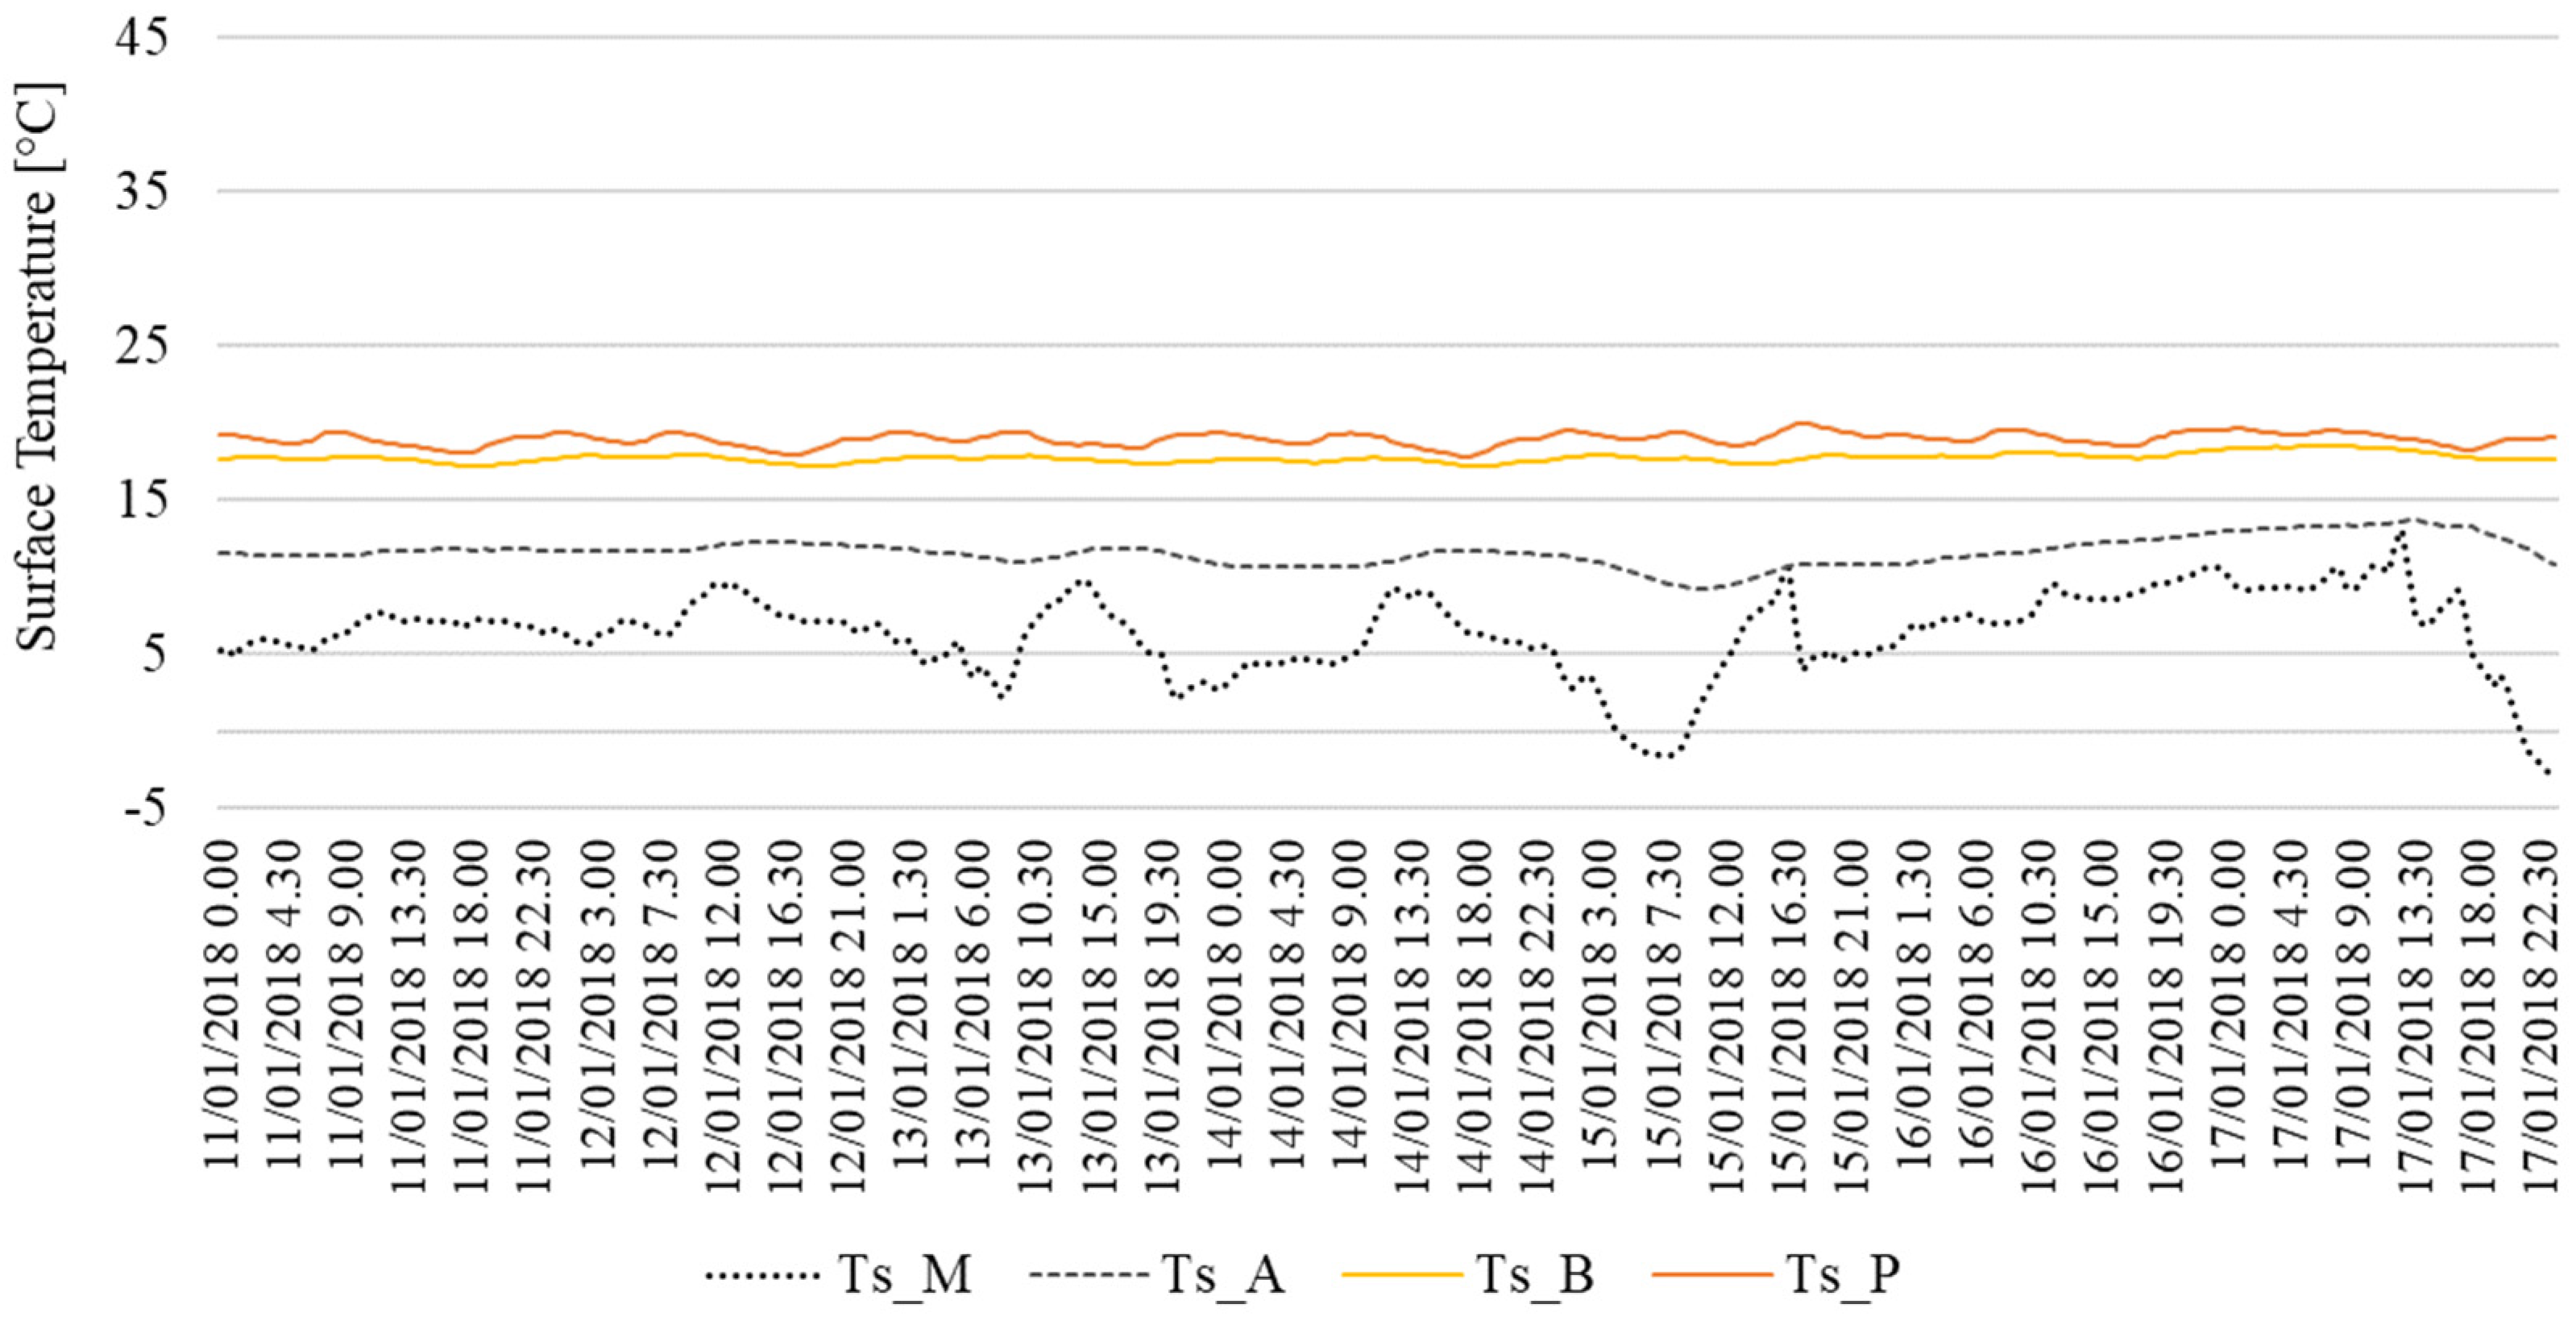
s values measured respectively from the 1 July to the 7 July 2018, and from the 11 January to the 17 January 2018, in the different layers of the plastered external wooden wall (BR1), are reported.
The temperature trend measured on the internal surface (T
s_P) of the plastered external wooden wall (BR1) is almost constant over time, with slight fluctuations due to external temperature variations; this is related to the high thermal resistance of the component. Starting from the outside of the wall (
Figure 5a), T
s_A represents the effect on the surface temperature trend due to the first layer of thermal insulation (0.12 m, λ = 0.036 W/m K), while T
s_B represents the effect on the surface temperature trend due to the second layer of thermal insulation (0.12 m, λ = 0.035 W/m K) [
15]. The analysis of the temperature trend on these inner layers (T
s_A and T
s_B) of the wooden wall during the week reported in
Figure 9 (cooling period) highlights how the thermal insulation layers affect the inertial properties of the component. This results in a low value of decrement factor (DF) and a high value of time lag (TL). In the heating period, referring to the week reported in
Figure 10, the analysis of the temperature trend of the inner layers (T
s_A and T
s_B) of the wooden wall highlights the effectiveness of the different thermal insulation layers, with average surface temperatures rising from external to internal: 6.3 °C (T
s_M), 11.6 °C (T
s_A), 17.7 °C (T
s_B), and 19 °C (T
s_P).
4.2. Actual Indoor Microclimate Conditions in the nZEB
This section reports the main results of the microclimate monitoring in the analyzed nZEB. The critical analysis of the monitored data aimed at stressing the main criticalities and describing the real conditions monitored in the building with respect to those expected.
Figure 11 presents the time profiles of T and RH measured in bedroom 1 (BR1) from the 24 October 2017 to the 25 October 2018 against the outdoor values (OUT). In the figure, the heating (15/10–15/04) and cooling (11/06–08/09) seasons are also highlighted.
In bedroom 1 (BR1) during the heating period, in the face of high external air temperature fluctuations, the internal temperature trend is quite constant. As for the RH, in the same period the internal values never exceed 60%, even against external values close to 100%. On the contrary, very often the internal values fall below 40% with winter periods characterized by very dry indoor air (RH reaching minimum values of 30–20%). These low values are mainly related to the corresponding outside low values and to the type of HVAC system installed. During the cooling period, the internal temperature never exceeds the 26.8 °C, with RH remaining around the average value of 50%, even against external temperatures that reach even 38 °C.
In particular, in
Figure 12, the time profiles of T measured in bedroom 1 (BR1), and living room (LR) during the cooling period are presented.
In the cooling period, the internal temperature trend at the two measuring points is quite different, with higher values, even more than 1 °C, in the living room (LR), where there are also much wider daily variations, probably due to the lower inertial capacity of this environment, characterized by large windows facing SW irradiated in the afternoon and a window-to-wall ratio of 51.8% compared to a window-to-wall ratio of the bedroom 1 (BR1) of 22.5%.
In
Figure 13, for one summer (the 14 July 2018) and one winter (1 February 2018) day, the time profiles of T and T
g measured in the living room (LR) during the comfort monitoring campaign, are compared with the T
r and T
o calculated as reported in
Section 2.3.
Figure 13 shows that the air temperature T and the operative temperature T
o differ by less than 0.5 °C, with slightly higher deviations in the winter period, due to the strong thermal insulation of the building envelope.
In
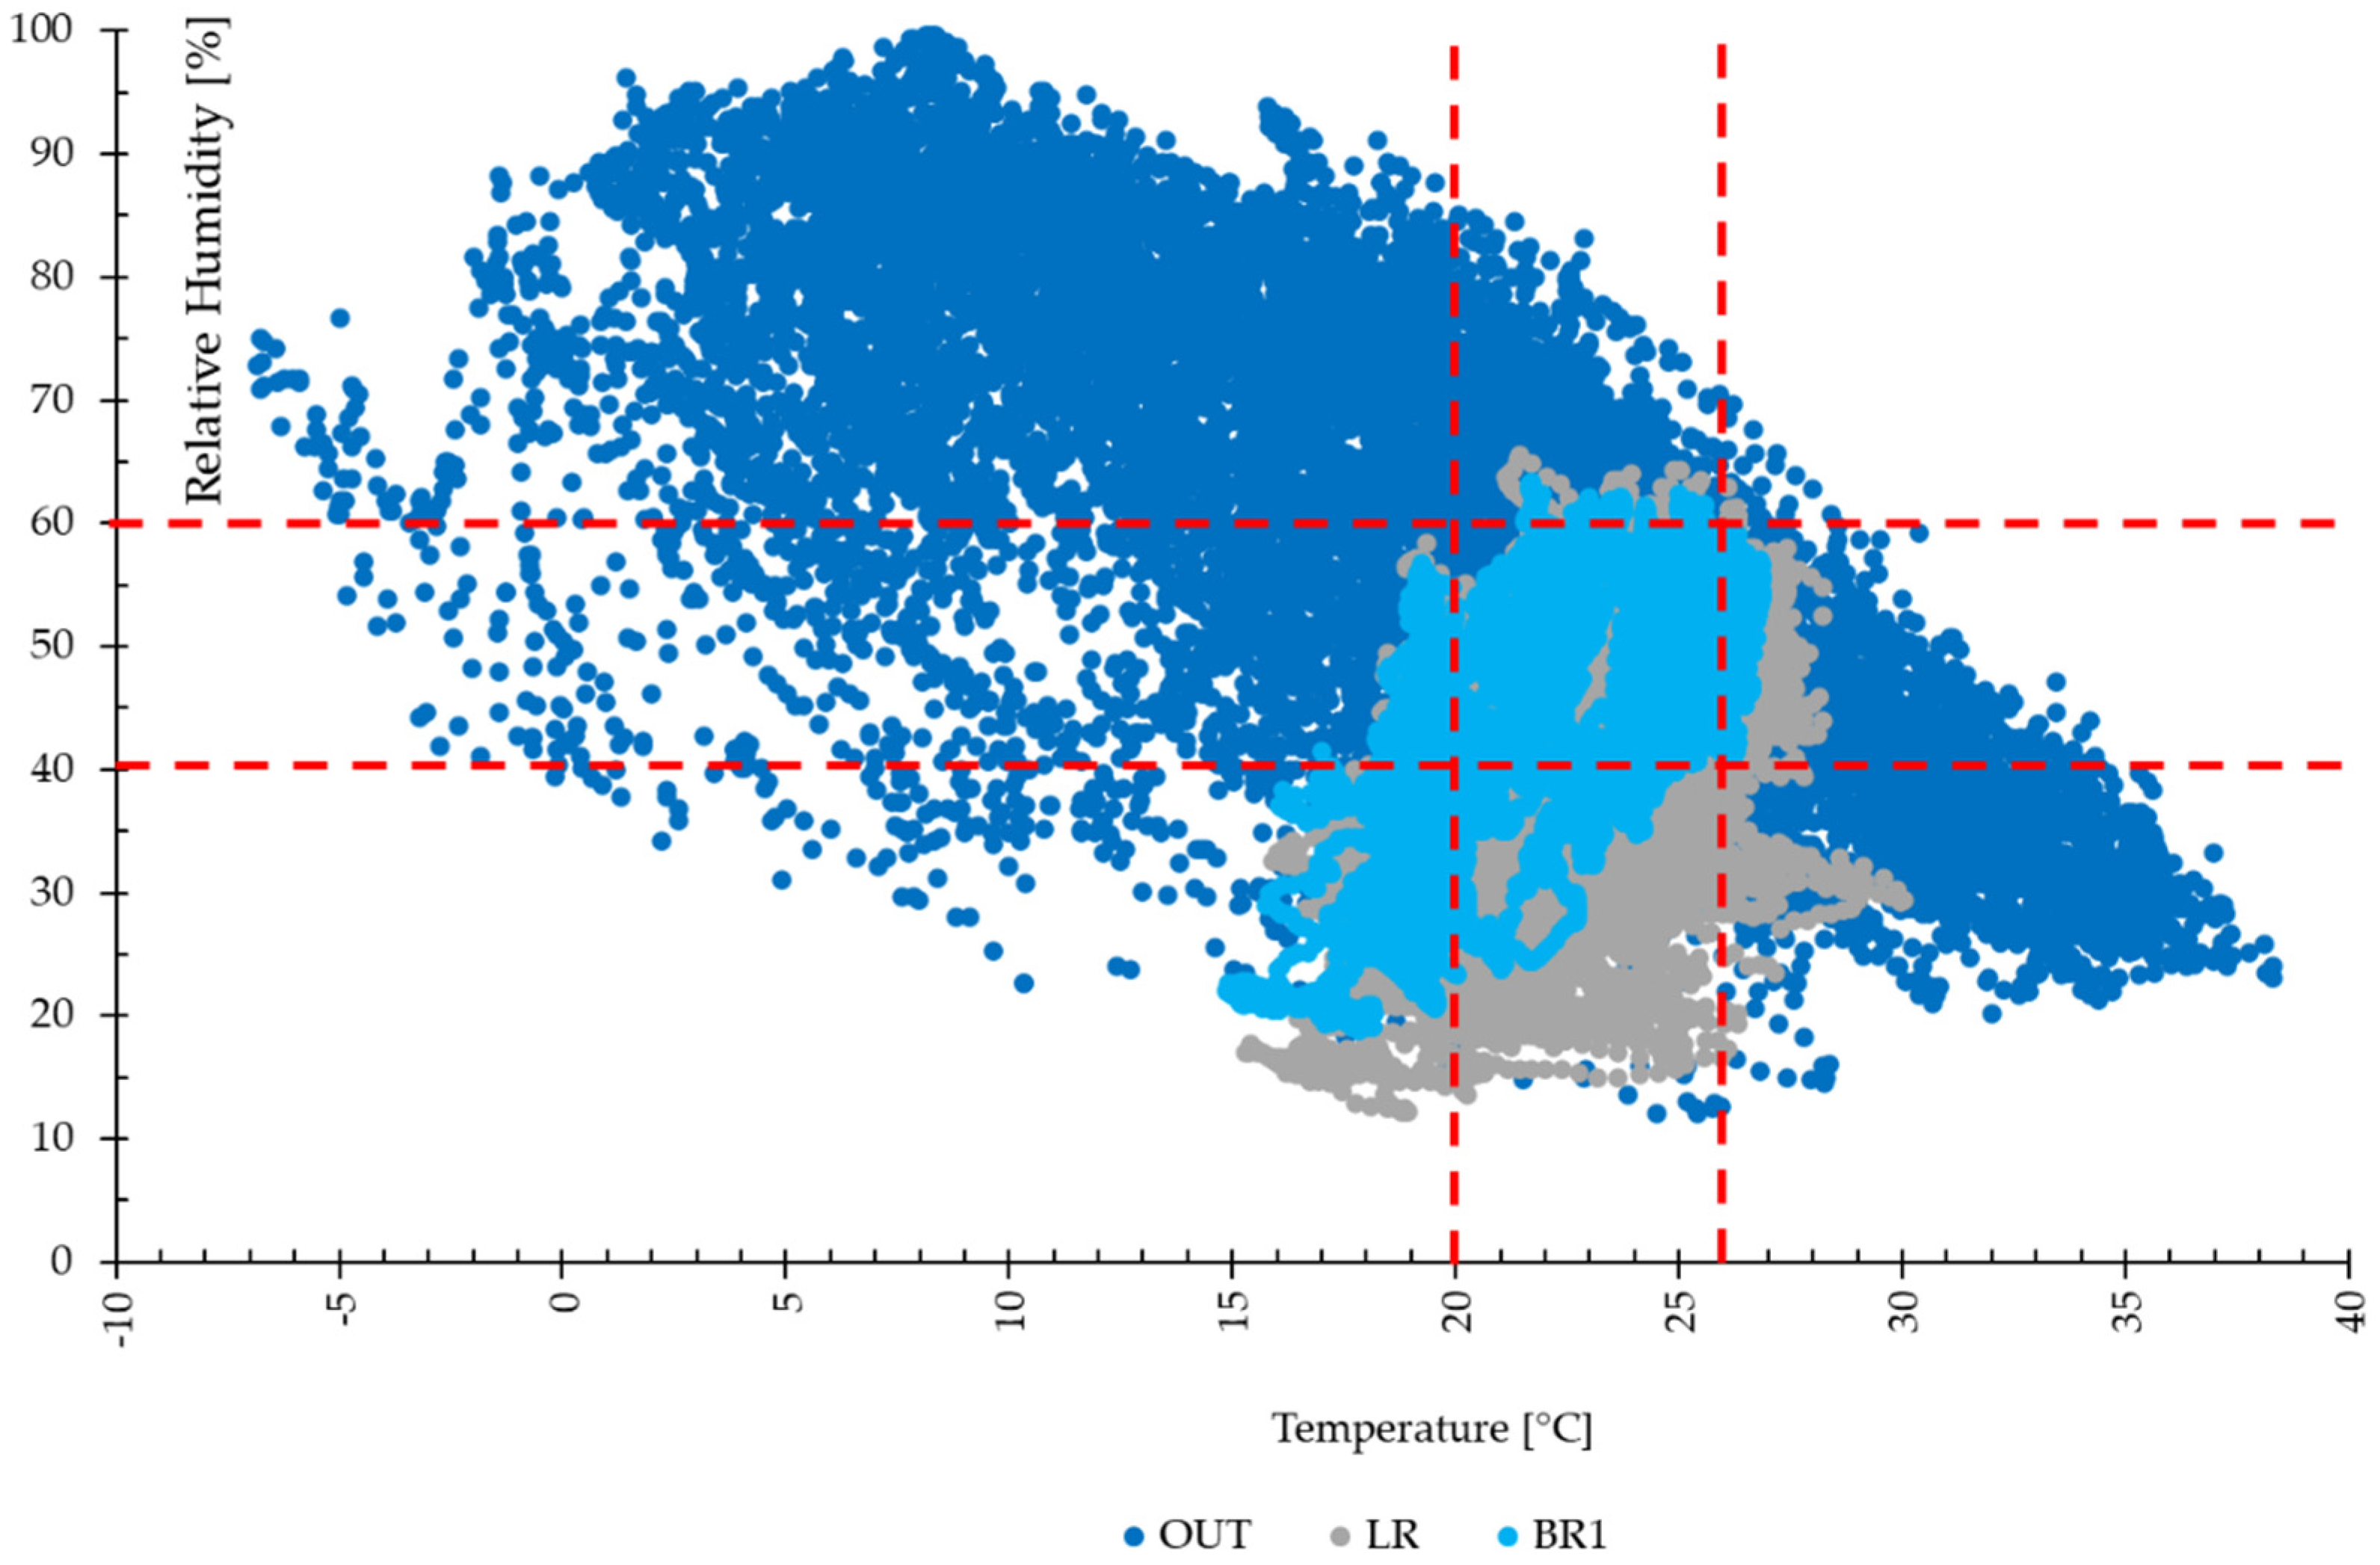
Figure 14, the values of T and RH measured in bedroom 1 (BR1), living room (LR), and outdoors (OUT) for one year are presented and compared with the ranges of occupants’ well-being reported in
Section 2.3 (20 °C ≤ T ≤ 26 °C and 40% ≤ RH ≤ 60%), considering air temperature and operative temperature coincident with an acceptable error of approximation.
The annual values are within the range considered optimal for human comfort for 48% in the bedroom and 43% in the living room. In particular, during the heating period, 82% of internal temperature values in the bedroom and 33% in the living room are lower than 20 °C. This can be justified by the shorter duration of occupancy in the bedroom, the night-time attenuation of the HVAC system, and the turning off of the system when the building is not occupied. The internal RH values are less than 40%, especially in winter (51% of the values in the bedroom and 71% in the living room). In the cooling period, 33% of internal temperature values in the living room and 12% in the bedroom are higher than 26 °C.
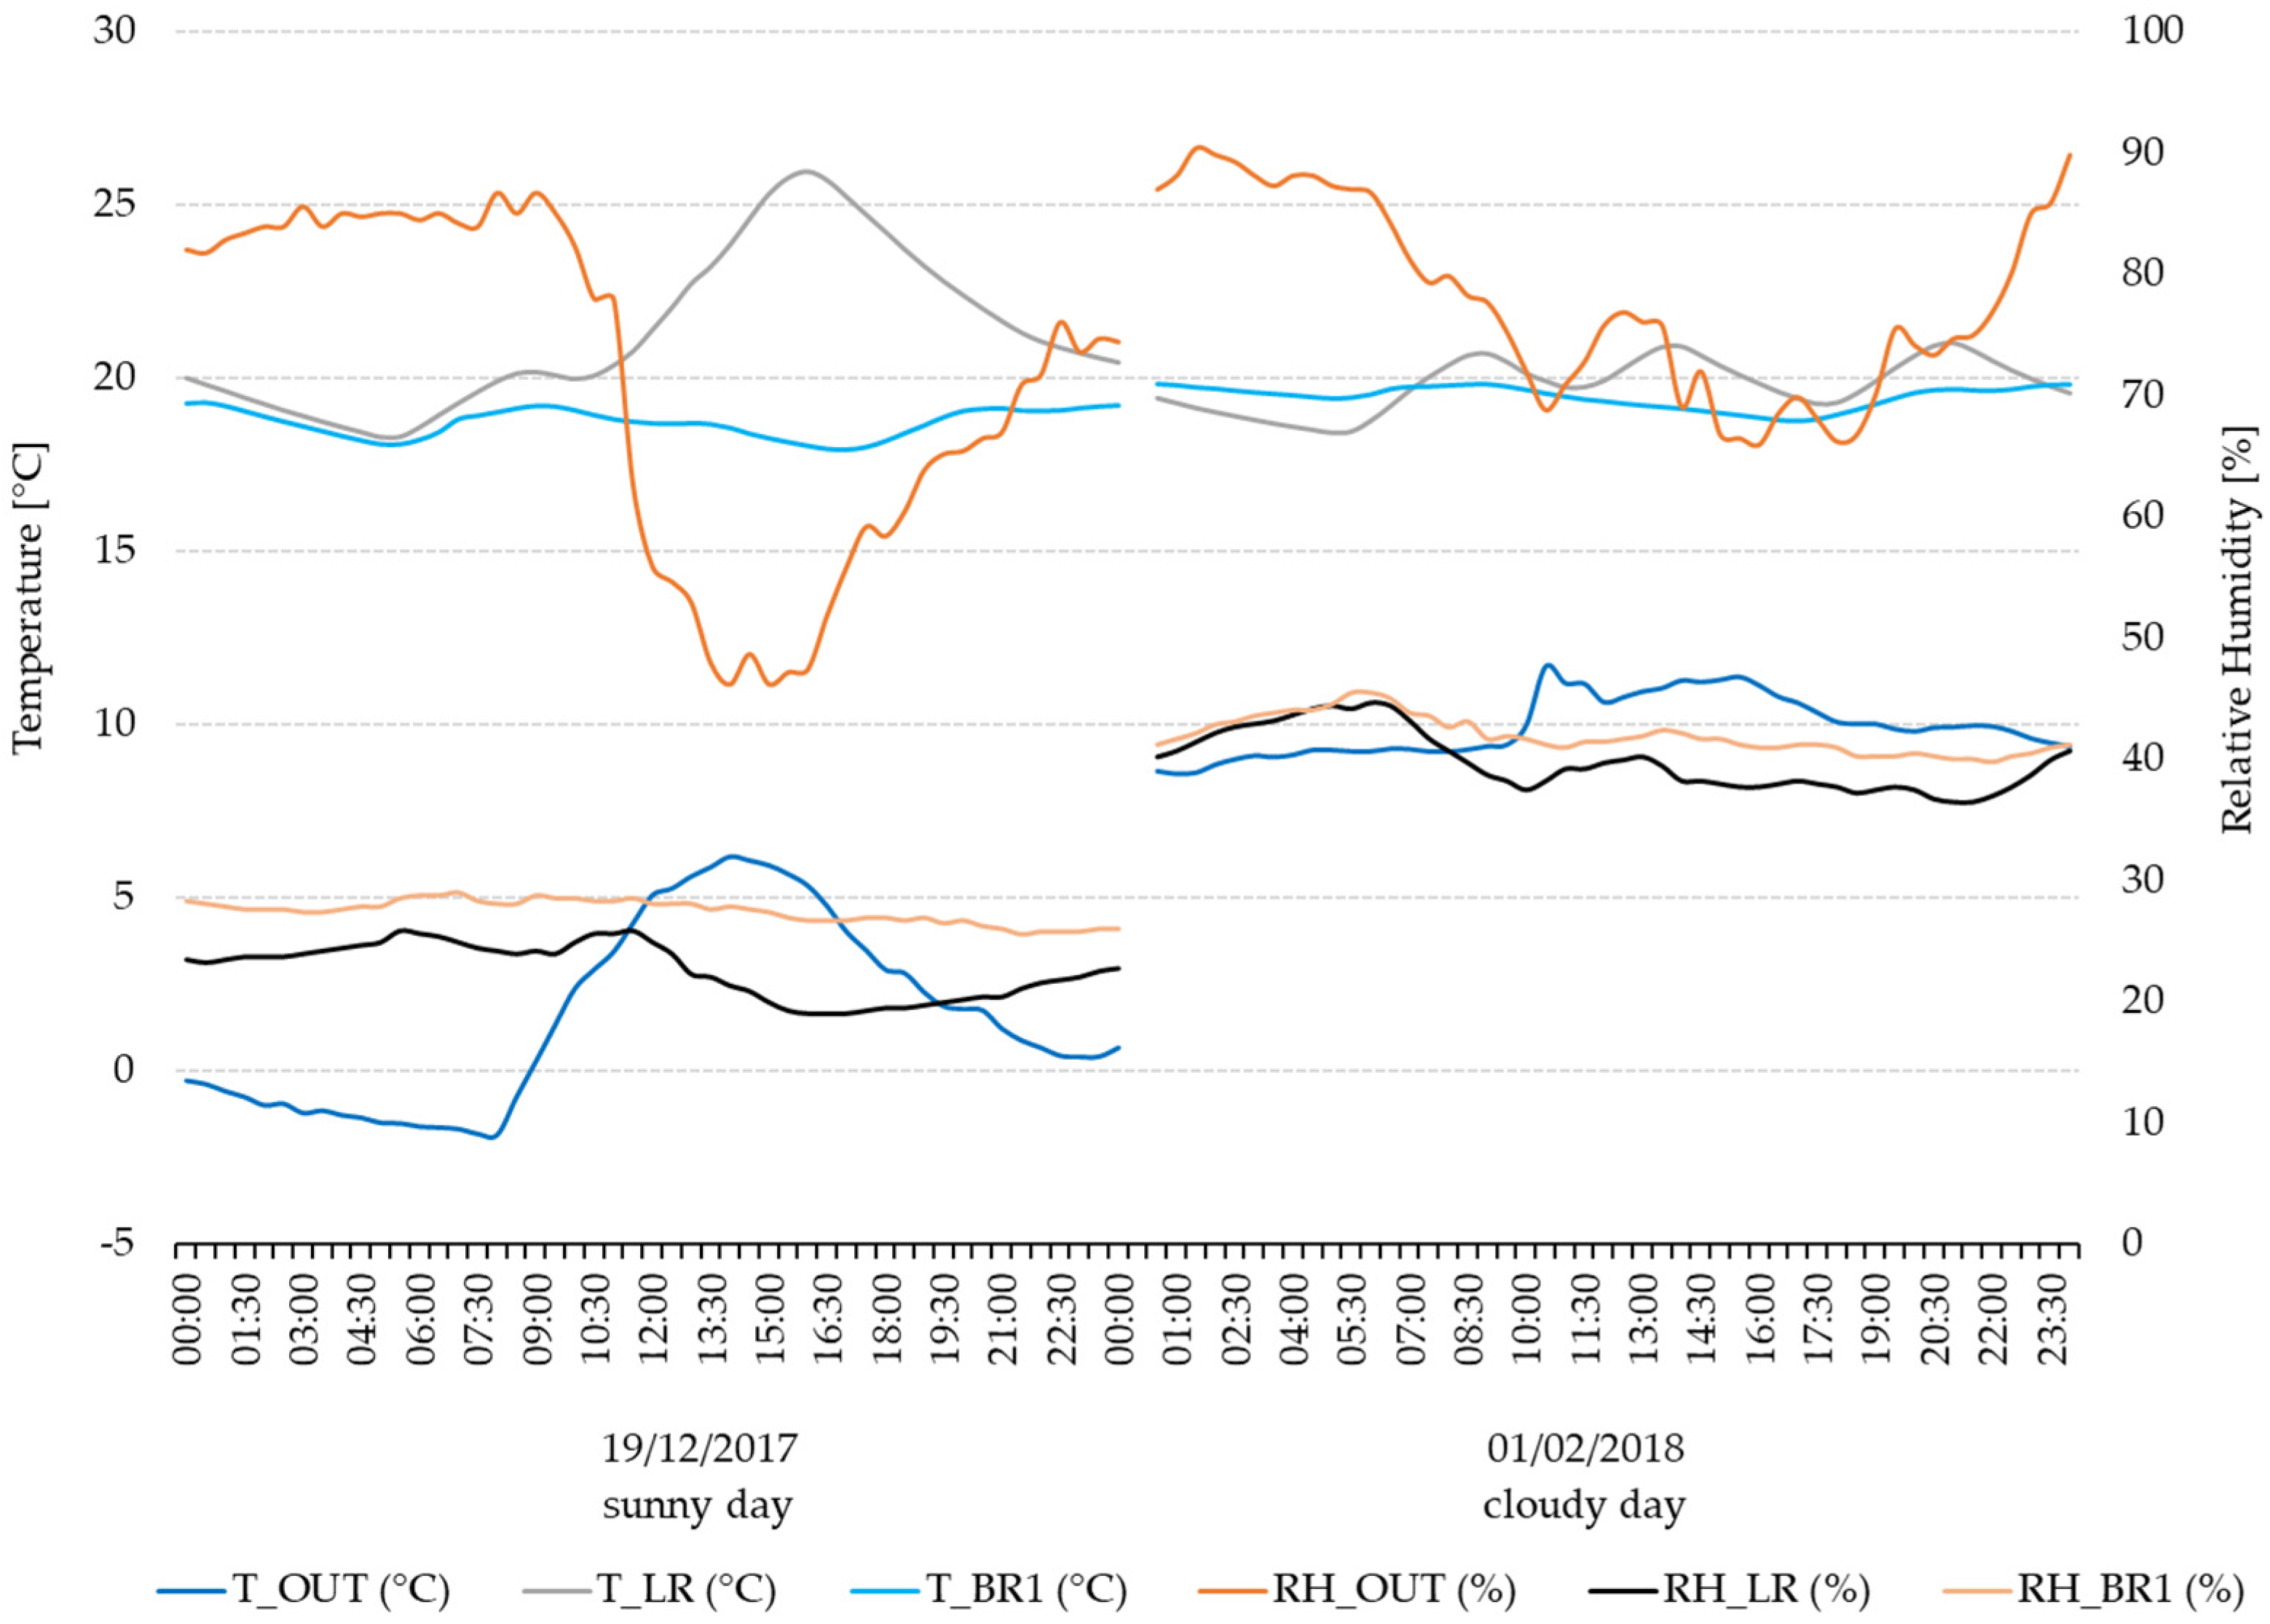
Figure 15 presents the time profiles of T and RH measured in bedroom 1 (BR1) and living room (LR) in typical winter days (19 December 2017 and 1 February 2018) against the outdoor values (OUT).
Figure 15 shows that in the living room (LR) there is a greater daily variability of values than the bedroom (BR1). In addition, on a typical sunny day (19 December 2017), it is noted that the large SW oriented glass surfaces of the living room guarantee good solar gains bringing the internal temperature to values close to 26 °C, despite the low value of g (g = 0.34); this against very low internal RH values, close to 20%.
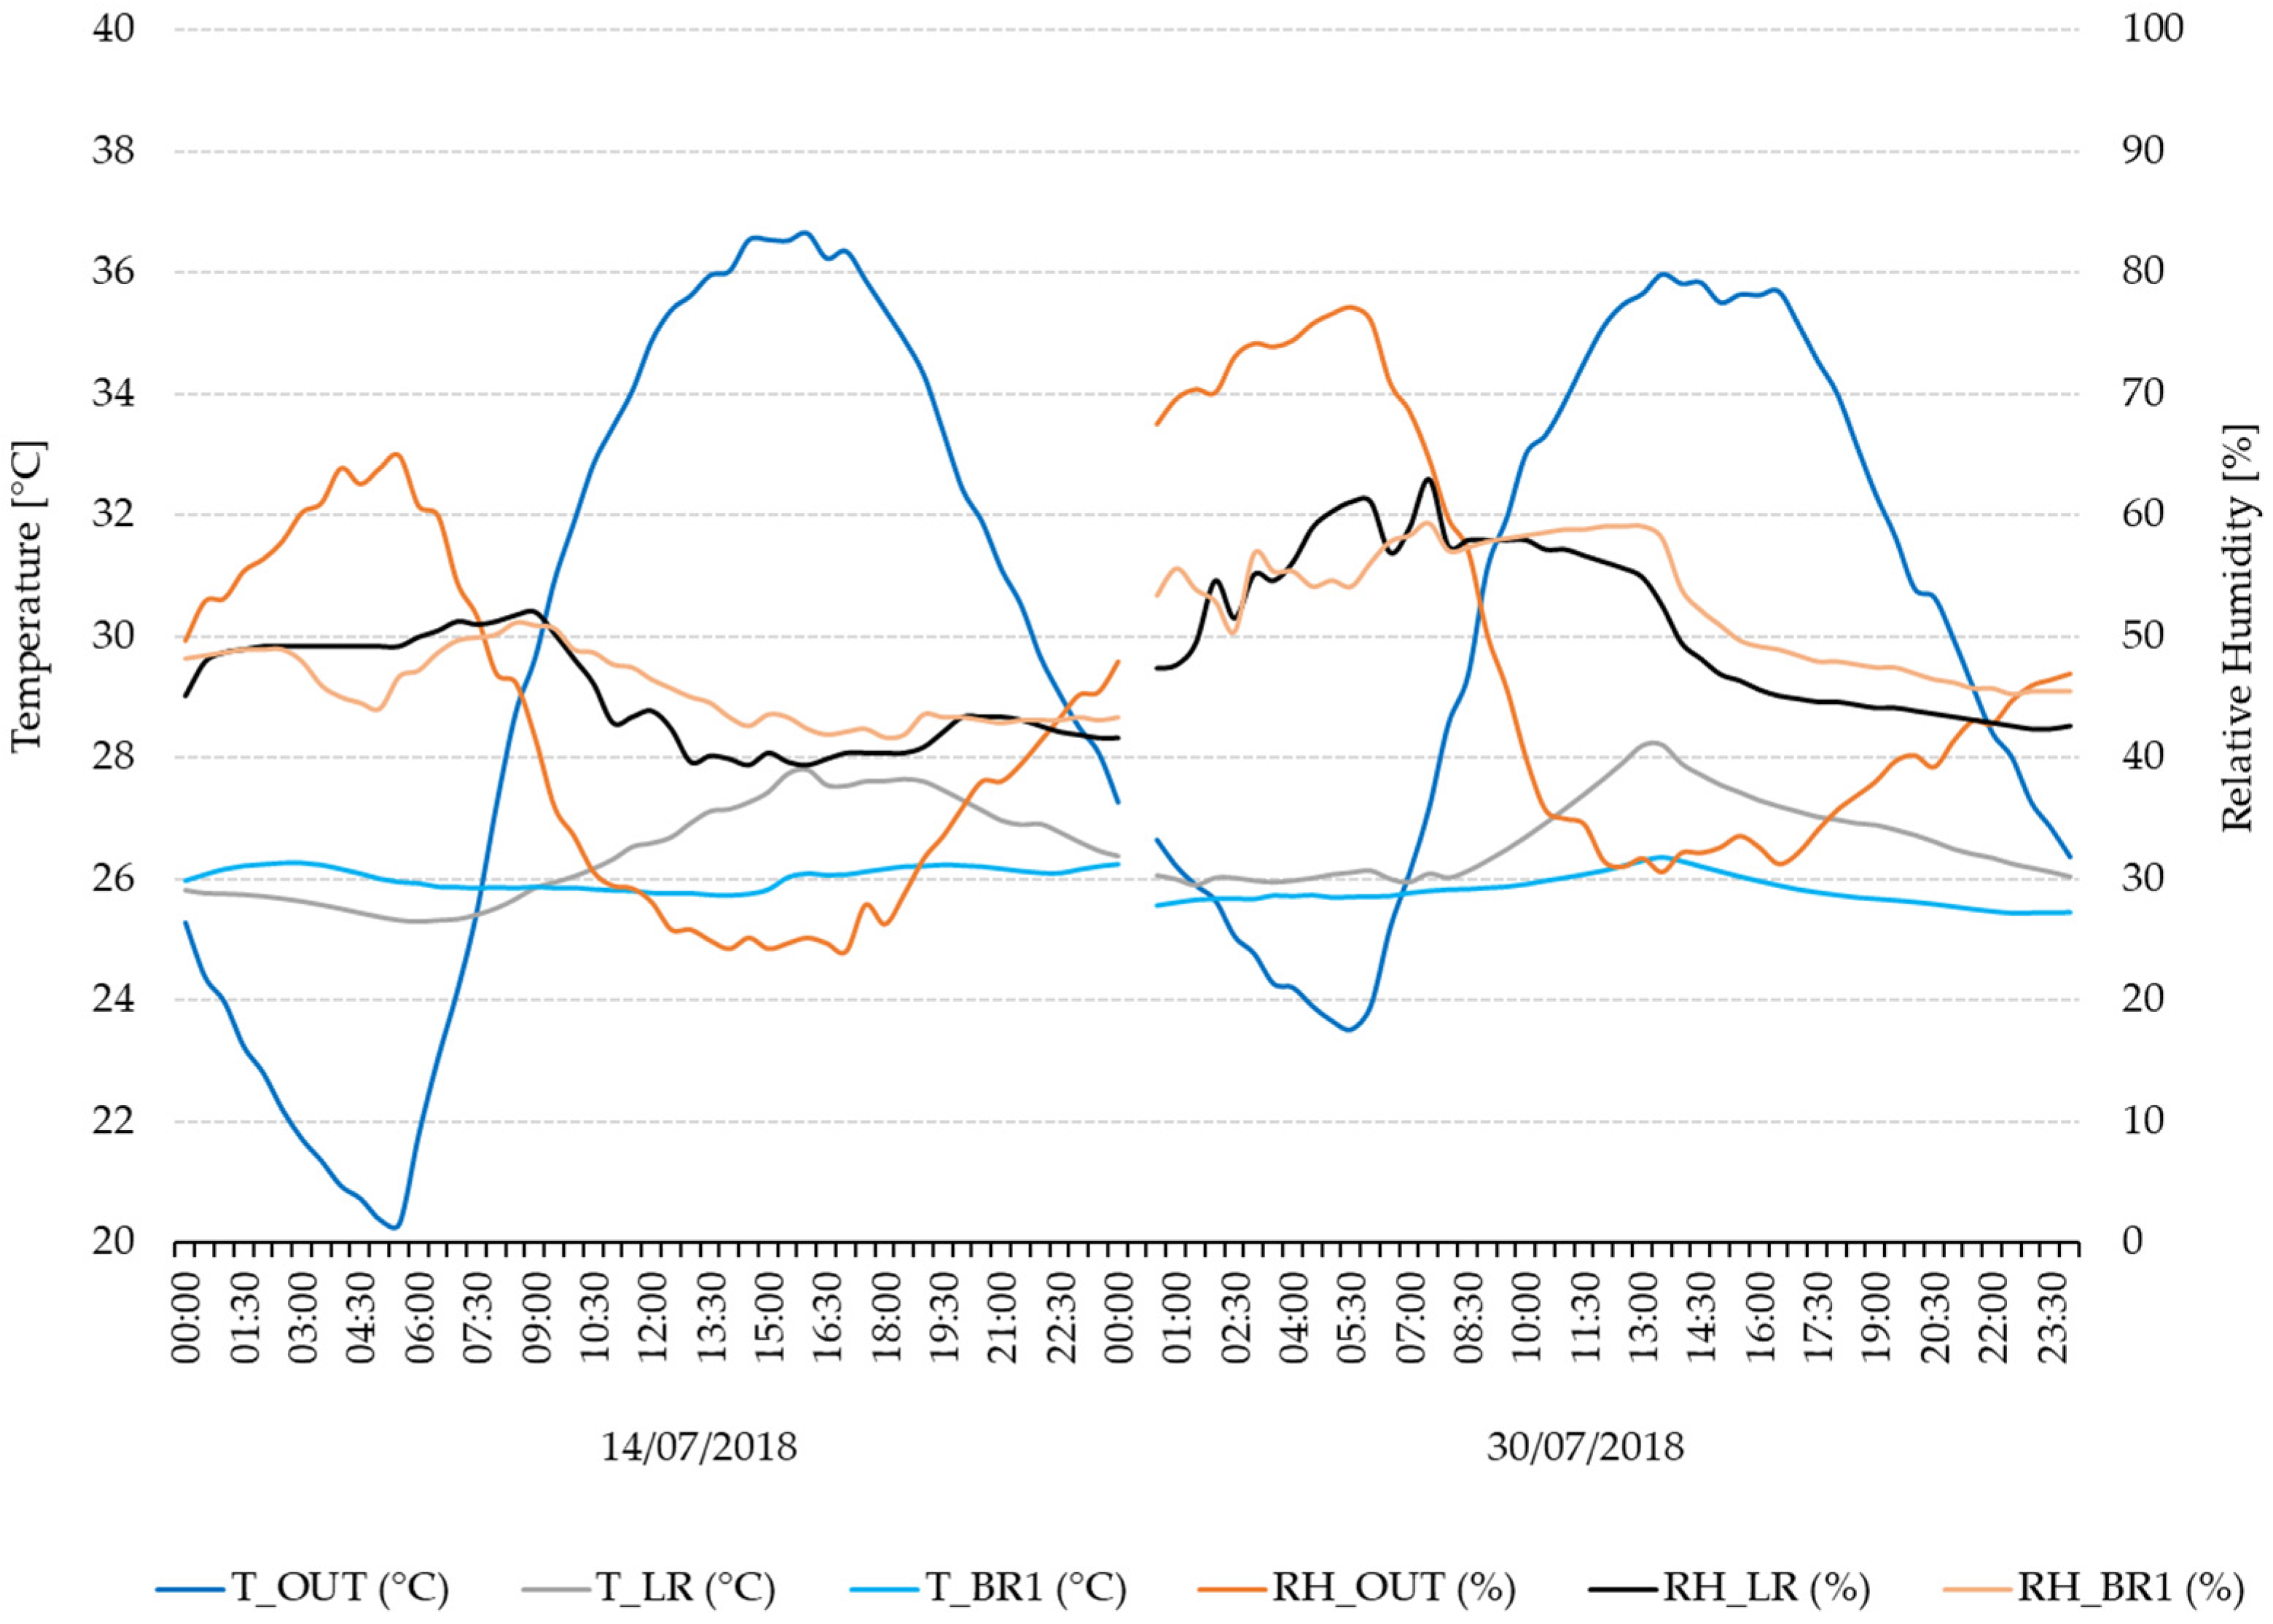
Figure 16 presents the time profiles of T and RH measured in bedroom 1 (BR1) and living room (LR) in typical summer days (14–30 July 2018) against the outdoor values (OUT).
In the summer period, there is a greater variability of temperature values in the living room (LR) than in the bedroom (BR1). In the SW oriented living room, with a window-to-wall ratio of 51.8%, in the afternoon, when solar radiation enters the building, internal temperatures reach 28 °C, while in the NW oriented bedroom, with a window-to-wall ratio of 22.6%, temperatures remain close to 26 °C.
In
Figure 17, for one summer day (13 July 2018), the time profiles of the mean radiant temperature (T
r), the internal (T
s,glass_i) and external (T
s,glass_e) surface temperature of glass, and the radiant heat flow (RA) measured in the living room (LR) are reported.
The graph highlights that, during the cooling period, in the presence of direct solar radiation, the internal surface temperature of the glass of the large windows featuring the SW living room, reaches values around 30 °C; the value of the radiant heat flow becomes positive meaning surface temperatures of the glass greater than those of the opposite wall, indeed.
In
Figure 18, for one winter day (1 February 2018), the time profiles of the internal (T
s,glass_i) and external (T
s,glass_e) surface temperature of glass, measured in the living room (LR) are reported. The Figure highlights that the large glass surfaces that characterize the SW living room have a good thermal insulation performance, ensuring quite high internal surface temperatures (around 17 °C).
5. Conclusions
The present work focuses on the results of an experimental campaign on the performance of a newly built nZEB single-family house located in central Italy. The work aimed to assess its real operational conditions and to point out the role of envelope performance in the indoor microclimate and occupants’ well-being. The one-year monitoring data analysis and discussion underline the positive aspects as well as the critical issues of the building under analysis. The real performance of the case study building envelope was monitored and analyzed thanks to several temperature probes and heat flow meters installed in the opaque component layers and on the surfaces of the transparent components during the construction phase. Moreover, different apparatus for the monitoring of indoor microclimate and well-being were put in the different rooms of the building. Some interesting conclusions were drawn from the analyzed data and the effectiveness of the choices made during the design phase was emphasized.
Regarding the opaque components performance, in the heating season, the discrepancy between the as-designed U-values and the measured ones seems negligible and the U-values are always lower than the limit value reported by the current legislation on nZEBs. As a result of the high thermal resistance of the components, the temperature trend measured on the internal surfaces was almost constant over time, with slight fluctuations due to external temperature variations. However, when technologies that include non-homogeneous sections are used in the building envelope, such as platform frame in this case, greater attention must be paid to the real U-values calculation since the non-homogeneous sections affect the average transmittance values. Moreover, extremely low thermal transmittance values may cause some critical issues in summer by trapping thermal loads in the building if not combined with efficient climate control strategies tailored to the real needs and uses of the occupants. The analysis of the components in the cooling season shows good values of decrement factor (DF) and time lag (TL), based on the measured values of internal and external surface temperature. Indeed, although the observed DF and TL are slightly different from those calculated, the components achieve a good thermal inertia value compliant with the limit values of the Italian legislation.
As regards the transparent components, a window transmittance extremely lower than the limit value supports the achievement of adequate indoor comfort levels in winter due to the improved uniformity of mean radiant temperature. In addition, even if the g-value is low, solar winter gains are not penalized. However, this design strategy is not as effective as expected in summer when the unwanted solar gains are only partially shielded. Therefore, a careful assessment of the balance in terms of thermal losses and gains should be improved since the preliminary stages of the project according to the climatic peculiarities of the site. In particular, the selection of the window features in mid-climate contexts should be carefully evaluated by also considering the design strategies in terms of the window-to-wall ratio in the different orientations as well as the presence and effectiveness of shading devices.
As for the indoor microclimate as well as occupants’ well-being assessment, the match of the analyzed parameters with reference comfort values is quite good, especially for operative temperature. Nevertheless, some critical issues were observed regarding low relative humidity values, due to the low latent heat loads related to the presence of the occupants and the external hygrometric conditions typical of the case study location climate, which are poorly controlled by the mechanical ventilation system. Moreover, a difference between the bedroom and the living room microclimate was noted, because of the different orientation, window-to-wall ratio, and the presence of different solar shading devices. In particular, the performance of these devices could be improved with an automated control system designed to assure indoor daylighting and, thus, visual comfort, while properly controlling solar gains in the different seasons.
In conclusion, the above-listed outcomes of the monitoring data assessment allowed to understand important gaps between the expected and the real performance of the analyzed nZEB. The analyzed aspects are shown to be of fundamental importance when an nZEB target is aimed. Therefore, the awareness of these aspects is strategic for the proper design, construction, and operation of nZEBs in the Mediterranean climate context. This knowledge dissemination, deriving from the analysis of the real monitored performances of existing buildings, should engage many players in the construction sector, including designers, policymakers, and occupants.

