Article

A New Method for Shale Oil Injecting-Stewing-Producing Physical Modeling Experiments Based on Nuclear Magnetic Resonance

1
College of Petroleum Engineering, Yangtze University, Wuhan 430100, China
2
Hubei Drilling and Recovery Engineering for Oil and Gas Key Laboratory, Wuhan 430100, China
3
No. 4 Gas Production Company of PetroChina Changqing Oilfield Company, Xi’an 710018, China
*
Author to whom correspondence should be addressed.
Energies 2024, 17(3), 694; https://doi.org/10.3390/en17030694
Submission received: 3 January 2024 / Revised: 27 January 2024 / Accepted: 30 January 2024 / Published: 31 January 2024
(This article belongs to the Section L: Energy Sources)

Abstract

:
Enhancing oil recovery in shale is a critical technology for improving shale oil extraction efficiency. It is essential to develop a comprehensive set of physical simulation methods that are coherent and aligned with practical field operations. This paper establishes an integrated experimental approach, encompassing the entire Injecting-Stewing-Producing cycle, to simulate the actual Huff-n-Puff process accurately. Initially, the fracturing and flowback states are simulated by injecting an imbibition fluid, followed by a 48 h well-soaking process using CO2. The extraction is then carried out under various pressures. The microtransportation of crude oil across different pore sizes and the extent of extraction during shale oil Huff-n-Puff are investigated using Nuclear Magnetic Resonance technology. The results suggest that there was an initial increase in crude oil within pores smaller than 20 nm at the beginning of the Huff-n-Puff process. In Contrast, crude oil in pores larger than 200 nm was preferentially extracted, with oil in smaller pores (<200 nm) migrating to larger pores before extraction. After the initial Huff-n-Puff cycle, the extraction efficiency of the shale oil core reaches 29.55%, constituting 63.3% of the total extraction achieved over three Huff-n-Puff cycles. This study also identifies a critical pressure drop to 60% of the initial pressure as the optimal point for injection in subsequent Huff-n-Puff cycles. These experimental insights provide valuable guidance for the practical implementation of enhanced oil recovery techniques in shale formations.

1. Introduction

In recent years, the exploration of unconventional oil and gas development has become increasingly important due to the scarcity of conventional oil and gas reserves [1,2,3]. With significant advancements in unconventional oil and gas extraction technologies, shale oil has emerged as a pivotal unconventional energy resource in China, subsequent to shale gas. This development holds considerable strategic importance for the nation’s energy succession plans [4,5]. The Jiangsu North Basin is a skip-shaped fault basin located in China that dates back to the mid-Cenozoic era. It is characterized by distinct geological features, including a southern fault and a northern superstructure. The Jiangsu exploration area primarily encompasses the mining rights of the Gaoyou, Jinhu, Haian, and Yancheng depressions. This region has seen the development of three distinct shale stratigraphic systems: the Taizhou Formation Tai II, Funing Formation Fu II, and Fu Ⅳ. The stratigraphic sections of Fu II and Fu IV in the Gaoyou, Jinhu, and Haian Depressions are characterized by deposits that range from semi-deep to deep lake phases. These sections exhibit a significant presence of mud shale, notable for their substantial thickness and the presence of promising hydrocarbon indicators [6]. In the year 2022, two pivotal shale oil exploration wells, HY1HF and H2CHF, were operationalized in the Gaoyou Depression, situated within the Northern Jiangsu Basin. These wells targeted the second section of the Paleoproterozoic Funing Formation. Subsequent to reservoir fracturing, they yielded industrial oil flows of 29.7 tons per day and 50.5 tons per day, respectively, marking a substantial breakthrough in the exploration of shale oil within the Fu II section of the Gaoyou Depression [7]. However, the development of shale oil in China faces significant challenges due to the majority of the nation’s shale oil reservoirs being lake-phase deposits. These deposits have low reservoir pressure coefficients, and the crude oil and related fluids have high viscosity and limited fluidity [8,9,10].
The intricate geological composition and the notably low permeability characteristic of shale oil reservoirs pose significant challenges for traditional assessment methodologies to yield adequate insights for efficaciously directing the extraction of oil. In light of these challenges, nuclear magnetic resonance (NMR) technology emerges as a highly effective instrument in this context. Owing to its rapid processing, high precision, and superior resolution, the NMR technique has ascended as an indispensable tool for non-destructively delving into the internal architecture of materials. This technique is notably influential in elucidating the physical attributes of porous media, particularly in the context of oil and gas reservoirs, thereby solidifying its role as a principal methodology for reservoir analysis. Within the realm of oil and gas exploration, the application of low-field NMR technology has evolved from its initial use in petrophysical analysis and core characterization during geological logging to a broader usage in characterizing oil and gas reservoirs. This application extends to quantifying parameters such as reservoir porosity, permeability, movable fluids, and the distribution of pore sizes. NMR technology has yielded significant advancements in the applied research of diverse reservoir types, including conventional sandstone, carbonate, unconventional tight sandstone, and shale. Notably, Liu et al. [11] investigated the fluid mobility in fractured shale oil within the Gulong shale oil reservoir using NMR. They evaluated the effect of differential pressure drive and adsorption efficiency on crude oil utilization through adsorption experiments at different centrifugal pressures and under different conditions. Furthermore, Fan et al. [12] developed a comprehensive quantitative approach for determining fluid saturation in shale samples. This approach integrates NMR, X-ray diffraction (XRD), and scanning electron microscopy (SEM) techniques, enabling the identification and quantitative assessment of different fluid saturations within the samples. Gu et al. [13] developed a novel method for fluid saturation assessment, integrating morphological analysis, non-negative matrix decomposition, and fully constrained least squares, and applied two-dimensional NMR for evaluating fluid saturation in shale. Li et al. [14] conducted a comprehensive assessment of water and oil content, their distribution, and evaporation loss patterns in preserved shale using two-dimensional NMR T1-T2 mapping techniques. Zhang et al. [15] explored oil shale and its components (clay minerals and casein) through a sequence of T2 and T1-T2 NMR experiments, obtaining T1-T2 fluid type maps and analyzing the states of adsorbed and free oil in shale. These findings indicate that T1-T2 NMR methods are potentially efficacious in assessing fluid distribution and proton mobility, thereby characterizing the states of shale oil. Fei Xu et al. [16] performed porosity and permeability experiments on shale cores from China’s Gulong block and examined the spatial dynamics of fluid occurrence and oil recovery via infiltration, utilizing nuclear magnetic resonance (NMR) techniques. Their research revealed that during infiltration, brine primarily penetrates into the minuscule inorganic pores of clay minerals, exerting a hydration expansion effect on larger-sized inorganic pores harboring light oil, thus facilitating the expulsion of light oil from shale cores and enhancing oil recovery efficacy. Huang et al. [17] meticulously analyzed shale sample parameters, including pore size distribution, specific surface area, and pore volume, through low-temperature nitrogen adsorption experiments, subsequently calibrating the correlation coefficients between chilling time (T2) and pore size. Additionally, CO2 Huff-n-Puff NMR experiments were employed on shale samples to scrutinize the impact of gas injection pressure, soak time, and fracture on the microscopic oil production characteristics of shale pores. The application of NMR technology in the evaluation of shale oil reservoirs exhibits immense potential. Through precise assessment of pore architecture, fluid characteristics, and hydrocarbon saturation, NMR technology furnishes a vital scientific foundation for the development of shale oil. Prospectively, as the technology advances and finds broader application, its use in shale oil exploration and production is anticipated to become more comprehensive and profound. Specifically, NMR technology is poised to play an increasingly crucial role in enhancing oil and gas recovery, refining development strategies, and bolstering environmental protection efforts.
The Fu II section of the Gaoyou Depression in the North Jiangsu Basin, China, which is currently in the experimental recovery phase, has not been extensively developed for shale oil extraction. Identifying an effective extraction method tailored to the shale oil characteristics of the Fu II section is critical for efficient development in this region. Recently, the use of shale oil Huff-n-Puff technology has gained prominence in the field of unconventional oil extraction. This technique primarily involves imbibing fluid and gases into the reservoir to restore formation energy and increase the mobility of the crude oil, thereby enhancing the efficiency of oil recovery. In this context, substances such as imbibition fluid and CO2 are often used as Huff-n-Puff media, which play an important role in facilitating oil recovery by permeation. Vadose agents, substances that infiltrate reservoir rock pores to bolster imbibition capacity, are instrumental in this process. These agents encompass surfactants, polymers, and other specialized chemicals designed to diminish the interfacial tension between oil and water, thereby improving oil’s traversability through the pore network. The injection of CO2 into shale oil recovery exhibits two principal effects. Initially, it enhances the fluidity of the crude oil and diminishes the adherence of the crude oil to the rock’s pore walls, thereby facilitating oil Huff-n-Puff. Subsequently, the solubility of CO2 allows for its integration with hydrocarbons in the crude oil, effectively augmenting the crude oil’s flowability. Consequently, the establishment of a controlled indoor experimental methodology that can assess and optimize the parameters of the post-pressure Huff-n-Puff process in shale reservoirs is of paramount importance. In contemporary experiments concerning unconventional reservoir Huff-n-Puff, the predominant reliance is still on traditional approaches involving CT technology and numerical simulations [18,19]. While CT scans provide qualitative assessments, they fall short of offering quantitative analysis [20,21]. This gap is adeptly bridged by the application of NMR technology, which compensates for the limitations inherent in CT scanning methods. Notably, as water or other fluids permeate shale pores, altering the initial fluid distribution, NMR technology is capable of monitoring these alterations, thereby facilitating the evaluation of the seepage process’s efficiency and kinetics. Comparative analysis of NMR responses before and after seepage can be used to quantitatively determine the movement and expulsion of hydrocarbons within the reservoir. NMR data contribute significantly to the understanding of the seepage and suction characteristics of shale oil reservoirs, providing critical insight for the development of strategic approaches. The synergistic use of seepage and CO2 segment plug Huff-n-Puff technologies potentially enhances crude oil recovery in shale oil operations. This technique aids in augmenting the mobility of crude oil within intricate shale formations, thereby boosting recovery rates and production efficiency. While numerous scholars have conducted indoor experiments using NMR technology on phenomena like shale oil seepage and well simmering, most have performed NMR scans on shale cores only before and after these experiments. This approach often leads to the inadvertent loss of fluids from the cores when removed from their holders, introducing errors that compromise the accuracy of experimental outcomes. Additionally, due to the complexities involved in shale oil research, many scholars conduct isolated experiments on aspects like storage, seepage, and flowback. These segmented studies may not accurately reflect the actual processes and stages of shale oil Huff-n-Puff, thus limiting the persuasiveness of the findings. As shale reservoirs are typically developed through volume fracturing, this study aims to create a controlled experimental setting using nuclear magnetic resonance technology, specifically tailored for conditions associated with fracture flowback. This will facilitate the physical simulation of the entire Injecting-Stewing-Producing process in shale oil wells. Such an experimental framework permits a precise investigation of the seepage and suction dynamics as well as the micro-level transport mechanisms of shale oil during the Huff-n-Puff oil recovery process, thereby guiding the practical application of seepage and suction techniques for oil recovery in shale oil fields.

2. Experiment Apparatus and Materials

2.1. Experimental Material

Shale Rock Sample: The core sample was extracted from the second section of the Gaoyou Depression in the North Jiangsu Basin at a depth of 3714 m. It underwent comprehensive XRD analysis and Total Organic Carbon (TOC) testing. The sample’s composition included 36% quartz, 2.7% potassium feldspar, 12.8% sodium feldspar, 4.2% calcite, 1.9% pyrite, and 42.4% clay, with an organic carbon content of 2.32% and a sulfur content of 0.537%. Given that the development of shale oil necessitates hydraulic fracturing, the samples underwent Brazilian seam-making treatment (as depicted in Figure 1) to realistically simulate reservoir conditions in shale oil development. Permeability evaluations using the pressure pulse depletion method showed values of 0.0014 millidarcies (mD) before treatment and 1.81 mD after treatment. The basic data for this core is detailed in Table 1.
The experimental Huff-n-Puff medium comprised highly pure CO2 (99.95% purity) and a specifically formulated percolating fluid, consisting of a mixture of 99.8 g of deuterium oxide and 0.2 g of surfactant.
The crude oil utilized in the experiment was sourced directly from the reservoir via a well separator. Under original formation conditions (temperature 78 °C), this crude oil exhibited a viscosity of 1.73 mPa·s. To replicate these formation conditions in the experiment, the viscosity of the crude oil, which was 3.82 mPa·s under surface conditions, was adjusted to the desired level by incorporating aviation kerosene, thereby effectively reducing its viscosity.

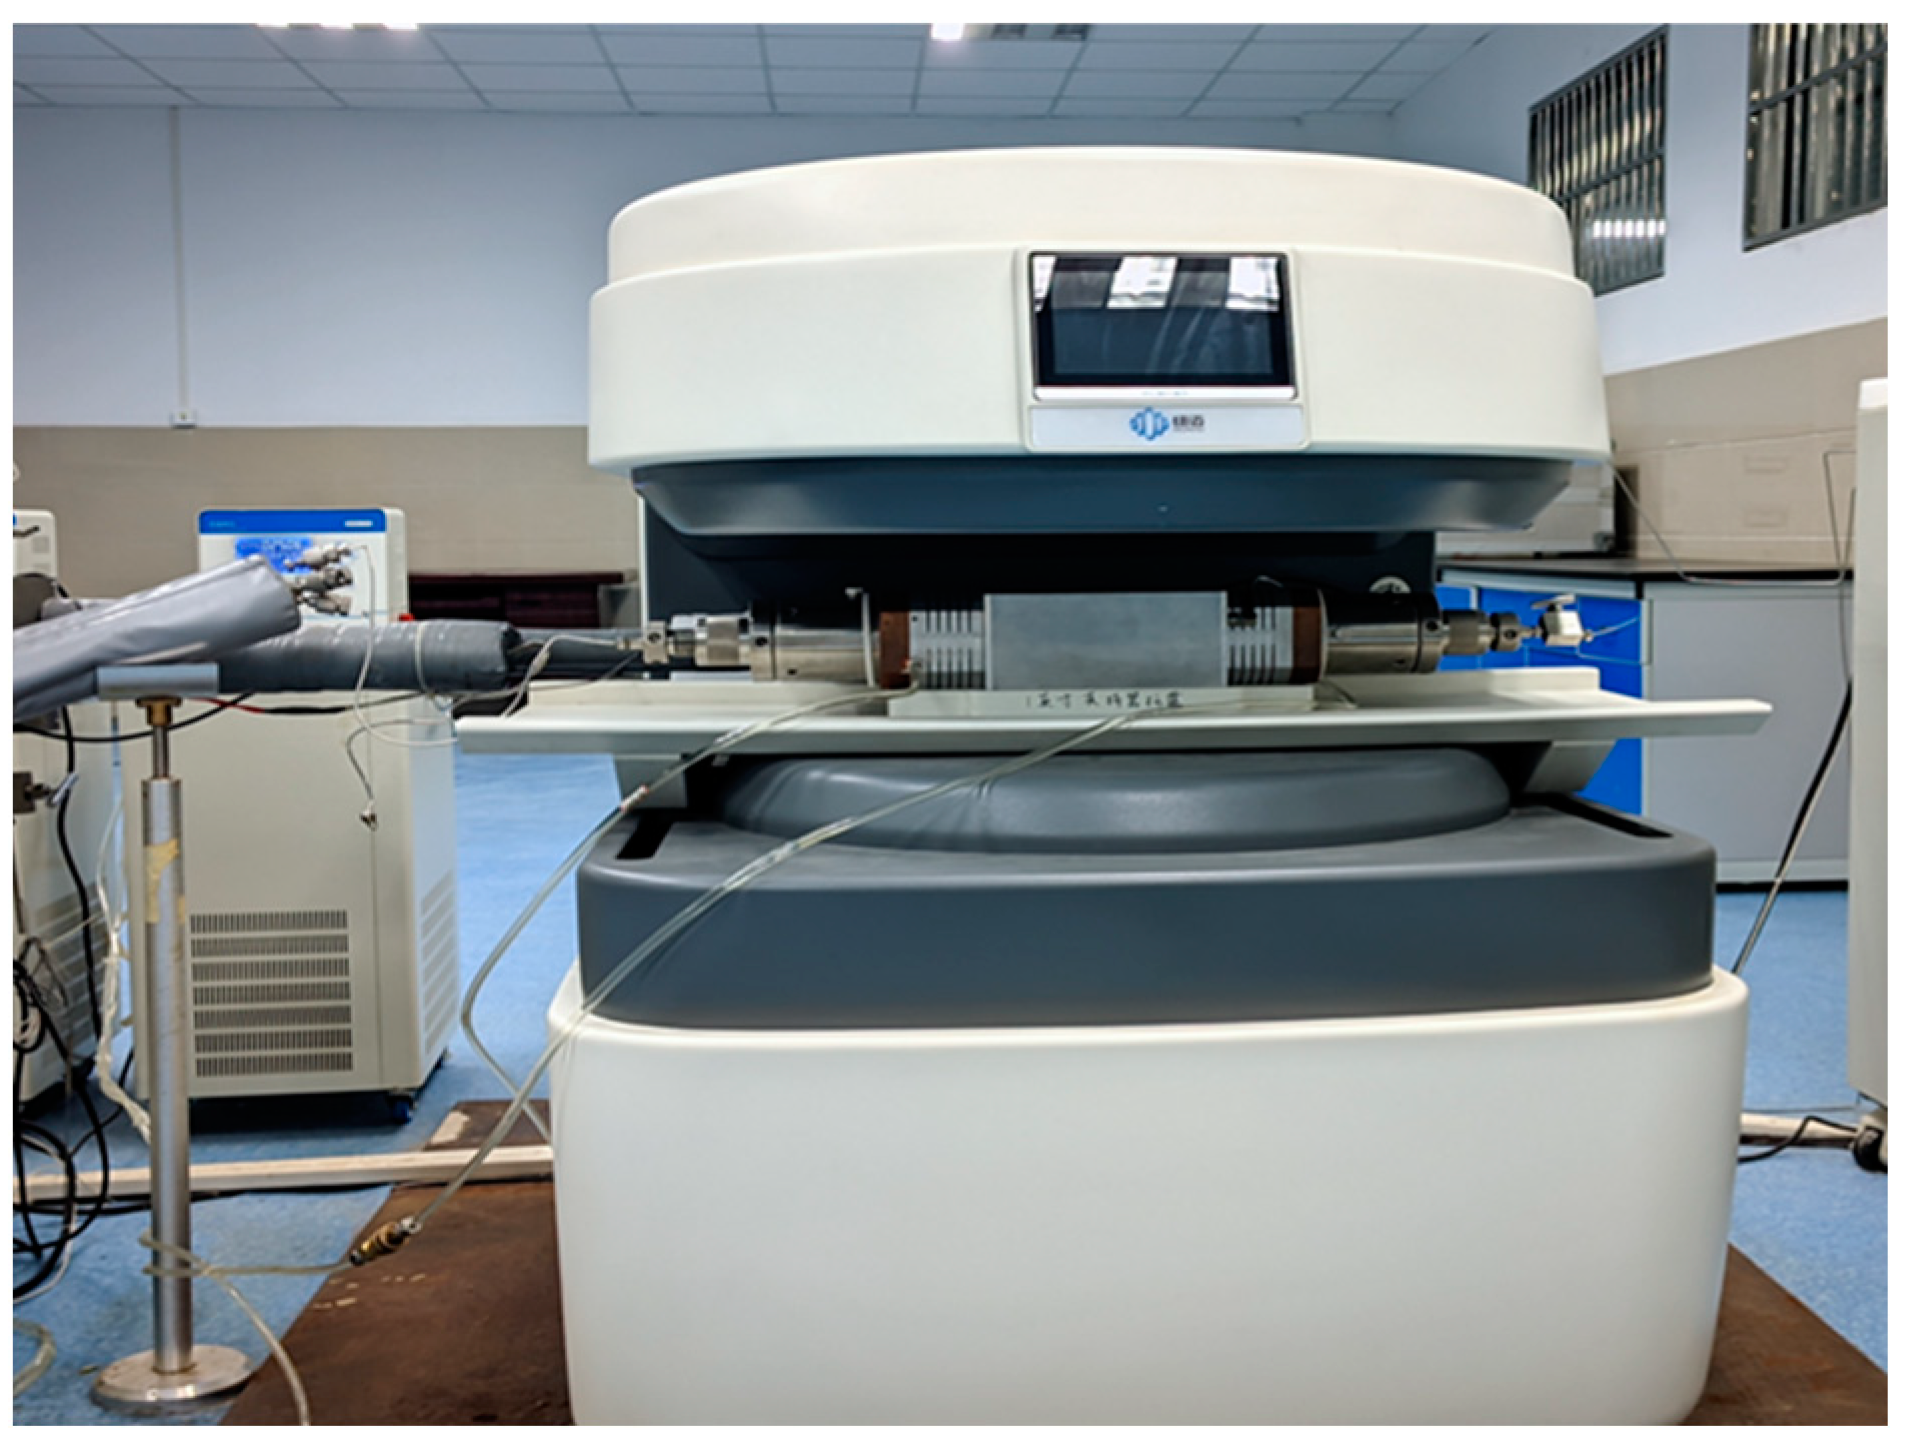
2.2. Experimental Equipment and Parameters

The experimental apparatus employed was the MacroMR12-150H-I, a large-size NMR high-temperature and high-pressure imaging analyzer, manufactured by Suzhou Niumag Analytical Instrument Co., Suzhou, China (illustrated in Figure 2). This sophisticated instrument features a resonance frequency of 12.798 MHz and a magnetic strength of 0.3 Tesla. It is equipped with a replica coil measuring 25 mm in diameter, accommodating replica samples up to 25 mm in diameter. Additionally, the magnet’s operational temperature is maintained at 32 °C.
In the simulation and Huff-n-Puff experiments involving imbibition fluid and CO2 segment plug injection for shale core analysis, a specific set of parameters was employed. The detailed descriptions of these parameters are enumerated in Table 2 and include: P1 (pre-pulse delay) at 14.52 microseconds, P2 (pulse delay) at 26 microseconds, SW (spectral width) at 200 kHz, RFD (receiver filter delay) at 0.08 milliseconds, RG1 (receiver gain 1) at 20, DRG1 (digital receiver gain 1) at 3, PRG (pulse repetition gain) at 3, TW (total wait time) at 2500 milliseconds, TE (echo time) at 0.15 milliseconds, NECH (number of echoes) at 15,000, and NS (number of scans) at 32.

2.3. Pre-Experimental Preparation

(1)
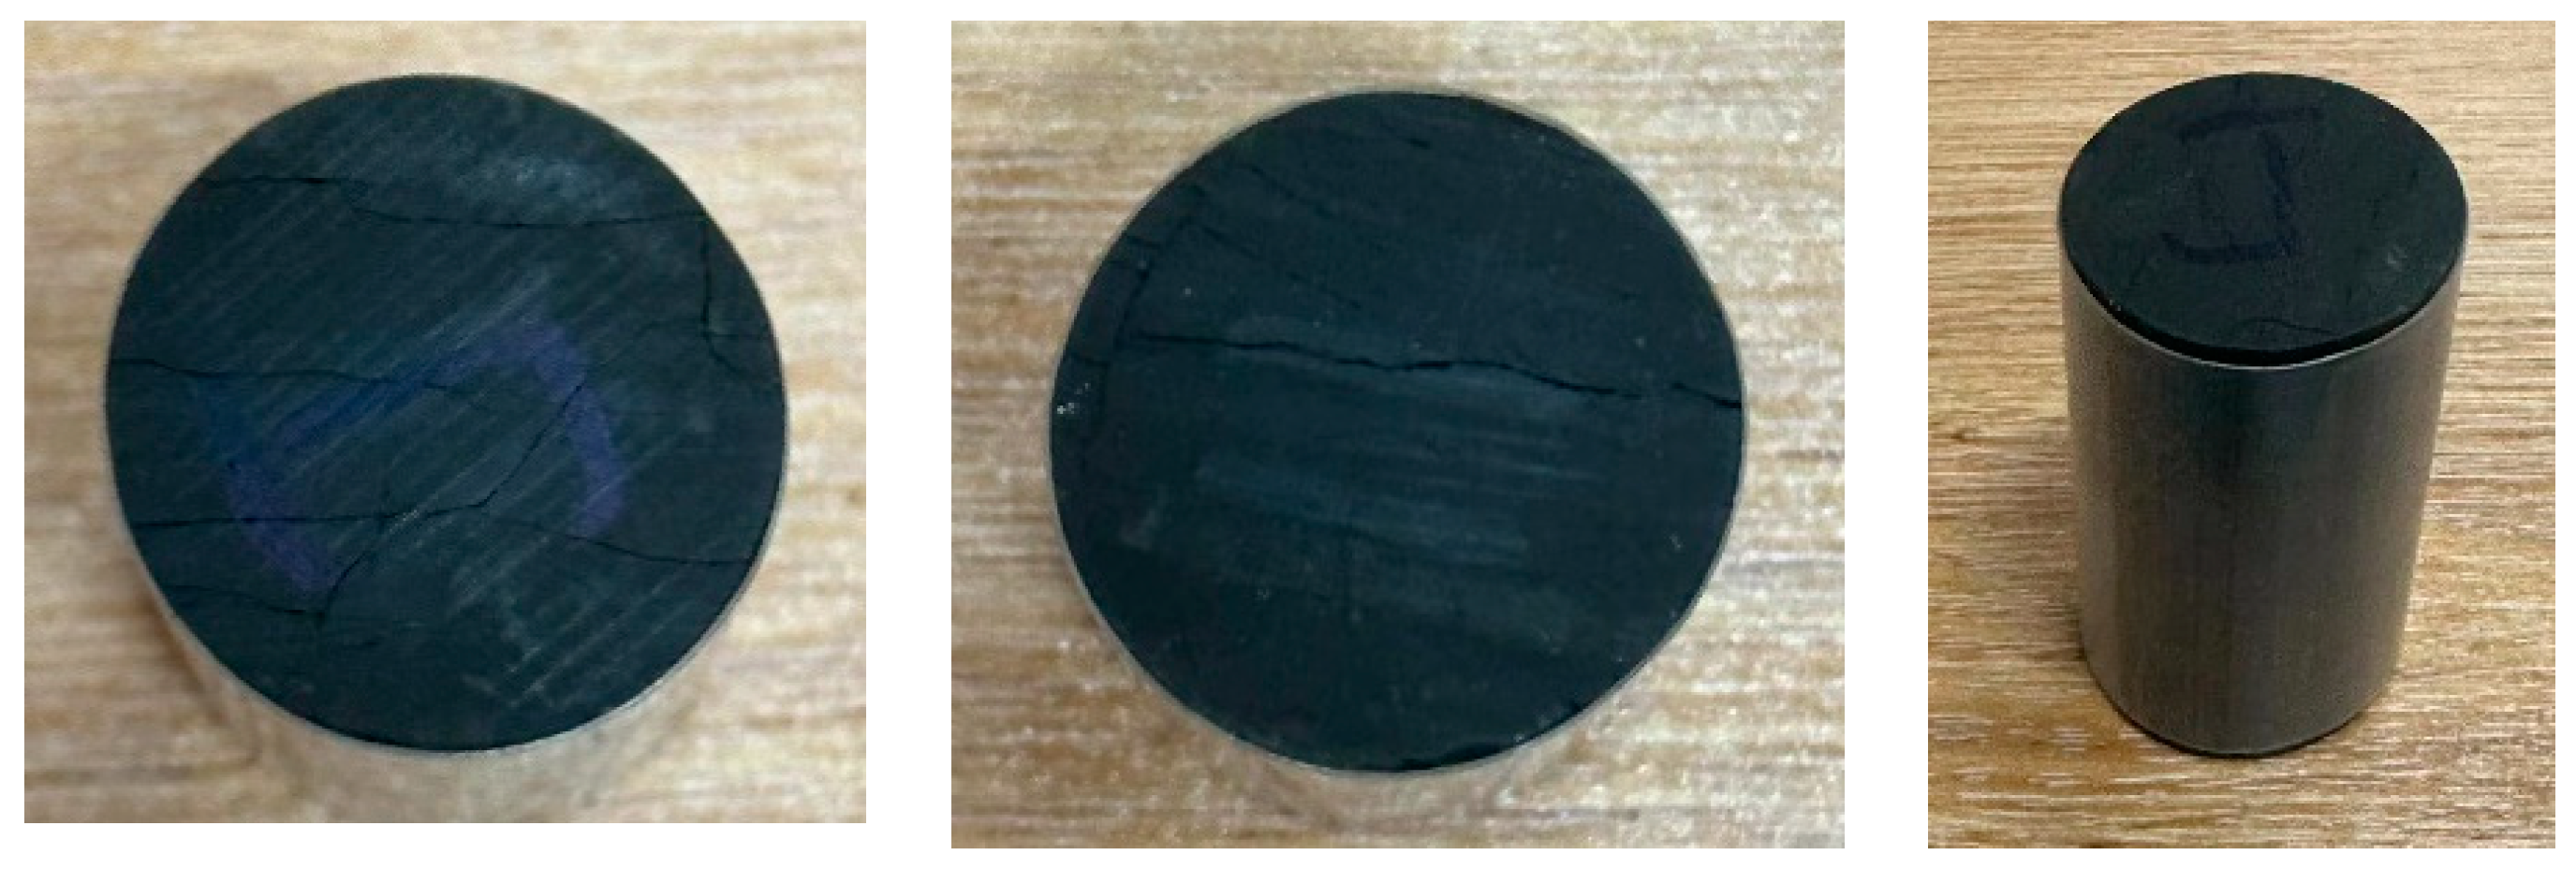
Core Cutting and Oil Washing: Meticulous sample preparation is essential for precise NMR analysis of shale, with steps like sample preparation, oil washing, drying, and saturation critically influencing the outcomes of shale tests. To this end, the shale samples were meticulously prepared using diamond wire cutters. They were drilled in anhydrous conditions, maintaining a diameter of approximately 2.5 cm, to avert any alteration of the original pore structure, which could be caused by hydration reactions between the shale and water. Pictures of the cores before and after treatment are shown in Figure 3.
According to the principles of NMR, accurate T2 spectral analysis, instrumental in characterizing pore size distribution, necessitates samples being saturated with fluids that emit hydrogen signals. However, oil shale samples typically harbor a variety of hydrogen-bearing fluids like water, oil, and gas, complicating the precision of NMR testing. To circumvent this issue, a series of preparatory procedures, including the oil washing and drying of shale oil, are indispensable for purging these fluids from the original shale’s pores. In this context, the author frequently employs a method involving high-temperature and high-pressure steam for oil-washing experimental cores. The chosen solvent for this process is a benzene and alcohol mixture, selected for its efficacy in minimizing potential damage to the core.
(2)
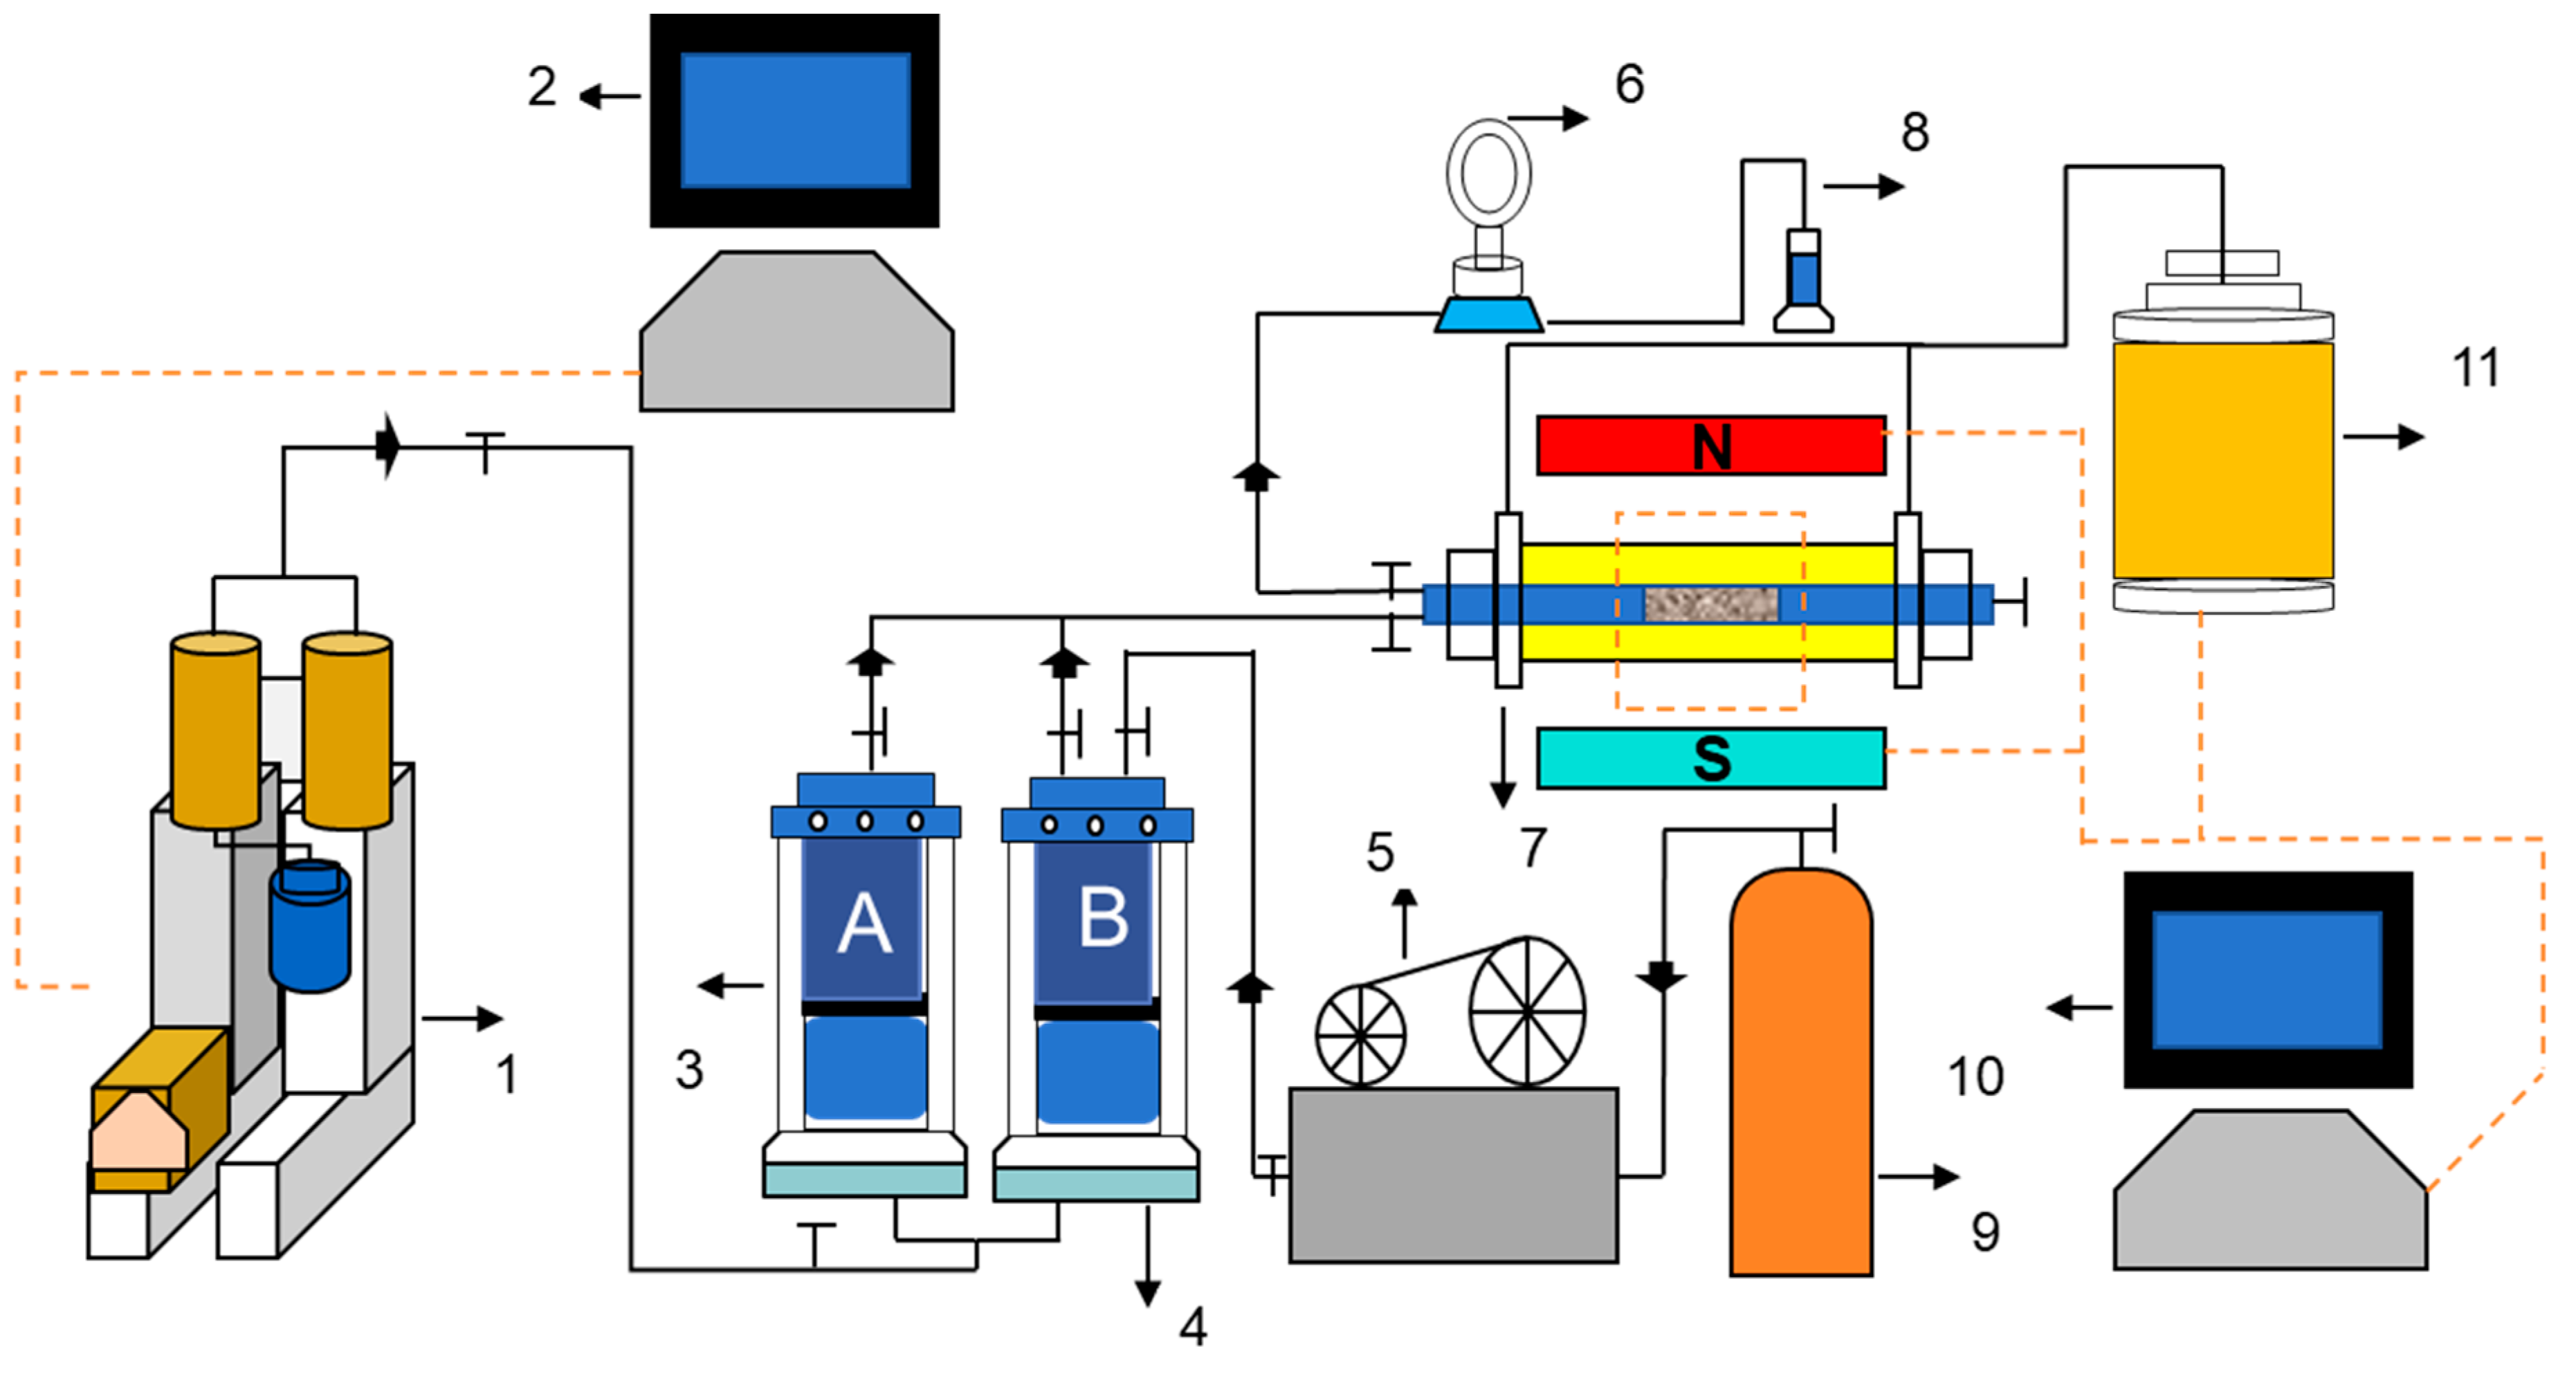
Crude Oil Saturation in the Core: Given the inherent base permeability of the shale and the relatively high viscosity of crude oil, it becomes imperative to implement vacuum and high-pressure saturation procedures for the core. A schematic representation of the saturation apparatus is depicted in Figure 4, with the detailed procedural steps outlined as follows:
The core is first subjected to oil washing, then placed in an oven where it is baked at 100 °C for 48 h. This process is aimed at drying the core, after which it is weighed. Subsequently, the core’s porosity and permeability are rigorously tested.
The core is then placed into a core container and subjected to a continuous vacuum process using a vacuum pump for 24 h, ensuring thorough evacuation of air from the core.
Valves V3 and V4 are opened, and the piston is pressurized via the injection pump, facilitating the movement of crude oil into the core container.
Once the crude oil in the core container fully immerses the core, the pressure within the container is maintained at 30 MPa. After a saturation period of 120 h, the pressure gradually decreased. The core is then allowed to stand for an additional 24 h, following which it is removed and weighed.
(3)
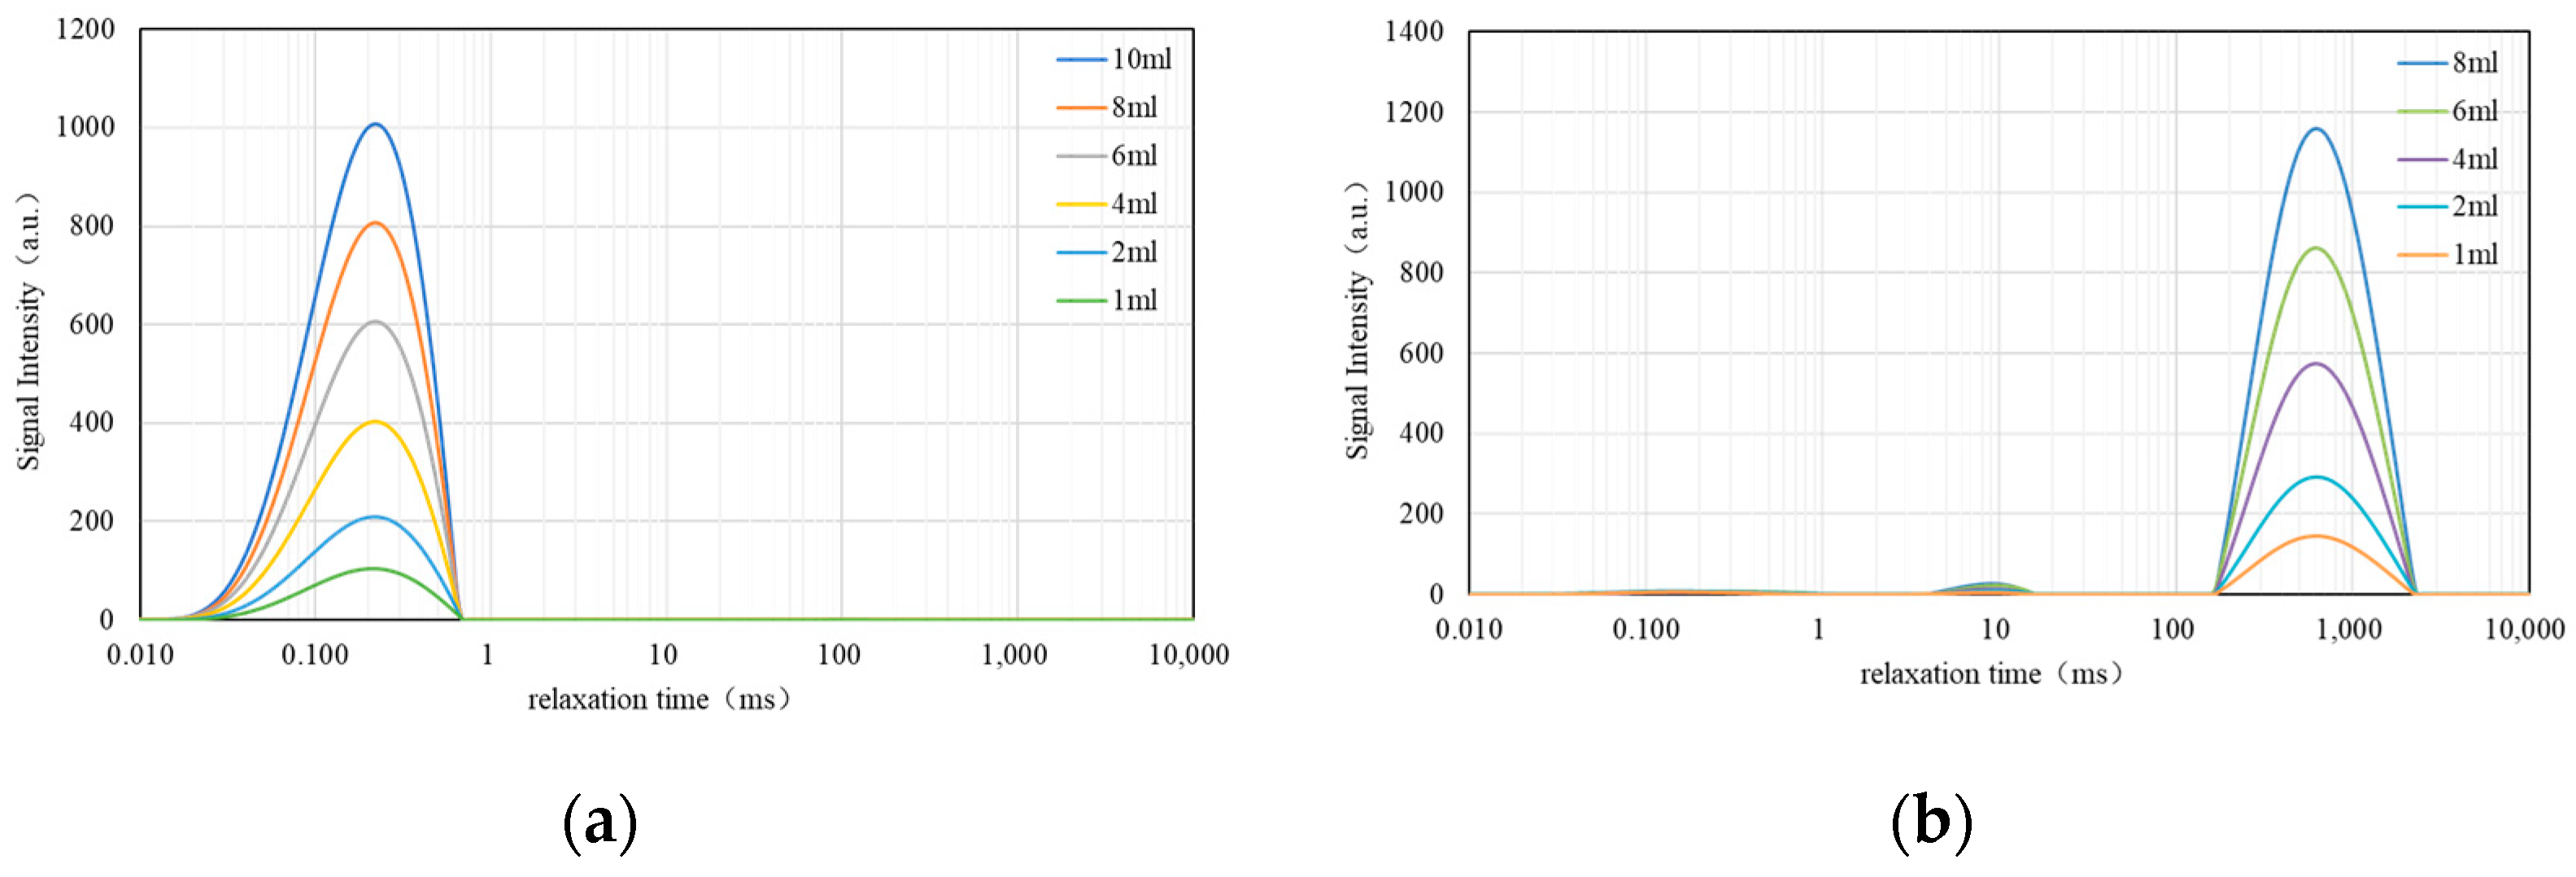
Signal Calibration of Fluids for Nuclear Magnetic Experiments
To enhance the precision of experimental data, the author has undertaken the calibration of NMR signals for fluids frequently used in current experiments. The calibration process involves loading varying volumes of fluid into a nuclear magnetic calibration vessel (as depicted in Figure 5), followed by multiple nuclear magnetic samplings to calculate the T2 spectral signal quantity for different fluid volumes. The calibration results, presented in Figure 6, indicate that the relaxation time of the NMR T2 spectrum for fracturing fluid containing a 0.2% surfactant concentration and prepared with a high concentration of manganese chloride solution–falls within the range of 0.01–1 ms. This range is consistent with the measured relaxation time for the T2 spectrum of shale cores saturated with crude oil. Therefore, manganese chloride solution is considered unsuitable as a fluid for NMR experiments. In addition, to investigate changes in crude oil content within the experimental cores, several NMR signal acquisitions of the experimental oil were performed. From these, the conversion ratio of NMR signal volume to crude oil mass can be calculated based on the NMR signal volume of different crude oil volumes.

2.4. Experimental Methods and Procedures

  • Initially, place the core, which has been saturated with crude oil via vacuum and high-pressure processes (ensuring the saturation level is greater than 60%), into the core gripper. Then, scan the T2 spectrum using low-field NMR to determine the initial state.
  • Two intermediate vessels are prepared, one filled with imbibition solution (deuterium oxide solution containing 0.2% surfactant) and the other filled with CO2. The CO2 was pumped into the intermediate container by a pressure pump and pressurized to more than 15 MPa.
  • Employ a constant pressure and speed pump to infuse the permeate solution into the clamp at a steady flow rate of 0.01 mL/min until the pressure reaches 15 MPa, thereby simulating fracturing conditions. Record the injection duration and total volume of permeate solution injected throughout this process.
  • Activate the intermediate container containing CO2 pressurized at 15 MPa. Utilize a constant pressure and speed pump to methodically inject liquid CO2 into the core gripper at a steady flow rate of 0.01 mL/min, elevating the pressure to 25 MPa. Throughout this procedure, meticulously record the duration of the injection and the total volume of CO2 injected. Upon ceasing the injection, conduct a subsequent NMR scan to assess the changes.
  • Seal the core holder and maintain the well under a system pressure of 25 MPa for 48 h, simulating a simmering process. Subsequently, conduct another NMR scan.
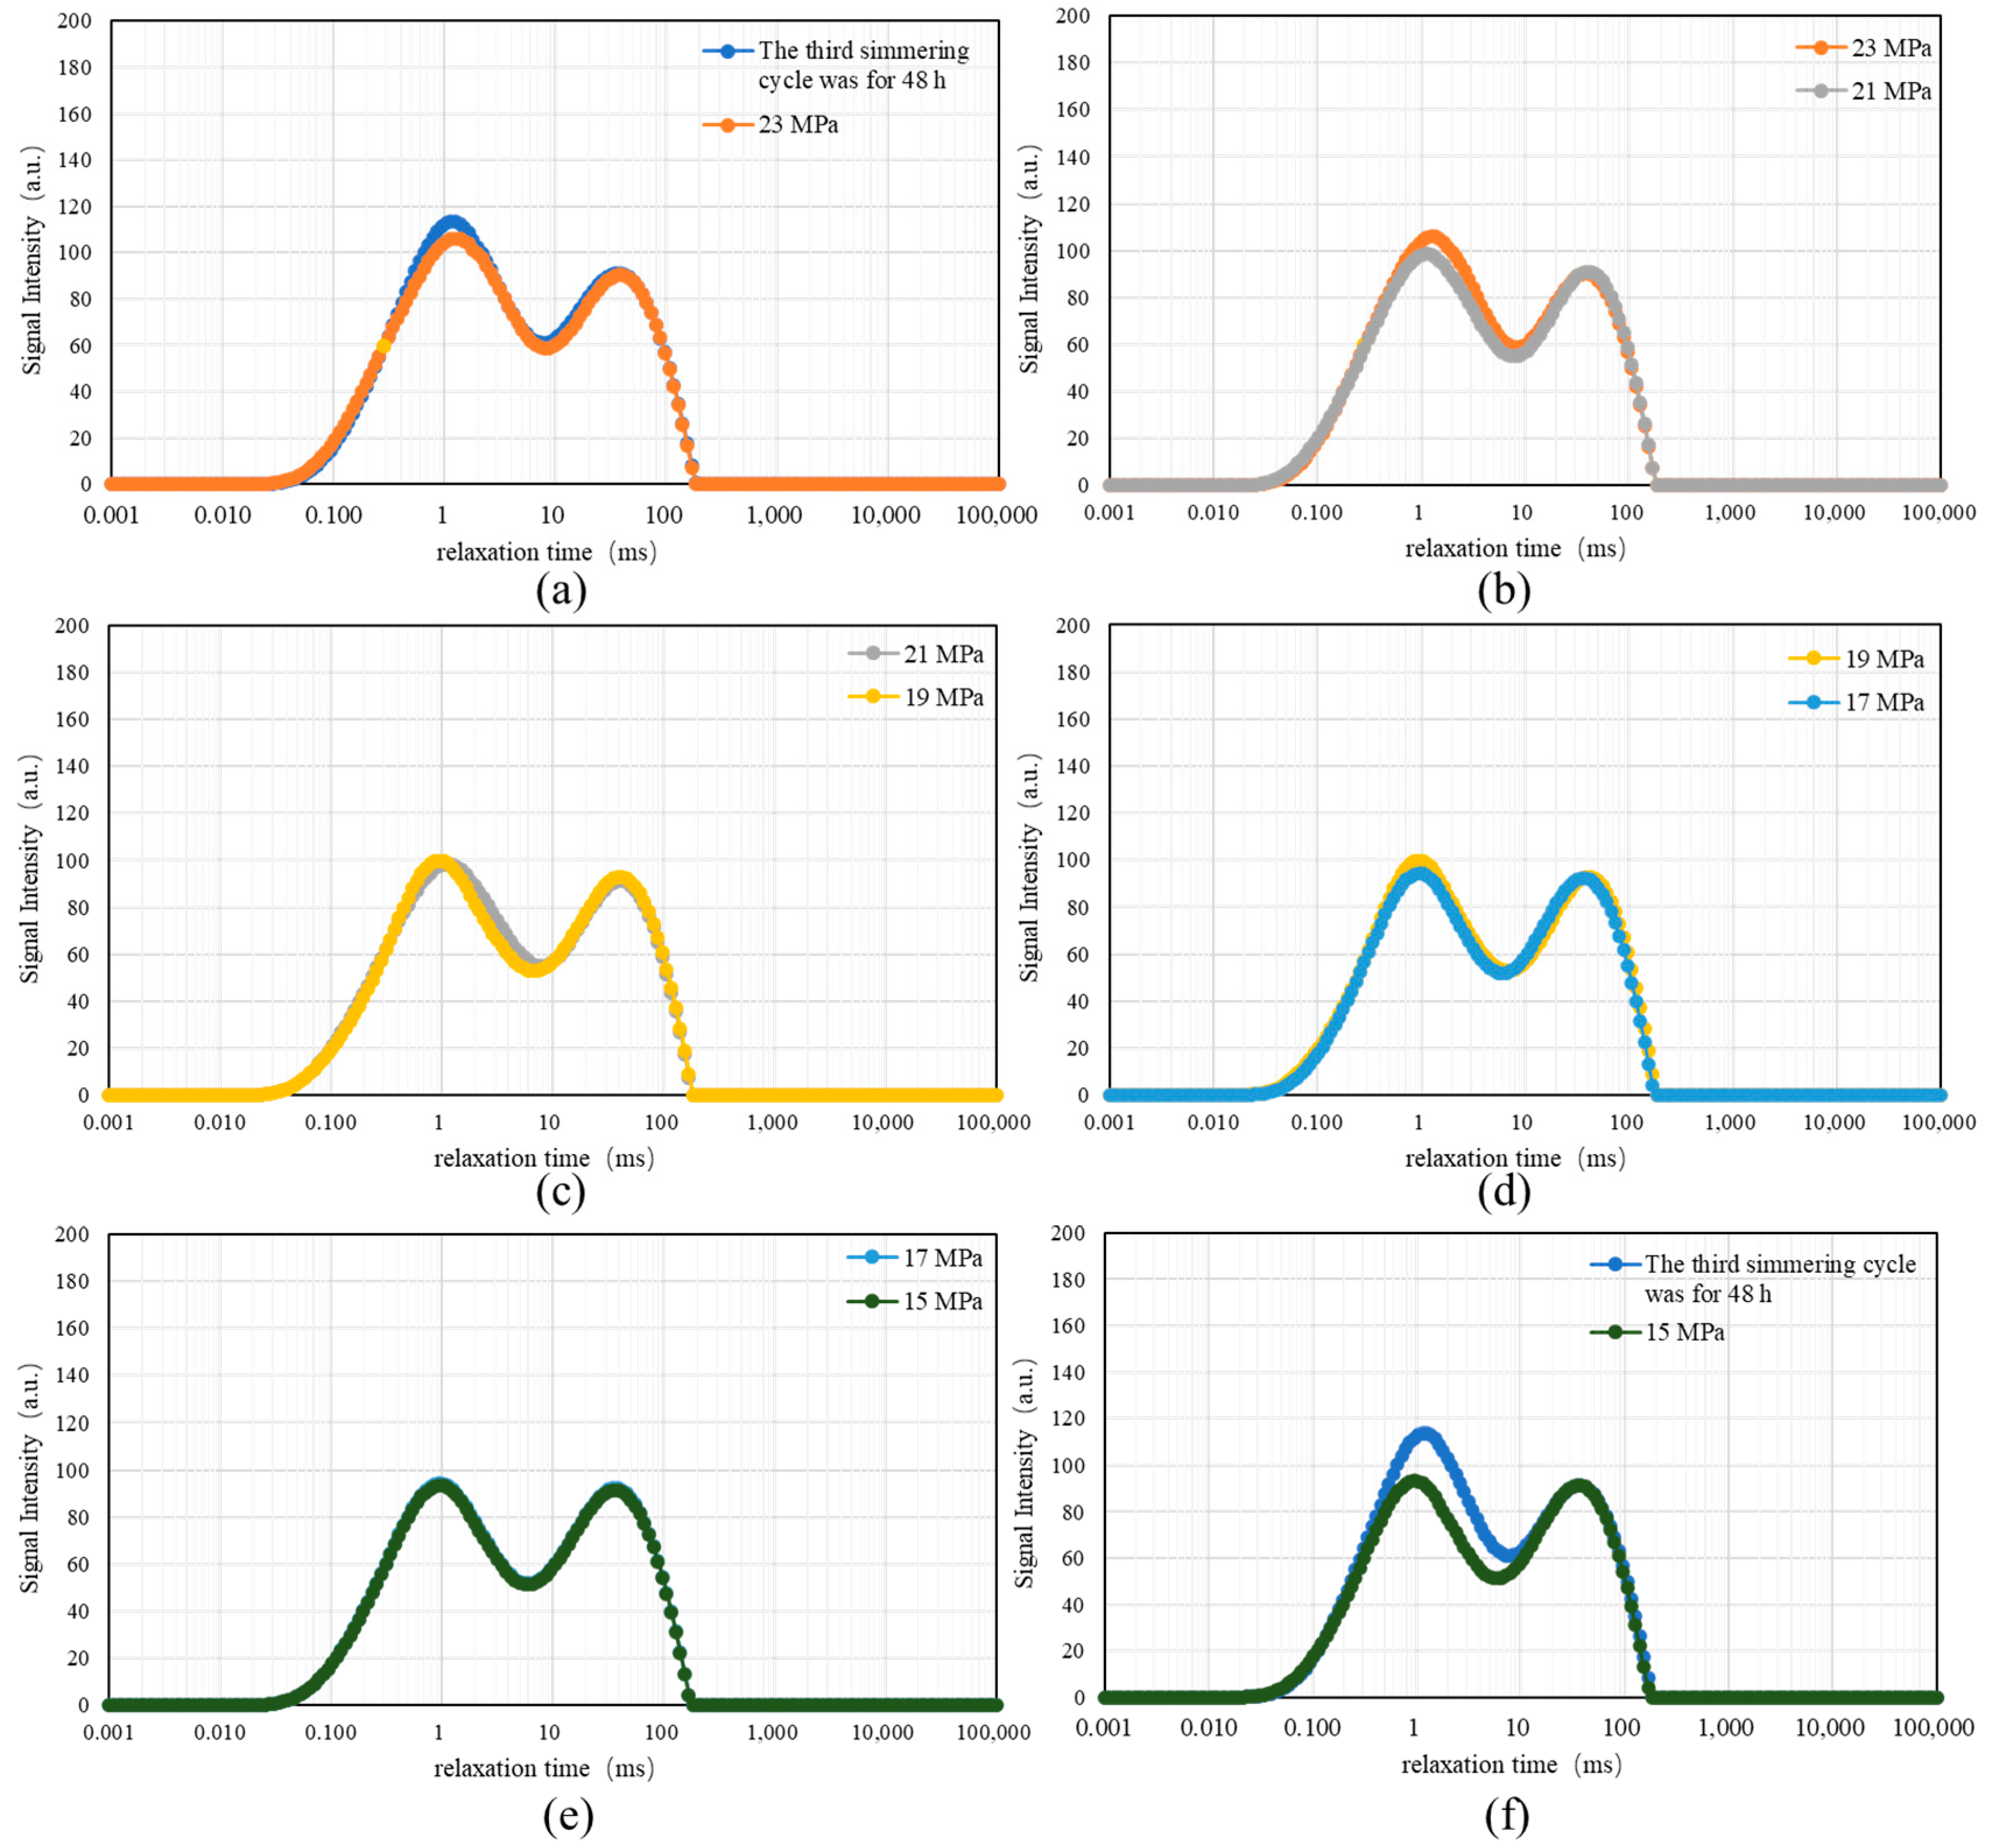
  • Upon completion of the simmering phase, open the outlet for extraction, maintaining a 2 MPa differential pressure using a pressure return valve. As the system’s differential pressure decreases to 23, 21, 19, 17, and 15 MPa, scan one set of NMR signals at each pressure level, resulting in five sets of NMR signals. Ensure continuous production for 4 h at each pressure.
  • Repeat the aforementioned experimental procedures for the second and third experimental cycles.
  • Thoroughly process the accumulated NMR data and determine the extent of crude oil extraction from the core by calculating the magnitude of the NMR signals for each experimental operation.
In particular, the experimental setup includes an automatic perimeter pressure tracking pump to ensure that the perimeter pressure consistently exceeds the system pressure by 3 MPa throughout the experiment. Figure 7 shows a schematic diagram of the experimental procedure.

3. Discussion of Experimental Results

3.1. The First Cycle of Experiments on Injecting-Stewing-Producing

This section details an integrated Injecting-Stewing-Producing experiment conducted on experimental cores within an indoor closed chamber, utilizing NMR technology. The specific methodology encompasses the injection of the Huff-n-Puff medium, sealing the core gripper for 48 h, and eventually opening the exit for the extraction process, which is conducted under varying production pressures while maintaining the same production differential pressure. Considering that field production necessitates multiple Huff-n-Puff cycles, the experiment was structured to include three complete cycles of Huff-n-Puff. The residual crude oil in the core was quantified after each cycle to determine the extent of extraction achieved, thereby facilitating the optimization of Huff-n-Puff parameters.
As shown in Figure 8, a notable increase in the first wave of the graph is observed during the injection of imbibition fluid and CO2. This phenomenon is attributed to the initial phase of the Huff-n-Puff medium injection, which essentially serves as a crude oil displacement process. During this phase, crude oil initially occupying larger pores is forced into smaller pores by the injected medium. Further, as depicted in Figure 8b, the NMR curve shifts rightward during the well-casing process, indicating the migration of oil from smaller to larger pores. Throughout the production stages shown in Figure 8c–f, a consistent downward shift in the first peaks of the curves is discernible as the pressure decreases, suggesting the movement of oil from smaller pores to medium and larger pores.
As shown in Figure 9, following the initial Injecting-Stewing-Producing process, the experimental data reveals that shale oil accumulates predominantly in reservoir spaces larger than 2 nm. In spaces measuring 2–20 nm, oil production initially increases and then gradually decreases; for spaces between 20 and 200 nm, the reduction in oil production is more pronounced. The oil content in reservoir spaces larger than 200 nm gradually diminishes, while in the 200–2000 nm range, there is a gradual increase. Oil in spaces greater than 2 µm progressively reduces with a significant magnitude. Consequently, during the production process, oil in spaces larger than 2 µm is preferentially extracted, whereas oil in spaces smaller than 20 nm tends to migrate to mid-sized and larger pores before extraction. As Table 3 illustrates, throughout the first Huff-n-Puff cycle’s step-down production phase, crude oil volume in the core diminishes sequentially from 0.713 mL to 0.619 mL, 0.584 mL, 0.536 mL, 0.508 mL, and finally 0.502 mL. At the conclusion of the first Injecting-Stewing-Producing cycle, the crude oil recovery rate of the core reached 29.55%.

3.2. Second Cycle of Experiments on Injecting-Stewing-Producing

Implementing the same experimental protocol for the second cycle of the Huff-n-Puff process, observations from Figure 10a–e reveal that the first peak of the NMR curve parallels the pattern seen in the first cycle of Huff-n-Puff experiments, exhibiting a sequential decrease. Conversely, the second peak displays variable trends: in segment 10a, a declining trend is noted, whereas segment 10b demonstrates a marked increase and the curve undergoes a leftward shift.
As illustrated in Figure 10e, a noteworthy observation is made when the production pressure decreases from 17 to 15 MPa: the curve patterns largely coincide, indicating minimal variation in the distribution of crude oil across different bore diameters. Figure 10f further reveals a significant decline in the position of both wave peaks after the completion of the second production cycle, clearly signifying substantial crude oil extraction. The analysis of changes in oil content across various bore diameters was similarly conducted, with findings presented in Figure 11.
Figure 11 shows that during the second production cycle, there is a discernible decrease in crude oil within the 2–20 nm pore spaces, while the oil in the 0.02–0.2 micrometer pores initially increases then decreases. The oil content within the 0.2–2 micrometer pores exhibits a decreasing-increasing-decreasing trend. This pattern suggests that, during production, crude oil in smaller pores is progressively transferred to larger pores for extraction. According to the NMR signal data in Table 4, the extraction degree increases as system pressures decrease, but at a diminishing rate. After the second Huff-n-Puff cycle, the overall extraction degree of the core reached 40.11%, with a single-cycle extraction degree of 10.56%, which is only 35.8% of the extraction rate observed in the first Huff-n-Puff cycle.

3.3. Third Cycle of Experiments on Injecting-Stewing-Producing

Through the third cycle of experiments on the core, the nuclear magnetic curve is shown in Figure 12.
Observations from Figure 12a–d reveal that, as the system pressure diminishes, the curve morphology undergoes varying degrees of alterations. Notably, when the system pressure drops from 17 to 15 MPa, the curve patterns essentially overlap (as shown in Figure 12e), signifying negligible changes in the distribution of crude oil across different pore sizes. According to Figure 12f, the position of the first wave peak significantly decreases, whereas the second wave peak remains relatively unchanged by the conclusion of the third Huff-n-Puff cycle. This suggests that the extractable crude oil in larger pore spaces was primarily depleted in the initial two Huff-n-Puff cycles, with minimal changes occurring in these larger pore spaces during the third cycle.
As indicated in Figure 13, there is a continuous extraction of crude oil from pores smaller than 200 nm in response to decreasing pressure. In contrast, crude oil in pores larger than 200 nm shows no marked changes, with inconsistent trends. This suggests that during the later stages of production, smaller pores contribute more significantly to crude oil production, as most movable crude oil in larger pores has already been substantially extracted in earlier production phases. When the system pressure reduces to 60% of its original value (15 MPa), the volume of crude oil within various pore sizes remains largely stable. According to data from Table 5, by the conclusion of the third Huff-n-Puff cycle, the overall extraction degree of crude oil in the core had attained 46.68%, with the extraction rate per cycle being merely 6.57%.

3.4. Discussion of Experimental Results

A comparative analysis, based on the extraction degree per cycle, is illustrated in Figure 14. The T2 spectra from the three Injecting-Stewing-Producing cycles, incorporating CO2 and imbibition fluid plugs, exhibit significant alterations in the NMR T2 spectrum curve shape post-each Huff-n-Puff cycle. As shown in Figure 15 and Table 6, the extraction degree of the core reaches 46% after three Huff-n-Puff cycles. Despite the overall increase in extraction degree with successive Huff-n-Puff cycles, the diminishing trend of this increase is evident in Figure 15. The replacement efficiency, defined as the ratio of the volume of crude oil extracted to the volume of liquid injected, shows a decline across Huff-n-Puff cycles, with values of 0.46, 0.16, and 0.094 for the first, second, and third cycles, respectively. These results suggest that oil production becomes less pronounced when the system pressure drops to 60% of the original pressure (15 MPa), indicating the potential to optimize injection timing based on Huff-n-Puff experimental outcomes.
Due to the extreme non-homogeneity of shale reservoirs, experimental data obtained from a small number of cores can only partially illustrate the situation. Furthermore, indoor experiments are conducted on small cores to obtain data on the degree of extraction under different conditions. The values obtained are significantly higher than those observed in the actual field due to the idealized process of fluid injection, rippling, and extraction at the core scale. The data presented in this paper serves as a guide for the field, demonstrating development trends and relative effectiveness under various conditions. Subsequent studies can consider the effects of different temperatures, initial pressures, and fluid media on the experimental results.

4. Conclusions

(1)
This study validates the practicality of the Injecting-Stewing-Producing integrated experimental approach formulated by the author for the shale reservoir Huff-n-Puff. The experiments facilitate an in-depth investigation into the microscale transport of crude oil across various pore sizes throughout different Huff-n-Puff cycles. In the production phase following the simmering of the well, the behavior of crude oil within various pore sizes exhibits distinct variations under different production pressures. Specifically, crude oil residing in pores smaller than 200 nanometers tends to preferentially migrate to larger pore spaces before being extracted. This pattern suggests a dynamic redistribution of oil within the reservoir, where smaller pores act as initial sources and larger pores serve as subsequent pathways for oil extraction. Conversely, crude oil within larger pores (greater than 200 nm) is initially prioritized for extraction. In the latter stages of production, pores smaller than 200 nm predominantly contribute to the extracted crude oil.
(2)
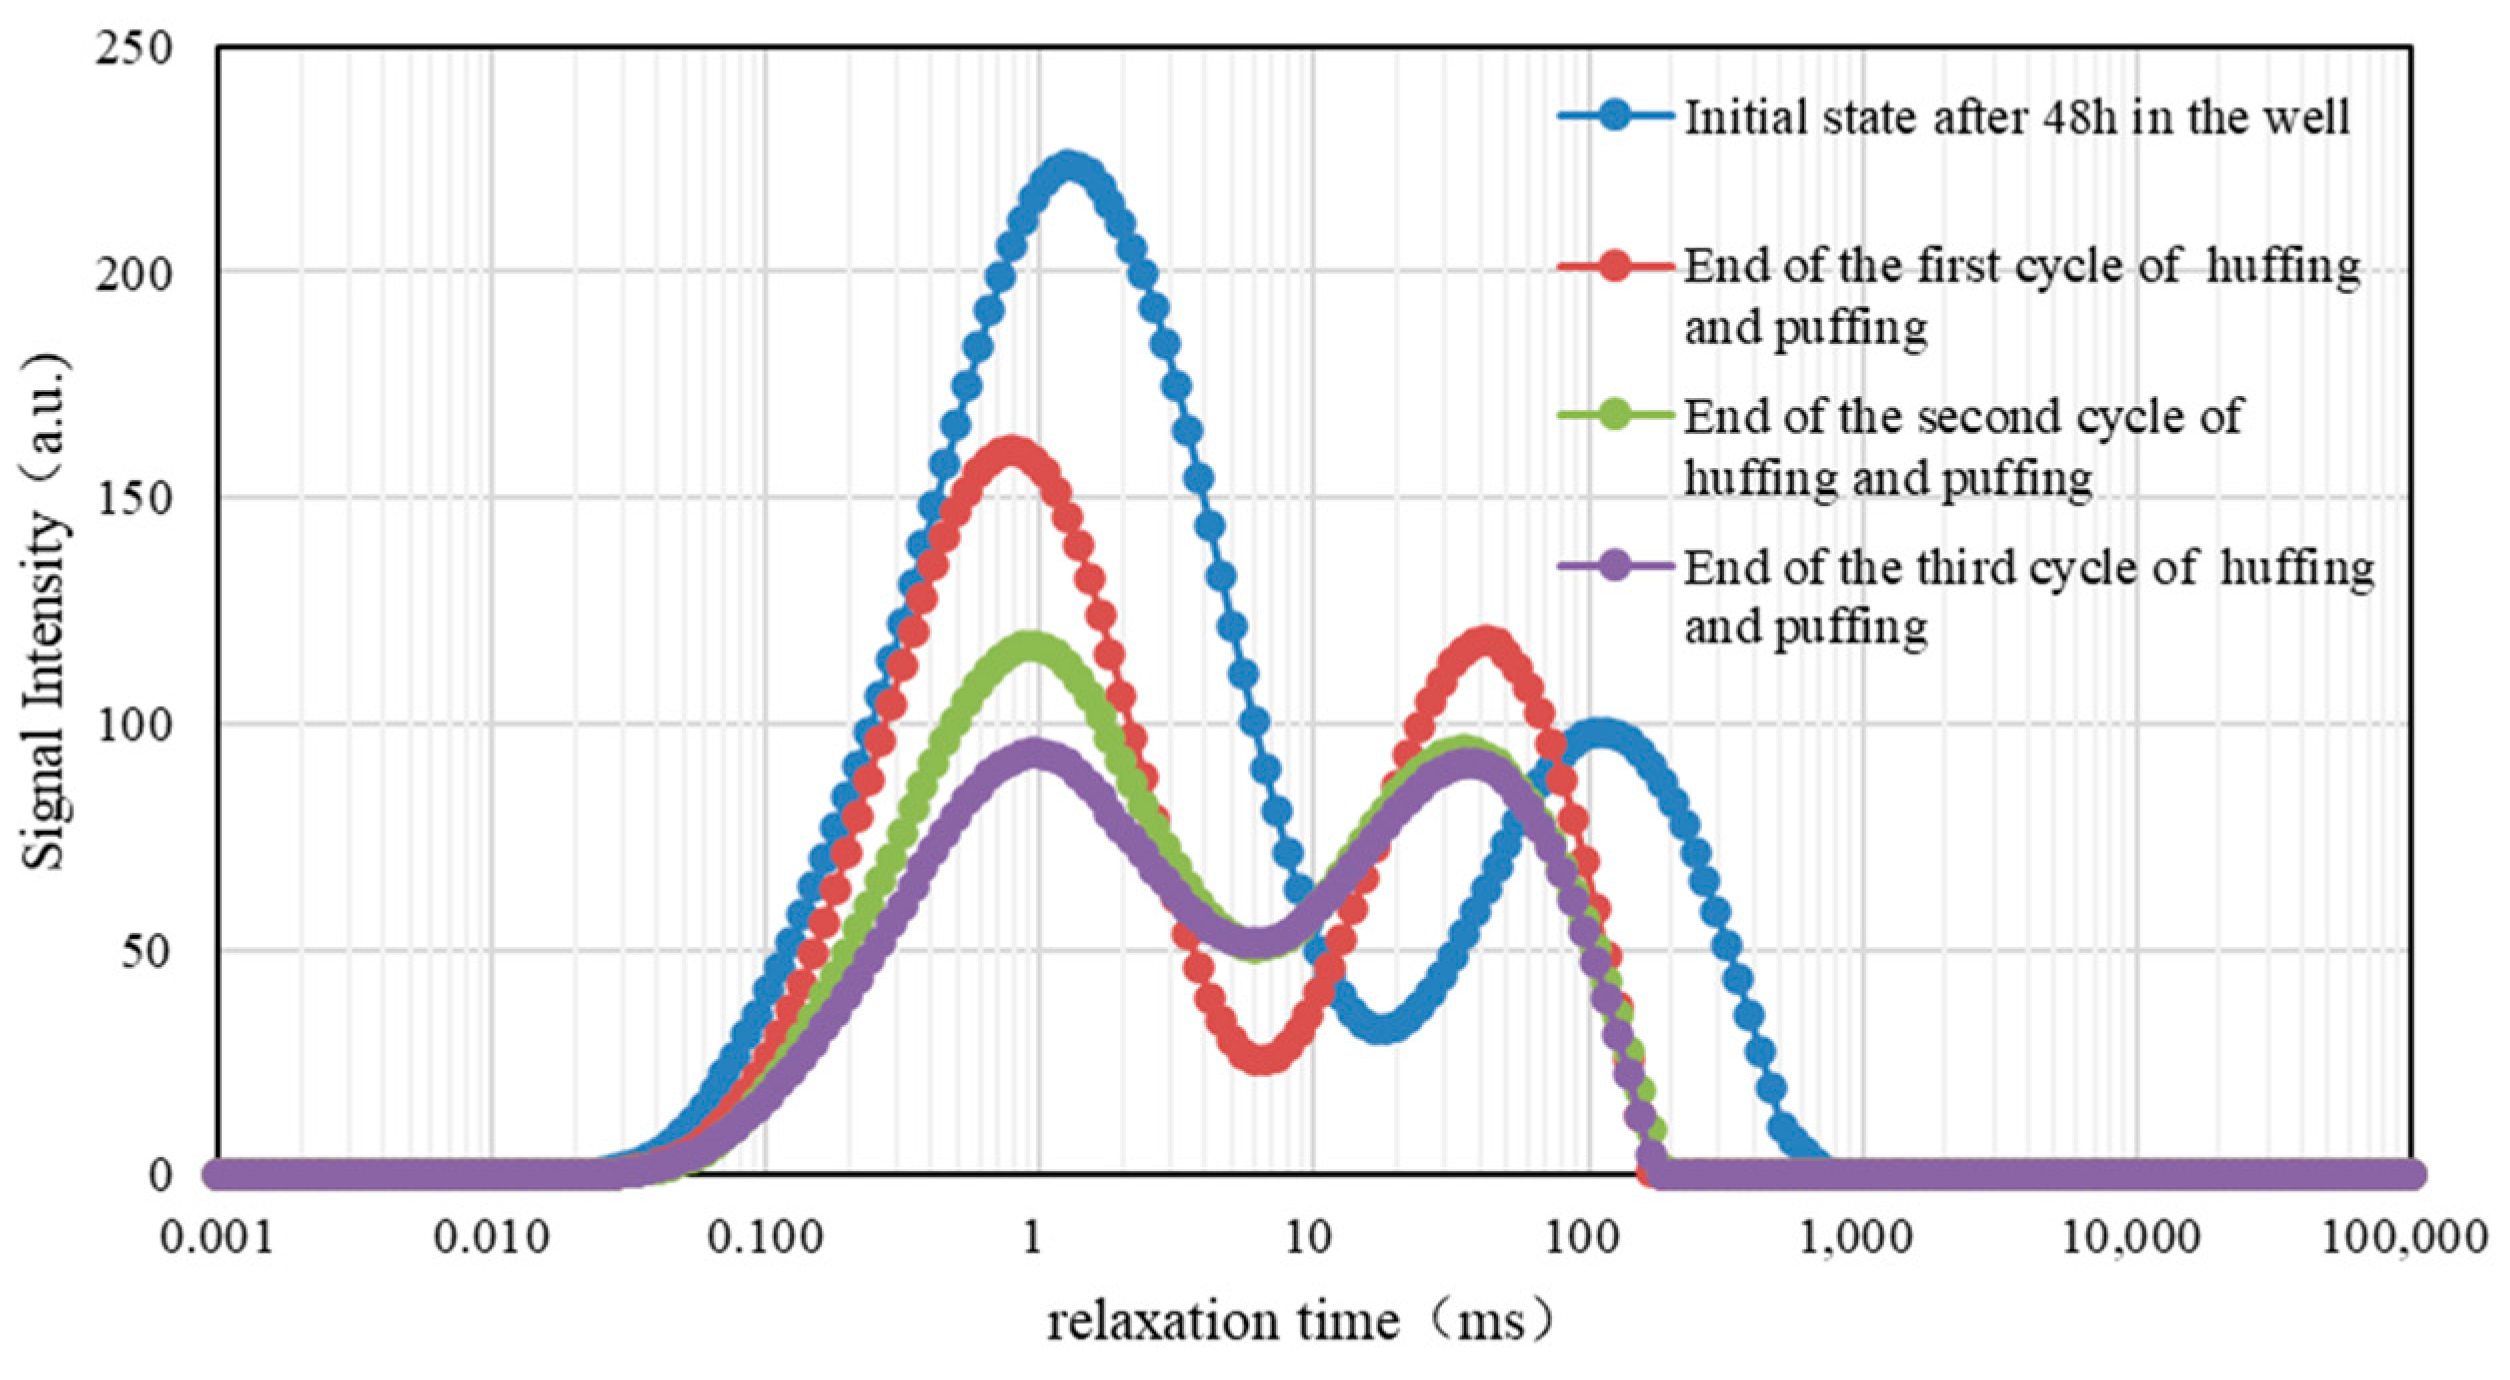
The findings enable optimization of Huff-n-Puff cycles and injection timing in the oil recovery process. The extraction rates for the first and second Huff-n-Puff cycles are 29.55% and 10.56%, respectively, while the third cycle achieves only a 6.57% rate. Furthermore, as Huff-n-Puff cycles increase, a marked decline in replacement efficiency is observed, plummeting from 46% in the initial cycle to 9.4% in the final cycle. Therefore, in practical mining scenarios, it is advisable to conduct two Huff-n-Puff cycles to balance recovery rates against investment costs. Moreover, when production pressure drops to 60% of the original formation pressure, it becomes imperative to introduce imbibition fluid and CO2 to replenish formation energy and enhance recovery efficiency.

Author Contributions

Conceptualization, S.L. and D.L.; methodology, S.L.; drawings, J.S.; validation, D.L. and X.Z.; formal analysis, S.L.; investigation, D.L.; resources, X.Z.; data curation, J.S.; writing—original draft preparation, S.L.; writing—review and editing, D.L.; supervision, D.L.; project administration, D.L.; funding acquisition, D.L. All authors have read and agreed to the published version of the manuscript.

Funding

This work was supported by the National Science and Technology Major Project during the 13th Five-Year Plan under grant number 2016ZX05060004.

Data Availability Statement

All data generated or analyzed during this study are included in the published article.

Conflicts of Interest

Author Xuankang Zhao was employed by the company No. 4 Gas Production Company of PetroChina Changqing Oilfield Company. The remaining authors declare that the research was conducted in the absence of any commercial or financial relationships that could be construed as a potential conflict of interest.

References

  1. Lei, Q.; Xu, Y.; Cai, B.; Guan, B.; Wang, X.; Bi, G.; Li, H.; Li, S.; Ding, B.; Fu, H.; et al. Progress and Prospects of Horizontal Well Fracturing Technology for Shale Oil and Gas Reservoirs. Pet. Explor. Dev. 2022, 49, 166–172. [Google Scholar] [CrossRef]
  2. Lei, Q.; Weng, D.; Xiong, S.; Liu, H.; Guan, B.; Deng, Q.; Yan, X.; Liang, H.; Ma, Z. Progress and Development Directions of Shale Oil Reservoir Stimulation Technology of China National Petroleum Corporation. Pet. Explor. Dev. 2021, 48, 1035–1042. [Google Scholar] [CrossRef]
  3. Zou, C.; Li, J.; Yang, S.; He, D.; Wei, Y.; Jia, A.; Chen, J.; Zhao, Q.; Li, Y.; Li, J.; et al. Theory, Technology, and Prospects of Conventional and Unconventional Natural Gas. Pet. Explor. Dev. 2018, 45, 13. [Google Scholar] [CrossRef]
  4. Jin, Z.; Wang, G.; Liu, G.; Gao, B.; Liu, Q.; Wang, H.; Liang, X.; Wang, R. Research progress and key scientific issues of continental shale oil in China. Acta Pet. Sin. 2021, 42, 821–835. [Google Scholar] [CrossRef]
  5. Ma, Y.; Cai, X.; Zhao, P.; Hu, Z.; Liu, H.; Gao, B. Geological characteristics and exploration practices of continental shale oil in China. Acta Geol. Sin. 2022, 96, 155–171. [Google Scholar] [CrossRef]
  6. Zan, L.; Luo, W.; Yin, Y.; Jing, X. Formation conditions of shale oil and favorable targets in the second member of Paleogene Funing Formation in Qintong Sag, Subei Basin. Pet. Geol. Exp. 2021, 43, 233–241. [Google Scholar] [CrossRef]
  7. Zhu, X.; Duan, H.; Sun, Y. Breakthrough and significance of Paleogene continental shale oil exploration in Gaoyou sag, Subei Basin. Acta Pet. Sin. 2023, 44, 1206–1221, 1257. [Google Scholar] [CrossRef]
  8. Zhang, L.; Li, J.; Li, Z.; Zhang, J.; Zhu, R.; Bao, Y. Advances in Shale Oil/Gas Research in North America and Considerations on Exploration for Continental Shale Oil/Gas in China. Adv. Earth Sci. 2014, 29, 700–711. [Google Scholar] [CrossRef]
  9. Song, G.; Zhang, L.; Lei, S.; Xu, X.; Shu, R.; Wang, M.; Li, Z. Resource evaluation method for shale oil and its application. Earth Sci. Front. 2013, 20, 221–228. [Google Scholar]
  10. Zhang, L.; Li, J.; Li, Z.; Zhu, R.; Zhang, S.; Liu, Q.; Zhang, J.; Chen, Z. Characteristics and Genesis Mechanism of Organic Storage Space Development in Lacustrine Shale. Earth Sci. (J. China Univ. Geosci.) 2015, 40, 1824–1833. [Google Scholar]
  11. Liu, Y.; Chen, Z.; Ji, D.; Peng, Y.; Hou, Y.; Lei, Z. Pore Fluid Movability in Fractured Shale Oil Reservoir Based on Nuclear Magnetic Resonance. Processes 2023, 11, 3365. [Google Scholar] [CrossRef]
  12. Fan, R.; Liao, G.; Mao, R.; Luo, X.; Hou, L.; Zhang, H.; Tian, H.; Wang, G.; Qin, Z.; Xiao, L. Nuclear magnetic resonance response characteristics and quantitative evaluation method of fluid saturation of lacustrine shale oil. Front. Earth Sci. Sec. Solid Earth Geophys. 2023, 11, 1117193. [Google Scholar] [CrossRef]
  13. Gu, M.; Xie, R.; Guo, J.; Jin, G. Evaluation of Fluid Saturation in Shale Using 2D Nuclear Magnetic Resonance. Energy Fuels 2023, 37, 2713–2720. [Google Scholar] [CrossRef]
  14. Li, J.; Wang, M.; Fei, J.; Xu, L.; Shao, H.; Li, M.; Tian, W.; Lu, S. Determination of in situ hydrocarbon contents in shale oil plays. Part 2: Two-dimensional nuclear magnetic resonance (2D NMR) as a potential approach to characterize preserved cores. Mar. Pet. Geol. 2022, 145, 105890. [Google Scholar] [CrossRef]
  15. Zhang, P.; Lu, S.; Li, J.; Chang, X. 1D and 2D Nuclear magnetic resonance (NMR) relaxation behaviors of protons in clay, kerogen and oil-bearing shale rocks. Mar. Pet. Geol. 2020, 114, 104210. [Google Scholar] [CrossRef]
  16. Xu, F.; Jiang, H.; Liu, M.; Jiang, S.; Wang, Y.; Li, J. NMR-Based Analysis of Fluid Occurrence Space and Imbibition Oil Recovery in Gulong Shale. Processes 2023, 11, 1678. [Google Scholar] [CrossRef]
  17. Huang, X.; Li, X.; Zhang, Y.; Li, T.; Zhang, R. Microscopic Production Characteristics of Crude Oil in Nano-Pores of Shale Oil Reservoirs During CO2 Huff and Puff. Pet. Explor. Dev. 2022, 49, 636–643. [Google Scholar] [CrossRef]
  18. Yu, H.; Xu, H.; Fu, W.; Lu, X.; Chen, Z.; Qi, S.; Wang, Y.; Yang, W.; Lu, J. Extraction of shale oil with supercritical CO2: Effects of number of fractures and injection pressure. Fuel 2021, 285, 118977. [Google Scholar] [CrossRef]
  19. Yu, W.; Lashgari, H.R.; Wu, K.; Sepehrnoori, K. CO2 injection for enhanced oil recovery in Bakken tight oil reservoirs. Fuel 2015, 159, 354–363. [Google Scholar] [CrossRef]
  20. Al-Yaseri, A.Z.; Lebedev, M.; Vogt, S.J.; Johns, M.L.; Barifcani, A.; Iglauer, S. Pore-scale analysis of formation damage in Bentheimer sandstone with in-situ NMR and micro-computed tomography experiments. J. Pet. Sci. Eng. 2015, 129, 48–57. [Google Scholar] [CrossRef]
  21. Yang, F.; Ning, Z.F.; Wang, Q.; Zhang, R.; Krooss, B.M. Pore structure characteristics of lower Silurian shales in the southern Sichuan Basin, China: Insights to pore development and gas storage mechanism. Int. J. Coal Geol. 2016, 156, 12–24. [Google Scholar] [CrossRef]
Figure 1. Shale core after Brazilian seaming.
Energies 17 00694 g001
Figure 2. MacroMR12-150H-Large-Size MRI High Temperature and High Pressure Imaging Analyzer.
Energies 17 00694 g002
Figure 3. Photographs of the core before and after wire-cutting treatment. (a) Core before wire cutting; (b,c) After the core is wire-cut.
Energies 17 00694 g003
Figure 4. Schematic diagram of an evacuated high-pressure saturated crude oil unit.
Energies 17 00694 g004
Figure 5. Fluid calibration tool for NMR. (a) Manganese chloride solution; (b) Experimental oils.
Energies 17 00694 g005
Figure 6. Fluid calibration results for NMR. (a) Results of calibration of manganese chloride solution; (b) Experimental oil calibration results.
Energies 17 00694 g006
Figure 7. Schematic diagram of the flow of the experiments of segment plug injection of imbibition fluid and CO2 Huff-n-Puff. 1. Constant pressure and speed pump; 2. Injection unit computerized acquisition system; 3. Intermediate vessel A (imbibition fluid); 4. Intermediate vessel B (CO2); 5. Air booster pump; 6. Pressure gauge; 7. NMR experimental device; 8. Graduated cylinder; 9. CO2 gas cylinder; 10. NMR signal acquisition system; 11. Confining pressure pump. The dotted line in the Figure 6 shows the monitoring range of the acquisition system. NS is a nuclear magnetic resonance testing facility.
Energies 17 00694 g007
Figure 8. NMR results of the first cycle of Injecting-Stewing-Producing experiment. (a) The process of injecting different Huff-n-Puff media into the well; (b) the process of storing the well for 48 h; (cf) the changes of NMR curves under different production pressures; (g) the changes of NMR curves from the beginning of storing the well to the end of the first cycle of Huff-n-Puff.
Energies 17 00694 g008
Figure 9. Variation of oil content in each pore size pore of the core during the first Huff-n-Puff cycle.
Energies 17 00694 g009
Figure 10. NMR results of the second cycle of the Injecting-Stewing-Producing experiment. (ae) the changes of NMR curves under different production pressures; (f) the changes of NMR curves from the beginning to the end of the second cycle of Huff-n-Puff.
Energies 17 00694 g010
Figure 11. Variation of oil content in each pore size pore of the core during the second Huff-n-Puff cycle.
Energies 17 00694 g011
Figure 12. NMR results of the third cycle of the Injecting-Stewing-Producing experiment. (ae) the changes of NMR curves under different production pressures; (f) the changes of NMR curves from the beginning to the end of the third cycle of Huff-n-Puff.
Energies 17 00694 g012
Figure 13. Variation of oil content in each pore size pore of the core during the third Huff-n-Puff cycle.
Energies 17 00694 g013
Figure 14. Variation of NMR curves at the end of different cycles of Huff-n-Puff experiments.
Energies 17 00694 g014
Figure 15. Extent of crude oil recovery from the core at the end of different cycles of Huff-n-Puff experiments.
Energies 17 00694 g015
Table 1. Basic data of experimental rock core.
Diameter, mmLength, mmRock Core Volume, cm3Porosity, %Pore Volume, cm3Permeability, 10−3 μm2
25.0146.6723.054.511.041.81
Table 2. Description of NMR parameters.
Symbol Name and UnitMeaning and Description
SF (MHz)Primary value of RF signal frequency
O1 (KHz)RF signal frequency offset
P1 (us)RF 90° pulse width
P2 (us)RF 180° pulse width
SW (KHz)The frequency range of the signal received by the receiver and the sampling frequency of the signal during sampling
RFD (ms)RF delay
TW (ms)Repeat Sampling Interval
RG1Analog Gain
DRG1Digital Gain
PRGPreamplification Gain
NSAccumulated sampling times
TE (ms)Echo time
NECHNumber of echoes
Table 3. Changes in NMR signal volume during the first Huff-n-Puff cycle.
Production ProcessTotal Signal
(a.u.)
Volume of Oil Recovered (mL)Extraction Level (%)Remaining Oil Volume
(mL)
Stewed well for 48 h10,010.810.0000.0000.713
23 MPa8694.710.09413.1470.619
21 MPa8203.880.12918.0500.584
19 MPa7531.370.17724.7670.536
17 MPa7129.200.20528.7850.508
15 MPa7052.960.21129.5460.502
Table 4. Changes in NMR signal volume during the second Huff-n-Puff cycle.
Production ProcessTotal Signal
(a.u.)
Volume of Oil Recovered (mL)Extraction Level (%)Remaining Oil Volume
(mL)
Stewed the well for 48 h after the 2nd Huff-n-Puff7050.390.21090.502
23 MPa6771.340.230732.3600.482
21 MPa6476.080.251835.3090.461
19 MPa6274.540.266137.3220.447
17 MPa6051.960.282039.5460.431
15 MPa5995.360.286040.1110.427
Table 5. Changes in NMR signal volume during the third Huff-n-Puff cycle.
Production ProcessTotal Signal
(a.u.)
Volume of Oil Recovered (mL)Extraction Level (%)Remaining Oil Volume
(mL)
Stewed the well for 48 h after the 3rd Huff-n-Puff5994.460.28610.427
23 MPa5845.230.296741.6110.416
21 MPa5635.670.311643.7040.401
19 MPa5575.350.315944.3070.397
17 MPa5391.220.329146.1460.384
15 MPa5337.310.332946.6840.380
Table 6. Results of different cycles of Huff-n-Puff experiments.
Huff-n-Puff CyclesVolume of
Imbibition Fluid (mL)
Volume of CO2
(mL)
Stage Oil
Production (mL)
Stage
Extraction Level (%)
Replacement Efficiency
(%)
First cycle0.180.280.21129.5546
Second cycle0.220.250.07510.5616
Third cycle0.230.270.0476.579.4
Disclaimer/Publisher’s Note: The statements, opinions and data contained in all publications are solely those of the individual author(s) and contributor(s) and not of MDPI and/or the editor(s). MDPI and/or the editor(s) disclaim responsibility for any injury to people or property resulting from any ideas, methods, instructions or products referred to in the content.

