Abstract
The opposed wall-fired boiler is widely used in Chinese power plants due to its adaptability. However, deviations from design conditions can cause the reduction of combustion efficiency and combustion stability, and the overheating of heating surfaces. This study conducted numerical simulations on a 600 MW supercritical opposed wall-fired boiler at 75%, 50%, and 30% Turbine Heat Acceptance (THA) load conditions. The variation of temperature field and heat flux in the furnace under different loads, and parameters such as distributions of heat flux, temperature, and the stress of the high-temperature heating surface are analyzed. Results indicate that reducing the load from 75% to 30% THA lowers the furnace outlet temperature from 1158 to 1009 K and reduces the average gas temperature of the high-temperature heating surface from 1800 to 1570 K. Under a high load, the maximum heat flux concentrates on the side water-cooled wall of the combustion zone. However, when the load decreases, the heat absorption shifts towards the main combustion zone. Furthermore, under a high load, the average wall temperature of the high-temperature heating surface remains at 1600 K with a uniform temperature distribution. In contrast, when the load drops to 30% THA, significant temperature differences appear on the heating surface, with a maximum difference of 400 K. This leads to excessive expansion and slagging on the high-temperature heating surface, particularly in the middle and lower sections, due to the increased stress. These findings offer valuable insights for optimizing the combustion characteristics of opposed wall-fired boilers and preventing overtemperature explosions on the platen heating surface.
1. Introduction
In recent years, the energy industry has encountered numerous challenges, including environmental regulations and the imperative for transitioning to diversified energy sources. As part of the solution, renewable energy sources (RESs) have actively integrated into power system networks, steadily increasing their share [1]. With the Chinese proposal of the strategic goal of “2030 carbon peak, 2060 carbon neutral” in China, the proportion of renewable energy power generation is gradually increasing, which means that the proportion of coal-based thermal power generation is declining. Large boilers in coal-fired power plants are facing long-term medium- or low-load operation. However, due to the instability of renewable energy, the large-scale utilization of intermittent wind energy and solar energy has produced many challenges to the stable dispatching and operation of the power system [2]. Therefore, coal-fired power generation has to increase again and coal-fired power plant boilers need to be adjustable and operate stably under both low and high load conditions [3]. In China, coal-fired power plants frequently employed opposed wall-fired boilers because of their superior performance in air–powder mixing and consistency in heat load distribution [4].
The wall-fired boiler stands out as a prevalent furnace type in coal-fired power plants, employing an independent flame arrangement to ensure stable combustion, even at minimal loads [5]. Improper regulation of variable load operations in the boiler can lead to a decline in combustion efficiency, an increase in pollutants, and the occurrence of operational accidents such as flameout, overheating of the heating surface, and tube bursts. A reduction in load can elevate the wall heat flux. During the initiation of the boiler from a cold state, the rapid escalation in tube temperature may induce substantial thermal stresses, resulting in exfoliation and the accumulation of steam-side oxide scales [6]. The optimal operating load of coal-fired boilers is 70–100% of the rated electrical load and the operation of boilers at less than 70% of the rated load belongs to low-load operation [7,8]. China’s thermal power unit design is mostly based on the basic load as the set working condition, and the general unit load regulation ranges between 40% and 100% Turbine Heat Acceptance (THA), which is generally only 40% to 50% of the peak capacity. Compared to Germany, Denmark, and other developed countries, where more than 70% of the peak capacity is utilized, there is still a big gap [9]. As the capacity of the boiler increases, the boiler operates under different temperature and pressure conditions, which can easily cause the uneven distribution of the heat load, resulting in the uneven distribution of heating surface temperature and stress, resulting in problems such as water pipe rupture and membrane wall expansion deformation. This poses a significant threat to the secure functioning of the boiler, particularly the opposed wall-fired boiler. The heating surface in contemporary boilers is subjected to various unfavorable working conditions. These include high-temperature and low-temperature corrosion induced by distinct chemical components on the flue gas side, deposit and corrosion within the water tube, fly ash erosion, and deposition on the convective heating surface, as well as fouling and slagging [10,11].
Researchers have done much work related to the temperature and heat flux distribution in the furnace and on the heating surfaces [12,13,14,15]. In recent years, numerical simulation technology has gradually become an important means of studying the combustion characteristics of boilers. For the calculation of boiler temperature distribution, numerical models based on computational fluid dynamics (CFD) are commonly utilized [16,17,18,19,20]. To prevent the boiler’s high-temperature heating surface from failing, many researchers have conducted studies on the working condition of the boiler’s heating surface. Some scholars have studied and tried to improve the combustion conditions in the furnace to create better working conditions for the heating surface [21,22,23]. The unavoidable effect of stresses during boiler operation was further investigated [24,25]. Other scholars researched the high-temperature corrosion behaviors of boiler heating surface materials [26,27].
However, there are few studies on the temperature distribution in the furnace and the variation in the wall temperature and stress of the heating surface under variable load conditions in opposed wall-fired boilers. Meanwhile, all of them may lead to serious operational problems or even accidents. Therefore, this paper calculates the heat load distribution and temperature field distribution in the furnace and the wall temperature and stress distribution of high-temperature heating surfaces in the furnace under 75% THA, 50% THA, and 30% THA conditions. In addition, this paper monitors the heat load distribution in several key cross-sections to derive the distribution of velocity and temperature fields, which offers valuable insights for optimizing the combustion characteristics of opposed wall-fired boilers and preventing overtemperature explosions on the platen heating surface.
2. Calculating the Condition of the Boiler Equipment
The numerical simulations are executed on a 600 MW supercritical opposed wall-fired boiler. Figure 1 shows the boiler structure. The height, width, and depth of the furnace are 72,500, 22,162, and 54,865 mm, respectively. The boiler is a spiral-coil direct-current furnace with supercritical parameter-variable pressure operation, a single furnace, intermediate reheating, a front and rear wall hedge combustion mode, balanced ventilation, solid-state slag discharge, an all-steel suspension structure Π boiler, and an indoor layout coal boiler. The boiler adopts a completely tight seal.
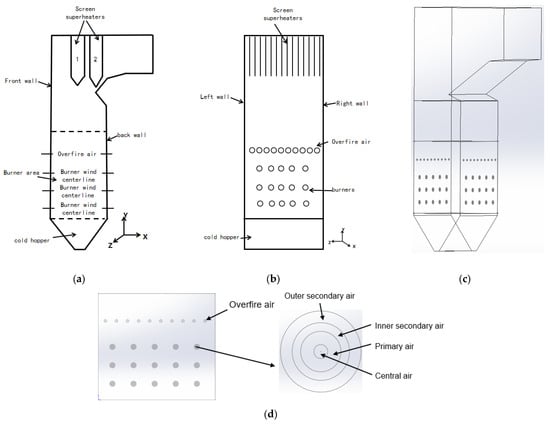
Figure 1.
Structure diagram of the boiler. (a) Boiler main view, 1 is the high-temperature superheater, 2 is the high-temperature reheater; (b) Boiler side view; (c) Boiler stereogram; (d) Air and fuel inlets.
2.1. Flue Gas and Air Supply
A forced draught fan sends the air to the two three-compartment air preheaters. The flue gas transfers heat to the heated primary air mixed with cold primary air into the pulverizer, then into the pulverized coal burner arranged in the front and rear walls. The heated secondary air enters into the burner wind box and then into the secondary air inside each burner through the regulating baffle and the outside secondary air channel. At the same time, part of the secondary air enters into the burnout air nozzle in the upper part of the combustor.
2.2. Main Boiler Parameters
Table 1 shows the main parameters of the boiler.

Table 1.
Boiler main parameters.
2.3. Burner Condition
The burner divides the air for combustion into four parts: the primary air, the inner secondary air, the outer secondary air, and the center air. The specific structure is shown in Figure 2. The primary air duct outlet possesses a greater thickness and expansion of the cone to enable primary and secondary air separation and the formation of an angle, to form a stable annular backflow region through the high speed of the primary and secondary air suction volume in the range of the angle (Figure 3). Under the combined action of the above factors, the pulverized coal gas can catch fire quickly and timely after leaving the burner nozzle and burn stably.
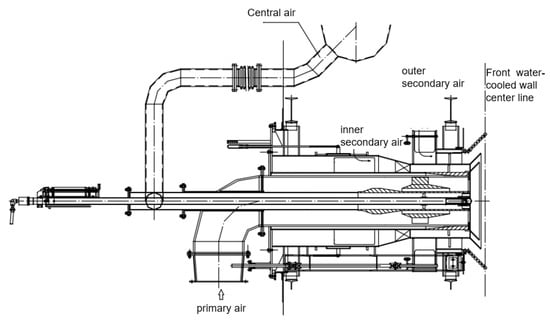
Figure 2.
Cyclone pulverized coal burner sketch.
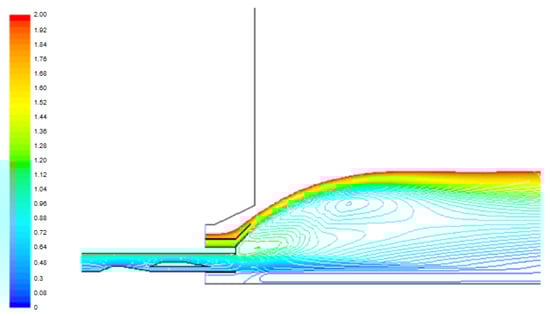
Figure 3.
Schematic diagram of the backflow region.
3. Modeling Methodology
3.1. Modeling and Grid
A 3D model of the supercritical opposed wall-fired boiler according to the data acquired from the power plant was developed in SOLIDWORKS 2022. To facilitate the mesh division, the calculated furnace is divided into five regions according to the model characteristics (as shown in Figure 4). These are the cold ash hopper region, the burner region, the upper region of the burner, the arch nose region, and the furnace outlet region. All five areas adopt structured grids, and the interface is set up to calculate the data connection between the regions.
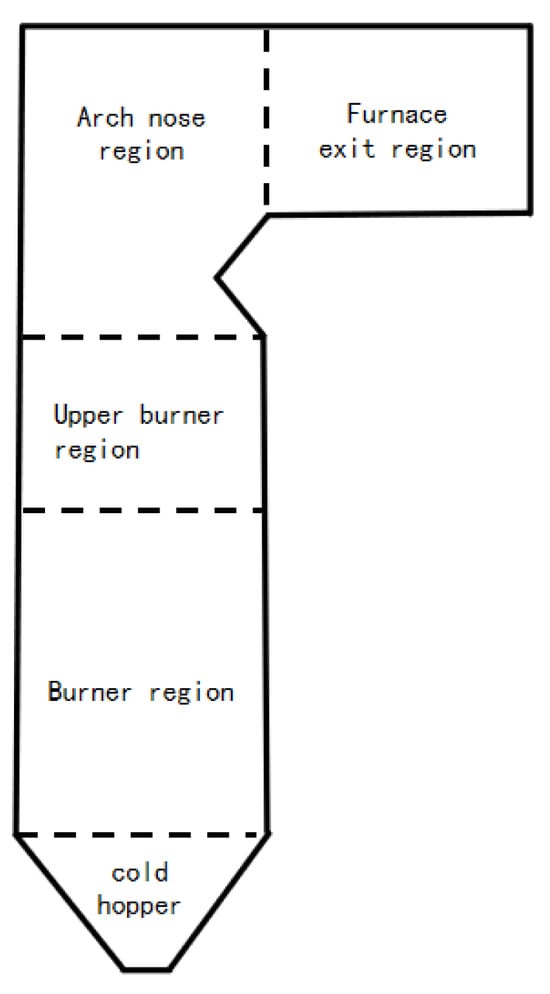
Figure 4.
Calculation of furnace partitions.
As the cold ash hopper region has little influence on the accuracy of the numerical simulation calculation, the number of grids in the cold ash hopper region is appropriately reduced. The burner area is in a state of high-temperature combustion, which requires a high calculation accuracy. Therefore, all entrances and the whole area are properly encrypted, and the remaining areas are divided into grids according to the characteristics of the model. The platen superheater and high-temperature superheater are replaced with a flat surface without thickness. The overall grid of the completed boiler is shown in Figure 5. Domestic and foreign scholars often use numerical simulation methods to predict thermal deviation and wall temperature. In order to simplify the calculation process, the boiler heating surface is always set as a uniform wall temperature [28,29,30], uniform working medium temperature [31], and uniform heat flux [32].
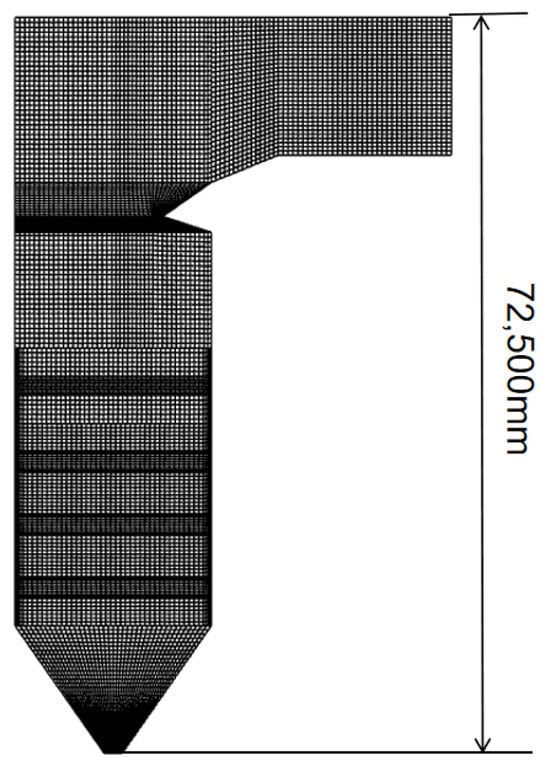
Figure 5.
Mesh division.
As shown in Figure 6, the high-temperature superheater is simplified into a plane with a thickness of 0, called heating surface 1, and the high-temperature reheater is also simplified into a plane with a thickness of 0, called heating surface 2.
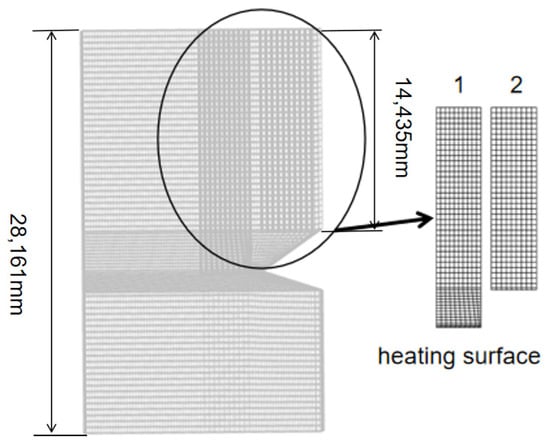
Figure 6.
Schematic of heating surface mesh.
3.2. Numerical Methods
The pulverized coal combustion process in a coal-fired boiler encompasses a complex series of chemical and physical phenomena, including turbulent flow, heat transfer, and combustion reactions. Numerical simulations were conducted using the Simple algorithm and three-dimensional steady-state calculations. For turbulent modeling, the realizable k-ε model was chosen due to its precise prediction capabilities for swirling flow and intense recirculation [33]. Simulations of pulverized coal particle movement were executed using the Discrete Phases Model (DPM) [34]. To simulate radiation heat transfer, the P-1 model was employed since the cell-based Weighted-Sum-of-Gray-Gases Model (WSGGM) is a very poor approximation that may yield large errors [35]. The absorption coefficient of flue gas was determined using the domain-based WSGGM model [36]. The Probability Density Function (PDF) model was utilized for calculating non-premixed combustion gas-phase turbulent combustion. To predict the devolatilization process, a Two-Competing-Reaction model proposed by Kobayashi et al. was selected [37]. The Kinetics/Diffusion-Limited Char Combustion model was employed to simulate coke combustion. The Particle Radiation Interaction method was applied to track coal particles [38]. Boundary conditions were established based on wind speed and temperature data for the burner center air, primary air, inner secondary air, and outer secondary air inlets under varying loads. The power plant provided data on coal quality analysis, fuel consumption, and the number of burner layers. Describing the particle phase involved employing the Lagrange method, and a mathematical model was developed using this approach. The Lagrange method treats fluid and particles as inter-penetrable continuous media, providing simplified calculations while effectively tracking complex particle trajectories [39].
Various computational techniques have evolved over the years for modeling flows involving suspended particles. The first category of methods involves computing the velocity and pressure fields of the fluid flow around each individual particle through the numerical solution of the Navier–Stokes system [40]. Hydrodynamic forces acting on each particle are then calculated based on the fluid flow solution and incorporated into the equation governing particle motion. In the studies by Hu [41] and Hu et al. [42], the velocity and pressure fields of the fluid flow were determined using the finite element method. The finite element mesh included nodes positioned along the fluid–solid boundaries, and these nodes moved in tandem with the particles.
3.3. Mathematical Model and Model Parameters for Numerical Simulation
Here are the main solving equations.
3.3.1. Realizable k-ε Model
Generalized form equation:
k-equation:
ε-equation:
3.3.2. Lagrangian Stochastic Tracking Model
Force balance equation with the forces acting on the particle (for the × direction in Cartesian coordinates):
Instantaneous momentum equation for the particle:
Particle trajectory equation:
3.3.3. P-1 Model
Radiation heat flux qr equation:
3.4. Stress Solution
Under the action of the load, the six stress components on any element divided on the elastic body, including the normal stress and shear stress along the three coordinate axes, satisfy the following relations:
where , , and are the three-way normal stress perpendicular to the external surface of the microelement, , , , , , and are the shear stress parallel to the external surface of the microelement, and X, Y, and Z are the components of the unit volume force along the three coordinate directions.
3.5. Grid Independence Testing
To verify the independence of the grid, boiler models with 2.4 million, 3.1 million, and 3.8 million grids were calculated, respectively. The calculation results are shown in Figure 7. When the number of grids is 3.1 million and 2.8 million, the average temperature of the furnace section has practically the same distribution along the furnace height, while the difference is obvious when the number of grids is 2.4 million. Finally, the total number of grids was determined to be 3.1 million.
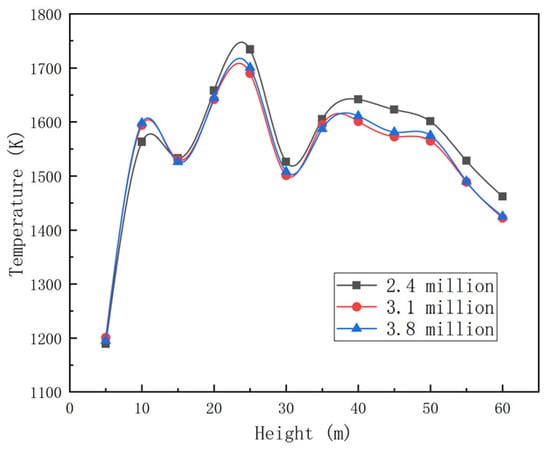
Figure 7.
Grid independence testing.
3.6. Boundary Condition
The boundary conditions of numerical simulation include conventional entrance conditions, wall conditions, and exit conditions. The inlet boundary conditions are mainly the inlet conditions of each nozzle of the burner, including the velocity, temperature, and turbulence intensity of all levels of air (the primary air, the inner secondary air, the outer secondary air, the center air, and overfire air), as well as the mass flow, velocity, temperature, and particle size distribution of the pulverized coal particles at the nozzle of each layer of pulverized coal burner. The inlet mass flow rate and temperature of the pulverized coal burner nozzle are given according to the design parameters, and the gas phase of the air (primary and secondary air, etc.) is determined by each wind speed and wind temperature.
For pulverized coal particles, besides speed and temperature, particle characteristics are also considered. The particle size is Rosin-Rammler distributed, the minimum particle size is 10 μm, the maximum particle size is 100 μm, and the average particle size is 60 μm. No velocity slip and no mass penetration conditions are adopted on the solid wall surface of the calculation area. The first type of boundary condition is selected for the heat flow wall condition, and the wall temperature and emissivity are 690 K and 0.3, respectively. The outlet boundary of the calculation area is the horizontal plane in front of the superheater, which is described by the free outlet boundary condition.
3.7. Differential Approximations for Radiative Heat Transfer in Combustion Systems Containing Particles
A radiative model must not only achieve acceptable accuracy but also exhibit sufficient efficiency for incorporation into coupled numerical modeling of turbulent combustion problems [43]. In combustion systems, radiation serves as a crucial mode of energy transport for various reasons [44]. Firstly, high-temperature combustion devices necessitate the consideration of heat transfer through diffusion, convection, and radiation. Energy losses from the reaction region govern processes such as flame quenching and flame evolution near walls [44]. Secondly, the heat transfer rate from reactants and/or post-reaction combustion products to the load and/or containment walls of the chamber is determined by convection and radiation [44].
In approximating the scattering function, commonly used methods include expansion in a series of Legendre functions or describing the main maxima of the scattering function through several delta functions with associated weight coefficients. Some combinations of these two approaches are also employed [45,46]. The simplest approximations of each method are well known. If one is restricted to two terms in expansion in terms of the Legendre functions, the result is the linear anisotropic approximation [47]:
where is the asymmetry factor of scattering:
3.8. Case Conditions
The furnace temperature, heat flux, platen heating surface’s temperature, and stress distribution under 75% THA, 50% THA, and 30% THA operating conditions are calculated. The burner inlet sizing conditions are shown in Table 2, and the axial air velocity and air temperature at each air outlet vary according to the load.
Table 2.
Equivalent diameter of each burner duct.
The actual fuel consumption under 75% THA, 50% THA, and 30% THA loads of the plant is 259.67, 175.83, and 145.73 t h−1, respectively. The total primary air volume is 427,200, 310,590, and 265,809 kg h−1, respectively. The total secondary air volume is 1,321,149, 978,839, and 850,809 kg h−1, respectively. The total amount of overfire air is 96,695, 17,712, and 41,616 kg h−1. The excess air ratio is 1.24, 1.29, and 1.34, respectively. Coal quality analysis is shown in Table 3.
Table 3.
Coal analysis.
4. Results and Discussion
4.1. Verification of Numerical Simulation Accuracy
To verify the accuracy of the numerical simulation calculation, the temperature measurement point in the furnace under the 75% THA condition provided by the power plant was compared with the corresponding point simulation calculation value. The results are shown in Table 4. The relative errors are within 5%, indicating that the calculation of the accuracy is sufficient and the simulation results can be used to discuss the analysis.
Table 4.
Comparison of field measurement points with numerical simulation data.
4.2. Numerical Simulation of the Furnace
4.2.1. Furnace Flow Distribution
The simulation in this study quantifies the flow field distribution within the central section of the furnace. As depicted in Figure 8, the overall flow field in the furnace is symmetrically distributed in the front and rear walls, and the ejector gas from the front and rear wall burners is congregated in the middle of the furnace. In the upper part of the combustion area, the overfire air is injected into the furnace.
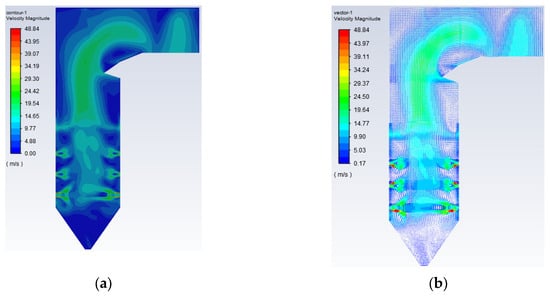
Figure 8.
Flow field distribution in the center section of the furnace chamber. (a) Velocity cloud of the furnace cross-section; (b) Furnace cross-section velocity vector.
It has strong rigidity and high wind speed and can force the flue gas into the middle area of the furnace. The velocity of flue gas at the top of the furnace and the upper part of the arch nose region decreases sharply and backflow occurs. The distribution of the flow field is similar to the results from other scholars [48,49].
Based on the structural data of the boiler, longitudinal cross-sections (XZ plane) were extracted at three elevations within the burner area, specifically at 23.204 m (third layer), 18.192 m (second layer), and 13.179 m (first layer), as illustrated in Figure 9a. These cross-sections were analyzed to investigate the flow field and temperature distribution within the combustor. Within the burner region, a portion of the airflow introduced into the chamber via the lowest burner is directed towards the cold ash hopper area, while the remaining airflow from the burner ascends, carrying the heat generated during combustion.
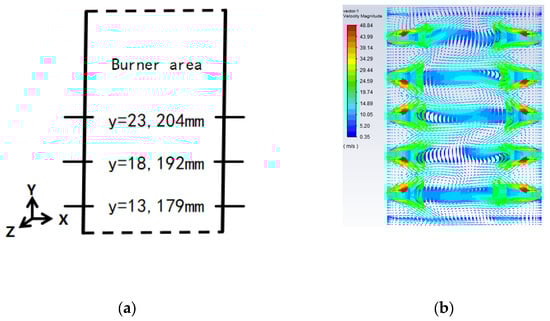
Figure 9.
Vector diagram of burner cross-section velocity. (a) Schematic cross-section of the burner section; (b) Vector diagram of the velocity of the lowermost burner section.
From Figure 9b, at the exit of the lower burner, the DC central wind and the primary wind are rigid enough to pass through the backflow region into the middle region of the furnace chamber. The inner secondary wind and the outer secondary wind exit produce a backflow region, in which the flue gas temperature is very high, and it can roll and suck the unburned coal particles to promote combustion.
4.2.2. Temperature of the Furnace under Different Loads
Particles entrained in the combustion gas can be categorized into carbonaceous (coal, char, and soot) or non-carbonaceous/inorganic (fly ash). Carbonaceous particles are predominantly located in the firebox region, while fly ash may be the sole type of particle remaining in the heat absorption region [49]. In furnace heat transfer calculations, optical constants of coals are deemed of secondary importance to char since the devolatilization time of coal is generally insignificant compared to the char burn-out time [49]. Therefore, this article will not delve into this aspect.
Figure 10 shows the temperature distribution of the central section of the furnace under different operating loads. Figure 11 shows the temperature distribution of the front wall under different operating loads.
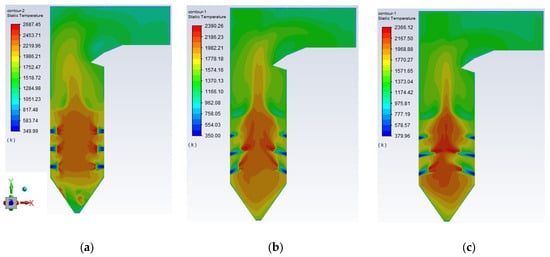
Figure 10.
Temperature distribution of furnace center section under different loads (a) 75% THA; (b) 50% THA; (c) 30%THA.
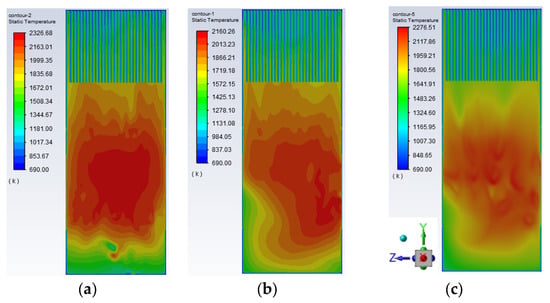
Figure 11.
Temperature distribution of the front wall under different loads (a) 75% THA; (b) 50% THA; (c) 30%THA.
At 75% THA, the flame-filling degree in the furnace is the highest and a large amount of unburned carbon enters the upper part of the furnace to burn. The maximum temperature in the upper part of the furnace reaches 1520 K, which can easily cause slagging of the platen superheater. At the same time, more desuperheater water is needed to control the temperature of the superheated steam. With the decrease of the load, the flame temperature in the furnace decreases and the high-temperature area shrinks and gradually concentrates in the burner outlet area.
From Figure 11, with the reduction of the boiler load, the flame-filling degree decreases. At 75% load, the high-temperature area is concentrated in the burner area, the pulverized coal burns well, the temperature distribution is uniform on the left and right walls of the furnace, and the maximum temperature in the combustion area reaches approximately 2300 K. With the decrease of the load, the flame in the furnace will shift, and the temperature of the right wall is obviously higher than that of the left wall, which makes the slagging of the water-cooling wall of the left wall more likely. The flame-filling degree gradually decreases and the overall temperature in the furnace decreases more when the load reaches 30%.
To study the influence of load change on the pulverized coal combustion of the burner tissue, the temperature distribution cloud maps of the central cross-section of the three-layer burner under 75%, 50%, and 30% THA load were intercepted, respectively, as shown in Figure 12. From the figure, the swirling secondary air enrolls 1500 K high-temperature flue gas to the root of the primary air jet to heat and ignite the pulverized coal, thus maintaining the stable combustion of the boiler. The outward expanding swirling secondary air forms a barrier in front of the water wall of the front and rear walls of the main combustion area, which can prevent the pulverized coal particles from burning near the water wall, so as to effectively prevent slag formation and corrosion in the area and reduce the probability of burner burning damage. Part of the pulverized coal sprayed into the burner near the side wall of the furnace will reach the middle of the side wall of the furnace and burn, increasing the temperature of the area and reaching 1700 K when the load is more than 50% THA, indicating that the area prone to slag formation and corrosion of the boiler is mainly located in the middle of the water cooling wall of the side wall of the burner area.
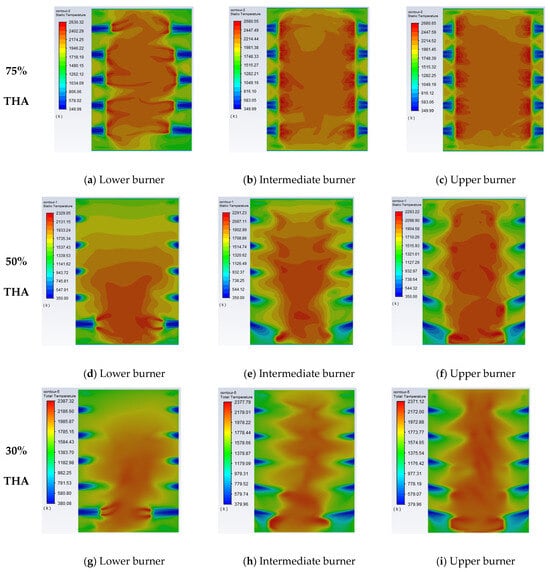
Figure 12.
Temperature distribution of each burner section under different loads.
4.2.3. Heat Flux Distributions of the Furnace Wall under Different Loads
Furnace heat load as a measure of the flue gas flow rate in the furnace and pulverized coal combustion intensity of a key indicator. Its high and low values are directly related to the furnace cross-section, and whether the combustion region of the water-cooled wall is slagging or not. Therefore, the calculation of the heat load of the furnace wall, as well as the distribution of the heat load under different operating conditions, is shown in Figure 13. All wall heat loads are negative due to wall heat absorption.
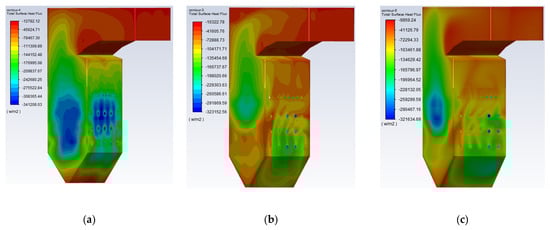
Figure 13.
Furnace heat load for different conditions. (a) 75% THA; (b) 50% THA; (c) 30%THA.
In most of the furnace chambers for radiation heat transfer, the burner area temperature is higher, coupled with the hedge nozzle and the flame bias side of the wall with the highest local heat load. Under conditions of 75% THA, the heat load is higher on the wall near the nozzle in the main combustion area and above the cold ash hopper. In the upper part of the burner area, the heat load is evenly distributed and the arch nose has little effect on the distribution of heat load.
Under conditions of 50% THA, the heat load is higher on the right wall of the furnace. Due to the reduction of the operating load and the reduction of the coal feed, the flame temperature is lowered and heat absorption decreases, but the heat load is higher on the right wall of the furnace and in the first and second layers of the burner area. However, in the right wall of the furnace and the first two layers of the burner area, the heat load is higher and the heat absorption is large.
Under conditions of 30% THA, the heat absorption of the furnace is further reduced. At this time, the temperature field and the velocity field of the furnace are lower, and the overall heat absorption is reduced compared with the previous two conditions. However, there is still a high heat load area in the right wall. The water-cooled wall area on the right wall of the furnace should be protected against slagging, wear, and expansion. As the load is reduced, the heat load distribution in the furnace becomes more uniform, indicating that the heat absorption is uniform, and the load reduction will improve the heat load distribution on the wall.
4.3. Numerical Simulation of Heating Surfaces 1 and 2
4.3.1. Temperature Distribution Analysis of Heating Surfaces 1 and 2 under Different Loads
Furthermore, it is crucial to direct attention to the temperature distribution across the heating surface. An uneven temperature distribution can result in excessive thermal stress on the heating surface, leading to worse expansion. Positioned in the upper region of the furnace, the platen superheater plays a multifaceted role in heat absorption. It absorbs both direct radiation emanating from the high-temperature flame within the furnace and space radiation from the flue gas that interfaces with the heating surface. Monitoring the temperature distribution within the platen superheater is imperative. By assessing the temperature distribution cloud across the platen superheater’s heating surface (1 and 2) within the furnace, critical insights and preliminary conditions for addressing these issues can be obtained. The results of this analysis are displayed in Figure 14.
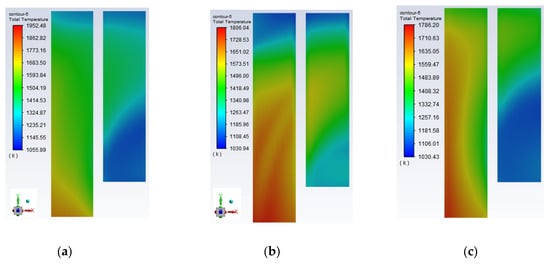
Figure 14.
Distribution of the temperature of the platen heating surface for different working conditions. (a) 75% THA; (b) 50% THA; (c) 30% THA.
Analysis of the figure reveals that the temperature difference between the three working conditions of heating surface 1 is large, according to the temperature distribution law. The temperature gradually decreases from the bottom to the top of the process, with the highest temperature at the bottom. This is because the part, in addition to absorbing radiation heat transfer from the flame of the burner area, also absorbs the high-temperature flue gas (approximately 1850 K) in the upper part of the furnace chamber. Therefore, the focus should be on the study of high-temperature heating surface slagging and wear problems in this region. The overall temperature of heating surface 2 is less than heating surface 1 because it is subjected to less radiative heat transfer from the high-temperature flame. Specific temperature distributions for all sections of heating surface 1 under varying operational conditions are provided in Figure 15. Similarly, Figure 16 presents detailed temperature distributions across all segments of heating surface 2 under different working conditions.
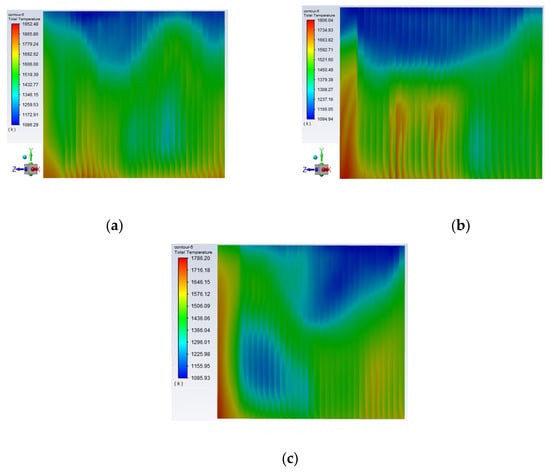
Figure 15.
Overall heating surface 1 temperature distribution. (a) 75% THA; (b) 50%THA; (c) 30% THA.
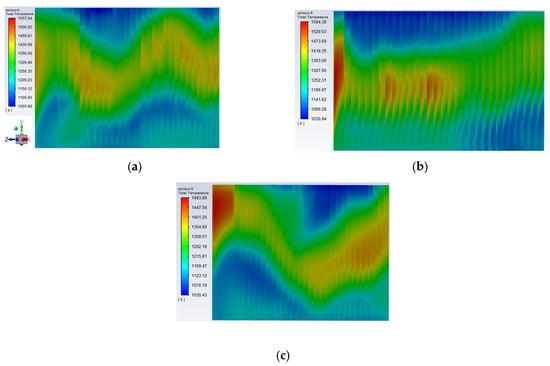
Figure 16.
Overall heating surface 2 temperature distribution. (a) 75% THA; (b) 50% THA; (c) 30% THA.
Heating surface 1 exhibits a prevailing higher temperature profile, with some regions exceeding 1800 K. To address this condition, it is imperative to implement anti-slagging measures and install expansion measurement devices at the lower regions of heating surface 1. These measures are essential for preventing excessive expansion. Conversely, heating surface 2 demonstrates a distinctive temperature distribution pattern. The highest temperature concentrations are observed within the central area of this heating surface, coinciding with the region of maximum thermal stress. Consequently, the central area of heating surface 2 warrants significant attention.
4.3.2. Stress Distributions of Heating Surfaces under Different Loads
Figure 17 shows the thermal stress distribution of two high-temperature heating surfaces under different loads. When the high-temperature heating surface 1 is under a 75% THA load, the maximum thermal stress area is in the bottom of the platen. According to the temperature (Figure 11) distribution in the furnace, this area is in the high-temperature area of 1700 K. The bottom of the platen absorbs not only the radiation heat transfer from the high-temperature flame but also the convection heat transfers from the high-temperature flue gas generated by combustion. The temperature difference is large, with the maximum temperature difference reaching 200 K, so the thermal stress in this region is the largest. In the actual operation of the boiler, more attention should be paid to the slagging formation in this area.
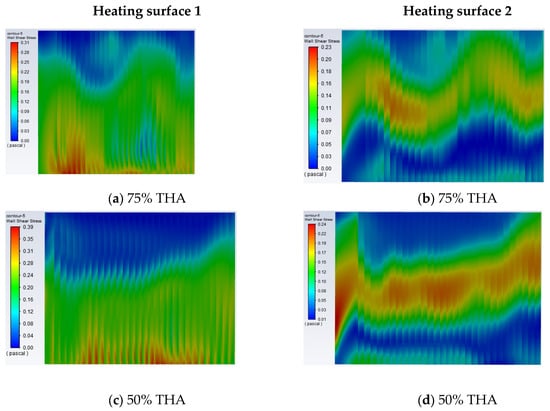
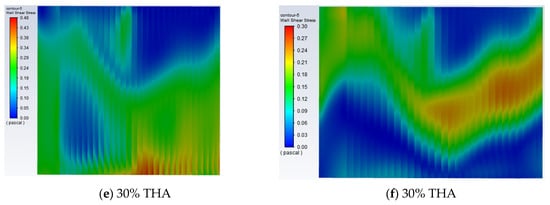
Figure 17.
Stress distribution of two high-temperature heating surfaces under different loads.
With the decrease of the operating load, the stress in the upper part of the platen superheater decreases and the high-stress area transfers downward. However, the stress in the bottom of the platen area is still high, indicating that the bottom of the platen area is a region with large thermal stress regardless of the operating load, so it is necessary to pay attention to the expansion of the heating surface and the overtemperature explosion of the tube in this area.
For high-temperature heating surface 2, the large thermal stress area is concentrated in the middle of the heating surface. At 75% THA, the high thermal stress area is in the middle area of the heating surface. As the load decreases, the area with high stress increases because the distribution of the flow field and temperature field in the furnace becomes more uneven as the load decreases. As shown in Figure 14, the maximum temperature difference is approximately 400 K. No matter the load level, the heat stress in the middle and lower right of heating surface 2 is higher, indicating that this area is prone to excessive expansion of the heating surface, which should be paid attention to. The uneven flow rate of the working medium, the mismatch between the flow rate of the working medium and the heat load, and the difference in heat transfer effect all lead to excessive thermal deviation, so that the thermal stress in the middle region of heating surface 2 is larger.
5. Conclusions
For the numerical simulation study of combustion characteristics under 75% THA, 50% THA, and 30% THA loads of a 600 MW supercritical opposed wall-fired boiler, the air flow process and pulverized coal combustion process in the furnace and the combustion characteristics are studied. At the same time, the wall temperature and stress distribution at the top of the furnace with different loads are analyzed. The following conclusions can be drawn:
- (1)
- In a supercritical opposed wall-fired boiler under high load conditions, the furnace flame is filled with a high degree of uniform temperature distribution in the furnace chamber, the distance of the fuel ignition point from the burner outlet of each layer is shorter, the fuel comes from the primary air outlet after rapid combustion, and the pulverized coal combustion rate is high. When the load is reduced, the furnace flame is filled with a reduced degree of narrowing of the combustion area. The burner can effectively combust the fuel under high loads, but the temperature inside the furnace chamber is too high when the load is high, so it is necessary to have burner protection measures to prevent the burner exit temperature from being too high and damaging the burner. When the load is lowered, the flame is close to the left and right walls of the furnace chamber, so there are certain requirements for the temperature resistance of the left and right walls and their water-cooled walls.
- (2)
- Upon reducing the operational load of the boiler, several notable changes are observed. Firstly, the outlet temperature of the furnace experiences a decrease, transitioning from 1158 K to 1009 K. Concurrently, the average temperature within the platen superheater area decreases from 1800 K to 1570 K. With the decrease of the airflow velocity in the furnace, the enrolling capacity of the swirling secondary air on the high-temperature flue gas and the mixing capacity of the exhaust air on the rising flue gas are gradually reduced. Consequently, these changes result in a gradual decrease in temperature within the upper region of the furnace, facilitating the progressive concentration of the high-temperature flame on the operating burner within the main combustion zone.
- (3)
- At elevated operational loads, the temperature distribution across the heating surface 1 exhibits uniformity, primarily around 1600 K. Notably, the bottom platen registers notably high temperatures, with the maximum temperature reaching 1900 K. However, as the load diminishes, a notable shift occurs in the temperature distribution across heating surface 1. Specifically, an uneven temperature distribution emerges, marked by a substantial temperature gradient between the middle and lower segments, with the maximum temperature differential reaching 400 K. This transition precipitates a significant surge in stress within this region, consequently yielding excessive expansion of heating surface 1. In the case of heating surface 2, the higher-temperature region predominantly occupies the central segment, with an overall temperature level inferior to that of heating surface 1. Remarkably, the temperature distribution maintains relative uniformity during load variations, with the maximum stress manifesting in the central region of heating surface 2.
- (4)
- Under high-load conditions, the focal point of maximum heat flux within the furnace wall primarily resides in the sidewall of the primary combustion region. Notably, the burner area and the upper section of the burner receive a substantial heat flux. However, as the operational load decreases, the heat flux gradually converges toward the main combustion zone. In the range of 75% to 50% load, the heat absorption within the main combustion zone remains relatively constant. In the platen superheater area, when the load is reduced, the radiation heat absorption gradually decreases and the convection heat absorption increases.
Author Contributions
J.D.: Investigation, Data curation, Writing—original draft. Y.L.: Conceptualization, Data curation, Investigation, Writing—original draft. Y.Z.: Conceptualization, Writing—review & editing. Y.D.: Conceptualization, Writing—review & editing. D.C.: Conceptualization, Supervision, Resources, Writing—review & editing. All authors have read and agreed to the published version of the manuscript.
Funding
This work has been financially supported by National Energy Group Guoyuan Power Co., LTD. 2023 Science and Technology Innovation Project (GSKJ-23-43).
Conflicts of Interest
The remaining authors declare that the research was conducted in the absence of any commercial or financial relationships that could be construed as a potential conflict of interest.
References
- Choi, H.; Choi, Y.; Moon, U.-C.; Lee, K.Y. Supplementary Control of Conventional Coordinated Control for 1000 MW Ultra-Supercritical Thermal Power Plant Using One-Step Ahead Control. Energies 2023, 16, 6197. [Google Scholar] [CrossRef]
- Hu, P.; Cao, C.; Dai, S. Optimal dispatch of combined heat and power units based on particle swarm optimization with genetic algorithm. AIP Adv. 2020, 10, 045008. [Google Scholar] [CrossRef]
- Wang, J.; Yang, J.; Yang, F.; Cheng, F. Numerical and Experimental Investigation of the Decoupling Combustion Characteristics of a Burner with Flame Stabilizer. Energies 2023, 16, 4474. [Google Scholar] [CrossRef]
- Ning, X.; Yue, Y.; Huang, J.; Ding, H.; Li, B.; Deng, L.; Li, Y. Numerical study on optimization of secondary air box in a 600 MW opposed wall-fired boiler. AIP Adv. 2023, 13, 105119. [Google Scholar] [CrossRef]
- Xie, X.-Q.; Yang, J.-G.; Zhu, C.-Y.; Liu, C.-H.; Zhao, H.; Wang, Z.-H. Numerical analysis of reasons for the CO distribution in an opposite-wall-firing furnace. J. Zhejiang Univ. Sci. A 2020, 21, 193–208. [Google Scholar] [CrossRef]
- Nawaz, M.; Hamzaoui, M.; Bukhari, M.D.; Mustafa, G.; Khan, S.U.; Abdelkarim, A.; Kolsi, L. A numerical study on the superheater tubes bundle of a 660 MW coal-fired supercritical boiler. Int. J. Mod. Phys. B 2023, 2450226. [Google Scholar] [CrossRef]
- Li, X.; Zeng, L.; Zhang, N.; Chen, Z.; Li, Z.; Qin, Y. Effects of the air-staging degree on performances of a supercritical down-fired boiler at low loads: Air/particle flow, combustion, water wall temperature, energy conversion and NOx emissions. Fuel 2022, 308, 121896. [Google Scholar] [CrossRef]
- Wang, H.; Liu, J. Influence of operation of industrial boilers under low load on overheaters. Metall Power. 2001, 6, 47–48. [Google Scholar]
- Kabouris, J.; Kanellos, F.D. Impacts of Large-Scale Wind Penetration on Designing and Operation of Electric Power Systems. IEEE Trans. Sustain. Energy 2010, 1, 107–114. [Google Scholar] [CrossRef]
- Wen, D.; Pan, Y.; Chen, X.; Aziz, M.; Zhou, Q.; Li, N. Analysis and prediction of thermal stress distribution on the membrane wall in the arch-fired boiler based on machine learning technology. Therm. Sci. Eng. Prog. 2022, 28, 101137. [Google Scholar] [CrossRef]
- Pronobis, M. Environmentally Oriented Modernization of Power Boilers; Elsevier: Amsterdam, The Netherlands, 2020. [Google Scholar]
- Li, Z.; Miao, Z.; Shen, X.; Li, J. Effects of momentum ratio and velocity difference on combustion performance in lignite-fired pulverized boiler. Energy 2018, 165, 825–839. [Google Scholar] [CrossRef]
- Liu, H.; Wang, Y.; Zhang, W.; Wang, H.; Deng, L.; Che, D. Coupled modeling of combustion and hydrodynamics for a 1000 MW double-reheat tower-type boiler. Fuel 2019, 255, 115722. [Google Scholar] [CrossRef]
- Yu, C.; Xiong, W.; Ma, H.; Zhou, J.; Si, F.; Jiang, X.; Fang, X. Numerical investigation of combustion optimization in a tangential firing boiler considering steam tube overheating. Appl. Therm. Eng. 2019, 154, 87–101. [Google Scholar] [CrossRef]
- Laubscher, R.; Rousseau, P. CFD study of pulverized coal-fired boiler evaporator and radiant superheaters at varying loads. Appl. Therm. Eng. 2019, 160, 114057. [Google Scholar] [CrossRef]
- Gomez, A.; Fueyo, N.; Diez, L.I. Modelling and simulation of fluid flow and heat transfer in the convective zone of a power-generation boiler. Appl. Therm. Eng. 2008, 28, 532–546. [Google Scholar] [CrossRef]
- Ludowski, P.; Taler, D.; Taler, J. Identification of thermal boundary conditions in heat exchangers of fluidized bed boilers. Appl. Therm. Eng. 2013, 58, 194–204. [Google Scholar] [CrossRef]
- Madejski, P.; Taler, D.; Korzeń, A. Modelling of platen superheaters in a circulating fluidized bed boiler at different loads. Arch. Energ. 2012, 2012, 85–92. [Google Scholar]
- Madejski, P.; Taler, D. Analysis of temperature and stress distribution of superheater tubes after attemperation or sootblower activation. Energy Convers. Manag. 2013, 71, 131–137. [Google Scholar] [CrossRef]
- Modliński, N.; Szczepanek, K.; Nabagło, D.; Madejski, P.; Modliński, Z. Mathematical procedure for predicting tube metal temperature in the second stage reheater of the operating flexibly steam boiler. Appl. Therm. Eng. 2019, 146, 854–865. [Google Scholar] [CrossRef]
- Zima, W.; Nowak-Ocłoń, M.; Ocłoń, P. Simulation of fluid heating in combustion chamber waterwalls of boilers for supercritical steam parameters. Energy 2015, 92, 117–127. [Google Scholar] [CrossRef]
- Luo, R.; Fu, J.; Li, N.; Zhang, Y.; Zhou, Q. Combined control of secondary air flaring angle of burner and air distribution for opposed-firing coal combustion. Appl. Therm. Eng. 2015, 79, 44–53. [Google Scholar] [CrossRef]
- Ameri, M.; Shamshirgaran, S.R. A case study: The effects of the design factors on the thermal profile of Shahid Rajaiee boiler. Appl. Therm. Eng. 2008, 28, 955–961. [Google Scholar] [CrossRef]
- Fu, J.; Zhou, Q.; Li, N.; Liu, Z.; Liu, T. Effects of external stresses on hot corrosion behavior of stainless steel TP347HFG. Corros. Sci. 2016, 104, 103–111. [Google Scholar] [CrossRef]
- Fu, J.; Li, N.; Zhou, Q.; Guo, P. Impacts of applied stresses on high temperature corrosion behavior of HR3C in Molten salt. Oxid. Met. 2015, 83, 317–333. [Google Scholar] [CrossRef]
- Zhong, X.; Wu, X.; Han, E.-H. Effects of exposure temperature and time on corrosion behavior of a ferritic–martensitic steel P92 in aerated supercritical water. Corros. Sci. 2015, 90, 511–521. [Google Scholar] [CrossRef]
- Gruber, T.; Schulze, K.; Scharler, R.; Obernberger, I. Investigation of the corrosion behaviour of 13CrMo4–5 for biomass fired boilers with coupled online corrosion and deposit probe measurements. Fuel 2015, 144, 15–24. [Google Scholar] [CrossRef]
- Wu, X.; Fan, W.; Liu, Y.; Bian, B. Numerical simulation research on the unique thermal deviation in a 1000 MW tower type boiler. Energy 2019, 173, 1006–1020. [Google Scholar] [CrossRef]
- Madejski, P. Numerical study of a large-scale pulverized coal-fired boiler operation using CFD modeling based on the probability density function method. Appl. Therm. Eng. 2018, 145, 352–363. [Google Scholar] [CrossRef]
- Tan, P.; Fang, Q.; Zhao, S.; Yin, C.; Zhang, C.; Zhao, H.; Chen, G. Causes and mitigation of gas temperature deviation in tangentially fired tower-typeboilers. Appl. Therm. Eng. 2018, 139, 135–143. [Google Scholar] [CrossRef]
- Laubscher, R.; Rousseau, P. Coupled simulation and validation of a utility-scale pulverized coal-fired boiler radiant final-stage superheater. Therm. Sci. Eng. Prog. 2020, 18, 100512. [Google Scholar] [CrossRef]
- Zheng, S.; Luo, Z.; Deng, Y.; Zhou, H. Development of a distributed parameter model for the evaporation system in a super-critical W-shaped boiler. Appl. Therm. Eng. 2014, 62, 123–132. [Google Scholar]
- Shih, T.H.; Liou, W.W.; Shabbir, A.; Yang, Z.; Zhu, J. A new k-ε eddy viscosity model for high Reynolds number turbulent flows. Comput. Fluids 1995, 24, 227–238. [Google Scholar] [CrossRef]
- Wang, Y.Q.; Zhou, Y.G. Numerical optimization of the influence of multiple deep air-staged combustion on the NOx emission in an opposed firing utility boiler using lean coal. Fuel 2020, 269, 116996. [Google Scholar] [CrossRef]
- Coelho, P.J. Numerical simulation of radiative heat transfer from non-gray gases in three-dimensional enclosures. J. Quant. Spectrosc. Radiat. Trans. 2002, 74, 307–328. [Google Scholar] [CrossRef]
- Zhou, Z.; Han, X.; Jin, G.; Wang, X.; Yu, J.; Shan, S. New coefficients of the weighted-sum-of-gray-gases model for gas radiation characteristics of hydrogen/natural gas blends combustion. Int. Commun. Heat Mass Transf. 2023, 149, 107090. [Google Scholar] [CrossRef]
- Kobayashi, H.; Howard, J.B.; Sarofim, A.F. Coal devolatilization at high temperatures. Symp. Combust. 1977, 16, 411–425. [Google Scholar] [CrossRef]
- Li, Y.; Zhu, Q.; Kong, D.; Han, H.; Kang, Y.; Liang, J.; Zhao, W.; Zhu, M.; Huang, S. Numerical Simulation of Ash and Slag Deposition in Supercritical Tangential Boiler. In Proceedings of the 2023 International Conference on Smart Electrical Grid and Renewable Energy (SEGRE), Changsha, China, 16–19 June 2023. [Google Scholar]
- Wang, H.P.; Jin, H.Z.; Yang, Z.; Deng, S.S.; Wu, X.H.; An, J.X.; Sheng, R.R.; Ti, S.G. CFD modeling of flow, combustion and NOx emission in a wall-fired boiler at different low-load operating conditions. Appl. Therm. Eng. 2024, 236, 121824. [Google Scholar] [CrossRef]
- Lage, M.; Lopes, H.; da Silveira Carvalho, M. Flows with suspended and floating particles. J. Comput. Phys. 2011, 230, 7736–7754. [Google Scholar] [CrossRef]
- Hu, H.H. Direct simulation of flows of solid–liquid mixtures. Int. J. Multiph. Flow 1996, 22, 335–352. [Google Scholar] [CrossRef]
- Hu, H.H.; Joseph, D.D.; Crochet, M.J. Direct simulation of fluid particle motions. Theor. Comput. Fluid Dyn. 1992, 3, 285–306. [Google Scholar] [CrossRef]
- Liu, F.; Consalvi, J.-L.; Coelho, P.J.; Andre, F.; Gu, M.; Solovjov, V.; Webb, B.W. The impact of radiative heat transfer in combustion processes and its modeling—With a focus on turbulent flames. Fuel 2020, 281, 118555. [Google Scholar] [CrossRef]
- Viskanta, R. Radiative Transfer in Combustion Systems: Fundamentals and Applications; Begell House: New York, NY, USA, 2005. [Google Scholar]
- Modest, M.F. Radiative Heat Transfer, 2nd ed.; Academic Press: New York, NY, USA, 2003. [Google Scholar]
- Dombrovsky, L.A. Radiation Heat Transfer in Disperse Systems; Begell House: New York, NY, USA, 1996. [Google Scholar]
- Dombrovsky, L.A.; Baillis, D. Thermal Radiation in Disperse Systems: An Engineering Approach; Begell House: New York, NY, USA, 2010. [Google Scholar]
- Kang, W.; Jo, H.; Lee, J.; Jang, K.; Ryu, C. Numerical investigations on overfire air design for improved boiler operation and lower NOx emission in commercial wall-firing coal power plants. Appl. Therm. Eng. 2023, 219, 119604. [Google Scholar] [CrossRef]
- Zhang, Y.; Liu, Y.; Yang, X.; Chen, G.; Jin, B. Numerical investigation on optimization of wall jet to reduce high temperature corrosion in 660 MW opposed wall fired boiler. Int. J. Chem. React. Eng. 2022, 20, 305–323. [Google Scholar] [CrossRef]
Disclaimer/Publisher’s Note: The statements, opinions and data contained in all publications are solely those of the individual author(s) and contributor(s) and not of MDPI and/or the editor(s). MDPI and/or the editor(s) disclaim responsibility for any injury to people or property resulting from any ideas, methods, instructions or products referred to in the content. |
© 2024 by the authors. Licensee MDPI, Basel, Switzerland. This article is an open access article distributed under the terms and conditions of the Creative Commons Attribution (CC BY) license (https://creativecommons.org/licenses/by/4.0/).