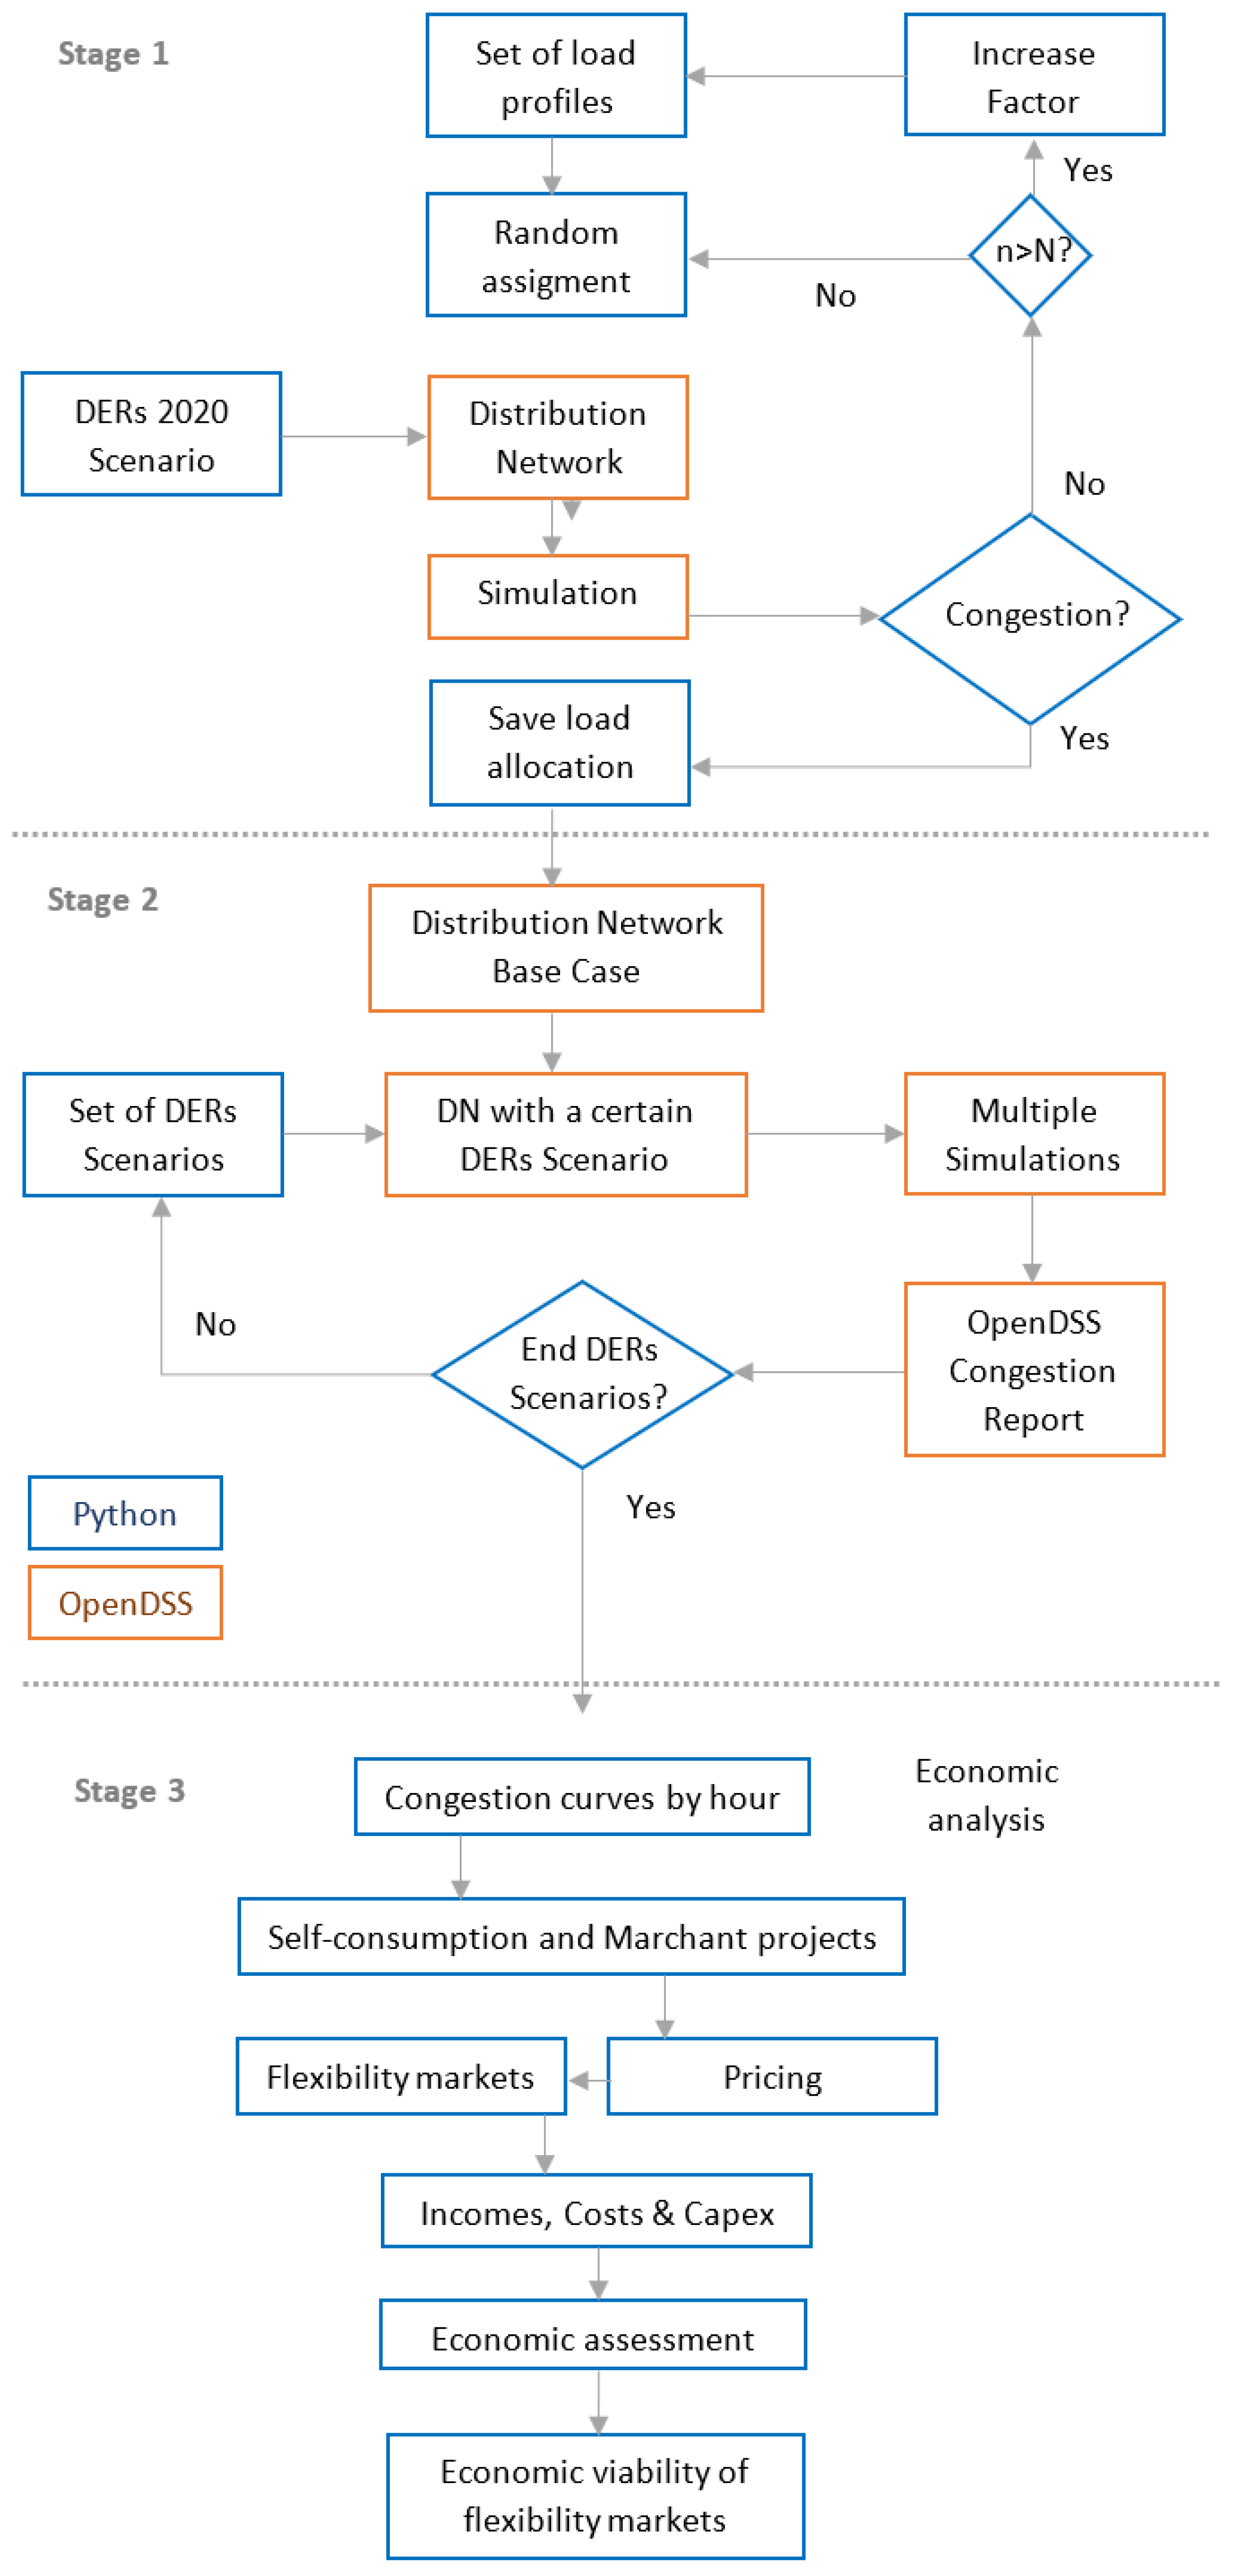
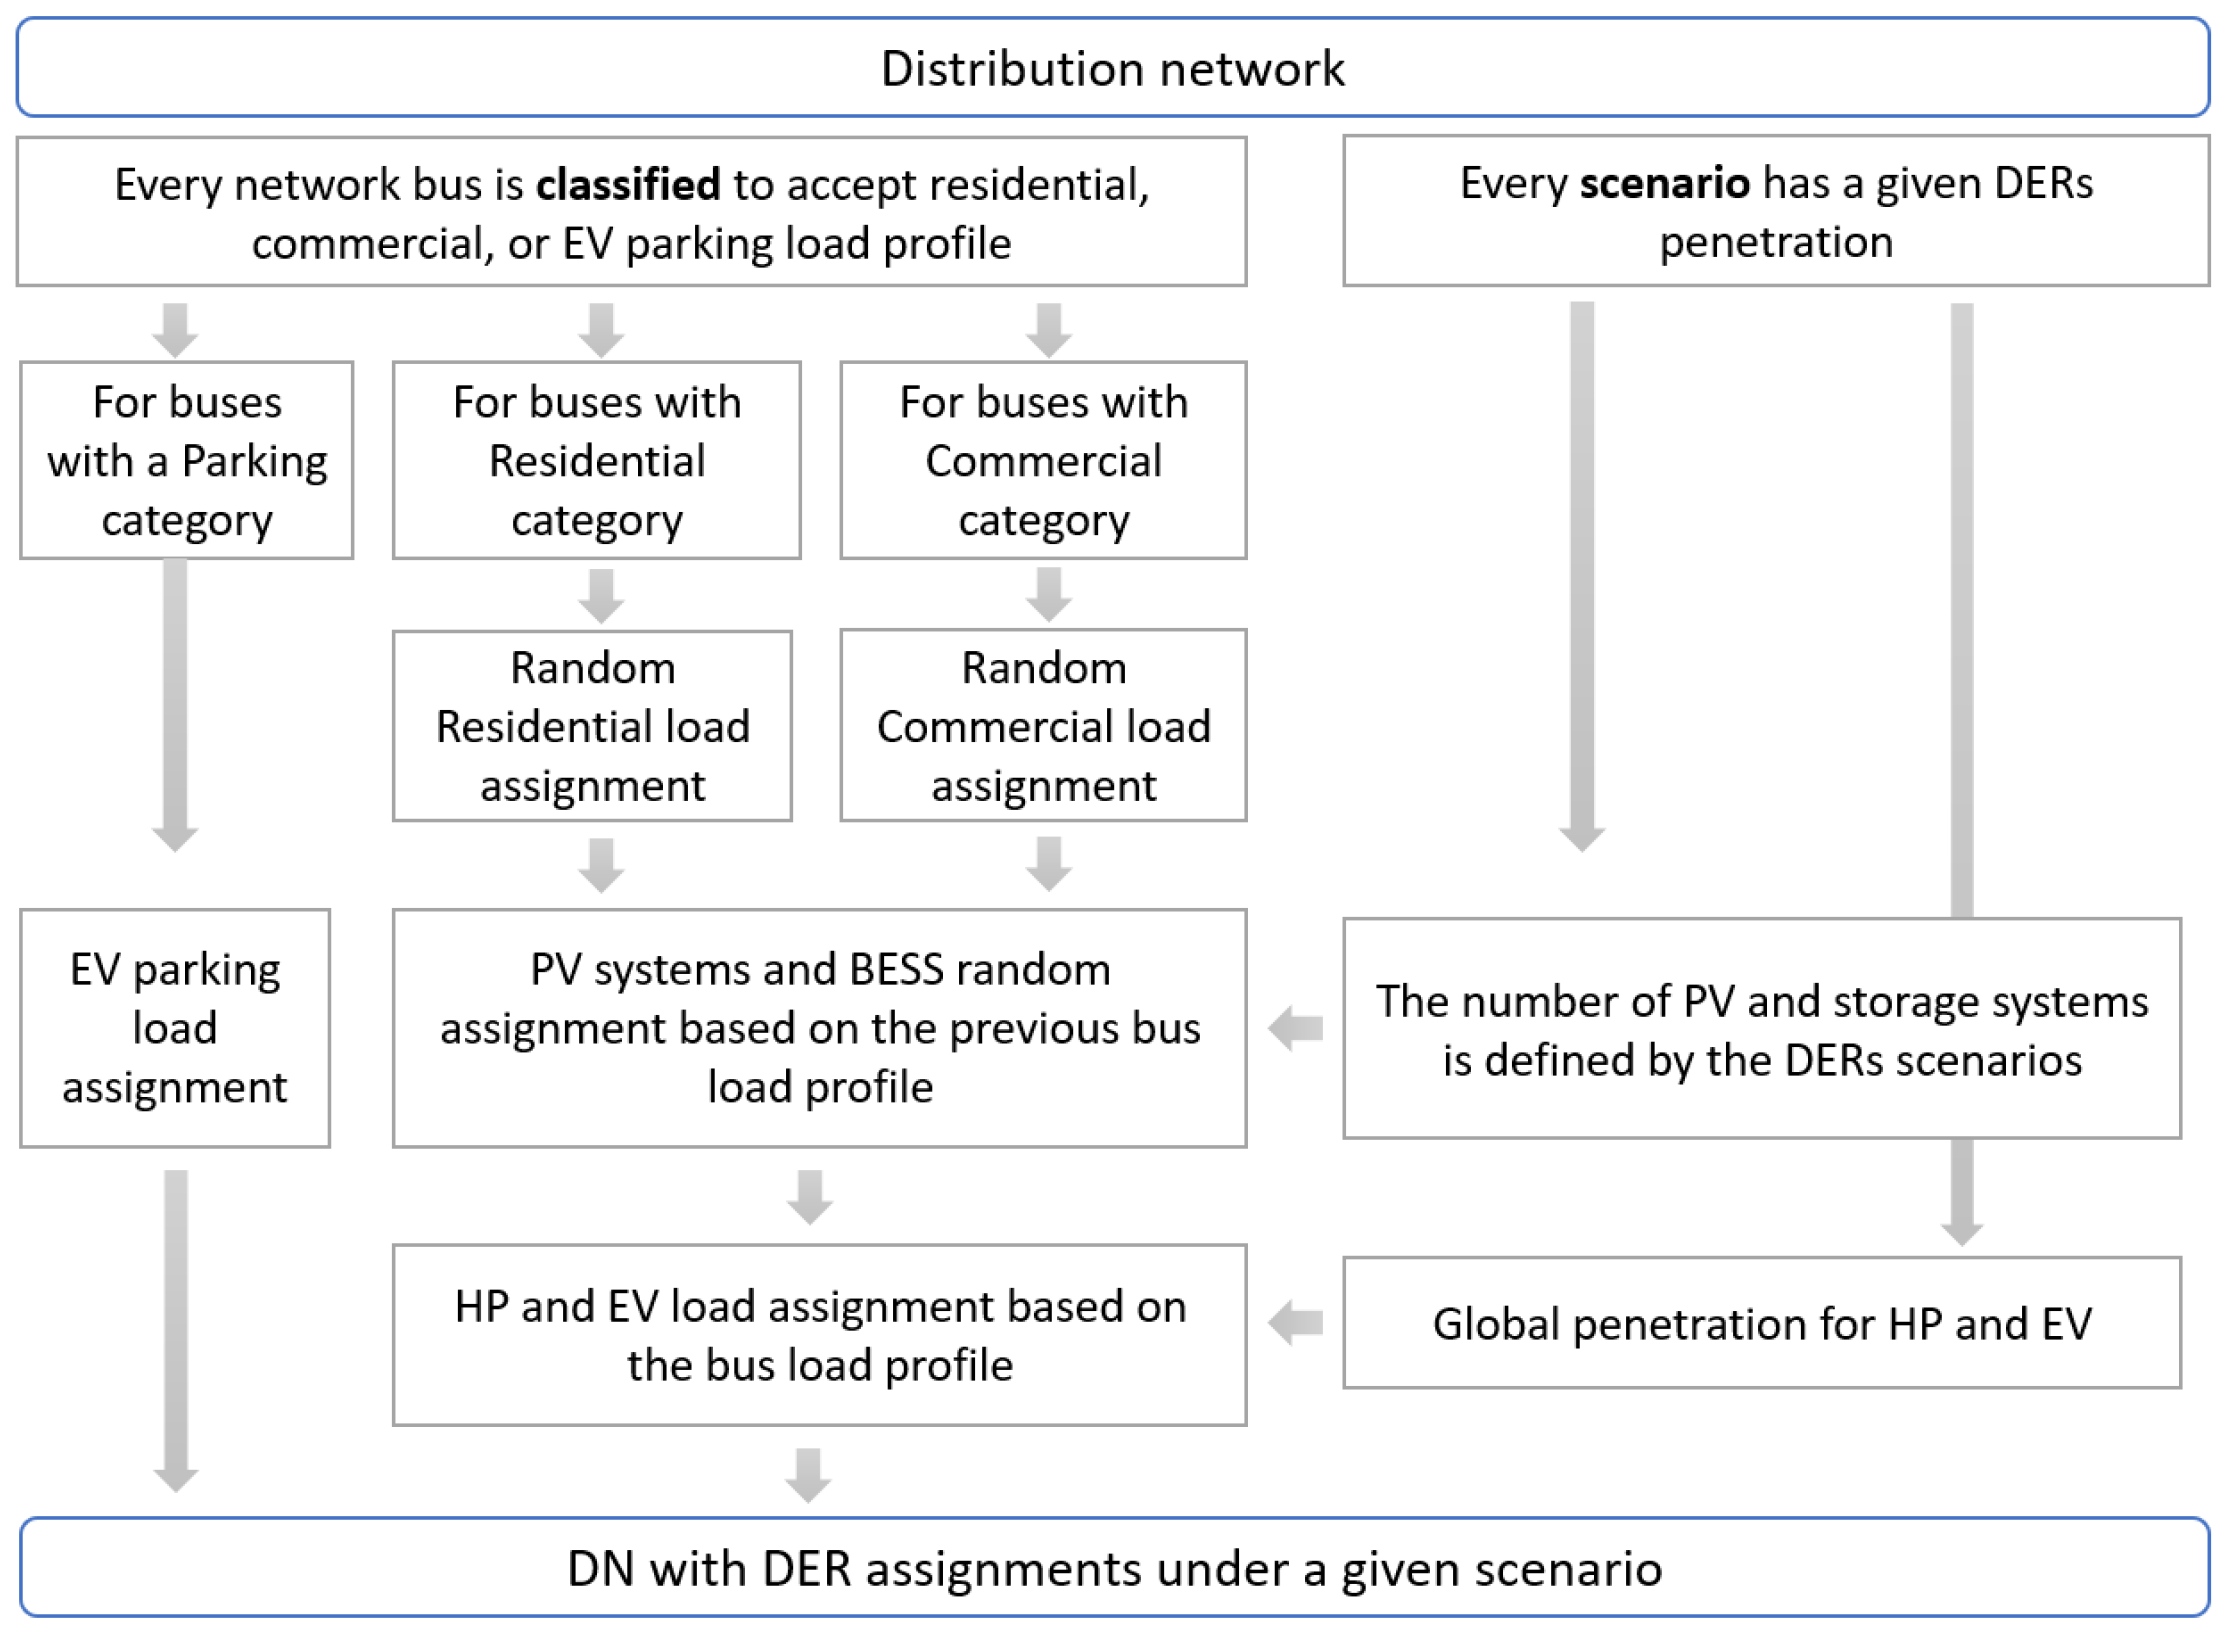
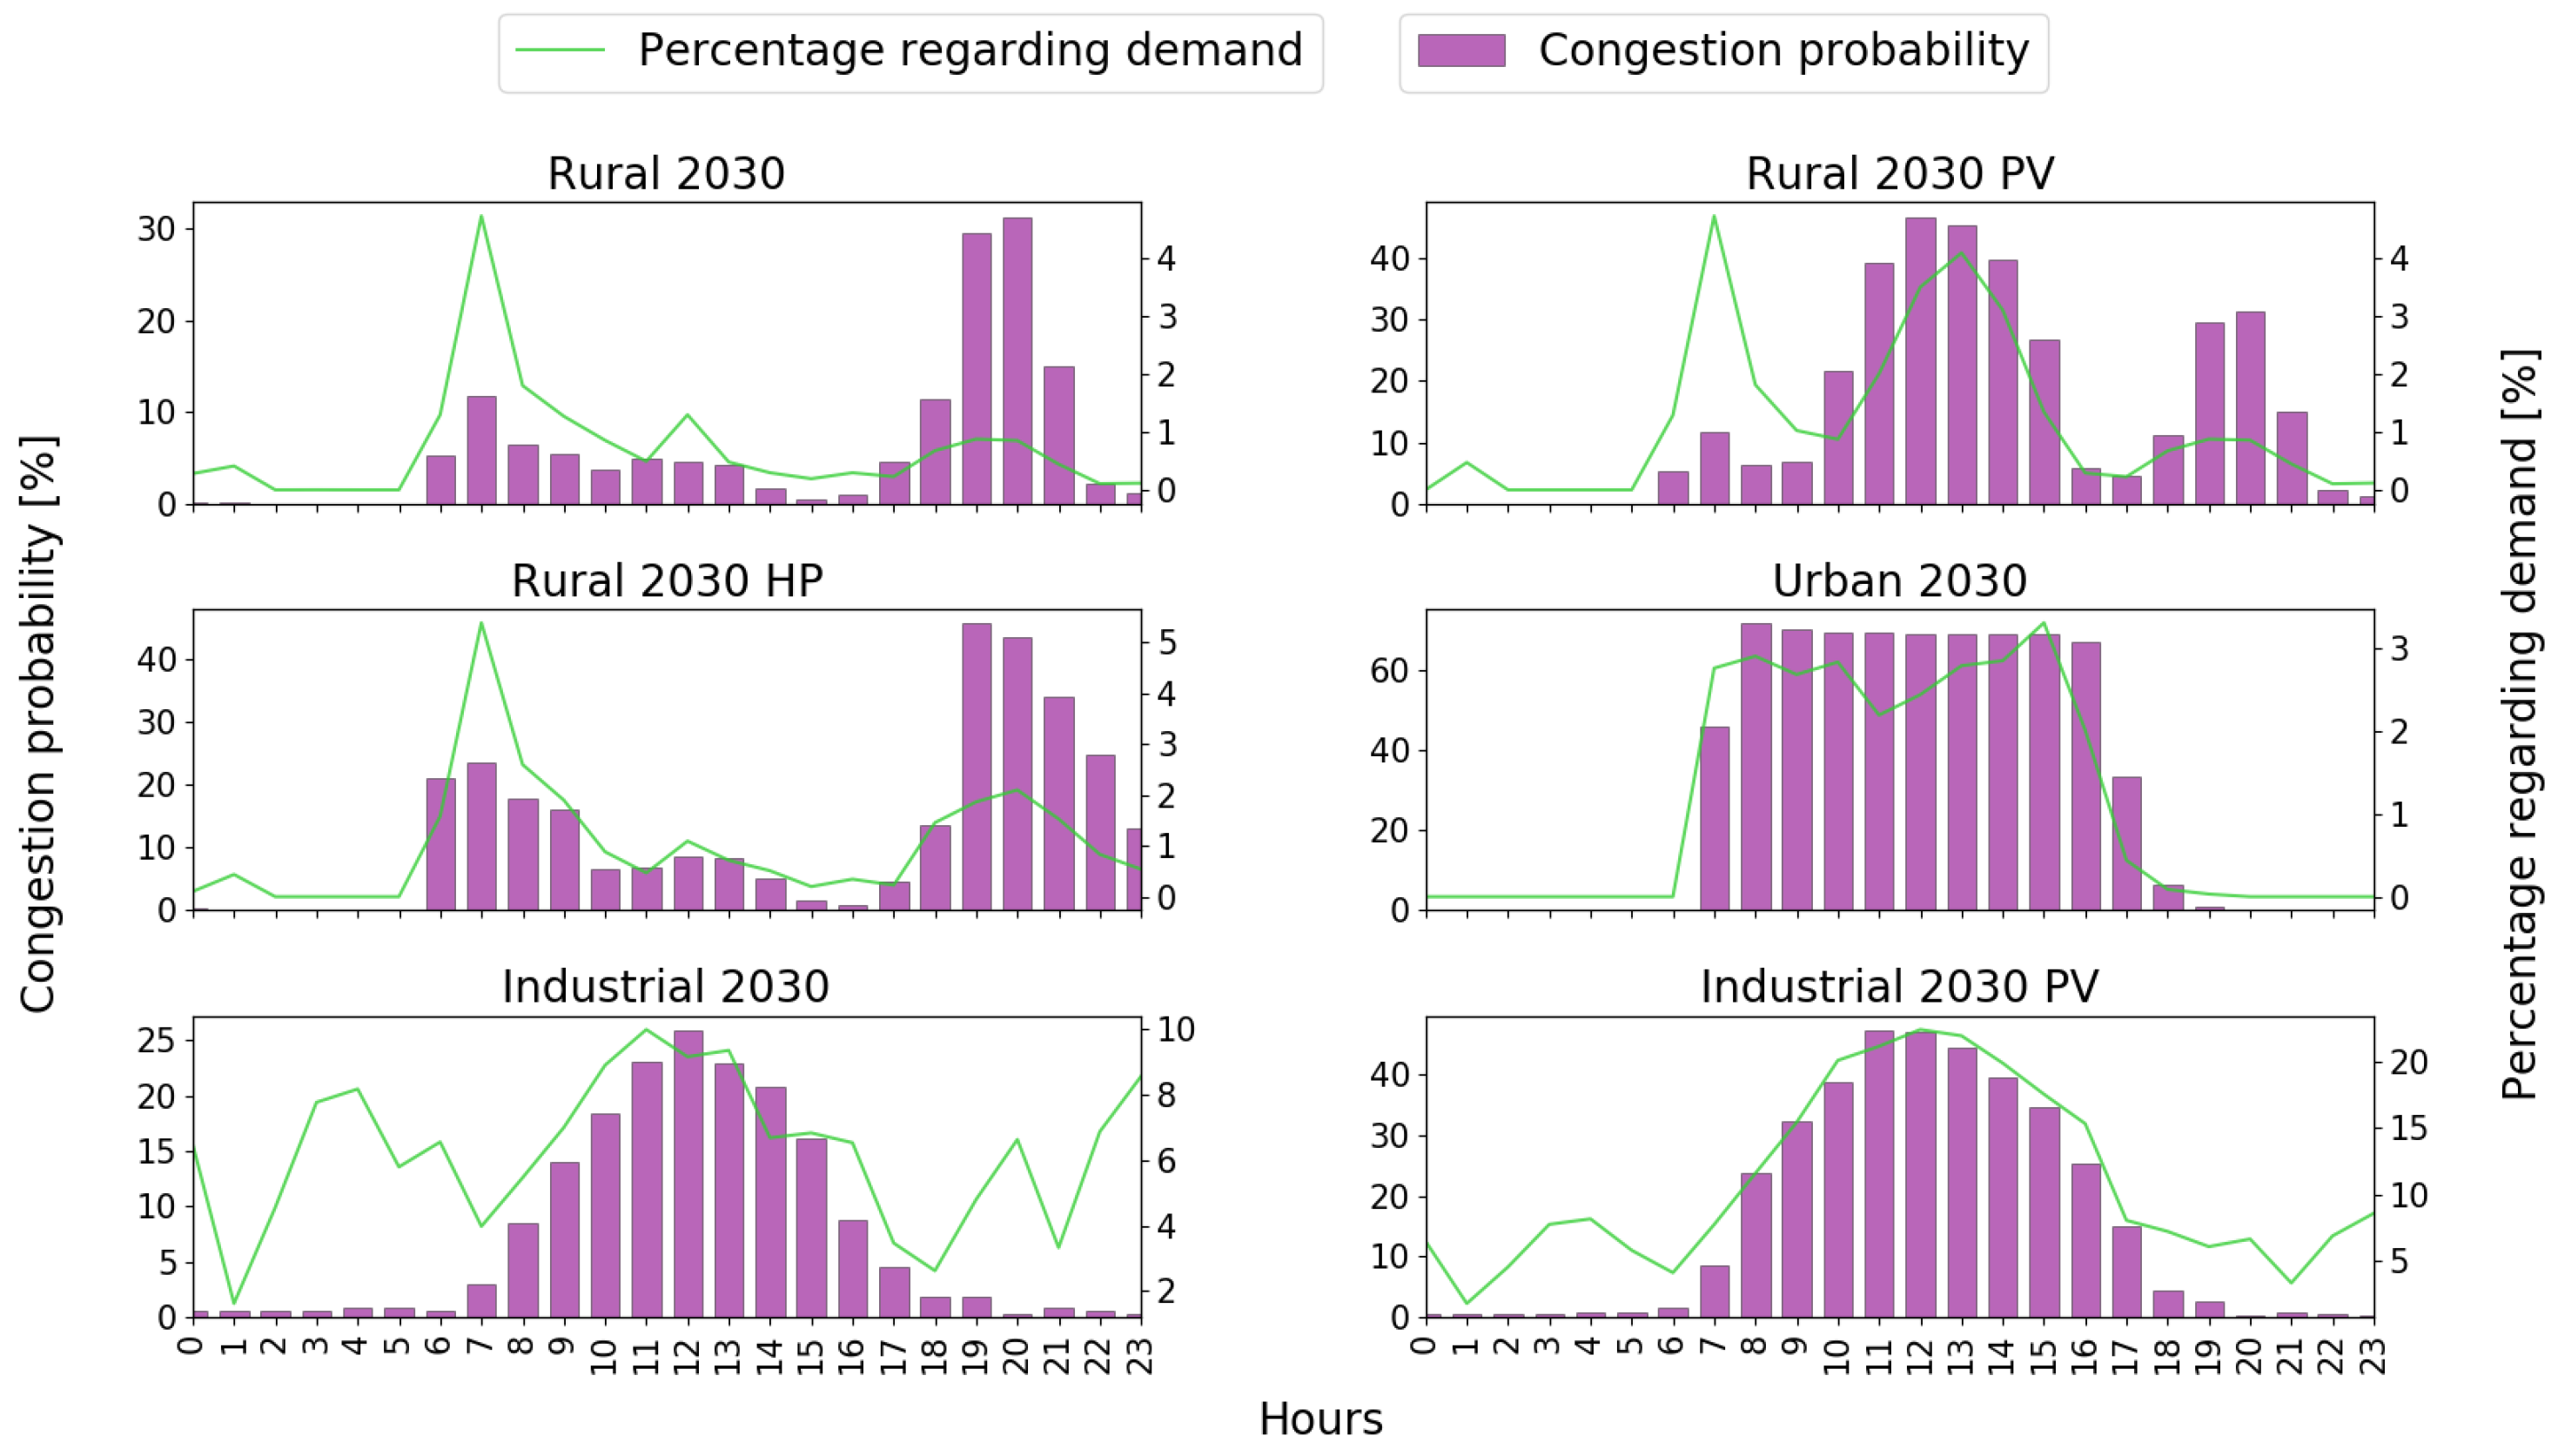
This section uses the congestion levels detected in the simulations to quantify and assess under what pricing and market assumptions DERs are an economically viable mechanism to manage congestion events. Thus, the day-ahead and intraday markets are the energy markets modeled in this analysis, considering the NPV, payback, and IRR as the main criteria for assessing the viability of different case studies.
5.1. Case Studies
A total of 10 different case studies grouped in two sets, namely Self-consumption and Merchant projects, have been considered to assess the viability of DERs to manage congestion events. The Self-consumption group includes four individual cases considering the most common archetypes in the networks and assumes they have additional economic aid from the market price to operate in a flexible market. Thus, the first case corresponds to a rural single-family house (Case IA), the second to a user belonging to the service sector (Hotel) in an urban context (Case IB), the third to a food-producing factory in an industrial estate (Case IC), and the fourth to a collective self-consumption case, which considers a building with 20 families in an urban context (Case ID).
Table 5 shows the parameters used for each case, considering cases with and without a BESS to measure the effect of a BESS on case viability. Conversely, the second group corresponds to the Merchant projects, including two case studies: a PV system not associated with any user (Case III) and a battery dedicated to energy arbitrage (Case IV). In both cases, it is assumed that they do not have additional economic incentives, so their viability depends entirely on the income obtained from the sale of energy in the markets. However, the economic incentives are replaced by three different pricing scenarios—Optimistic, Trend, and Pessimistic—based on the expected evolution of technologies in 2030.
In this analysis, it has been assumed that the local market would work through an auction scheme at the distributor’s request after the forecast of congestion in some areas under its jurisdiction. Such congestion forecasts will be obtained with the previous methodology for the different scenarios proposed in the industrial, rural, and urban network models. Thus, for each hour where there is a voltage imbalance, above or below normal limits, it is considered that there is a need to activate the local flexibility market to acquire local products. In this regard, this study assumed that the market has appropriate policy regulation and the economic incentives to manage congestion issues using the DER’s flexibility via an LFM. The reason for this strong assumption relies on the study’s aim, which is to quantify the operational margin of a flexibility market and estimate an upper limit for its economic viability. Hourly prices from the continuous intraday market in 2019 and the price projection for the daily market proposed by OMIE around 2030 were used. Similarly, the day-ahead market prices are projected to 2030 based on the the day-ahead market prices from OMIE. These prices represent the E0 price scenario. Three additional scenarios were created to add sensitivity to day-ahead market prices considering the average price per Megawatt-hour for the year to be 10%, 35%, and 45% higher than in scenario E0, corresponding to the scenarios E1, E2, and E3, respectively.
5.2. CAPEX and OPEX
Table 6 presents the investment (CAPEX) and operation and maintenance (OPEX) costs used for each case evaluated in this study. All values have been taken from projections to 2030 made by the Joint Research Center (JRC) [
44]. The costs used for the IC Case correspond to those projected for a large-scale system with fixed tilt solar. In the cases evaluated for domestic users (Case IA and Case ID), the projected cost for residential systems is used, while for Case IB—in a commercial building—the projected costs for commercial-scale photovoltaic systems are considered. In addition to the OPEX values, an additional cost has been considered—introduced in the model in year 15—for replacing the inverter, whose useful life is shorter than those of the other components. According to the projections by the Fraunhofer Institute for Photovoltaic Solar Systems [
45] for the year 2030, it is assumed that the cost of this component is equivalent to 7% of the initial CAPEX. In terms of the operational degradation of the system, an annual reduction in efficiency of 0.5% is considered, which gives an aggregated annual factor with a mean of 18.17% under the meteorological conditions of the base case (Mediterranean-North climate).
The costs of lithium-ion batteries correspond to those projected to 2030 under the moderate learning curve in a study by Tarvydas [
46] that evaluates possible cost scenarios for batteries in mobile and stationary applications. For BESS-A, which is associated with residential systems (PV-R), the cost of a residential lithium-ion battery system was used. The OPEX of storage systems for residential users is assumed to be zero, as in [
47], while for the other applications, it is assumed to be equal to 2% of the CAPEX [
48]. Additionally, for all BESS systems analyzed, an annual battery degradation of 0.5% is assumed [
49], and a maximum depth of discharge of 90%.
For Merchant projects, the PV system costs are presented in
Table 6 and correspond to those projected for large-scale systems [
44]. The other assumptions are the same as those considered for Self-consumption PV systems. Likewise, for Case IV—which considers a BESS for energy arbitrage—the costs projected for 2030 by JRC [
46] for stationary lithium-ion battery systems designed for energy applications were used, assuming an OPEX equal to 2% of CAPEX [
48]. As in Case III, three scenarios were considered: the expected scenario that corresponds to projected prices under a moderate technological learning rate, the optimistic scenario that considers a fast learning rate, and the pessimistic scenario with a slow learning rate.
5.3. Other Considerations
Within the cases of self-consumption, the surplus energy generated and not consumed by the user is discharged into the network for sale in the available global and local energy markets. A tax on the Value of the Production of Electric Energy (IVPEE) is assumed for incomes generated by selling energy, corresponding to 7%. Likewise, it was assumed that the user pays 2% of the income generated to the trading company—or aggregator—that manages the sale of energy in the corresponding electricity markets.
For self-consumption in the industrial-type network (Case IC), three types of incentives are considered following the provisions of incentive programs 1 and 2 of Royal Decree 477/2021 [
50], aimed at self-consumption facilities with renewable energy sources in the service sector. The incentives vary according to the size of the company requesting the incentive and are applicable to the total cost of the asset. Thus, for Large Companies (LC), the applicable percentage is 15%, while for Medium Companies (MC), it is 25%, and for Small Companies (SC), 35%. Similarly, industrial-type users have access to three levels of support for BESS installation: 45% for LCs, 55% for MCs, and 65% for SCs.
The profitability of the projects is analyzed using the potential variable income that each of these could obtain under the different DER scenarios and price conditions considered. Additionally, the impact of using different discount rates—low, medium, and high—is evaluated (5%, 7%, 9%). Thus, to be considered viable, the project should have a positive VAN, a Payback Period shorter than the asset’s useful life, and a TIR higher than the discount rate set for each user based on their typology and risk level. However, the cost of operating the flexibility market was not included in the VNP analysis, so the NPV could be slightly overestimated.
5.4. Projects Feasibility
Table 7 summarizes the economic assessment developed for every case study considering different pricing and scenarios. Specifically, for Case IA, although economic incentives are not necessary to achieve economic viability, their use increases the IRR by an average of 14%, which would help the cases maintain their profitability even using credit financing. However, the discount rate and chosen price impact each case’s NPV and payback. The economic model for Case IB finds that installing a PV system is viable in all the cases evaluated, even considering the low price scenario and the highest discount rate. The payback without incentives varies between 8 years for the most favorable case (price scenario E3 and a discount rate of 5%) to 15 years for the most unfavorable case (price scenario E0 and discount rate of 9%), and the IRR is between 35% (E0) and 47% (E3). All the financial parameters improve when considering incentives, reaching a payback lower than five years.
Incorporating BESSs in the model does not improve the financial results; however, the projects maintain their viability in most cases. In fact, when including incentives, all price scenarios offer a profitable case, even at discount rates of 9%. When considering the total cost of the asset, without economic incentives, the project is no longer profitable for the price scenarios E0 and E1 under a discount rate of 9%. Likewise, considering economic incentives increase the IRR values between 18% and 23%. Conversely, even with incentives, the payback for cases including BESSs decreased to less than five years for all the analyzed scenarios.
The economic model results for Case IC without storage show that all the cases analyzed are viable when considering the discount rate of 5%, which is low for this type of user. However, with higher rates, the project’s viability depends on the price scenario and the level of incentives. When not considering any incentives, the project is unfeasible for price scenarios E0 and E1, with discount rates of 7% and 9%. It should be remembered that 7% is the average rate applicable to this type of user [
35], so the results obtained for this value are especially relevant. Likewise, when considering the discount rate for LC, the E0 scenario is not viable for these values, but profitability levels are reached under the E1 scenario and the 7% discount rate. When considering incentives for MC—which covers the results shown in
Table 7—all cases are viable except for scenario E0 with a discount rate of 9%. Likewise, adding BESSs does not improve the economic results, and the effect on the DER scenario is minimal, especially when only the PV system is considered. By incorporating the batteries, the variation between the IRR values obtained for each DER scenario is greater, but the differences do not exceed 1% and only occur in some scenarios (2030 PV, 2030 PV2, 2030 VE). Conversely, considering incentives has a greater impact, especially from zero economic incentives to incorporating the discount applicable to LC, where the IRR increases by 2%. Likewise, considering more favorable price scenarios also impacts the IRR values, especially when comparing the results of scenarios E2 and E3 (which present similar metrics to each other) against those obtained for scenarios E0 or E1.
The Merchant project, Case III, is viable only considering optimistic costs for the price scenarios E1, E2, and E3. In this regard, profitability is only achieved with a discount rate of 5%, considered low for this type of project but still within reasonable investment values. For price scenarios E2 and E3, the optimistic case is profitable under all defined discount rates, including the high level (9%). The IRR values obtained for the optimistic cost scenario are: 2% for the price scenario E0, 6% for prices E1, and 11% for prices E2 and E3. Likewise, the payback period for the viable cases found within this project varies between 11 years under the most favorable conditions (prices E3 and a discount rate of 5%) and 19 years in the case of scenario E1 (which is only viable considering a discount rate of 5%).
As with Case III, the viability of Case IV depends mainly on the price and cost scenario chosen and the discount rate. Likewise, no profitable scenarios are identified when considering the E0 prices, while for E1, all the DER scenarios are profitable with optimistic costs and a 5% discount rate. Unlike the previous case, for E2 prices, only the desired financial metrics are obtained when the discount rate of 5% and the optimistic cost scenarios are considered. Conversely, using E3 prices, profitable cases are obtained under the 5% discount rate since the E3 scenario has the highest average prices during peak hours, which benefits energy arbitrage projects. Considering the high discount rate (9%), no scenario is feasible, not even under E3 prices. The IRR values obtained are 5% for scenarios E0 and E1, 6% for scenario E2, and 7% for scenario E3. The payback of viable cases is between 15 years for the most favorable (5% discount rate, optimistic costs, E3 prices) and 22 years for the least favorable (5% discount rate, trend costs, E3 prices).
Therefore, some Merchant projects would need supplementary income sources to be profitable in low-price scenarios. Conversely, most Self-consumption projects demonstrated viability, especially when the solar systems were sized according to the users’ needs. Finally, we observed that adopting an energy arbitrage scheme could result in significant income within a flexible market context.
5.5. Costs for Managing Congestion Issues
Two alternative schemes were considered to calculate the cost associated with the acquisition of the manageable energy necessary to solve congestion at the distributor level. The first proposal, called the current model, is based on the current scheme for balance markets where the distributor would act as the counterparty of the DERs (Balance Responsible Party, BRP). The second proposal—called the alternative model—consists of a scheme where the participants go to the local market to solve the congestion issue, making an offer that is matched against those of other agents that operate in markets managed by the global market operator (for example, the continuous intraday market).
In the current model, the system operator settles with the distributor the deviation produced by acquiring the requirements activated in the local markets. For each hour where it was considered necessary to activate the local market, a mechanism based on the sign and direction of the deviation within the system was used to estimate the potential income or extra cost that the transaction would represent for the distributor. Energy prices for the current model were constructed using an open database in the I90 files published by REE (Red Eléctrica España) for the year 2019. In the alternative market, the participants make an offer in the intraday market as a counterpart to the offer made in the local market to meet the requested requirement under the pricing framework described previously corresponding to E0, E1, E2, and E3, and applied for both schemes.
In the industrial network, the alternative model has a lower cost to the distributor than the current model, considering the base price scenario E0, which increases in scenarios with higher PV penetration. However, the gap between the two models decreases as market prices increase. Conversely, in the rural network, both models show similar costs (the alternative model is slightly less expensive by 2% compared to the current model), with the difference becoming more noticeable in scenarios with increased solar panel penetration. Finally, continuing the trends in other networks, in the urban network, the alternative model represents a lower cost to the distributor (around 5%) across the different penetration and price scenarios. In conclusion, based on the assumptions considered, the model where market participants manage congestion events through a local flexibility market controlled by a global market operator is, in terms of cost, preferable to the distributor acting as a counterparty.


